1. Introduction
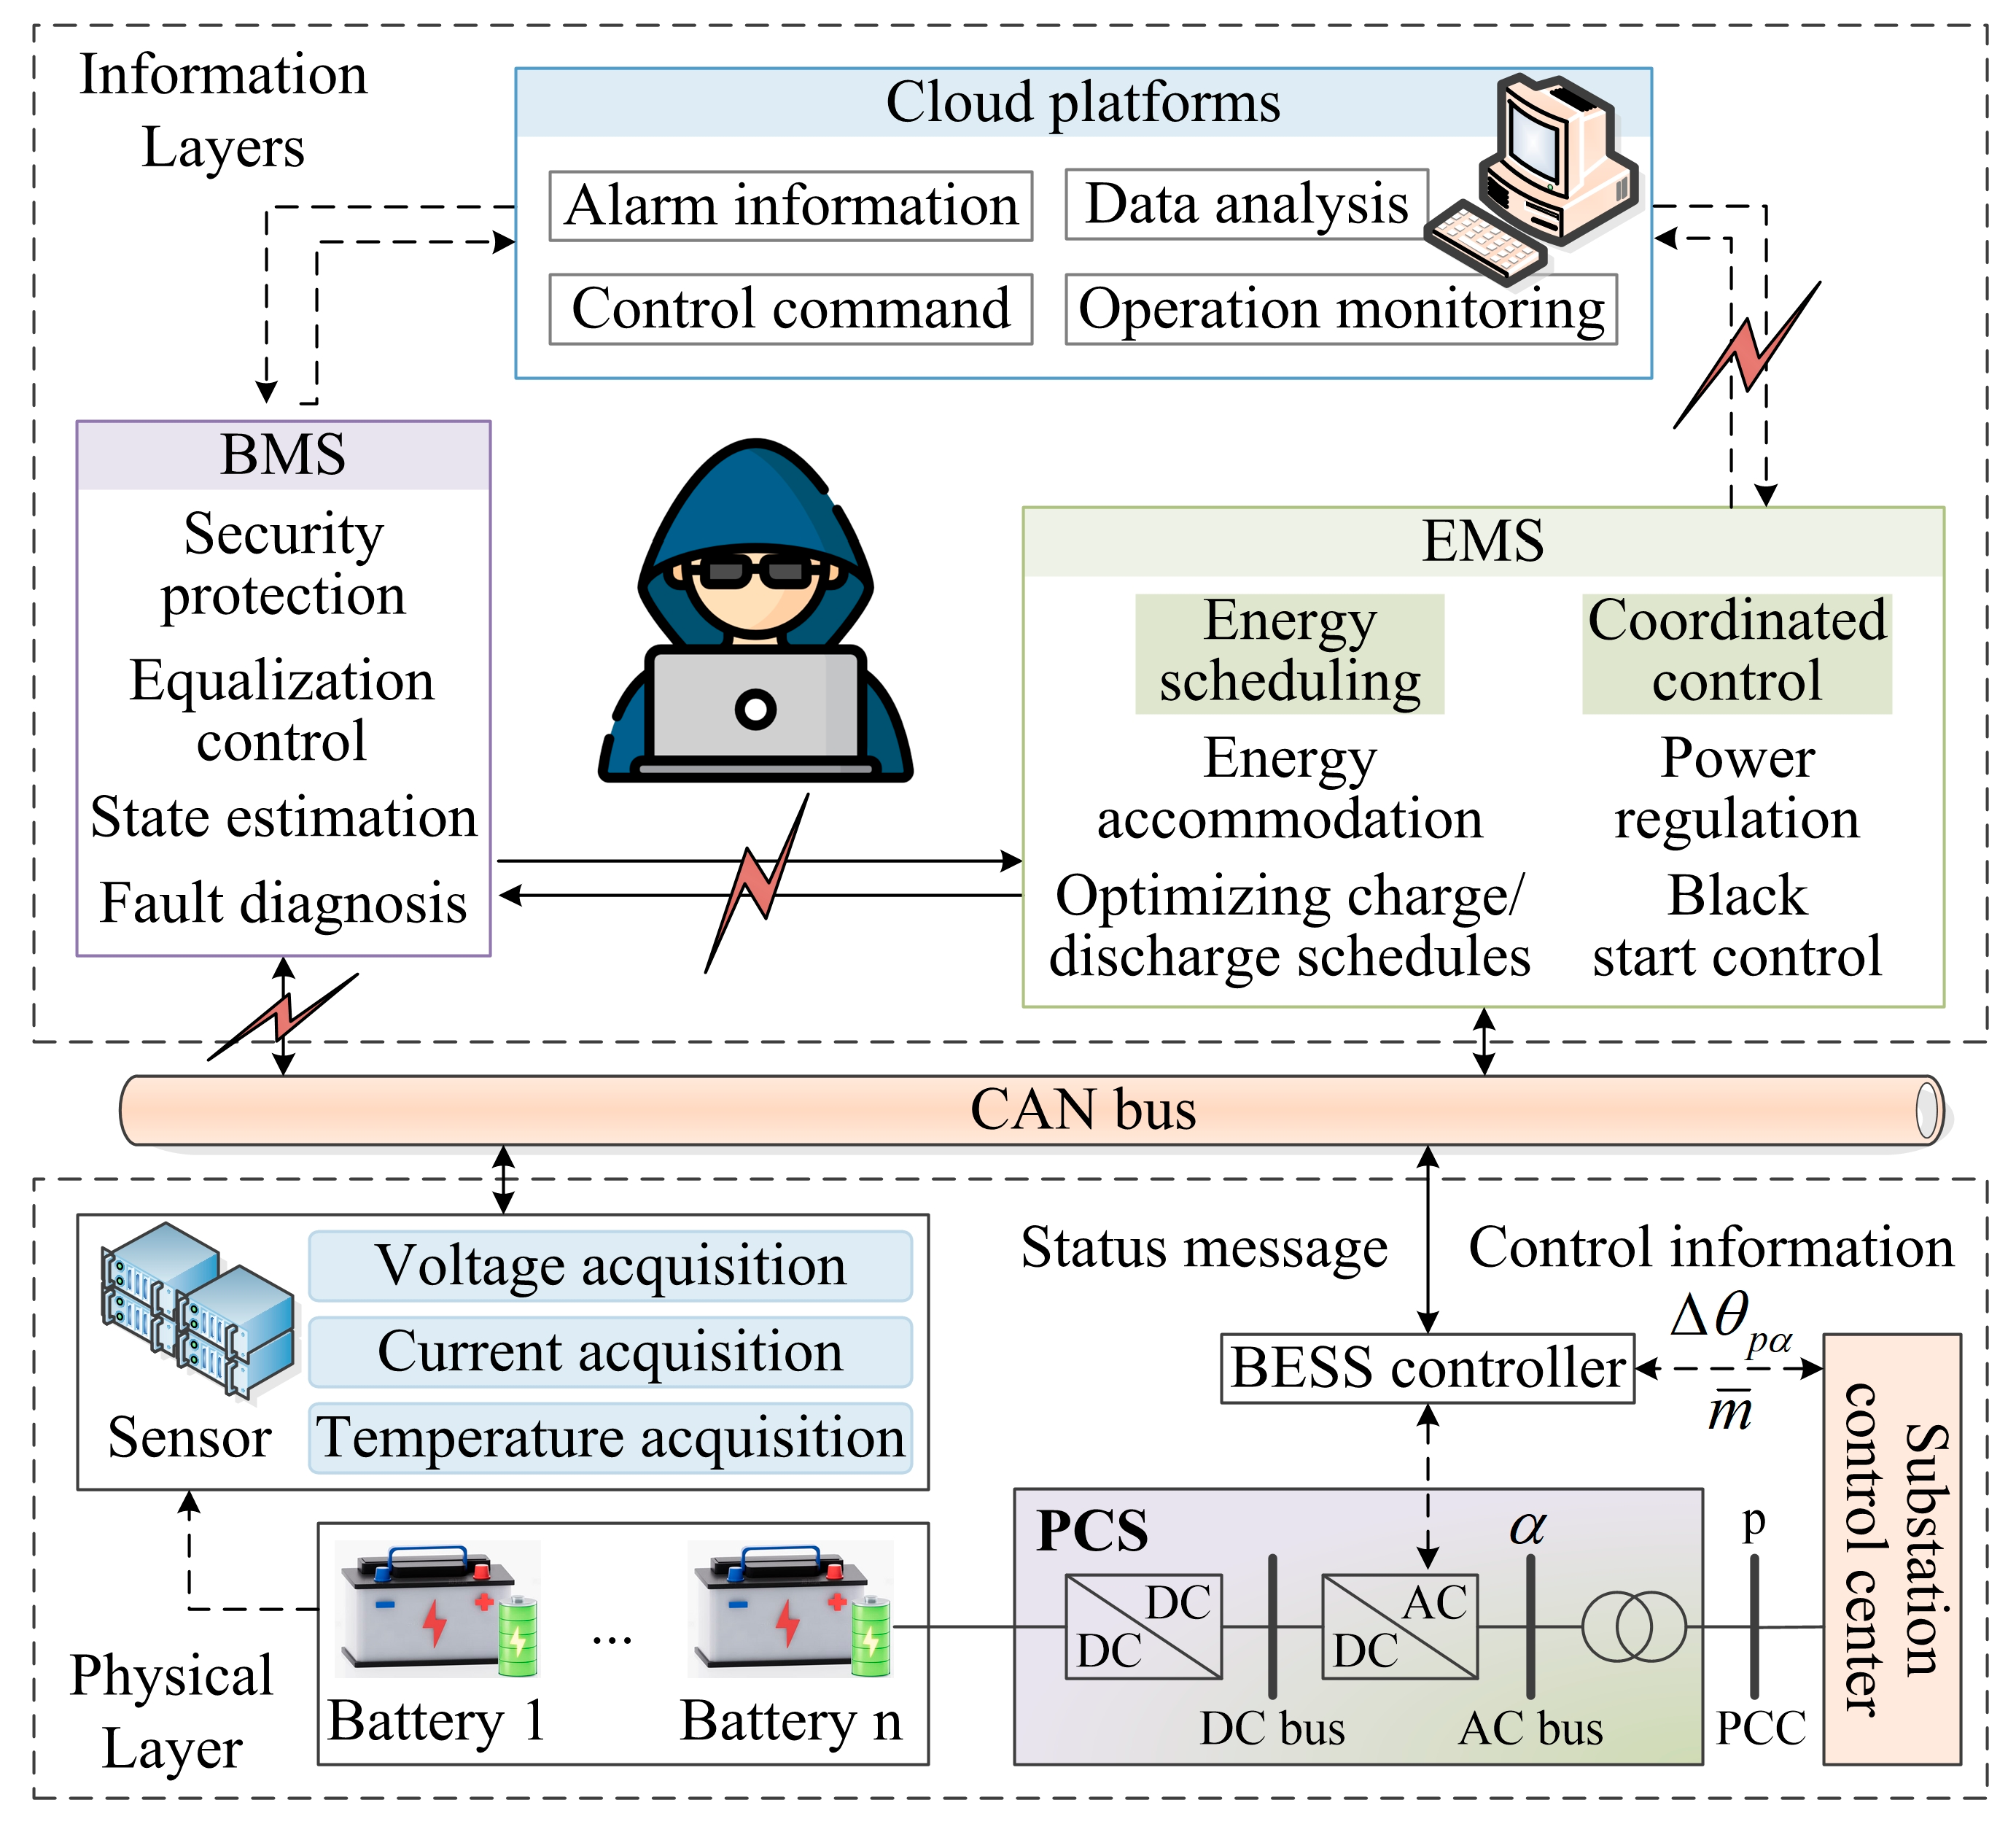
The DC microgrid adopts a layered control architecture, in which the upper information layer is connected to the distributed micropower supply and energy storage equipment through the communication network, relying on smart sensors, controllers, and other embedded devices to achieve system monitoring and control [
1,
2]. As the core energy storage unit in a DC microgrid, the operation and management of lithium BESS is mainly completed by the battery management system (BMS). With the development of intelligent control technology, modern BMSs have integrated cloud computing and IoT technologies and evolved into power information physical systems, which face threats of cyber-attacks such as FDIA and denial-of-service while improving control accuracy [
3,
4]. In particular, FDIA, which circumvents bad data detection (BDD) through distributed state estimation, tampers with the measurement data, leading to biased state-of-charge (SOC) estimation of the BMS, which triggers problems such as power oscillations or battery overcharge/over-discharge. Therefore, the study of FDIA prevention mechanisms in BESS state estimation is crucial for securing DC microgrids [
5].
FDIAs are difficult to directly detect and eliminate due to their highly hidden nature [
6,
7]. Currently, detection methods for FDIAs are mainly classified into two categories: model-based prediction methods and data-driven machine learning methods. A previous study [
8] proposes a multi-area probabilistic prediction-assisted interval state estimation framework for FDIA identification in distribution networks, which combines interval estimation with improved Krawczyk operator solving through probabilistic prediction modelling pseudo-measurements, and extends it to multi-area collaborative detection to form an FDIA identification scheme. The authors of [
9] modelled the erroneous data and measurement errors as non-Gaussian noise, combined the Maximum Correlation Entropy Criterion Extended Kalman Filter with Weighted Least Squares (WLS), introduced cosine similarity to quantify the difference between the two estimators and constructed the logistic locus matrices, applying cosine similarity detection to each part to generate the detection matrices. The authors of [
10] replaced the traditional fixed threshold of FDIA detection based on time series data by using its time-varying and asymmetric consistency intervals as the consistency feature of the time series, based on the IDSE model for state recovery. However, as CPPS continues to evolve, model-based approaches are not sufficient to cope with the state estimation problems in measurement devices caused by the huge increase in the amount of data.
Therefore, some detection methods based on the fusion of data-driven methods and intelligent algorithms have been proposed. Reference [
11] proposes a dual-attention multi-head graph attention network, DAMGAT, which combines the node feature attention and spatial topology attention into a multi-head graph attention network to efficiently aggregate the attack features and spatial topology information by dynamically capturing the potential correlation between the FDIA detection and measurement data. Reference [
12] introduces an improved CNN-LSTM approach for FDIA detection in power grids, incorporating an attention mechanism in the autoencoder structure and using a sparrow search algorithm to optimize the model parameters; the authors of [
13] propose a two-layer detection model that uses graph convolution operations to untangle the interactions between buses and extract spatial features of measurements, while temporal features are extracted using a temporal convolutional network model, which can effectively identify false data injection attacks injected in smart grids. The study of [
14] represents the smart grid with graphical alternatives and proposes an FDIA detector based on Hodge aggregation graph neural network, which utilizes Hodge’s theory and applies Hodge’s Laplace operator to the AGNN, and uses the graph attention mechanism to enhance the detector’s location detection performance.
Through reviewing and analyzing existing research frameworks, this paper identifies three primary research directions related to BESS and FDIA: (1) FDIA defence mechanisms for pure AC distribution grids without BESS [
15,
16], (2) local FDIA detection techniques for isolated BESS, and (3) BESS control and optimization strategies developed under the assumption of no FDIA threats. These studies have, to some extent, fragmented the intrinsic cybersecurity coupling between AC distribution grids, DC microgrids, and battery energy storage systems. They have failed to adequately address more covert attack patterns, specifically: attackers initiating FDIA on the AC side, bypassing traditional power flow-based bad data detection mechanisms, then leveraging grid-connected converters to influence the operational state of DC microgrids, ultimately disrupting the perception and decision-making processes of battery management systems. To bridge this research gap, this paper positions BESSs within a microgrid-level framework, with key contributions as follows:
(1) Developed a system-oriented FDIA model. Based on the IEEE standard node system, we established a highly covert and deceptive FDIA generation method.
(2) A multi-stage preprocessing framework for irregular operational data is proposed. Addressing challenges such as inconsistent sample lengths and misaligned time scales in real-world systems, this framework innovatively integrates multi-stage normalization, sliding window techniques, and Dynamic Time Warping (DTW) algorithms. It achieves high-precision alignment and feature enhancement for multi-source heterogeneous data, providing high-quality inputs for subsequent detection models.
(3) An integrated detection and defence solution based on an improved Wasserstein Generative Adversarial Network (WGAN) is proposed. By introducing a gradient penalty term into WGAN, the stability of model training and feature extraction capabilities are significantly enhanced. Furthermore, integrating anomaly detection and data repair modules enables high-precision identification of FDIAs and effective reconstruction of damaged data. Experimental results demonstrate that the proposed method achieves detection accuracy exceeding 92.9% across multiple attack scenarios, with data recovery errors controlled within 1.3%, providing reliable assurance for the secure operation of BESS.
3. WGAN-GP-Based FDIA Detection and Prevention
3.1. Data Preprocessing
Aiming at the problem that the inconsistent length of charging voltage data samples affects the feature extraction, this study innovatively proposes a multi-stage standardization processing method, which combines the sliding window technique and DTW algorithm to effectively solve the data alignment problem [
27]. Specifically, it includes the following steps:
(1) Length normalization: firstly, count the time-series length information of all the samples, and define the arithmetic mean of the sample lengths as the target length Ltarget. According to the relationship between the actual lengths Li and Ltarget of each sample, different processing strategies were adopted to normalize the sample lengths, respectively.
(2) Short sample expansion (
Li <
Ltarget): Equal spacing expansion using Piecewise Cubic Hermite Interpolating Polynomial (PCHIP). Given the original sequence V
orig ∈ R
Li, the new time base t
new = linspace (1,
Li,
Ltarget) was constructed, which has the advantage of strictly maintaining the monotonicity of the voltage curve and local morphological characteristics, avoiding the problem of oscillation easily introduced by conventional high-order interpolation, and the interpolation function is as follows:
(3) Long sample compression (
Li >
Ltarget): Introduce an adaptive uniform down-sampling strategy. The specific steps are as follows: calculate the number of points to be culled
k =
Li −
Ltarget, determine the culling interval Δ =
Li/(
k + 1), generate the set of culling positions
through an iterative algorithm, and ultimately form the set of retained indexes
K = {1,…,
Li}\
R to obtain the compressed sequence
Vnew =
Vorig(
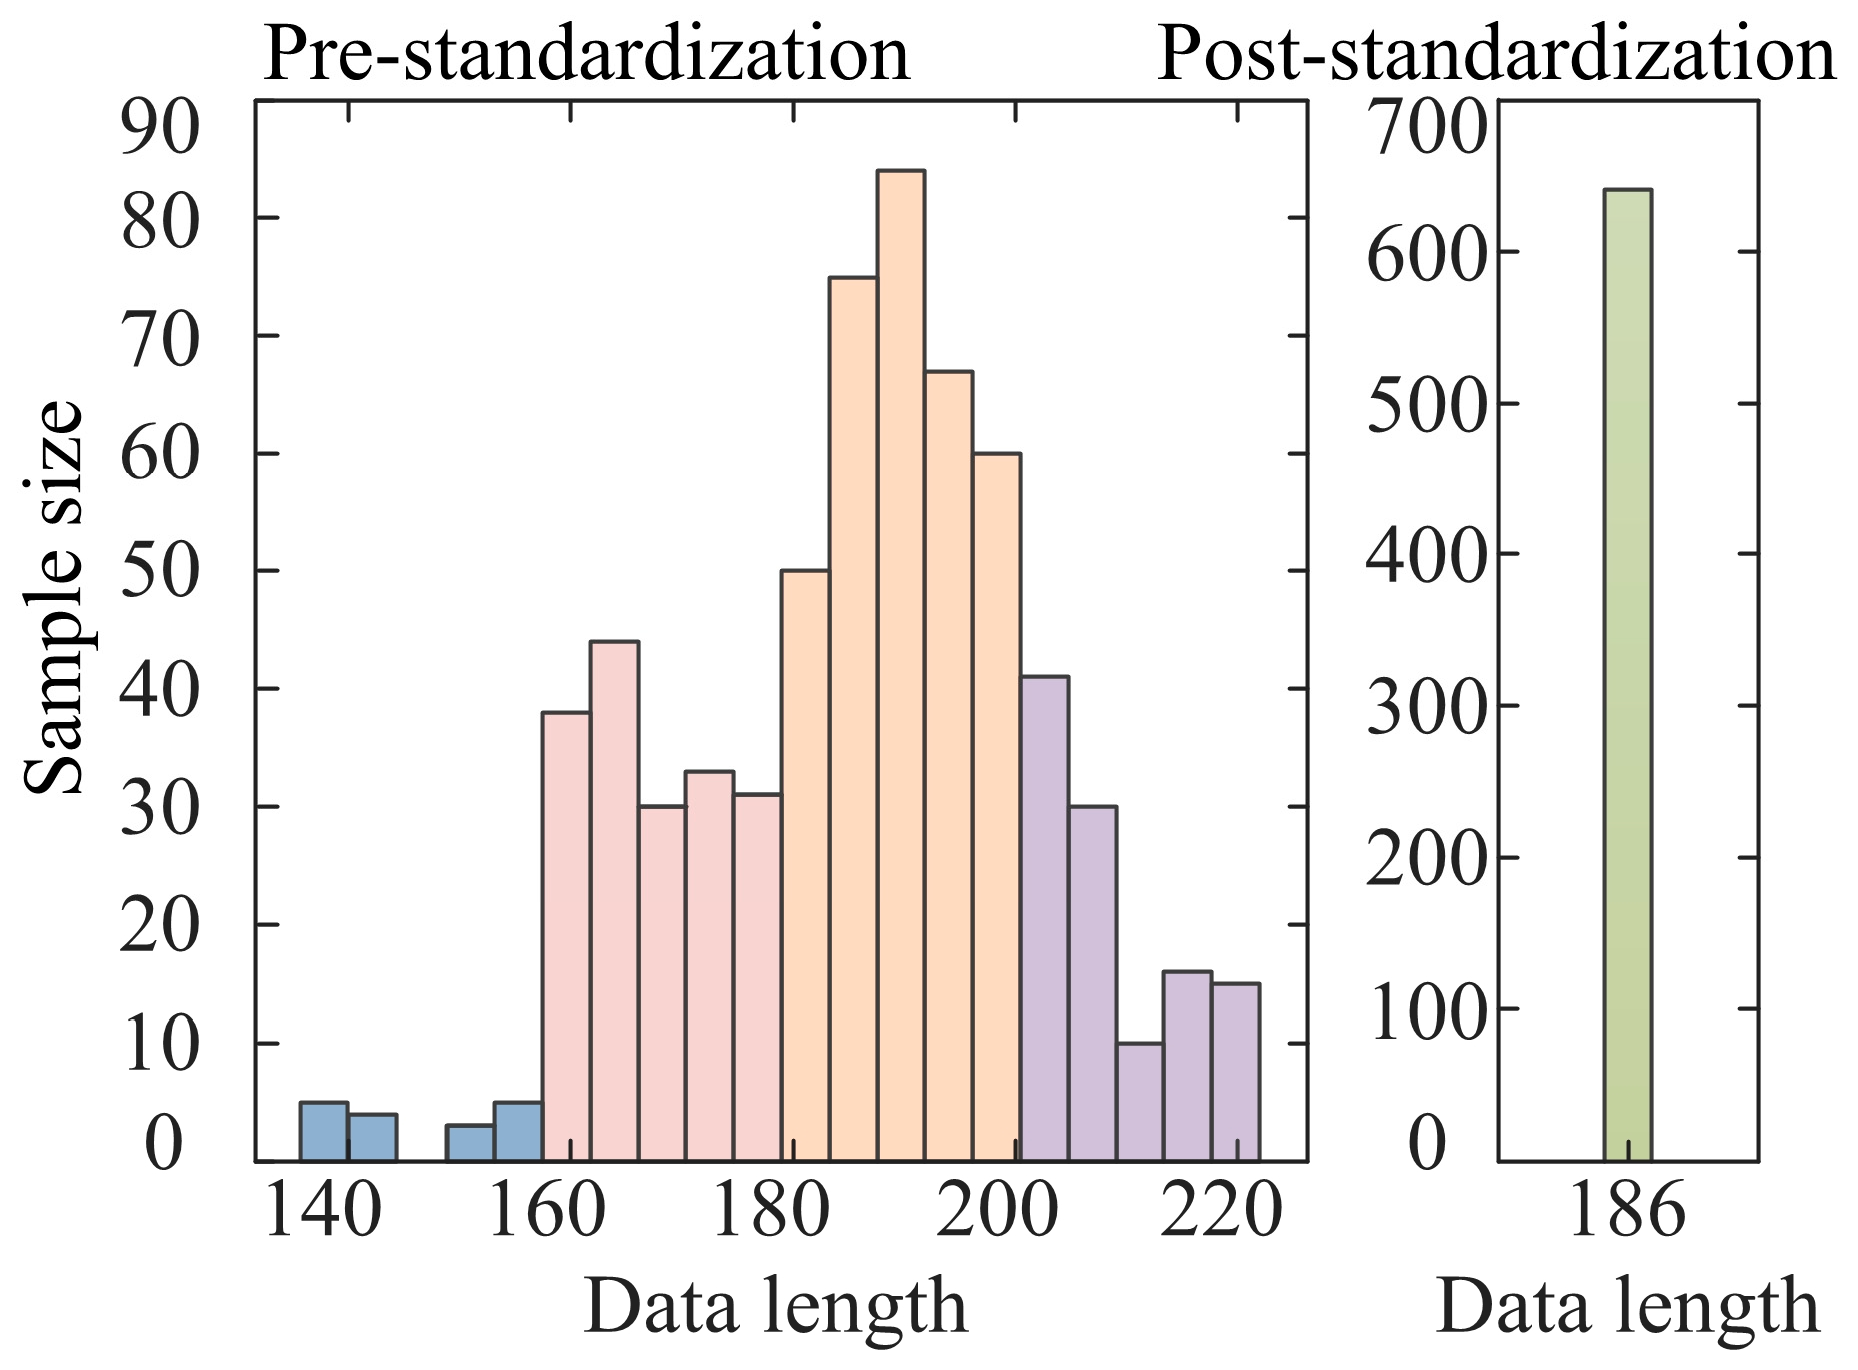
K). This method retains the key feature point information of the original curve to the maximum extent and effectively reduces the morphological distortion caused by down-sampling, and the length of the data samples before and after processing is shown in
Figure 2, different colors are used to distinguish between sample length intervals.
To systematically assess the effectiveness of the proposed multi-stage standardization approach, this paper establishes a multi-dimensional validation framework, which provides an in-depth analysis of three key dimensions, namely, statistical property retention, morphological fidelity, and boundary robustness. In the statistical property validation session, the effectiveness of the method in maintaining the statistical properties of the data is confirmed by calculating descriptive statistics such as mean, variance, skewness, and kurtosis (see
Table 1 for details), supplemented by the Kolmogorov–Smirnov test (statistic D = 0.0062, significance level
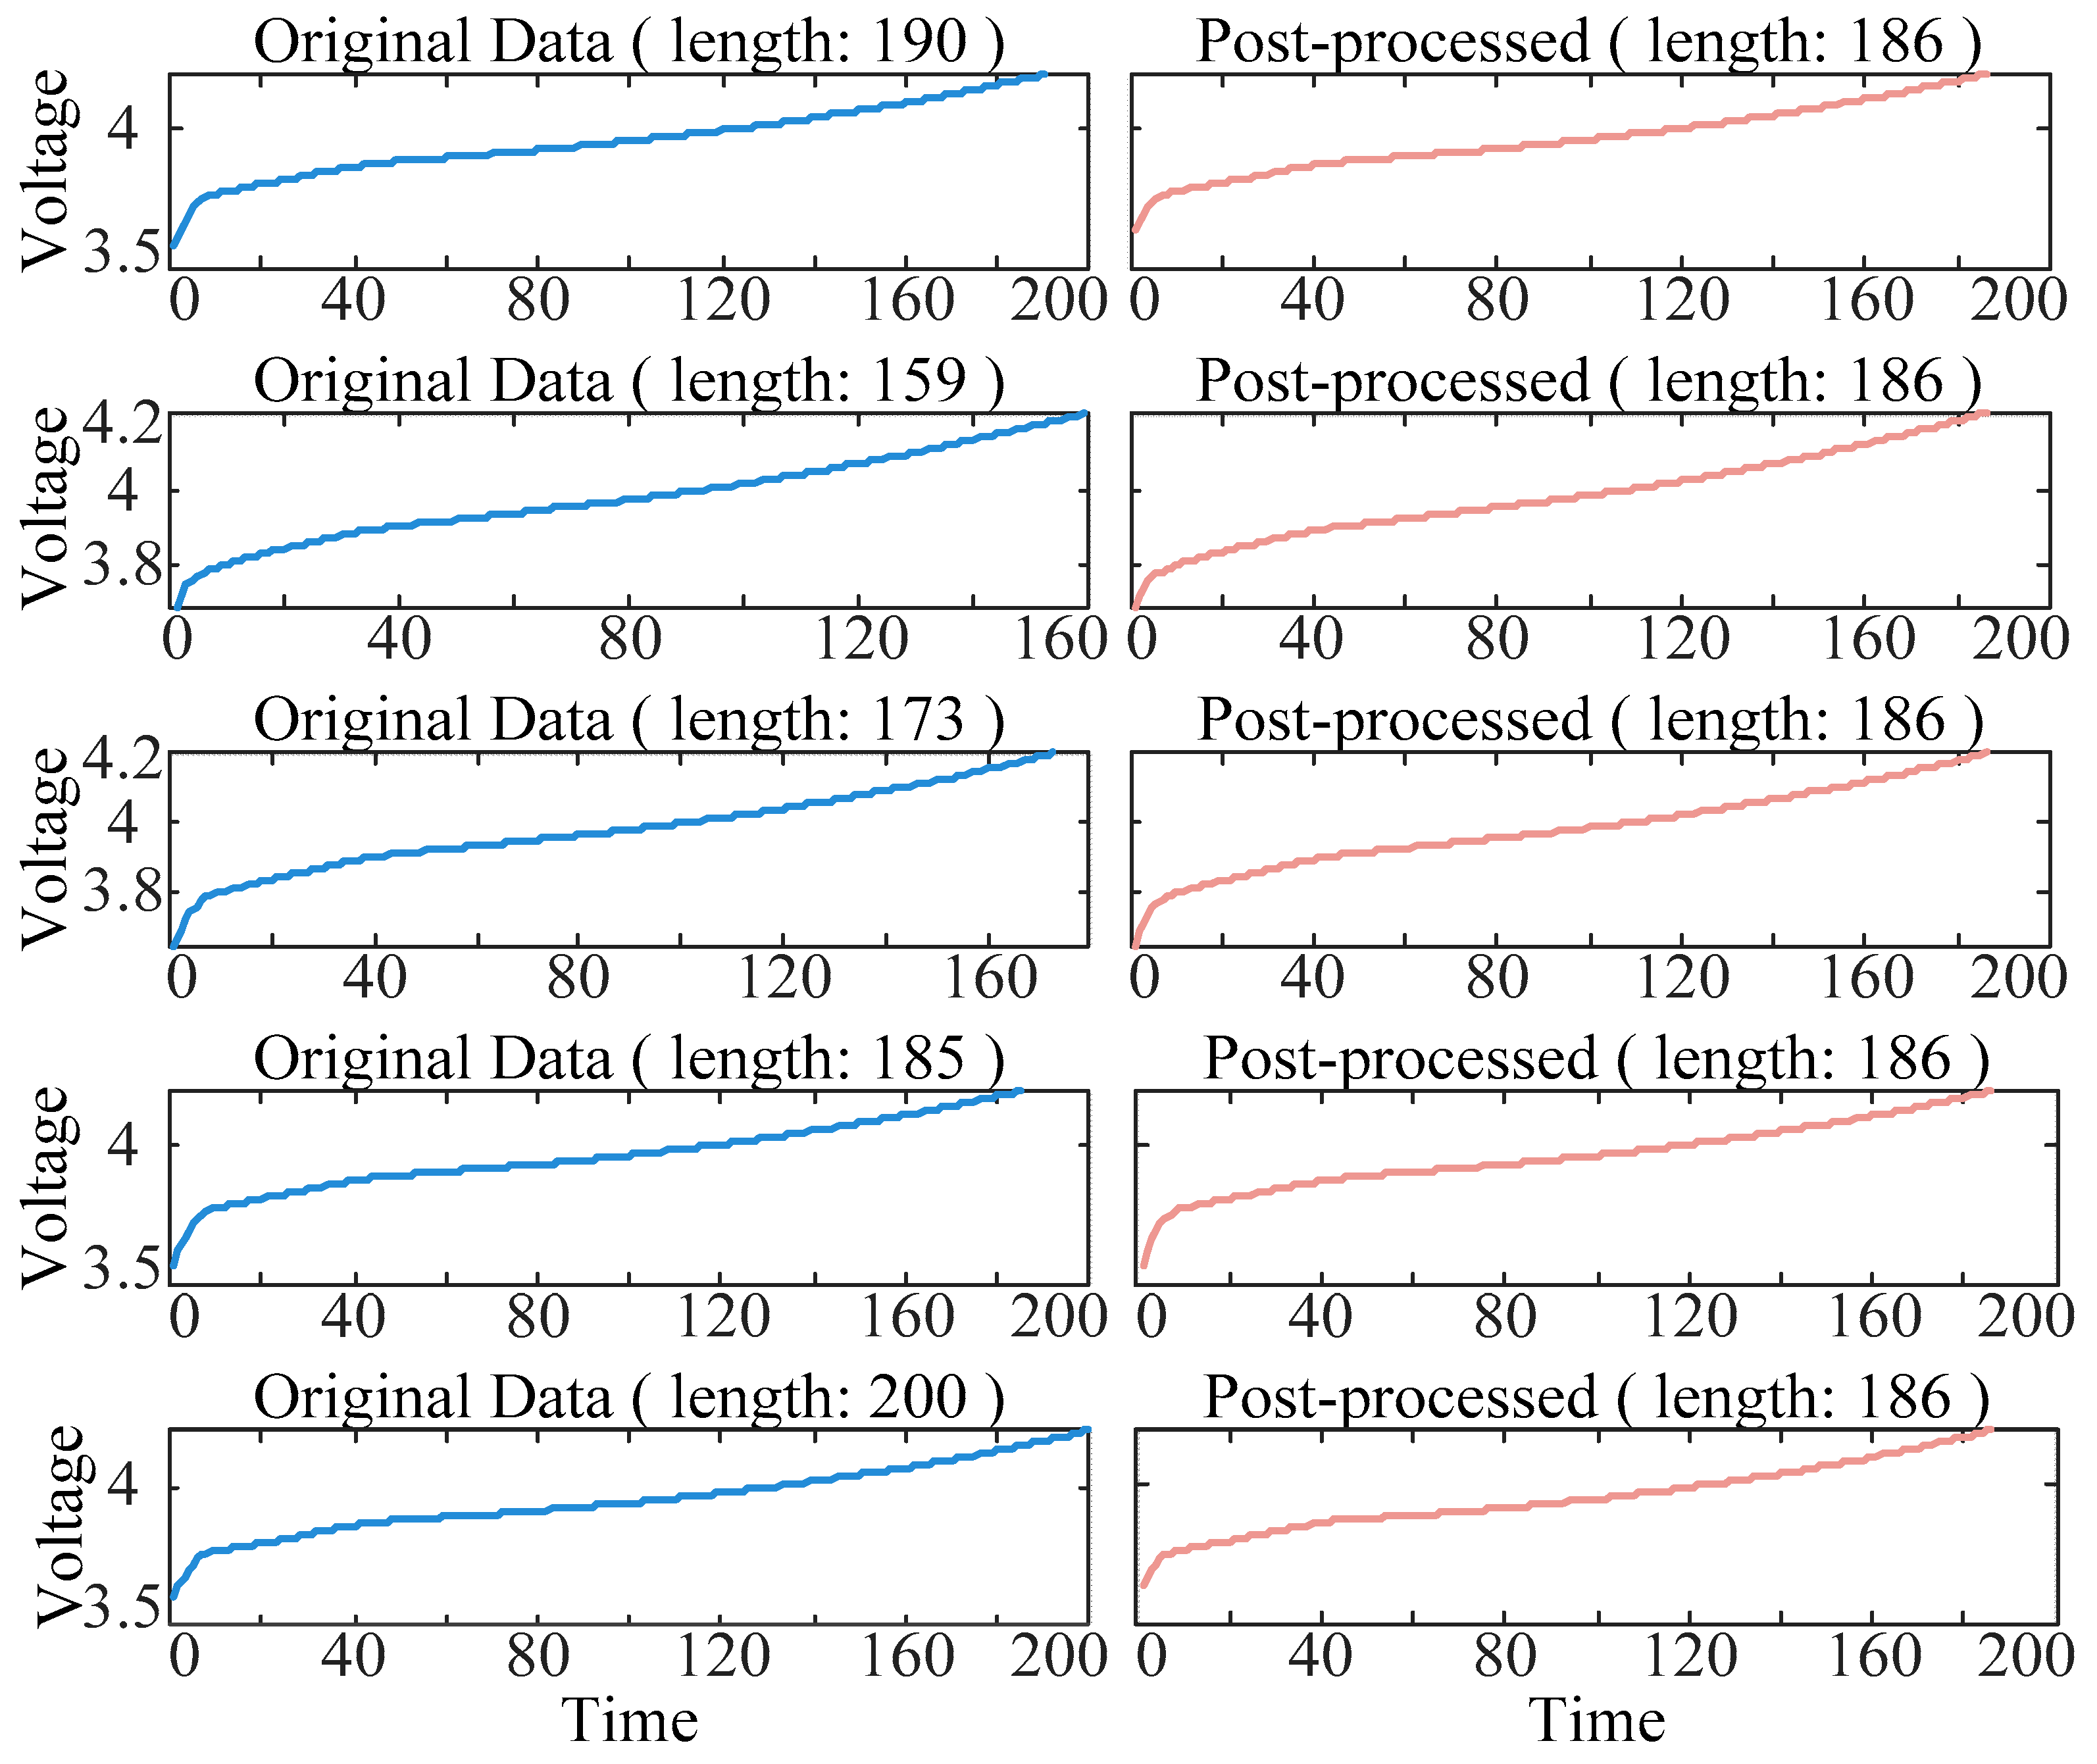
p < 0.02). It is important to emphasize that, although the KS test demonstrated statistical significance with over 100,000 data points, its extremely small D value indicates negligible practical differences between the two distributions. The maximum cumulative probability difference was only 0.62%, confirming the high consistency of statistical characteristics between pre- and post-processing data. For morphological fidelity validation, this study innovatively employed the DTW for full-sample morphological similarity analysis. Results demonstrate that standardized voltage curves maintain high consistency with original curves, with an average DTW distance of only 0.0956 and average similarity reaching 98.84%. This outcome provides compelling evidence for morphological fidelity, indicating near-complete preservation of voltage curves’ dynamic characteristics, trend patterns, and key morphological points.
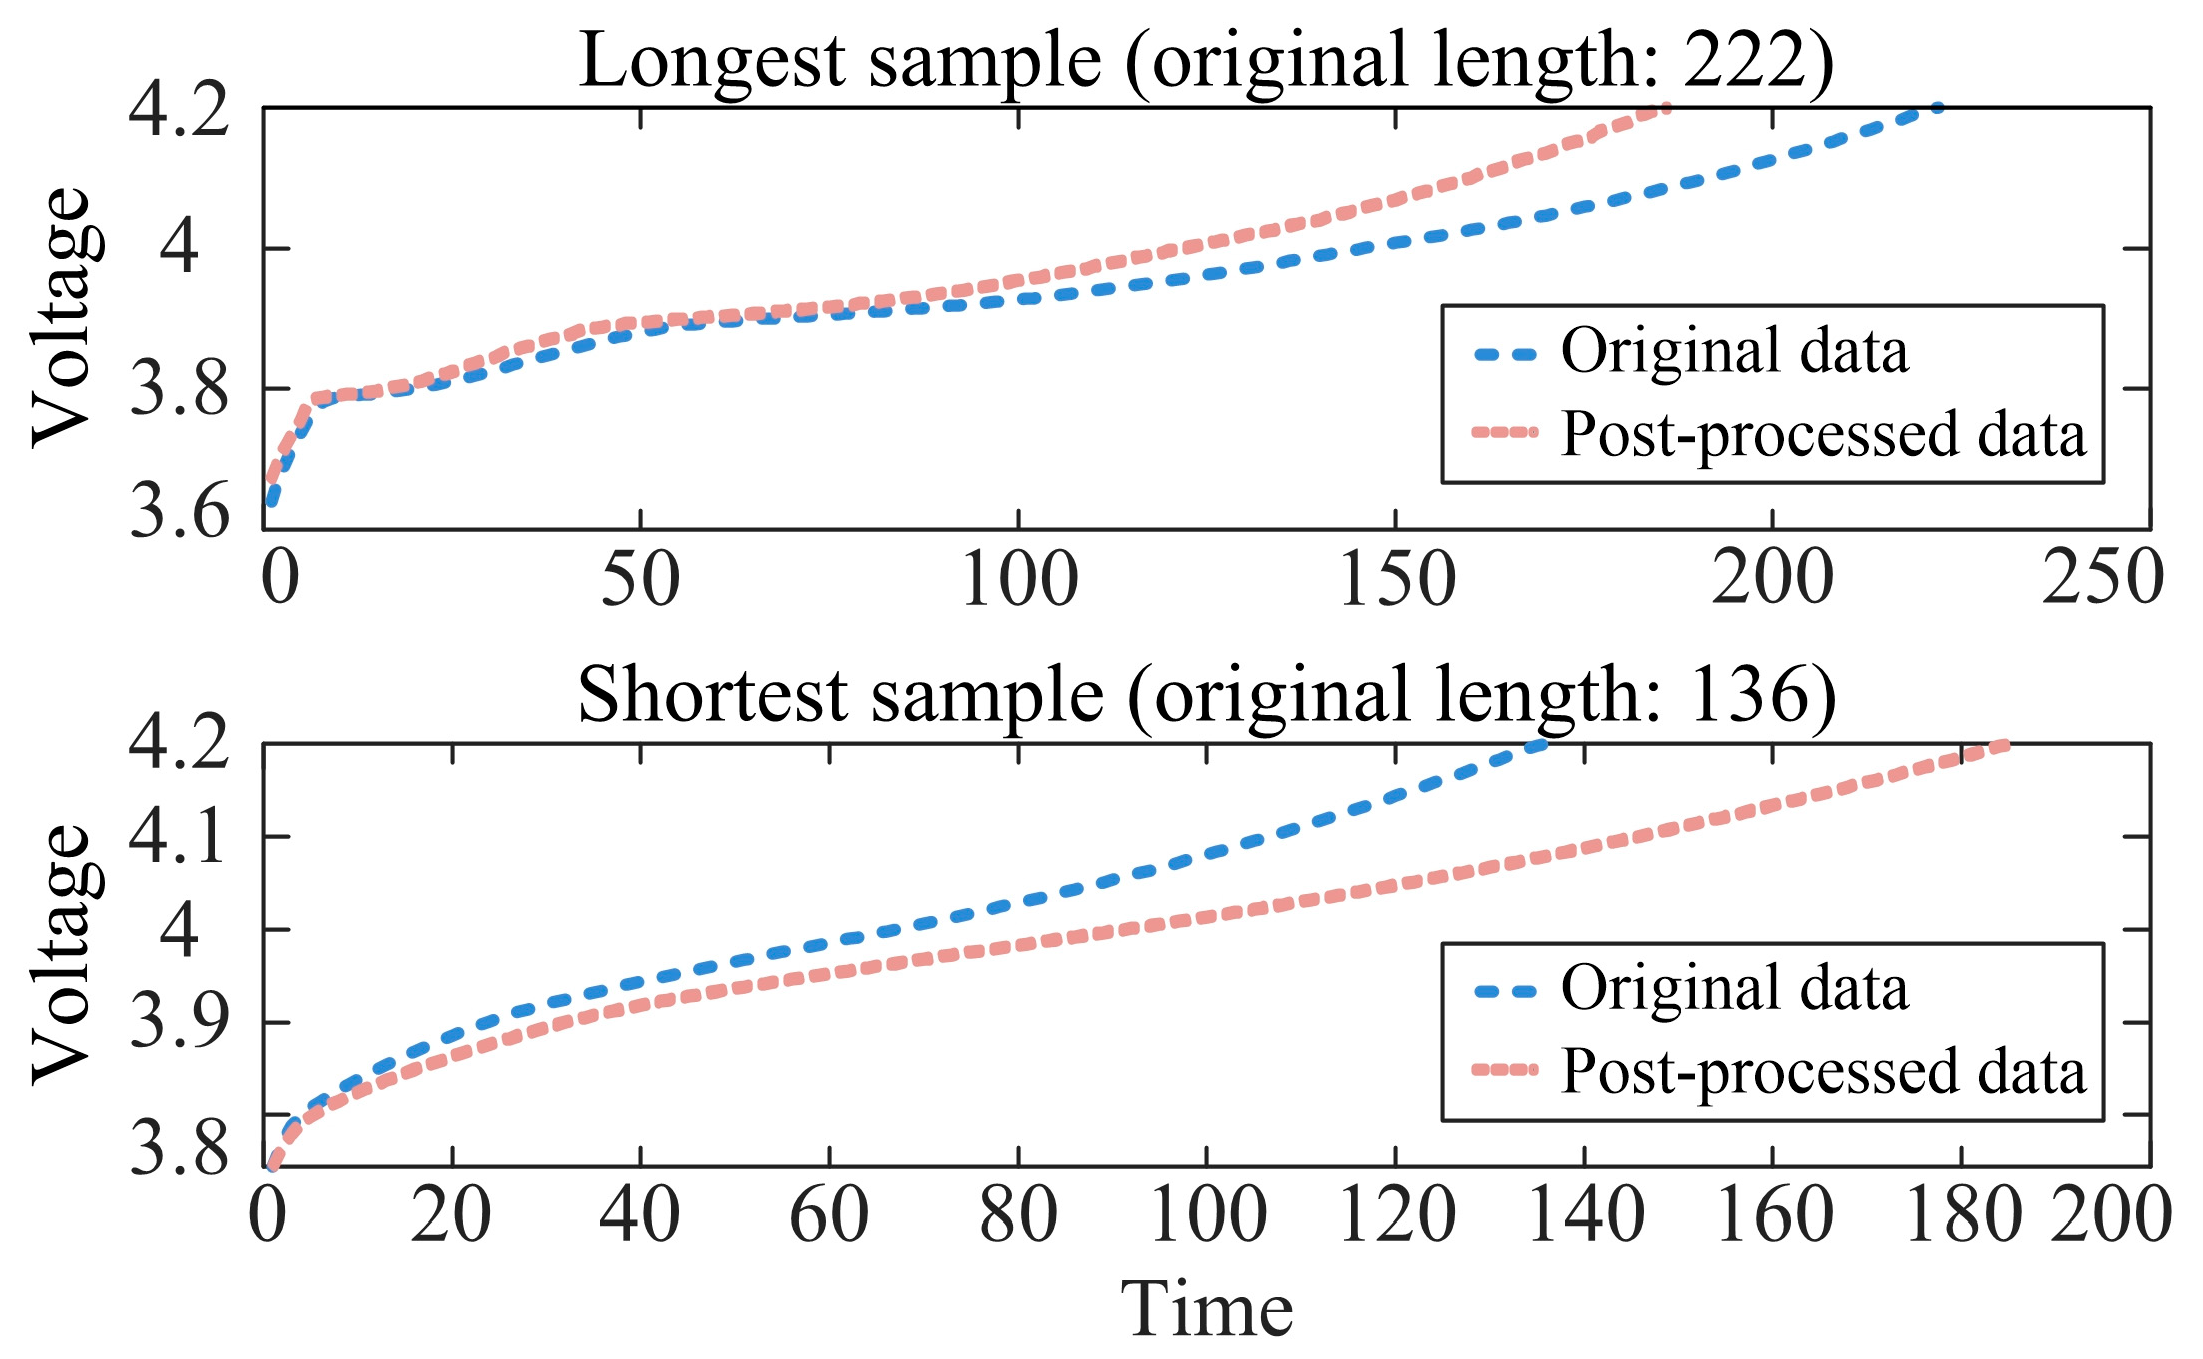
Figure 3 further illustrates detailed comparison results from a 5% random sample, visually validating the method’s superior performance in preserving data morphological characteristics. For the robustness test of the boundary case, this study adopts the extreme scenario verification scheme, selects the two longest and shortest cell samples in the original data, and tests the stability of the method under the 3σ boundary condition, as shown in
Figure 4. The experimental results show that the proposed PCHIP interpolation and adaptive down-sampling strategy still maintain an excellent performance under extreme conditions, and the key feature points are retained intact with no abnormal oscillations.
3.2. GAN
The GAN algorithm learns by pitting the generator and the discriminator against each other, where the generator
G generates false data that approximates the original data, and the discriminator
D distinguishes between the real data and the generated false data, and feeds back the results of the discrimination to the generator [
28,
29,
30]. The maximum-minimum game objective function
V(
D,
G) of
D and
G is as follows:
where:
x is the data of the real sample;
PR is the distribution of the real sample;
is the noise input to the generator;
is the data generated by the generator;
PG is the distribution of the data generated by the generator; and
D(
x) and
D(
G(
)) are the discriminator’s results of the real data and the generated data, respectively. The loss of the discriminator is given in the following equation:
The loss function of the discriminator is minimized so that the discriminator can distinguish the real data from the generated data as accurately as possible, and then the discrimination results are fed back to the generator to improve the quality of the data generated by the generator. The loss function of the generator is as follows:
Minimizing the generator’s loss function prompts the generator to generate samples that can deceive the discriminator, ultimately achieving the effect that the data generated by the generator has the same distribution as the real data, and the discriminator is unable to accurately distinguish between true and false.
3.3. WGAN-GP
The traditional GAN algorithm has some defects in the iterative calculation of the loss function, which leads to an unstable training process. Therefore, scholars proposed the WGAN-GP algorithm, which adopts the Wasserstein distance instead of the traditional Jensen–Shannon scatter or cross-entropy to calculate the loss function. The Wasserstein formula is as follows:
where
WP(
P,
Q) denotes the Wasserstein distance from distribution
P to distribution
Q,
p is the order of distance calculation and denotes the set Π(
P,
Q) of all joint distributions that satisfy the marginal distributions of
P and
Q,
γ is the set of all possible joint distributions from
P to
Q, i.e., all possible transfer schemes from distribution
P to distribution
Q. The Wasserstein distance finds the optimal transfer scheme by minimizing the cost of the joint distribution.
At the same time, to ensure the Lipschitz continuity of the discriminator and improve the training stability, a gradient penalty term is added to the discriminator during the iteration of the algorithm. Therefore, the loss function of the discriminator consists of two parts:
where
is the Wasserstein distance estimate, λ is the penalty factor,
is the gradient penalty term,
is the stochastic linear interpolation between real and generated samples,
denotes the distribution of these difference samples, and
denotes the gradient of the discriminator at the interpolation. In contrast, the generator’s loss function does not use a logarithmic measure, and the loss function becomes:
Compared with the GAN, the WGAN-GP algorithm’s loss function removes the logarithmic link, directly uses the Wasserstein distance of the generated samples in the output of the discriminator to measure the difference between the generated data and the real data, and increases the gradient penalty term. It makes the gradient calculation more accurate and stable, and it effectively alleviates the problems of gradient explosion and gradient vanishing in the traditional GAN algorithm.
3.4. WGAN-GP-Based FDIA Detection and Defence Process
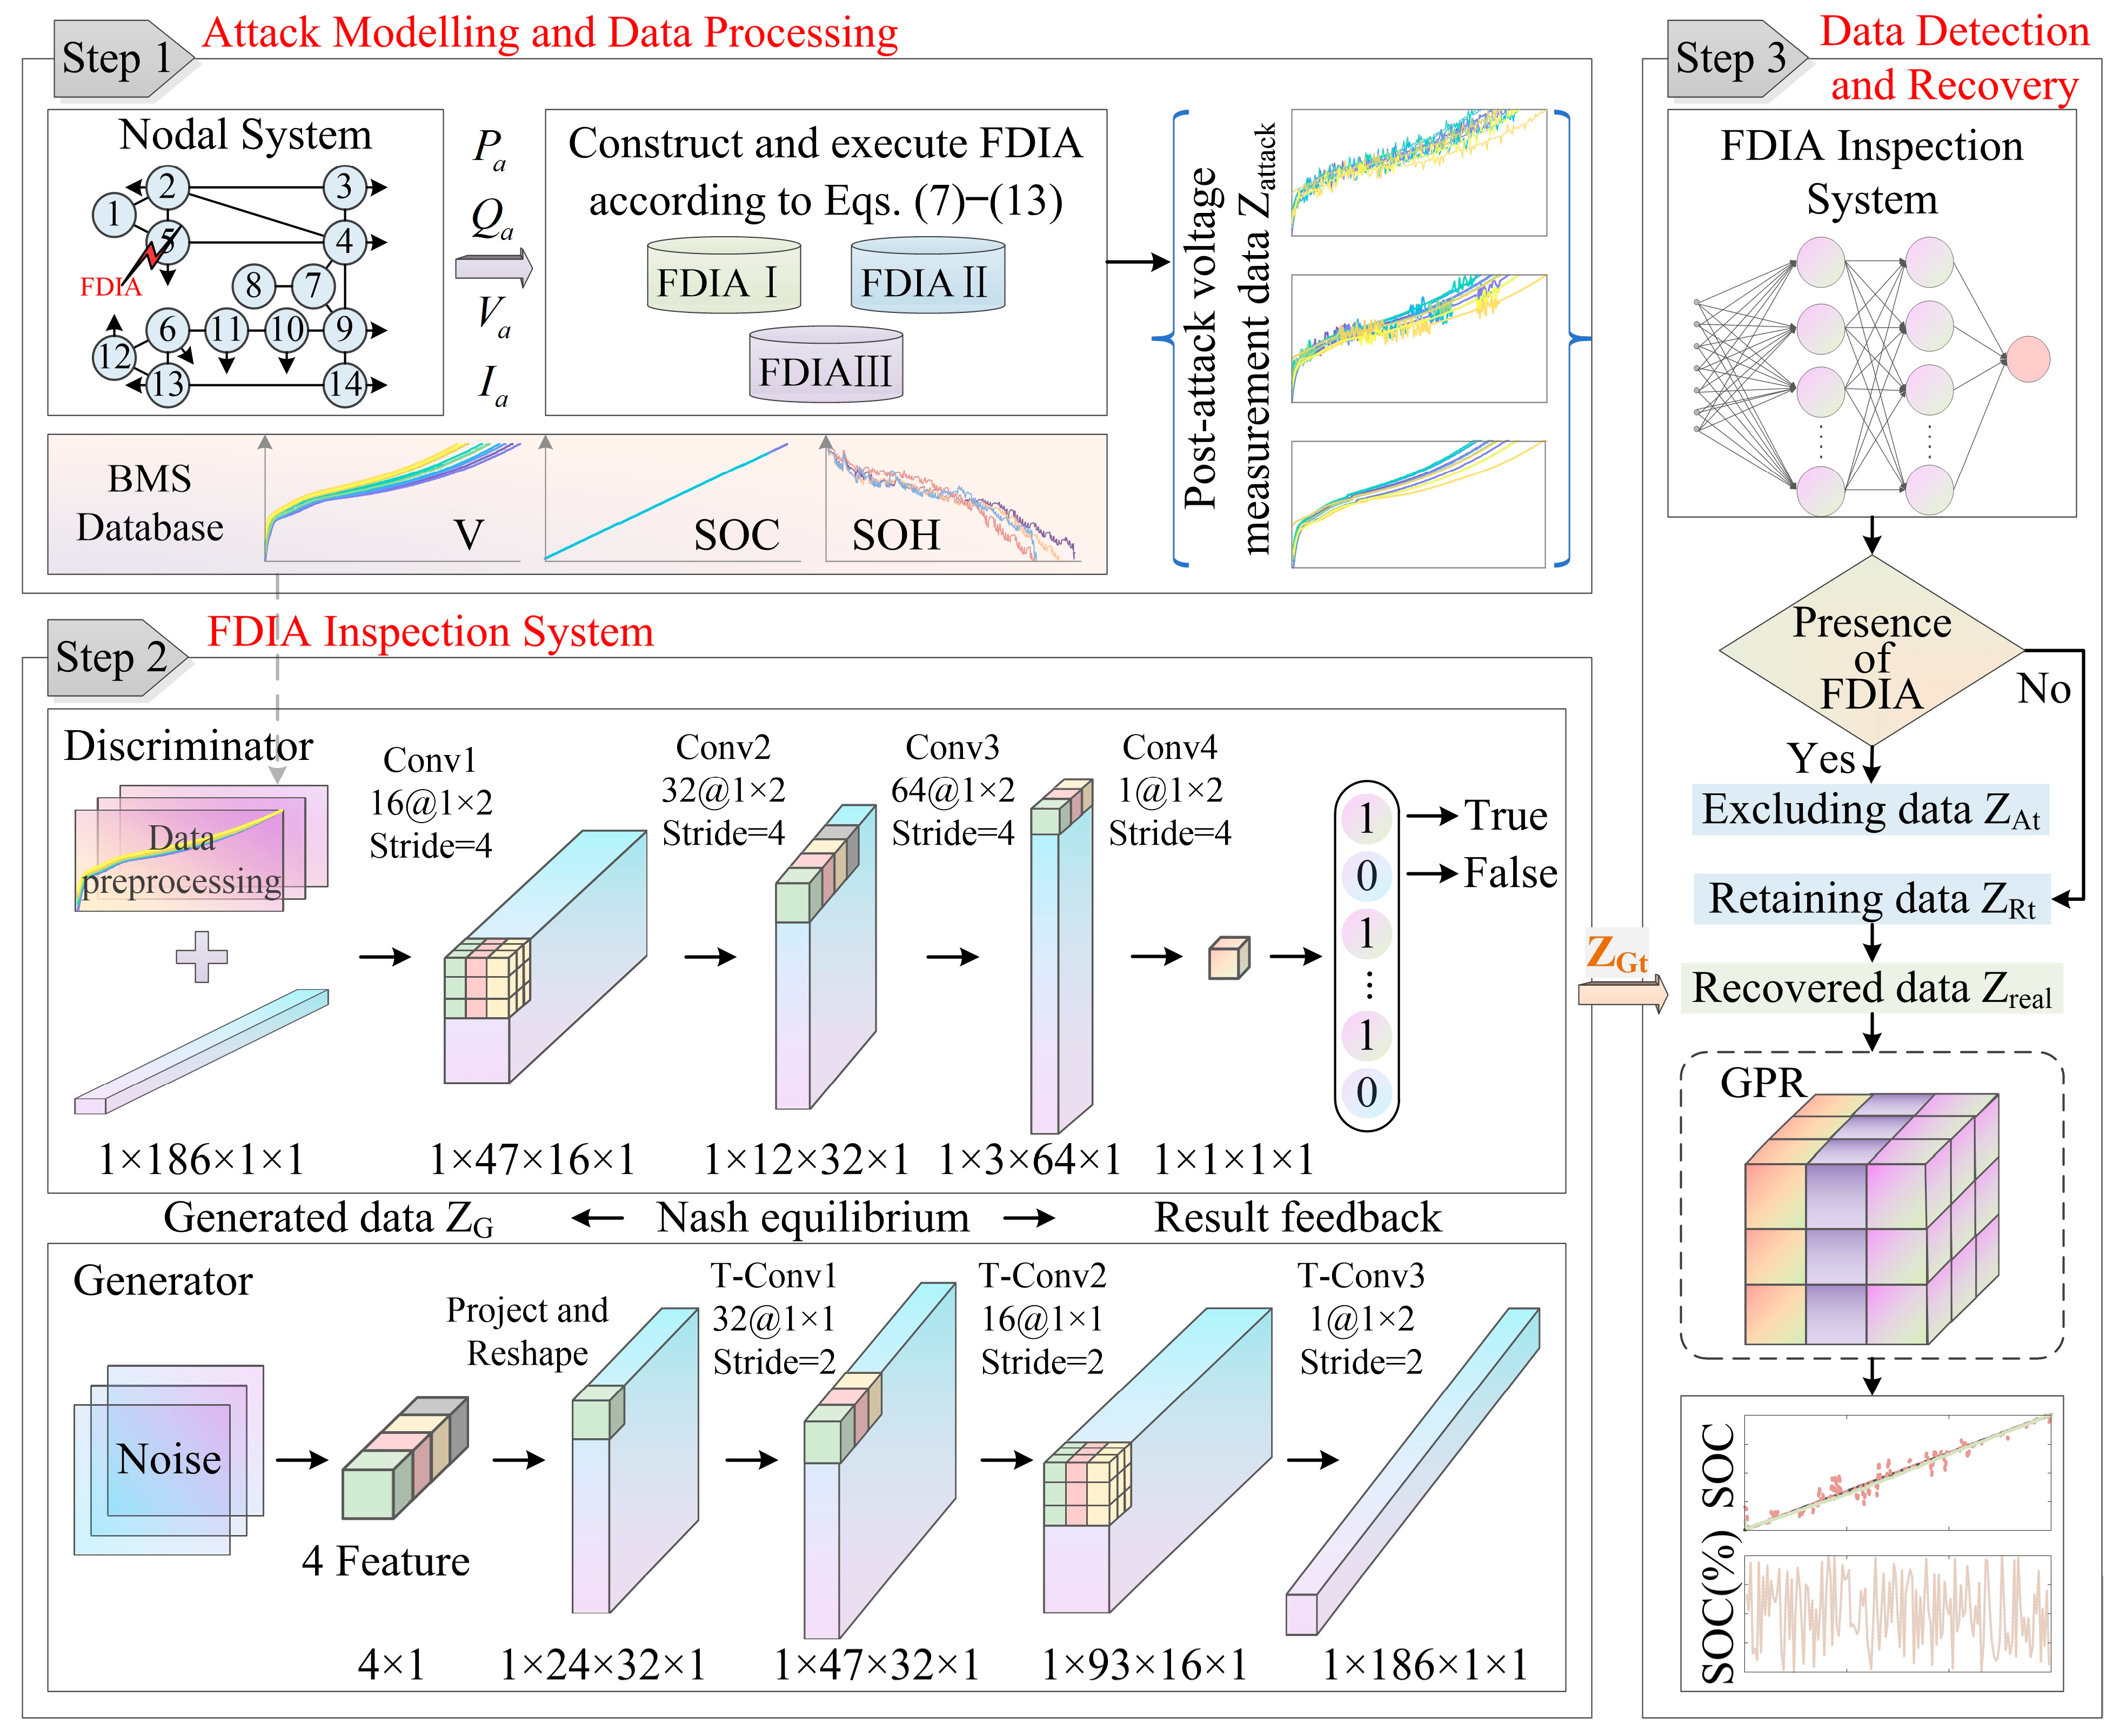
The FDIA detection and prevention system based on the WGAN-GP model uses a three-phase processing flow (
Figure 5), which is implemented in the following steps:
Step 1: Attack modelling and data processing.
A stratified sampling method is used to divide the original dataset into a training set and a test set in the ratio of 9:1.
A multi-form FDIA model based on dual attack targets is constructed on the test set to generate the attack sample set.
Multi-stage standardization and normalization are performed on the raw measurement data (including injected attack samples).
The time-series measurement data are reconstructed into graph-structured data suitable for input to the WGAN-GP model.
Step 2: Model training and testing phase.
Acquisition of battery system historical operation data (Voltage, SOC/SOH estimation).
Generator learns to generate fake samples ZGk based on noise and real data.
Discriminator learns the feature distribution of normal data ZReal and performs sample discrimination.
- 2.
Detection process:
Modelling FDIA detection as a binary classification task (1: normal, 0: attack).
Input test samples to the trained WGAN-GP network.
Achieve attack detection based on a discriminant score and preset threshold τ.
Evaluate model detection performance metrics.
Step 3: Data monitoring and recovery phase.
When attacked data ZAt moment t is detected, abnormal data is removed and normal data ZRt is retained.
Recover missing data using the generator prediction output to generate corrected data Zreal.
Use the recovered data for SOC/SOH estimation to ensure reliable system operation.
This process improves detection sensitivity through adversarial training and achieves effective recovery of attack data, significantly reducing the impact of FDIA on the BESS.
4. Calculus Analysis
To verify the effectiveness of the FDIA detection method based on the WGAN-GP model in BESSs, this paper conducts experiments in the MATLABR2023a simulation environment. The test system uses the IEEE 14-node and IEEE 118-node systems provided by the MATPOWER 8.0 data package, covering the network topology, node parameters, and branch data, assuming that the attacker possesses complete network model information, representing a worst-case scenario. The dataset used for the experiment is Maryland CS2_35 battery charging data, totalling 641 charge/discharge cycle data [
31]. To simulate real measurement conditions, Gaussian noise with a mean of 0 and standard deviation σ = 0.01 p.u. was added to all experimental data.
4.1. FDIA Simulation Analysis
To further validate the effectiveness and adaptability of the proposed defence method, this section first performs the BDD-based attack feasibility validation on the IEEE 14-node and IEEE 118-node test systems. For the IEEE 14-node system, the attacking nodes are set as nodes 12, 5, and 14, and the attacking routes are 12 and 14; for the IEEE 118-node system, the attacking nodes are nodes 8, 18, 26, 74, and 77, and the corresponding attacking branches are branches 12, 19, 95, and 129. In order to evaluate the covertness and feasibility of the attacks, this paper calculates the normalized residual mean of the attacked nodes before and after the attacks on the two node systems. The normalized residual means and chi-square statistics before and after the attack are also calculated, and the results are shown in
Table 2.
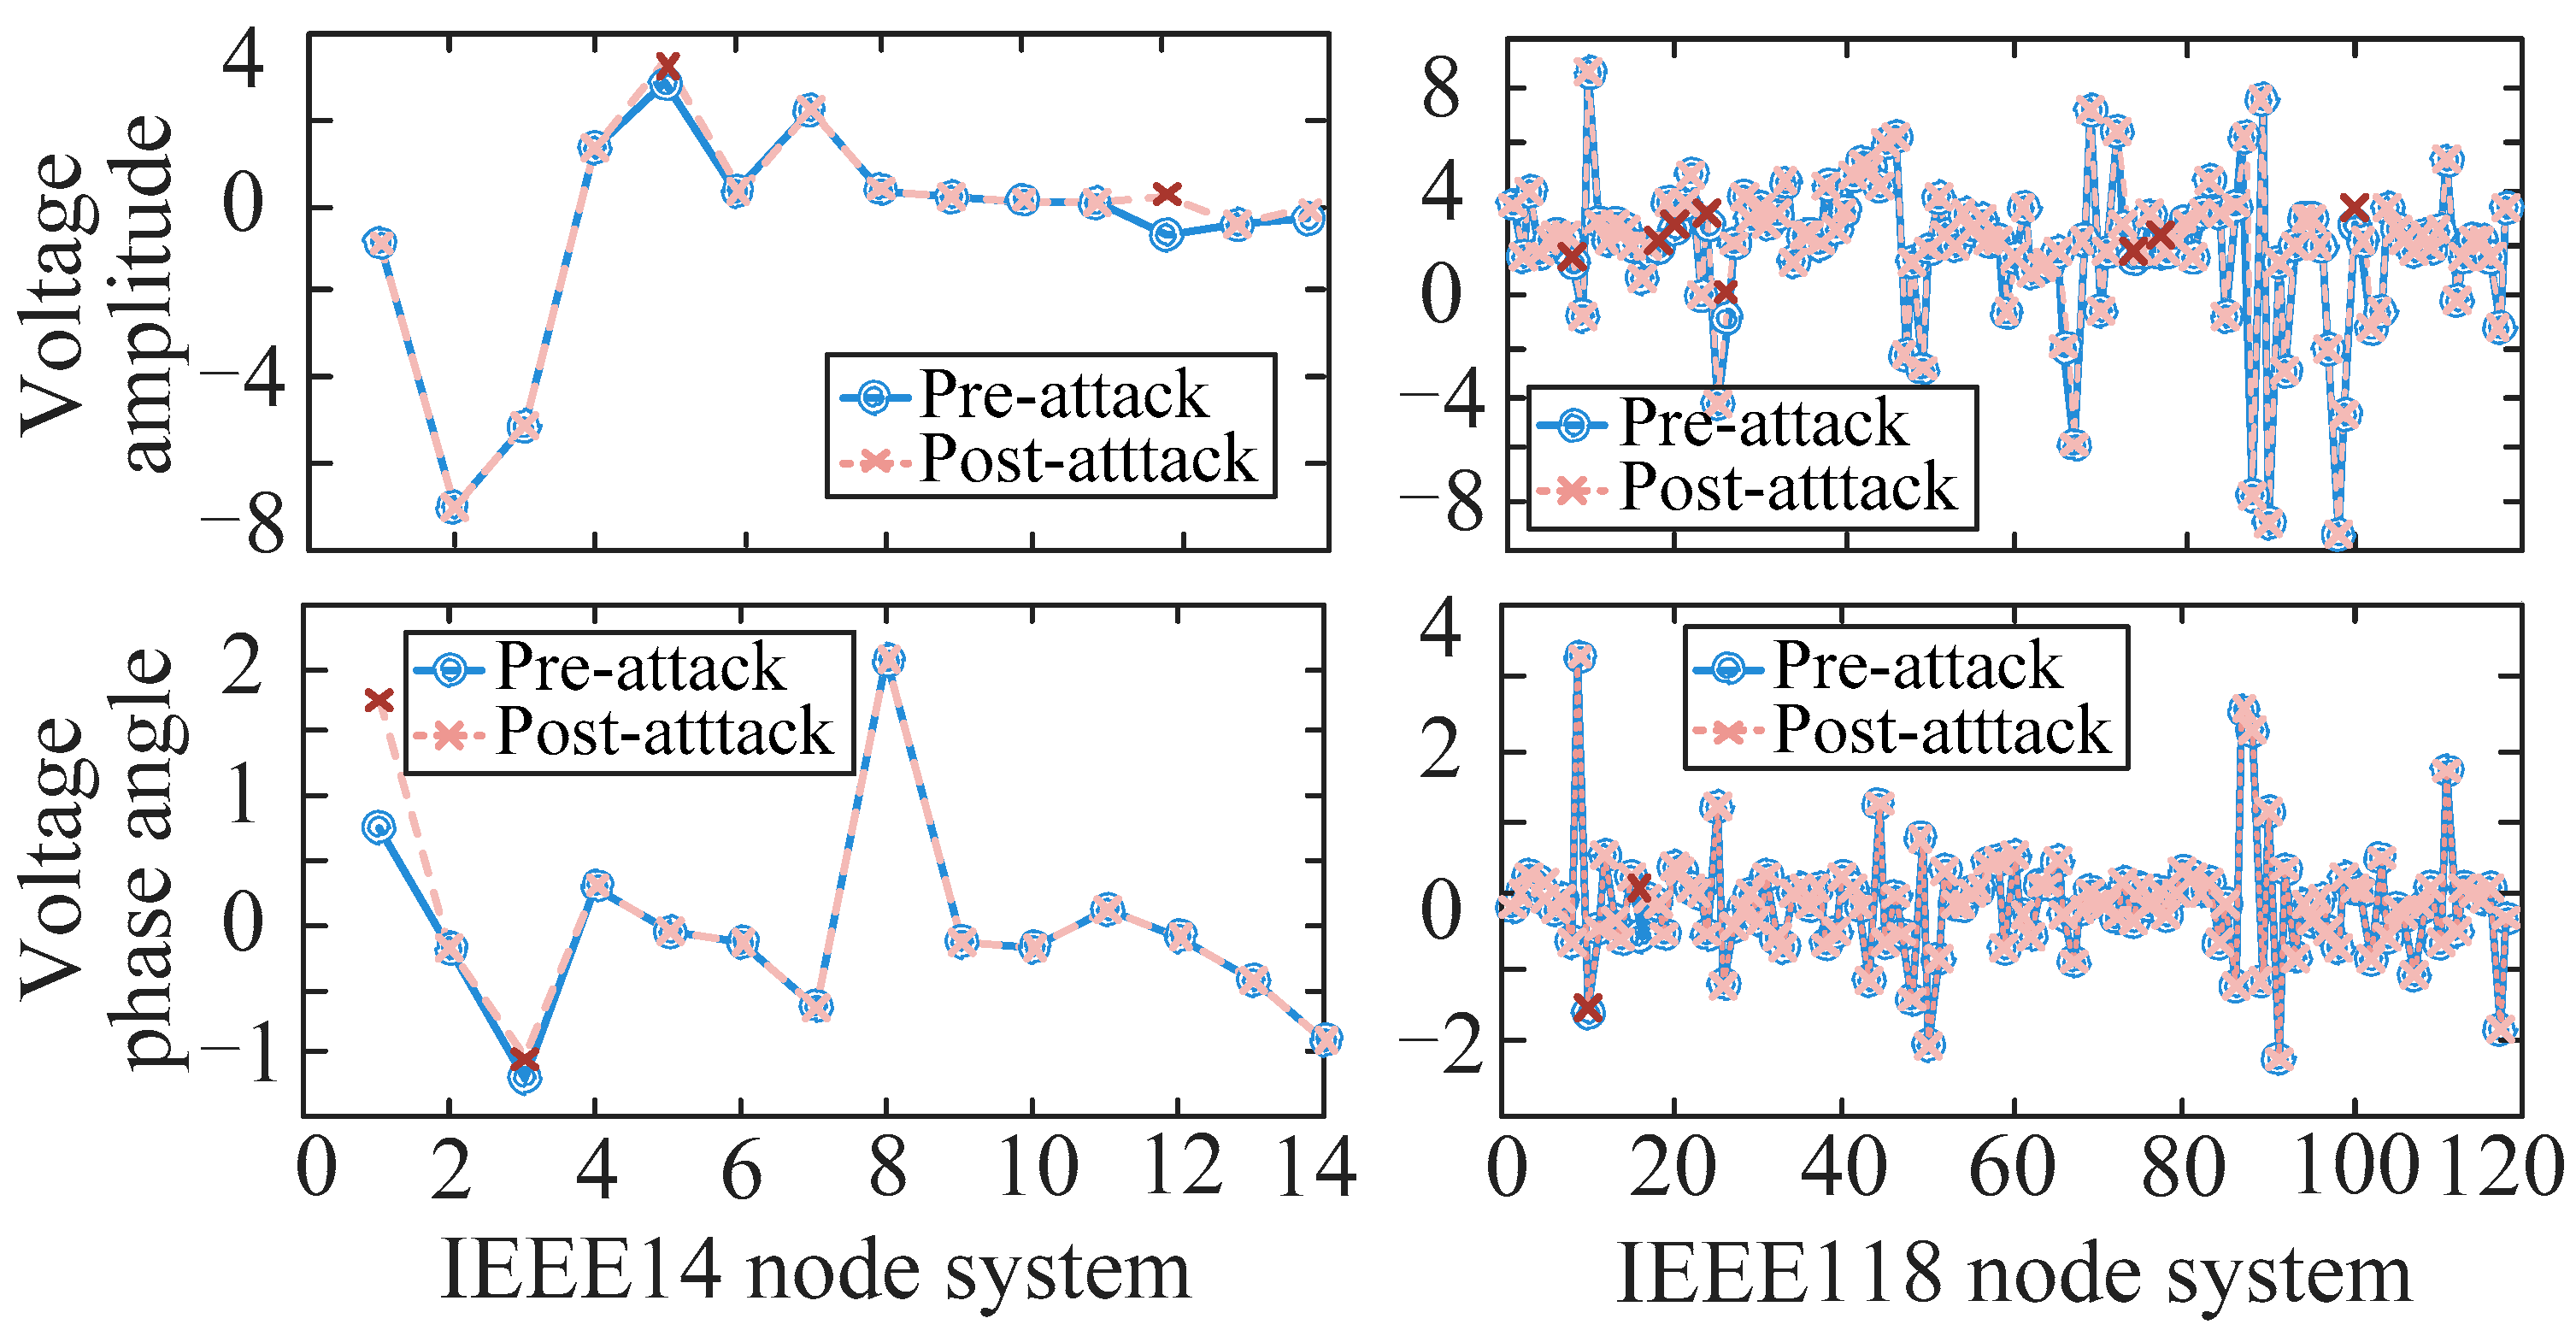
Table 2 shows that none of the metrics exhibited significant changes post-attack, and the chi-square statistics did not exceed the detection thresholds (at a 95% confidence level, the detection threshold τ for the IEEE 14-node system with 2 degrees of freedom is 3.666, and the detection threshold τ for an IEEE 118-node system is 5.99). This indicates that FDIAs can effectively evade traditional BDD mechanisms in both node systems, demonstrating strong concealment and feasibility. The state estimation results for the IEEE 14-node system and IEEE 118-node system without any defensive measures are shown in
Figure 6.
From the figure, it can be observed that the voltage amplitude and phase angle of the nodes attacked by FDIAs are significantly shifted, showing abnormal fluctuations or systematic deviations compared with the normal state, which further verifies that FDIAs can quietly change the operation state of the system while guaranteeing that the residual test passes, which fully reflects that the attack design achieves a good balance between destructive and covert, bringing potential threats to the system’s operation safety.
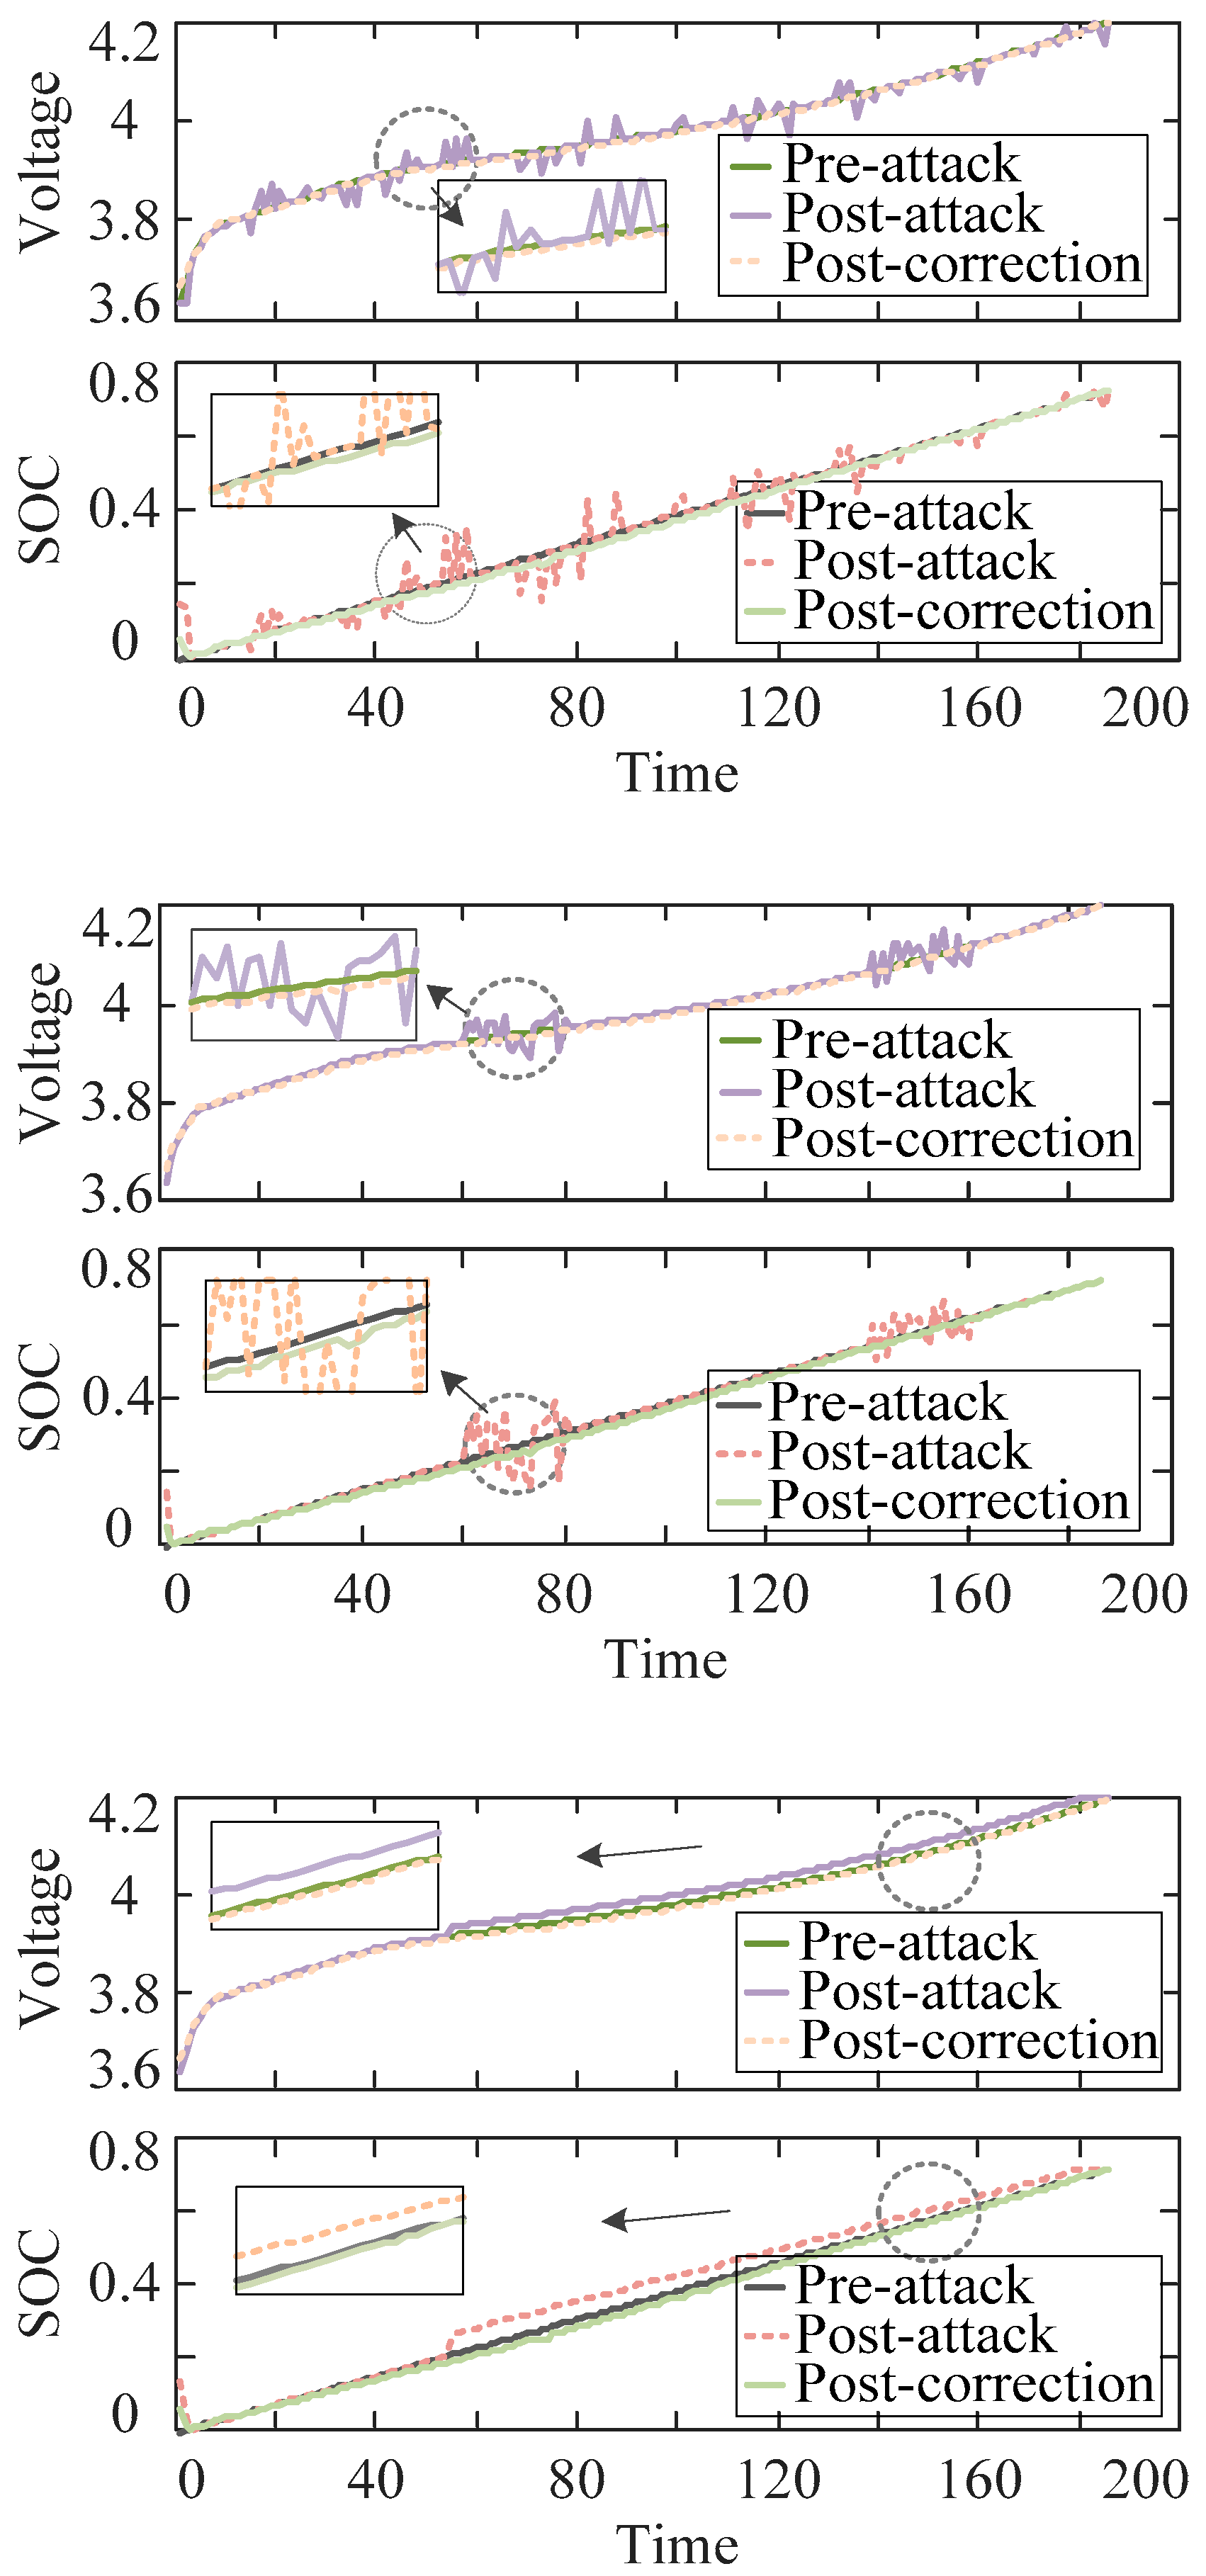
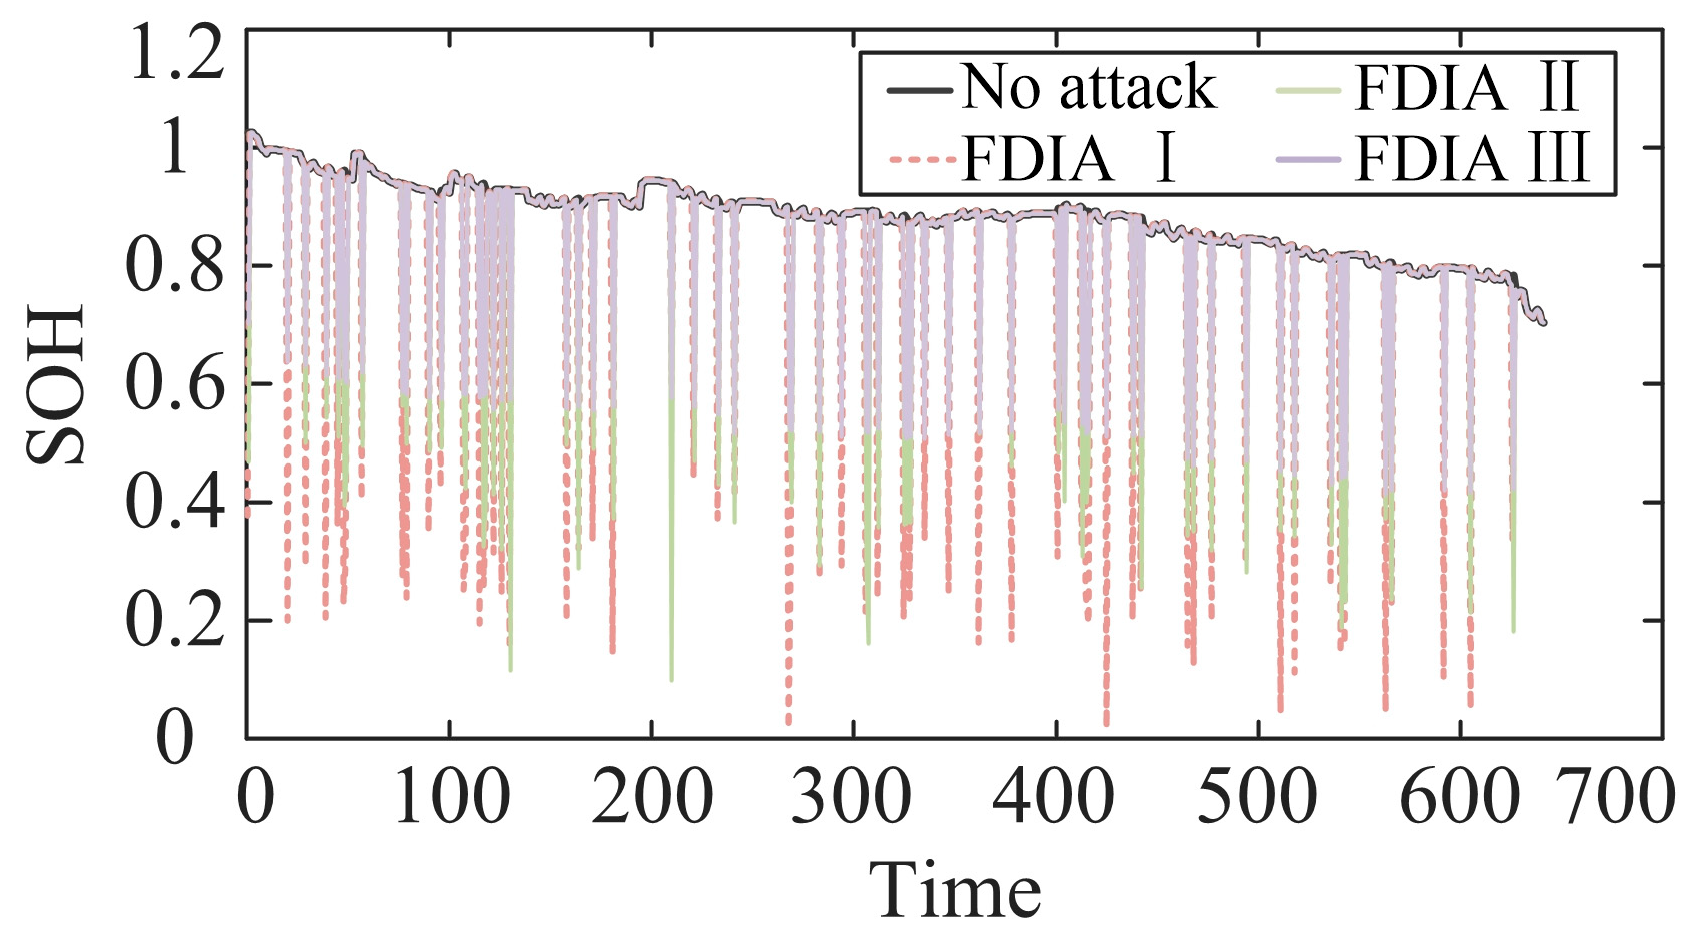
Further, to evaluate the system response under different attack strategies, this paper introduces three types of FDIAs in a normally operating BESS energy storage system: attack 1: randomly select 30% of the discrete data points for the attack, with an attack range of [−0.1, 0.1]; attack 2: segment the data in a loop, and select the consecutive data within the 30% interval to be tampered with; and attack 3: in the process of the loop attack 3, inject a fixed offset vector with an offset of 200 mV starting from the 30% moment point in the cycle.
The changes in system measurement data under the three attack modes are shown in
Figure 7 and Figure 9, from which it can be observed that different types of FDIA have triggered obvious abnormal fluctuations in the battery voltage curves and at the same time caused obvious deviations in the SOC and SOH estimates, further indicating that the FDIA can effectively damage the state of the BESS storage system without triggering the alarm of the traditional detection mechanism, increasing the uncertainty and potential risk of system operation. Estimation accuracy increases the uncertainty and potential risk of system operation. It is worth noting that, to effectively reduce the estimation bias due to sensor noise, model error, and external interference in the state estimation process, this paper constructs a high-precision data-driven estimation model based on the Gaussian process regression (GPR) method proposed in Paper 1 [
32,
33,
34]. The model can adaptively learn the dynamic characteristics of the battery by exploiting the nonlinear mapping relationship in the historical operation data, to achieve the robust estimation of SOC and SOH.
4.2. Position Detection Simulation and Analysis
Based on the above attack simulation scenarios, this paper obtains the dataset used for FDIA localization detection through multiple sampling. The detection method starts from the perspective of label binary classification and adopts classical binary classification evaluation metrics to comprehensively evaluate the detection performance. The selected metrics include accuracy, cross-entropy loss, precision, recall, F1-score, precision–recall curve, and AUC value. The WGAN-GP detection performance metrics under the three attack modes are shown in
Table 3.
Analyzing the indicators in
Table 3, the AUCs under the three attack modes are all at a high level; in particular, attack 3 reaches 0.9055, indicating that the WGAN-GP model has good differentiation ability and can effectively improve the stability and accuracy of detection when coping with different forms of FDIA; the accuracy, precision, and recall rates can all be maintained at a high level under different attack intensities and modes, with the recall rate is almost close to 100%, showing excellent performance of the WGAN-GP algorithm in terms of high recognition rate, high robustness, and low false detection rate; the F1-score composite index further verifies that the model achieves a good balance between accuracy and recall, and it has a stable and reliable classification ability. In terms of cross-entropy loss, the loss value under attack 3 is slightly higher, reflecting that the fixed-offset type attack relatively In terms of cross-entropy loss, the loss value under attack 3 is slightly higher, reflecting that the fixed offset attack increases the detection difficulty, but the overall loss level is still within the acceptable range and does not lead to a significant decrease in the performance index, which shows good robustness of the model under different attack environments, and it proves its wide adaptability and high efficiency in the localization and detection of FDIAs in the BESS energy storage system.
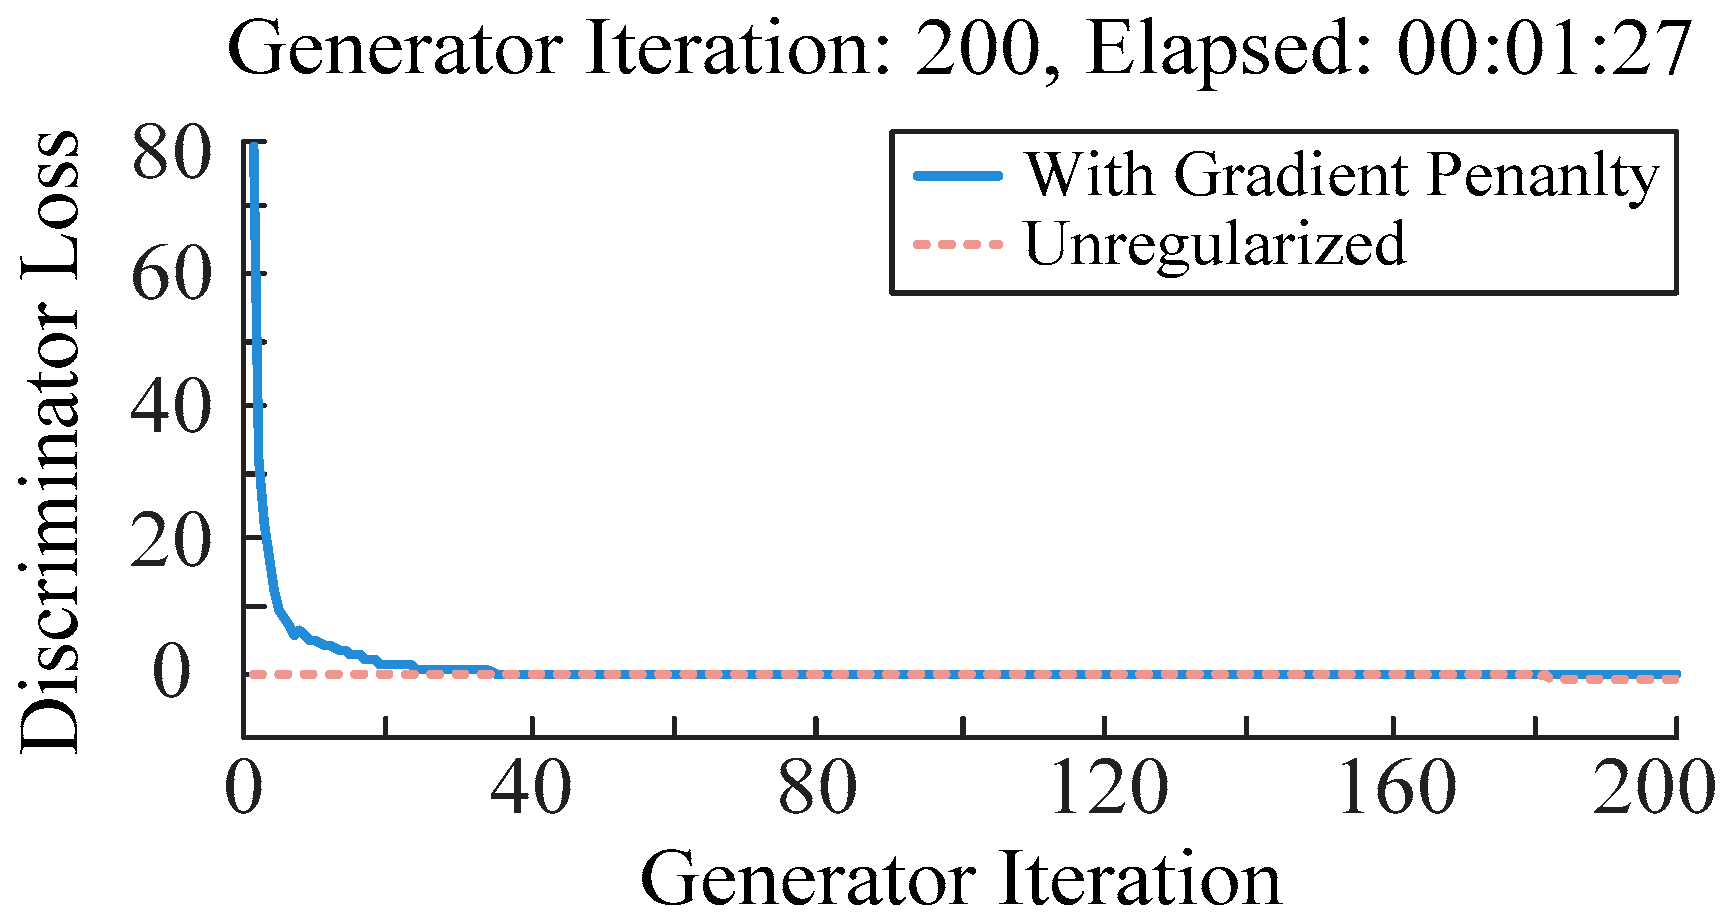
Figure 8 illustrates the trend of the discriminator loss of the WGAN-GP model during the training process. With the increase in the number of iterations, the loss value continues to decrease and eventually converges stably to a level close to 0. This convergence process indicates that the generator and the discriminator gradually reach a balance during the game, and the model can effectively learn the different characteristics between normal data and attack data. The smooth convergence of the loss curve further verifies that the WGAN-GP method has good training stability and feature extraction ability under different attack modes, which can achieve accurate identification and effective defence against FDIA.
After locating the attacked measurement data, this paper adopts the generation model based on WGAN-GP to generate complementary data that is highly similar to the normal measurement data to replace the attacked data, to complete the state reconstruction, and effectively defend against FDIA. To verify the accuracy and applicability of the data recovery methodology, this paper conducts detailed comparisons between the recovered measurement data, the measurement data in normal operation, and the abnormal measurement data after the attack. Data are compared in detail, and the SOC estimation results in the attacked state are also corrected, as shown in
Figure 9.
The comparison results demonstrate that, after processing with the detection and data recovery method proposed in this paper, the restored voltage data curve closely matches the curve under normal operating conditions. Reconstruction error analysis indicates a maximum reconstruction error of only 0.13547 V, with an average error of 0.005584V and a 95% confidence interval of [0.005509, 0.005659] V. This effectively eliminates abnormal disturbances introduced by attacks, significantly enhancing data authenticity and reliability. In addition, the SOC estimation results are also basically restored to the change trend and value level before the attack after the restoration, without obvious deviation or fluctuation, which further verifies the accuracy and reliability of the restoration algorithm. This result fully demonstrates that the defence mechanism proposed in this paper is not only able to accurately detect and locate the data anomalies in the BESS attacked by FDIAs but also achieve high-precision data reconstruction and state recovery on this basis, which significantly improves the security and robustness of the system in the face of the complex malicious attack environment and provides solid technological support for the safety and protection of the BESS in practical engineering applications.
Figure 9.
Comparison of voltage data and SOC estimation before and after the attack, as well as after correction of the attack.
Figure 9.
Comparison of voltage data and SOC estimation before and after the attack, as well as after correction of the attack.
5. Conclusions
This paper addresses the security issue of state estimation for BESSs in power grids under the threat of FDIAs. It systematically investigates the attack mechanisms of FDIAs, constructs a multi-scenario FDIA model tailored for BESSs, and proposes an integrated detection and recovery defence framework combining data preprocessing with WGAN-GP. The main research conclusions are as follows:
(1) For the characteristics of microgrid BESS state estimation, an optimized attack model of FDIA considering overload constraints, boundary node constraints, and lithium battery upper and lower limit constraints is constructed. Through simulation verification on IEEE 14-node and 118-node systems, it is confirmed that the carefully designed attack vectors can significantly affect the state estimation results of BESSs while bypassing traditional bad data detection mechanisms, fully demonstrating the stealthiness and destructiveness of this type of attack in real power grid environments.
(2) An FDIA detection method combining multi-stage data normalization and a WGAN-GP deep generative adversarial network is proposed. Aiming at the problem of inconsistent length of measurement data, a multi-stage interpolation and down-sampling standardization process was designed to provide high-quality, consistent inputs for subsequent deep learning models. This significantly enhances model training stability and generalization capabilities.
(3) The detection and recovery mechanism based on WGAN-GP can effectively identify multiple FDIA patterns (including random discrete point tampering, continuous interval data destruction, and fixed offset injection) and achieve high-precision reconstruction of damaged measurement data through the generator. Simulation results demonstrate that this method exhibits excellent detection accuracy, defence robustness, and data recovery capabilities across different attack scenarios. It provides a systematic solution for BESS facing complex cyberattacks and holds significant engineering application value.
