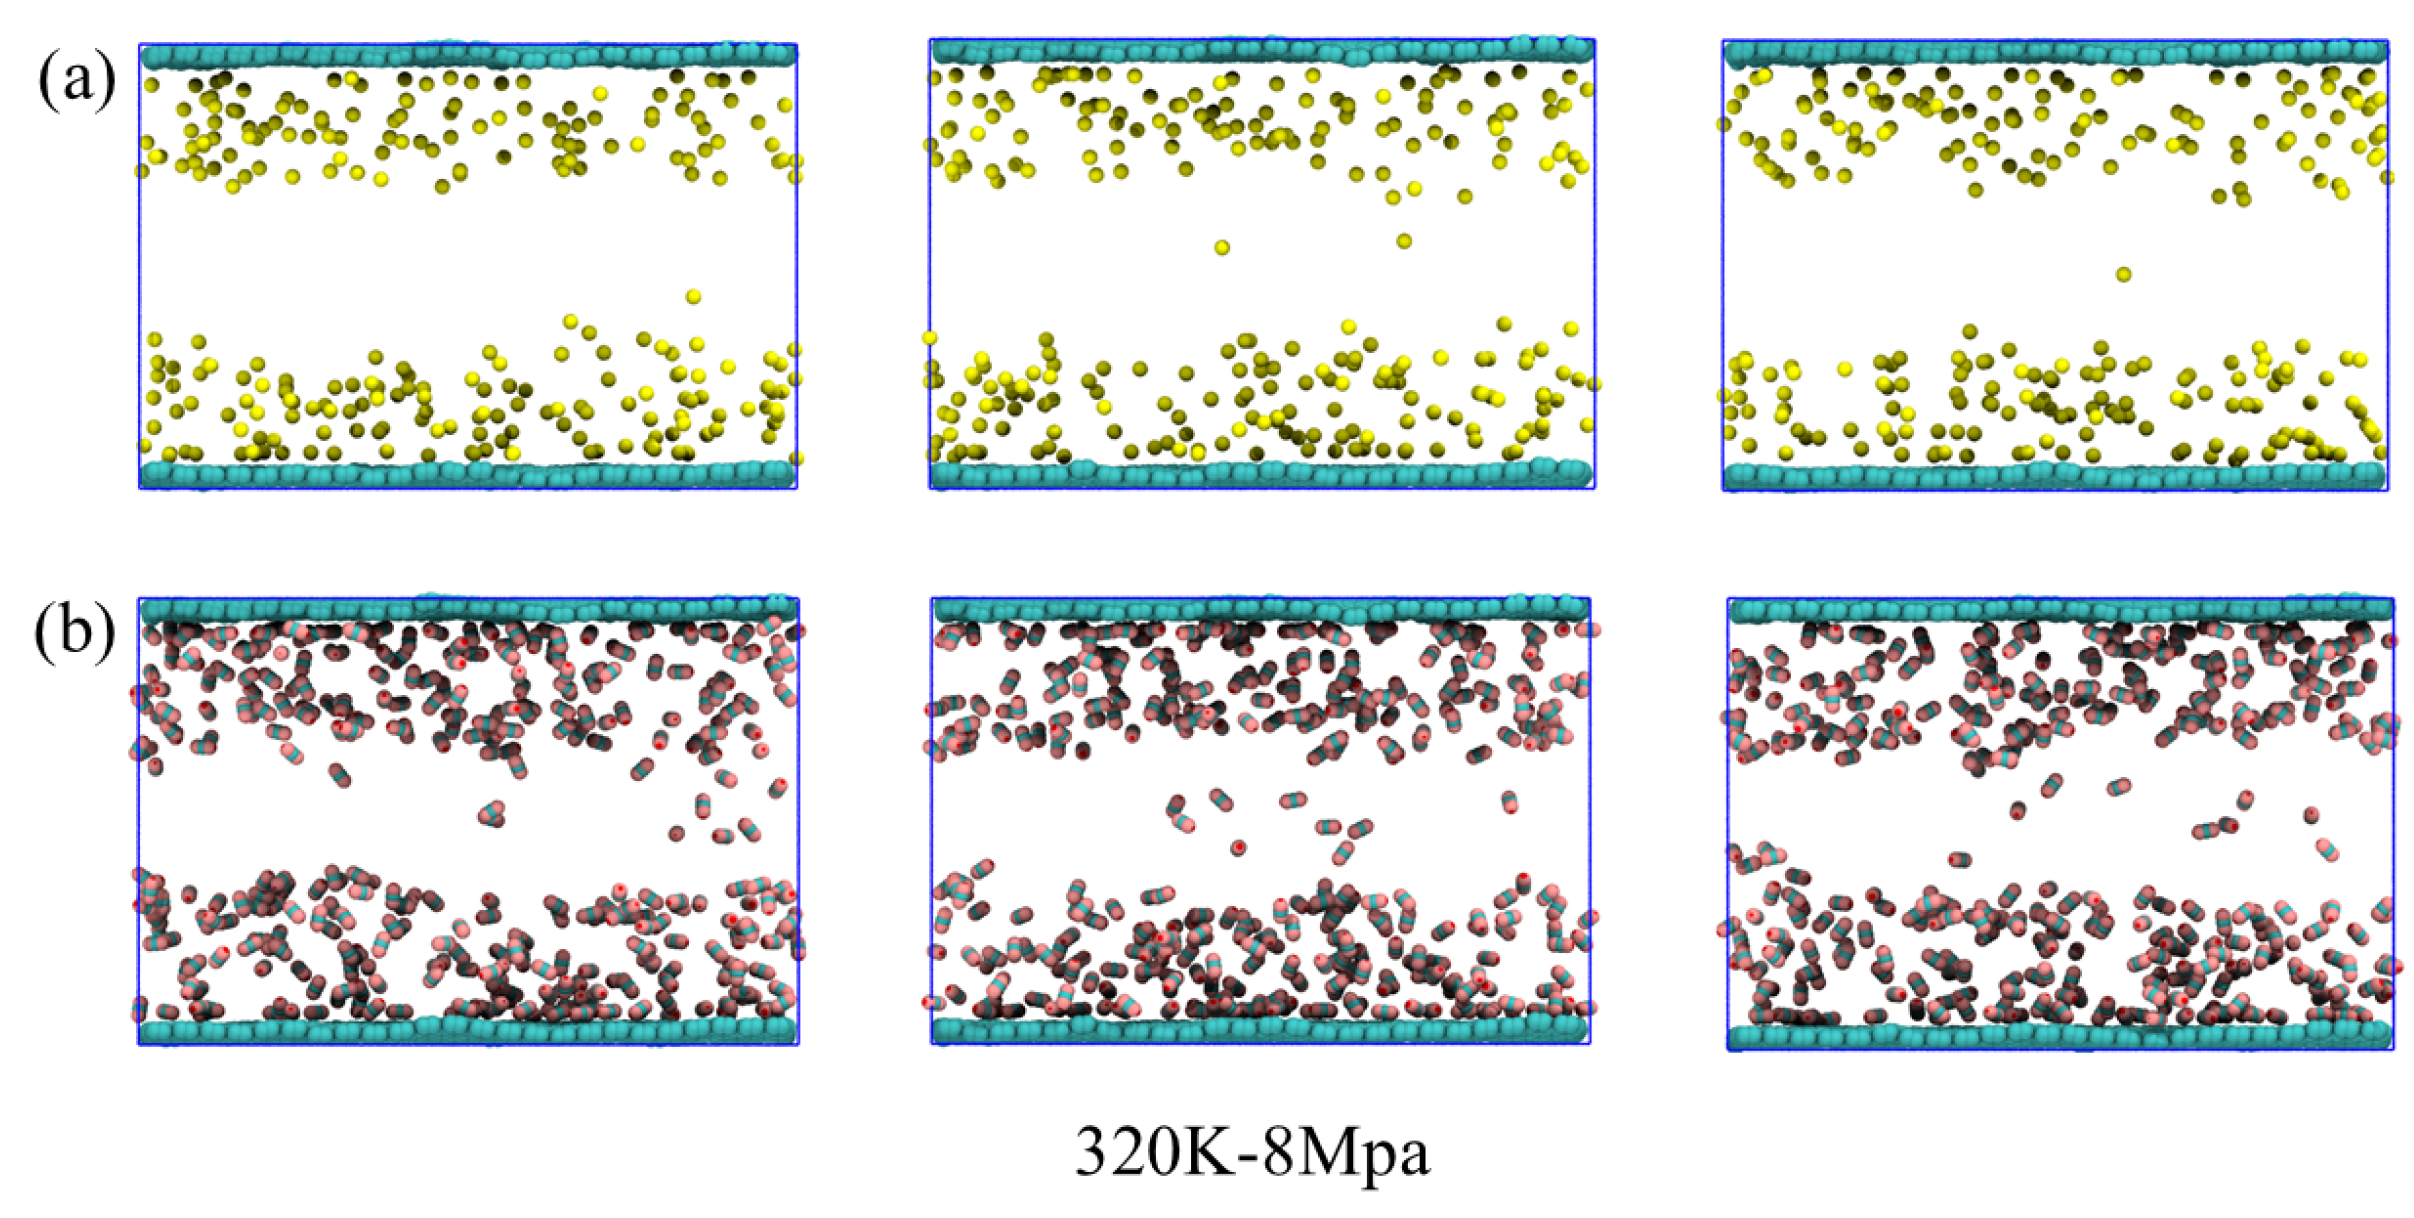
Abstract
Unconventional natural gas development requires a deeper insight into how CH4 and CO2 adsorb and diffuse in the pores of coal seams. Graphene (GRA) is frequently employed in microscopic mechanism simulations on coal surfaces because its structure closely resembles that of the coal seam matrix. In this study, molecular dynamics simulations were conducted to systematically investigate the diffusion, adsorption, and desorption behaviors of CH4 and CO2 within the pore system of hydrated graphene under three representative temperature and pressure conditions: 190 K-6 MPa, 298 K-0.1 MPa, and 320 K-8 MPa. The results show that heatinfg and depressurization significantly enhance the diffusion ability of gas molecules and promote their desorption from the graphene surface. Low temperature and high pressure are conducive to the formation of a stable adsorption layer, and more hydrogen bond structures are formed between CO2 and water. However, under high-temperature conditions, this ordered structure is significantly weakened. The density distribution further reveals the spatial distribution characteristics of water molecules and gases and their evolution trends with changes in temperature and pressure. This research is conducive to a deeper understanding of the multiphase behavior of coalbed methane and its regulatory mechanism, providing theoretical support for the gas storage and displacement processes.
1. Introduction
Coalbed methane (CBM), a type of unconventional natural gas, consists predominantly of methane (CH4) [1,2]. In recent years, it has received increasing attention in the global energy structure, especially against the backdrop of the clean energy transition [3,4]. In contrast to conventional natural gas, coalbed methane primarily exists adsorbed on the surfaces of coal pore walls, rather than being trapped within the pore spaces [5]. Although this special occurrence form increases the difficulty of extraction, it also brings unique utilization value [6]. Meanwhile, carbon dioxide (CO2) has not only drawn much attention due to the greenhouse effect [7,8], but also become a research hotspot because of its potential in enhancing coalbed methane extraction (ECBM) [9,10]. By injecting CO2 into coal seams, the displacement and recovery of CH4 can be achieved, and CO2 can be safely stored underground [5,11]. This process has dual significance for energy development and carbon reduction [12,13]. Therefore, a thorough understanding of how CH4 and CO2 are adsorbed and desorbed in coal seams is not only related to fundamental research but is also a crucial step in enhancing mining efficiency and promoting green development [14].
Currently, significant progress has been made in understanding the adsorption behavior of CH4 and CO2 in coal seams, particularly through molecular simulation studies [3,15]. Techniques such as Grand Canonical Monte Carlo (GCMC) and Molecular Dynamics (MD) simulations are commonly employed to investigate gas adsorption capacities, diffusion properties, and intermolecular interactions within coal molecules and pore structures [4,16]. Over the past decade, molecular simulation technology has been widely applied in research on coalbed methane adsorption mechanisms [17]. Many scholars have employed GCMC and molecular dynamics (MD) methods to construct various types of coal molecular models, revealing the adsorption behavior of CH4 and CO2 within coal at the microscopic level [18,19]. Zhang, J. et al. used combined Monte Carlo and molecular dynamics simulations to study CH4, C2H6, and CO2 sorption isotherms on dry coal, revealing how pressure, temperature, and molecular interactions influence adsorption behavior, with implications for methane recovery and CO2 sequestration [20]. Han, Q. et al. employed Grand Canonical Monte Carlo and molecular dynamics simulations with graphene-based pore models of varying sizes to investigate competitive adsorption of CH4 and CO2 in coal, revealing how pore size, pressure, and CO2 concentration influence methane desorption and providing guidance for enhanced gas recovery [11]. Furthermore, Long, H. et al. applied Grand Canonical Monte Carlo and molecular dynamics simulations to coal pore models of different sizes to analyze CH4, CO2, and N2 adsorption and diffusion, showing that CO2 exhibits the strongest adsorption while larger pores favor gas diffusion, with distinct interaction mechanisms among the three gases [6].
Some researchers have started considering the effect of pressure. For example, Xie, W. et al. experimentally investigated CH4 and CO2 adsorption on Longmaxi shale under high pressure and temperature, showing that CO2 has a stronger adsorption affinity than CH4, with pressure and temperature significantly affecting adsorption patterns and having implications for enhanced gas recovery and CO2 storage [21]. However, it is worth noting that they still did not incorporate phase changes into the analytical framework, even though the simulated pressure was approaching the critical point. Hong, L. et al. used molecular dynamics and grand canonical Monte Carlo simulations to explore how varying water content affects CO2, CH4, and N2 adsorption in coal, finding that CO2 consistently shows a strong adsorption advantage while increased moisture reduces overall adsorption and diffusion by forming inhibitory water layers [22]. However, the simulation temperature remained fixed at 298 K, which does not adequately represent the actual behavior under supercritical conditions. Although Jia, J. et al. applied Grand Canonical Monte Carlo and molecular dynamics simulations to a macromolecular model of Jixi gas-fat coal, showing that CH4, CO2, and H2O adsorption has a Langmuir-type behavior with distinct temperature and pressure dependencies, and revealing stronger adsorption and interaction energies for H2O and CO2 compared to CH4 alongside differing diffusion dynamics [23].
From the existing literature, most studies still focus on adsorption analysis in dry coal, a single gaseous state, or medium- and low-pressure environments. Systematic simulations of the adsorption behavior of CH4 and CO2 under high-temperature, high-pressure, or even supercritical phases are still relatively scarce [8,24]. It is precisely in deep coal seams that these gases are often in a subcritical or even supercritical state, and their thermodynamic properties are significantly different from those of the gaseous state. Therefore, delving deeply into the microscopic interactions between gases and coal bodies in different phases is an important part of understanding the mechanisms of coalbed methane storage and CO2 storage [25].
Although existing studies have revealed the adsorption behavior of CH4 and CO2 in coal seams, there is still, overall, a lack of systematic analysis of the adsorption and desorption mechanisms of gases in different phases (gaseous, liquid, and supercritical states) [26]. On the one hand, most simulations assume that the gas is in a stable gaseous state by default, ignoring that as the temperature and pressure change and the gas state transitions, its density, diffusion capacity, and interaction with the coal structure will also change significantly [27]. On the other hand, current research on the adsorption stability, selective adsorption capacity, and desorption kinetics of supercritical CO2 or CH4 in coal pores is still fragmented, lacking a unified comparative framework [28]. In addition, changes in the gas phase may not only affect the adsorption capacity but also alter its spatial distribution and retention behavior in the pores. However, these details are often simplified or overlooked in existing work [29]. Hence, it is imperative to conduct molecular simulations covering the full adsorption and desorption processes of CH4 and CO2 in coal across varying phase conditions, aiming to bridge existing knowledge gaps and offer a more practical microscopic theoretical foundation for both coalbed methane extraction and CO2 geological sequestration [30].
This study intends to adopt molecular simulation methods to systematically evaluate the adsorption and desorption characteristics of CH4 and CO2 across gaseous, liquid, and supercritical states, and deeply analyze the influence of gas phase changes on their thermodynamic properties and kinetic characteristics in coal bodies. The research will be based on a typical coal molecular model and conduct analyses from multiple dimensions, such as adsorption capacity, diffusion coefficient, quantity distribution, and energy interaction. By introducing multiple phase conditions, this study not only helps to quantify the adsorption differences of CH4 and CO2 under different states, but also is expected to reveal the regulatory laws of the gas phase on the adsorption/desorption mechanism of coal reservoirs. This study aims to offer novel theoretical foundations and simulation approaches to support efficient coalbed methane extraction, enhance safety evaluations of CO2 storage, and improve phase state corrections in adsorption modeling.
2. Simulation Methods and Models
2.1. Simulation Models
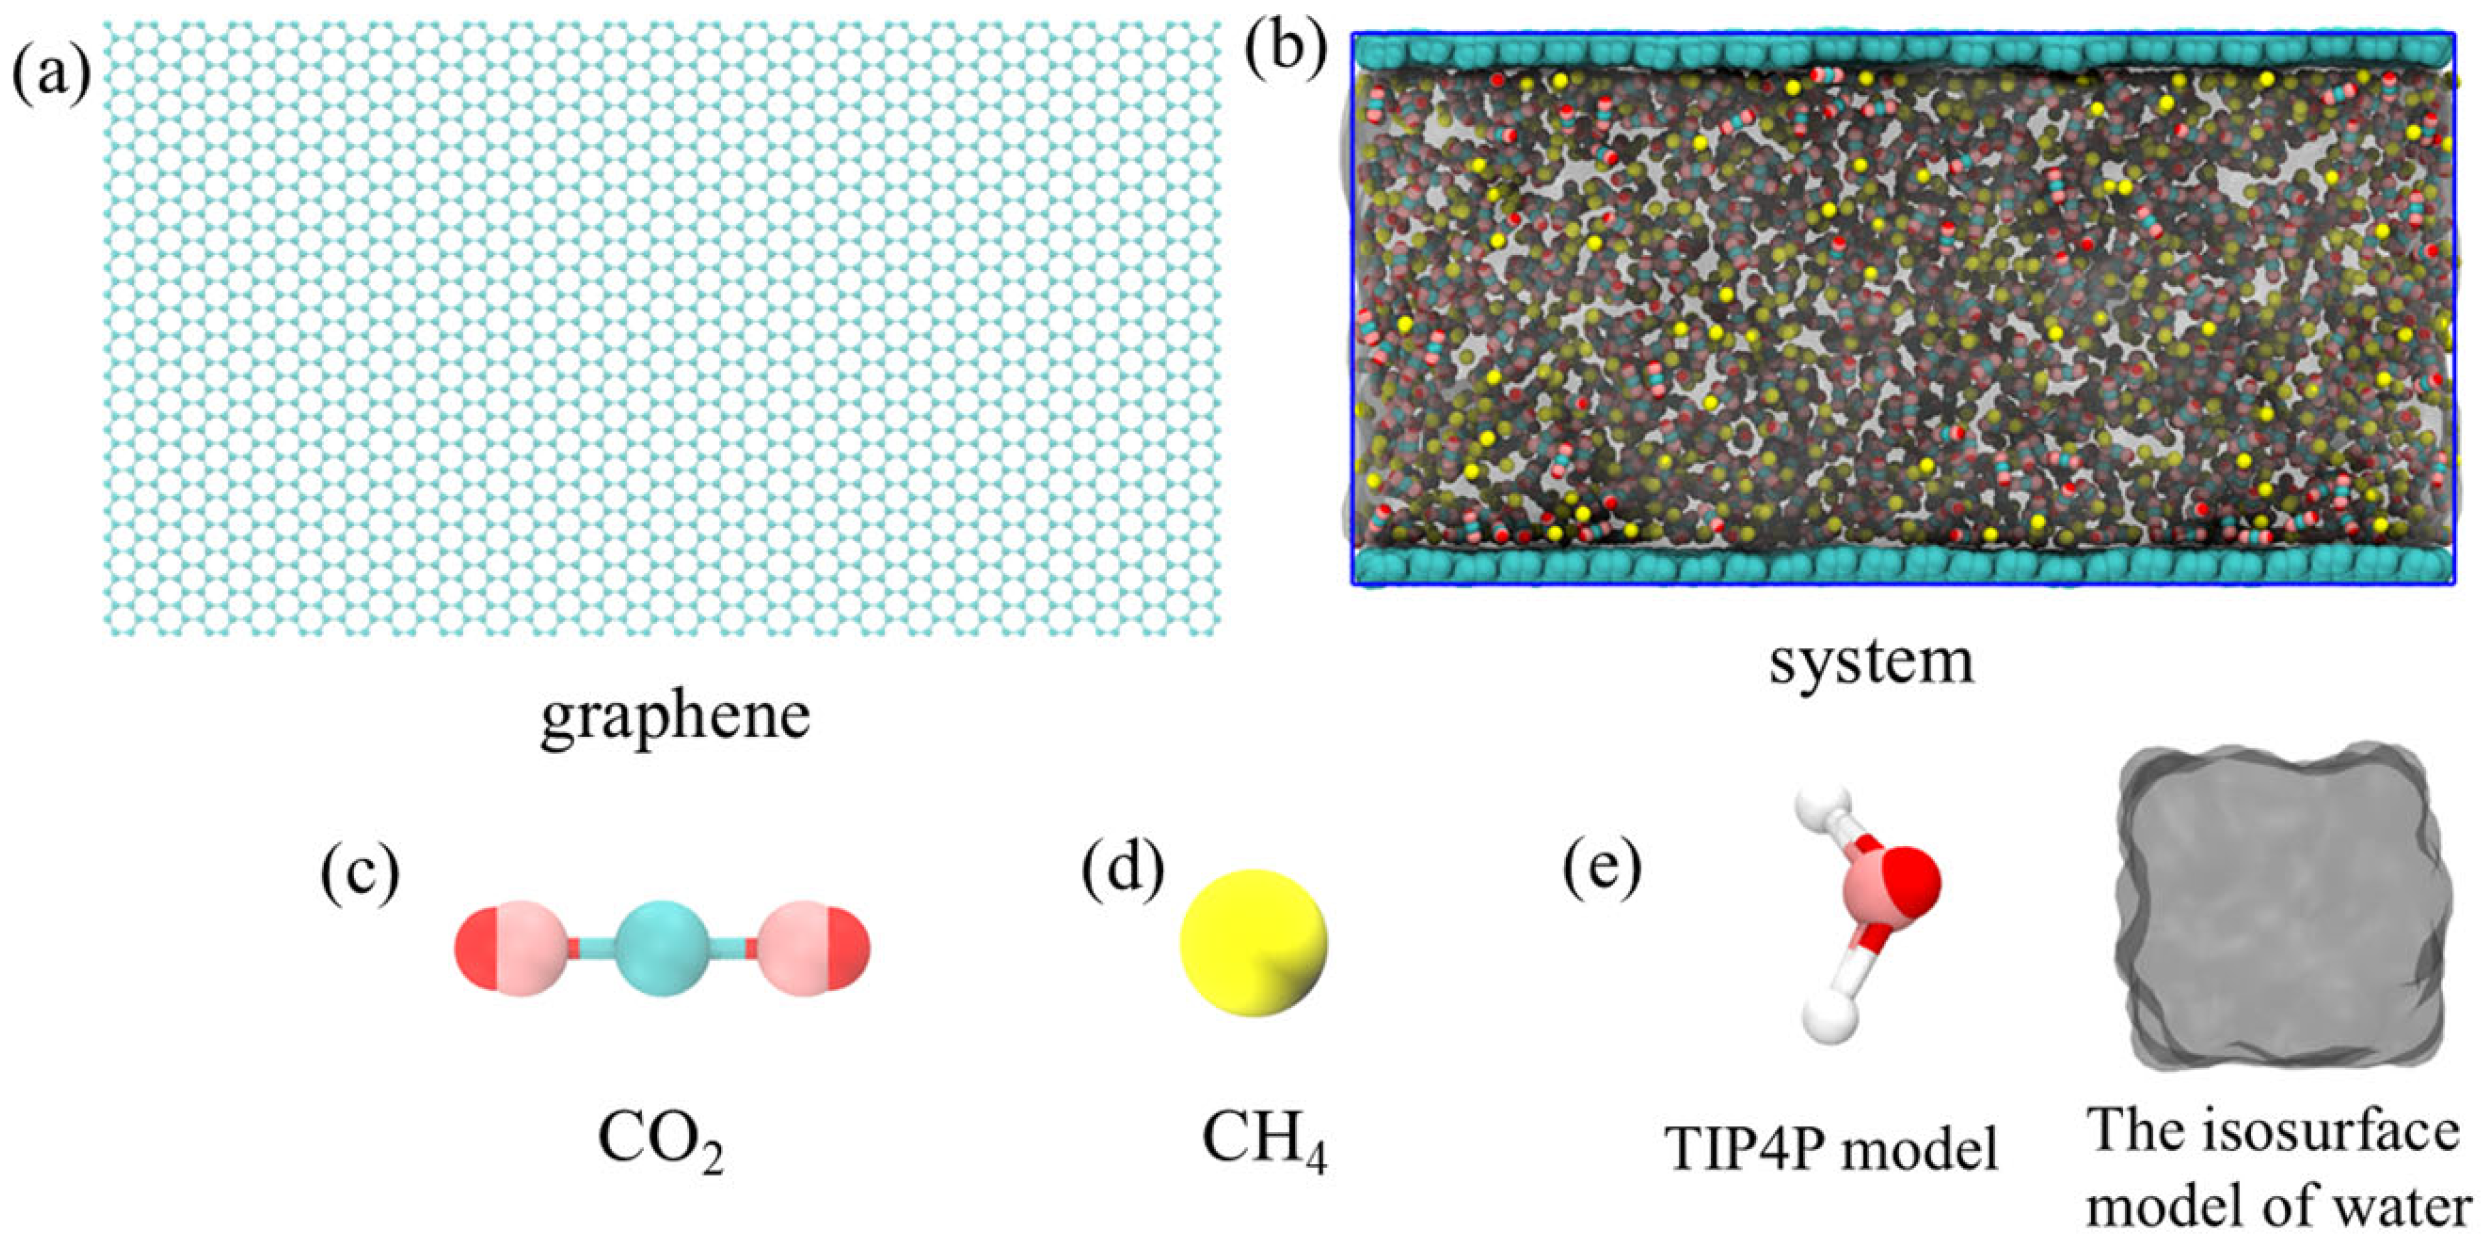
Molecular dynamics simulations were carried out using Gromacs v5.0.7 (Gromacs, Groningen, The Netherlands). A representative model was established in this study to simulate gas adsorption and desorption on coal seam surfaces (Figure 1). We adopted two layers of graphene sheets arranged in parallel to replace the coal seam structure, thereby simulating the microscopic surface characteristics of the coal body. Sufficient space was retained between the two layers of graphene to accommodate the target molecules. Three components were introduced into the simulation system: water molecules, carbon dioxide (CO2), and methane (CH4). Among them, there were 3000 water molecules, 1500 CO2 and 1500 CH4, which were uniformly filled in a random distribution between two layers of graphene, forming a multi-component mixed system. The initial box size was 10.4 nm × 5.8 nm × 5.2 nm.
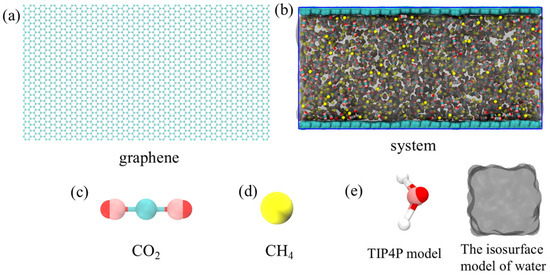
Figure 1.
The initial configuration of the simulation model consists of CO2, CH4, water phases, and two graphene sheets. Among them, (a) is the graphene model, (b) is the initial configuration of the composite system, (c) is the five-point carbon dioxide model, (d) is the combined atom methane model, and (e) are the TIP4P and isosurface water models.
To examine the effects of phase transformations on the adsorption and desorption mechanisms, we designed three sets of temperature and pressure conditions, namely 190 K-6 Mpa, 298 K-0.1 Mpa, and 320 K-8 Mpa, corresponding to CO2 and CH4 in gaseous, liquid, and supercritical states. By controlling the temperature and pressure of the system, gas molecules interact with the graphene surface under different thermodynamic states, thereby revealing the behavioral differences in various physical states. Throughout the entire simulation process, the system adopted periodic boundary conditions, allowing molecules to freely move in the regions between graphene layers to be closer to the pore environment in actual coal seams.
2.2. Simulation Methods
Graphene is described by the OPLS-AA force field [31]. The H2O molecule adopts the TIP4P model [32], which has virtual sites and uses the SETTLE algorithm to rigidly constrain the water molecule. The CH4 molecule uses the OPLS-UA model to map the various parameters of the CH4 molecule onto the C atom [33]. CO2 molecules are described using the EPM2 force field [34,35]. The LJ interaction between atoms is calculated using the Lorentz-Berthelot combination rule. The Lorentz-Berthelot combination rules are commonly applied to define the mixing of Lennard-Jones potential parameters between different atoms or molecules, particularly in molecular dynamics simulations. For interactions between particles i and j, the Lennard-Jones distance parameter (σ) is calculated using Formula (1):
The Lennard–Jones potential energy parameter (ε) is described by Formula (2):
The short-range non-bonding interaction is truncated at 1.20 nm, and the long-range electrostatic interaction is calculated using the PME summation method. The PME method divides the total electrostatic energy into three parts, as shown by Formula (3):
The real space term is as shown in Formula (4):
The reciprocal space term is as shown in Formula (5):
The self-interaction correction term is shown in Formula (6):
Here, qi denotes the charge of particle i, rij is the distance between the two particles, κ represents the Ewald parameter used to separate real and reciprocal space, erfc refers to the complementary error function, V stands for the volume of the simulation box, and k is the wave vector in reciprocal space. The calculation time step is 2 fs, and the x,y,z directions are periodic boundary conditions. The initial configuration adopts the fastest descent algorithm for energy minimization. Then, an isobaric–isothermal (NPT) equilibrium of 2 ns was carried out under the conditions of 190 K-6 Mpa, 298 K-0.1 Mpa, and 320 K-8 Mpa, respectively. Temperature and pressure were regulated using the V-rescale thermostat and Berendsen barostat methods, respectively, with coupling time constants of 0.1 ps and 2 ps. The pressure coupling mode is semi-isotropic, which causes the two directions of the simulation box to fluctuate independently. Following pre-balancing, NPT simulations lasting at least 20 ns were conducted under 190 K-6 Mpa, 298 K-0.1 Mpa, and 320 K-8 Mpa, respectively. Temperature and pressure were controlled using the Nosé–Hoover and Parrinello–Rahman methods, respectively, with coupling times of 2 ps and 4 ps, and the pressure coupling mode set to isotropic.
3. Results and Discussion
3.1. Structural Evolution Under Different Temperature and Pressure Conditions
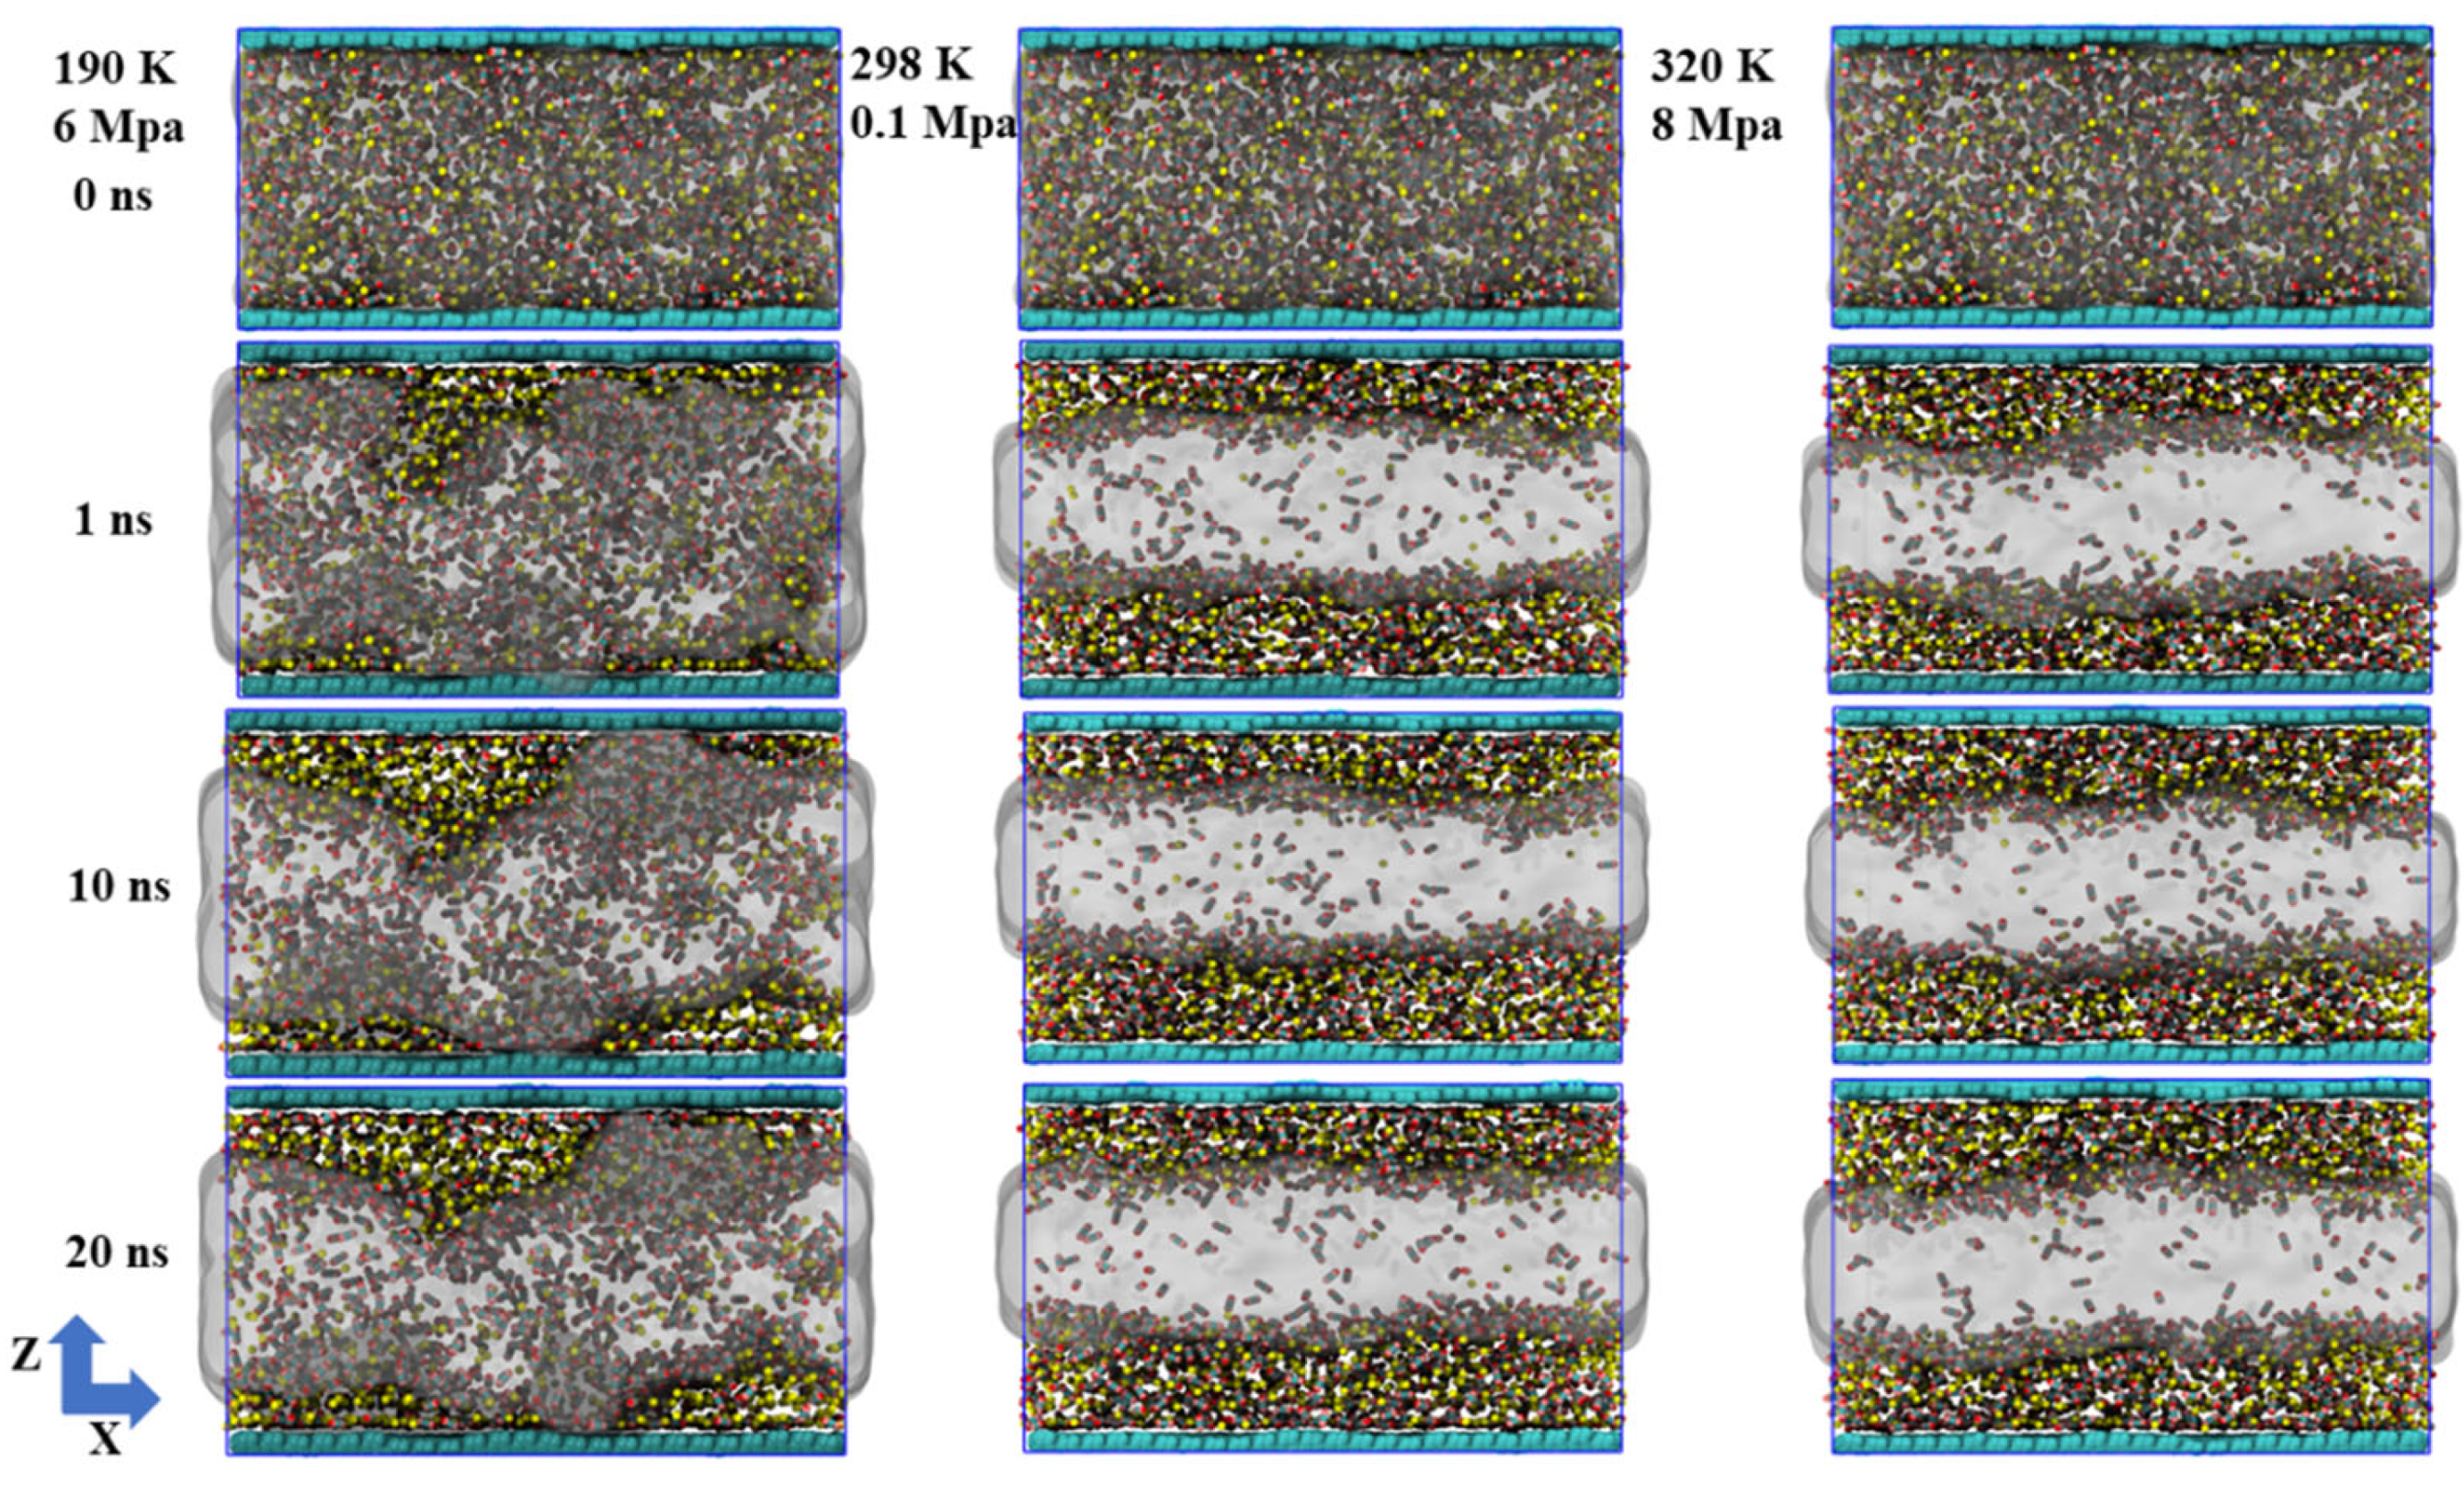
Under conditions of 190 K and 6 MPa, the entire system is in a state of low temperature and medium pressure. CH4 and CO2 tend to be in liquid or metastable condensed states. The thermal motion between molecules is significantly weakened. The simulation results indicate an overall increase in molecular density within the system, particularly near the graphene surface, where a clear layered structure forms and molecules arrange more compactly. Under these conditions, water molecules remain basically liquid, mainly gathering in the central regions between graphene layers and being widely distributed. The polar characteristics promote the formation of a stable hydrogen bond network between molecules, providing a dynamic equilibrium medium environment for the dissolution and adsorption of gas molecules. In terms of gas behavior, CO2 molecules exhibit strong hydrophilicity and surface–philicity. The majority of the molecules dissolve in the aqueous phase, while some are closely adsorbed onto the surface of graphene. In contrast, CH4 has a weaker polarity and is more inclined to be distributed in the boundary areas of water or directly adhere to the surface of graphene. As the simulation proceeds, most of the gas molecules in the initial adsorption state remain stably within 5 Å on the graphene surface, and desorption events occur very rarely, reflecting the poor stability and reversibility of the adsorption process under low-temperature conditions. Notably, CO2 exhibits significantly greater solubility than CH4 in an aqueous (liquid water) environment. Some CO2 molecules do not even participate in direct adsorption but remain in the aqueous phase for a long time, existing in a dissolved state.
Under conditions of 298 K and 0.1 MPa, the thermal disturbance of the system intensifies, and thus the thermal motion of molecules becomes more intense (Figure 2). The simulation results show that CH4 and CO2 molecules are mainly distributed near the two side surfaces of the graphene layers, showing a certain interfacial affinity, but the adsorption layer is looser compared to the low-temperature state. The molecular arrangement lacks orderliness. The adsorption behavior tends to be dynamically unstable. In contrast, the spatial distribution of water molecules undergoes significant changes. They no longer extend as widely as they do under low-temperature conditions but tend to gather in the middle of the lamellar layers to form compact and well–defined water mass regions. This distribution and reorganization, on the one hand, reflect the enhanced self–polymerization characteristics of water in the gaseous environment, and on the other hand, weaken its containment effect on gas molecules. Meanwhile, the solubility of CO2 in the aqueous phase declines, and more molecules instead distribute around the water mass or near the interface, further intensifying the desorption trend. Overall, under normal temperature and pressure conditions, the system exhibits kinetic characteristics of weak adsorption, high desorption, and structural separation, providing a strong reference for understanding the interaction mechanism in gaseous environments.
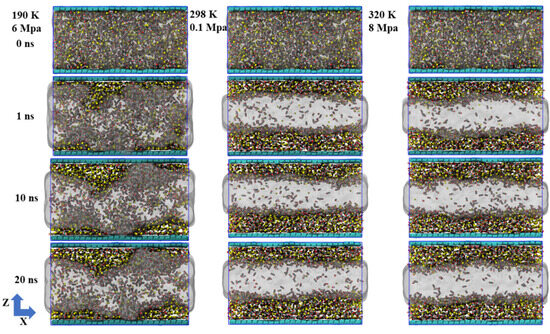
Figure 2.
The behavior of dynamic evolution during 20 ns simulations under varying temperature and pressure conditions.
At 320 K and 8 MPa, the system is close to or partially in the supercritical state. The thermal motion of molecules continues to intensify. The system as a whole exhibits the characteristics of high diffusivity and loose structure. From the perspective of the simulated structure, the distribution is very similar to that at 298 K and 0.1 MPa: CH4 and CO2 are still mainly concentrated near the graphene surfaces on both sides, forming a relatively sparse adsorption layer. Water molecules continue to cluster in the middle of the lamellar layer, forming liquid phase clusters with relatively clear boundaries. This indicates that under the dominance of thermal motion, the system tends towards molecular stratification and spatial separation rather than forming a dense structure. Although the structural features are similar, the interaction between CO2 and water at this stage is slightly enhanced compared to the atmospheric gaseous environment. Some CO2 molecules briefly enter the aqueous phase region, but the overall solubility remains relatively low. Most CO2 and CH4 molecules are in a free state between the graphene surface and water clusters, with significant desorption behavior, indicating that the adsorption is in a highly reversible, weakly bound state. In addition, due to the critical point of CO2 being close to the current temperature and pressure, the increase in molecular volume fluctuations leads to a more dynamic and unstable distribution of CO2 in the edge region of the water mass.
Based on the simulation outcomes obtained at the three temperature and pressure conditions, it can be seen that temperature and pressure have significant regulatory effects on the system structure and gas behavior. The system is dense and stable at low temperatures of 190 K and 6 MPa. The gas molecules are mainly in the adsorbed state and desorption behavior is extremely rare. The aqueous phase is widely distributed and structurally ordered. After entering the normal temperature and pressure environment of 298 K and 0.1 MPa, the increased thermal motion of molecules greatly promotes gas desorption. Water molecules gather in the middle of the lamellar layer, and the structure tends to be concentrated. The dissolving capacity of CO2 is weakened. Under supercritical transition conditions of 320 K and 8 MPa, the overall structure of the system is similar to that at normal temperature and pressure, but the intermolecular interactions are more dynamically unstable. Adsorption and desorption occur more frequently, with the three phase states clearly demonstrating the significant impact of phase transitions on gas–coal seam interfacial behavior. In particular, the dynamic regulation by thermal motion and intermolecular forces plays a crucial role in the mechanisms governing adsorption and desorption.
3.2. The Number Density Distributions of CH4, CO2, and Water Under Varying Temperature and Pressure Conditions
In GROMACS, a two–dimensional density distribution map (such as the xz plane) is used to divide the analog box into two-dimensional grid cells (voxel) and calculate the time average distribution of a certain physical quantity (mass, number, electron density, etc.) in each grid cell. The calculation formula for the two-dimensional number density distribution formula (xz plane) is as shown in Formula (7):
ρ(x,z) represents the average density of positions (x,z) on the X–Z plane (unit: particles/nm3). Δx and Δz represent the side lengths of the grid cells in the x and z directions. Ly represents the box length along the y axis, which is considered constant. T represents the total sampling time frame number. bin(x,z) represents the set of all particles that fall into the (x,z) grid region at time t.
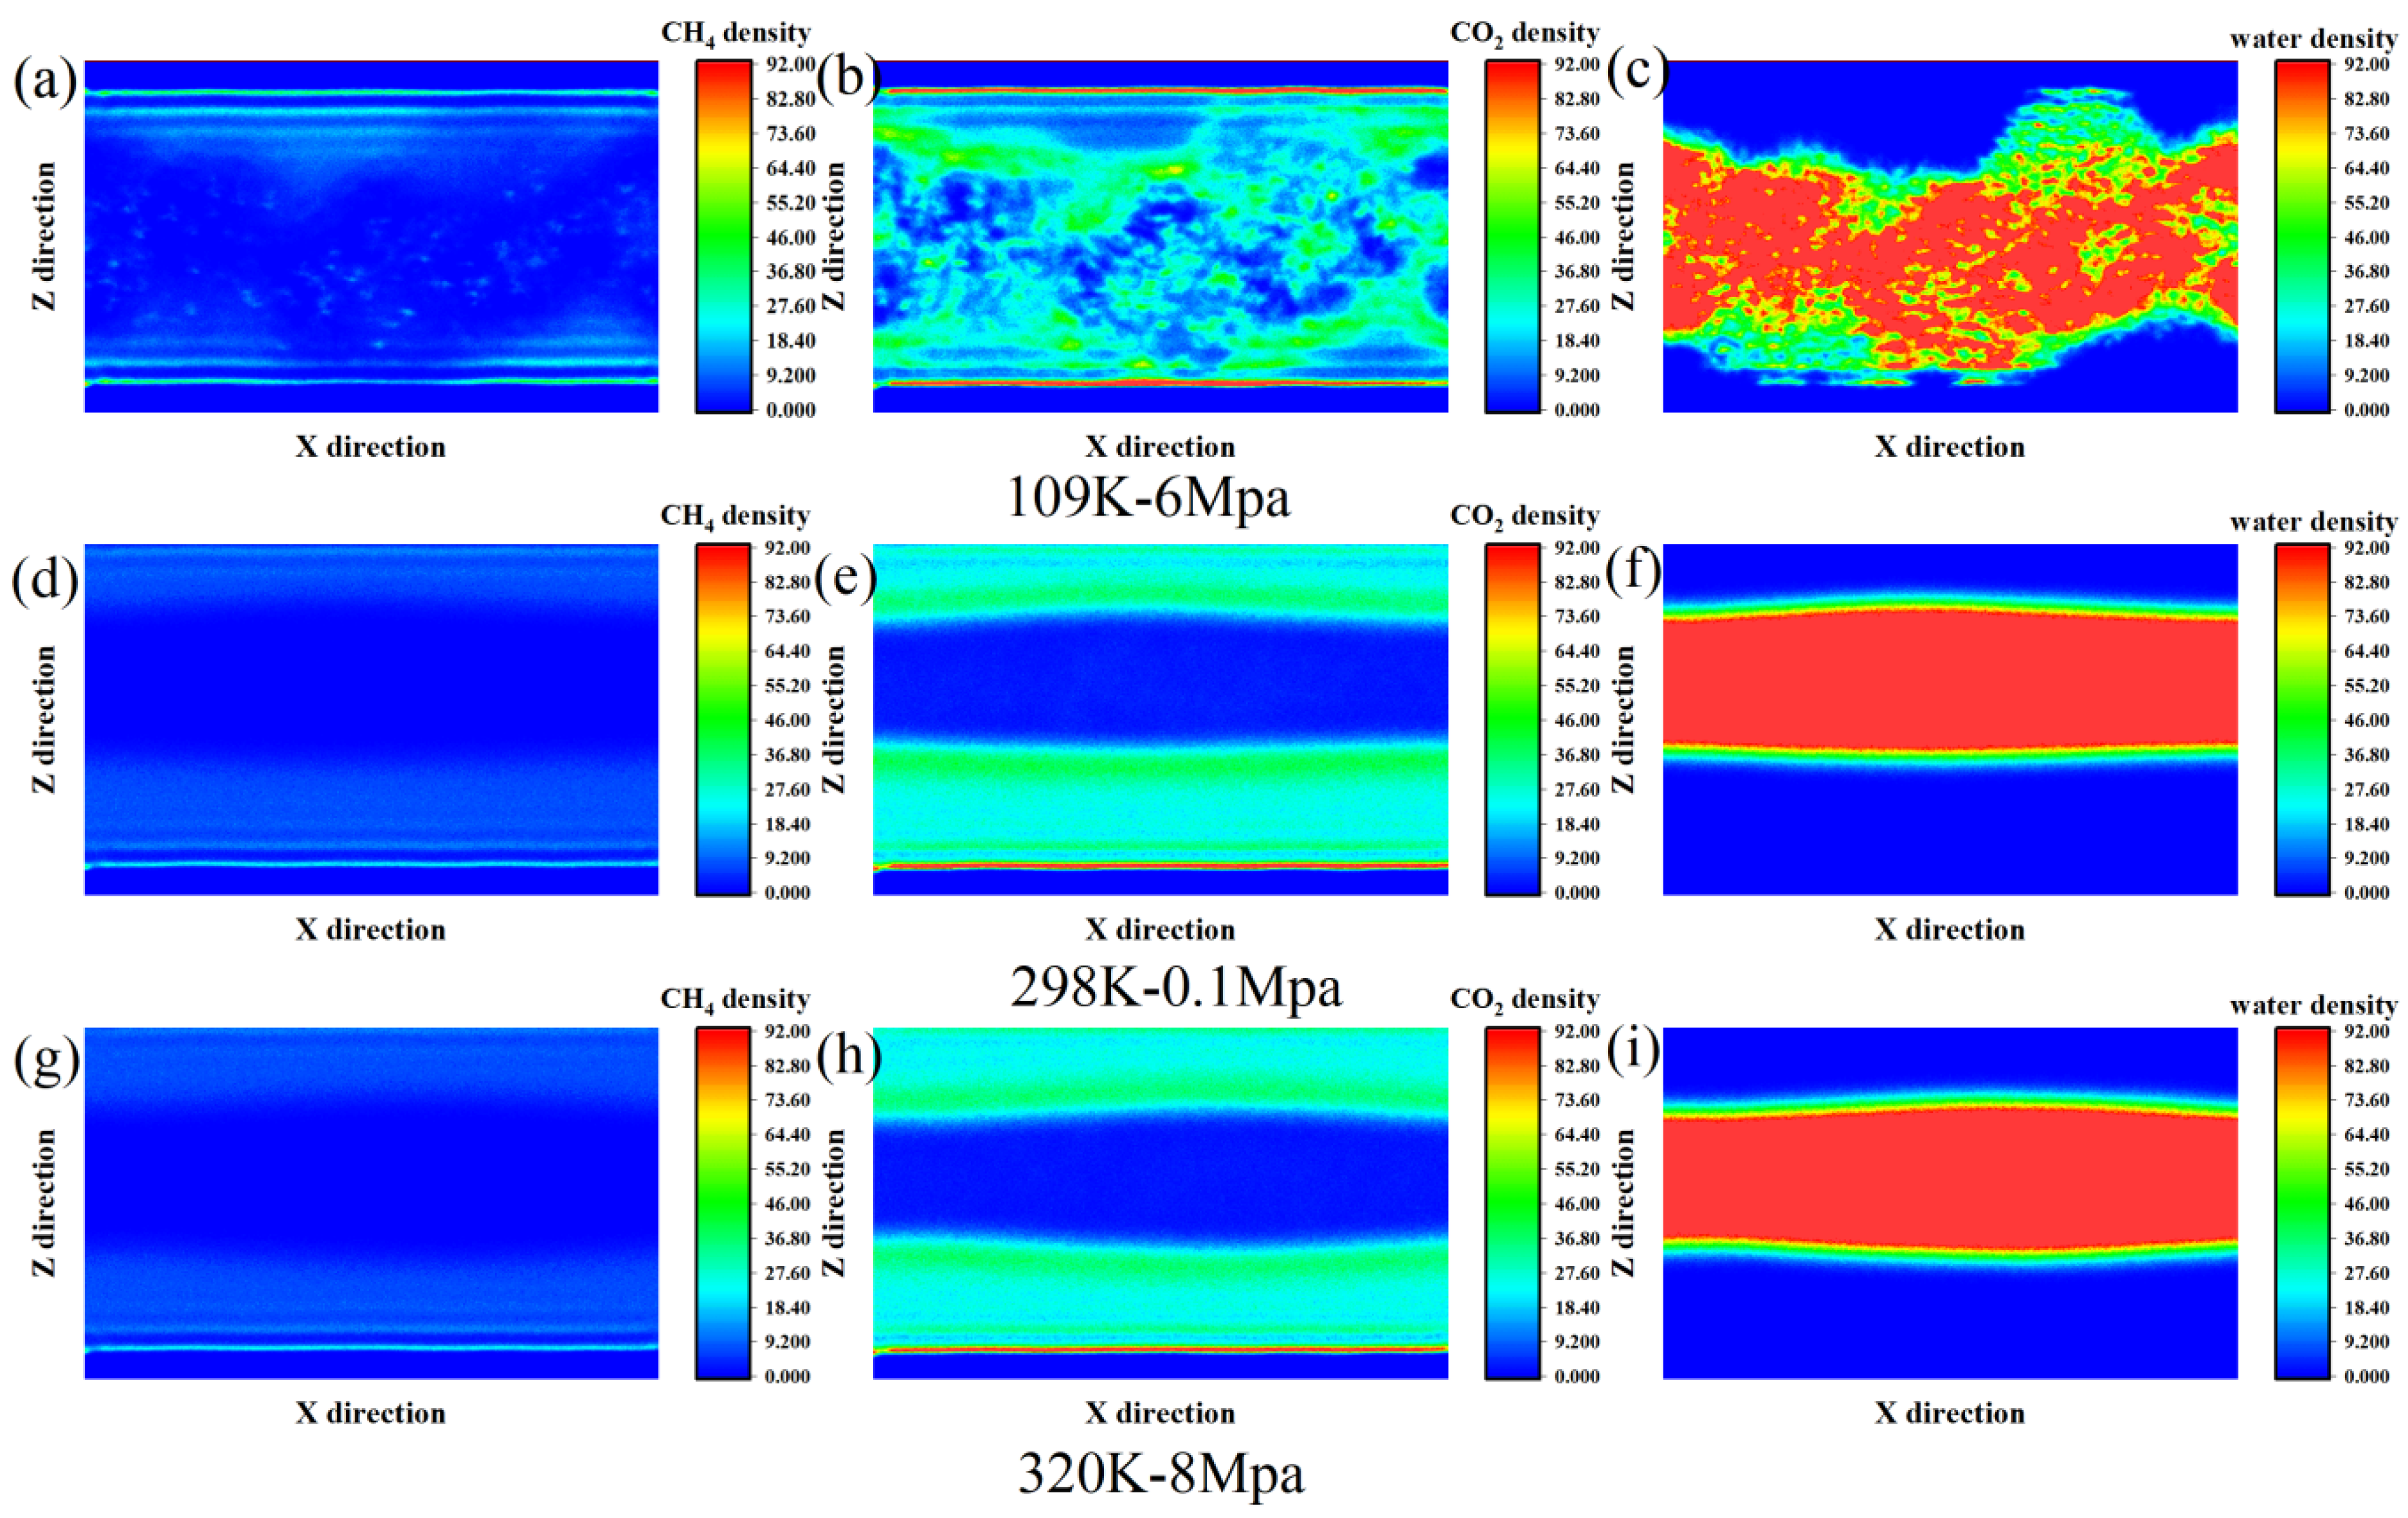
From the density profiles, significant differences in methane distribution are evident across varying temperature and pressure settings, especially in proximity to the graphene surface (Z ≈ 5–10 Å and Z ≈ 50–56 Å) (Figure 3). Under the low-temperature and high-pressure environment of 190 K and 6 MPa, methane molecules formed obvious adsorption peaks at the interface on both sides. Among them, the density at Z = 5.5 Å was as high as 20, which was the main enrichment area in the entire simulation system. This suggests that at low temperatures and high pressures, the thermal motion of methane molecules is limited, leading them to adsorb more strongly near graphene surfaces and form comparatively dense adsorption layers. The density in the middle region is relatively low, indicating that most molecules are in an interfacial bound state. As the temperature increases to 298 K and the pressure decreases to 0.1 MPa, the overall methane density declines, the adsorption peak becomes less pronounced, and the local density is reduced. The adsorption layer is no longer as obvious as it was at low temperatures, and the molecular distribution tends to diffuse more. This change reflects that the enhanced thermal motion at a normal temperature and pressure makes it easier for methane to desorb from the interface. Adsorption and desorption tend to be in dynamic equilibrium, and the structure tends to be loose. In the high-temperature and high-pressure environment of 320 K and 8 MPa, the density distribution of methane is relatively close to that at 298 K, but slightly higher in some areas, such as Z = 46.5–56.5 Å. Although the system is in the supercritical transition zone and thermal motion is further intensified due to the increase in pressure, some methane still fluctuates near the interface area. In this state, methane exhibits a relatively weak but persistent interfacial adsorption behavior, with blurred contours of the adsorption layer and more frequent molecular movements.
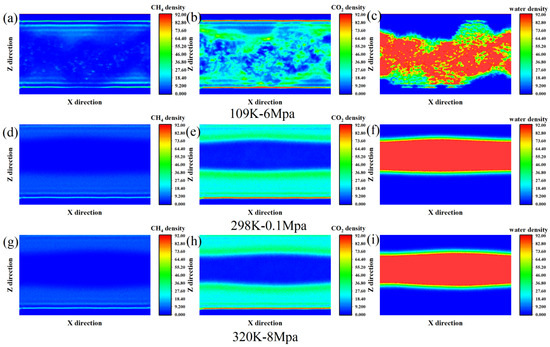
Figure 3.
The quantity density distribution of (a) CH4, (b) CO2 and (c) water at 109 K-6 Mpa, (d) CH4, (e) CO2 and (f) water at 298 K-0.1 Mpa and (g) CH4, and (h) CO2 and (i) water at 320 K-8 Mpa.
CO2 exhibited relatively obvious interfacial adsorption behavior under the three temperature and pressure conditions, but its distribution characteristics changed significantly with the variations in temperature and pressure. Under low-temperature, high-pressure conditions (190 K and 6 MPa), carbon dioxide molecules exhibit a clustered distribution throughout the system, with significant enrichment observed in certain regions. This high-density enrichment phenomenon indicates that thermal motion is restricted at low temperatures. Coupled with higher pressure, CO2 molecules are easily captured and stabilized on the surface, forming typical monolayer or multilayer adsorption structures. At ambient conditions (298 K, 0.1 MPa), the interfacial adsorption of CO2 persists, though the adsorption strength is noticeably reduced. Meanwhile, the molecular distribution becomes more uniform between Z = 15–25 Å and Z = 45–50 Å, indicating that under the influence of enhanced thermal motion, some CO2 begins to diffuse to the area far from the interface, and the contour of the adsorption layer thus becomes blurred. It is worth noting that the density in the central region remains at a relatively low level, indicating that CO2 is still mainly concentrated on both sides close to the graphene sheets and cannot easily penetrate the aqueous phase region. Under high-temperature and high-pressure conditions (320 K, 8 MPa), the behavior of CO2 shows a certain “polarization” trend: on the one hand, there is still obvious adsorption in the area close to the graphene surface, but the peak density does not continue to increase. On the other hand, the adsorption layer near the interface is looser, and the extensibility of molecular distribution is enhanced. For instance, the density at Z = 5.5 Å reaches 0.099 atoms/Å3, slightly higher than that at room temperature, but the overall distribution is more diffused. This indicates that adsorption still exists under high pressure, but high temperature intensifies adsorption and diffusion, making the adsorption layer no longer compact.
The distribution behavior of water molecules shows relatively obvious temperature and pressure dependence in terms of both spatial structure and overall concentration. At low temperature and high pressure (190 K, 6 MPa), the distribution of water molecules is relatively dispersed. The maximum density is still concentrated in the central area of the interface (Z ≈ 20–30 Å). However, a certain degree of diffusion was also observed near the graphene surface (e.g., Z = 9.5 Å), indicating that at lower temperatures, water molecules tend to break through the interfacial energy barrier and expand towards the vicinity of graphene, forming a wider distribution profile. This phenomenon may be related to the fact that the hydrogen bond network structure is more prone to extension at low temperatures, thereby promoting the transfer of some water molecules to the interface. As the temperature increases to ambient conditions (298 K, 0.1 MPa), the density distribution of water rapidly shifts toward the center of the system, exhibiting a clear aggregation tendency. Density plateaus formed in the Z = 13–27 Å region, while the density near the graphene interface (Z < 8 Å and Z > 47 Å) almost dropped to 0. This indicates that at a normal temperature, the thermal motion of water intensifies, and molecules are more inclined to spontaneously form bulk structures, repelling them into gas-rich regions. At this time, carbon dioxide and methane are mainly adsorbed at the graphene interface, and water exists stably in the intermediate region, forming a certain degree of spatial separation with the molecules of the two types of gases. Under conditions of high temperature and high pressure (320 K, 8 MPa), the behavior of water is similar to that at normal temperature, still concentrating in the center of the layer. However, compared with normal-temperature conditions, its overall density slightly decreased, and the distribution is gentler. The peaks are no longer concentrated and instead flatten into a wider high-density area. This distribution characteristic suggests that under the influence of higher temperature and pressure, although pressure can enhance the density of water, the increase in temperature also intensifies the thermal motion and diffusivity of water, thereby leading to structural relaxation.
To further investigate the microscopic interactions between gas molecules and water, a statistical analysis was performed on the time evolution of hydrogen bonds between CO2 and water under different temperature and pressure conditions (Figure 4). Initially, the number of hydrogen bonds under all three conditions was 844, indicating that CO2 molecules were uniformly dispersed within the aqueous phase and engaged in substantial intermolecular contact. However, as the simulation progressed, the number of hydrogen bonds declined rapidly and reached a stable value within a short time, suggesting that CO2 molecules gradually desorbed from the aqueous phase and became enriched on the graphene surface.

Figure 4.
The variation in LJ parameters between CH4–water and CO2–water with time under (a) 190K-6Mpa, (b) 298K-0.1Mpa, (c) 320K-8Mpa.
At 190 K and 6 MPa, the Lennard4–Jones (LJ) interaction energies between CH4–water and CO2–water exhibit distinct behaviors over time (Figure 4a). The CH4–water LJ energy rapidly decreases from a large positive value (~11,316 kJ/mol) to a negative range of around −3900 to −4600 kJ/mol within the first few nanoseconds, indicating a fast transition to a quasi-equilibrium state dominated by weak van der Waals attractions. In comparison, the CO2–water interaction energy starts from a smaller initial value (~487 kJ/mol) but quickly stabilizes in the range of −11,200 to −12,000 kJ/mol. This suggests that CO2 interacts more strongly and consistently with water molecules than CH4, likely due to the larger quadrupole moment of CO2 enhancing dispersion interactions with surrounding water molecules.
Under ambient conditions (298 K, 0.1 MPa), similar trends are observed but with reduced interaction strengths (Figure 4b). CH4–water LJ energies decrease from ~11,316 kJ/mol to approximately −1300 to −1560 kJ/mol and fluctuate around this range, indicating weaker non-bonded interactions at higher temperature and lower pressure. CO2–water interactions also show a rapid drop from ~487 kJ/mol to the −4050 to −4550 kJ/mol range, remaining relatively stable over the simulation. Compared with the low-temperature high-pressure case, the reduced magnitude of the LJ energies reflects the temperature and pressure dependence of van der Waals interactions, with higher temperatures weakening the attractive forces.
At 320 K and 8 MPa, the LJ interaction patterns remain qualitatively similar, but quantitative differences appear due to the combined effect of higher temperature and elevated pressure (Figure 4c). CH4–water interactions decrease to around −1200 to −1400 kJ/mol, while CO2–water interactions stabilize between −3350 and −4100 kJ/mol. Despite the increased pressure, the higher temperature reduces the overall interaction strength relative to the 190 K case. Across all three conditions, CO2 consistently exhibits stronger and more stable interactions with water than CH4, confirming that non-bonded LJ interactions dominate gas–water behavior and are influenced by both temperature and pressure.
3.3. The Radial Distribution Function Among Different Components
To deeply explore the mutual distribution relationship between CH4 and CO2 molecules under different temperature and pressure conditions. We statistically analyzed the radial distribution function (RDF) under three conditions (190 K-6 MPa, 298 K-0.1 MPa, 320 K-8 MPa). RDF describes the degree of enhancement of the average local density between two molecules at different distances relative to the overall density, thereby reflecting the spatial correlation and local aggregation behavior between molecules (Figure 5). For details, see Formula (8):
gAB(r) represents the radial distribution function of Class B particles relative to Class A particles at a distance of r; NAB(r) represents the total number of B particles found by all A particles within the distance range from r to r + Δr; NA represents the total number of Class A particles; ρB represents the average density of Class B particles (unit: particles/nm3); Δr represents the shell thickness. 4πr2Δr represents the volume of the spherical shell; and ⟨⋅⟩ represents results averaged over time.
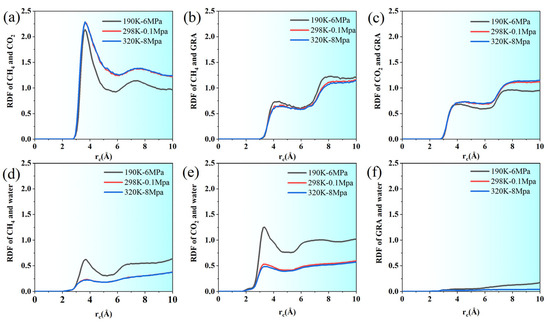
Figure 5.
RDF between (a) CH4 and CO2, (b) CH4 and GRA, (c) CO2 and GRA, (d) water and CH4, (e) water and CO2, and (f) water and GRA.
Figure 5.
RDF between (a) CH4 and CO2, (b) CH4 and GRA, (c) CO2 and GRA, (d) water and CH4, (e) water and CO2, and (f) water and GRA.
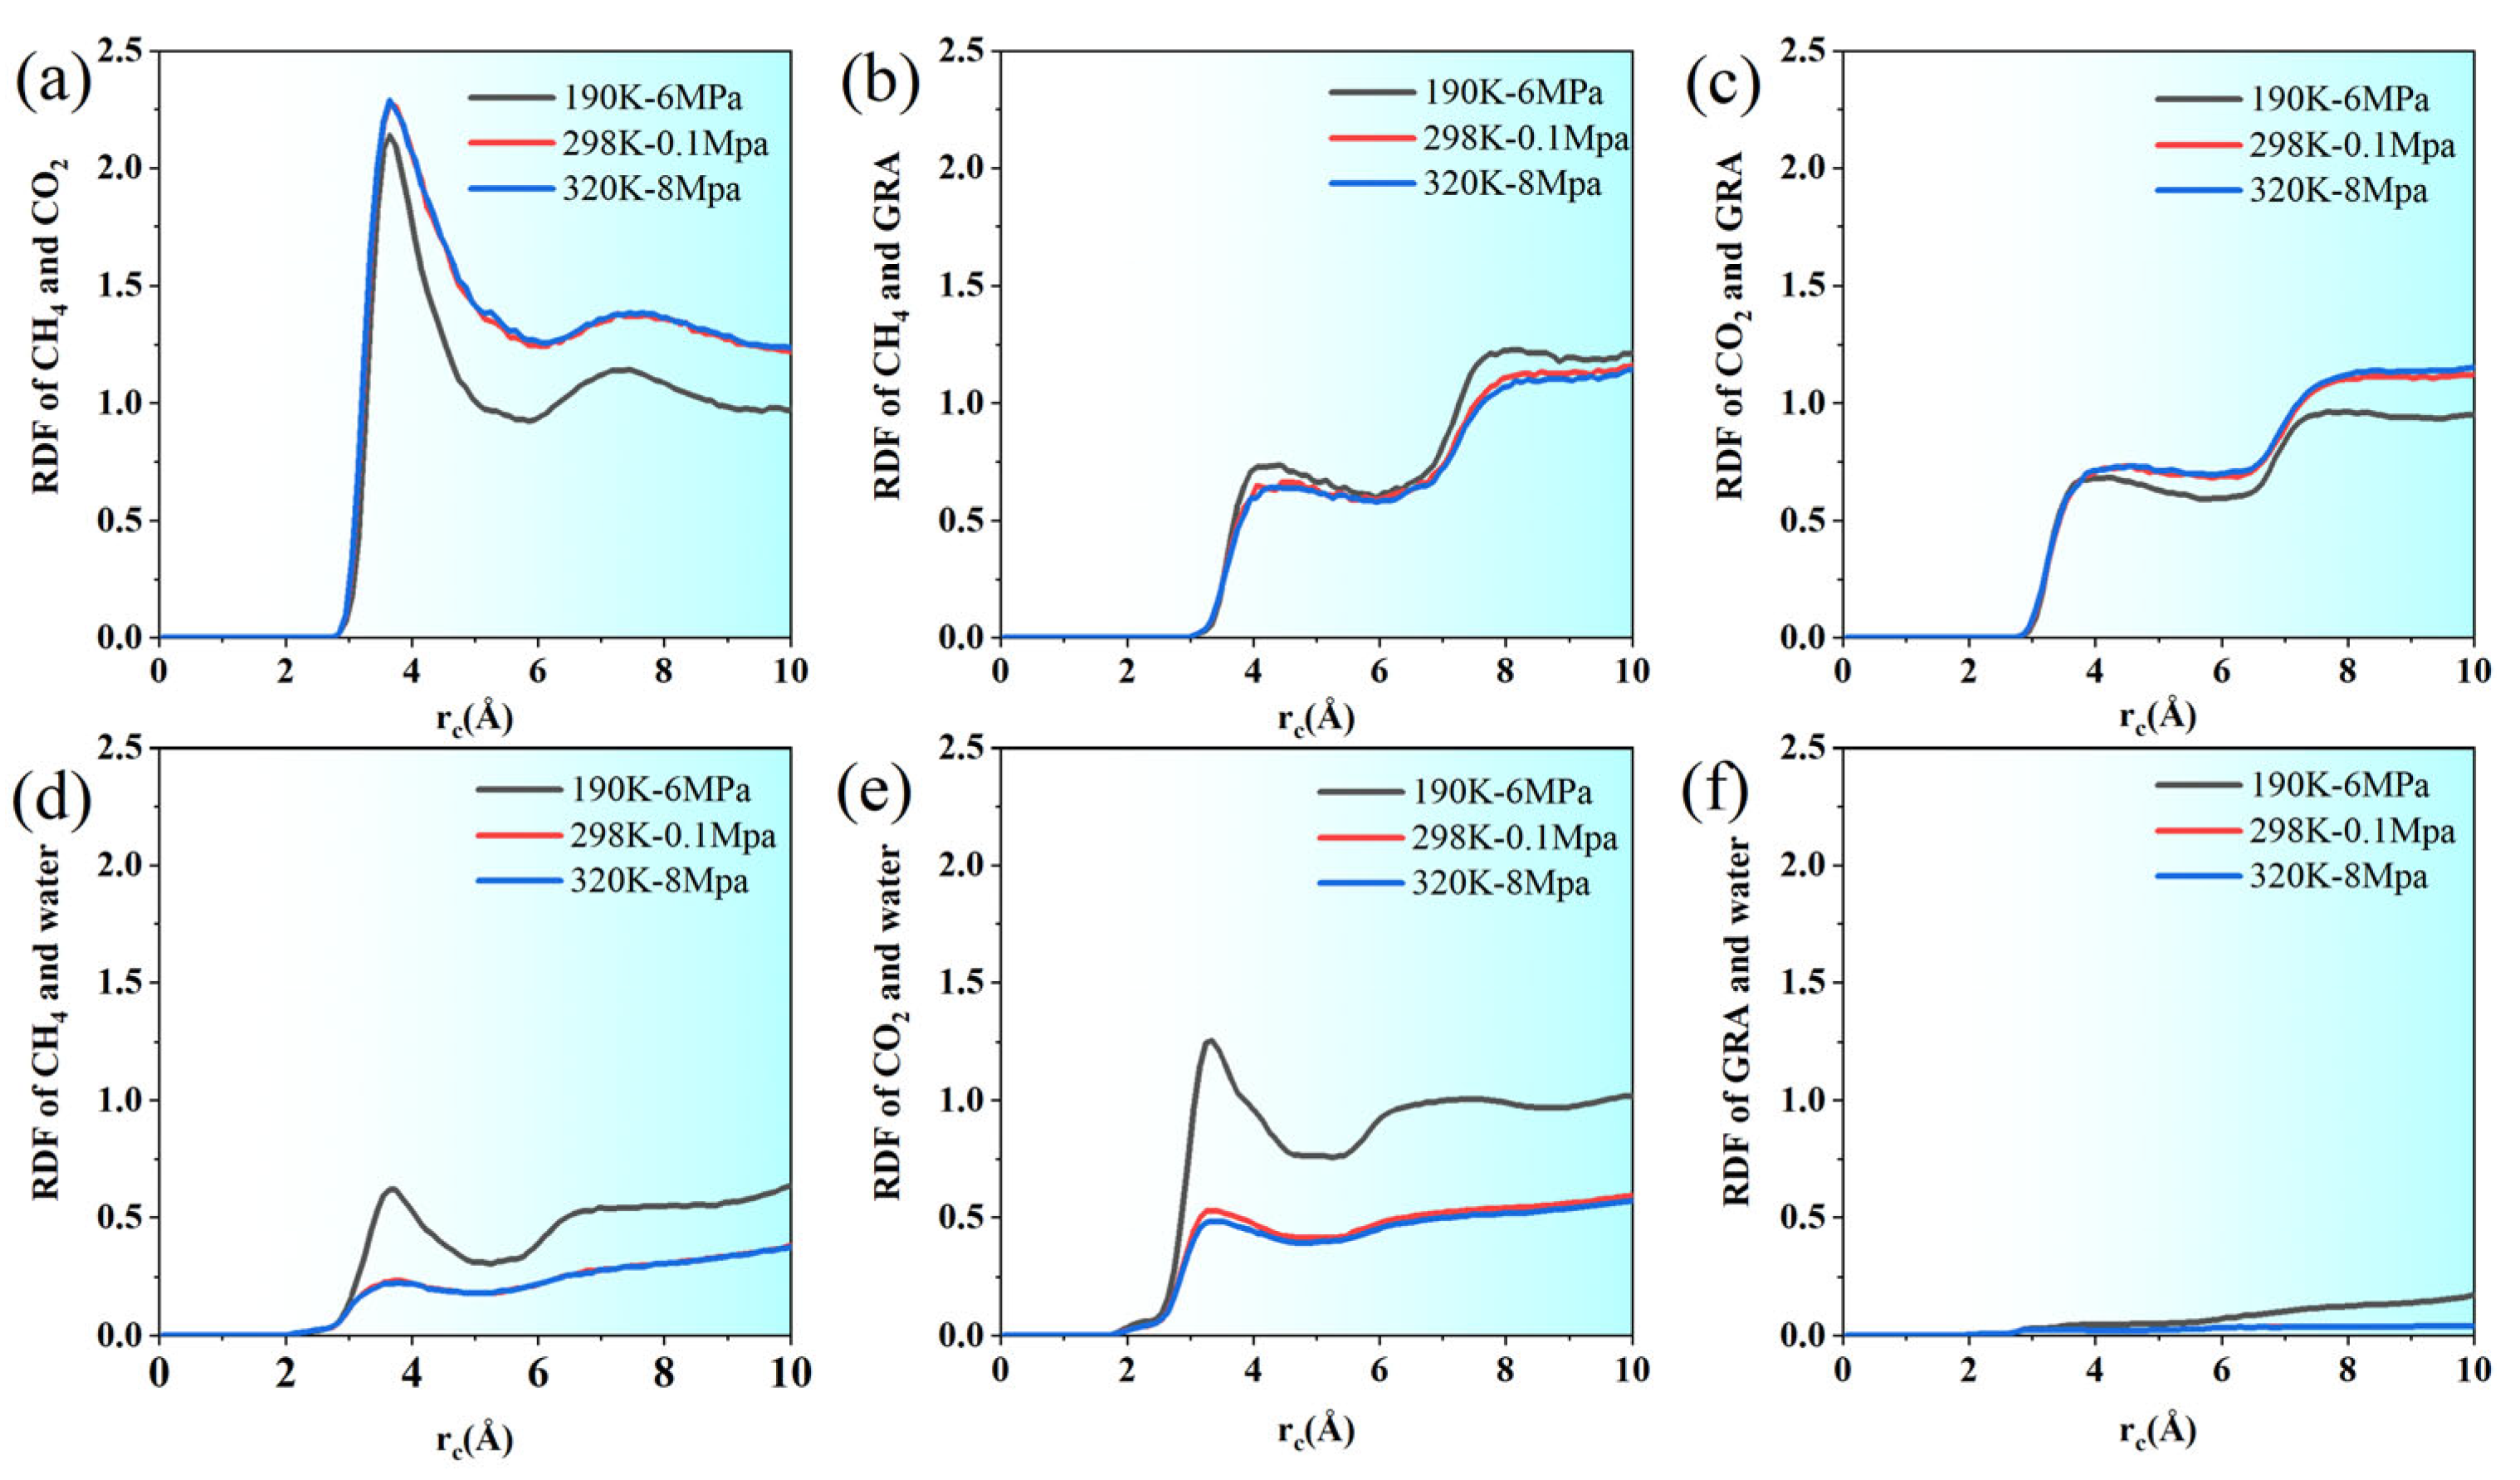
Under all three conditions, the RDF curve of CH4-CO2 is basically zero before 2.5 Å, indicating that there is a clear repulsive region between the two molecules, reflecting the influence of the van der Waals repulsion radius. Subsequently, this began to rise at around 2.95 Å and reached the main peak around 3.55–3.65 Å, indicating that this is the most likely distance at which the two molecules make contact (Figure 5).
From the perspective of quantitative comparison, the peak value of g(r) is the lowest under low-temperature and high-pressure conditions (190 K, 6 MPa), with the main peak value approximately 2.14. Under ambient conditions (298 K, 0.1 MPa) and high-temperature, high-pressure conditions (320 K, 8 MPa), the primary peaks are comparatively higher, reaching approximately 2.28 and 2.29, respectively. This indicates that when the temperature rises or the pressure drops, the spatial correlation between CH4 and CO2 molecules intensifies, and the two are more prone to structural aggregation.
After the main peak, the curves under the three conditions gradually decay and tend to plateau, with the plateau value approaching 1, indicating that the system tends to be uniformly distributed on a larger scale. However, the decay at normal and high temperatures is slightly slower, suggesting that the aggregation structure lasts for a longer distance. Especially within the range of 3.25–4.5 Å, g(r) is higher at both normal and high temperatures than at low temperatures, indicating that under these conditions, the number of neighboring molecules between CH4 and CO2 is greater, forming a more significant local cluster structure.
The radial distribution function g(r) between CH4 and graphene illustrates the adsorption characteristics and molecular structural organization of gas molecules on the graphene surface. It can be observed from the figure that under three temperature and pressure conditions (190 K-6 MPa, 298 K-0.1 MPa, 320 K-8 MPa), the RDF curve rises rapidly, starting from approximately 3.0 Å. Near 4.25–4.5 Å, it tends to platform and forms a distinct main peak, reflecting the strong adsorption capacity of graphene for CH4 and the structural aggregation close to the in-plane van der Waals contact distance.
Overall, the g(r) values under low temperature and high pressure (190 K-6 MPa) are generally slightly higher than those under normal-temperature and high-temperature conditions, maintaining relatively larger peaks and slow decay throughout the 3.0–6.5 Å range. This enhanced spatial correlation indicates that at lower temperatures and higher pressures, CH4 tends to form a dense monolayer or even multimonolayer distribution on the graphene surface, demonstrating excellent adsorption stability. Under normal- and high-temperature–pressure conditions, noticeable adsorption persists, but the lower RDF peak values indicate that stronger molecular thermal motion or reduced gas concentration weakens CH4 molecule clustering and adsorption saturation. Furthermore, within the range of 7.0–9.5 Å, each group of curves still showed a certain degree of oscillation, indicating that CH4 also had a certain degree of layered distribution far from the graphene surface, which might be caused by the structured gas phase induced by the surface
The radial distribution function curve between CO2 molecules and the graphene surface shows a significant structural correlation and has certain similarities with the distribution pattern of CH4. After the initial position of approximately 2.65 Å, the g(r) value rose rapidly and reached the main peak in the range of 3.75–4.25 Å. Then, it declined slowly and formed a stable platform within the range of 6–7 Å. This trend clearly reflects the strong adsorption and ordered arrangement of CO2 molecules at close range on the surface of graphene, which is particularly evident under low temperature and high pressure (190 K-6 MPa).
Specifically, the peak value of g(r) is the highest at 190 K-6 MPa, indicating that under the combined effect of strong thermal motion suppression and high gas concentration, CO2 molecules accumulate in large quantities on the graphene surface and tend to form a dense monolayer structure. In contrast, the curve peaks at 298 K-0.1 MPa and 320 K-8 MPa are slightly lower and the distribution is wider. This suggests that increasing the temperature or lowering the pressure reduces the adsorption interaction between CO2 and graphene, leading to decreased surface ordering and diminished local enrichment of gas molecules.
RDF analysis further elucidates the microstructural characteristics of water molecules, highlighting their spatial relationships with different solutes or matrix components. It can be seen from the RDF curve that the distribution function between water and CO2 shows significant peaks in the range of 2.8–4.0 Å, with the maximum value reaching approximately 0.6, indicating a strong spatial correlation between water molecules and CO2 molecules within this distance range. This result is consistent with the hydrogen bond statistics in the previous text, indicating that CO2 molecules can form stable local structures with water to a certain extent. Although their hydrogen bond capacity is limited, the spatial aggregation effect still exists.
In contrast, the RDF curve between water and graphene shows a low and gentle growth trend throughout the range of 0–10 Å, lacking distinct characteristic peaks. It only rises slightly between 6 and 10 Å, with a peak of approximately 0.17, which is much lower than the corresponding value of water–CO2. The findings indicate a weak van der Waals interaction between water and graphene, lacking a well-defined first coordination layer, which aligns with the known low affinity of non-polar graphene for polar water molecules.
Regarding the distribution between water and methane, the use of a united-atom model in this study means that the hydrogen positions in CH4 molecules cannot be directly represented. Therefore, the conditions for calculating the hydrogen bond between water and methane or the precise peak position of RDF were not available. However, based on the overall density distribution and other statistical metrics, it can be concluded that the interaction between water and methane is significantly weaker than that in the water–CO2 system, primarily exhibiting as non-directional, nonspecific weak repulsion or sparse encapsulation. This is also reflected in the aforementioned structural distribution analysis; that is, water molecules did not form a distinct enrichment layer around methane, suggesting a structural tendency to be more “repelled” by the aqueous phase.
In conclusion, water molecules exhibit a certain degree of local structural correlation with CO2, forming a non-ideal “solvent shell” within a defined spatial range. However, this only shows a relatively weak hydrophobic adsorption trend compared with graphene. Due to the model’s limitations, the spatial behavior of CH4 is mainly characterized by being surrounded by the edge of the aqueous phase and lacking a clear structural sequence. These differential micro-behaviors jointly determine the macroscopic distribution patterns and diffusion behaviors of each component under different temperature and pressure conditions.
3.4. Root Mean Square Displacements (RMSD) of CH4, CO2, and Water Under Various Temperature and Pressure Conditions
To further investigate the effects of temperature and pressure on the mobility of system components, this study analyzes the root mean square displacement (MSD) of methane (CH4), carbon dioxide (CO2), and water (H2O) under three representative temperature and pressure conditions (Figure 6). Overall, the MSD of each component showed an increasing trend over time, indicating that the system was in a state dominated by thermal diffusion. However, the magnitude and growth rate of MSD differ markedly across temperature and pressure conditions, highlighting the regulatory influence of the thermodynamic environment on molecular motion intensity. The definition formula of MSD is shown in Formula (9):
Here, ri(t) represents the position vector of particle i at time t and ri(0) represents he position vector of particle i at its initial moment.

Figure 6.
Mean square displacement (MSD) of (a) methane (CH4), (b) carbon dioxide (CO2), and (c) water at different temperatures and pressures.
Figure 6.
Mean square displacement (MSD) of (a) methane (CH4), (b) carbon dioxide (CO2), and (c) water at different temperatures and pressures.

Under the conditions of low temperature and high pressure (190 K, 6 MPa), the MSD values of the three molecules were generally low, indicating that their diffusion ability was limited. The MSD of CH4 and CO2 in this state at 20 ns is approximately 141.5 and 86.2, respectively, while the MSD of water molecules is significantly smaller, only about 0.39. This indicates that the water is almost in a quasi-frozen state, with only limited local vibrations occurring, which is consistent with the structural characteristics of a strong aggregation of water molecules and occupation of intermediate regions observed at low temperatures (Figure 6).
Under ambient conditions (298 K, 0.1 MPa), the MSD of all three components increased markedly, indicating intensified molecular mobility. At 20 ns, the MSD of CH4 and CO2 reached 236.0 and 242.7, respectively, which were nearly equal, indicating that they have similar diffusion capabilities in a low-constraints environment. The MSD of water increased to 92.3, showing significant diffusivity compared to the weak vibration at low temperatures. This is consistent with the description in the aforementioned results that water molecules are mainly distributed in the middle of graphene, forming a certain degree of network but with a loose structure.
3.5. The Variation in the Adsorption Quantities of Methane and Carbon Dioxide on the Surface of Graphene
By examining the temporal variations in the adsorption amounts of CH4 and CO2 on the graphene surface, this study reveals how temperature and pressure regulate the adsorption process. Three representative thermodynamic conditions are analyzed: 190 K-6 MPa (low temperature and high pressure), 298 K-0.1 MPa (ambient temperature and pressure), and 320 K-8 MPa (high temperature and high pressure/supercritical), aiming to investigate the interfacial behavior of gas molecules under varying environments.
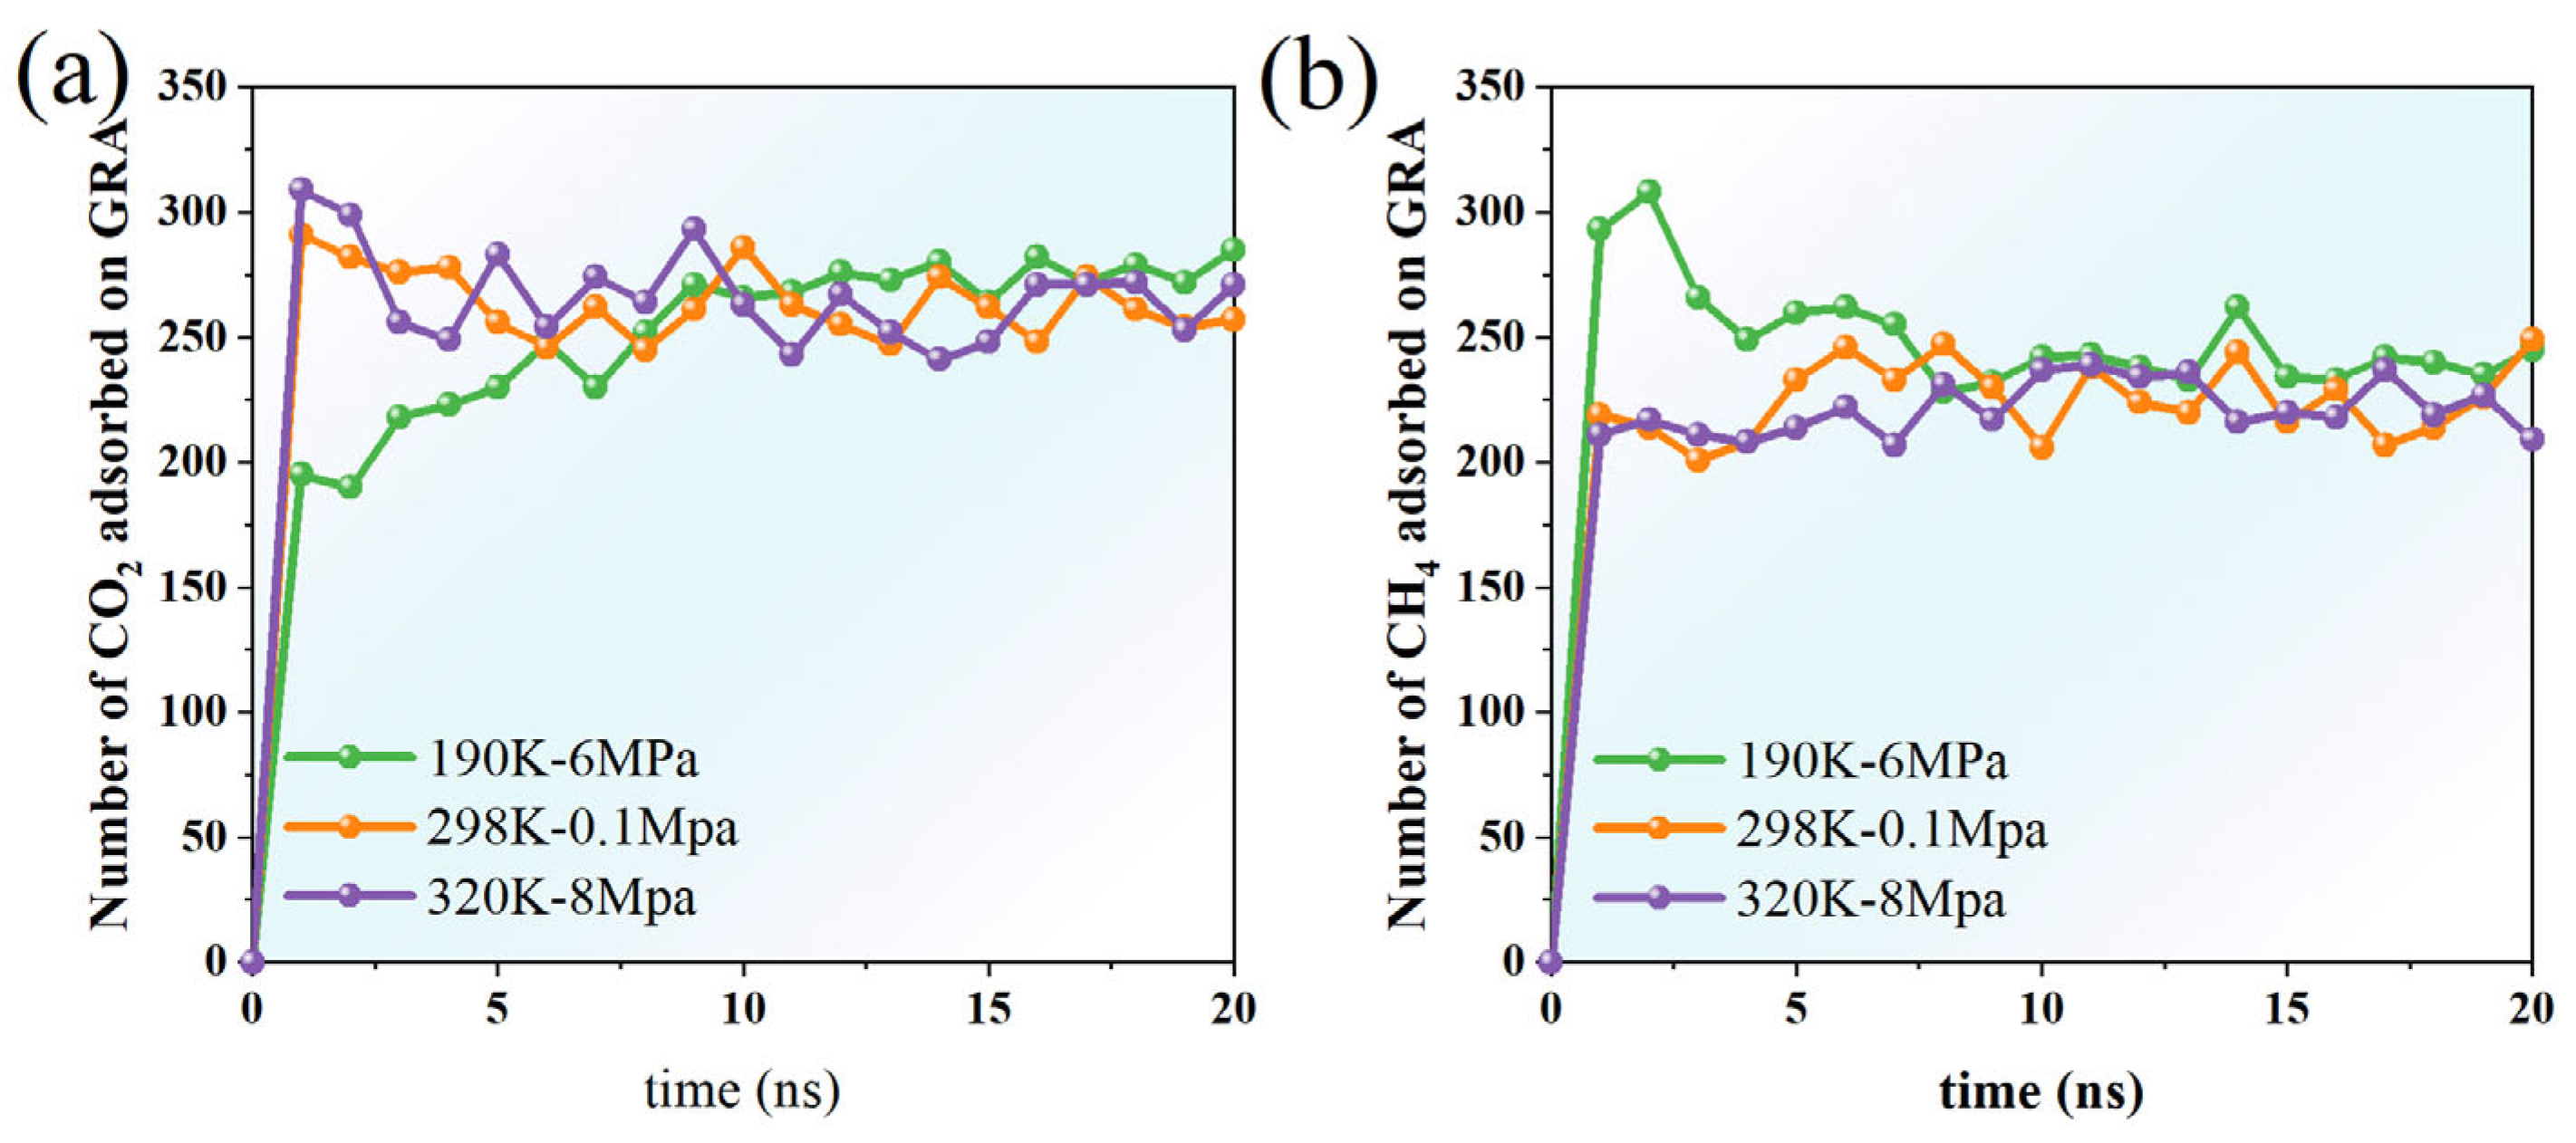
Under the 190 K-6 Mpa conditions, the adsorption quantity of CO2 was always significantly higher than that in the other two temperature and pressure environments, and was also higher than CH4 under the same conditions. This indicates that low temperature and high pressure can effectively enhance the interaction between CO2 molecules and graphene, promoting their stable adsorption on the surface. The adsorption quantity rose rapidly in the initial stage and then fluctuated and converged, indicating that the system tended towards adsorption equilibrium. In contrast, the quantity of CH4 adsorption that occurs under the same conditions is generally lower and slightly more fluctuating, indicating that adsorption capacity at this temperature and pressure is limited and mainly restricted by its non-polar characteristics and relatively weak molecule–surface interactions (Figure 7).
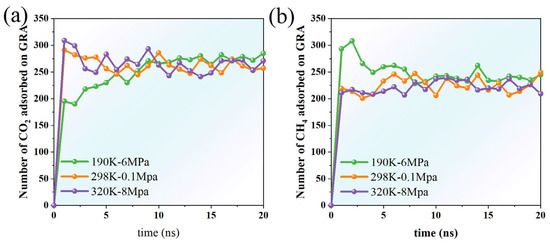
Figure 7.
Time-dependent changes in the adsorption amounts of (a) CH4 and (b) CO2 on graphene surfaces under varying temperature and pressure conditions.
At 298 K and 0.1 MPa, the adsorption behaviors of both gases exhibit increased fluctuations. The overall adsorption quantity of CO2 is lower than that obtained at 190 K-6 MPa, and there is a frequent, dynamic process of alternating adsorption and desorption over time, which reflects that the system tends to have a weaker adsorption equilibrium at normal temperature and pressure. Under these conditions, the amount of CH4 adsorption exceeds that of CO2, possibly because CH4 molecules possess greater diffusion freedom at lower pressure, facilitating their access to adsorption sites near the graphene surface.
Under the high-temperature and high-pressure conditions of 320 K-8 MPa, the adsorption quantity of CO2 is basically maintained at a medium level, slightly higher than normal-pressure but significantly lower than low-temperature conditions. Although high temperatures are conducive to enhancing molecular kinetic energy and inhibiting adsorption, the increase in pressure to some extent offsets the adverse effects of temperature. Under these conditions, the amount of CH4 adsorption remains relatively high and stable, indicating that the enhancing effect of high pressure on CH4 adsorption persists even at elevated temperatures.
Overall, CO2 demonstrates the highest adsorption capacity under low-temperature, high-pressure conditions, whereas CH4 shows measurable adsorption activity at both ambient and elevated temperature–pressure conditions, although its adsorption quantity consistently remains lower than that of CO2. Increases in temperature and decreases in pressure hinder the stable adsorption of gas molecules on graphene surfaces. Additionally, the polarity and molecular size of different gases significantly influence their adsorption behaviors.
3.6. Changes in the Amounts of Methane and Carbon Dioxide Desorbed on Graphene Surfaces
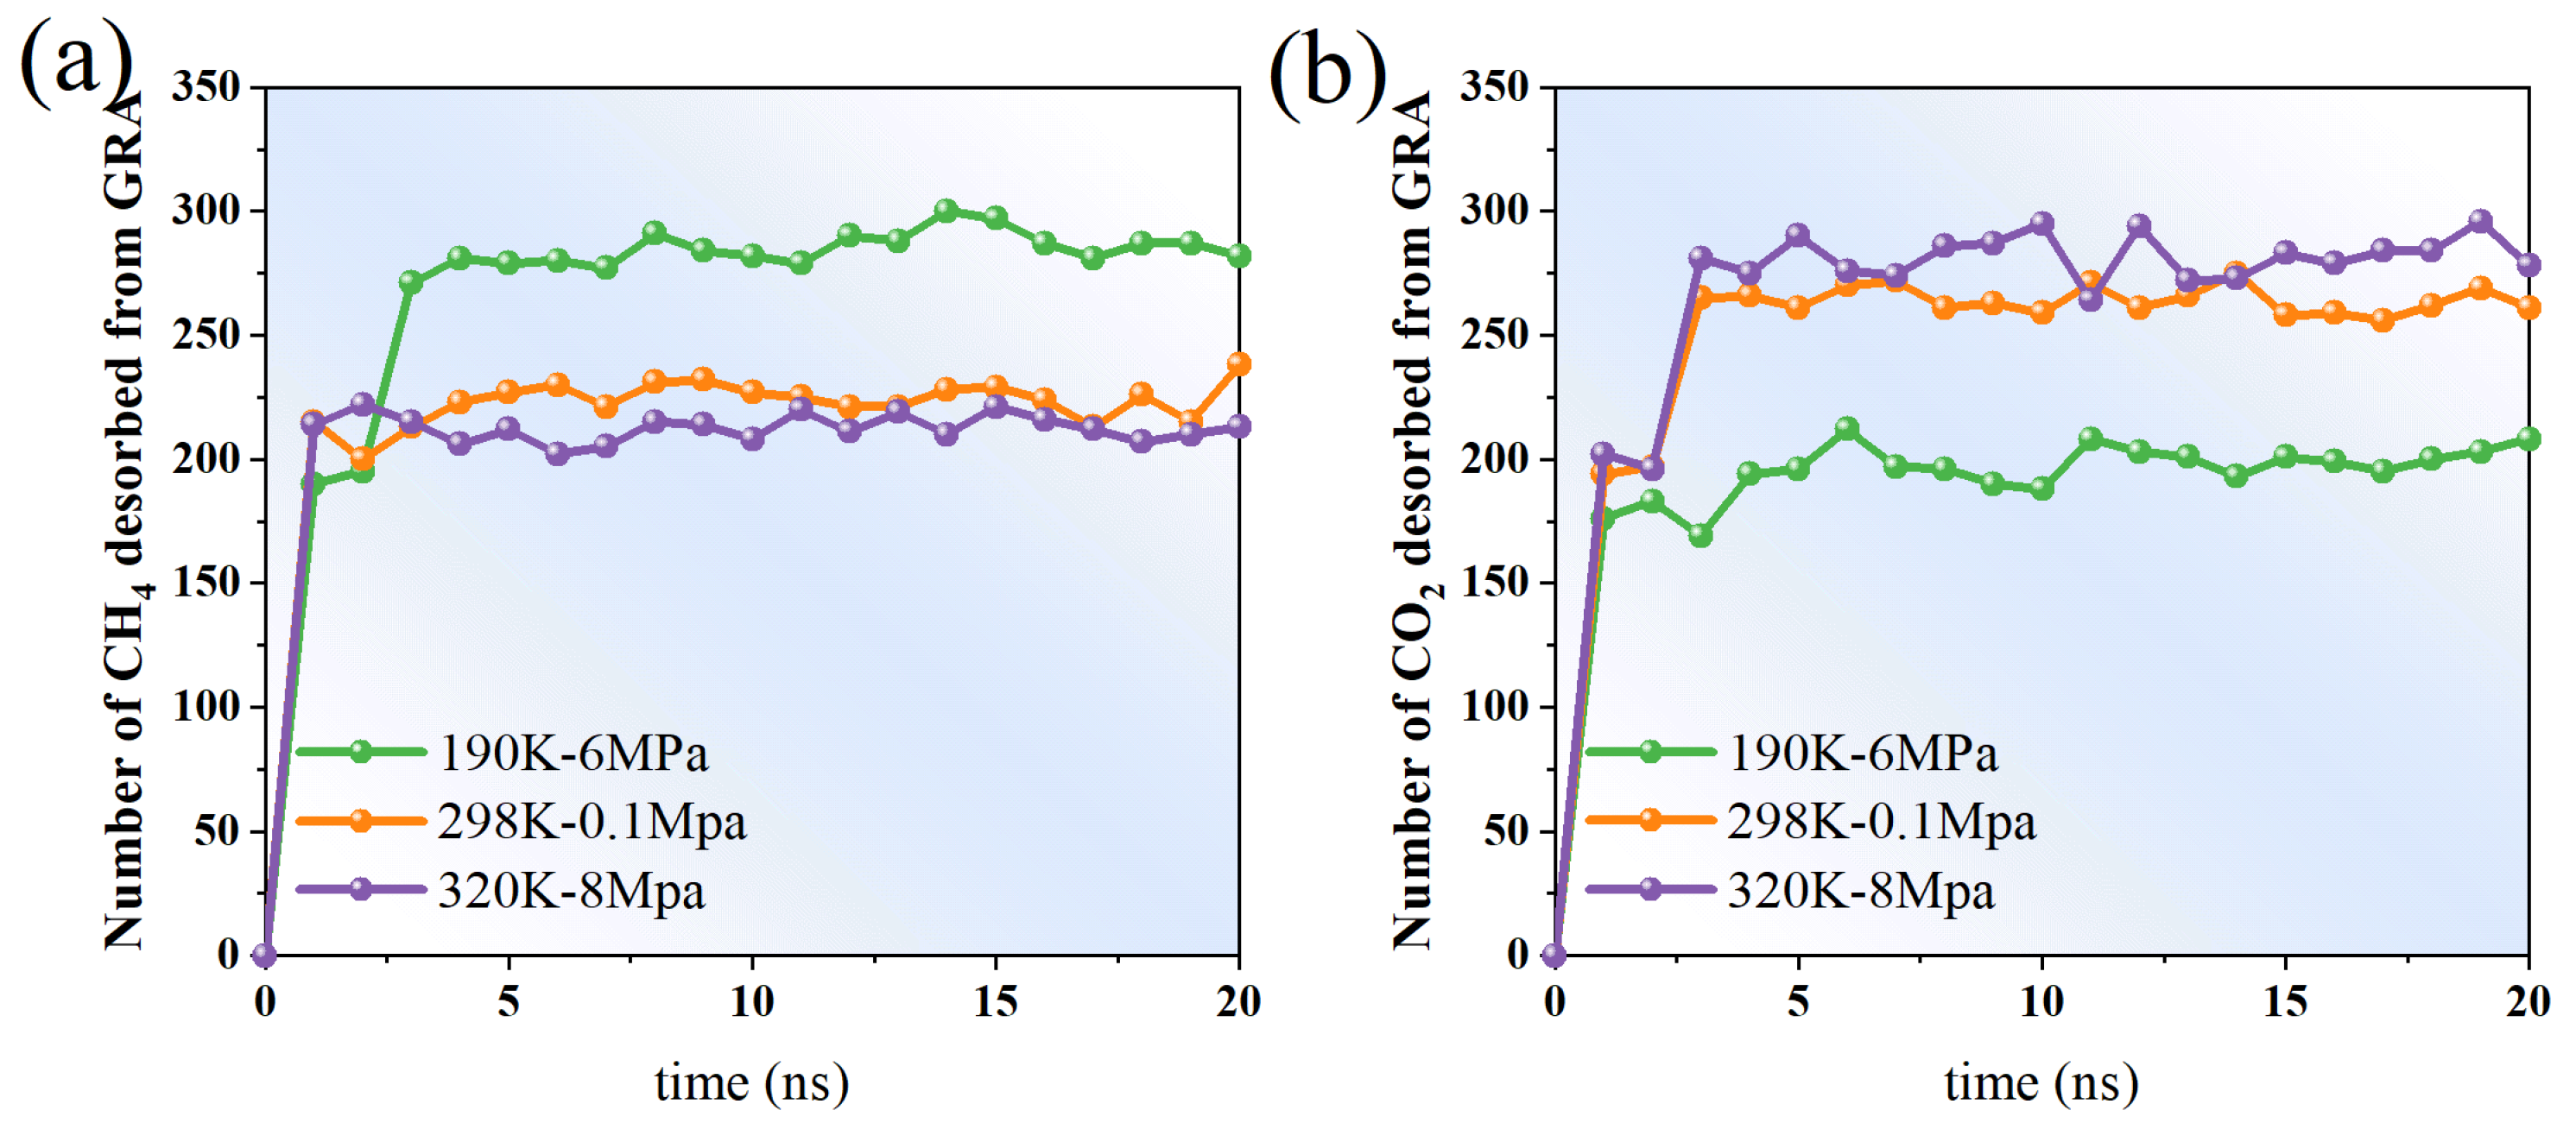
When comparing the desorption behaviors of methane (CH4) and carbon dioxide (CO2) from graphene surfaces under varying temperature and pressure conditions, both similarities and notable differences in the temporal variation in desorption amounts are evident (Figure 8). The simulations were conducted under three representative conditions: low temperature and high pressure (190 K, 6 MPa), ambient temperature and pressure (298 K, 0.1 MPa), and high temperature and high pressure (320 K, 8 MPa), aiming to elucidate the combined effects of temperature and pressure on the desorption process.
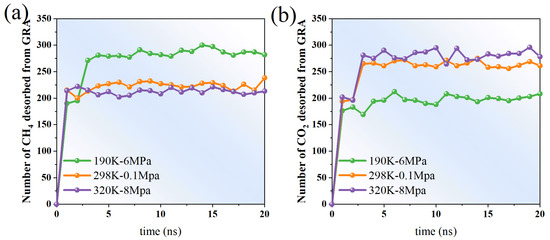
Figure 8.
Time-dependent changes in the desorption of (a) CO2 and (b) CH4 on graphene surfaces under varying temperature and pressure conditions.
At 190 K and 6 MPa, the desorption of CH4 and CO2 remained generally low, showing slight increases over time accompanied by considerable fluctuations. For example, in the initial stage (0–5 ns), the quantity of CH4 desorption rapidly increases from 0 to approximately 280, and then tends to stabilize. Although the amount of CO2 desorption observed at the initial stage is slightly lower than that of CH4, it also reaches and remains above 200 in the later stage (15–20 ns). Lower temperatures inhibit the desorption process, while higher pressures promote the surface residence of molecules. Therefore, the desorption rates of both under these conditions are relatively low (Figure 8).
At 298 K and 0.1 MPa, the desorption trends of CH4 and CO2 are more significant. Both rapidly reached over 200 in the initial stage and continued to grow slightly in the subsequent period, indicating that under near-atmospheric pressure and normal temperature conditions, gas molecules have higher thermal kinetic energy and can more easily overcome the surface adsorption barrier to undergo desorption processes. Notably, the amount of CO2 desorption in the range of 5–15 ns is significantly higher than that of CH4, and even approaches or exceeds 270 at some time points, indicating that CO2 is more easily desorbed from the graphene surface than CH4.
Under the conditions of 320 K and 8 MPa, despite the high pressure, the high temperature significantly enhanced the thermal motion of molecules and promoted desorption behavior. The amounts of CH4 and CO2 desorption both rose rapidly and remained approximately within the range of 210–290 after 10 ns. The total amount of CO2 desorption slightly exceeds that of CH4, suggesting that its weaker adsorption and greater kinetic responsiveness facilitate desorption. This finding further confirms that high temperatures promote desorption, whereas higher pressure has a less significant effect on the desorption behavior.
Overall, as the temperature rises, the amounts of CH4 and CO2 desorption both show an increasing trend, and the amount of CO2 desorption under various temperature and pressure conditions is always no less than that of CH4. This indicates that the adsorption stability of CO2 on the surface of graphene is relatively weak and it is more prone to desorption behavior. Although CH4 desorbs rapidly in the initial stage, it shows a certain degree of sluggishness in the later stage, reflecting its strong adsorption and retention capacity. The dynamic features of desorption behavior offer a foundation for a more comprehensive understanding of the interactions between different gases on nanomaterial surfaces.
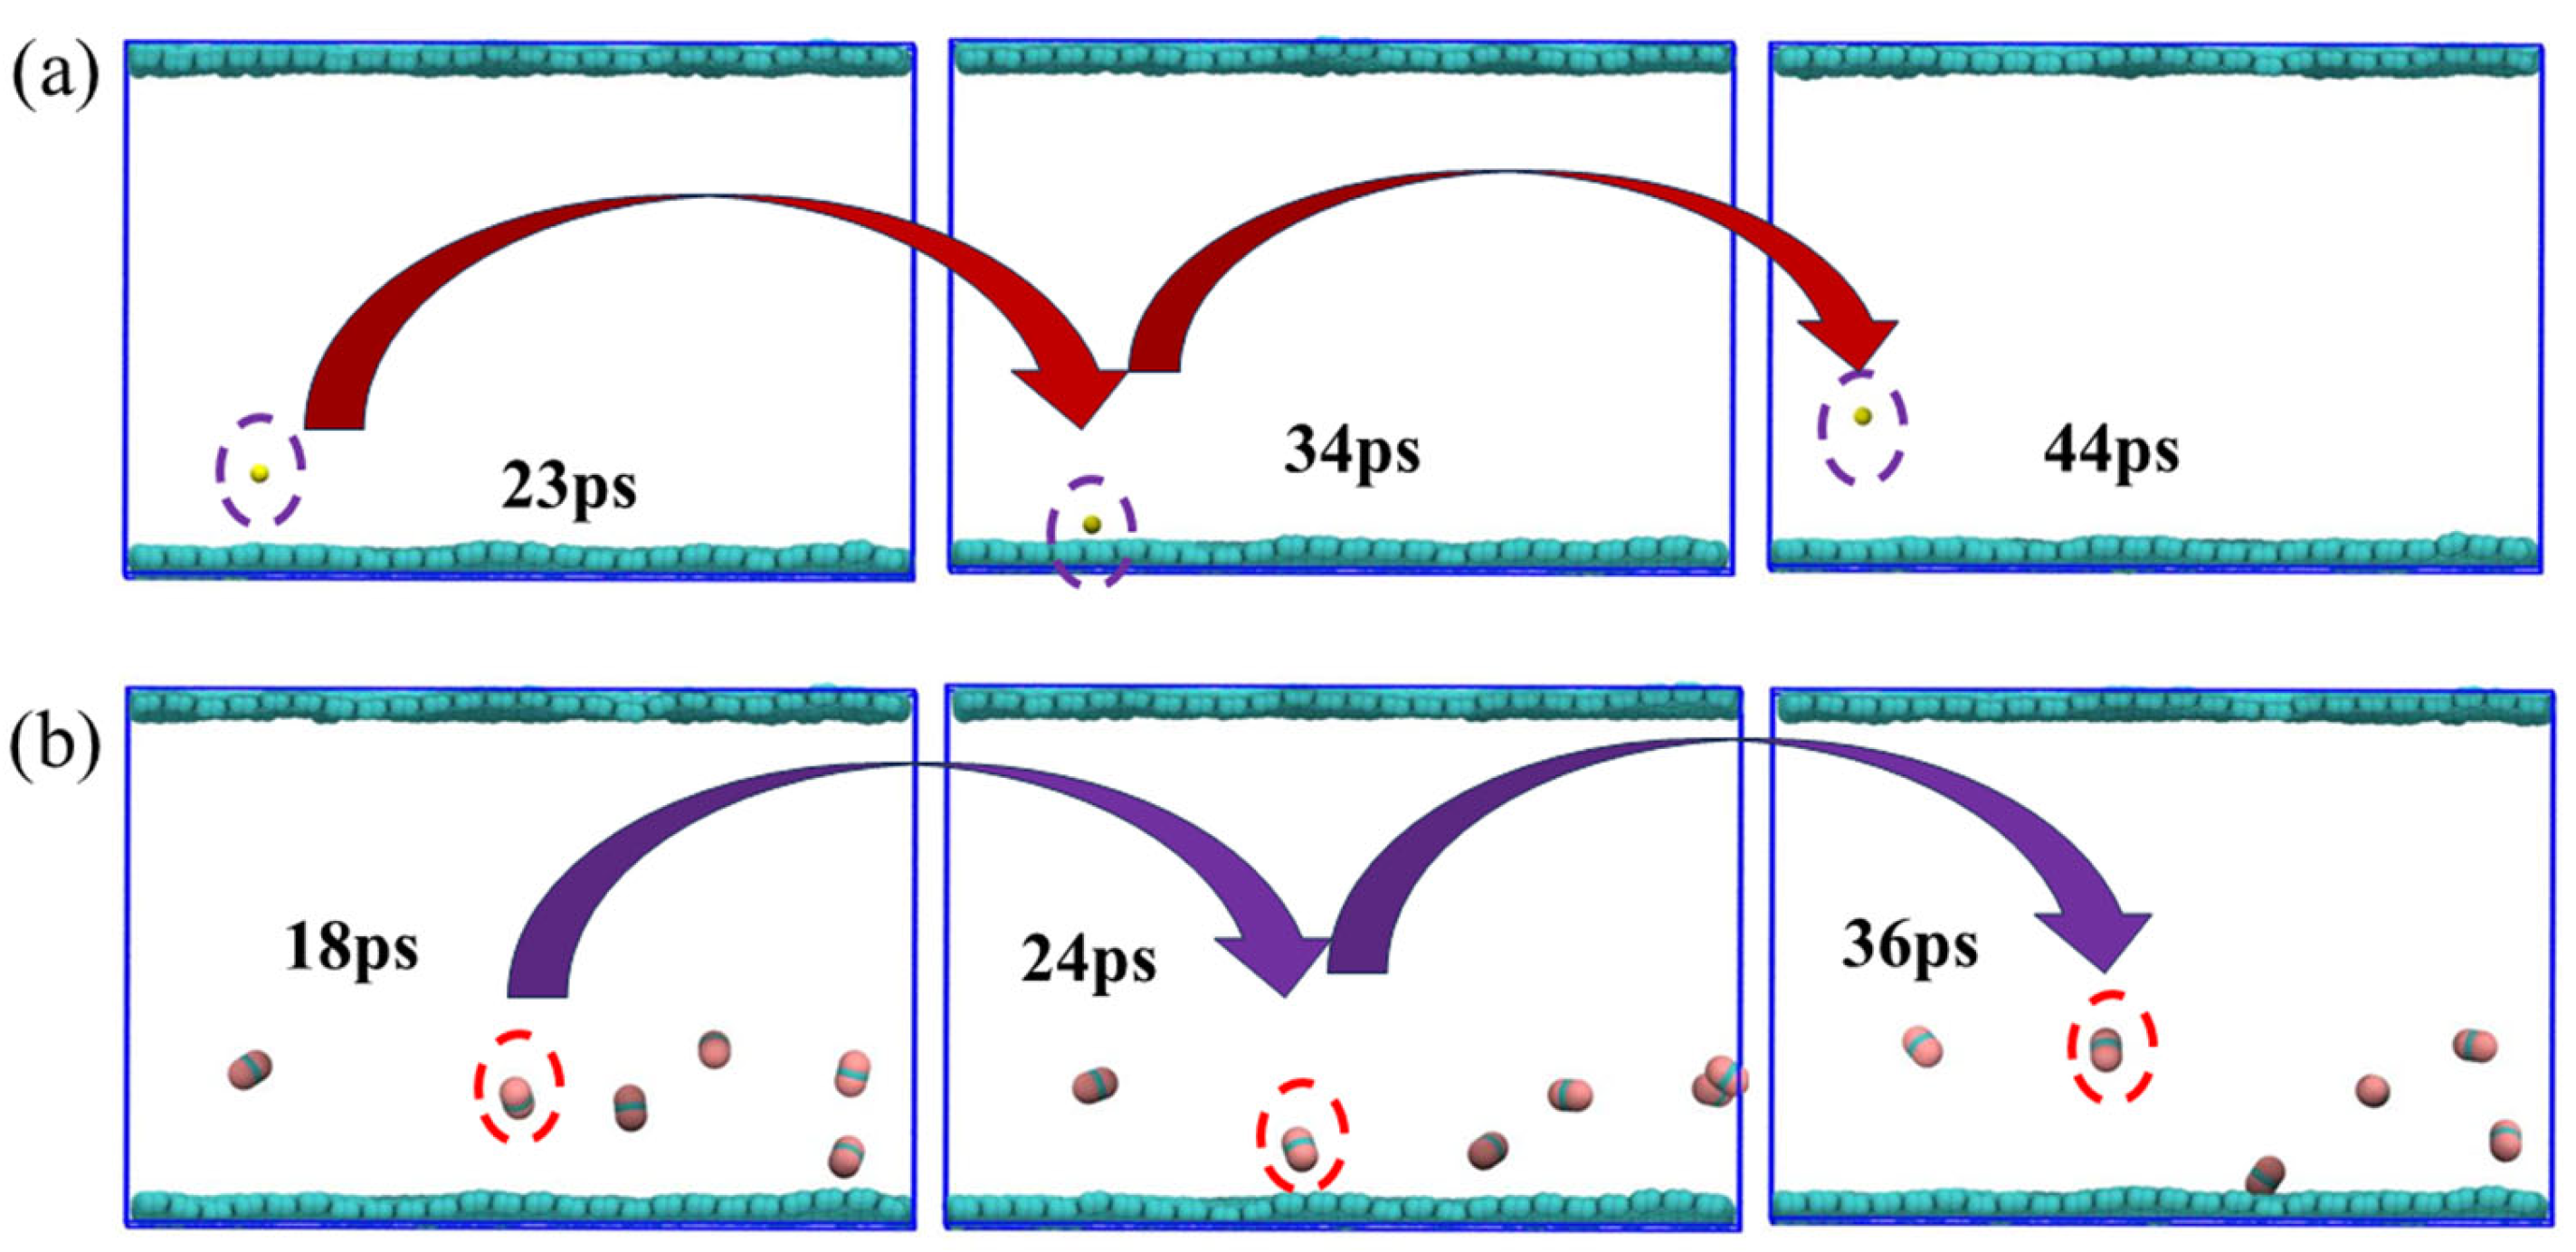
To visually illustrate the adsorption and desorption behaviors of CH4 and CO2 on graphene surfaces, this study presents a snapshot of a molecular dynamics simulation under the conditions of 320 K and 8 MPa (Figure 9). We presented paths of the movement a small amount of CH4 and CO2 to facilitate the observation of their behaviors. In the simulation, CH4 and CO2 molecules were partially distributed in the center of the system at the initial point. However, as time went on, the thermal disturbance of the molecules significantly increased, gradually leaving the interior and diffusing into the graphene. The trajectory diagram clearly shows the migration paths of most molecules after desorption, indicating that, under these temperature and pressure conditions, the desorption process is active and the adsorption is no longer stable. The adsorption and desorption processes are completed within approximately tens of ps. In fact, both methane and carbon dioxide mostly go through processes of adsorption and desorption. From the perspective of individual molecules, the molecules first gradually approach graphene, and this process requires tens of ps. Then, they are captured by the surface of graphene; the time required for this adsorption is also approximately several tens of ps. Finally, they desorb and move to the middle of the system.
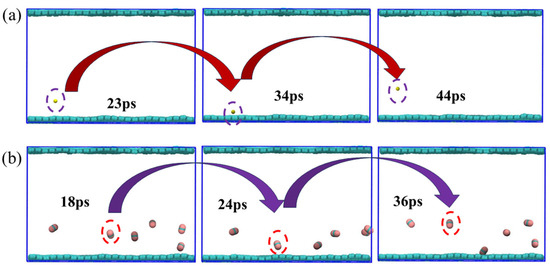
Figure 9.
Simulated snapshots of the adsorption and desorption processes of (a) CH4 and (b) CO2.
Previous studies have shown that the adsorption behavior of CO2 and CH4 strongly depends on the carbon substrate. CO2 is known to bind more strongly than CH4 on monolayer graphene, as evidenced by TPD, XPS, and DFT studies, and adsorption capacity can vary with defects or doping in the graphene lattice. In contrast, graphite, with its multilayer stacking and reduced surface accessibility, generally exhibits a lower adsorption capacity and altered competitive adsorption behavior compared to monolayer graphene. These observations suggest that while the qualitative trends of competitive adsorption are similar, the quantitative adsorption strengths and site distributions would differ between graphene, graphite, and other graphene-based materials [27,28,29,30].
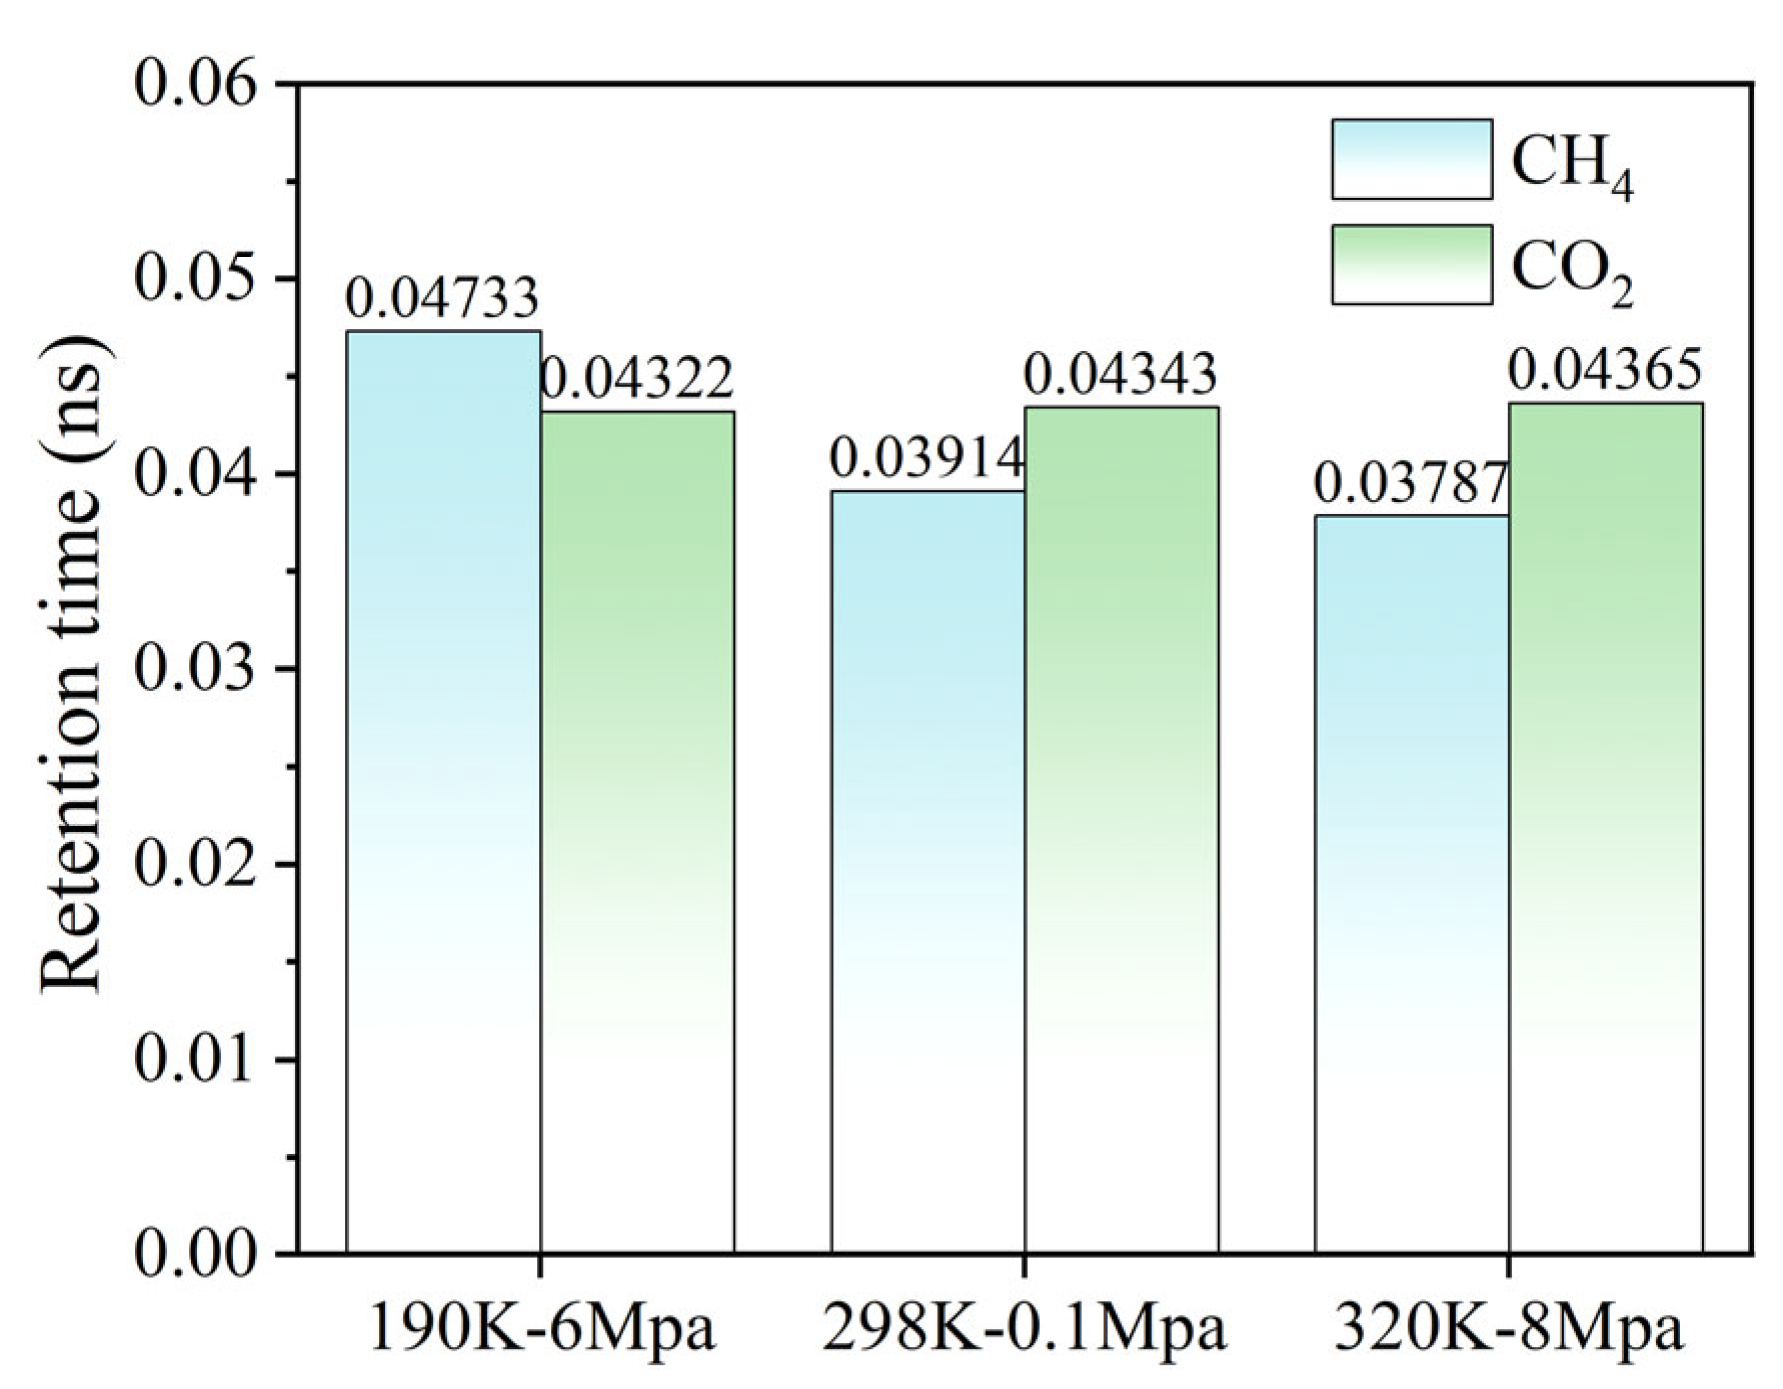
The residence time analysis provides quantitative insight into the adsorption–desorption dynamics of CH4 and CO2 within the hydrated graphene pores. As shown in Figure 10, the residence time of CH4 decreases markedly from 0.04733 at 190 K-6 MPa to 0.03787 at 320 K-8 MPa, indicating that elevated temperature and altered pressure enhance CH4 mobility and promote its desorption from the graphene surface. In contrast, CO2 exhibits relatively stable residence times across all three temperature–pressure conditions, ranging from 0.04322 to 0.04365, suggesting that its interactions with water and the graphene surface—dominated by quadrupole–dipole and van der Waals forces—remain robust even under increased thermal energy and varying pressure. This differential behavior underscores the preferential retention of CO2 over CH4 in hydrated coal seam analogs and provides mechanistic support for the observed competitive adsorption phenomena.
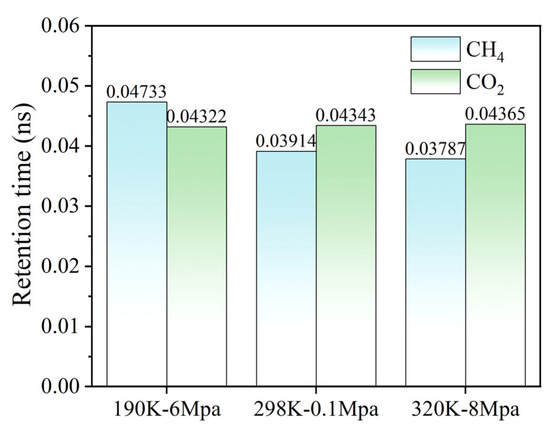
Figure 10.
The retention times of CH4 and CO2 on the surface of graphene under different temperature and pressure conditions.
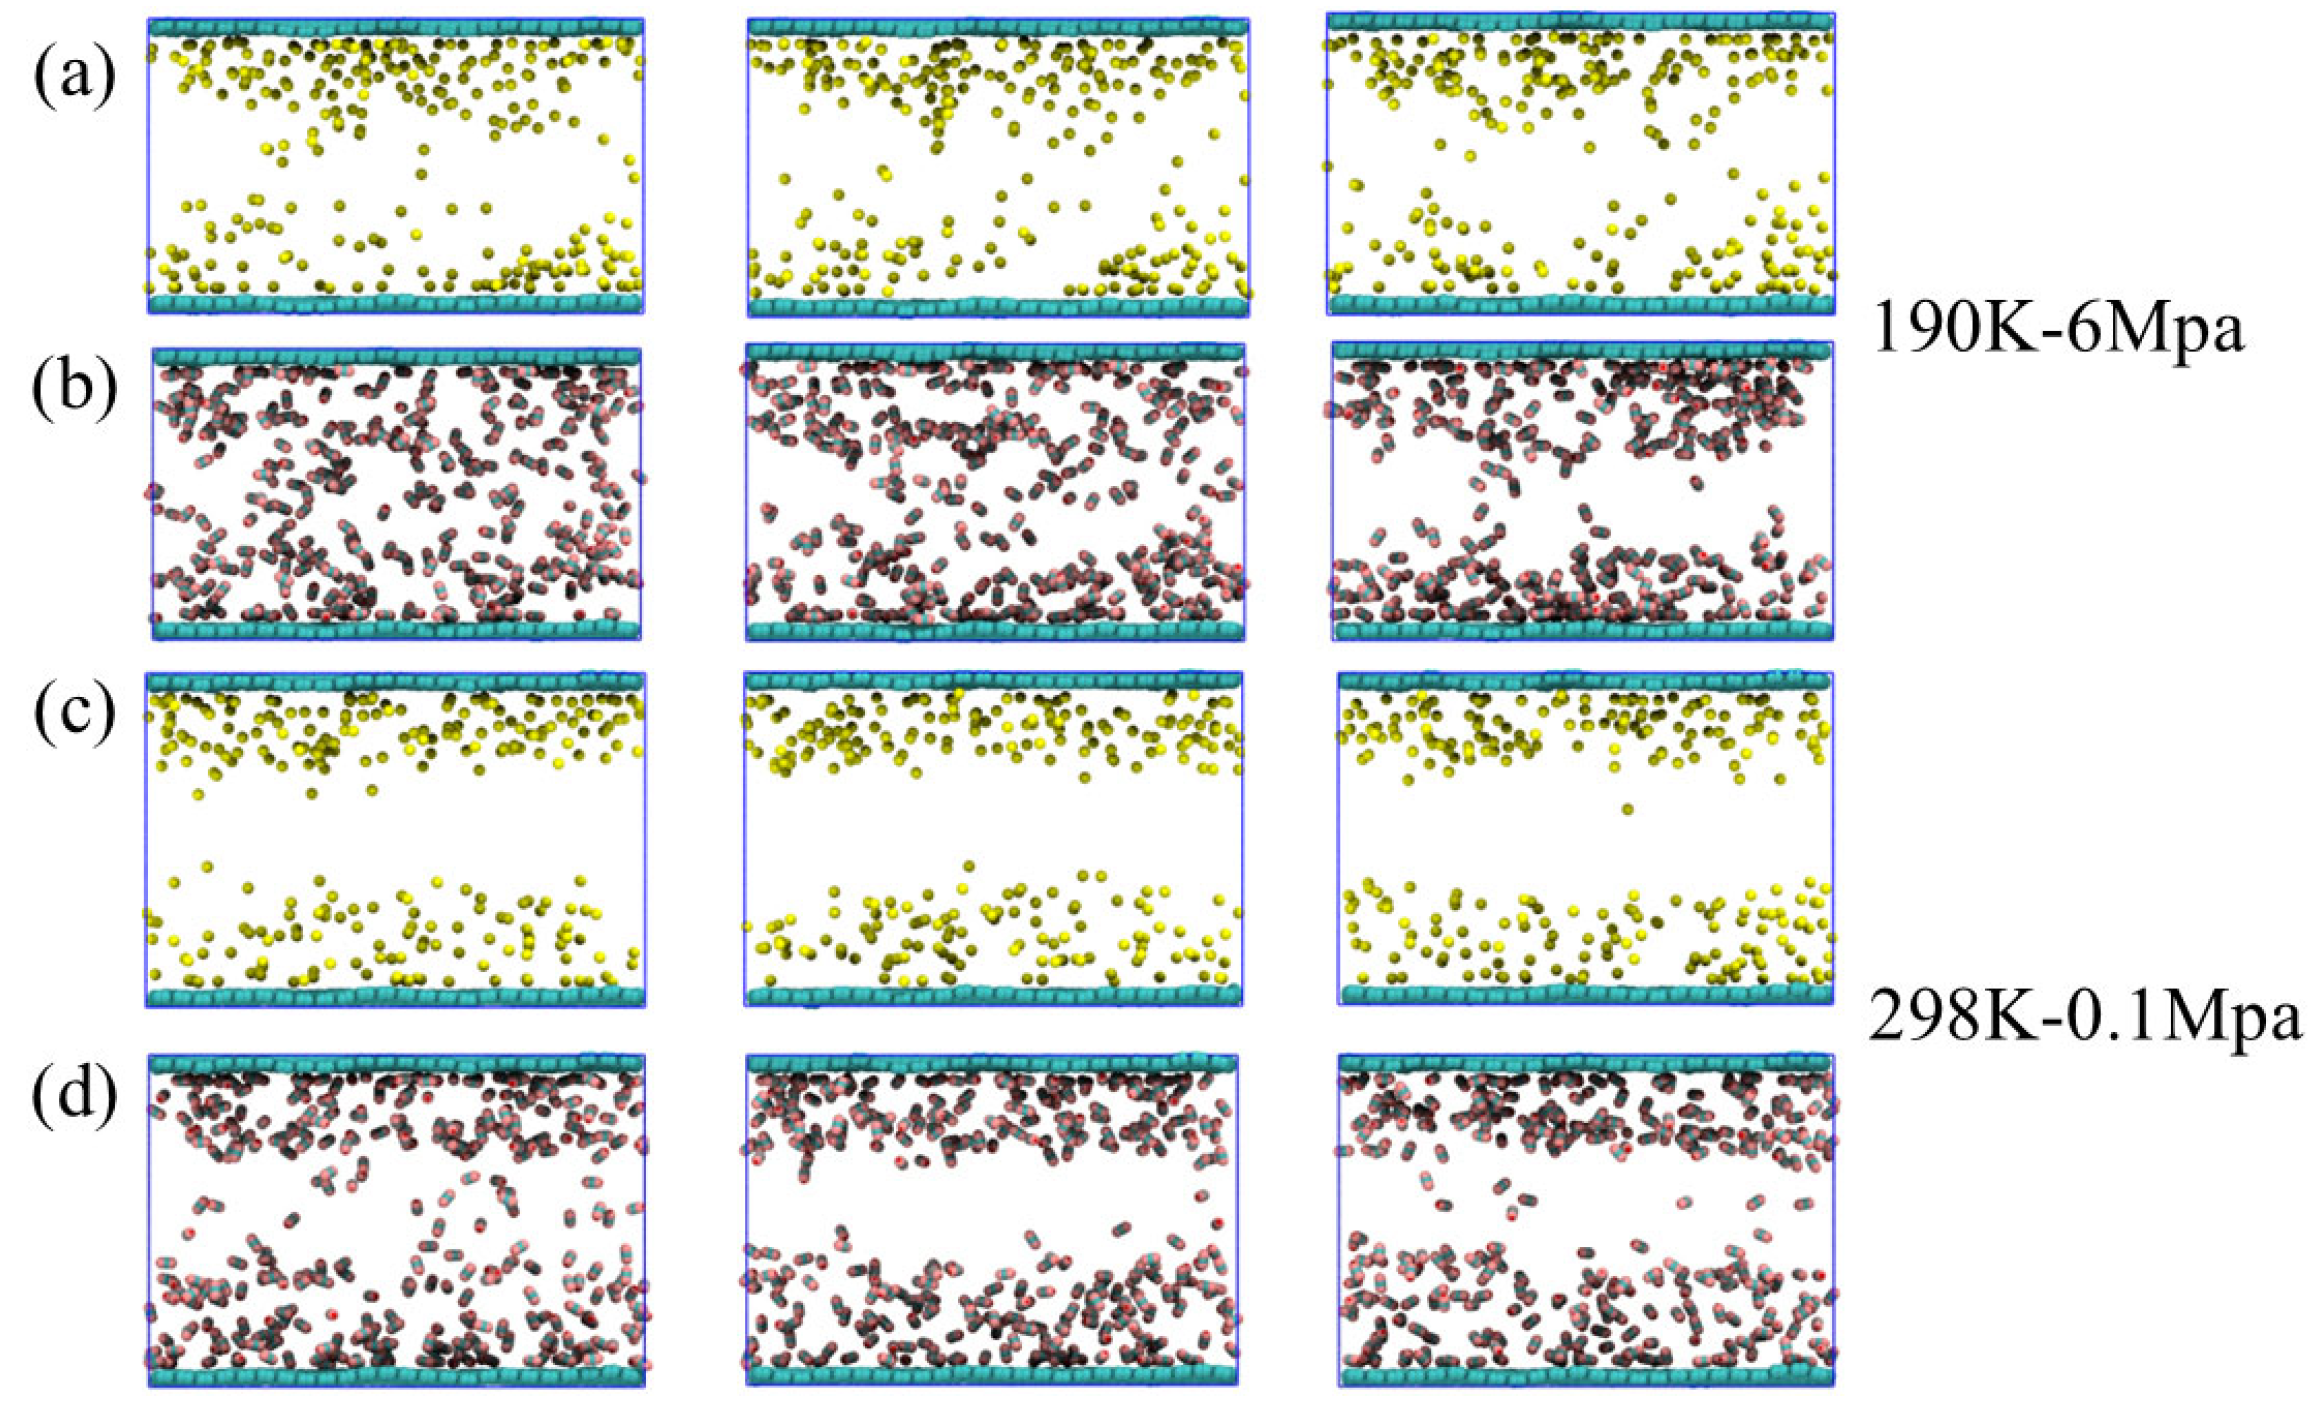
The dynamic evolution of CH4 and CO2 within the 5 Å adsorption layer on the graphene surface was analyzed under the representative temperature–pressure conditions. At 190 K-6 MPa (Figure 11a,b), both CH4 and CO2 exhibit relatively stable adsorption layers, with CH4 showing small temporal fluctuations around an average occupancy, while CO2 maintains a consistently higher density near the surface. This behavior indicates that the low-temperature and moderately high-pressure conditions favor the formation of a stable adsorption layer, with CO2 interacting more strongly with water and the graphene surface, consistent with its quadrupole–dipole and van der Waals interactions.
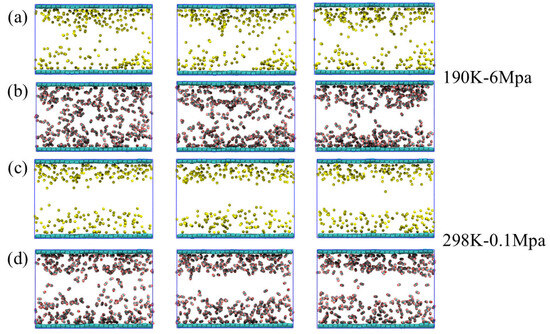
Figure 11.
Dynamic changes in (a) CH4 and (b) CO2 adsorption layers on the graphene surface within a 5 Å range under 190 K-6 Mpa conditions; dynamic changes in (c) CH4 and (d) CO2 adsorption layers on the graphene surface within a 5 Å range under conditions of 298 K-0.1 MPa.
At 298 K-0.1 MPa (Figure 11c,d), both CH4 and CO2 form well-defined adsorption layers within the 5 Å region near the graphene surface. Compared to the 190 K-6 MPa condition, the adsorption layers are more stable, exhibiting smaller temporal fluctuations and higher average occupancy. This enhanced stability suggests that moderate temperature and low pressure facilitate stronger adsorption, likely due to an optimal balance between molecular mobility and interaction strength with the hydrated graphene surface. CO2 continues to exhibit slightly higher surface density than CH4, reflecting its stronger interactions with water and the graphene surface, consistent with quadrupole–dipole and van der Waals forces. These results indicate that adsorption efficiency is maximized under intermediate thermal and pressure conditions, emphasizing the significant role of temperature and pressure in regulating gas retention in hydrated pores.
At 320 K-8 MPa (Figure 12a,b), the adsorption layers of both CH4 and CO2 exhibit more pronounced fluctuations compared to lower-temperature conditions. The CH4 layer shows a marked decrease in average occupancy and frequent desorption events, indicating that elevated temperature significantly enhances molecular mobility and reduces surface retention. Although CO2 maintains a relatively more stable adsorption layer than CH4, the layer is still less ordered and slightly thinner compared to the 298 K-0.1 MPa condition, suggesting that high thermal energy partially disrupts the optimal adsorption configuration. These observations demonstrate that high temperature, even under elevated pressure, diminishes the stability of the adsorption layers, particularly for CH4, and highlight the interplay between temperature and pressure in modulating gas adsorption and desorption dynamics in hydrated graphene pores.
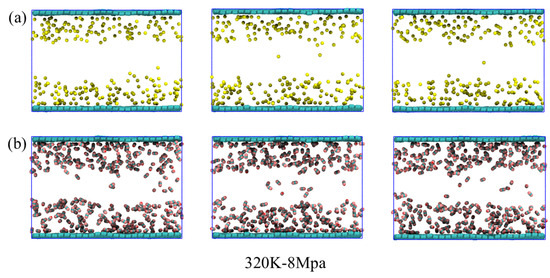
Figure 12.
Dynamic changes in (a) CH4 and (b) CO2 adsorption layers on the graphene surface within a 5 Å range under 320 K-8 Mpa conditions.
4. Conclusions
This study explored the structural and dynamic behaviors of CH4 and CO2 on graphene surfaces under three temperature and pressure conditions (190 K-6 MPa, 298 K-0.1 MPa, and 320 K-8 MPa) using molecular dynamics simulations. The results show that higher temperatures and lower pressures enhance the diffusion of both gases, with CO2 consistently exhibiting higher mobility than CH4. Under low-temperature, high-pressure conditions, gas molecules tend to stably adsorb on the graphene surface, while high-temperature conditions significantly promote desorption.
Trajectory snapshots clearly illustrate increased molecular motion and desorption at elevated temperatures. Structural analyses via radial distribution functions reveal that hydrogen bonding between CO2 and water is strong at low temperatures but weakens with increasing thermal energy. Density profiles further demonstrate that gas molecules accumulate near the graphene surface at low temperatures, whereas higher temperatures lead to more uniform spatial distributions.
Overall, temperature and pressure strongly influence the adsorption–desorption behavior, diffusion, and water interactions of CH4 and CO2. These insights contribute to a better understanding of gas behavior on graphene surfaces, relevant to storage, separation, and interfacial transport applications.
Author Contributions
P.G., Conceptualization, investigation, methodology, writing—original draft, funding acquisition. H.C., investigation, methodology. Y.Z., investigation, formal analysis. L.Z., formal analysis, writing—original draft. C.J., formal analysis, writing—original draft B.W., Formal analysis, writing—review and editing. L.W., formal analysis, writing—review and editing. All authors have read and agreed to the published version of the manuscript.
Funding
This study was supported by Science and Technology Research Program of Chongqing Municipal Education Commission (Grant No. KJQN202203201), Natural Science Foundation of Chongqing (Grant No. CSTB2025NSCQ-GPX0832), Key Project of Chongqing Technology Innovation and Application Development (Grant No. CSTB2025TIAD-KPX0028), Guizhou Provincial Science and Technology Foundation (Grant No. Qian Ke He Zhi Cheng [2023] Yiban 482) and Doctoral Research Fund of Chongqing Industry Polytechnic University (Grant No. 2023GZYBSZK1-11).
Data Availability Statement
The original contributions presented in this study are included in the article material. Further inquiries can be directed to the corresponding author.
Conflicts of Interest
Authors Yunlong Zou and Changguo Jing were employed by CCTEG Chongqing Research Institute. The remaining authors declare that the research was conducted in the absence of any commercial or financial relationships that could be construed as a potential conflict of interest.
References
- Chareonsuppanimit, P.; Mohammad, S.; Robinson, R.L., Jr.; Gasem, K.A. High-pressure adsorption of gases on shales: Measurements and modeling. Int. J. Coal Geol. 2012, 95, 34–46. [Google Scholar] [CrossRef]
- Liu, Y.; Zhou, L.; Wan, X.; Tang, Y.; Liu, Q.; Li, W.; Liao, J. Synthesis and Characterization of a Temperature-Sensitive Microcapsule Gelling Agent for High-Temperature Acid Release. ACS Omega 2024, 9, 20849–20858. [Google Scholar] [CrossRef]
- Fagorite, V.I.; Ikechukwu, U.N.; Oluwasola, H.O.; Onyekuru, S.O.; Enenebeaku, C.K.; Ohia, N.P.; Agbasi, O.E.; Oguzie, E.E. Investigating adsorption properties of CO2 and CH4 in subbituminous coals from Mamu and Nsukka formations: A molecular simulation approach. Carbon Res. 2024, 3, 79. [Google Scholar] [CrossRef]
- Yu, S.; Bo, J.; Wei, C.; Dai, X.; Quan, F.; Hou, C.; Cheng, G. A review on the application of molecular dynamics to the study of coalbed methane geology. Front. Earth Sci. 2021, 9, 775497. [Google Scholar] [CrossRef]
- Xie, C.; Huang, J.; Jiang, S.; Zhao, H.; Wu, Z. Effect of Water Content and Salinity on CH4/CO2 Competitive Adsorption in Organic and Clay Nanopores: A Molecular Perspective. Energy Fuels 2024, 38, 23507–23518. [Google Scholar] [CrossRef]
- Long, H.; Lin, H.F.; Yan, M.; Bai, Y.; Tong, X.; Kong, X.G.; Li, S.G. Adsorption and Diffusion Characteristics of CH4, CO2, and N2 in Micropores and Mesopores of Bituminous Coal: Molecular Dynamics. Fuel 2021, 292, 120268. [Google Scholar] [CrossRef]
- Asif, M.; Wang, L.; Wang, R.; Wang, H.; Hazlett, R.D. Mechanisms in CO2-Enhanced Coalbed Methane Recovery Process. Adv. Geo-Energy Res. 2022, 6, 531–534. [Google Scholar] [CrossRef]
- Valadi, F.M.; Pasandideh-Nadamani, M.; Rezaee, M.; Torrik, A.; Mirzaie, M.; Torkian, A. Competitive adsorption of CO2, N2, and CH4 in coal-derived asphaltenes, a computational study. Sci. Rep. 2024, 14, 7664. [Google Scholar] [CrossRef]
- Li, Z.; Hu, H.; Wang, Y.; Gao, Y.; Yan, F.; Bai, Y.; Yu, H. Molecular Simulation of CO2/N2 Injection on CH4 Adsorption and Diffusion. Sci. Rep. 2024, 14, 20777. [Google Scholar] [CrossRef]
- Li, D.; Gao, X.; Liu, Z.; Zan, X.; Zheng, Z.; Jia, J.; Wu, J. Comparison and revelation of coalbed methane resources distribution characteristics and development status between China and America. Coal Sci. Technol. 2018, 46, 245–251+237. [Google Scholar] [CrossRef]
- Han, Q.; Deng, C.; Gao, T.; Jin, Z. Molecular simulation on competitive adsorption differences of gas with different pore sizes in coal. Molecules 2022, 27, 1594. [Google Scholar] [CrossRef]
- Wood, B.C.; Bhide, S.Y.; Dutta, D.; Kandagal, V.S.; Pathak, A.D.; Punnathanam, S.N.; Ayappa, K.G.; Narasimhan, S. Methane and Carbon Dioxide Adsorption on Edge-Functionalized Graphene: A Comparative DFT Study. J. Chem. Phys. 2012, 137, 054702. [Google Scholar] [CrossRef] [PubMed]
- Wu, H.A.; Jafar, M.; Sadegh, S. Molecular Dynamics Simulations about Adsorption and Displacement of Methane in Carbon Nanochannels. J. Phys. Chem. C 2015, 119, 25464–25474. [Google Scholar] [CrossRef]
- Cezar, H.M.; Lanna, T.D.; Damasceno, D.A.; Kirch, A.; Miranda, C.R. Revisiting greenhouse gases adsorption in carbon nanostructures: Advances through a combined first-principles and molecular simulation approach. Appl. Surf. Sci. 2024, 671, 160659. [Google Scholar] [CrossRef]
- Meng, J.; Zhong, R.; Li, S.; Yin, F.; Nie, B. Molecular Model Construction and Study of Gas Adsorption of Zhaozhuang Coal. Energy Fuels 2018, 32, 9727–9737. [Google Scholar] [CrossRef]
- Zhou, W.; Wang, H.; Zhang, Z.; Chen, H.; Liu, X. Molecular Simulation of CO2/CH4/H2O Competitive Adsorption and Diffusion in Brown Coal. RSC Adv. 2019, 9, 3004–3011. [Google Scholar] [CrossRef]
- Hui, D.; Li, L.; Zhang, Y.; Peng, X.; Li, T.; Jia, C.; Pan, Y. Molecular simulation of adsorption behaviors of methane and carbon dioxide on typical clay minerals. Front. Energy Res. 2023, 11, 1231338. [Google Scholar] [CrossRef]
- Saka, C. Phosphorus and sulphur-doped microalgae carbon as a highly active metal-free catalyst for efficient hydrogen release in NaBH4 methanolysis. Fuel 2022, 309, 122183. [Google Scholar] [CrossRef]
- Jia, J.; Song, H.; Jia, P. Molecular simulation of methane adsorption properties of coal samples with different coal rank superposition states. ACS Omega 2023, 8, 3461–3469. [Google Scholar] [CrossRef]
- Zhang, J.; Liu, K.; Clennell, M.B.; Dewhurst, D.N.; Pan, Z.; Pervukhina, M.; Han, T. Molecular Simulation Studies of Hydrocarbon and Carbon Dioxide Adsorption on Coal. Pet. Sci. 2015, 12, 692–704. [Google Scholar] [CrossRef][Green Version]
- Xu, R.; Liao, L.; Liang, W.; Wang, H.; Zhou, Q.; Liu, W.; Chen, M.; Fang, B.; Wu, D.; Jin, H.; et al. Fast Removing Ligands from Platinum-Based Nanocatalysts by a Square-Wave Potential Strategy. Angew. Chem. Int. Ed. Engl. 2025, 5, e202509746. [Google Scholar] [CrossRef]
- Hong, L.; Lin, J.; Gao, D.; Zheng, D.; Wang, W. Molecular simulation of the effect of water content on CO2, CH4, and N2 adsorption characteristics of coal. Sci. Rep. 2024, 14, 18190. [Google Scholar] [CrossRef] [PubMed]
- Jia, J.; Xing, Y.; Li, B.; Wu, Y.; Wang, D. Molecular simulation study of adsorption-diffusion of CH4, CO2 and H2O in gas-fat coal. Sci. Rep. 2024, 14, 24131. [Google Scholar] [CrossRef] [PubMed]
- Song, Y.; Qin, Y.; Yan, L.; Guo, W.; Xu, H. Endothermic relaxation behavior of gangue in longwall gob: Bidirectional heat transfer model and its simulation validation. Fuel 2023, 346, 128349. [Google Scholar] [CrossRef]
- Zhang, K.; Ma, M.; Sang, S.; Liu, H.; Xu, H.; Fang, H. Supercritical Transition Adsorption Process of CO2 and CH4 in Coal: Insights from Molecular Simulations. ACS Omega 2025, 10, 1234–1245. [Google Scholar] [CrossRef]
- Marini, A.; Piegari, L.; Mortazavi, S.S.; Ghazizadeh, M.S. Coordinated operation of energy storage systems for distributed harmonic compensation in microgrids. Energies 2020, 13, 771. [Google Scholar] [CrossRef]
- Takeuchi, K.; Yamamoto, S.; Hamamoto, Y.; Shiozawa, Y.; Tashima, K.; Fukidome, H.; Koitaya, T.; Mukai, K.; Yoshimoto, S.; Suemitsu, M.; et al. Adsorption of CO2 on graphene: A combined TPD, XPS, and vdW-DF study. J. Phys. Chem. C 2017, 121, 2807–2814. [Google Scholar] [CrossRef]
- Wang, C.; Fang, Y.; Duan, H.; Liang, G.; Li, W.; Chen, D.; Long, M. DFT study of CO2 adsorption properties on pristine, vacancy and doped graphenes. Solid State Commun. 2021, 337, 114436. [Google Scholar] [CrossRef]
- Abdul Razak, M.; Do, D.D.; Birkett, G.R. Evaluation of the interaction potentials for methane adsorption on graphite and in graphitic slit pores. Adsorption 2011, 17, 385–394. [Google Scholar] [CrossRef]
- Trinh, T.T.; Vlugt, T.J.H.; Hägg, M.B.; Bedeaux, D.; Kjelstrup, S. Selectivity and self-diffusion of CO2 and H2 in a mixture on a graphite surface. Front. Chem. 2013, 1, 38. [Google Scholar] [CrossRef]
- Jorgensen, W.L.; Maxwell, D.S.; Tirado-Rives, J. Development and Testing of the OPLS All-Atom Force Field on Conformational Energetics and Properties of Organic Liquids. J. Am. Chem. Soc. 1996, 118, 11225–11236. [Google Scholar] [CrossRef]
- Jorgensen, W.L.; Chandrasekhar, J.; Madura, J.D.; Impey, R.W.; Klein, M.L. Comparison of Simple Potential Functions for Simulating Liquid Water. J. Chem. Phys. 1983, 79, 926–935. [Google Scholar] [CrossRef]
- Linse, P. Thermodynamic and structural aspects of liquid and solid benzene. Monte Carlo study. J. Am. Chem. Soc. 1984, 106, 5425–5430. [Google Scholar] [CrossRef]
- Norberg, J.; Nilsson, L. Temperature dependence of the stacking propensity of adenylyl-3′, 5′-adenosine. J. Phys. Chem. 1995, 99, 13056–13058. [Google Scholar] [CrossRef]
- Li, J.; Wen, M.; Yang, J.; Liu, Y.; Jiang, Z.; Chen, J. Synthesis and analysis of magnetic nanoparticles within foam matrix for foam drainage gas production. Geoenergy Sci. Eng. 2024, 238, 212887. [Google Scholar] [CrossRef]
Disclaimer/Publisher’s Note: The statements, opinions and data contained in all publications are solely those of the individual author(s) and contributor(s) and not of MDPI and/or the editor(s). MDPI and/or the editor(s) disclaim responsibility for any injury to people or property resulting from any ideas, methods, instructions or products referred to in the content. |
© 2025 by the authors. Licensee MDPI, Basel, Switzerland. This article is an open access article distributed under the terms and conditions of the Creative Commons Attribution (CC BY) license (https://creativecommons.org/licenses/by/4.0/).

