Article

Increasing Residence Time in Random Packed Beds of Spheres with a Helical Flow Deflector

Faculty of Mechanical Engineering, Czestochowa University of Technology, al. Armii Krajowej 21, 42-200 Czestochowa, Poland
Processes 2025, 13(9), 2828; https://doi.org/10.3390/pr13092828
Submission received: 31 July 2025 / Revised: 25 August 2025 / Accepted: 2 September 2025 / Published: 3 September 2025
(This article belongs to the Section Chemical Processes and Systems)

Abstract

Random packed beds (RPBs) of various particles are widely used in chemical reactors to enhance the contact between the reactants or the catalyst. This numerical study investigates the prospects of using a helical flow deflector spanning the whole cross-section of the reactor and the height of the random packing to control residence time distribution (RTD) in RPBs of spherical particles. The packed bed geometry is generated via sequential particle deposition, while flow equations are solved for the real geometry of the packing without additional modelling terms. The results demonstrate that in laminar conditions the flow deflector significantly increases flow tortuosity and residence time (even a few times for small helix pitches) when the effective velocity in the RPB is kept fixed. The relationship between the helix pitch and tortuosity, pressure drop, and RTD is quantified, revealing that residence time scale similarly to tortuosity while the increase in pressure drop is more pronounced. The study provides a validated framework for optimising helical deflector designs in RPBs (at least in the laminar regime), with implications for reactor efficiency.

Graphical Abstract

1. Introduction

Random packed beds (RPB) of various particles are widely employed in chemical and power engineering, e.g., in trickle bed reactors (TBR) [1,2,3,4], thermal energy storage systems [5,6] or distillation columns [7,8]. The particles are freely deposited into a cylindrical container (column) and form a complex, randomly arranged structure of channels, which may be viewed as pores in a porous medium. The very large surface of the random packing allows for increased contact between the reactants, particularly in gas–liquid reactions or mass exchange, but is also important when the particles play the role of a catalyst [9,10].
When a gaseous reactant flows through the structure of the packing, a typical flow path of a fluid parcel is highly tortuous at a scale comparable with the size of the particles, which is still nearly parallel to the container’s wall when observed at the macro-scale. As a result, the average time spent by a fluid parcel within the reactor (residence time, R T ) is relatively short, although it may be crucial for the efficiency of the reaction [11]. In order to increase this time, one may try to extend the average length of the flow path by enforcing curvature of the trajectory at the scale of the container’s diameter. This can be achieved by introducing a helical surface (flow deflector) spanning the whole volume of the packed bed.
Applications of helical structures, mostly in the form of fins, have been suggested in many previous works. In the context of RPBs, Wu et al. [12] proposed helical fins for packed bed reactors in methane steam reforming and Jurtz et al. [13] for catalytic reactors. In these (and similar) implementations, the helical fins are made of highly conductible material; they are lean elements placed on the container’s wall and their main purpose is to increase radial heat and mass transport in the vicinity of the wall. Other applications include the following: rotating packed beds [14], superheated steam generators [15], solar power systems [16,17] and heat exchangers [18,19,20]. The latter uses are particularly popular–helical fins or baffles are very effective in reinforcing mixing and turbulent flow features, which are crucial from the point of view of heat transfer. In heat exchangers, however, the flow is significantly less restricted and not limited to the interstitial space within a complex porous structure.
Although helical baffles have been applied in RPBs to enhance thermal performance or mitigate flow maldistribution, it appears that a solid helical flow deflector extending across the entire cross-section of the column has not yet been proposed as a means of increasing residence time (or tortuosity) in the reactor. This solution was preliminarily presented in the author’s previous paper [21]. In that work, the influence of the deflector on the flow in a RPB of Raschig rings (hollow cylinders), mainly on the tortuosity of the flow paths and pressure drop within the packing for fixed inlet velocity conditions. The present work is focused on the residence time distribution (RTD) but also presents a different method for estimation of the tortuosity directly from the flow velocity field. The RPB analysed here is a packing of spheres. The advantage of spherical particles is that they are fully characterised by one parameter (diameter) and their orientation is irrelevant for the analysis.
A direct numerical simulation of fluid flow within a complex structure like a random packing of spheres requires full information regarding the positions of all the particles. This information is obtained here from a separate simulation in which the geometrical structure of the packing is sequentially generated. The flow solver then employs the details of the geometry (including the helical deflector) to find the flow velocity field and the pressure drop along the bed, which are used for validation of the model, and the grid dependency test is performed for the reference case without the deflector. The residence time distribution is then estimated using a popular method of a passive marker transport in a given steady-state velocity field. The benefits of the helical deflector for the heat transfer are not taken into account here and are postponed to future work.
The paper is organised as follows. In Section 2, the studied flow configuration, the bed geometry generation method, the flow solver, and the method for calculation of the RTD are presented. Section 3 includes the properties of the numerically generated RPB, the validation of the flow model, calculation of the bed structure factor, and the results of calculation of the RTD together with the analysis of the pressure drop for fixed effective velocity conditions. The results are discussed in Section 4 and the main conclusions are provided in Section 5.

2. Methods

2.1. Flow Configuration

In the present work, the physical domain is a vertical, cylindrical container of diameter D c = 0.15 m filled with a random packing of mono-sized spherical particles of diameter D p = 0.025 m (Figure 1a), resulting in D c / D p = 6 . This configuration, without the flow deflector, is referred to further as the reference case. The domain is extended on both ends of the packing with the buffer zones of height L b , i n = L b , o u t = 0.06 m. As the height of the packed bed is L = 0.3 m, the total height of the column is H c = L + 2 L b , i n = 0.42 m. The fluid—here with the physical properties of air: ρ = 1.15 kg/m3 (density), μ = 1.85 × 10 5 Pa·s (dynamic viscosity)—is introduced through the top plane of the domain with a uniform velocity profile. The inlet velocity v i n is set to different values depending on the case but is not higher than 0.02 m/s to ensure laminar conditions and stationary characteristics of the flow in the steady state.
The structure of the random packing is reconstructed numerically with the method described in more detail in Section 2.2.
The surface of the helix is formed by a rotating line segment of length equal to the column’s radius and rising per one revolution by λ (pitch)—see Figure 1b. In this work, three values of λ are considered: 0.5 D c , 1.0 D c , and 1.5 D c . The surface is extruded to make the thickness b of the deflector equal to b = 0.003 m. The supporting rod for the helix is also introduced along the axis of the column, having the same diameter D r o d as the thickness of the deflector ( D r o d = 0.003 m). As the influence of parameter λ is of the main interest in the present study, the other dimensions of the helical structure are fixed and their values are purposefully selected as small in comparison to the size of the particles.
A zero flow velocity (no-slip) boundary condition (b.c.) is imposed on all solid surfaces, i.e., the surface of the spherical particles, the helical deflector, and the wall of the container. By default, the pressure at the outflow plane is enforced to be 0 (gauge pressure). As the flow solver employs the staggered grid arrangement, the pressure b.c. is not needed on other boundaries (including the solid surfaces).
Sample results of passive marker transport in a calculated velocity field within the random packing with a selected deflector ( λ = D c ) are shown in Figure 1c. The particles are presented as blue semi-transparent spheres and the iso-surface of the marker field as an orange surface.

2.2. Generation of the Packed Bed Geometry

The method used for the reconstruction of the geometry of the random packing is based on the algorithm described in detail in Ref. [22] and is designed for generation of random packed beds of cylinders and rings. It employs a sequential approach in which the particles are added one-by-one and the rest of the bed remains at rest (frozen bed assumption). Although this greatly improves the computational efficiency of the method, it may decrease the packing density of the simulated structures. In order to avoid this, an additional radial force is introduced acting in the direction which is normal to the container’s axis. The motion of the active particle (the one currently deposited) is divided into three stages: (1) free fall up to the first contact with the bed when the motion continues under the influence of gravity and reaction forces until mechanical equilibrium is attained; (2) motion due to the radial force and reaction forces; (3) motion under the same condition as in stage 1—the final equilibrium is thus not affected by the non-physical force. At the end of stage 3, the active particle is added to the packing and the next one is placed at a random position above the bed. The algorithm stops when the required number of particles in the bed is obtained.
In the case of spherical particles, the method presented in Ref. [22] can be significantly simplified. The calculation of overlap and reaction forces between cylinders or rings requires a dense grid of markers covering the active particle. For two spheres, the overlap can be easily found directly from the distance between their centres; thus, the grid is not necessary. Also, as all the forces act normally to a particle’s surface, the rotations of particles are not considered. As a result, the method is even more efficient and still leads to realistic random packings of spheres (see Section 3.1).
When the arrangement of particles in the packed bed is reconstructed, the helical surface is inserted directly into the structure cutting through the spheres and does not modify the bed geometry in any way. This approach allows for the analysis of the influence of the deflector on the global flow properties, keeping the packed bed fixed during the variation of the parameters like λ .
It should be noted, however, that in realistic scenarios, the helical deflector would be inserted first (maybe in parts) and then the particles would be deposited to fill the remaining space. The bed formation with such a restricting constraint would definitely lead to different structures that are less densely packed, particularly for low values of λ . A detailed analysis of these more realistic configurations is planned for future work. Still, the structures examined further in the present study can be reproduced in practice with additive manufacturing.

2.3. Flow Solver

The main equations governing the flow are the Navier–Stokes equations for an incompressible fluid:
ρ U t + ρ U · U = p + μ 2 U ,
· U = 0
where U —flow velocity, ρ —density, p—pressure, μ —dynamic viscosity. Due to low inlet velocity, the flow stays in the laminar regime and the velocity field is calculated in the void spaces of the packing directly without additional terms related to modelling of turbulence.
For solution of the flow equation, an in-house MAC solver on a Cartesian staggered computational grid has been used. The solver implements Chorin’s projection method [23] and explicit 2nd-order Runge–Kutta time integration. In the original version, the code allows for simulation of flows in very complex geometries due to special treatment of the solid boundaries according to the Immersed Boundary Method (IBM, with direct forcing). Each time step is divided into three stages: (1) calculation of the provisional velocity without the pressure term but imposing zero velocity on solid boundaries; (2) solution of the Poisson equation for the pressure; (3) correction of the velocity field with the obtained pressure distribution. For the details of the algorithm, the reader is referred to Ref. [24].
Although in the previous works the IBM method proved to be reliable and convenient (see e.g., [24,25,26]), here the solid boundaries (the particles, the column’s wall, the deflector) are treated differently. Based on the signed distance from the solid surfaces, the cells of the computational grid are divided into two separate regions: (a) the interstitial space available for the flow; (b) the inner parts of the solids where the flow cannot occur. On the boundaries between the cells belonging to different regions the no-slip b.c. is imposed. The advantage of this approach is that the calculated velocity field satisfies the divergence-free condition (2) with much larger accuracy, allowing for better mass conservation crucial for the passive marker transport analysis in RTD calculations (see Section 3.4). This comes, however, with the cost of less accurate representation of solid surfaces in comparison to the IBM with additional smoothing. Just like the IBM in the original solver, with the present approach, the computational domain is a rectangular box encompassing the whole column with the packing divided into a regular, Cartesian grid. Although the efficiency of the solver is reduced—the flow equations are solved even in the cells where the flow cannot reach (within solids or outside of the column)—the grid generation step is trivial and many problems with body-fitted grids are avoided (like treatment of the contact points of the spheres).
The pressure equation is solved with the preconditioned conjugate gradient method ICPCG (Incomplete Cholesky Preconditioned Conjugate Gradient) and the time step for time integration is selected at 0.2 of the CFL (Courant–Friedrichs–Lewy) stability limit.
The flow solver has been rigorously validated across multiple test cases. It accurately reproduces the parabolic velocity profile in a circular pipe modelled with immersed boundaries. Furthermore, for complex geometries such as a regular cubic lattice of spheres, the computed velocity profiles align with experimental data from Suekane et al. [27] across a range of Reynolds numbers. The solver also reliably predicts pressure drop in gas flows through random packings of Raschig rings, showing agreement with empirical correlations provided the mesh is sufficiently refined and the flow remains laminar. See Ref. [24] for more details.

2.4. Calculation of the Residence Time

In order to calculate the residence time distribution, a widely used method has been employed, consisting of the advective transport of a passive marker (tracer) in the flow velocity field [28].
After the steady state has been reached, a fixed mass of the marker C (scalar field) enters the domain at the inlet plane (over the whole cross-section); then, it is passively advected through the random packing. The value of C in any cell changes between 0 and 1, the latter meaning that the whole cell volume is filled with the marker. The flux F ( t ) of the marker is traced at the bottom of the packed bed as a function of time. The function F ( t ) is then normalised by its integral over time:
p ( t ) = F ( t ) Δ t 0 F ( t ) d t ,
where Δ t is the fixed time step for the advection equation. The advection of the marker is performed with a variant of the Volume of Fluid (VOF) method described in Ref. [29], ensuring very good mass conservation and negligible numerical diffusion.
Function p ( t ) can be interpreted as the probability density function (PDF) of the residence time R T . The first and the second moment of p ( t ) corresponding to the expected value E ( t ) and variance V ( t ) of R T , respectively, are calculated from the standard formulae:
E ( t ) = 0 t p ( t ) d t , V ( t ) = 0 [ t E ( t ) ] 2 p ( t ) d t ,
while the standard deviation is found as σ ( t ) = V ( t ) .
In addition to these standard parameters, higher moments of p ( t ) may be of interest, e.g., skewness s:
s ( t ) = 1 σ 3 0 [ t E ( t ) ] 3 p ( t ) d t ,
or the reactor Péclet number P e r which for open–open systems can be derived from the formula [30,31]:
σ ( t ) E ( t ) 2 = 2 P e r + 8 P e r 2 .
Residence time R T is further normalised by the reference value t e = L / v e , where v e is so-called effective velocity, i.e., the average magnitude of flow velocity in the interstitial space of the random packing:
R T ¯ = R T t e = R T · v e L .
The value of t e equals the time a parcel of fluid would need to travel through the height of the whole packed bed along a virtual straight path parallel to the container’s axis with the effective velocity v e .

3. Results

3.1. Packed Bed Generation

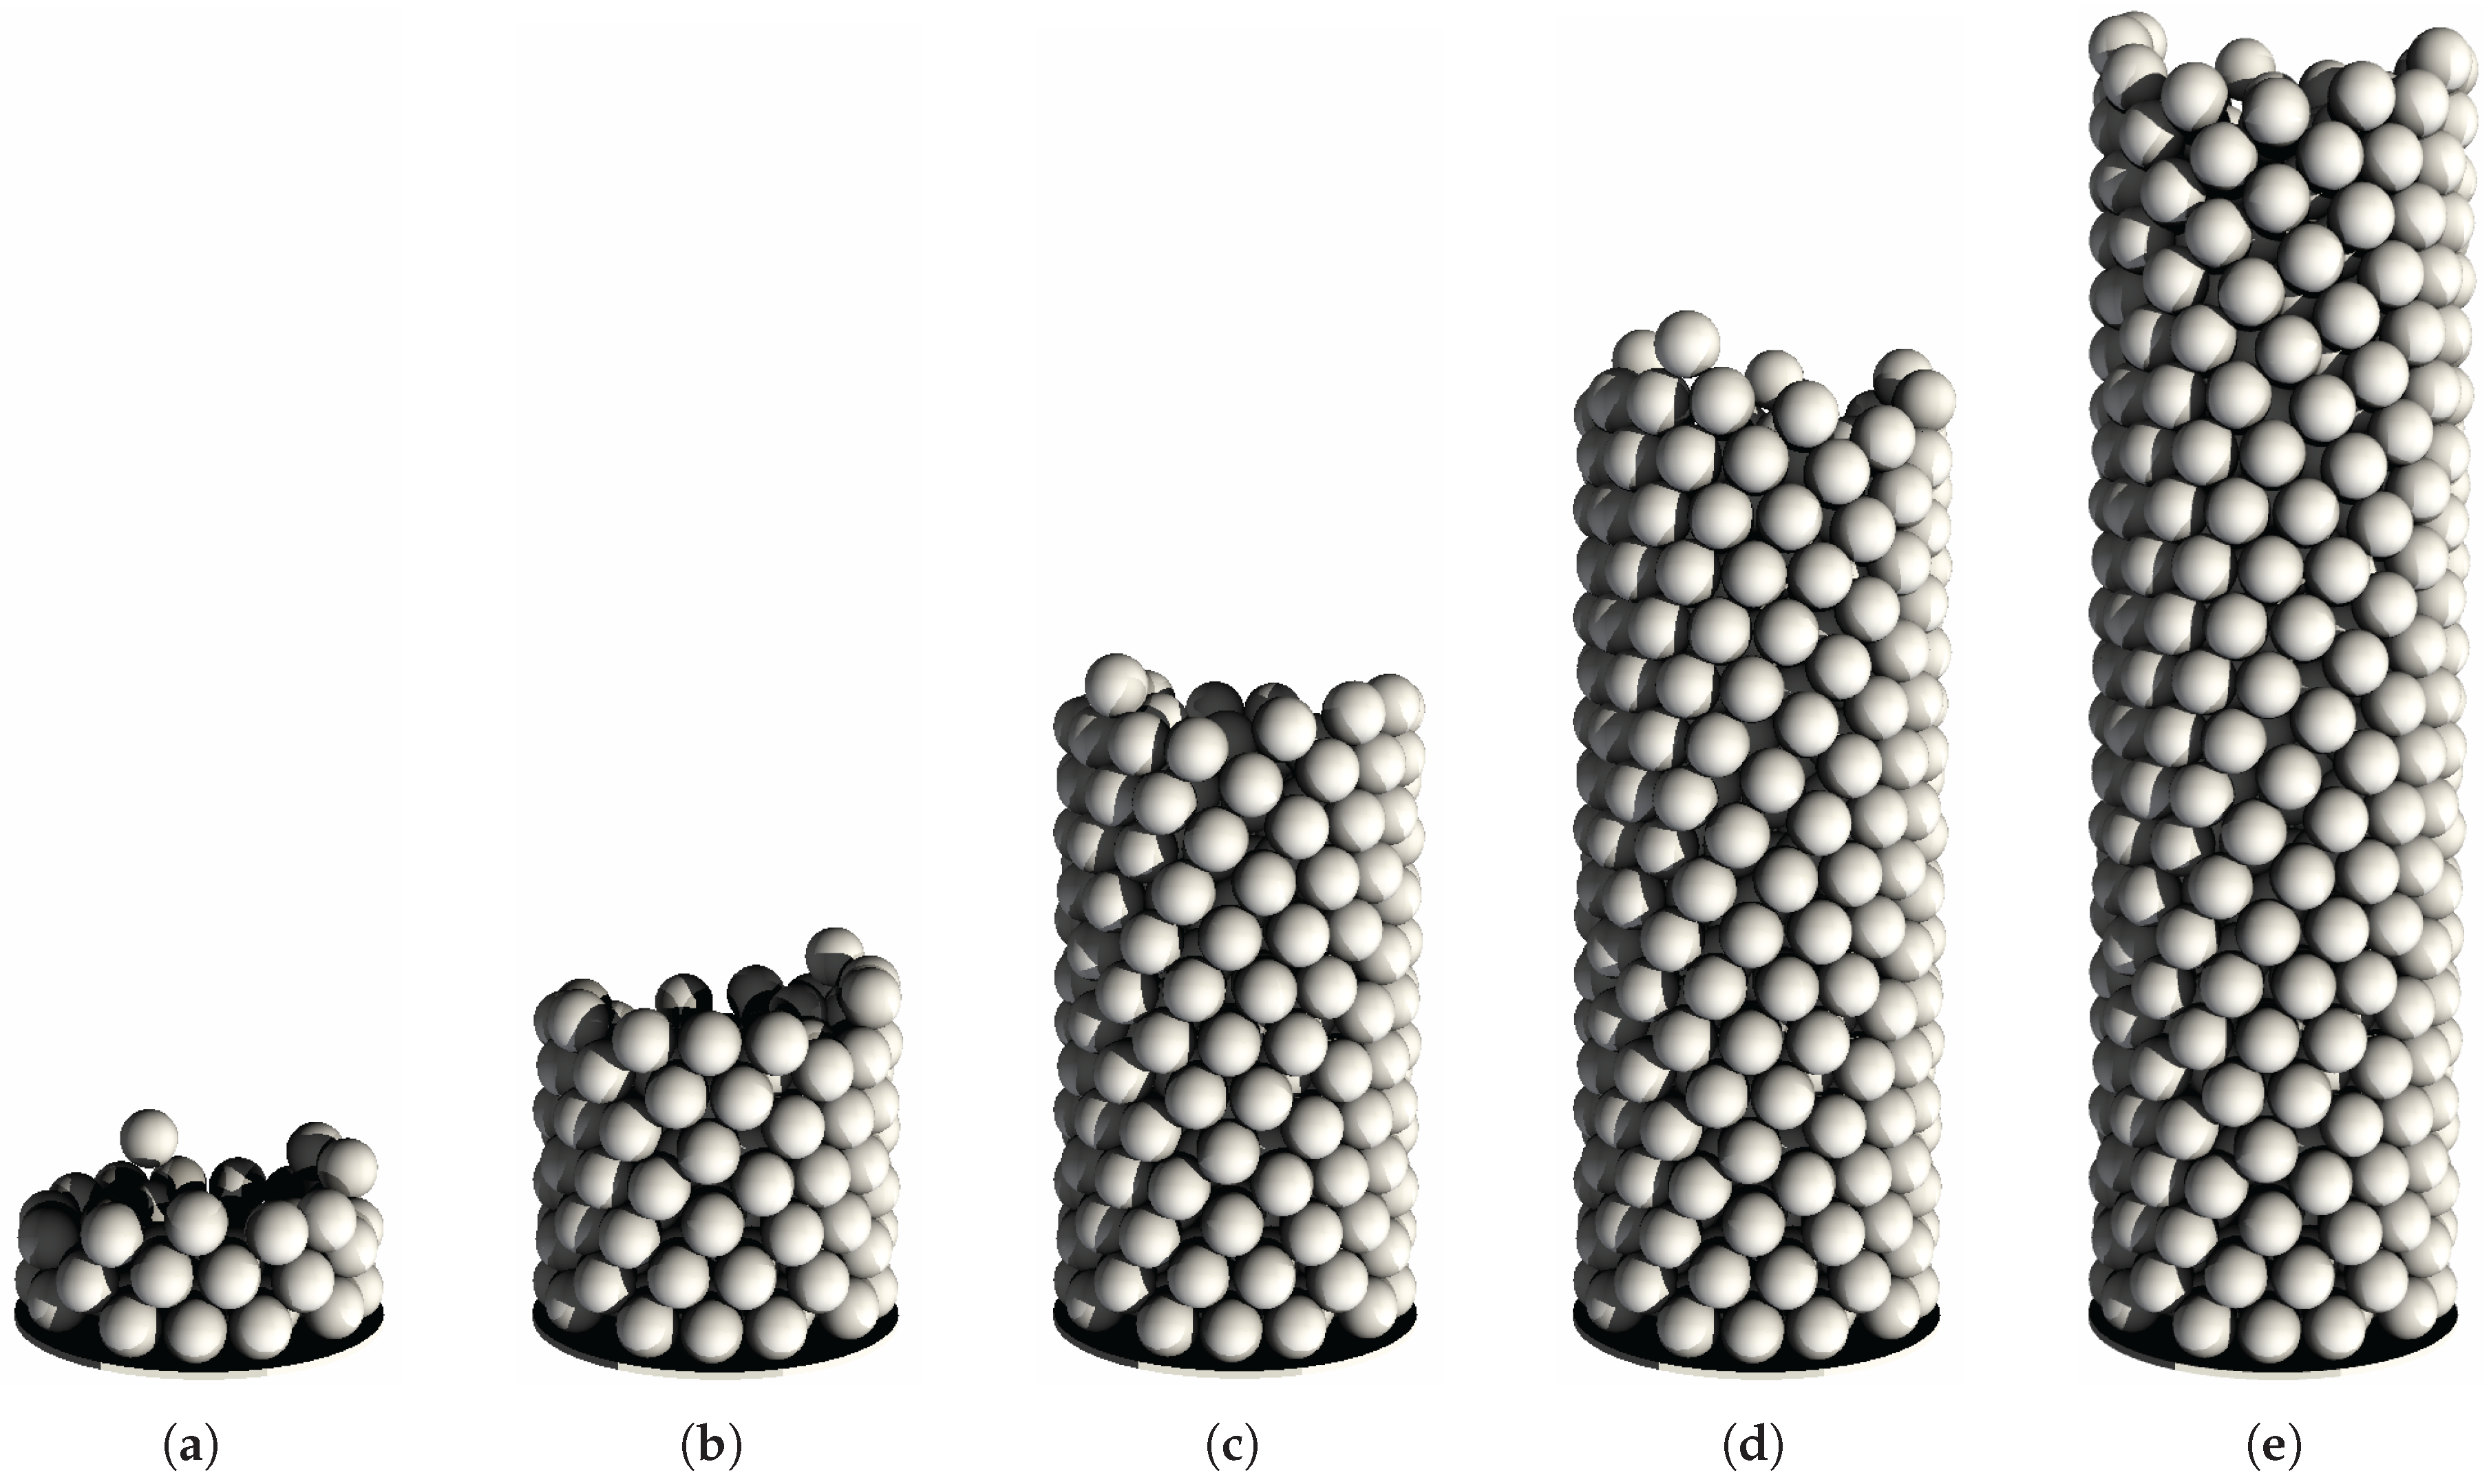
The structure of any random packing is highly influenced by the walls of the container, including the bottom plane. The range of the particle ordering induced by the walls (so-called wall effect) may extend to the distance of a few particle diameters [32]. Thus, in order to select a more representative section of the packing for the fluid flow simulation, a larger bed with 2000 particles was generated first, but then only a section of it was extracted to the flow domain. The lower part of the section was placed 0.15 m above the bottom plane of the original bed and the height of the section was taken as L = 0.3 m. The extracted part contained 373 spherical particles. The subsequent stages of the packing process are shown in Figure 2.
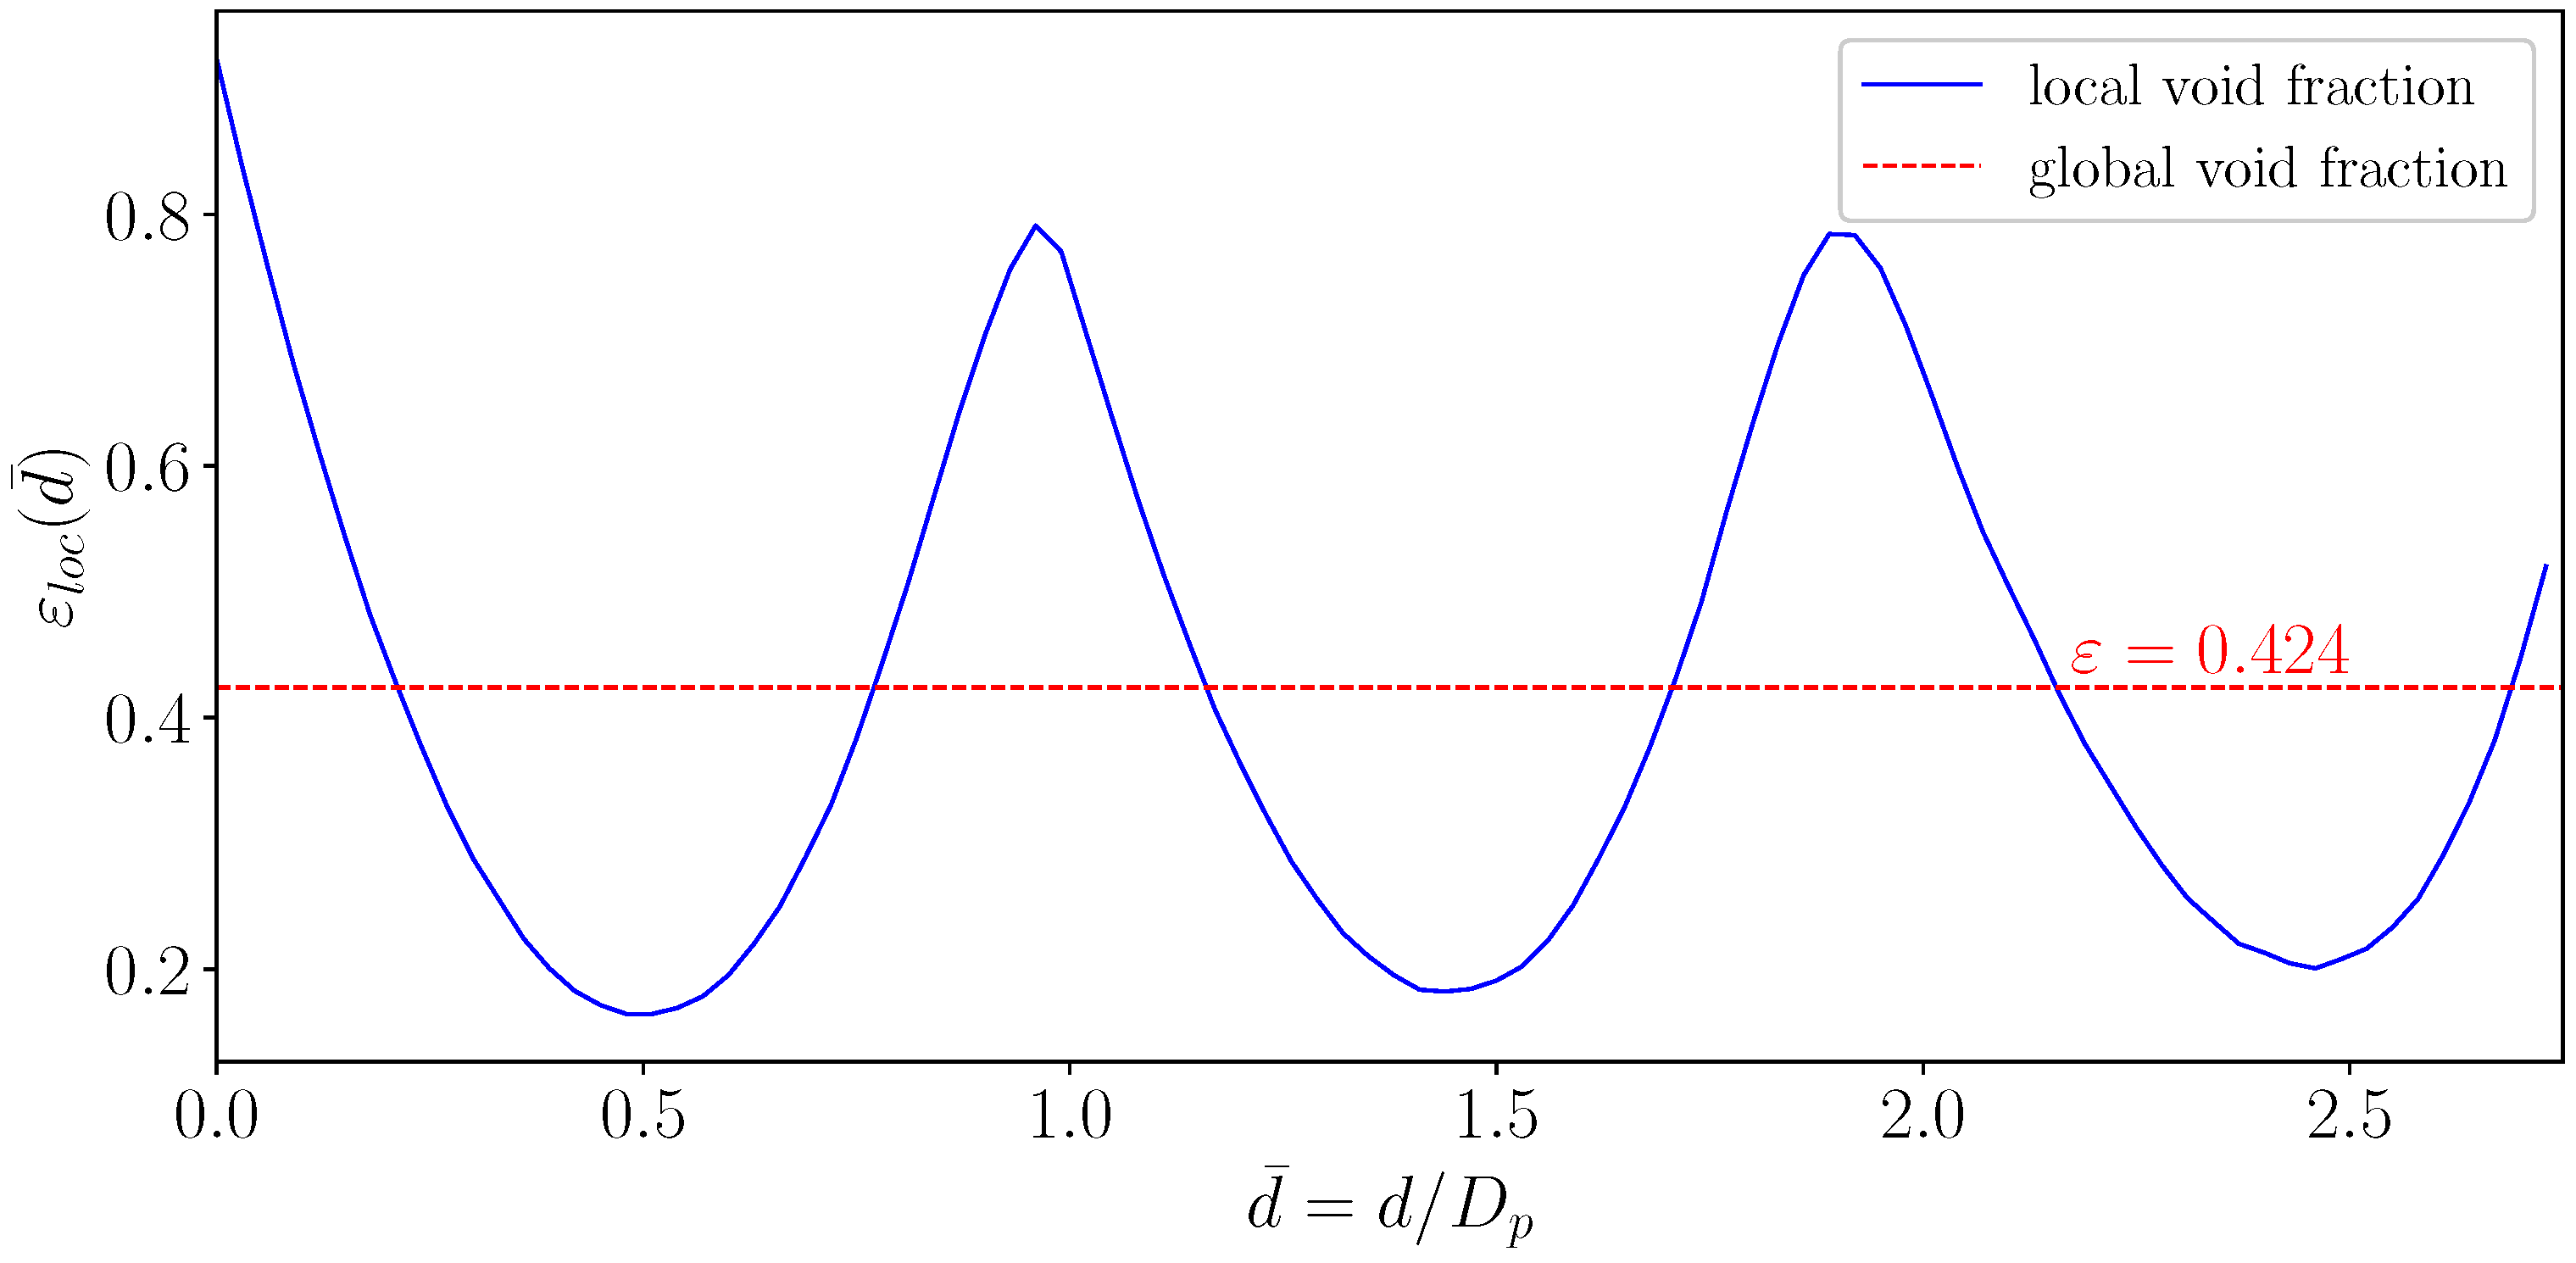
The ratio of the volume of the interstitial space V v o i d of the packed bed to the volume V P B of the section containing the packing, i.e., the void fraction   ε = V v o i d / V P B (also termed global porosity), was found as ε = 0.424 , in agreement with typical values of ε for loose random packings of spherical particles [33].
As the examined packed bed is relatively narrow ( D c / D p = 6 ), the wall effect dominates over the entire cross-section of the column. In consequence, the local void fraction ε l o c —calculated in a thin ring-like layer of width 0.1 D p in a normalised distance d ¯ = d / D p from the wall—is a highly oscillating function of d ¯ (see Figure 3). This oscillatory pattern reflects the distinct layers formed by the particles near the container wall.

3.2. Model Verification

The model has been validated in the reference case (without the flow deflector) by comparison of the pressure drop Δ p in the random packing with Ergun’s empirical formula [34] often used in the literature for this purpose:
Δ p L = ρ ( 1 ε ) v i n 2 D p ε 3 150 μ ( 1 ε ) D p ρ v i n + 1.75
First, the sensitivity of the results to the computational grid density has been tested. Setting the inlet velocity v i n to 0.01 m/s, the number of cells in x and z spanwise directions were taken successively as N x = N z = 60 , 80, 100, 120. The number of cells in the streamwise direction y were each time adjusted according to the ratio 2.8 of physical dimensions of the domain to keep the equilateral shape of a computational cell. As the results in Figure 4a show, the calculated pressure drop stabilises with sufficient accuracy around N x = N z = 100 ( N y = 280 ) and this resolution of the grid was selected for further computations. It should be noted that besides convergence, the limiting value is very close to the one obtained with Ergun’s formula.
Moreover, fixing the grid resolution ( 100 × 280 × 100 ), the dependence of the pressure drop on the inlet velocity has been examined for three different values of v i n : 0.005, 0.01, 0.015 [m/s]. The agreement with Ergun’s formula also found in this case can be considered as very satisfactory (Figure 4b).

3.3. Calculation of the Flow Velocity Field and the Structure Factor

For a fixed value of the inlet velocity ( v i n = 0.01 m/s), simulations of the fluid flow through the generated random packing have been performed for the reference case (without the deflector) and for three different pitches of the helix: λ = 1.5 D c , λ = 1.0 D c , and λ = 0.5 D c . After the steady-state was reached, the average magnitude of the flow velocity in the void spaces of the random packing (effective velocity v e ) was calculated. There is a simple but profound relation between the inlet velocity (here equal to the superficial velocity) and effective velocity v e [35,36]:
v e = v i n τ ε = v i n f w i t h f = ε τ ,
where τ is the tortuosity of the flow in the packed bed and f is, the so-called, structure factor [37].
Taking into account the previously found void fraction of the packing ( ε = 0.424 ), it is now possible to calculate the structure factor directly for each of the examined configurations. The results are presented in Table 1 together with the obtained tortuosity τ . This method of calculation of τ is similar in spirit to other approaches based on averaged characteristics of the velocity field [38].
The last column in Table 1 shows the Reynolds number R e (per case) based on the effective velocity and the particle diameter. Low values of R e confirm the laminar regime of the flow. Note that R e based on the superficial velocity would be significantly smaller.
As can be seen, the helical flow deflector enforces significant increase in the tortuosity but also in the effective velocity for a fixed value of the superficial velocity, which is the consequence of the incompressibility of the fluid and elongated flow paths across the random packing equipped with the deflector (see also [21]).
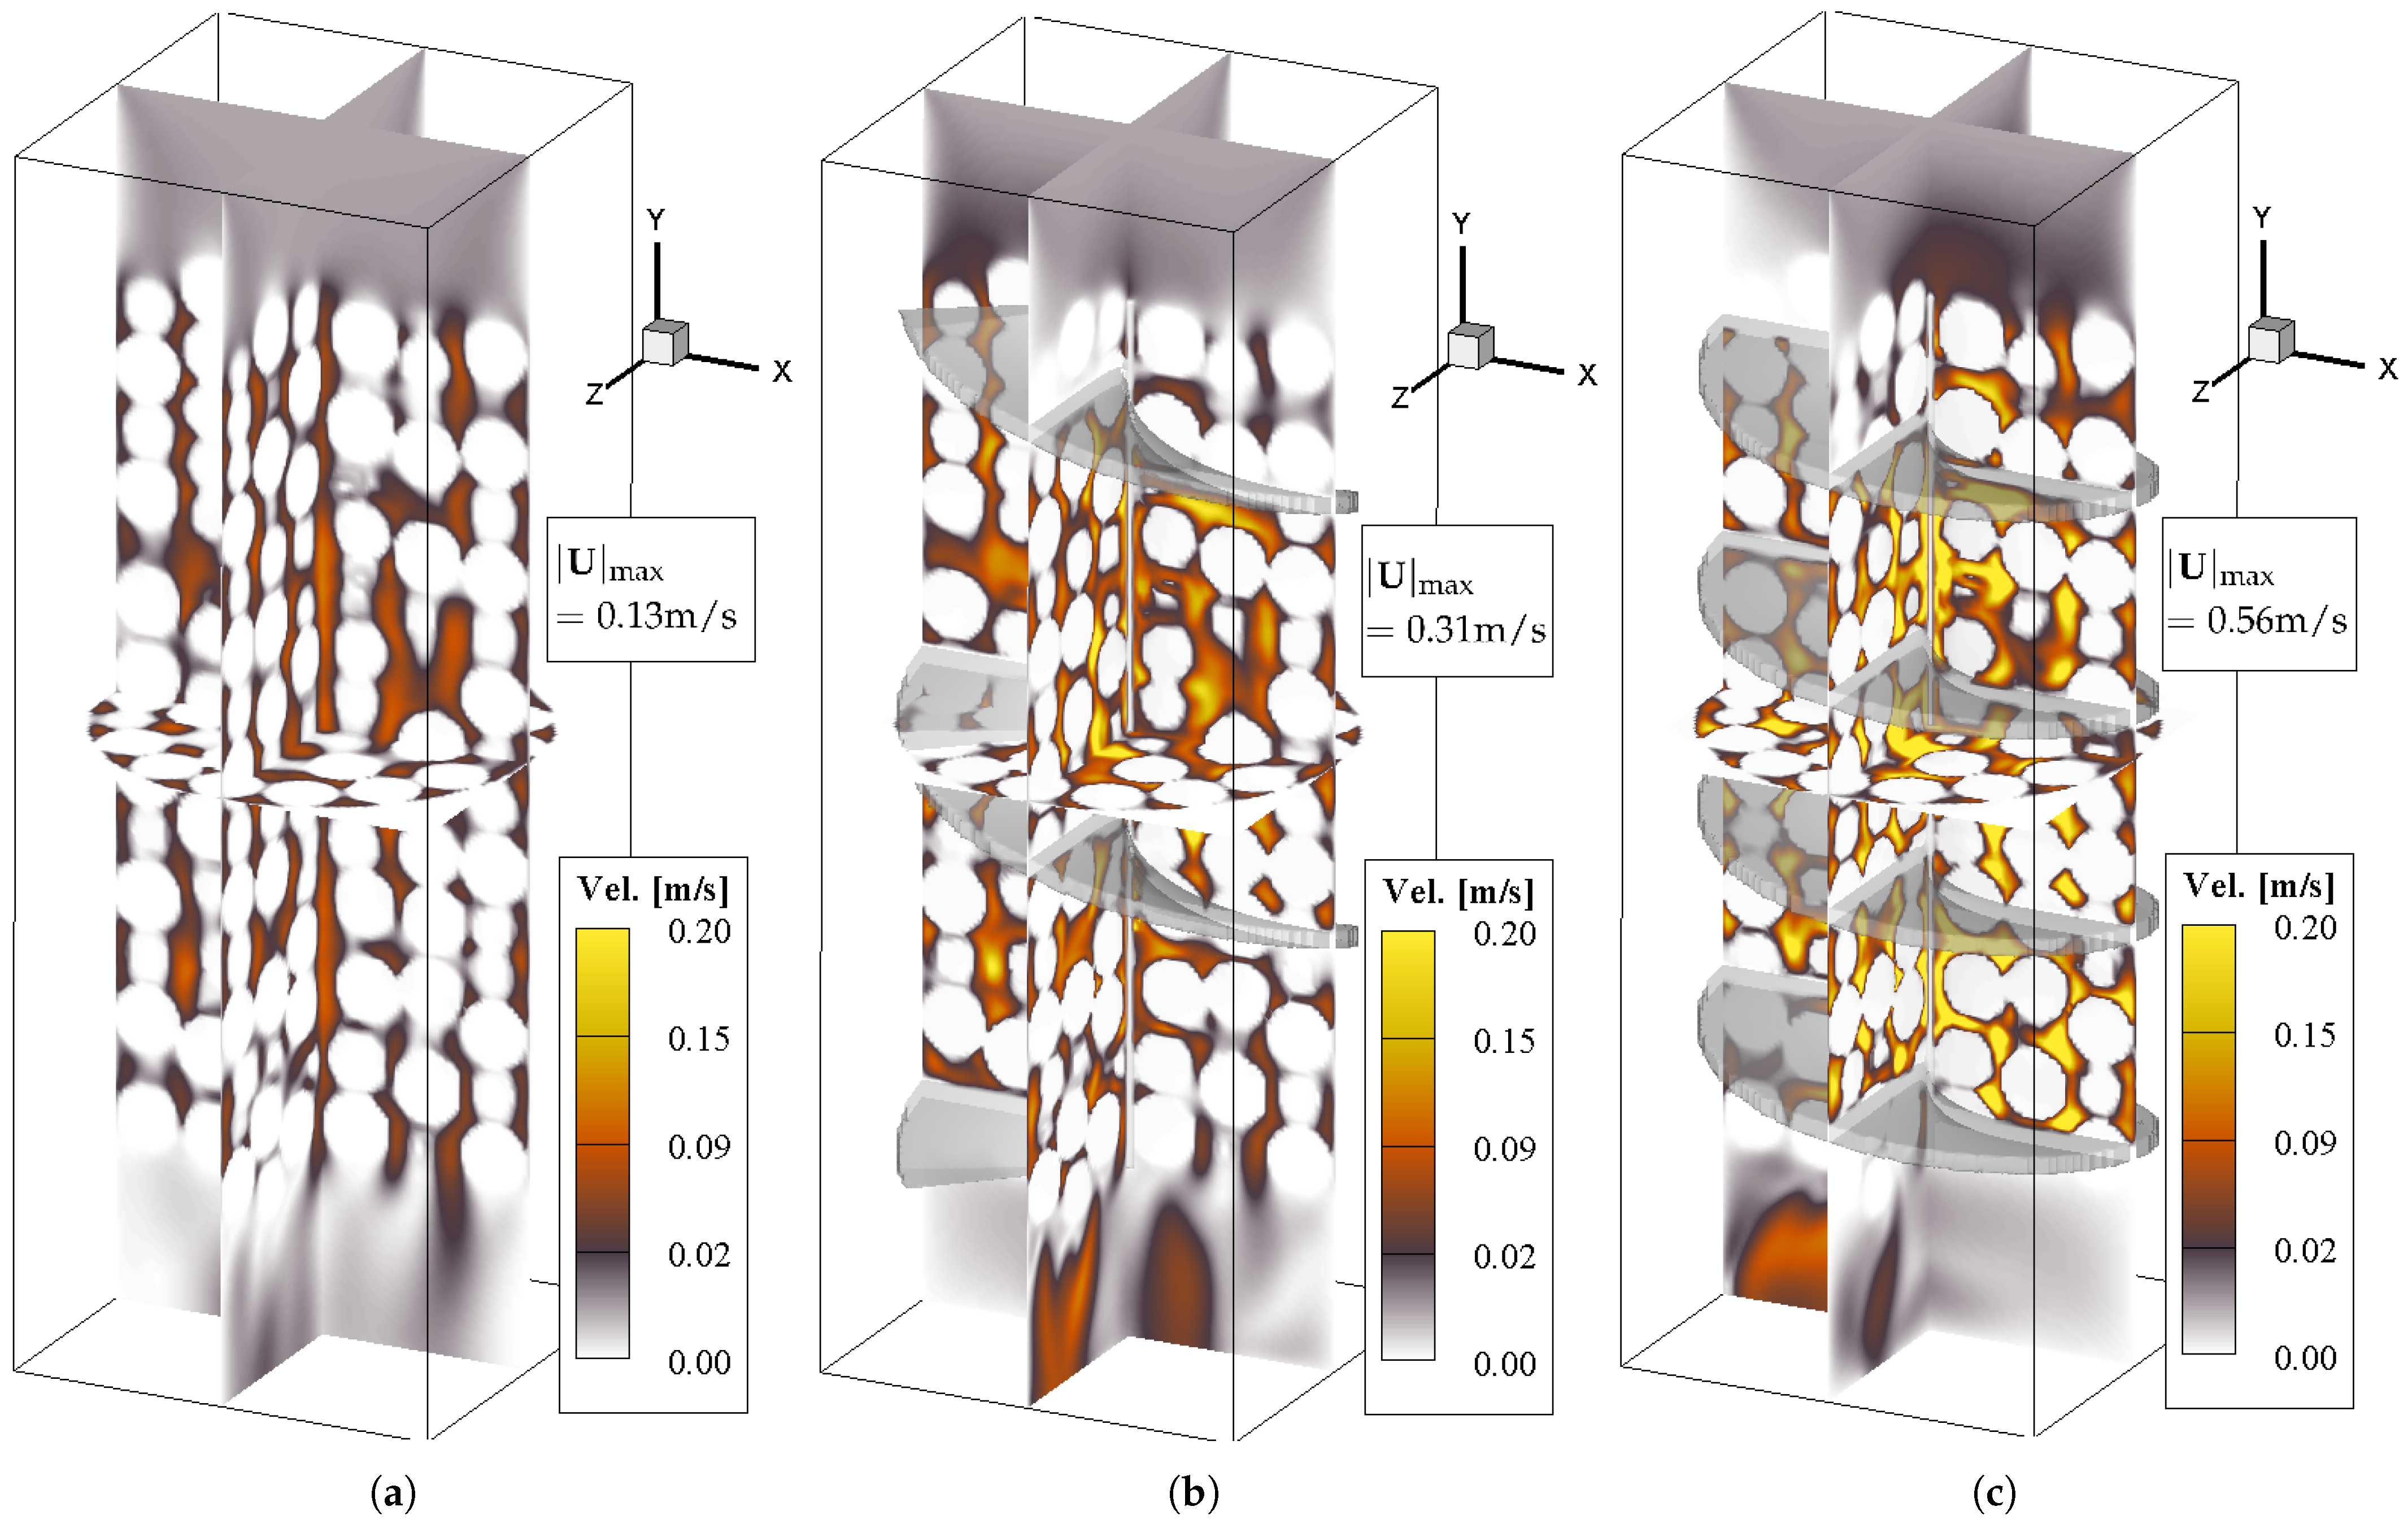
The distributions of the flow velocity magnitude | U | in various cut-planes of the computational domain for the reference case and λ = 1.0 D c , 0.5 D c are shown in Figure 5, which allows for assessment of the flow intensity in various parts of the column and the packing. For convenience of the comparison, the same colour scale has been assigned for the presented cases (range from 0 to 0.2 m/s). It must be emphasised, however, that the maximum values of | U | were different in each case—0.13 m/s for the reference case, 0.31 m/s for λ = 1.0 D c , and 0.56 m/s for λ = 0.5 D c . These maximum values were attained only in strictly localised parts of the packing.

3.4. Residence Time Analysis (RTD)

The RTD analysis was conducted by assuming a fixed effective velocity in the packed bed– v e = 0.05 m/s ( R e = 68 ), while the inlet velocity v in was adjusted based on the known structure factor f. This ensured that for all subsequently analysed cases, the reference time t e used to normalise the residence time R T remained constant and equal to t e = 6 s. For ease of interpreting the data presented further, it is worth noting that R T ¯ = 1 corresponds to a scenario where a fluid parcel travels along a straight path directly from the inlet plane of the bed to the outlet plane. Any value above 1 indicates an extended residence time within the packing compared to this virtual situation.
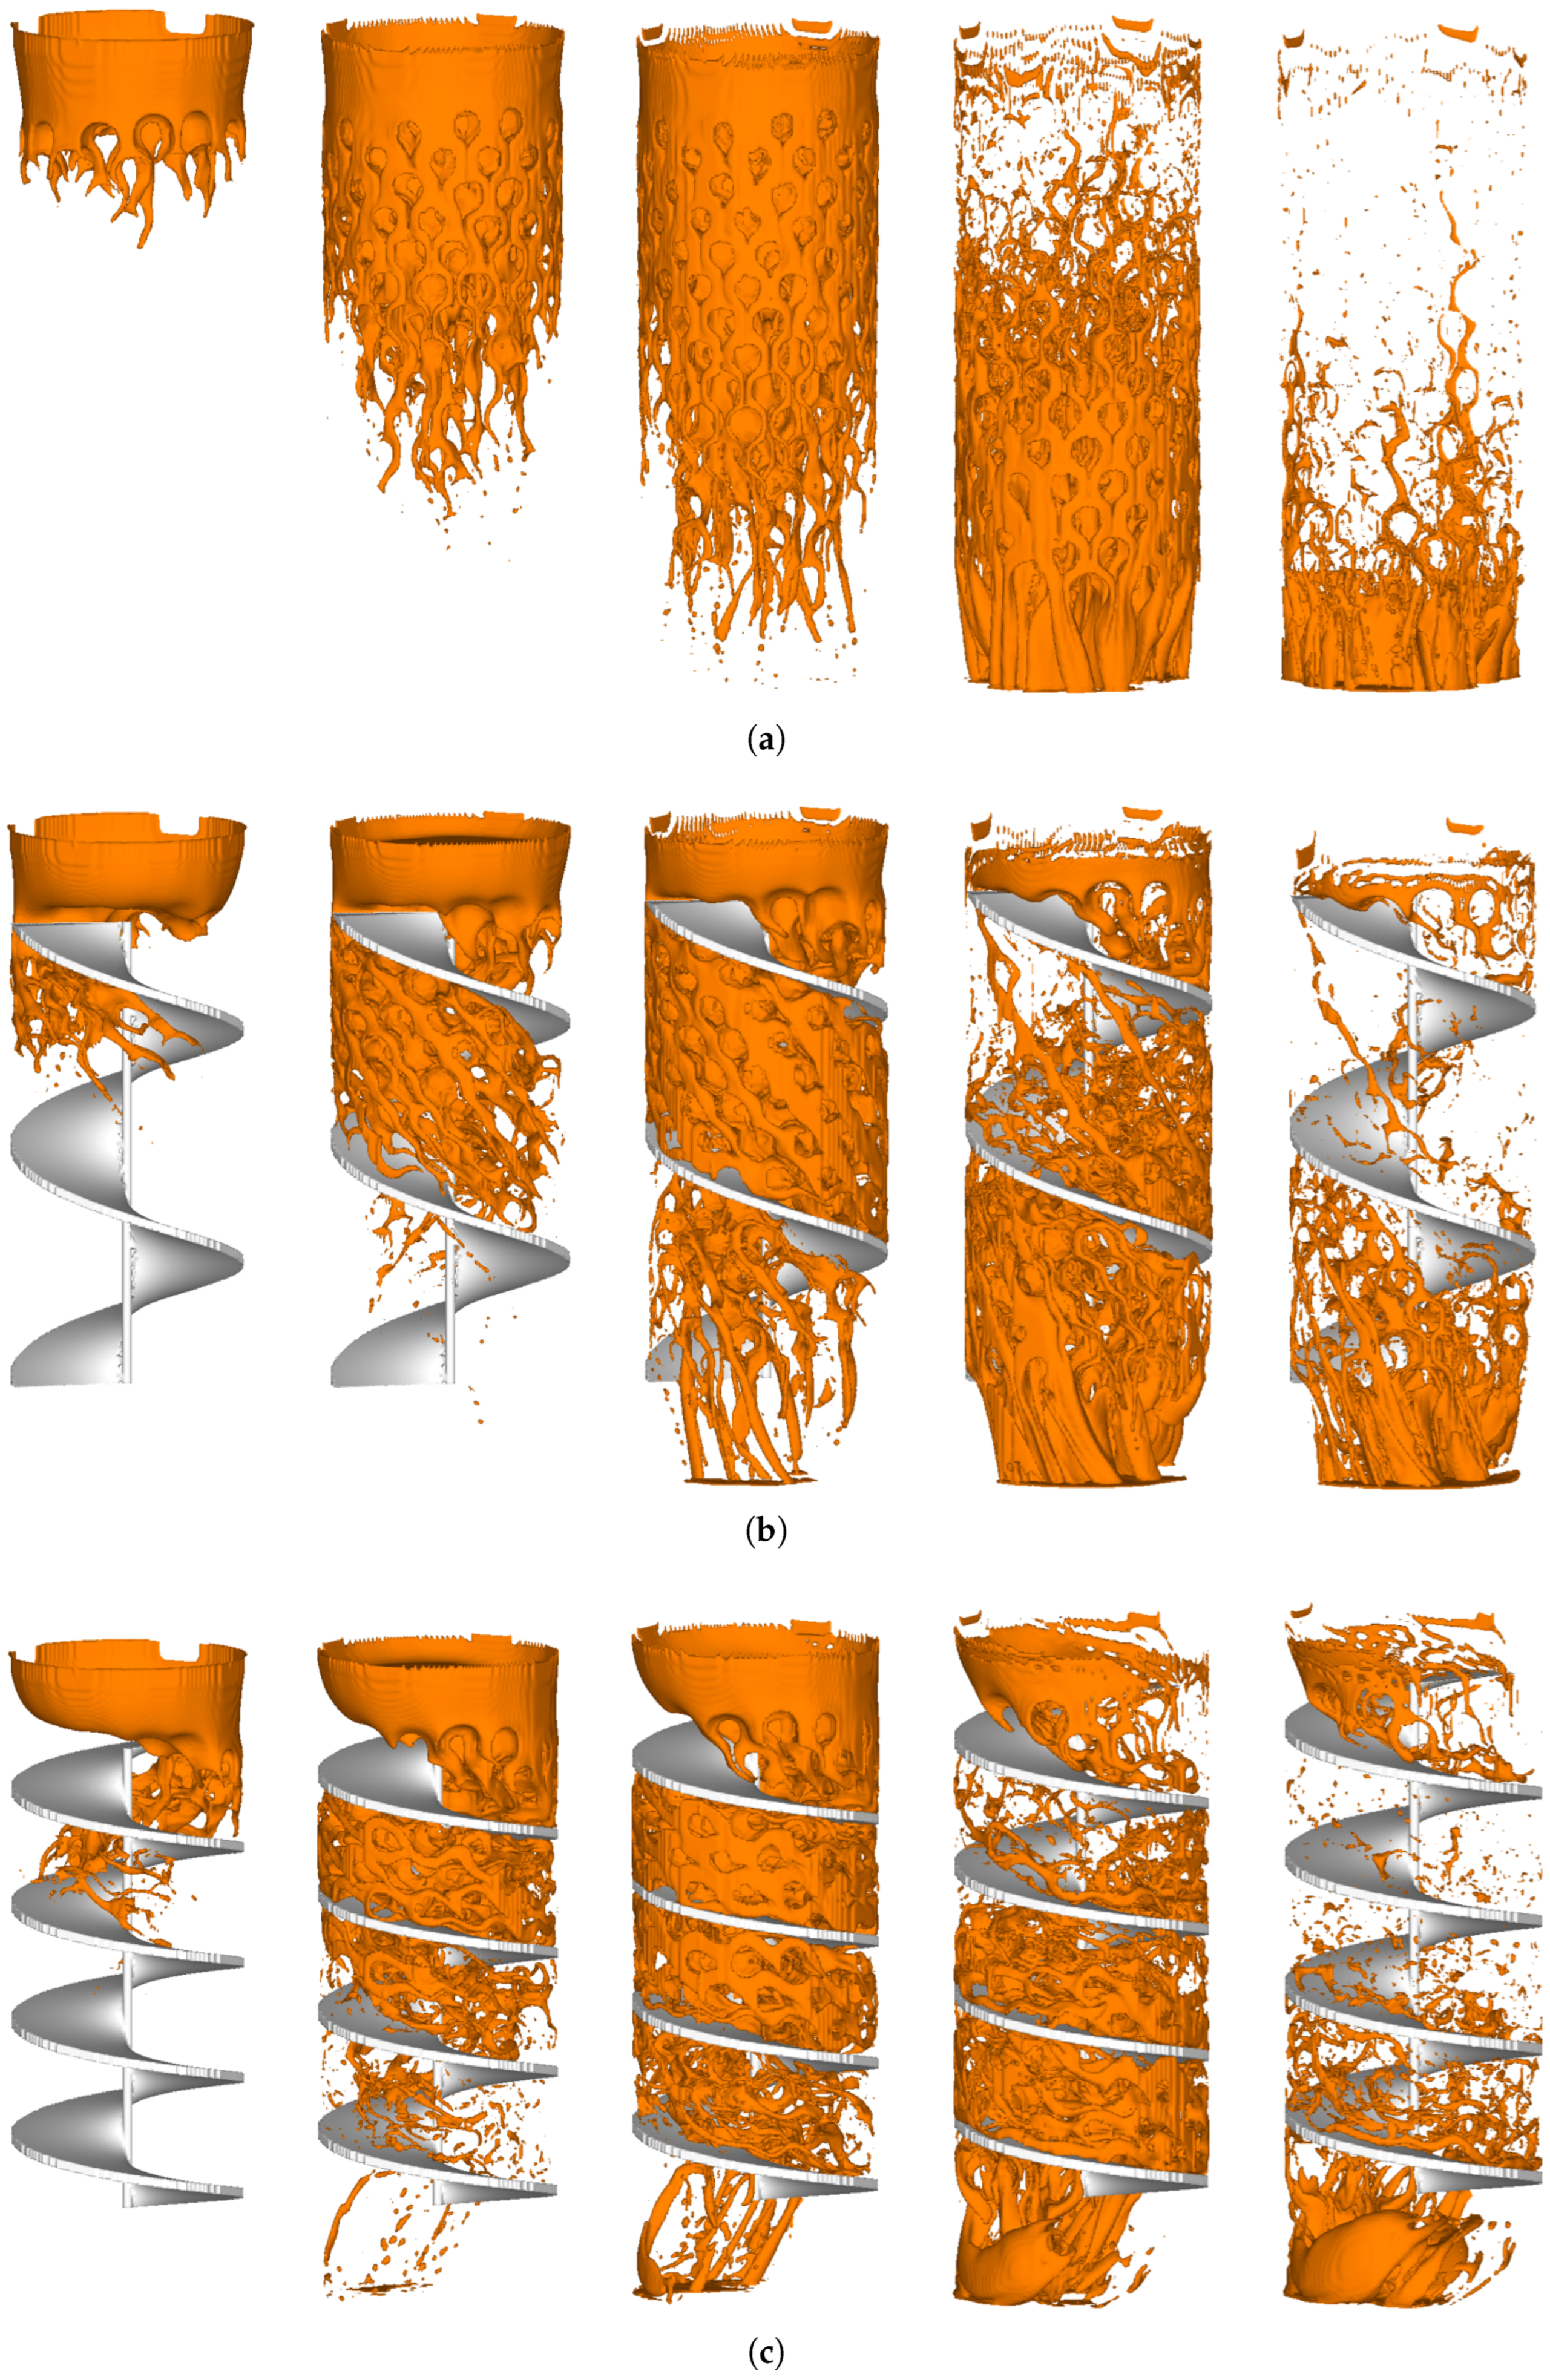
As mentioned in Section 2.4, the analysis is based on passive marker transport within a steady velocity field. The total volume V 0 of the marker injected into the domain throughout the entire simulation is equal to the volume of the inlet buffer zone: V 0 = π D c 2 L b , i n / 4 = 1.06 × 10 3 m3. Figure 6 illustrates exemplary distributions of marker iso-surfaces for the reference case (a), for λ = 1.0 D c (b), and λ = 0.5 D c (c), captured at several characteristic time intervals (note that these time points differ across cases).
The sequences span from the moment the marker enters the bed until the majority of the traced mass has left the packing. The figure reveals certain preferential pathways where the marker is transported with notably higher efficiency, as well as others where transport is less effective. Consequently, when monitoring the flux F ( t ) at the bed outlet, a small fraction of the marker appears relatively early, followed by the bulk flow delivering the peak flux, and finally, after a prolonged period, the remnants of the marker from less significant pathways leave the packed bed. The resulting marker flux plot (Figure 7) thus exhibits a characteristic structure with a distinct maximum and a Gaussian-like bell-shaped curve. As previously described, this curve is normalised such that the area under it equals 1 and the curve may represent the probability density p ( t ) . Additionally, R T = t t b , where t b denotes the time at which the marker reaches the inlet plane of the bed. Since the marker is introduced at the inlet plane of the computational domain, this time varies across cases, but R T ¯ = 0 in Figure 7 always corresponds to the moment when the marker enters the packed bed.
In the reference case, the expected value of R T ¯ , denoted as E ( R T ¯ ) , reaches 1.4, a value only slightly higher than 1, attributable solely to the inherent flow tortuosity within a random arrangement of spheres. This is typical for reactors with RPBs without flow deflectors. Note that the obtained RTD curves deviate only marginally from a symmetrical shape, so the peak R T ¯ values remain relatively close to the expected values.
The situation changes after introducing the flow deflector. As anticipated, the expected value of R T ¯ increases to 1.86 for the deflector with the largest analysed λ , up to a multiple increase (more than threefold) for the smallest λ . Along with the increase in the expected value, there is also an increase in the standard deviation of R T ¯ , denoted as σ ( R T ¯ ) , which is clearly visible in Figure 7, where the shift of the curve maxima to higher values is accompanied by a broadening of the bell-shaped curves. Detailed data, including comparisons with the reference case, are presented in Table 2.
Table 3 contains additional information regarding the inlet velocity v i n (per case, adjusted to keep v e fixed) and also other characteristics of R T D s : skewness s and P e r —calculated from Equations (5) and (6).
Alongside with the residence time analysis, the pressure drop Δ p for each case has also been calculated. The results and the corresponding ratios with respect to the reference case are shown in Table 4.
Based on the results for E ( R T ¯ ) / E ( R T ¯ ) r e f , σ ( R T ¯ ) / σ ( R T ¯ ) r e f , and Δ p / Δ p r e f , simple correlations may be derived as functions of the helix pitch λ :
E ( R T ¯ ) E ( R T ¯ ) r e f = 0.37 + 1.36 D c λ , σ ( R T ¯ ) σ ( R T ¯ ) r e f = 1.07 + D c λ , Δ p Δ p r e f = 0.47 + 1.9 D c λ ,
with correlation coefficients r of 0.996, 0.995, and 0.9986, respectively. The rational functional form was chosen based on the expected divergence of each quantity as λ 0 . Note, however, the limited scope of the correlations: laminar flow regime, spherical particles, and particular container-to-particle diameter ratio ( D c / D p = 6 ).

4. Discussion

The obtained results clearly demonstrate a significant influence of the helical deflector on the flow characteristics within the packed bed. As anticipated, the deflector induces global changes in flow tortuosity, which in the reference case was determined solely by the random particle packing (typical tortuosity for a spherical packing is τ 1.2 coinciding with the value in Table 1). Even a deflector with large pitch λ = 1.5 D c noticeably increases both the tortuosity and residence time ( R T ), with the effect becoming particularly pronounced for small pitches, where nearly a 3.5-fold increase is observed.
At constant effective velocity, the increase in tortuosity correlates with longer residence times, where the relative increase in R T ¯ closely follows (though remains slightly smaller than) the relative increase in tortuosity.
Unlike the expected value and variance of the residence time, which increase monotonically with decreasing λ , the skewness and the reactor Péclet number exhibit more complex, non-monotonic behaviour. Notably, the lowest helix pitch results in particularly low skewness.
Beyond increasing R T ¯ due to extended fluid parcel path lengths, the implementation of the helical deflector predictably leads to higher pressure drops. However, this effect is less pronounced than in the previous study [21], where maintaining constant superficial velocity meant that reduced helix pitch also increased effective velocity. Notably, the relative pressure drop increase also in the present study exceeds the relative tortuosity increase.
Several study limitations should be acknowledged. First, the deflector was modelled as a fixed, independent structure within the RPB. In practice, particles would be packed around the deflector strongly restricting the packing density. This would lead to less efficient particle packing near the helical surface and induce wall-ordering effects [32], potentially causing greater discrepancies at very small pitches. The looser packing near the helical surface might create preferential flow channels, similar to the ones near the container’s wall.
Additionally, simulations were conducted at relatively low flow velocities. This avoided modelling turbulent effects, which for complex geometries like RPB cannot properly capture the underlying physics. Lower velocities also facilitated computational convergence, whereas higher velocities would require more pressure solver iterations, finer computational grid to resolve smaller flow structures, and handling of transient flow features. Although the obtained absolute values might vary at higher velocities, the relative ratios to the reference case are expected to remain consistent.
Future work will focus on studying the effects of higher flow velocities and constrained particle packing around helical structures.

5. Conclusions

This numerical study demonstrates the effectiveness of a helical deflector as an independent structure within a random packed bed of spherical particles. The deflector significantly increases flow tortuosity and residence time for the same effective velocity, with both effects strongly dependent on the helix pitch. Additional effects include the following: (a) relative increase in the standard deviation of the residence time similar to the expected value gain; (b) the pressure drop rise exceeds the relative increase in tortuosity.
The results highlight the need for further research under more realistic conditions, where particles are packed around the deflector surface. Future work should address consequences such as reduced local packing density due to the additional constraint and preferential flow channels near the deflector.

Supplementary Materials

The supporting information and datasets can be downloaded at the following: https://doi.org/10.5281/zenodo.16938156 (accessed on 25 August 2025).

Funding

The investigation was supported by the Polish National Science Centre under Grant No. UMO-2023/51/B/ST8/01624. The partial support from the statutory research funds BS/PB 100-301/2025/P is also acknowledged.

Data Availability Statement

The original contributions presented in this study are included in the article/Supplementary Materials. Further inquiries can be directed to the author.

Conflicts of Interest

The author declares no conflicts of interest.

Abbreviations

The following abbreviations are used in this manuscript:
BCBoundary Condition
CFLCourant–Friedrichs–Lewy
IBMImmersed Boundary Method
ICPCGIncomplete Cholesky Preconditioned Conjugate Gradient
MACMarker and Cell
PDFProbability Density Function
RPBRandom Packed Bed
RTResidence Time
RTDResidence Time Distribution
TBRTrickle Bed Reactor
VOFVolume of Fluid

References

  1. Klenov, O.P.; Noskov, A.S. Influence of input conditions on the flow distribution in trickle bed reactors. Chem. Eng. J. 2020, 382, 122806. [Google Scholar] [CrossRef]
  2. White, J.P.; Chamberlain, T.W.; Bourne, R.A.; Taylor, D.; Brennan, C.; Muller, F.L. Decoupling the relative rate of hydrogen uptake via convection and mass transfer by a single catalytic pellet in a scaled down trickle bed reactor. Chem. Eng. J. 2020, 394, 124290. [Google Scholar] [CrossRef]
  3. Asimakopoulos, K.; Lezyk, M.; Grimalt-Alemany, A.; Melas, A.; Wen, Z.; Gavala, H.N.; Skiadas, I.V. Temperature effects on syngas biomethanation performed in a trickle bed reactor. Chem. Eng. J. 2020, 393, 124739. [Google Scholar] [CrossRef]
  4. Guo, R.; Wei, B.; Liu, H.; Shi, X.; Lan, X.; Gao, J. Study on liquid dispersion characteristics in trickle bed reactor based on image processing. Fuel 2023, 351, 128912. [Google Scholar] [CrossRef]
  5. Liu, M.; Steven Tay, N.; Bell, S.; Belusko, M.; Jacob, R.; Will, G.; Saman, W.; Bruno, F. Review on concentrating solar power plants and new developments in high temperature thermal energy storage technologies. Renew. Sustain. Energy Rev. 2016, 53, 1411–1432. [Google Scholar] [CrossRef]
  6. Gautam, A.; Saini, R.P. Thermal and hydraulic characteristics of packed bed solar energy storage system having spheres as packing element with pores. J. Energy Storage 2020, 30, 101414. [Google Scholar] [CrossRef]
  7. Hoffmann, A.; Ausner, I.; Repke, J.U.; Wozny, G. Fluid dynamics in multiphase distillation processes in packed towers. Comput. Chem. Eng. 2005, 29, 1433–1437. [Google Scholar] [CrossRef]
  8. Li, X.; Yang, X.; Li, H.; Shi, Q.; Gao, X. Significantly enhanced vapor-liquid mass transfer in distillation process based on carbon foam ring random packing. Chem. Eng. Process. Process. Intensif. 2018, 124, 245–254. [Google Scholar] [CrossRef]
  9. Billet, R. Packed Towers; VCH Verlagsgesellschaft mbH: Weinheim, Germany, 1995. [Google Scholar]
  10. Maćkowiak, J. Fluid Dynamics of Packed Columns; Springer: Berlin/Heidelberg, Germany,, 2010. [Google Scholar]
  11. Arthus, L.; Angeli, A.P.; Wolf Maciel, M.R.; Fregolente, L.V. Optimized continuous flow water removal from biodiesel and diesel (B15) using Raschig ring-shaped polyacrylamide/cellulose microfibrils hydrogels in fixed-bed columns. Fuel 2026, 404, 136332. [Google Scholar] [CrossRef]
  12. Wu, Z.; Guo, Z.; Yang, J.; Wang, Q. Numerical investigation of methane steam reforming in packed bed reactor with internal helical heat fins. Energy 2023, 278, 127988. [Google Scholar] [CrossRef]
  13. Jurtz, N.; Flaischlen, S.; Scherf, S.C.; Kraume, M.; Wehinger, G.D. Enhancing the Thermal Performance of Slender Packed Beds through Internal Heat Fins. Processes 2020, 8, 1528. [Google Scholar] [CrossRef]
  14. Xu, Y.H.; Xu, H.Z.; Li, Y.B.; Chu, G.W.; Chen, J.F. Mitigating gas maldistribution in a cross-flow rotating packed bed via optimizing guide baffle structures. Chem. Eng. Process.-Process. Intensif. 2025, 213, 110317. [Google Scholar] [CrossRef]
  15. Bang, Y.M.; Cho, C.P.; Jung, Y.; Park, S.R.; Kim, J.G.; Park, S. Thermal and flow characteristics of a cylindrical superheated steam generator with helical fins. Energy 2023, 267, 126599. [Google Scholar] [CrossRef]
  16. Pidaparthi, B.; Missoum, S.; Xu, B.; Li, P. Helical Fins for Concentrated Solar Receivers: Design Optimization and Entropy Analysis. J. Energy Resour. Technol. 2023, 145, 121706. [Google Scholar] [CrossRef]
  17. Zaboli, M.; Mousavi Ajarostaghi, S.S.; Saedodin, S.; Kiani, B. Hybrid nanofluid flow and heat transfer in a parabolic trough solar collector with inner helical axial fins as turbulator. Eur. Phys. J. Plus 2021, 136, 841. [Google Scholar] [CrossRef]
  18. Amini, R.; Amini, M.; Jafarinia, A.; Kashfi, M. Numerical investigation on effects of using segmented and helical tube fins on thermal performance and efficiency of a shell and tube heat exchanger. Appl. Therm. Eng. 2018, 138, 750–760. [Google Scholar] [CrossRef]
  19. Zhang, L.; Du, W.; Wu, J.; Li, Y.; Xing, Y. Fluid flow characteristics for shell side of double-pipe heat exchanger with helical fins and pin fins. Exp. Therm. Fluid Sci. 2012, 36, 30–43. [Google Scholar] [CrossRef]
  20. Sivalakshmi, S.; Raja, M.; Gowtham, G. Effect of helical fins on the performance of a double pipe heat exchanger. Mater. Today Proc. 2021, 43, 1128–1131. [Google Scholar] [CrossRef]
  21. Marek, M. Numerical modelling of gas flow in a random packed bed with a helical flow deflector. J. Phys. Conf. Ser. 2024, 2899, 012007. [Google Scholar] [CrossRef]
  22. Marek, M. Numerical generation of a fixed bed structure. Chem. Process. Eng. 2013, 34, 347–359. [Google Scholar] [CrossRef]
  23. Chorin, A.J. Numerical solution of the Navier-Stokes equations. Math. Comput. 1968, 22, 745–762. [Google Scholar] [CrossRef]
  24. Marek, M. Numerical simulation of a gas flow in a real geometry of random packed bed of Raschig rings. Chem. Eng. Sci. 2017, 161, 382–393. [Google Scholar] [CrossRef]
  25. Marek, M. Gas flow maldistribution in random packed beds of non-spherical particles–A CFD study. Chem. Eng. Sci. 2019, 197, 296–305. [Google Scholar] [CrossRef]
  26. Niegodajew, P.; Durajski, A.P.; Rajca, P.; Gruszka, K.M.; Marek, M. Experimental and numerical study on the orientation distribution of cylindrical particles in random packed beds. Chem. Eng. J. 2022, 432, 134043. [Google Scholar] [CrossRef]
  27. Suekane, T.; Yokouchi, Y.; Hirai, S. Inertial Flow Structures in a Simple-Packed Bed of Spheres. AIChE J. 2003, 49, 10–17. [Google Scholar] [CrossRef]
  28. Jaworski, T.; Wajda, A.; Kus, L. Model of Residence Time Distribution, Degree of Mixing and Degree of Dispersion in the Biomass Transport Process on Various Grate Systems. Energies 2023, 16, 5672. [Google Scholar] [CrossRef]
  29. Marek, M.; Aniszewski, W.; Boguslawski, A. Simplified Volume of Fluid Method (SOF) for two-phase flows. TASK Q. 2008, 12, 255–265. [Google Scholar]
  30. Fogler, H.S. Elements of Chemical Reaction Engineering, 5th ed.; Prentice Hall: Boston, MA, USA, 2016. [Google Scholar]
  31. Yang, N.; Xiao, Z.; Liu, H.; Jiang, J.; Liu, F.; Yang, X.; Wang, R. Effect of annulus ratio on the residence time distribution and Péclet number in micro/milli-scale reactors. Can. J. Chem. Eng. 2025, 103, 899–913. [Google Scholar] [CrossRef]
  32. Gorman, J.M.; Zheng, A.; Sparrow, E.M. Bounding wall effects on fluid flow and pressure drop through packed beds of spheres. Chem. Eng. J. 2019, 373, 519–530. [Google Scholar] [CrossRef]
  33. von Seckendorff, J.; Achterhold, K.; Pfeiffer, F.; Fischer, R.; Hinrichsen, O. Experimental and numerical analysis of void structure in random packed beds of spheres. Powder Technol. 2021, 380, 613–628. [Google Scholar] [CrossRef]
  34. Ergun, S. Fluid Flow Through Packed Columns. Chem. Eng. Prog. 1952, 48, 89–92. [Google Scholar]
  35. Carman, P.C. Fluid flow through granular beds. Trans.-Inst. Chem. Eng. 1937, 15, 150–166. [Google Scholar] [CrossRef]
  36. Epstein, N. On tortuosity and the tortuosity factor in flow and diffusion through porous media. Chem. Eng. Sci. 1989, 44, 777–779. [Google Scholar] [CrossRef]
  37. Pisani, L. Simple Expression for the Tortuosity of Porous Media. Transp. Porous Med. 2011, 88, 193–203. [Google Scholar] [CrossRef]
  38. Duda, A.; Koza, Z.; Matyka, M. Hydraulic tortuosity in arbitrary porous media flow. Phys. Rev. E 2011, 84, 036319. [Google Scholar] [CrossRef] [PubMed]
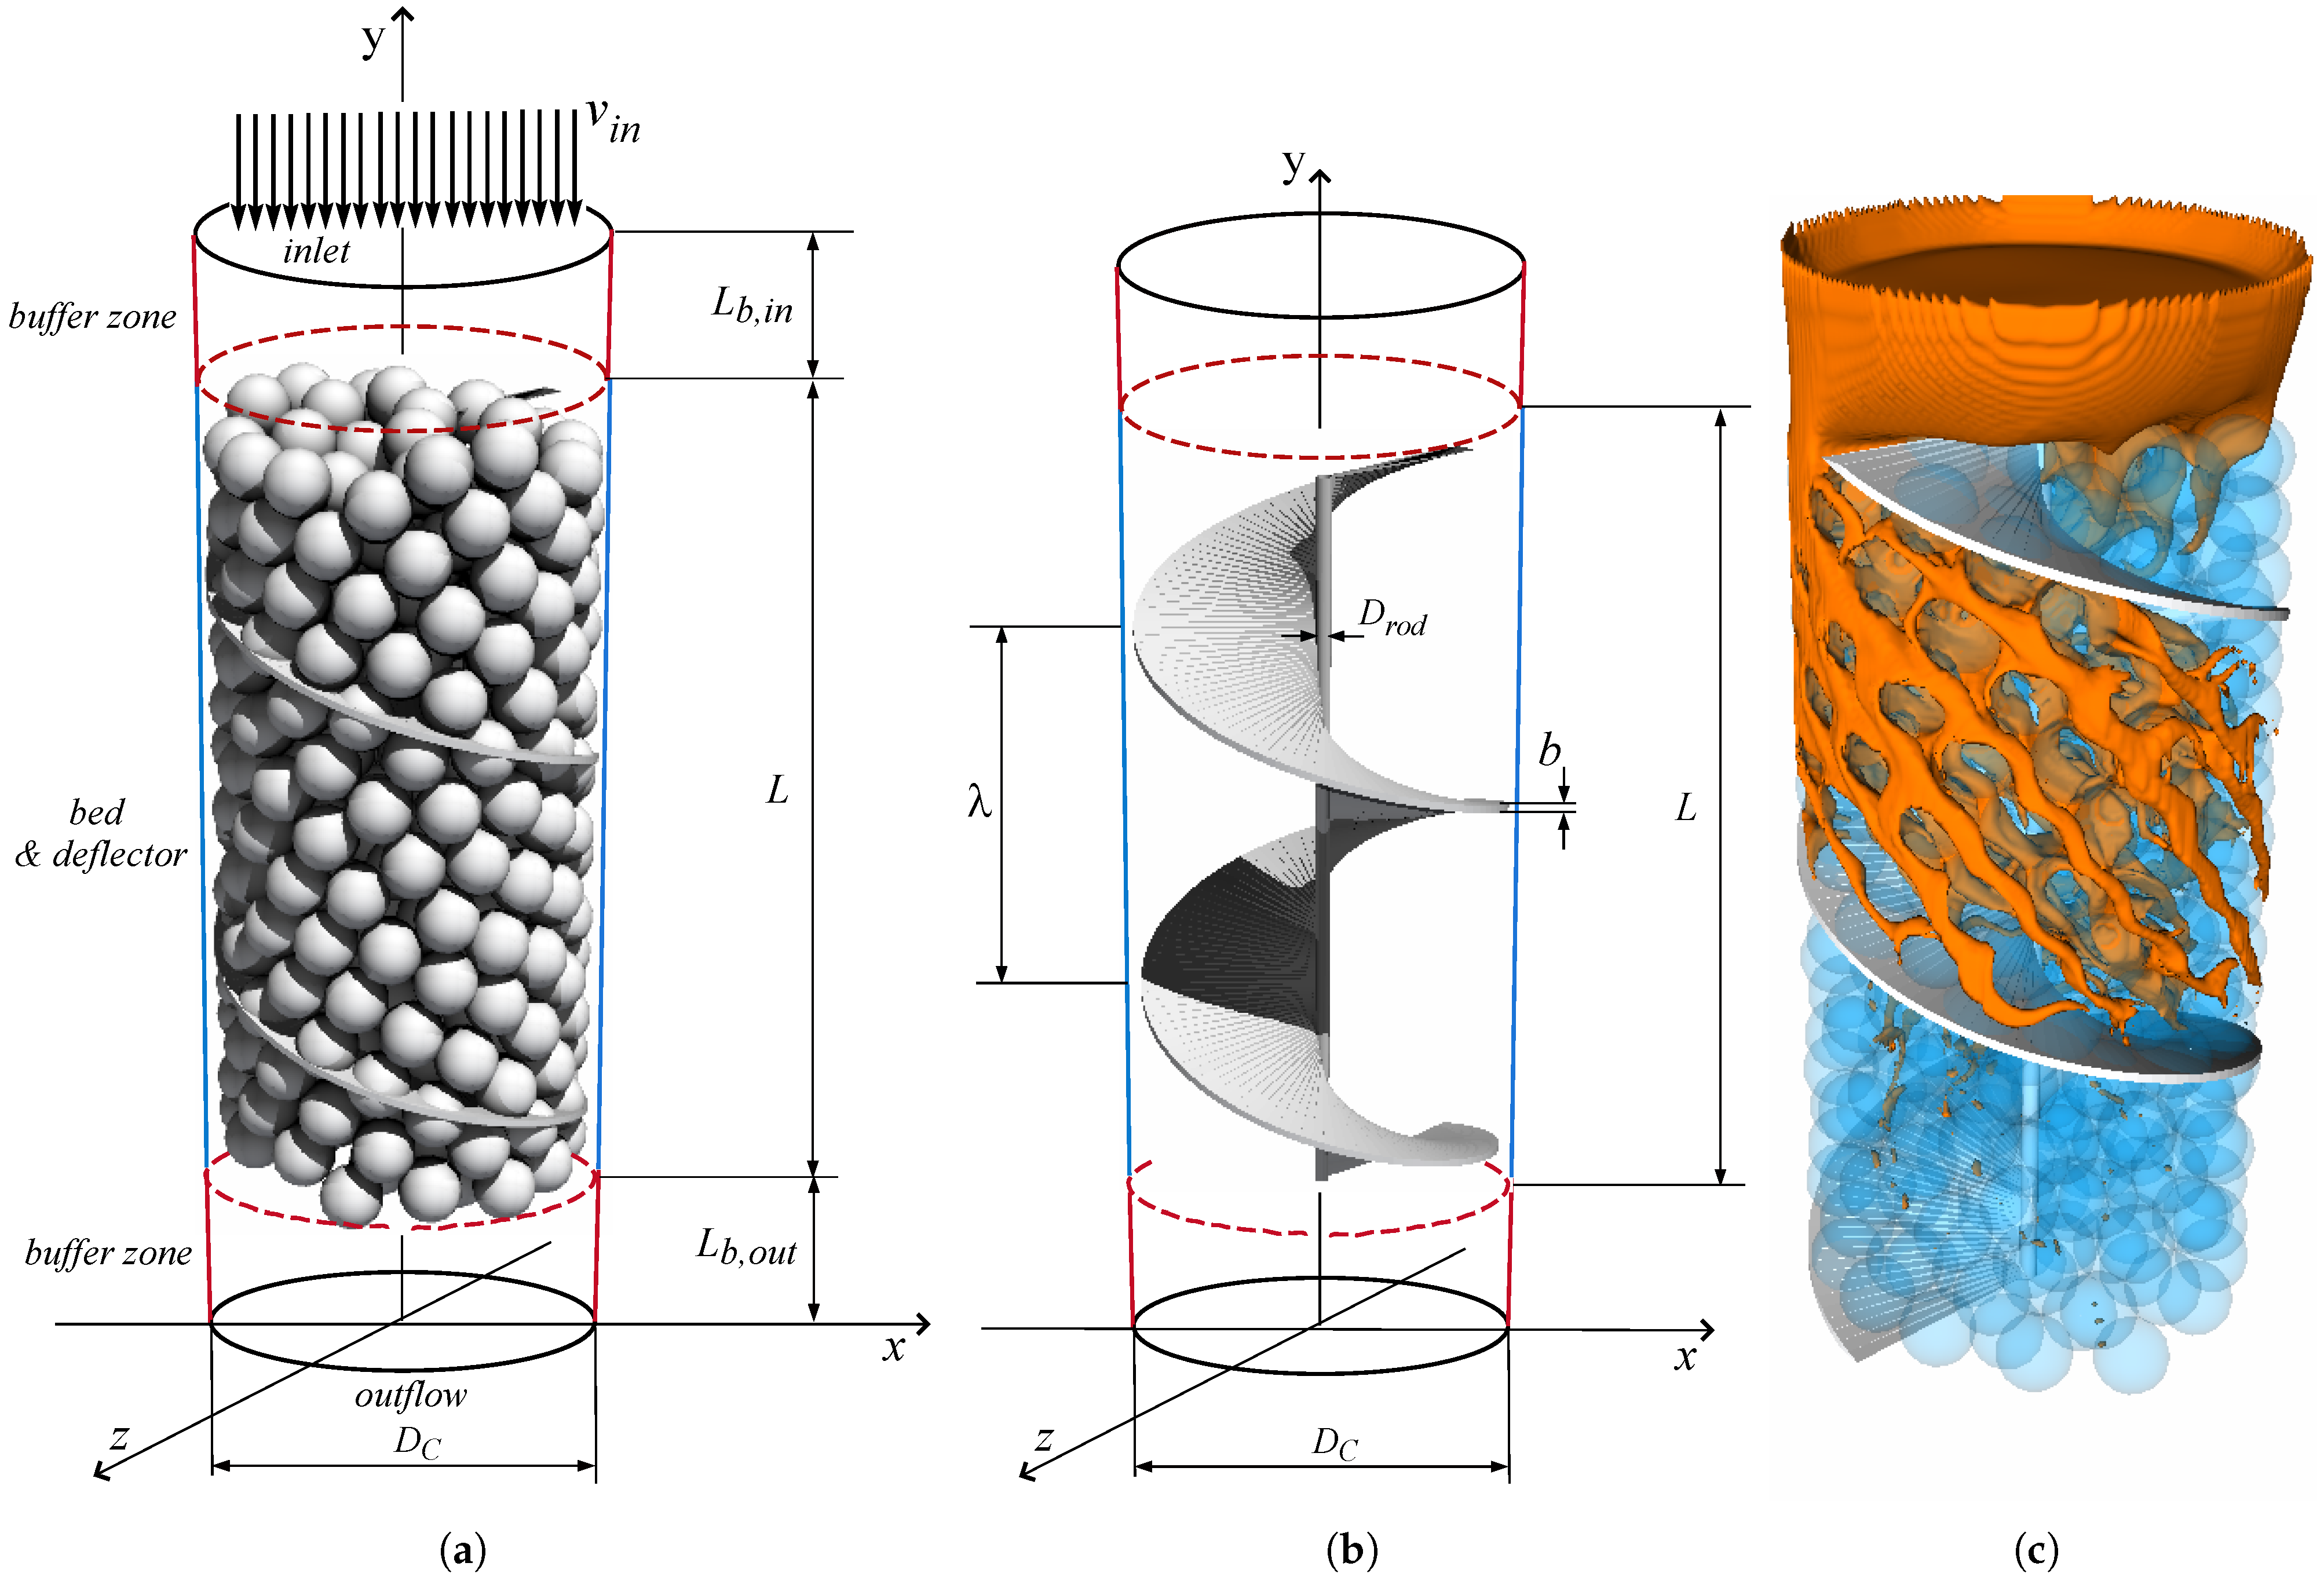
Figure 1. The physical domain and its dimensions: (a) The column with the random packed bed and the flow deflector. (b) The helical flow deflector. (c) Sample results for passive marker flow within the packing (the column’s wall is not shown).
Processes 13 02828 g001
Figure 2. Subsequent stages of the generation of the random packing of spheres (column’s wall not shown): (a) 50 spheres. (b) 150 spheres. (c) 300 spheres. (d) 450 spheres. (e) 600 spheres. The final stage with 2000 particles is not presented.
Processes 13 02828 g002
Figure 3. The local void fraction ε l o c ( d ¯ ) profile as a function of the normalised distance from the wall.
Processes 13 02828 g003
Figure 4. The validation of the numerical model: (a) Grid dependency test for Δ p [mPa] when v i n = 1 cm/s. The horizontal line corresponds to the value calculated from Ergun’s formula. The number of cells in y direction is equal to N y = 2.8 N x . (b) The pressure drop as a function of inlet flow velocity—Ergun’s empirical formula (line) and the simulation results (symbols).
Processes 13 02828 g004
Figure 5. The magnitude of the flow velocity | U | in various sections of the domain: (a) No deflector (reference case). (b) λ = 1.0 D c . (c) λ = 0.5 D c .
Processes 13 02828 g005
Figure 6. Iso-surface ( C = 0.5 ) of the transported passive marker at various subsequent moments of time: (a) No deflector (reference case). (b) λ = 1.0 D c . (c) λ = 0.5 D c . Note that the selected moments are different between the cases (results in a given column are not synchronised). The spherical particles are not shown for clarity.
Processes 13 02828 g006
Figure 7. Residence time distribution for the reference case and various values of λ of the helical deflector.
Processes 13 02828 g007
Table 1. The structure factor calculated from the velocity field together with the estimated tortuosity and the Reynolds number based on the effective velocity. Here, v i n is fixed and equal to 0.01 m/s.
CaseVelocity RatioStructure FactorTortuosityReynolds Number
v e / v in ε / τ τ Re = v e D p / μ
no deflector2.830.3531.2038
λ = 1.5 D c 3.740.2681.5851
λ = 1.0 D c 4.900.2042.0866
λ = 0.5 D c 9.750.1034.12132
Table 2. The moments of the calculated residence time distribution. The gains are found with respect to the reference case without the deflector.
CaseExpected ValueStandard DeviationExpected Value Gain       Standard Deviation Gain
E ( RT ¯ ) σ ( RT ¯ ) E ( RT ¯ ) / E ( RT ¯ ) ref σ ( RT ¯ ) / σ ( RT ¯ ) ref
no deflector1.420.42
λ = 1.5 D c 1.860.741.31.8
λ = 1.0 D c 2.390.831.72.0
λ = 0.5 D c 4.441.303.13.1
Table 3. The inlet velocity per case ( v i n = v e f ), skewness of RTDs, and calculated reactor Péclet number (based on Equation (6)).
CaseInlet VelocitySkewnessPéclet Number
v in [m/s] s Pe r
no deflector0.01771.4322.7
λ = 1.5 D c 0.01342.2312.3
λ = 1.0 D c 0.01021.6316.3
λ = 0.5 D c 0.00510.3823.1
Table 4. The calculated pressure drop Δ p [mPa] along the whole packing for the reference case and various values of the deflector pitch ( λ ). The pressure drop ratio is taken with respect to the reference case.
CasePressure DropPressure Drop Ratio
Δ p [mPa] Δ p / Δ p ref
no deflector169
λ = 1.5 D c 2961.8
λ = 1.0 D c 3972.3
λ = 0.5 D c 7294.3
Disclaimer/Publisher’s Note: The statements, opinions and data contained in all publications are solely those of the individual author(s) and contributor(s) and not of MDPI and/or the editor(s). MDPI and/or the editor(s) disclaim responsibility for any injury to people or property resulting from any ideas, methods, instructions or products referred to in the content.