Article

Simulation, Optimization, and Techno-Economic Assessment of 100% Off-Grid Hybrid Renewable Energy Systems for Rural Electrification in Eastern Morocco

by
Noure Elhouda Choukri
1,
Samir Touili
1,2,
Abdellatif Azzaoui
1 and
Ahmed Alami Merrouni
1,*
1
Materials Science, New Energies and Applications Research Group, LPTPME Laboratory, Department of Physics, Faculty of Sciences, Mohammed 1st University, Oujda 60000, Morocco
2
Centre de Recherche de l’École des Hautes Études d’Ingénierie, Oujda 60000, Morocco
*
Author to whom correspondence should be addressed.
Processes 2025, 13(9), 2801; https://doi.org/10.3390/pr13092801
Submission received: 2 August 2025 / Revised: 24 August 2025 / Accepted: 27 August 2025 / Published: 1 September 2025
(This article belongs to the Special Issue Advances in Heat Transfer and Thermal Energy Storage Systems)

Abstract

Hybrid Renewable Energy Systems (HRESs) can be an effective and sustainable way to provide electricity for remote and rural villages in Morocco; however, the design and optimization of such systems can be a challenging and difficult task. In this context, the objective of this research is to design and optimize different (HRESs) that incorporate various renewable energy technologies, namely Photovoltaics (PVs), wind turbines, and Concentrating Solar Power (CSP), whereas biomass generators and batteries are used as a storage medium. Overall, 15 scenarios based on different HRES configurations were designed, simulated, and optimized by the HOMER software for the site of Ain Beni Mathar, located in eastern Morocco. Furthermore, the potential CO2 emissions reduction from the different scenarios was estimated as well. The results show that the scenario including PVs and batteries is most cost-effective due to favorable climatic conditions and low costs. In fact, the most optimal HRES from a technical and economic standpoint is composed of a 48.8 kW PV plant, 213 batteries, a converter capacity of 43.8 kW, and an annual production of 117.5 MWh with only 8.8% excess energy, leading to an LCOE of 0.184 USD/kWh with a CO2 emissions reduction of 81.7 tons per year, whereas scenarios with wind turbines, CSP, and biomass exhibit a higher LCOE in the range of 0.472–1.15 USD/kWh. This study’s findings confirm the technical and economic viability of HRESs to supply 100% of the electricity demand for rural Moroccan communities, through a proper HRES design.

1. Introduction

1.1. Background and Motivation

In recent decades, the increasing global demand for energy, combined with the urgent challenges of climate change and rising greenhouse gas emissions, has intensified the interest in renewable energy (RE) sources, which are now considered a primary source of energy [1]. Countries seek to reduce their carbon footprints and secure sustainable energy supplies, and the global deployment of renewable technologies has accelerated remarkably [2].
Between 2012 and 2021, the global RE capacity expanded from approximately 480 GW to 1945 GW, reflecting a strong commitment to cleaner energy solutions [3]. During this period, electricity production from wind energy rose from 1270 TWh in 2018 to 1861 TWh in 2021, while solar energy generation increased from 582 TWh to 1032 TWh. In contrast, electricity production from non-renewable sources has shown a declining trend; for instance, oil-based electricity generation dropped from 958 TWh in 2016 to 720 TWh in 2021 [3]. Furthermore, the net global electricity generation from renewables rose from around 17 trillion kWh in 2007 to 21 trillion kWh by 2020 [4].
The decade-long growth across various renewable technologies further illustrates this shift. Between 2010 and 2020, the electricity generation from bioenergy increased from 331 TWh to 696 TWh, hydro from 3431 TWh to 4513 TWh, wind from 342 TWh to 1272 TWh, PVs from 32 TWh to 332 TWh, and CSP from 2 TWh to 52 TWh [5]. As a result, several countries have already achieved nearly 100% renewable electricity, although achieving full RE coverage across all energy sectors, including transport, heavy industries, and aviation, remains a global challenge [6].
According to a global roadmap for 139 countries, a transition to 100% RE by 2050 primarily based on wind, water, and solar sources could reduce the overall global energy demand by about 42.5% [7]. Projections suggest that renewable sources could supply up to 90% of the world’s electricity by the mid-century [8]. Indeed, the share of renewables has nearly doubled, from 8.5% in 2004 to 16.7% in 2015 [9]. The International Energy Agency (IEA) emphasizes that achieving net-zero emissions by 2050 will require a 45% reduction in global CO2 emissions from 2010 levels by 2030 [10].
In this global context, the Middle East and North Africa (MENA) region has embraced the clean energy transition, with nearly all countries setting national RE targets and integrating renewable technologies into their energy mix [11]. Among these countries, Morocco stands out as a regional leader in RE development and policy ambition [12].
Currently, Morocco aims to reach 52% of renewable energy in its total installed capacity by 2030, up from around 45% today [13]. Its long-term strategy envisions increasing the renewable share in electricity generation to 80% by 2050 [13]. To achieve these goals, Morocco relies on its vast renewable energy potential, backed by strong political commitment and strategic investments.
The country has made significant progress, with installed capacities reaching 850 MW in solar, 920 MW in hydropower, and 759 MW in wind energy. The Noor solar complex, with 580 MW of capacity, ranks among the world’s largest CSP facilities [14]. Moreover, Morocco benefits from exceptional natural resources: it receives over 3000 h of sunshine annually and has an average solar irradiation of around 5 kWh/m2/day, translating to a solar potential exceeding 20,000 MW. Hydropower remains a stable component, with an estimated potential of 3800 MW. In addition, Morocco’s coastal regions offer strong wind resources, with average wind speeds ranging from 6.5 to 10 m/s [15].
These factors position Morocco as a key player in the global RE transition and as a model for emerging economies pursuing sustainable and resilient energy systems. However, despite Morocco’s efforts, rural areas still face challenges regarding the reliability of electricity access, since the grid extension is expensive and damaging to the environment. On the other hand, renewables can offer clean and sustainable electricity, but their intermittent nature can be an obstacle for their deployment; thus, a combination between various RE sources and technologies in one Hybrid Renewable Energy Systems (HRESs) can be an attractive solution. Accordingly, the motivation behind this study is to identify the best pathways for clean, affordable, and reliable electricity in rural and remote areas in Morocco.

1.2. Literature Review and Research Gap

In the literature, several studies investigated the feasibility of HRESs in Morocco and in other regions worldwide. For instance, El Mokhi investigated the optimization of an operational PV system at Ibn Tofail University in Kenitra. Using HOMER Pro, the research analyzes scenarios aimed at minimizing grid dependence by scaling up the PV capacity to 1857 kWp. The findings reveal an RE contribution of up to 88.9%, along with a reduction in CO2 emissions estimated at 203,276 kg/year [16]. Similarly, El-Maaroufi et al. developed a hybrid energy model combining PVs, wind, and biomass to meet the annual electricity needs of households in the Zoumi region. The optimized system, simulated via HOMER Pro, achieved a complete RE penetration with an annual production of 11.14 GWh, a levelized cost of electricity (LCOE) of USD 0.125/kWh, and CO2 emission reductions of approximately 5900 tons per year [17].
In another study, Ennemiri et al. evaluated a hybrid configuration based on PVs, biogas, and battery storage to supply a commercial platform in Berkane. Through optimization modeling, the study achieved 100% RE integration with an LCOE of USD 0.280/kWh, offering both economic feasibility and a 40% reduction in CO2 emissions [18]. Ladide et al. conducted a techno-economic assessment of hybrid RE systems across six Moroccan climatic zones, focusing on medium- and small-scale microgrids for public facilities. Using HOMER Pro, the results highlighted regional variations, where grid-connected wind systems were more suitable for western cities, and PV systems were more advantageous in the eastern regions. The optimal systems recorded LCOEs around USD 0.13/kWh [19]. In their study, Bari et al. proposed optimized PV/wind/battery hybrid systems for four Moroccan locations. The simulation results showed that hybrid systems consistently outperformed standalone configurations in terms of cost. Tarfaya, in particular, achieved the lowest cost of electricity at USD 0.026/kWh. Wind-based systems were generally more economical due to reduced storage requirements, except in Zagora where PV systems showed a better performance [20]. Focusing on rural electrification in the Fez-Meknes region, Mahdavi et al. designed a standalone hybrid system combining biomass, solar, and wind energy. The system was configured to operate independently of fossil fuels and the national grid, demonstrating the technical viability of relying entirely on renewables in remote areas [21]. In a related work, Ladide et al. also analyzed various hybrid setups to supply electricity for households in Marrakech. The results identified the PV–battery configuration as the most efficient, offering complete renewable coverage and a competitive LCOE of USD 0.236/kWh, outperforming systems that incorporated diesel backups in both cost and emissions [22].
Expanding beyond Morocco, Purlu et al. conducted a study on hybrid renewable systems for rural electrification in Turkey. The research compared on-grid and off-grid setups combining wind, solar, and hydroelectric sources. The off-grid version, equipped with battery storage, achieved a RE contribution of up to 100% and an LCOE of USD 0.167/kWh, highlighting the potential of hybrid configurations in different geographical contexts [23]. Li et al. conducted a feasibility study of different RE systems in Nanyang, Henan Province, China. The authors used HOMER for the design, optimization, technico-economic, and environmental analysis, and the results showed that the most optimal configuration consists of a 250 kW PV plant, one wind turbine, a 360 kW diesel generator, and ten batteries, with a 150 kW converter leading to an LCOE of 0.378 USD/kWh. In addition, this configuration can reduce around 72 tons of CO2 emissions per year, which represents a reduction of 89.4% in comparison to the case of using the diesel generator only [24]. Kapen et al. evaluated the impact of batteries in a hybrid energy system on power and hydrogen generation. The system configuration consisted of a PV plant, fuel cells, an electrolyzer, and a biogas generator. Two scenarios were considered with and without batteries, and HOMER was employed for the optimization for three demand levels, low, medium, and high, in Maroua, Cameroon. The results showed that when batteries were used, the lowest cost of the electricity and hydrogen production was achieved with a range of 0.071–0.139 USD/kWh and 0.15–3.06 USD/kg, respectively [25].
Similarly, Kumar and Channi used HOMER for the design and optimization of a HRES consisting of a PV plant, a biomass generator, and batteries to meet the power demand of a rural village located in Sidhwanbet, Punjab, India. The author found that a 100% RE system is able to satisfy the village’s energy needs. The system consist of a 1.11 kW PV plant, a 10 kW biomass generator, and five batteries with a 3.96 kW converter for an LCOE of USD 0.362/kWh [26]. Chaichana et al. assessed the potentiality of different hybrid energy systems to power Koh Samui Island in southern Thailand using HOMER for the design and optimization, as well as the technical and economic analysis. Four different scenarios were derived from combinations between various technologies, namely PVs, wind turbines, fuel cells, and lithium-ion batteries, with the possible consideration of the grid and diesel generators as a backup. It was found that the most economic scenario is achieved with the grid connection, with an LCOE of 0.132 USD/kWh; however, this leads to considerable CO2 emissions, with 20.5 ktonnes/year. The most optimal scenario without the grid connection consists of a 182 MW PV plant, 8 MW wind turbines, a 10 MW fuel cell with a 17.9 MW converter, and a 211 MWh battery capacity, with the PV plant generating 89% of the total system energy production and an LCOE of 0.309 USD/kWh [27].
Odetoye et al. applied HOMER for a technical, economic, and environmental evaluation of various RE sources to provide electricity for a rural community located in Arandun, Nigeria, with an average power demand and daily energy consumption of 975 kW and 23.028 MWh/day, respectively. The most optimal system is composed of a 3 MW PV plant, a 9 MW CSP plant, 200 kW of hydropower, and 200 batteries with a 2.5 MW converter. The system has an LCOE of 0.26 USD/kWh and can reduce 7540 tons of CO2 emissions annually [28]. Mbasso et al. designed and optimized an off-grid hybrid system composed of a PV plant, a battery, and a diesel generator to meet the energy requirements for both a residence as well as the oxygen production for fish aquaculture located in Manoka Island, Cameroon, with a daily load average of 9.28 kWh and a peak demand of 0.88 kW. Accordingly, the optimization results find that the optimal configuration consists of a 5.19 kW PV plant, nine batteries, a 970 W diesel generator, and a 1.04 kW converter in addition to a 10 kW electrolyzer and a 50 kg oxygen tank, and the PV plant generates 96.31% of the system’s electricity [29]. Irshad et al. employed HOMER to design and optimize a hybrid energy system for coal-dependent regions in order to reduce CO2 emissions while providing reliable electricity at a low cost. The authors choose the site of Helmand, Afghanistan, since it already has a hydropower plant but has a significant mismatch between the energy generation and demand. It was found that the system’s optimal configuration consists of a 120 MW PV plant, a 111 MW coal plant, and a 151 MW hydropower plant; this system is able to meet a daily demand of 2.627 GWh, with a minimal capacity shortage of only 0.03%. In addition, the system achieves a low LCOE of 0.0547 USD/kWh while reducing the CO2 emissions by 83.1 million kg annually [30].
Chisale et al. carried out a technical and economic optimization of six different hybrid energy systems with the aim of enhancing the power generation reliability in a Malawian school while lowering the power costs and reducing the grid dependency. The six configurations were composed of various combinations between the grid, the diesel generator, the PV plant, wind turbines, the biogas generator, and batteries, while HOMER was employed to find the optimal configuration for Blantyre Secondary School, in the city of Blantyre in southern Malawi as a case study. It was found that the most optimal configuration is composed of the grid, the biogas generator, and the PV plant with an LCOE of 0.095 USD/kWh, which is lower than the Malawian grid cost by around 32% [31]. With HOMER, Pal and Mukherjee assessed and optimized a standalone energy system composed of a PV plant and hydrogen fuel cells as the storage medium under the climatic conditions of eight states located in North-East India to generate a daily average energy of 138 kWh. The optimization results show that the most optimal configuration consists of a PV plant capacity in the range between 110 and 120 kW, a 15 kW fuel cell, an electrolyzer capacity in the range between 30 and 60 kW, hydrogen tank ranges between 40 and 60 kg, and a 15 kW inverter with an LCOE range between 0.509 USD/kWh and 0.689 USD/kWh and an energy excess between 21.4% and 41.1% depending on the location [32].
Even though the aforementioned studies exhibit the potentiality of HRESs, many research gaps remain. Indeed, a large number of studies focus on an individual or a limited number of technologies in their HRES rather than fully optimized HRESs that include, PVs, wind, CSP, biomass, and batteries. In addition, the majority of studies consider only the energy balance and the costs of the HRES and do not consider the energy excess, CO2 emissions reduction, or the viability of the HRES for rural electrification; in fact, very few studies have addressed this issue within the Moroccan climatic conditions.

1.3. Contribution

This study addresses these gaps by assessing the technical and economic potentiality of various RE technologies to supply the energy needs of a rural village in Morocco in order to achieve full electrification from renewables. Accordingly, HRESs were designed based on different RE technologies, namely PVs, wind, and CSP, while using batteries and biomass generators as backup storage media, leading to a total of 15 scenarios incorporating 15 different HRESs. In order to design, simulate, and optimize the different HRESs, the HOMER simulation tool was used to identify the most optimal scenario able to achieve full electrification based on renewables with the lowest cost. In addition, an environmental assessment on the impact of the various scenarios was carried out. A remote village located in Ain Beni Mathar, Morocco, was taken as the case study, and therefore high-accuracy meteorological data collected at ground level were used in the modeling and optimization process.
Therefore, the key contribution of this study consists of providing a detailed comparison between a large number of HRESs, leading to the identification of the most optimal HRES to achieve 100% RE rural electrification under realistic climatic conditions in eastern Morocco. Moreover, this study quantifies the energy balance and the potential CO2 mitigation for each scenario, which represents valuable information to support the country’s policy objectives. In fact, this study’s novelty is that it integrates PVs, wind, and CSP-Eurodish technologies with biomass generators and batteries as backups into 15 different scenarios, unlike the majority of the previous studies in Morocco, which mainly focus only on combinations between PVs, wind, and biomass. In addition, this study investigates the potentiality of CSP technology, with the use of high-accuracy meteorological data gathered at the ground level while applying a dual modeling approach, Greenius for the CSP technology and HOMER for the HRES optimization, providing a realistic simulation with a precise technical, economic, and environmental comparison, which has not been extensively evaluated in Morocco for rural areas.

1.4. Paper Organization

The reminder of this paper is organized as follows: First, we present the study location, the village electricity load profile, and its RE potential, and then we present the simulation tool and the various components of the HRES. Afterwards we present and discuss the results and analyze the technical, economic, and environmental aspects of the various possible scenarios with a comparison of our results with similar studies in different locations, and we conduct a sensitivity analysis. Finally, we conclude with this study’s main findings, limitations, and future work.

2. Materials and Methods

In this section, we will describe the steps followed in this study. First, we present the study location and the typical load profile for the electricity demand and the material used for the collection of the meteorological data then the RE potential of the study location. Afterwards, we will provide an overview of the simulation tool and the technical and economic inputs for the different HRES components.

2.1. Site Description and Load Profile

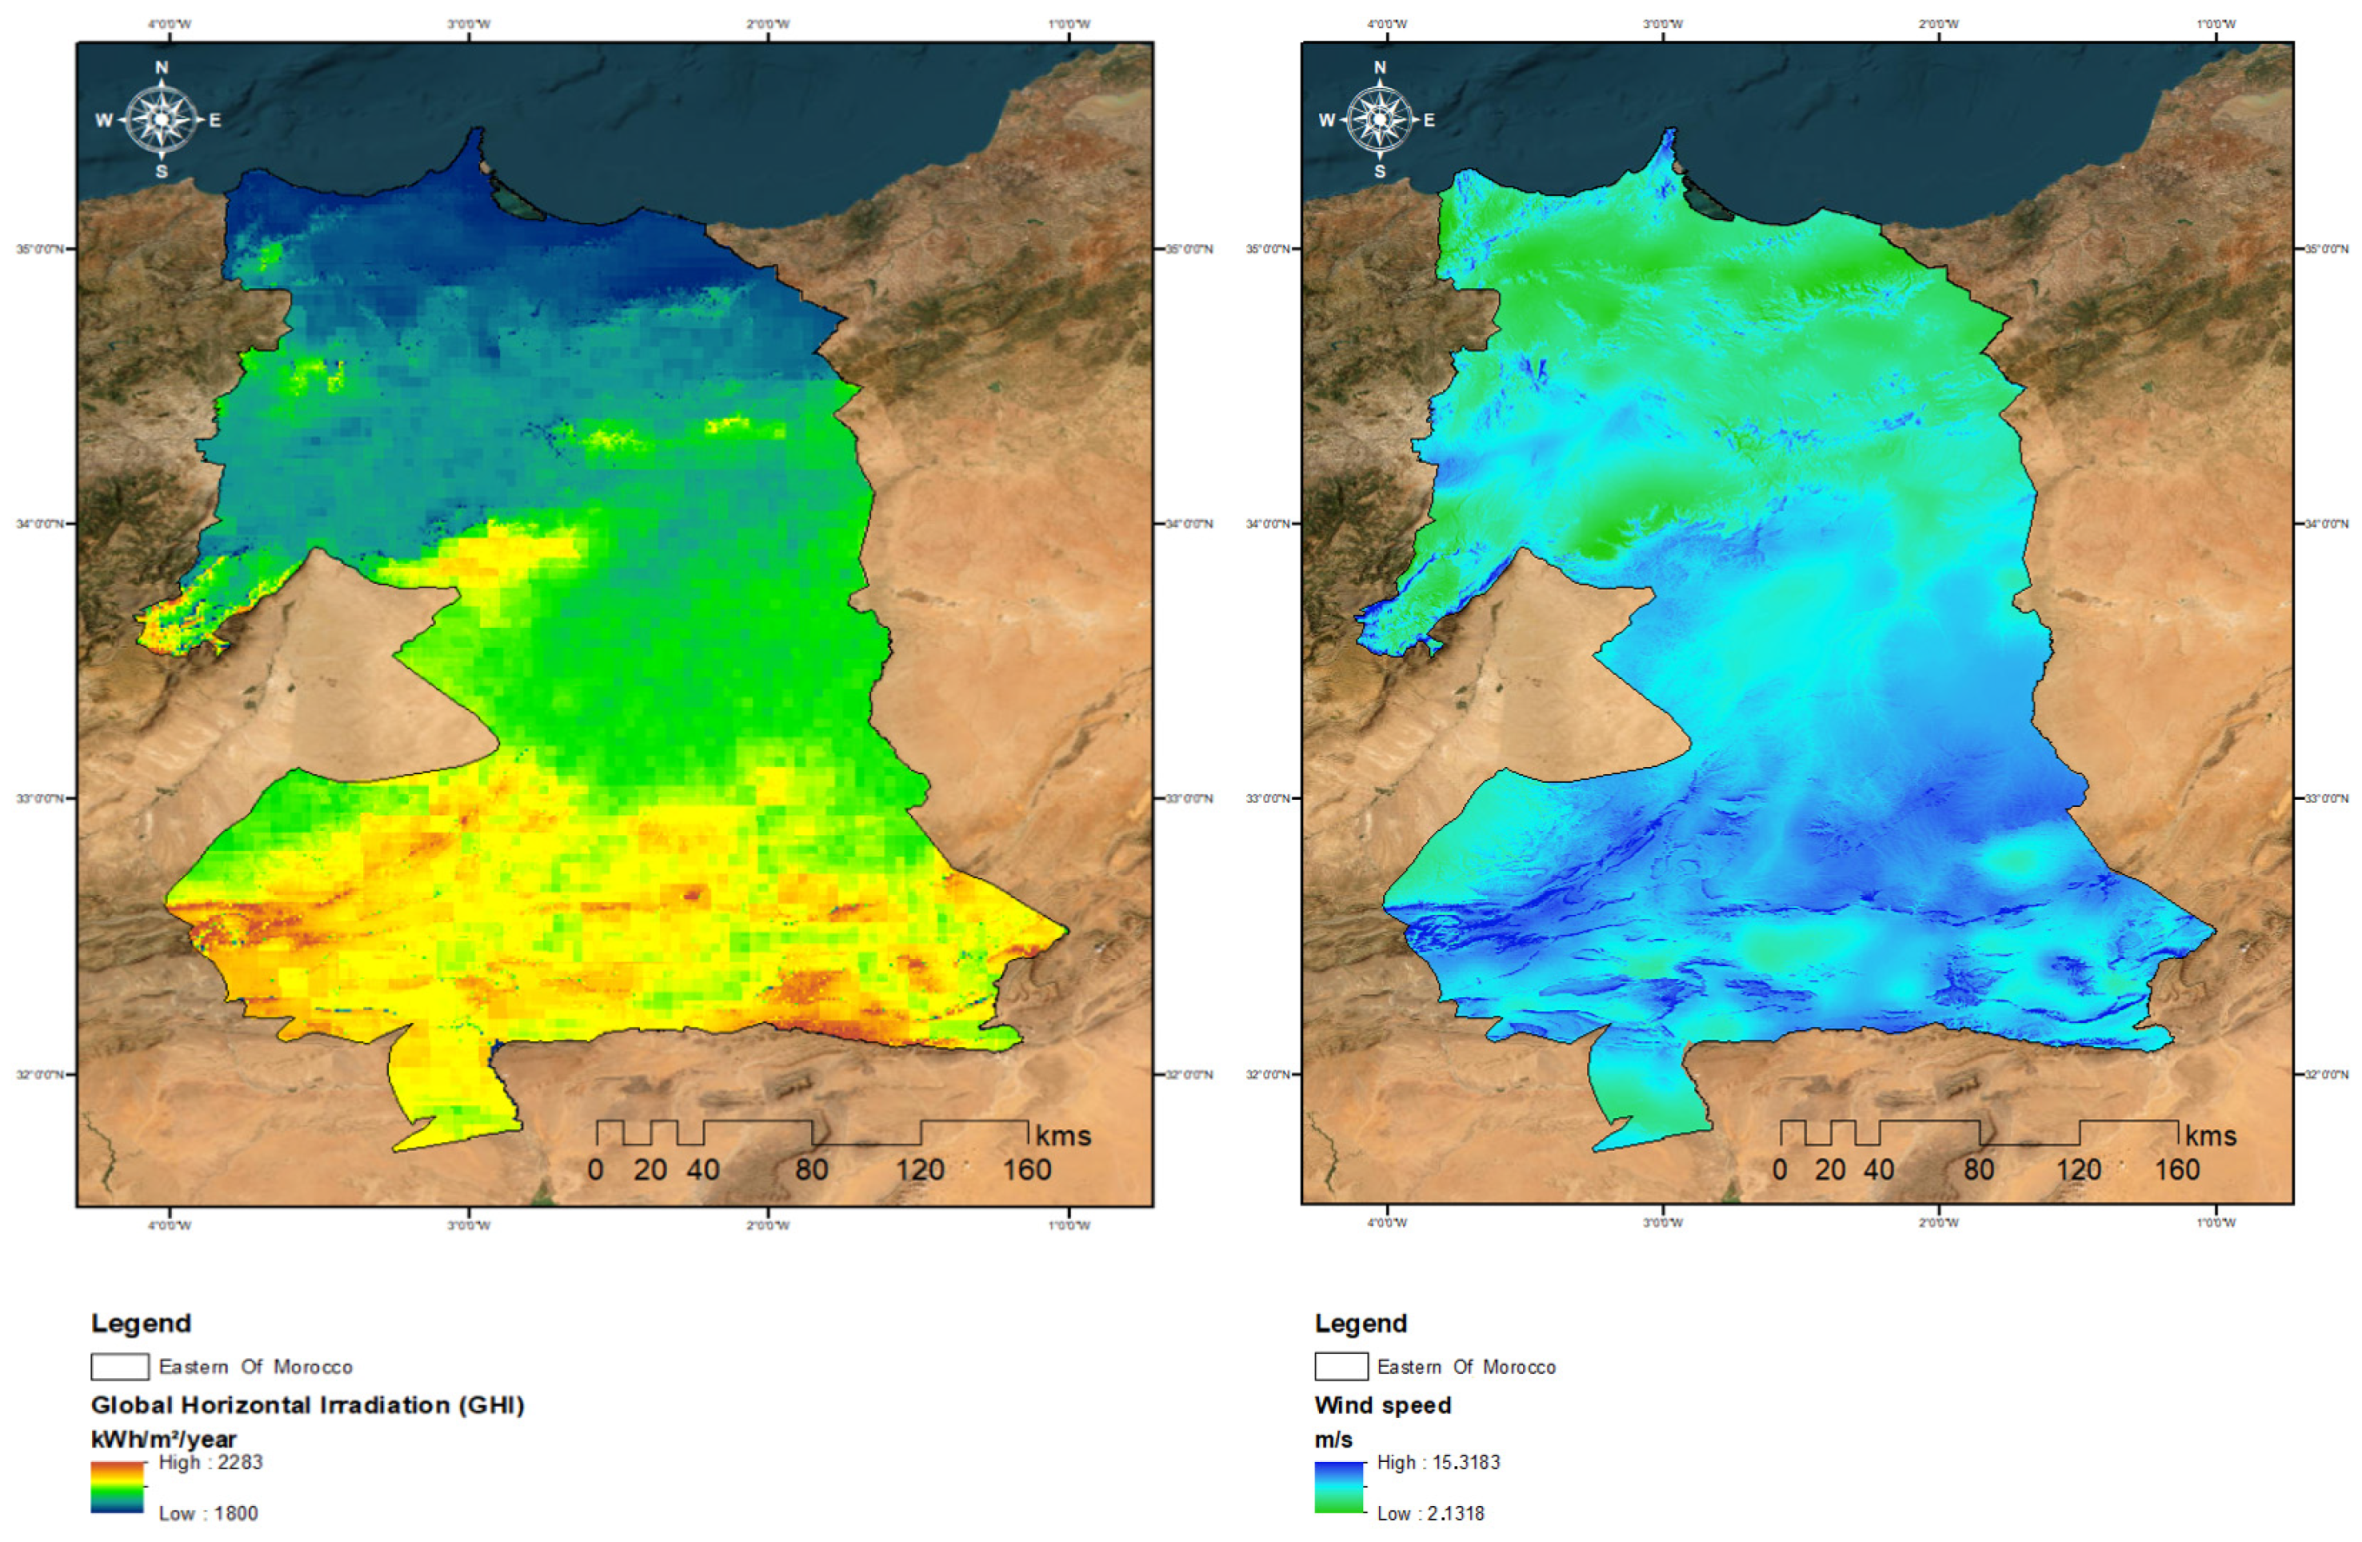
The investigated site is located in eastern Morocco (Figure 1) with the following coordinates: latitude of 34°05′ N and longitude of 2°01′ W. As for the region’s solar and wind potential, Figure 2 presents the solar and wind maps. The solar map (Figure 2, left) presents the Global Horizontal Irradiation (GHI), which is an indicator of the solar resource potential. The region exhibits, in general, a high potential, especially in the south, while for the wind resources the wind speed map (Figure 2, right) shows the presence of areas with high values of wind speed, which in general corresponds to plateaus or open plains. Accordingly, certain locations in the region can be considered as promising for solar and wind power production. However, the spatial variability highlights the importance of a site-specific resource evaluation with high-accuracy equipment in order to conduct an accurate feasibility study.
In this study, we use a typical daily load profile for a rural village, which remains the same throughout the year [33]. Figure 3 shows the typical daily load profile. Electricity consumption starts at 08:00 with 10 kW and continues at the same level until 11:00. From 11:00 to 13:00, the load drops to 5 kW, then goes back to 10 kW until 15:00. At 16:00, the demand increases sharply to 40 kW and stays the same until 17:00. Between 18:00 and 20:00, the load decreases to 28.5 kW. After 21:00, there is no electricity consumption. There is also no consumption before 08:00. This profile is the same for all days of the year.

2.2. Resource Assessment

2.2.1. Solar Resource Assessment

To evaluate the solar resource potential for the operation of PV and CSP systems, the daily profiles of the Global Horizontal Irradiance (GHI) and Direct Normal Irradiance (DNI) were analyzed over a full year. According to Figure 4, each daily value represents the average of the measured 24 h irradiance, which provides a comprehensive representation of diurnal solar variability and ensures reliable estimates of the daily solar availability. The daily annual DNI average is 234.7 W/m2, with a maximum of 429 W/m2 and a minimum of 16 W/m2, while the GHI exhibits an annual daily average of 237.27 W/m2, ranging between 78 W/m2 and 381 W/m2. Notably, the graph reveals that the DNI is subject to a significantly higher day-to-day variability compared to the GHI, due to its strong sensitivity to atmospheric conditions, such as the cloud cover and aerosols, whereas the GHI remains relatively stable, as it includes both direct and diffuse radiation components [34]. These two parameters were from ground-based instruments, which enhances the accuracy and reliability of the dataset used in this study. This distinction is critical in solar system designs: the GHI is essential for PV technologies that operate under both direct and diffuse light, while the DNI is vital for CSP systems that rely exclusively on direct beam irradiance [35].
The measurement of the DNI was carried out using a CHP1 pyrheliometer mounted on a Solys2 solar tracker. This device is known for its high precision and is classified as a secondary standard, with a total error of less than 2%. For the GHI, data were collected using a CMP11 pyranometer, which has an estimated uncertainty of 1% and is categorized by the World Meteorological Organization (WMO) as a first-class radiometer [36].
The monthly GHI and DNI, derived from ground-based measurements, reveals clear seasonal patterns and distinct differences between the two parameters, as shown in Figure 5. The GHI ranges from a minimum of approximately 130 W/m2 in December to a maximum of about 330 W/m2 in June, while the DNI varies between roughly 170 W/m2 in December and 290 W/m2 in May. Both irradiance components increase progressively from winter to summer, driven by a longer daylight duration and higher solar altitudes, and then they decline toward the end of the year. During spring and summer (March to August), the GHI consistently exceeds the DNI, particularly in June, indicating a higher contribution from diffuse radiation. In contrast, during autumn and winter months (October to February), DNI values become comparable to or even exceed the GHI, reflecting clearer skies with stronger direct beam radiation. Notably, the DNI exhibits more pronounced monthly fluctuations than the GHI, underscoring its sensitivity to atmospheric conditions.

2.2.2. Wind Resource Assessment

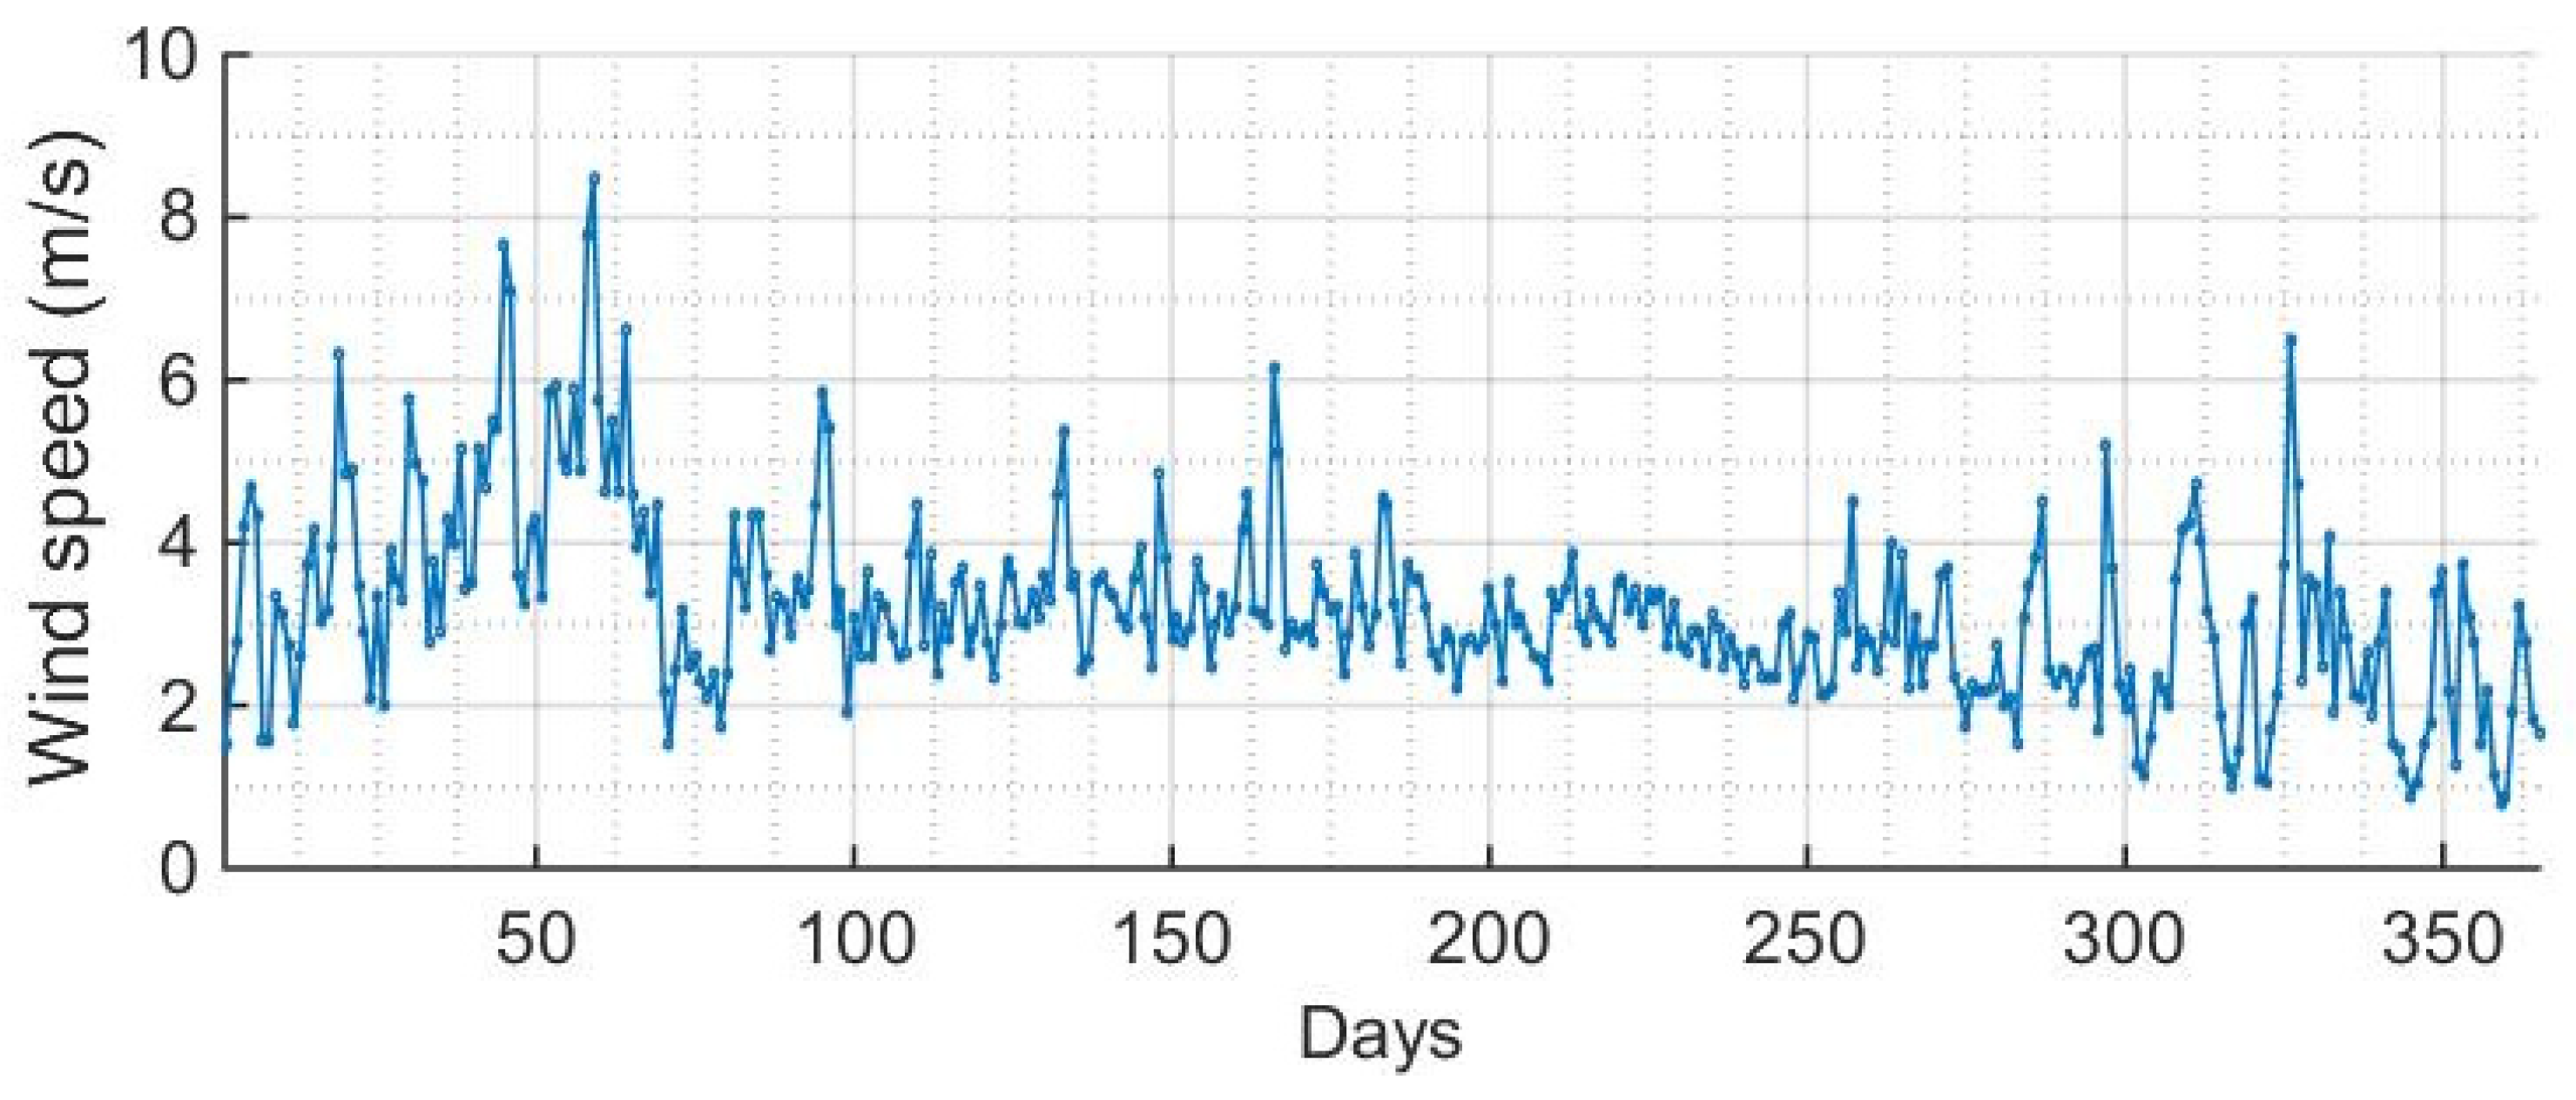
Figure 6 presents the daily wind speed at a height of 10 m, obtained by averaging 24 h measured for each day, and reveals noticeable fluctuations throughout the year. Values range from a minimum of 0.79 m/s to a maximum of 8.45 m/s, with a mean annual speed of 3.47 m/s. The graphical trend indicates frequent and irregular variations, including brief episodes where the wind speed exceeds 6 m/s, alternating with calmer days below 2 m/s, which is characteristic of wind’s intermittent behavior. Additionally, the use of ground-based wind measurements enhances the realism and accuracy of the system modeling in simulation tools such as HOMER. According to established thresholds, average wind speeds above 3 m/s can be considered acceptable for small- and medium-scale wind power applications, though the turbine performance strongly depends on site-specific wind regimes and technology parameters [37].
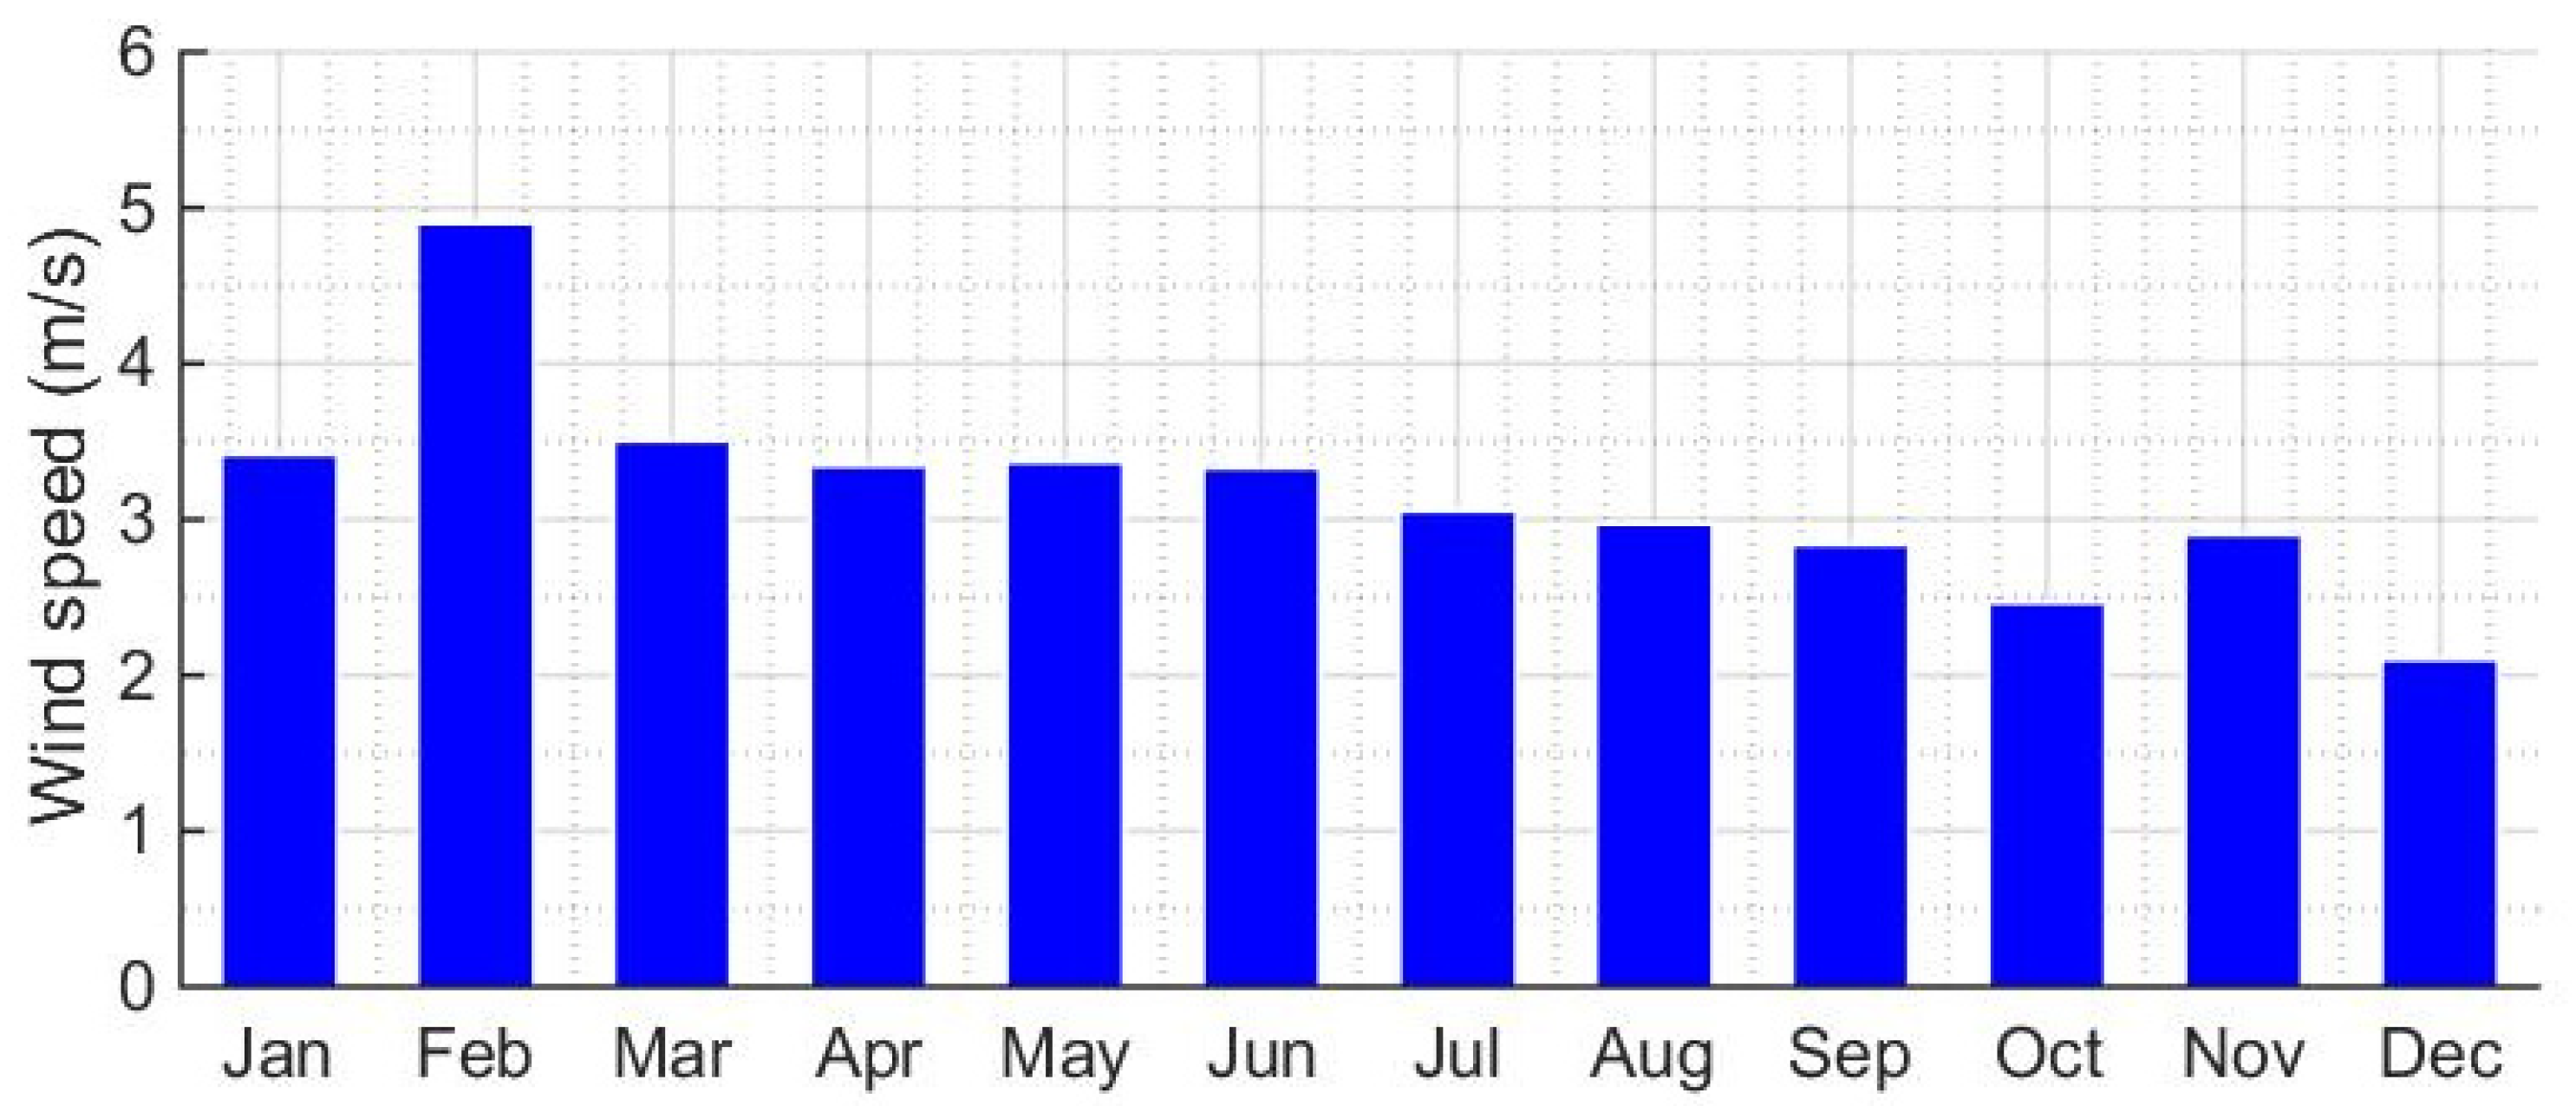
Regarding Figure 7, the monthly average wind speed shows noticeable variation throughout the year. The highest value is 4.90 m/s in February, while the lowest is 2.10 m/s in December, with an annual average of around 3.47 m/s. Higher wind speeds are observed from January to May, followed by a gradual decline from June to December.

2.3. Simulation Tools

In this study, we rely on the HOMER software, often referred to as HOMER (Hybrid Optimization of Multiple Electric Renewables), which is an optimization tool developed by the U.S. National Renewable Energy Laboratory (NREL). It is considered one of the most effective tools for simulating solar and hybrid energy systems [38]. The software offers a wide range of system configurations, including solar, wind, biomass, and hydroelectric systems. It also provides the capability to connect the system to the grid or to incorporate storage solutions [39]. At the input level, HOMER Pro allows for the integration of various resource data, such as the solar irradiance, wind speed, and biomass feedstock, as well as the economic parameters of the system. One of the most critical inputs is the electrical load that the system is intended to supply, as it directly influences the system sizing and optimization [40].
Regarding the outputs, the software generates a comprehensive set of results in the form of scenarios, which help identify the optimal system configuration, along with detailed information on energy production, efficiency, and economic costs.
HOMER ranks the optimization outcomes according to the total Net Present Cost (NPC). This metric represents the present value of all expenses associated with the system throughout its operational lifetime, offset by any revenues generated during the same period. The total NPC is calculated using the following formula [38]:
C N P C = C a n n , t o t C R F ( i , R p r o j )
In this equation, C a n n , t o t represents the total annualized cost (in USD/year), CRF is the Capital Recovery Factor, i denotes the real interest rate, and R p r o j refers to the project lifetime in years.
The Capital Recovery Factor (CRF), which is used to convert a uniform annual cost into its equivalent present value, is a function of the real interest rate i and the project lifetime N (in years) and is calculated using the following formula:
C R F = i ( 1 + i ) N ( 1 + i ) N 1
Another key metric in the optimization process is the LCOE, which represents the average cost per kilowatt-hour of the electricity produced by the system. It is expressed as a function of the total annualized cost of the system C a n n , t o t (in USD/year) and the total electrical load served E l o a d . HOMER computes the LCOE using the following equation:
L C O E = C a n n , t o t E l o a d

2.4. Hybrid Energy System Components

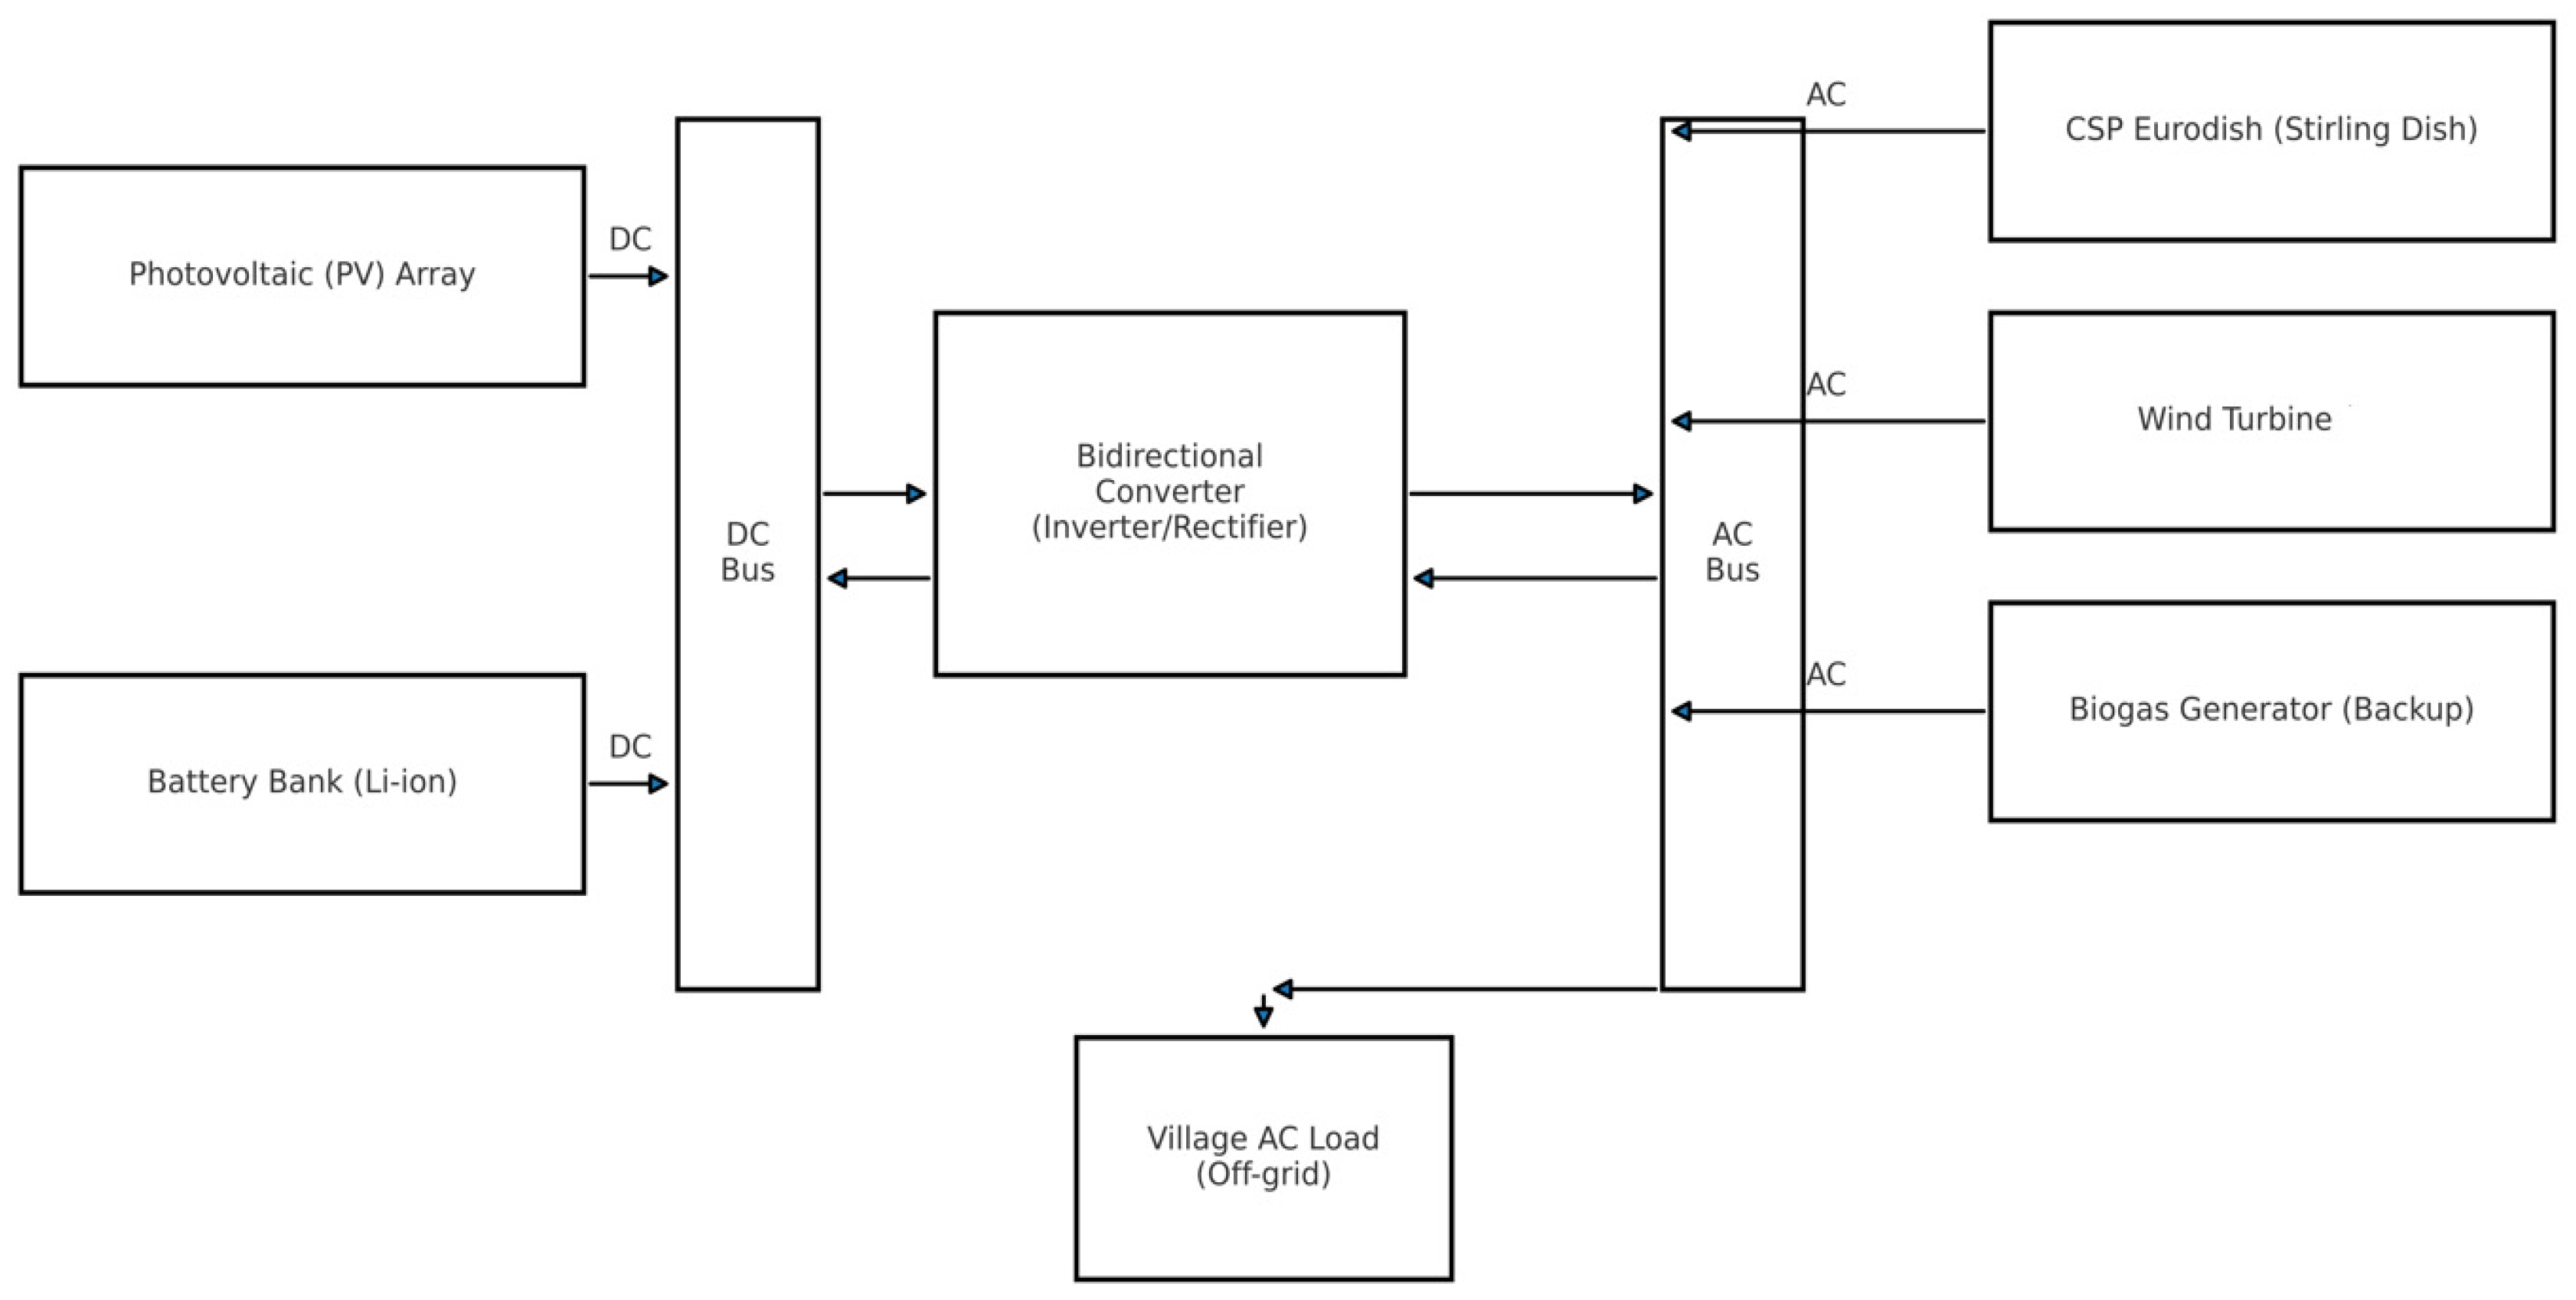
In this section, we will present the renewable technologies considered for the HRES, as displayed in Figure 8.
As can be observed, the CSP, the wind turbine, and the biogas generator are located at the AC bus, whereas the PV and battery are in the DC bus, while the converter ensures the connection between the two buses. The aim is to find the most optimal configuration among these technologies to satisfy the village electricity load. In what follows, each component of the HRES will be described individually.

2.4.1. PV Module

In this study, as inputs for the PV module we utilized the generic flat-plate PV model included in the HOMER library, with the following characteristics: an efficiency of 14.40%, a temperature coefficient −0.42%/°C, an Operating Temperature of 44.80 °C, and an operational lifespan of 25 years [41]. Taking into account the Moroccan economic context, the capital investment cost was estimated at 1600 USD/kW. Additionally, the annual operation and maintenance (O&M) cost is set at 15 USD/year [42].
The electrical output of the PV modules is computed using the following equation [43]:
P P V = Y P V . f P V . G P V G 0 . [ 1 + K T ( T C T 0 ) ]
where Y P V denotes the PV output under standard test conditions (kW), f P V represents the rated capacity of the PV system (%), and G P V and G0 correspond to the solar irradiance on the PV array at a given time and under standard conditions, respectively (kW/m2). K T is the temperature coefficient of the maximum power, while T C and T0 refer to the PV cell temperature in the current and standard conditions, respectively.

2.4.2. CSP-SD System

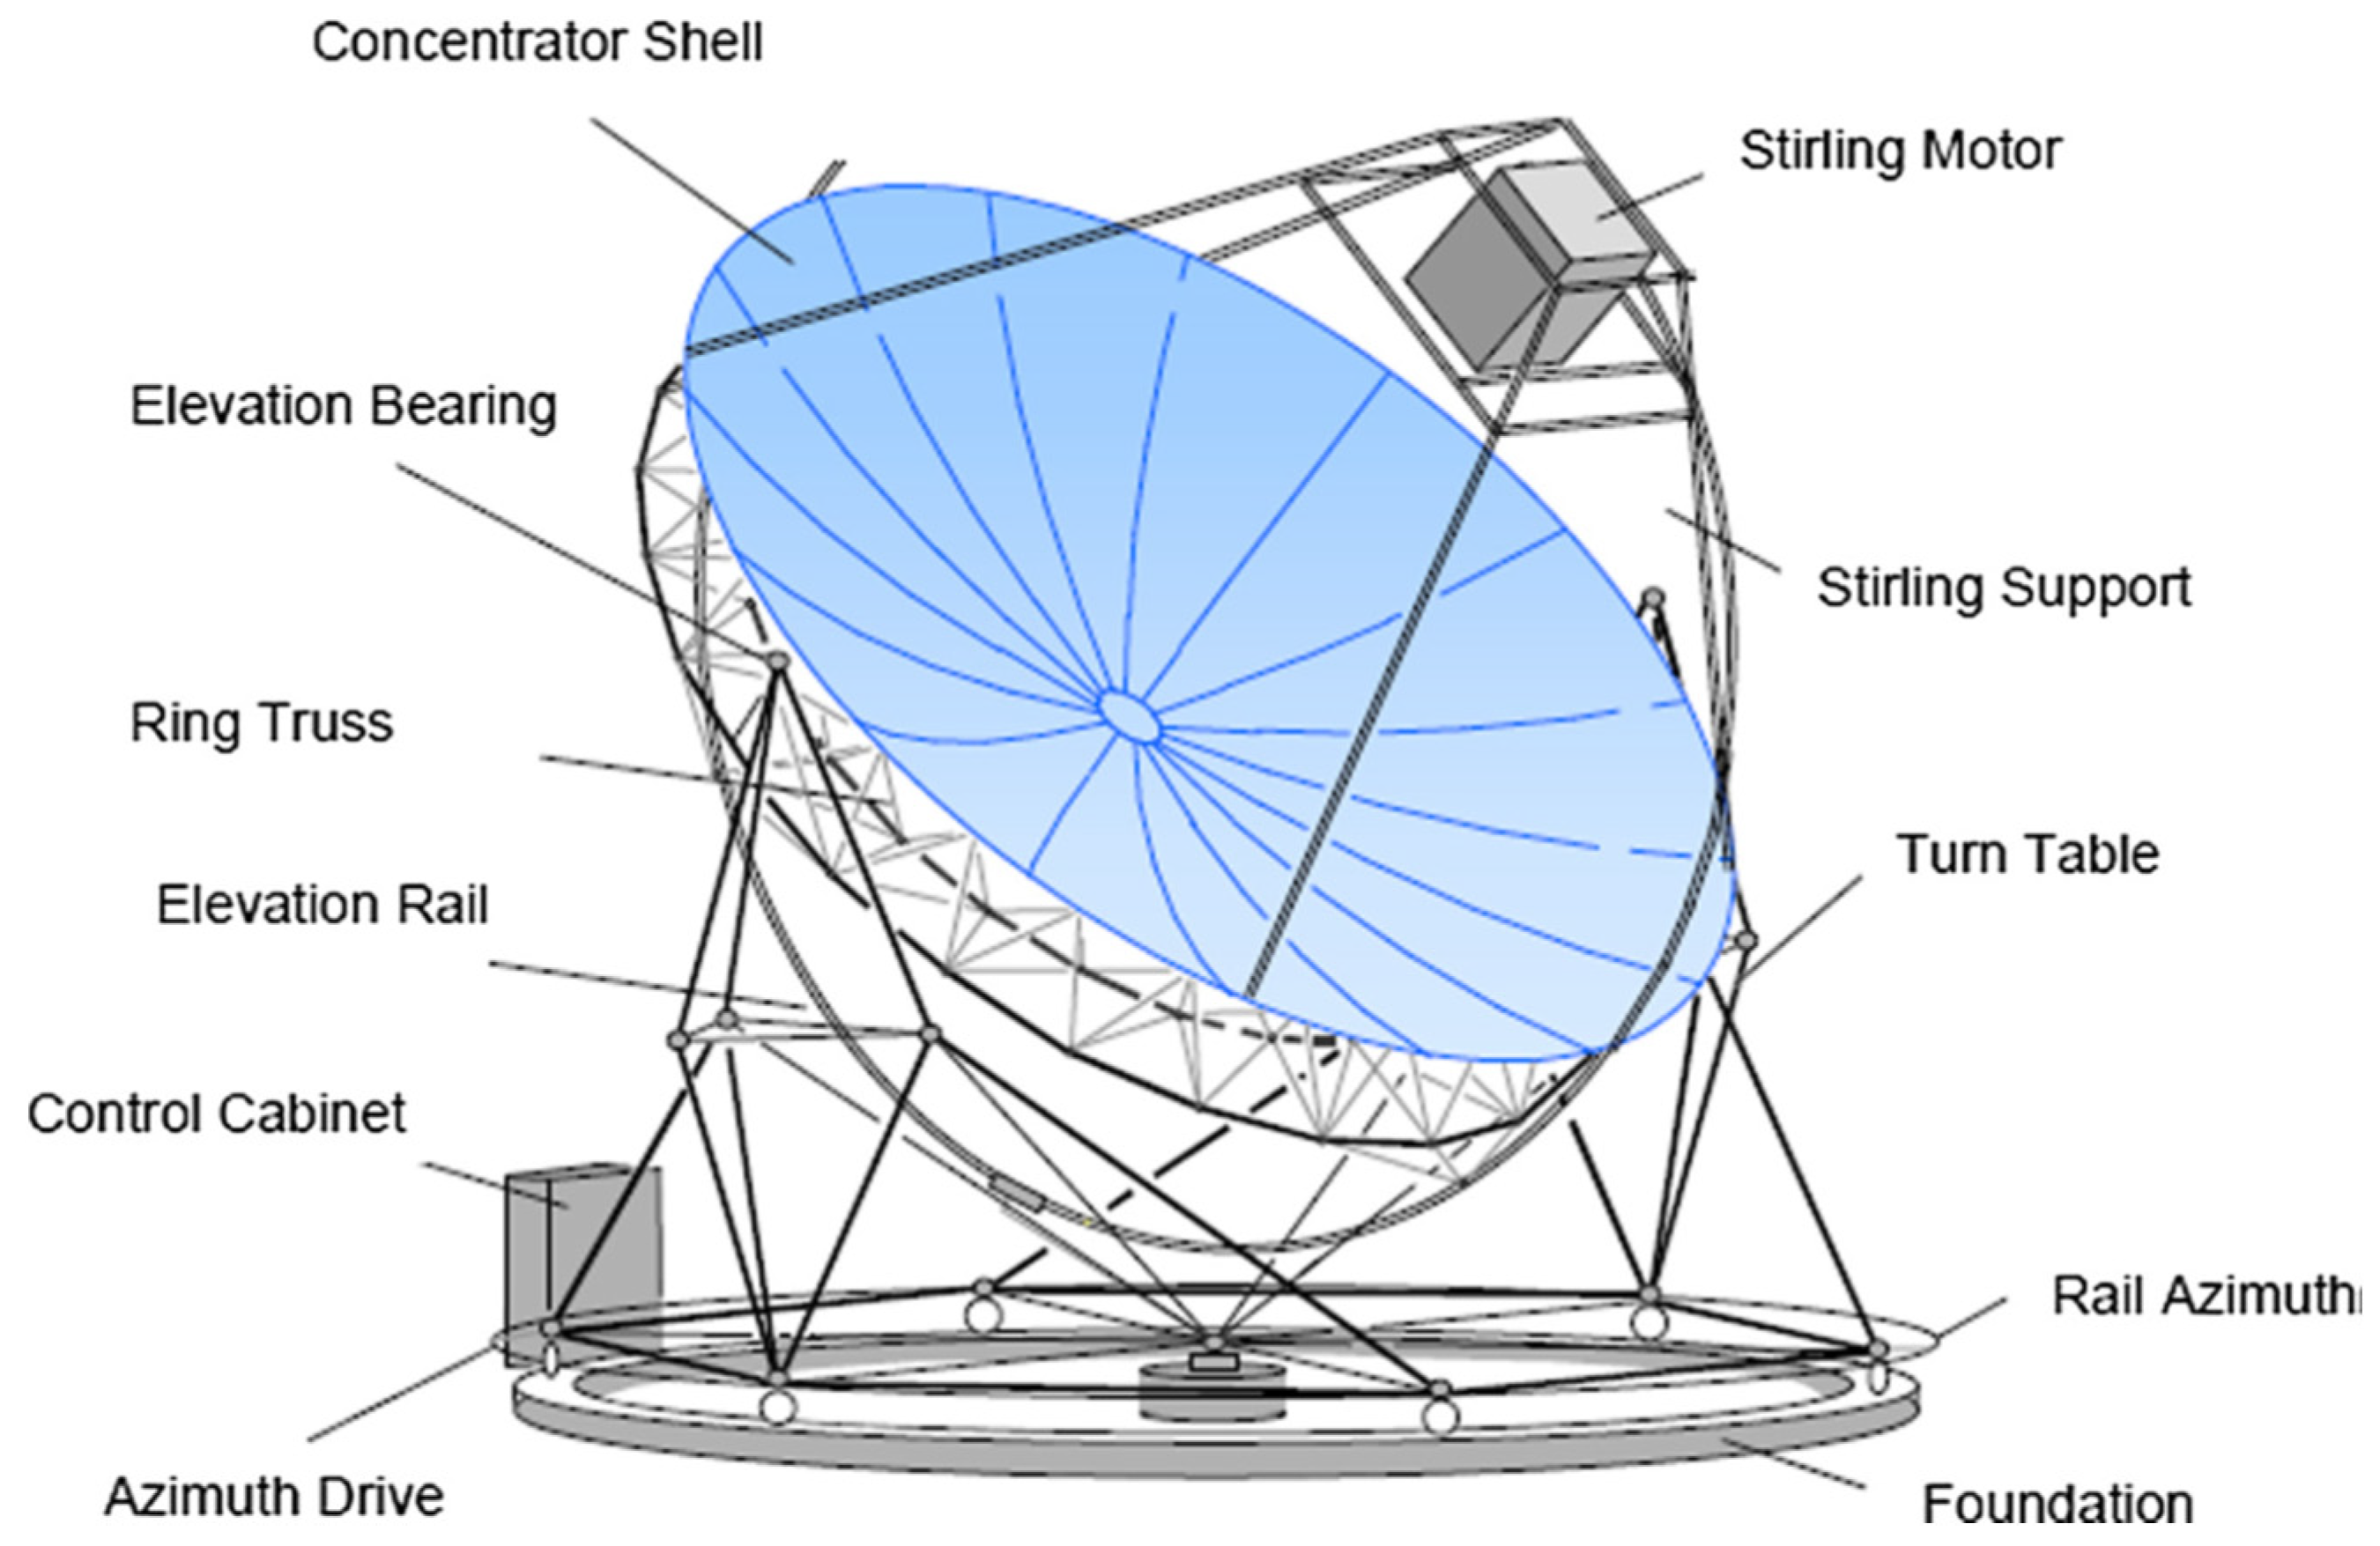
The Stirling Dish (SD) system is a solar thermal technology within the family of CSP technologies. It operates by using a parabolic dish to capture and concentrate the Direct Normal Irradiance (DNI) onto a receiver placed at the focal point of the reflector. The receiver absorbs this concentrated solar energy and transfers the heat to a working fluid inside a Stirling engine [44]. Although the SD is the least developed CSP technology, it has the potential to be competitive with mature technologies like PVs in the future, especially since the SD is considered as one of the most efficient solar technologies. In this study we selected the Eurodish technology developed by the German company Schlaich-Bergermann und Partner (SBP) because it is one of the most advanced Stirling Dish technologies, which has been deployed around the world since 2001 [33].
The Eurodish unit presented in Figure 9 uses helium as the working fluid, with a mirror area of 56.7 m2, a 92% clean mirror efficiency, and an 82.8% concentrator efficiency. One Eurodish has a capacity of 10 kW, and it can be deployed individually, or several units can be connected together depending on the power requirement. This modularity makes it an ideal technology for rural and remote areas.
As for the Eurodish’s associated costs, the total capital cost is estimated at around USD 40,000. Additional expenses include approximately USD 10,000 for transport and installation and an annual operation and maintenance (O&M) cost of about USD 200 [46].
As HOMER does not support the modeling of CSP systems like the Stirling Dish, an alternative approach was adopted. The electrical energy output of a 10 kW Eurodish unit was first simulated using the Greenius software (5.0.0.3, DLR, Cologne, Germany), which is capable of detailed performance modeling based on meteorological inputs, especially the DNI. The resulting hourly electrical output was then imported into HOMER Pro (3.18.4, NREL, Golden, CO, USA), using the software’s option that allows external power profiles to be integrated as input sources. This enabled the Eurodish system to be incorporated into various hybrid scenarios alongside other components, such as PVs and wind turbines.

2.4.3. Wind Turbine

This study employs the AWS HC wind turbine with a rated capacity of 5.1 kW. The turbine features a hub height of 12 m and a rotor diameter of 5.24 m. The system is designed for a 25-year operational lifetime. In terms of economic parameters, the capital investment is estimated at USD 2155, while the annual operation and maintenance (O&M) cost is set at USD 20.
The power output is calculated using the following equations [47]:
P W o u t = 1 2 . ρ . A . V . C P . α , β . η w . η g
where ρ represents the air density (kg/m3), A is the swept area of the rotor (m2), V denotes the wind speed (m/s), C P is the power coefficient reflecting the turbine’s aerodynamic performance, and η w and η g correspond to the efficiencies of the wind turbine and the generator, respectively. Table 1 presents the technical specifications of the wind turbine selected for this study.

2.4.4. Biogas Generator

In order to compensate for the solar and wind power generation intermittency, a biogas-fueled generator was considered in this study as the backup for periods with low or insufficient renewable output. Accordingly, HOMER automatically sized the generator capacity according to the system requirements. In this study, we considered a biogas unit total service life of 20,000 operating hours, which is a typical value for small and medium biogas generators. With respect to the associated costs, the initial investment is estimated at USD 1600 per kilowatt of installed capacity. Additionally, replacement costs were taken as USD 1250/kW, and the operational and maintenance expenses were set at USD 0.10 for each hour of operation [30].
Regarding the biomass feedstock, in this study, to avoid any shortage in supply, we selected olive waste residues as the biomass source due to their abundance in Morocco to ensure the year-round availability of the biomass feedstock, since the country is one of the largest olive producers worldwide [48]. The biomass cost considered in this study is USD 40 per ton [49].

2.4.5. Battery System

In the HRES, the integration of energy storage is essential to ensure a stable and continuous power supply. Given the fluctuating and non-dispatchable nature of sources like solar, wind, and the Eurodish, batteries act as a buffer, storing surplus electricity when the generation exceeds the demand and discharging it during periods of low production or high consumption. For this study, a lithium-ion storage unit with a nominal energy capacity of 1 kWh was employed. The selected model has a rated current of 167 Ah and operates at a voltage of 6 V. The main technical parameters are summarized in Table 2. Economically, the battery is valued at USD 330 for the initial investment, with an annual maintenance expense of USD 10. It is assumed to have a service life of 15 years, after which a full replacement at the same cost is considered [42].

3. Results and Discussion

3.1. Optimization Results

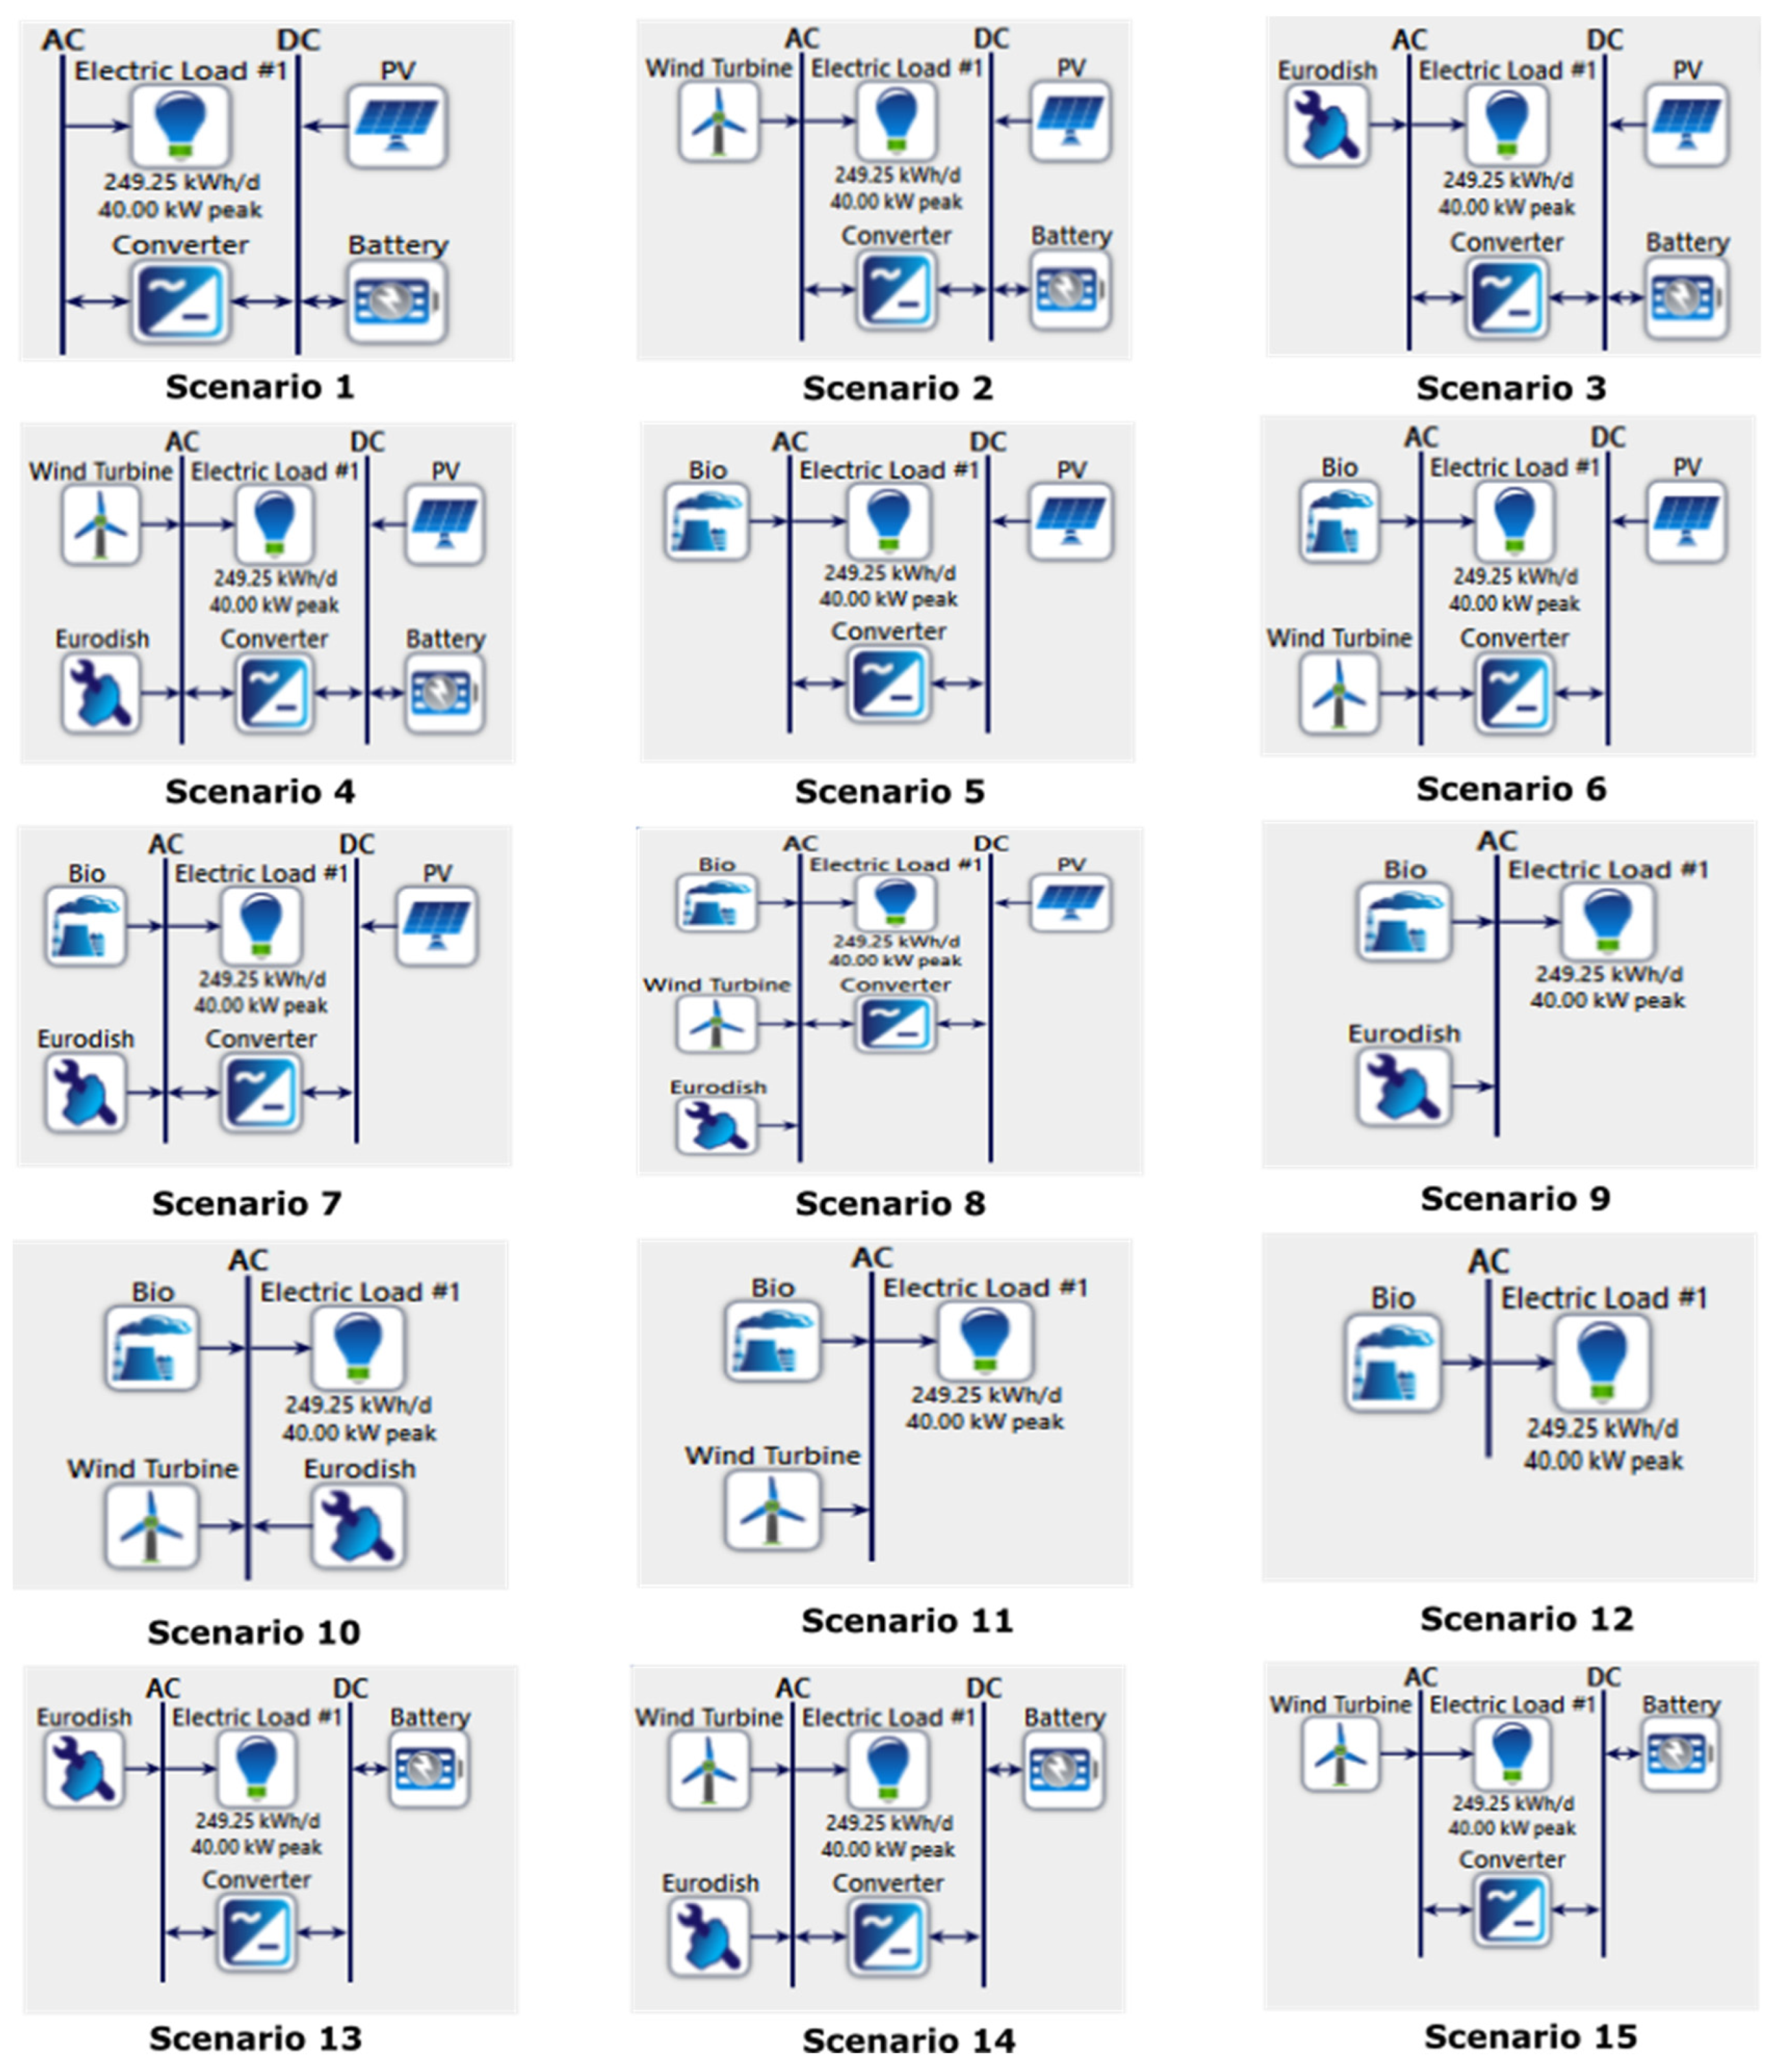
In this section, we will present the different HRESs simulated in this study. In fact, various scenarios were constructed based on the different technologies mentioned above. Then those combinations were simulated and optimized in order to find the most optimal HRES, satisfying the load demand with the lowest cost for every scenario. Overall, we identified 15 possible scenarios, and the flow diagram of each HRES is presented in Figure 10.
As mentioned above, the main objective of this section is to identify the most optimal HRES for each scenario. Therefore, the optimal HRES’s capacity, energy production, and cost from each scenario are presented in Figure 10 in Table 3.
Table 4 illustrates the HRESs’ optimal configuration for the different configurations based on the selected RE sources, and as can be observed, 15 possible scenarios are able to satisfy the village’s electricity requirements. The scenario with the lowest LCOE (0.184 USD/kWh) has a configuration that consists of a 48.8 kW capacity for the PV plant with 213 batteries and a 43.8 kW converter capacity, which generates around 117.5 MWh, of which 8.8% (10.3 MWh) is more than the energy requirement (Excess energy). The main difference between the second scenario and the first one is the addition of one wind turbine with a capacity of 5.1 kW. Indeed, this configuration consists of a 46.6 kW PV plant, a 5.1 kW wind turbine, 212 batteries, and a 41.1 kW converter. The energy production from this scenario is 115.7 MWh, with an energy excess of 9.1 MWh, representing 7.87% of the total production. The PV plant accounts for 96.7% of the HRES’s energy production, while the wind turbine generates the remaining 3.3%, leading to an LCOE of 0.187 USD/kWh.
The third possible combination is composed of a 42.6 kW PV plant, 1 Eurodish unit with a 10 kW capacity, 219 batteries, and a 41.1 kW converter. In terms of energy generation, 85% of the total HRES production is from the PV plant, while the remaining 15% is achieved using the Eurodish, which represent 102.5 MWh and 18 MWh of energy production, respectively, whereas the HRES’s total energy production is 120.6 MWh, with a 12.8% energy excess (around 15.4 MWh) and an LCOE of 0.214 USD/kWh. The following HRES is composed of a 41.7 kW PV plant, a 5.1 kW wind turbine, 1 Eurodish unit (10 kW), 228 batteries, and a 40.7 kW converter. In this scenario, the PV plant generates 82.1% of the system’s energy production with 100 MWh, followed by the Eurodish with 18 MWh and the wind turbine with 3.76 MWh, which corresponds to 14.8% and 3.1% of the overall power generation, respectively, while the energy excess is 17.2 MWh, leading to an LCOE of 0.220 USD/kWh. As for the possible number 5 configuration, the system is composed of a 38.7 kW PV plant, a 30 kW biomass generator, and a 22.2 kW converter. This system generates 146.4 MWh, of which 93.13 MWh (63.6%) is provided by the PV plant, 53.28 MWh (36.4%) is provided by the biomass generator, and there is 51.2 MWh of excess energy, while the LCOE is 0.3 USD/kWh. The next HRES configuration consists of the addition of a 5.1 kW wind turbine to the previous system, with an increase in the LCOE to 0.314 USD/kWh. Indeed, in addition to the 5.1 kW wind turbine, the HRES consists of a 36.2 kW PV plant, a 30 kW biomass generator, and a 37.7 kW converter. The system’s overall energy production is 143.3 MWh, with 60.8%, 36.6%, and 2.4% generated from the PV plant, the biomass generator, and the wind turbine with 87.1 MWh, 52.4 MWh, and 3.7 MWh, respectively, and the energy excess is equal to 48.4 MWh.
The HRES presented in scenario 7 includes a 34.5 kW PV plant, one Eurodish unit, a 30 kW biomass generator, and a 16.7 kW converter. As for each systems’ energy production, the largest contributor is the PV plant with 82.9 MWh, followed by the biomass generator with 52.5 MWh and the Eurodish with 18 MWh, which represent 54%, 34.2%, and 11.8% of the system’s production, respectively, and there is an excess energy production of 60.3 MWh, with an LCOE of 0.332 USD/kWh. As for scenario 8, the HRES comprises a 32.8 kW PV plant, a 5.1 kW wind turbine, one Eurodish unit, a 30 kW biomass generator, and a 31.3 kW converter. The system’s energy production is 152 MWh, with an energy excess of 58.8 MWh. The PV plant is responsible for 51.9% of the production with 78.8 MWh, followed by the biomass generator with 33.8%, representing 51.3 MWh; 11.9% from the Eurodish, with 18 MWh; and finally the wind turbine with 3.7 MWh (2.48%), which leads to an LCOE of 0.342 USD/kWh.
Scenario 9 represents the first configuration without the PV technology, as it is composed of three Eurodish units, representing a capacity of 30 kW, in addition to a 40 kW biomass generator capacity, without the use of a converter since both technologies generate AC currents. This HRES produces 117.2 MWh annually, of which the biomass generator produces around 63 MWh and the Eurodish unit produces 54.2 MWh, while the energy excess is 26.2 MWh. Contrarily to the previous systems where the energy share was dominated by the PV technology, the share of the power generation from the two technologies is very close, as it is 53.7% and 46.3% for the biomass generator and the Eurodish units, respectively; however, the LCOE has significantly increased to 0.472 USD/kWh in comparison to the previous scenario. For the 10th scenario, the HRES consists of a 5.1 kW wind turbine in addition to the previous configuration, leading to a close LCOE of 0.474 USD/kWh. The energy production of this system is 119 MWh, with the biomass generator, the Eurodish units, and the wind turbine generating 61 MWh, 54.2 MWh, and 3.76 MWh, which represent 51.3%, 45.6%, and 3.1%, respectively, whereas the excess energy is 28 MWh. As for scenario 11, the HRES includes a 40 kW biomass generator and 25 wind turbines, leading to a wind farm with a 127.5 kW capacity for the production of 136.6 MWh; 94 MWh of which is from the wind farm, and 42.2 MWh is produced via the biomass generator, which represent 69% and 31% of the production, respectively, with an energy excess of 45.3 MWh and an LCOE of 0.572 USD/kWh. The 12th scenario consists simply of a 40 kW biomass generator generating 91 MWh to satisfy the energy demand and with no energy excess for an LCOE of 0.602 USD/kWh. This is possible due to the availability of the biomass feedstock, as the biomass generator can operate only when it is needed and without depending on intermittent energy sources. Regarding scenario 13, the HRES involves a 110 kW Eurodish plant that consists of 11 units in addition to 732 batteries and a 65.1 kW converter for an LCOE of 0.739 USD/kWh. The system generates 199 MWh, with an energy excess of 94 MWh. With respect to scenario 14, the HRES is composed of 19 wind turbines and 9 Eurodish units, corresponding to a capacity of 96.6 kW and 90 kW, respectively, in addition to 627 batteries and a 55.4 kW converter. The system’s total energy production is 234.3 MWh, with the Eurodish plant accounting for 69.5% with 162.8 MWh and the wind farm accounting for 30.5% with 71.5 MWh, whereas the energy excess is 135.3 MWh and the LCOE is 0.759 USD/kWh. The final configuration presented in scenario 15 comprises 70 wind turbines, which is equivalent to a wind farm capacity of 357 kW; 1404 batteries; and a 54.9 kW converter. The system’s total production is 263.4 MWh, with an energy excess of 168.2 MWh and a very high LCOE of 1.15 USD/kWh.

3.2. Optimization Result Comparison and Analysis

In this section, we will compare and analyze different technical and economic aspects of the HRESs presented in the previous section. Firstly, the different LCOEs of all the scenarios starting from the lowest are presented in Figure 11.
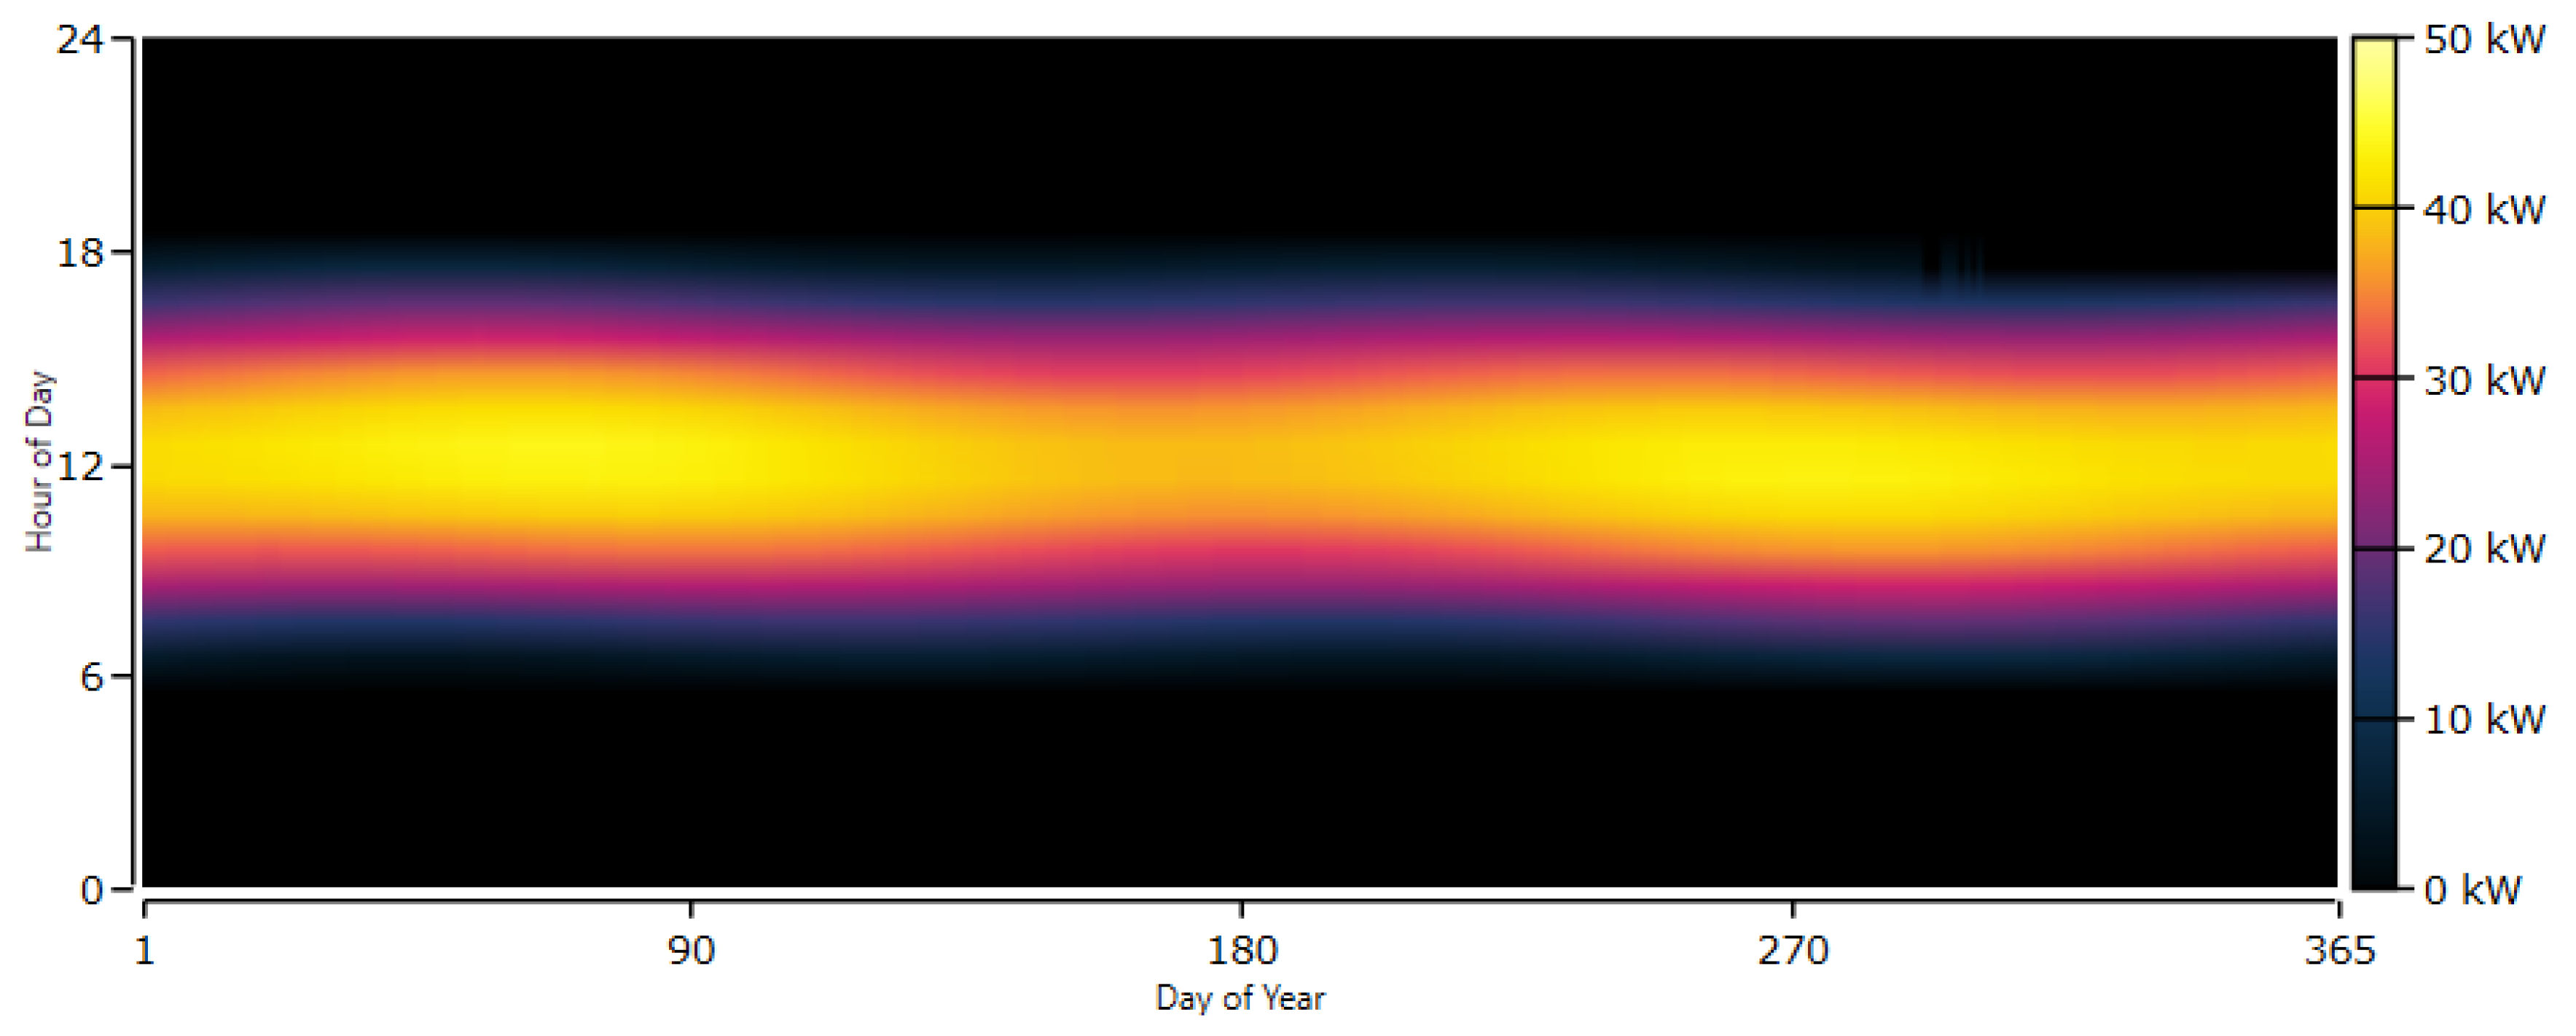
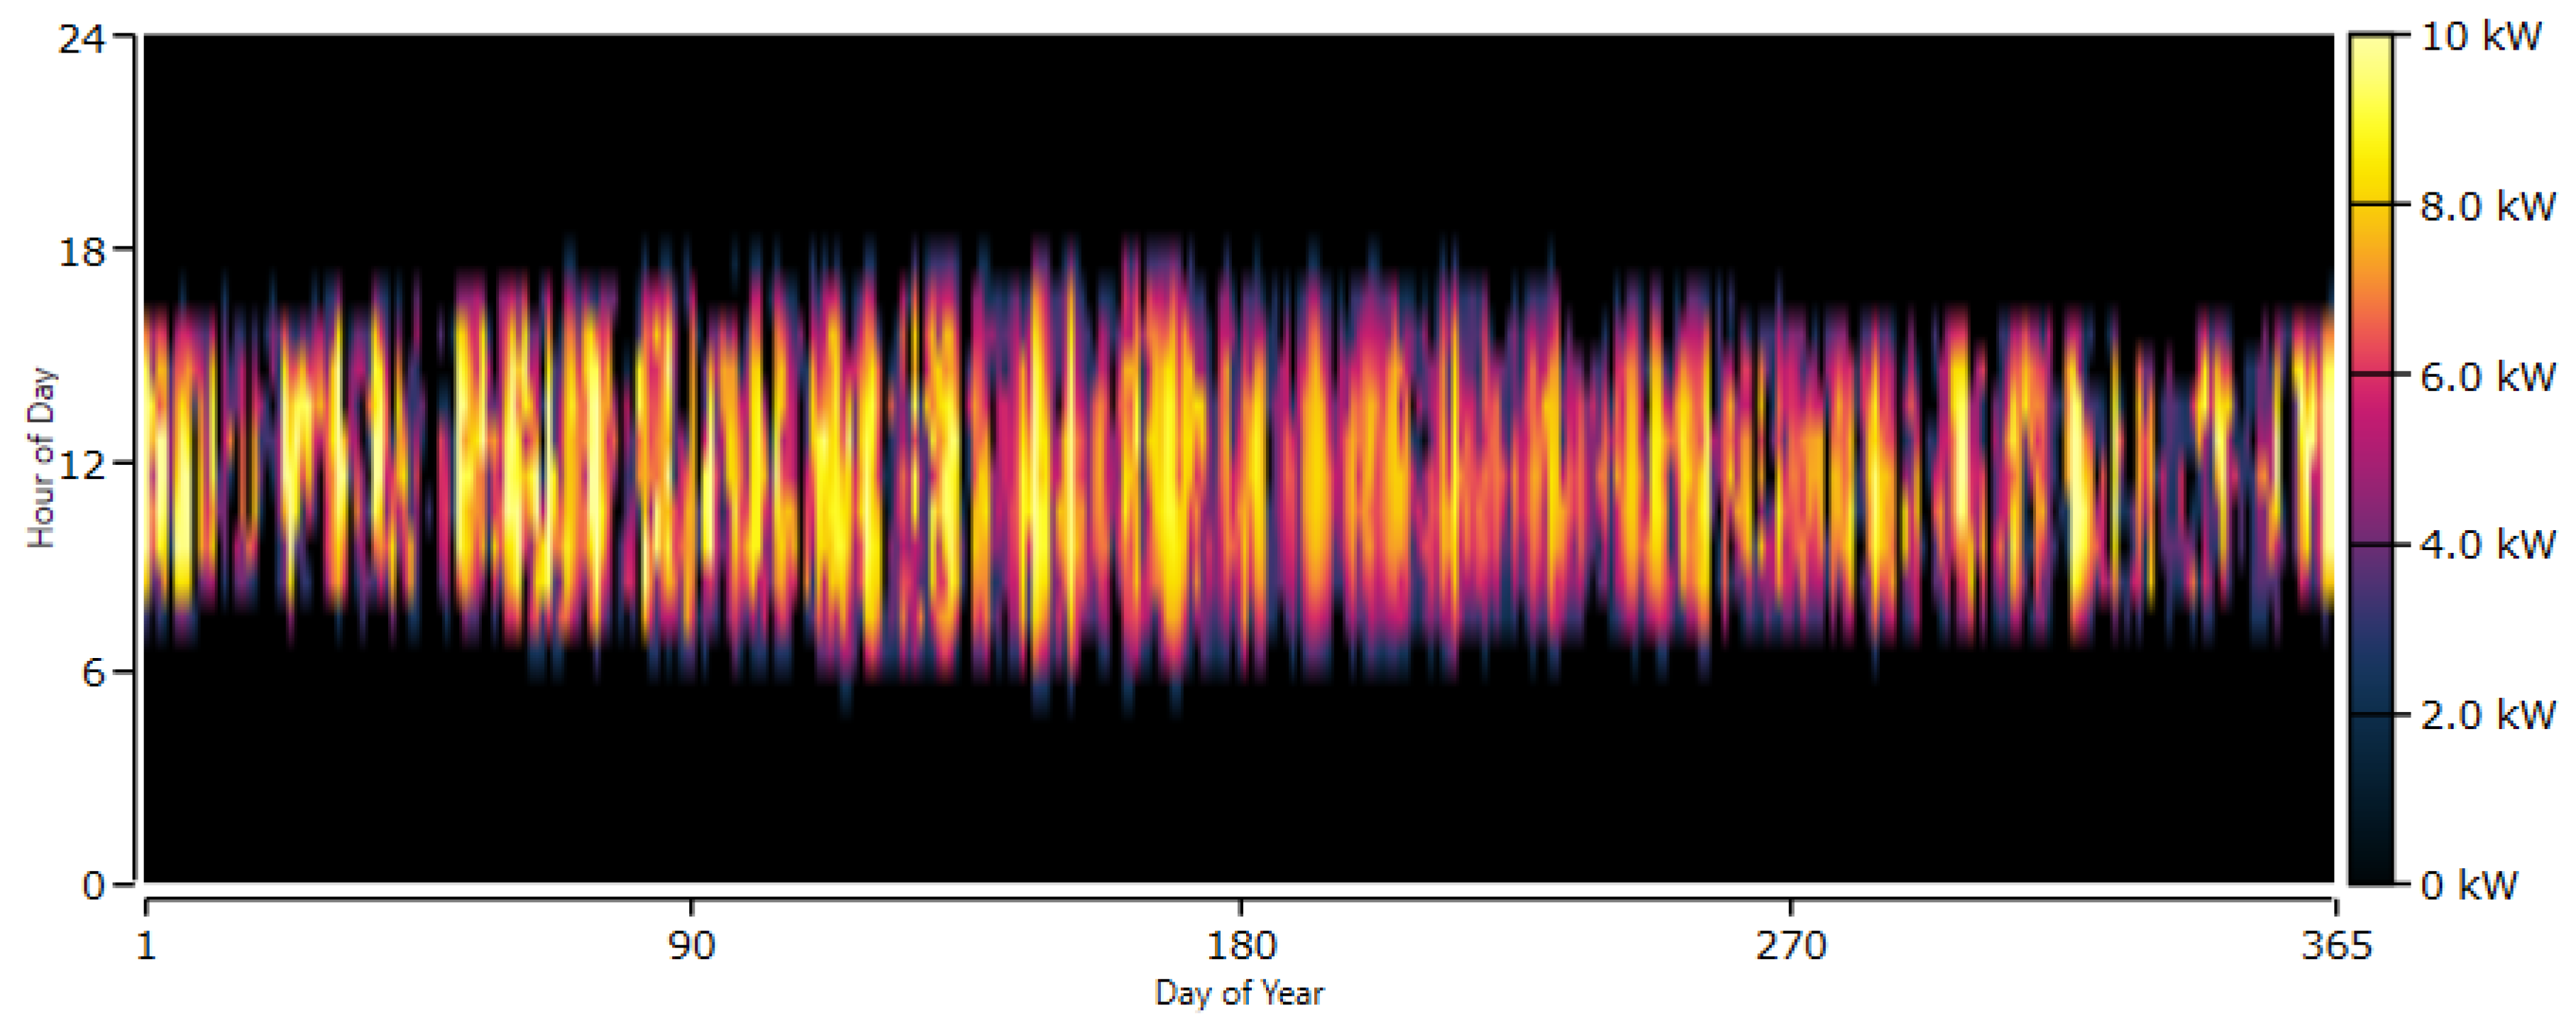
As can be observed in Figure 11, the HRES with the lowest LCOE is the PV/battery, with 0.184 USD/kWh, whereas the highest is the wind/battery, with 1.15 USD/kWh. It can also be observed that the first eight scenarios with the lowest LCOE include the PV technology in the HRES; this is due to its low investment cost in comparison to the other technologies, its high performance, and the availability of favorable meteorological conditions, especially the GHI. Indeed, Figure 12 presents the heat map of the 48.8 kW PV plant presented in scenario 1 as an example of the PV technology behavior throughout the year.
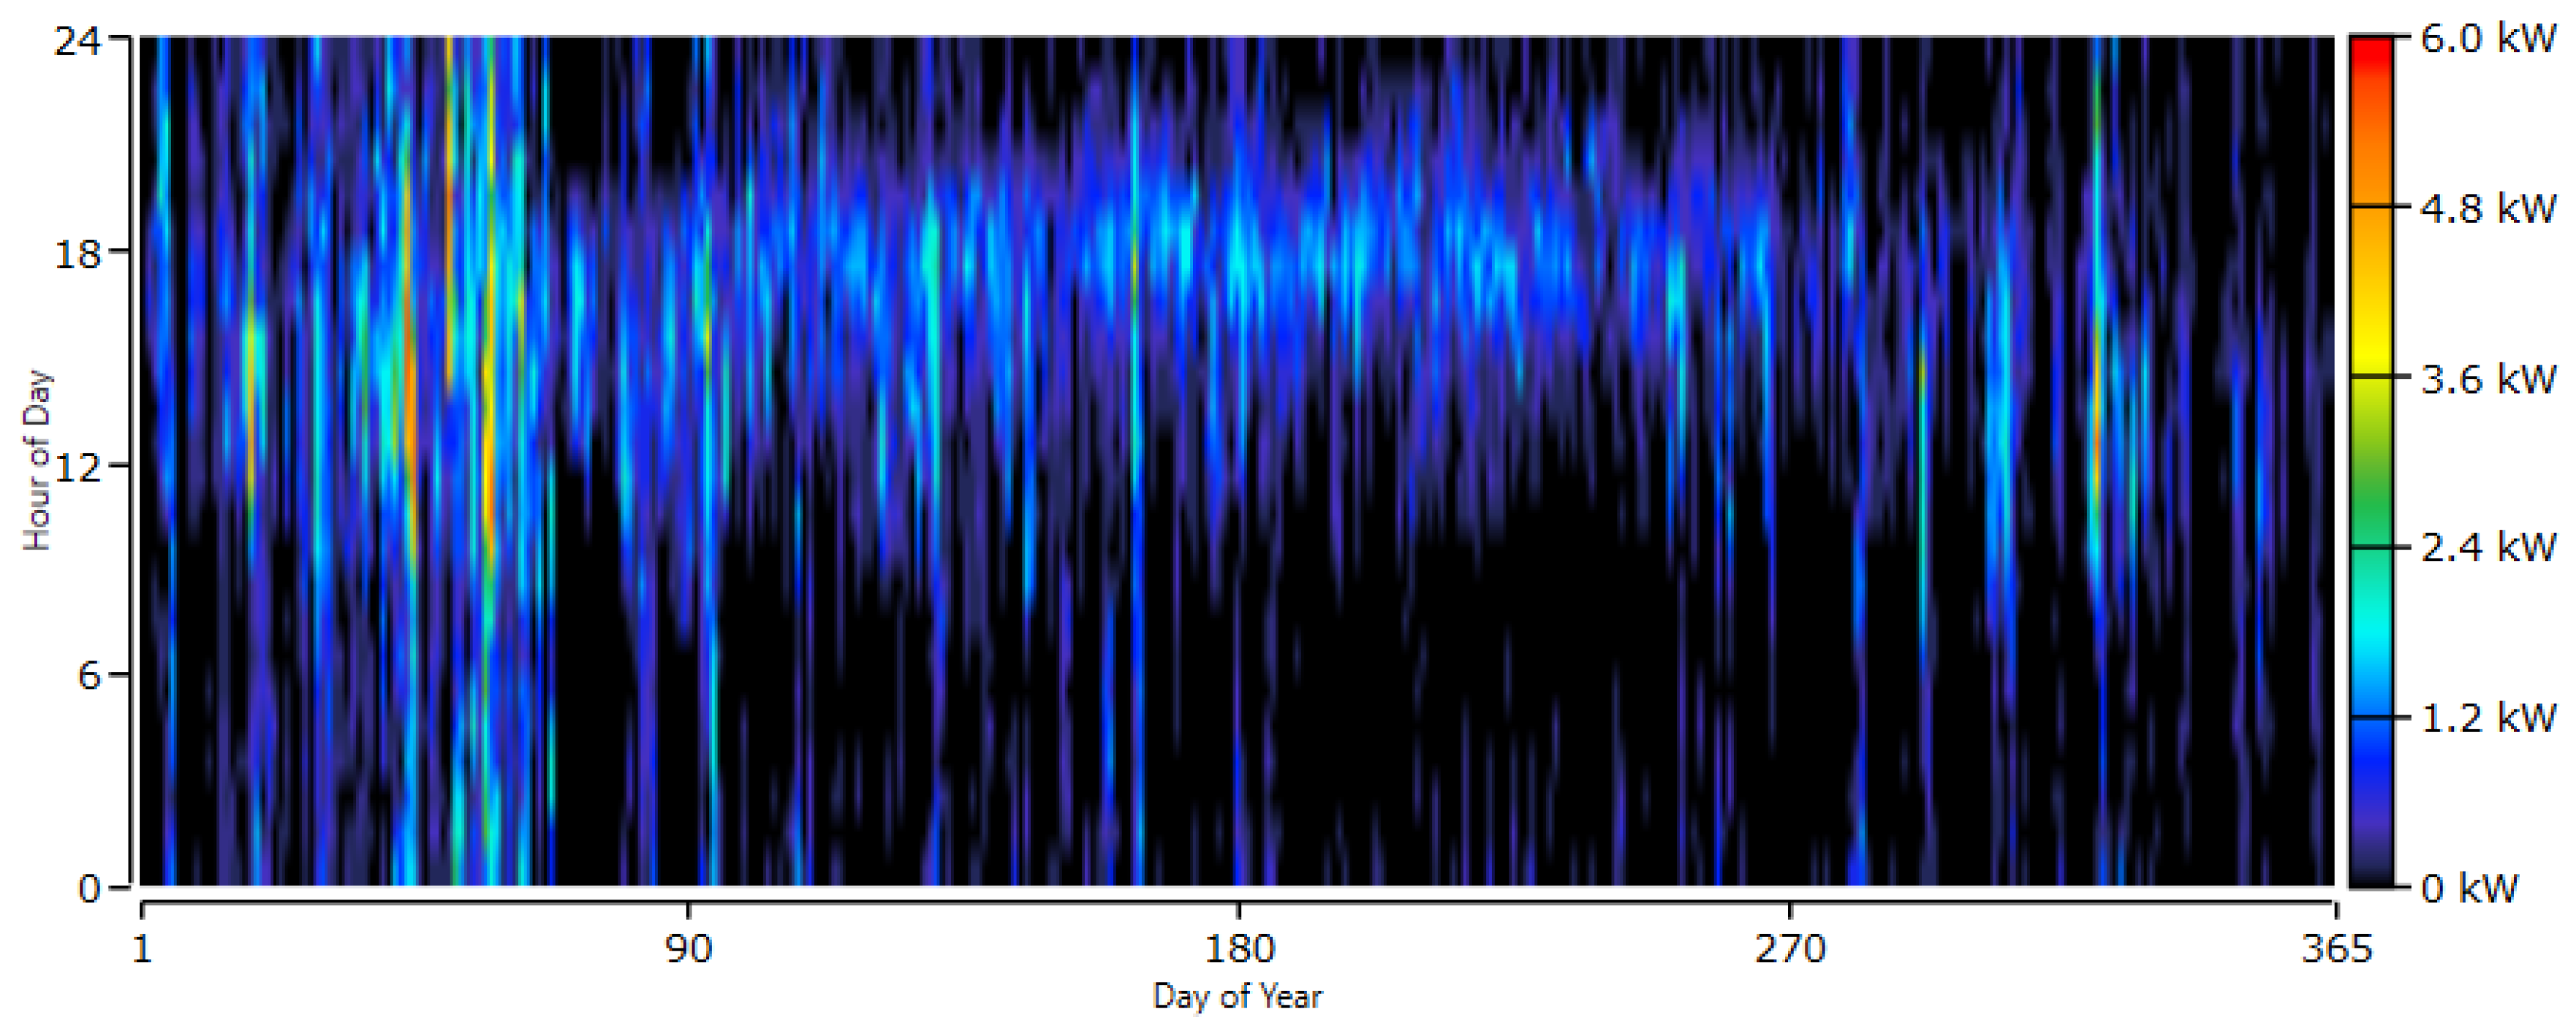
The heat map shows that the PV technology can operate with high efficiency for at least 8 h daily from 8 h to 16 h, with the highest production occurring at noon between 10 h and 15 h. Moreover, the production pattern presents small changes during the year, which can be considered as an advantage in terms of the reliability, which is very helpful for the HRES design. Regarding the wind energy power production, Figure 13 represents the heat map of the 5.1 kW wind turbine.
The first observation is the very high fluctuation in terms of the energy generation through the day and year contrarily to the energy production from the PV technology, which has a more regular pattern. In addition, the power output is, in general, lower than the wind turbine’s nominal capacity (5.1 kW). In fact, the wind turbine’s power generation does not exceed 2 kW throughout most of the year’s hours. Those results were expected due to the instable nature of the wind velocity and direction in addition to the limited wind resources at the study site.
With respect to the Eurodish technology, Figure 14 shows the heat map of one unit, which represents a rated capacity of 10 kW.
The results depicted in Figure 14 show a fluctuation in power generation during the year; however, it is not as high as in the case of the wind energy. Indeed, the Eurodish starts operating late in the morning until the evening from ~9 h to 15 h during the winter and fall, while this range is extended to ~8 h to 17 h in the late spring and summer. This is due to the fact that the Eurodish uses the Direct Normal Irradiation (DNI) for the energy conversion, which is highly affected by weather conditions, such as cloudy conditions and the presence of aerosols in the atmosphere. In addition, the Eurodish requires at a DNI of at least 300 W/m2 to start operating. Nonetheless, the Eurodish demonstrates a high performance for power generation, as it operates with a nominal capacity for extended durations during its working periods.
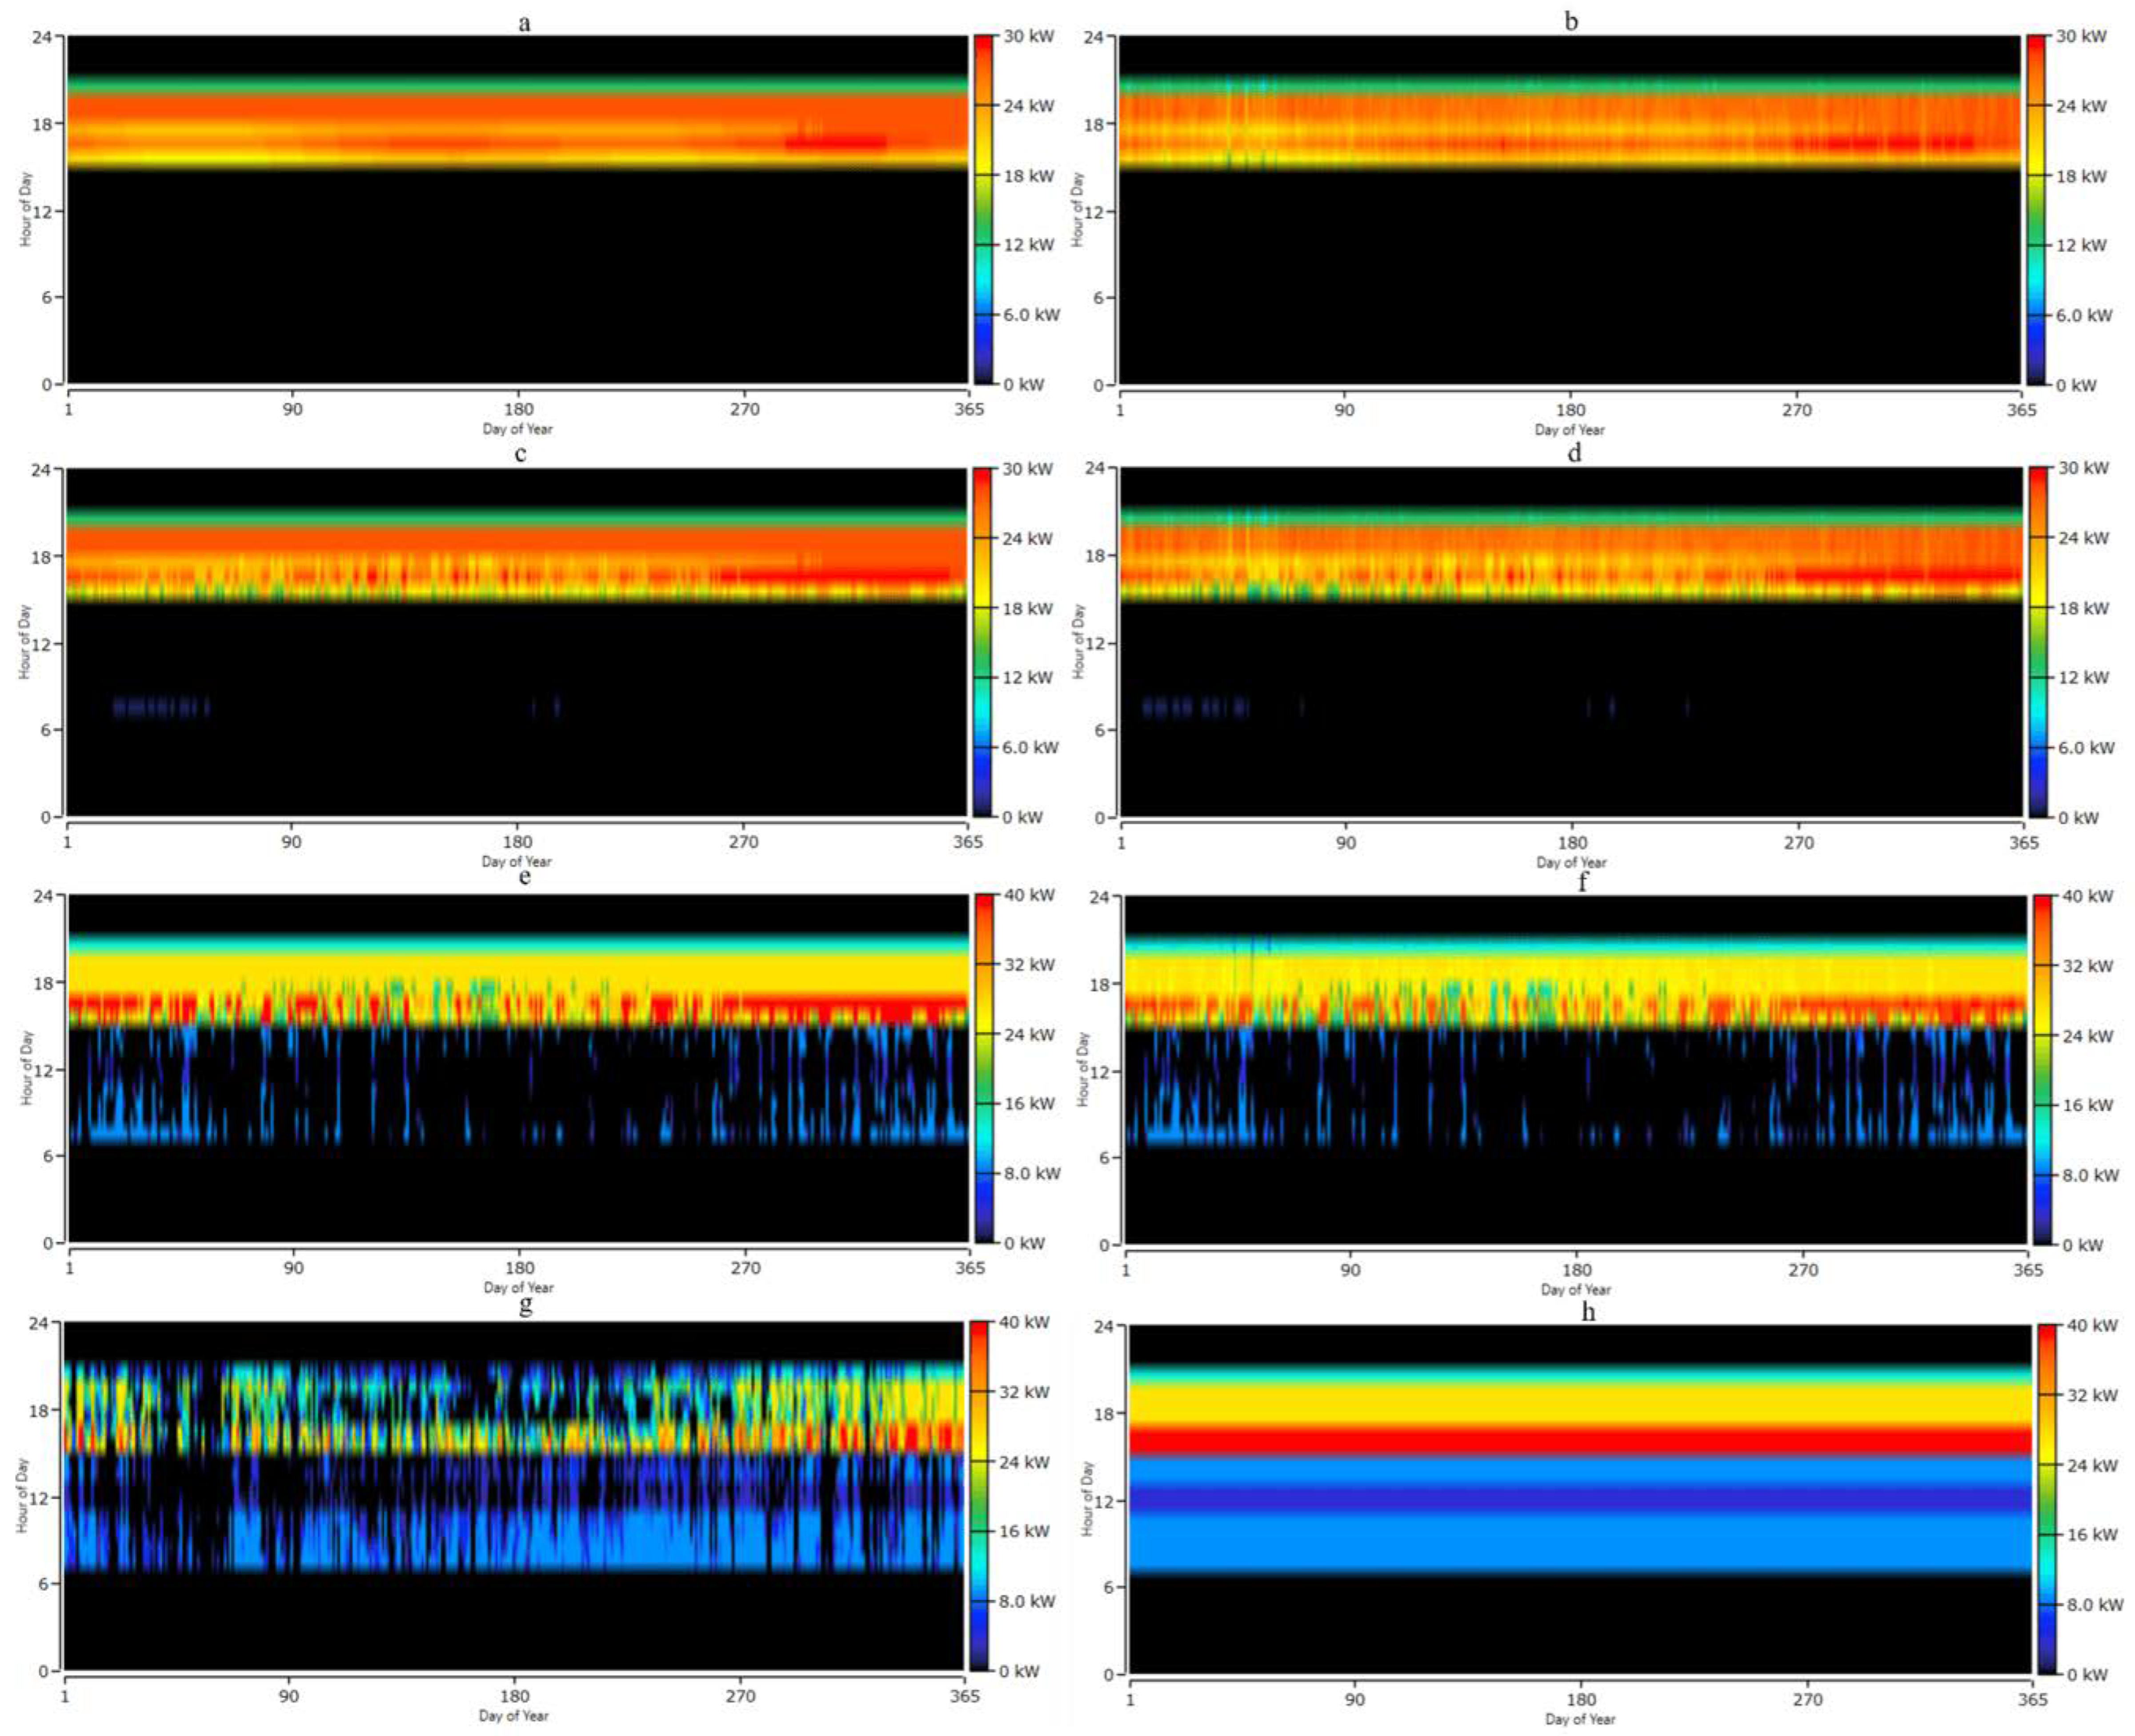
As mentioned above, the use of a storage medium is an important component for any off-grid HRES, due to the intermittent nature of the power generation of the RE technology, as noticed in the previous section. Firstly, we will assess the batteries’ performance under the various scenarios. To do so, we will use the battery’s State of Charge (SoC) as an indicator to have an idea about its performance throughout the year. Accordingly, in Figure 15 we present the battery SoC in the form of heat maps, allowing for a comprehensive evaluation of the seasonal and daily battery performance for each scenario where batteries were used.
In fact, each subfigure presented in Figure 15 corresponds to the SoC of different HRESs, and it can be observed that for all the configurations, a general pattern can be noticed as the SoC reaches its maximum capacity during the daytime, mainly due the energy generated by the solar-based technology, and then the capacity decreases during the nighttime in order to meet the load requirements. However, these patterns’ magnitude varies considerably between the different HRESs, revealing important insights on the systems’ stability and reliability. Indeed, for scenarios 1 (PV/batteries) and 2 (PV/wind/batteries), presented in subfigure a and b, respectively, the HRES shows a relatively stable SoC throughout the year, especially for scenario 1, with the high values of the SoC concentrated in the daytime period. In addition, the small change in the SoC for the different seasons suggests that the HRES sizing is adequate, with enough energy generation and storage capacity to satisfy the power demand, which leads to a reduction in the stress on the battery and an increase in the battery lifetime and consequently improves the HRES’s reliability and economic competitiveness.
Subfigures c and d show the SoC of scenarios 3 (PV/Eurodish/batteries) and 4 (PV/Wind/Eurodish/batteries), respectively. The results show a more noticeable fluctuation in comparison to the previous HRESs, with the presence of larger period with a low SoC (40%<), indicating a frequent energy deficiency mainly due to the mismatch of the power generation between the different technologies.
Regarding scenarios 13 (Eurodish/battery) and 14 (wind/Eurodish/battery) depicted in subfigures e and f, respectively, the SoCs have, in general, high values (80%>), as the heat map is dominated by the red and orange colors. In addition, the absence of clear charge and discharge cycles, similarly to the previous scenario, shows that the HRESs are oversized and the batteries’ capacity exceeds the electrical load needs. Although this will increase the HRESs’ reliability, it will significantly increase the system costs as well.
With respect to scenario 15 presented in subfigure g, for a HRES that consists of wind turbines and batteries, this configuration exhibits a high seasonal fluctuation. In fact, even though the SoC remains at a very high capacity for extended periods, a significate drop of the SoC, especially by the end of the year, is observed. This is also due to the system’s oversizing, in addition to the extreme fluctuation of the wind-based power generation as discussed earlier.
It is worth mentioning that the oversizing is due to the fact that the optimization model sizes the system to meet the load demand for each hour, and the presence of hours with a high demand can cause an oversizing of the HRES to satisfy this condition, especially with highly fluctuating RE sources.
The other component used as a storage medium in this study is the biomass generator. Accordingly, Figure 16 represents the annual operation in the form of heat maps as well, where the subfigures a, b, c, d, e, f, g, and h correspond to the power generation from the biomass generator for the scenarios 5, 6, 7, 8, 9, 10, 11, and 12, respectively.
The first observation is that for all the scenarios, the power generation mostly occurs during the late evening and nighttime to compensate for the intermittent power nature of RE sources, mainly the solar-based one. Indeed, for scenarios 5 to 8, the power generation takes place exclusively at nighttime, with the production in scenarios 5 and 6 showing high stability throughout the year as it operates with very low fluctuations and minimal seasonal variations, which indicates that the HRES is well sized. While for scenarios 7 and 8, a small variation in the biomass power generation can be observed scattered throughout the year. These variations are due to the low power generation from the renewable power sources for prolonged periods. The previous results show that the HRESs’ design relies primarily on the RE sources with the biomass generator as the backup.
Regarding scenarios 9 and 10, the involvement of the power generation of the biomass generator is more frequent with wider operation periods during the daytime and nighttime. This shows that the HRES relies heavily on the biomass generator to satisfy the energy demand due to the high intermittency of the RE source used in these scenarios.
As for scenario 11, the biomass generation is almost continuous across the year and with a high intensity, indicating that the HRES overly depends on the biomass generator as the main source for energy, not as a backup, which is due to the low power generation and high fluctuation from the wind turbine. Scenario 12 depicts the case where the biomass generator is used exclusively to meet the load demand, which is technically possible and can ensure more reliability in terms of the power supply, but it diminishes the many advantages of the HRES and has higher operational expenditures, especially with regard to the biomass feedstock consumption.
Indeed, the annual biomass consumption by each HRES is presented in Figure 17. It can be observed that the consumption for scenarios 5–8 is almost equal at around 253 tons annually; except for scenario 8, where it drops to 247 tons. This is due to the fact that most of the generation is ensured by renewables, while the biomass generator is used as a backup. Scenarios 9 and 10 are the HRESs with the highest biomass consumption, with 324 and 315 tons, respectively, since the main source of power in this HRES is the Eurodish, which generates power only during the daytime and has a very fluctuant nature, as discussed above. Whereas the HRES composed of the wind turbines and biomass in scenario 11 consumes 261 tons, which is lower than the previous scenario, mainly due to the capacity of the wind turbine to generate electricity during the nighttime. As for scenario 12, it shows that the capacity of a 40 kW biomass generator is able to meet the energy demand, with a yearly biomass feedstock of 497 tons.
With respect to the HRES economics, Figure 18 represents the systems’ total expenses over their lifetime, including the capital, replacement operation and maintenance, and biomass consumption. As can be observed, the results are similar to the LCOE, as the systems with lower costs have the lower LCOE and vice versa. The HRES requiring the lowest cost is the PV/battery in scenario 1, with USD 262,810. In fact, all the scenarios that include PVs with batteries achieve lower costs (in the range of USD 262,810 and USD 313,203). The costs increase when using the biomass generator instead of batteries as backups for the same configuration, in the range of USD 427,757 and USD 489,073, which is due to the higher operational costs associated with biomass generators, such as fuel consumption.
Also, a significant rise in the system costs is observed when using the Eurodish and wind turbine technologies, ranging from USD 673,069 for the Eurodish biomass configuration up to USD 1.08 M for the wind/Eurodish/batteries, where the highest cost is observed in the case of the wind turbines and batteries combination, with USD 1.6 M. This is due to the high investment costs of the wind turbine technology coupled with its highly fluctuating power production in addition to the limited RE sources in the study location, especially the wind velocity, which lead to the oversizing of the system and consequently an increase in all the associated costs.

3.3. Environmental Impact

One of the greatest advantages associated with the HRESs is their positive environmental impact, especially the reduction in the CO2 emissions, caused by the fossil energy sources used for electricity generation in the conventional grid. Accordingly, in this section, we will assess the potential CO2 emissions reduction by estimating the avoided CO2 for each scenario. The avoided CO2 is calculated by the following formula in order to compare the CO2 emissions by the HRESs in comparison to the case where the conventional electricity grid is used [42]:
A V C O 2 = E P V f g f P V + E W T f g f W T + E b i o f g f b i o + E E d f g f E d 10 6
where AV C O 2 represents the annual CO2 emissions that can be avoided by the HRES in tons; E PV , E WT , E bio , and E Ed are the annual electricity production in kWh by PVs, wind turbines, biomass generators, and the Eurodish, respectively. The annual CO2 emissions by the different HRES technologies is estimated by the Life Cycle Assessment method to estimate their carbon footprint, which is quantified by the life cycle emissions factor f that represents the amount of CO2 emitted for each kWh generated. Consequently, the following values were taken for each technology, where f PV , f WT , f bio , and f Ed represent the life cycle emissions factor taken as 50, 13.7, 16.5, and 22 g of CO2 per kWh annually for PVs, wind turbines, biomass, and the Eurodish, respectively. As for f g , it represents the CO2 emissions by the electricity grid, which is considered for the Moroccan case as 746 g of CO2 per kWh [50,51,52]. The potential CO2 emissions reduction is presented in Figure 19.
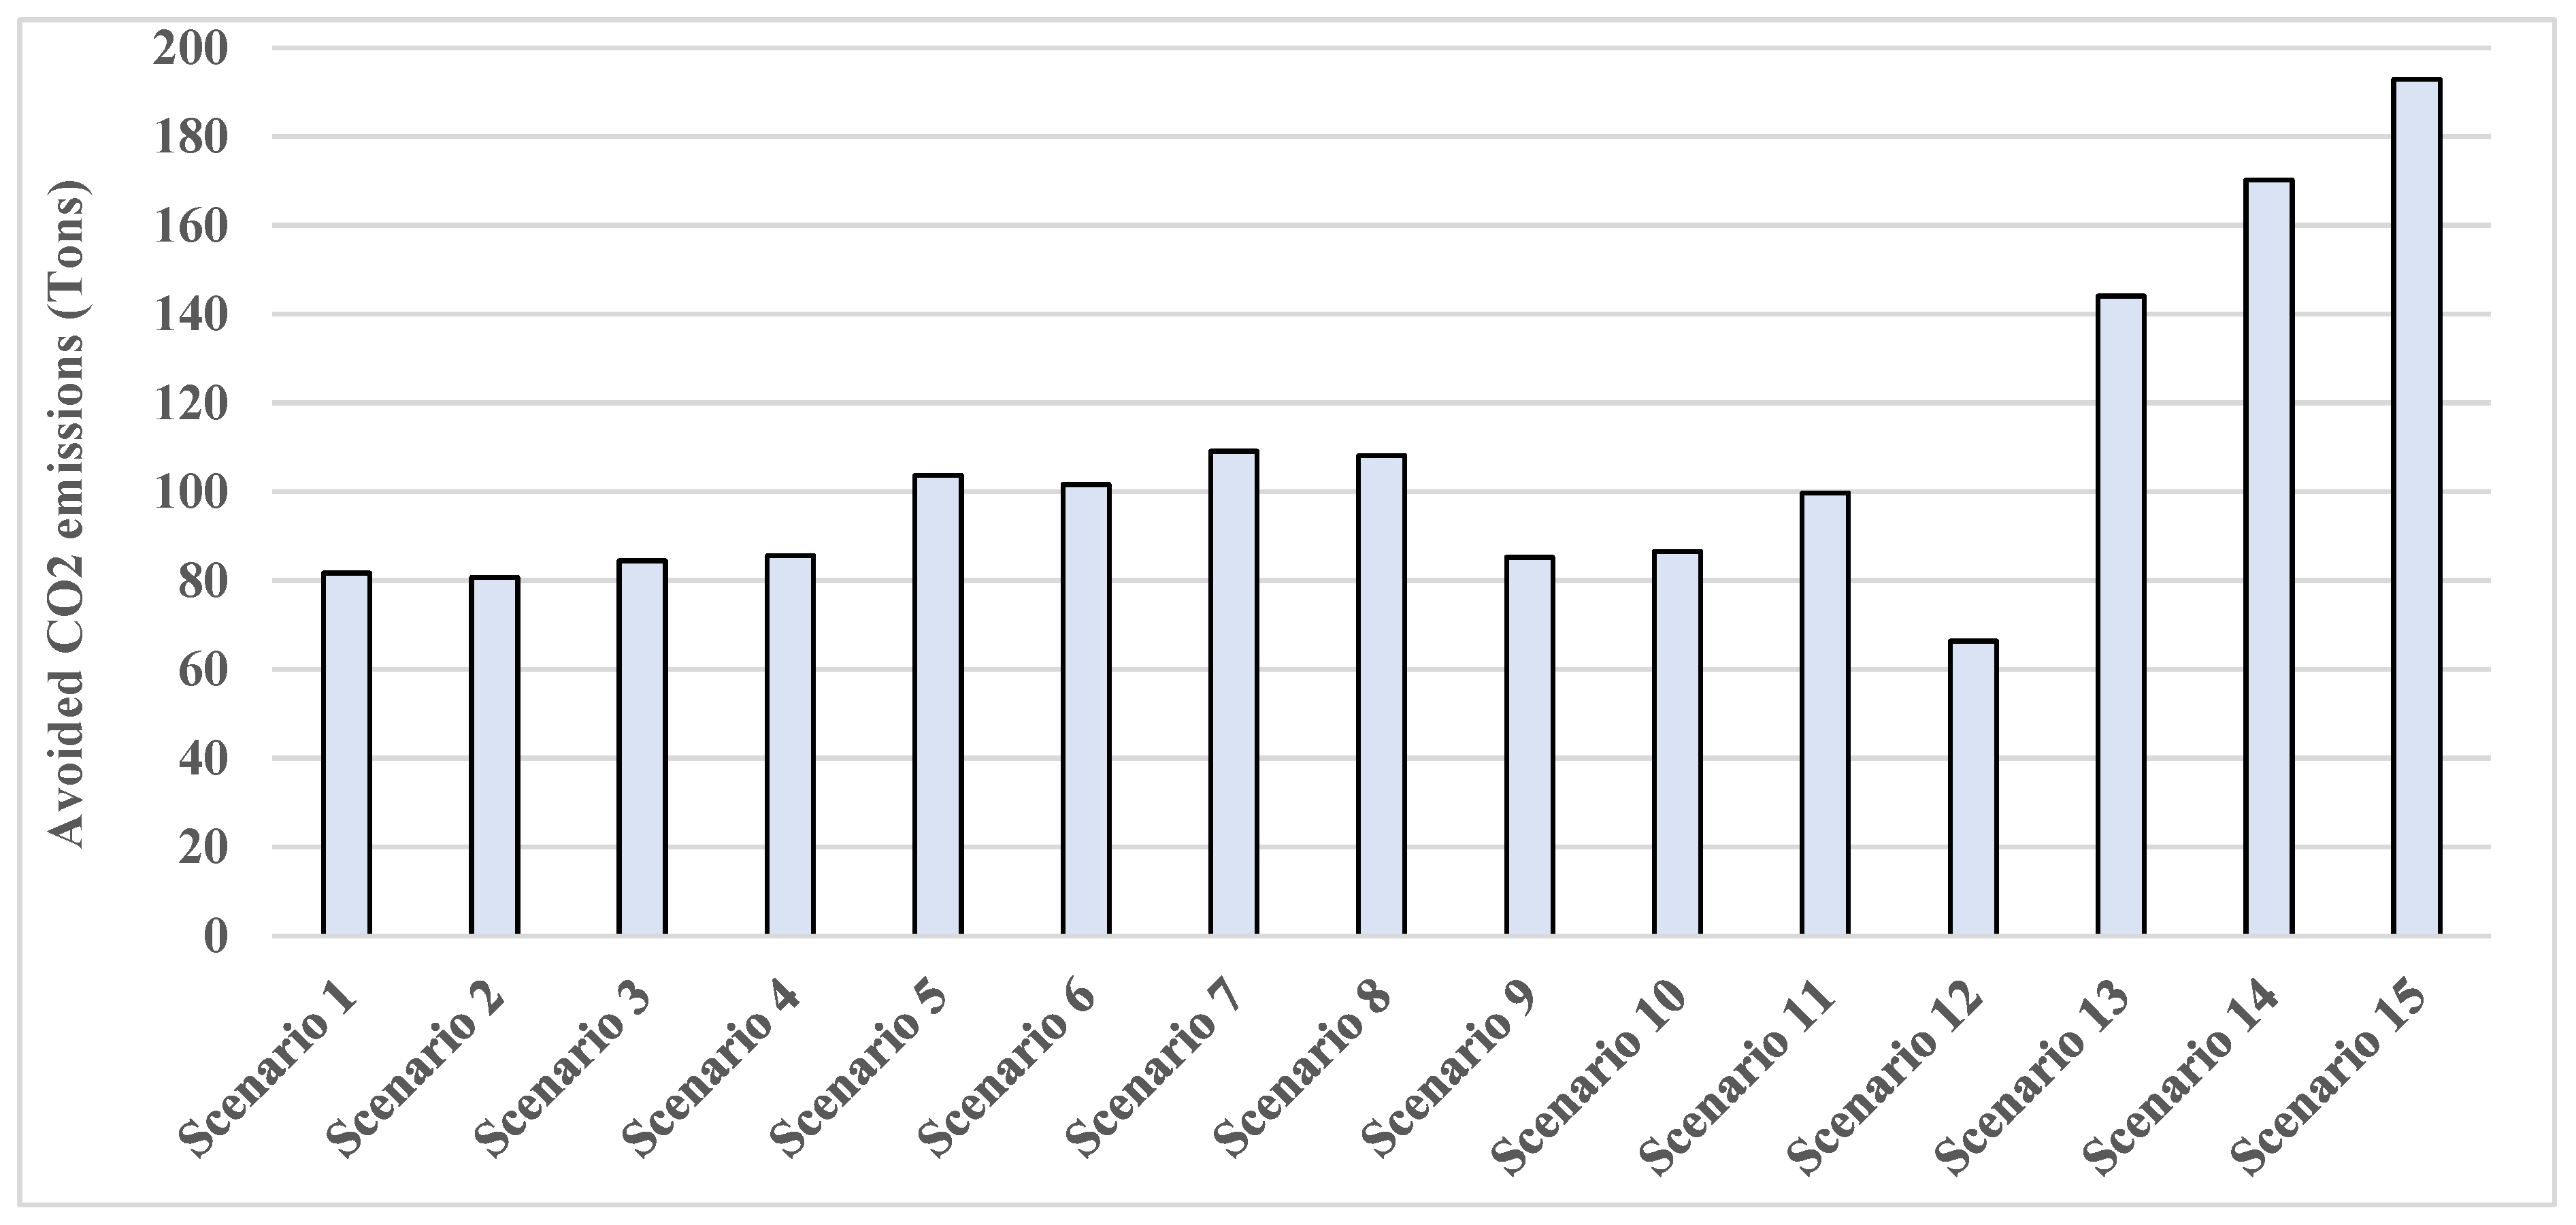
The results show that a significant amount of CO2 can be avoided by using the HERSs instead of the conventional electricity grid. For scenarios 1 to 11, the avoided CO2 emissions are in the range between 80 and 110 tons per year, with the optimal scenario 1 (PV/Battery) reducing up to 81.7 tons annually. As for scenario 12, it can be noticed that it has the lowest CO2 emissions avoided, with 66.3 tons/year; this is because in this scenario only a biomass generator is used, which can generate the exact amount of the required electricity with no energy excess. On the other hand, scenarios 13–15 have the higher amount of avoided CO2 emissions because they are oversized, as mentioned above, leading to high amounts of energy excess, and consequently higher amounts of CO2 can be avoided.

3.4. Result Validation

In order to demonstrate the technical and economic viability of the HRESs developed in this study, we validate the obtained results against similar recent studies in different locations. The LCOE is used as a metric for the comparison, because it takes into consideration both the technical and economic aspect of the HRES, which allows for a fair comparison between different HRES configurations and different locations. The details of the selected studies are gathered in Table 4.
Table 4. The selected studies for comparison.
LocationHRES ConfigurationLCOE (USD/kWh)Reference
Sidhwanbet, Punjab, IndiaPV/biomass/battery0.362[26]
Koh Samui Island, ThailandPV/wind/fuel cell/battery0.309[27]
Arandun, NigeriaPV/CSP/hydropower/battery0.26[28]
North-East IndiaPV/fuel cell0.509–0.689[32]
Pirthala, Haryana, IndiaPV/hydropower/battery0.782[53]
Countryside area in EgyptPV/wind/fuel cell0.47 [54]
Countryside region in TurkeyPV/wind/fuel cell0.55[55]
Gobardhanpur village, IndiaPV/biomass/wind/battery
PV/biomass
0.278
0.455
[56]
The lowest LCOE reported in Table 4 is 0.26 USD/kWh, which is recorded in Arandun, Nigeria, from a HRES configuration of a PV plant, a CSP plant, a hydropower plant, and a battery, while the highest LCOE is 0.782 USD/kWh in Pirthala, Haryana, India, from a PV plant, a hydropower plant, and a battery configuration. The LCOE of the optimal scenario in this study was found to be equal to 0.184 USD/kWh, which is significantly lower than all the HRESs used for the benchmark. Moreover, several of the various HRESs designed for this study can be considered as competitive, especially the one dominated by the PV technology. This indicates that the HRES design and approach adopted in this study is effective, as it can provide a cost-effective HRES according to the resource availability.

3.5. Sensitivity Analysis

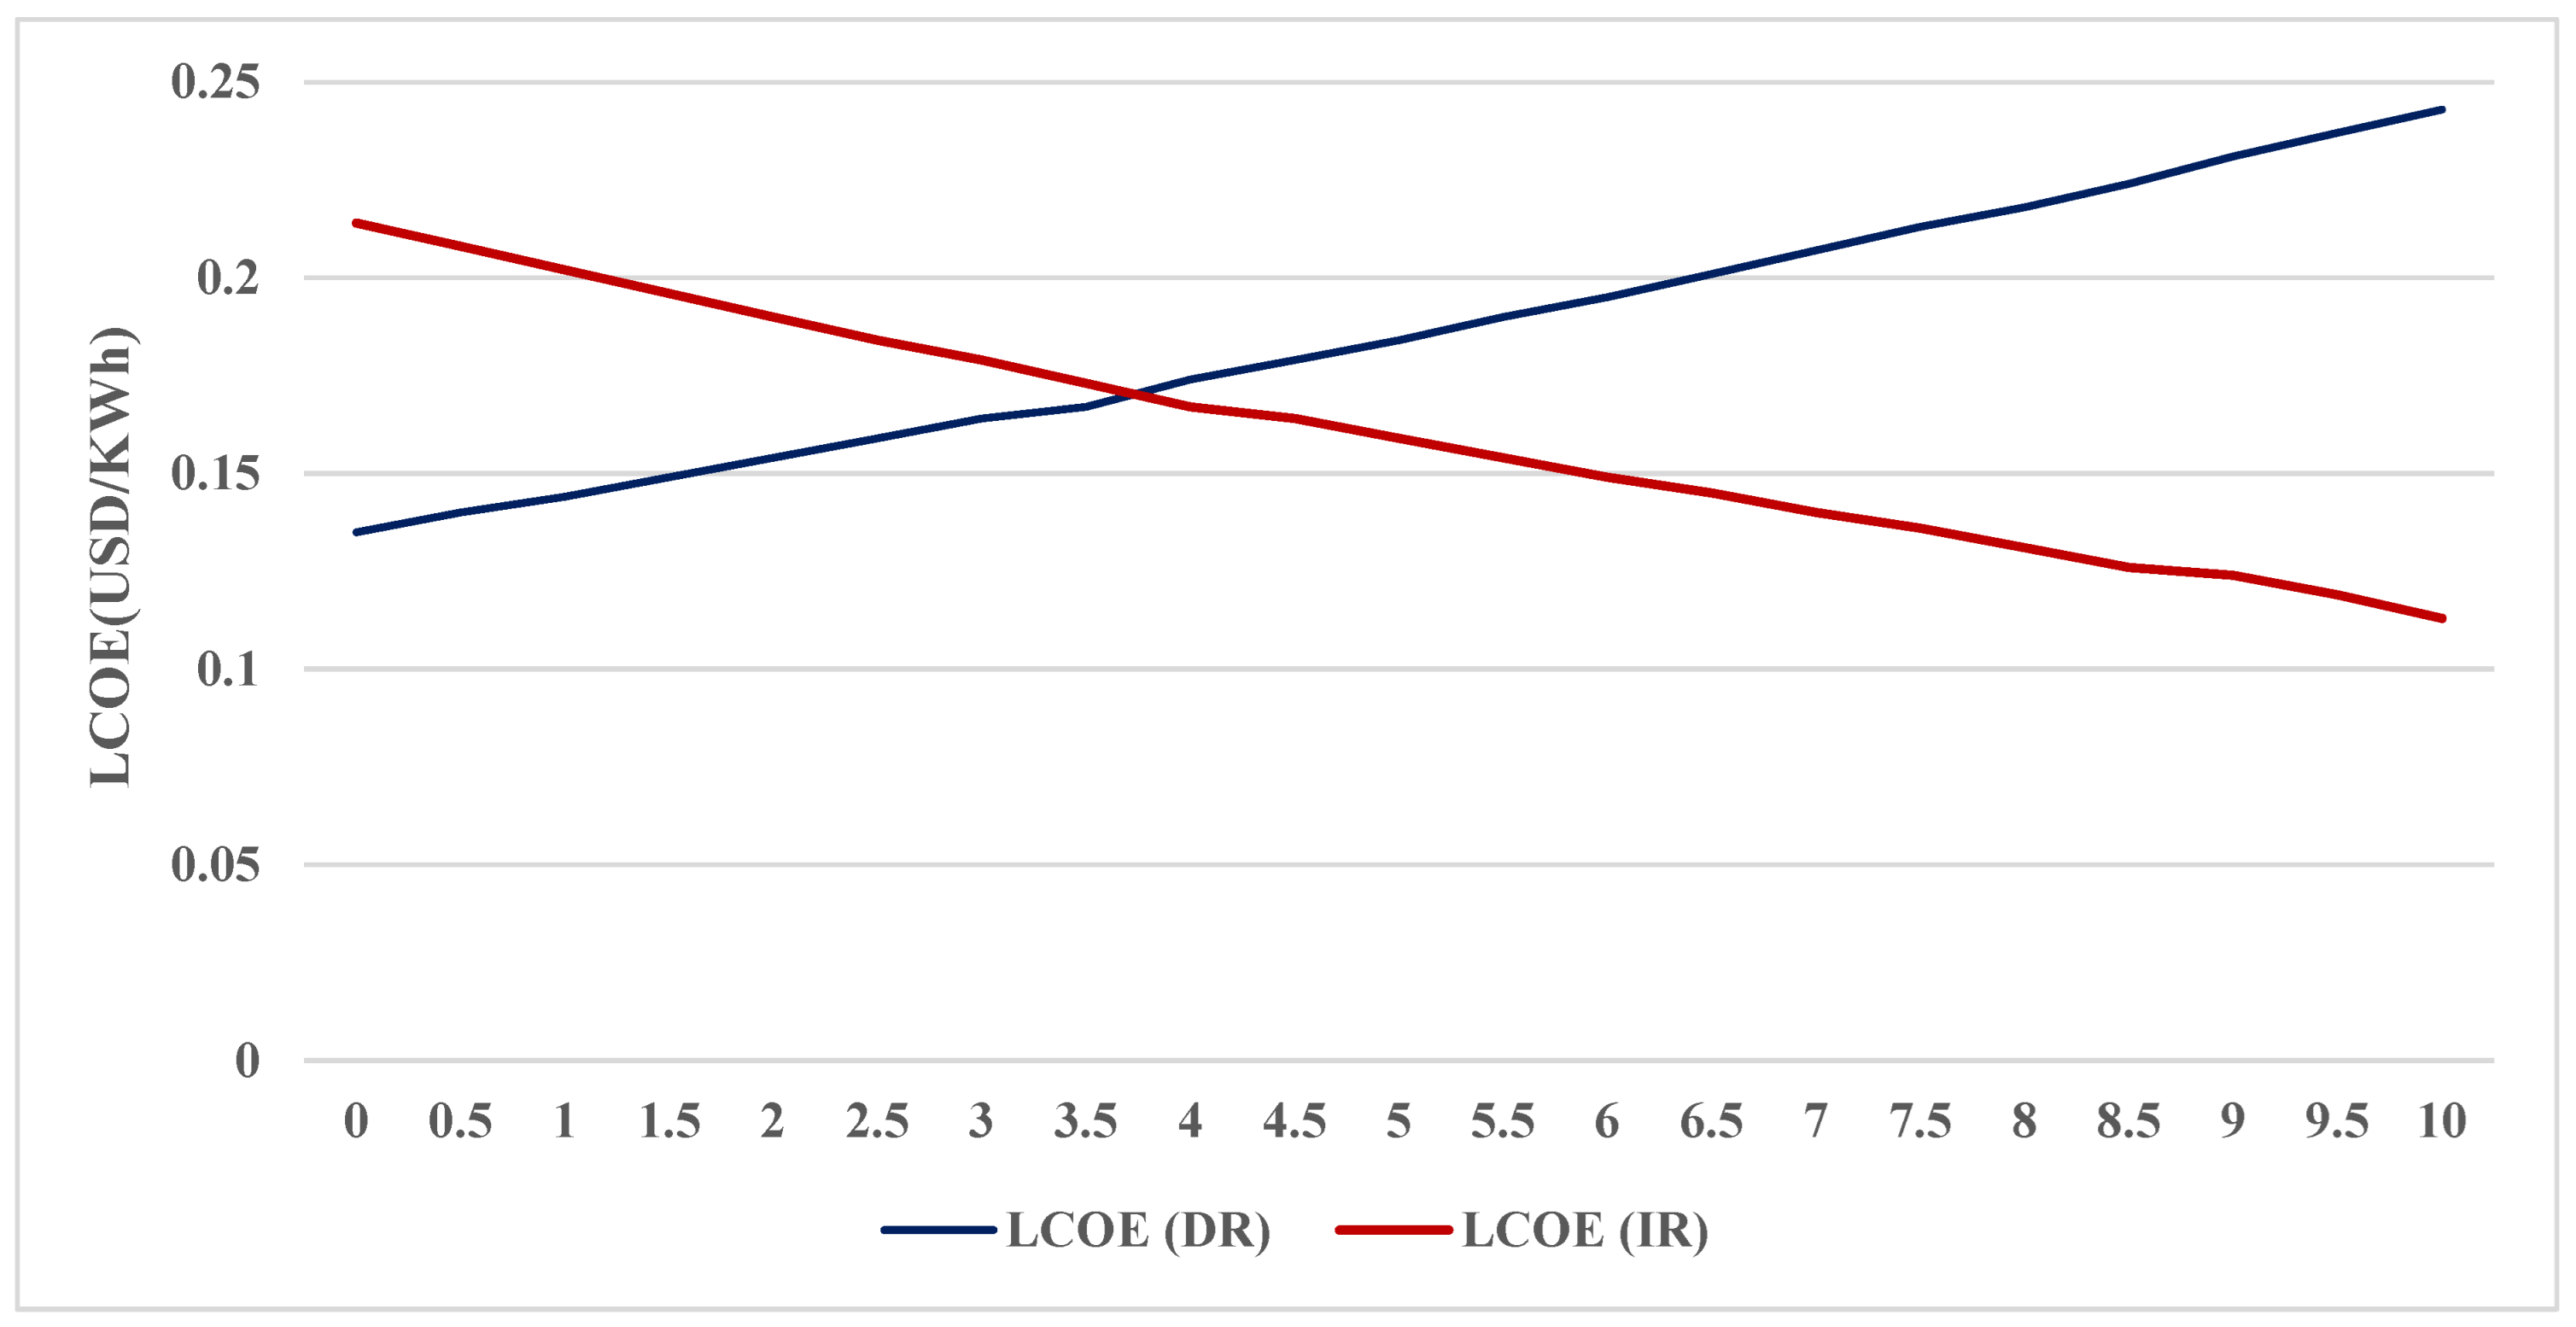
In this section, a sensitivity analysis is conducted in order to explore the impact of key financial parameters on the technical and economic performance of the optimal HRES (scenario 1) composed by the PV plant and batteries. Accordingly, the impact of the discount rate and inflation rate variation on the LCOE, considered as an index of the system’s technico-economical performance, is explored. To do so, we change the value of the inflation rate from 0% to 10% while fixing the discount rate. Similarly, we change the discount rate value from 0% to 10% while the inflation rate is fixed. The impact of the variation in the discount rate and the inflation rate on the LCOE is illustrated in Figure 20.
As can be observed, the LCOE is highly influenced by the discount rate and inflation rate. Indeed, when the inflation rate is increased, the LCOE decreases from 0.214 USD/kWh at 0% to 0.113 USD/kWh at 10%. Contrarily, the LCOE has the opposite behavior regarding the discount rate, as the LCOE increases from 0.135 USD/kWh at 0% to 0.243 USD/kWh at 10%. Also, it can be noticed that at around the value of 4%, a similar LCOE is recorded, ~0.17 USD/kWh, but beyond this point the discount rate-based LCOE tends to be more conservative with higher values, whereas the inflation rate-based LCOE shows more optimistic projections with lower values.

4. Conclusions

This research investigates the potentiality to achieve the 100% renewable electrification of a remote village in Ain Beni Mathar, eastern Morocco. To this end, we evaluated 15 possible HRESs incorporating PVs, wind, and the CSP-Eurodish, with a biomass generator and battery as a backup. The HRESs’ design and optimization was carried out by the HOMER software using high-accuracy meteorological data gathered at the ground level. The most optimal configuration identified consists of a 48.8 kW PV plant and 213 batteries with a converter capacity of 43.8 kW, achieving an LCOE of 0.184 USD/kWh, while generating 117.5 MWh per year, with a total lifetime cost of USD 262,810 and 81.7 tons/year of avoided CO2 emissions. HRESs that include wind turbines and the Eurodish exhibit higher costs, with an LCOE between 0.472 and 1.15 USD/kWh, due to fluctuating power production patterns because of resource intermittency, leading to system oversizing. As for the biomass generator, although it has shown a high reliability as a backup, it increases the system costs and consumes a significant amount of biomass feedstock, in the range of 250 tons and 500 tons depending on the scenario.
Overall, this study’s findings demonstrate that the PV-dominated HRESs with batteries as the storage medium are the most suitable for the studied site due to their high reliability, economic viability, and low environmental impact. In addition, it provides important information on different aspects of the HRESs for remote area electrification.
However, this study has several limitations that will be addressed in future works: the results are site-specific as they are based on high-accuracy measurements for a single location, and therefore the results may not be applicable for other locations with different climatic conditions. Also, other technologies may be a viable option, such as hydropower or geothermal plants, in addition to more advanced storage technologies, like fuel cells, as well as the consideration of different biomass feedstocks. In future work, the findings of this study will be extended to other locations with different climatic conditions, with the use of various biomass feedstocks and the investigation of other renewable and storage technologies, such as hydrogen-based fuel cells, as well as various hybridization strategies.

Author Contributions

Conceptualization, N.E.C., S.T., A.A. and A.A.M.; methodology, N.E.C., S.T., A.A. and A.A.M.; software, N.E.C., S.T. and A.A.; formal analysis, N.E.C.; S.T., A.A. and A.A.M.; investigation, N.E.C., S.T. and A.A.; writing—original draft preparation, N.E.C., S.T. and A.A.; writing—review and editing, A.A.M.; supervision, A.A.M. All authors have read and agreed to the published version of the manuscript.

Funding

This research received no external funding.

Data Availability Statement

Data will be available upon request to the corresponding author.

Acknowledgments

The authors would like to thank the Ain Beni Mathar power plant for providing the necessary meteorological data for this study.

Conflicts of Interest

The authors declare no conflicts of interest.

Abbreviations

The following abbreviations are used in this manuscript:
HRESHybrid Renewable Energy System
RERenewable Energy
PVPhotovoltaic
CSPConcentrating Solar Power
SDStirling Dish
LCOELevelized Cost of Energy
SoCState of Charge
CO2Carbon Dioxide
GHIGlobal Horizontal Irradiance
DNIDirect Normal Irradiance
NPCNet Present Cost
CRFCapital Recovery Factor

References

  1. Saleem, S.; Farhan, M.; Raza, S.; Awan, F.G.; Butt, A.D.; Safdar, N. Power Factor Improvement and MPPT of the Grid-Connected Solar Photovoltaic System Using Nonlinear Integral Backstepping Controller. Arab. J. Sci. Eng. 2023, 48, 6453–6470. [Google Scholar] [CrossRef]
  2. Guchhait, R.; Sarkar, B. Increasing Growth of Renewable Energy: A State of Art. Energies 2023, 16, 2665. [Google Scholar] [CrossRef]
  3. Yolcan, O.O. World energy outlook and state of renewable energy: 10-Year evaluation. Innov. Green Dev. 2023, 2, 100070. [Google Scholar] [CrossRef]
  4. Deshmukh, M.K.G.; Sameeroddin, M.; Abdul, D.; Sattar, M.A. Renewable energy in the 21st century: A review. Mater. Today Proc. 2023, 80, 1756–1759. [Google Scholar] [CrossRef]
  5. Ellabban, O.; Abu-Rub, H.; Blaabjerg, F. Renewable energy resources: Current status, future prospects and their enabling technology. Renew. Sustain. Energy Rev. 2014, 39, 748–764. [Google Scholar] [CrossRef]
  6. World Energy Outlook 2023—Analysis—IEA. Available online: https://www.iea.org/reports/world-energy-outlook-2023 (accessed on 29 April 2025).
  7. Jacobson, M.Z.; Delucchi, M.A.; Bauer, Z.A.F.; Goodman, S.C.; Chapman, W.E.; Cameron, M.A.; Bozonnat, C.; Chobadi, L.; Clonts, H.A.; Enevoldsen, P.; et al. 100% Clean and Renewable Wind, Water, and Sunlight All-Sector Energy Roadmaps for 139 Countries of the World. Joule 2017, 1, 108–121. [Google Scholar] [CrossRef]
  8. Renewable Energy—Powering a Safer Future|United Nations. Available online: https://www.un.org/en/climatechange/raising-ambition/renewable-energy (accessed on 29 April 2025).
  9. Achin Jain, A.J.; Vanita Jain, V.J. Renewable Energy Sources for Clean Environment: Opinion Mining. AJW Asian J. Water Environ. Pollut. 2019, 16, 9–14. [Google Scholar] [CrossRef]
  10. Achieving Net-Zero Emissions by 2050—World Energy Outlook 2020—Analysis—IEA. Available online: https://www.iea.org/reports/world-energy-outlook-2020/achieving-net-zero-emissions-by-2050 (accessed on 29 April 2025).
  11. Renewable Energy Target Setting. Available online: https://www.irena.org/publications/2015/Jun/Renewable-Energy-Target-Setting (accessed on 1 May 2025).
  12. Rubino, A.; Öztürk, I.; Lenzi, V.; Campi, M.T.C. (Eds.) Regulation and Investments in Energy Markets: Solutions for the Mediterranean, 1st ed.; Elsevier: Waltham, MA, USA, 2015. [Google Scholar]
  13. Moudene, K.; El-Oud, R.; Ejbari, R.; Amedjar, A. Renewable Energy and Economic Growth in Morocco. JHRSS J. Hum. Resour. Sustain. Stud. 2023, 11, 401–413. [Google Scholar] [CrossRef]
  14. Nakach, I.; Mouhat, O.; Shamass, R.; El Mennaouiy, F. Review of strategies for sustainable energy in Morocco. Polityka Energetyczna—Energy Policy J. 2023, 26, 65–104. [Google Scholar] [CrossRef]
  15. Renewable Energy in Morocco|EcoMENA. Available online: https://www.ecomena.org/renewable-energy-in-morocco/ (accessed on 2 May 2025).
  16. El Mokhi, C.; Choukai, O.; Hachimi, H.; Errouhi, A.A. Assessment and optimization of photovoltaic systems at the University Ibn Tofail according to the new law on renewable energy in Morocco using HOMER Pro. Energy Harvest. Syst. 2023, 10, 55–69. [Google Scholar] [CrossRef]
  17. El-Maaroufi, A.; Daoudi, M.; Laamara, R.A. Techno-economic analysis of a PV/WT/biomass off-grid hybrid power system for rural electrification in northern Morocco using HOMER. Renew. Energy 2024, 231, 120904. [Google Scholar] [CrossRef]
  18. Ennemiri, N.; Berrada, A.; Emrani, A.; Abdelmajid, J.; El Mrabet, R. Optimization of an off-grid PV/biogas/battery hybrid energy system for electrification: A case study in a commercial platform in Morocco. Energy Convers. Manag. X 2024, 21, 100508. [Google Scholar] [CrossRef]
  19. Ladide, S.; Fathi, A.E.; Bendaoud, M.; Hihi, H.; Faitah, K. Hybrid Renewable Power Supply for Typical Public Facilities in Six Various Climate Zones in Morocco. IJRER Int. J. Renew. Energy Res. 2019, 9, 893–912. [Google Scholar] [CrossRef]
  20. Bari, Z.; Yakhlef, M.B. Optimal sizing of Hybrid Renewable Energy System a case study in Morocco. Int. J. Math. Comput. Methods 2017, 2, 300–306. Available online: https://www.iaras.org/home/caijmcm/optimal-sizing-of-hybrid-renewable-energy-system-a-case-study-in-morocco (accessed on 29 April 2025).
  21. Mahdavi, M.; Jurado, F.; Ramos, R.A.V.; Awaafo, A. Hybrid biomass, solar and wind electricity generation in rural areas of Fez-Meknes region in Morocco considering water consumption of animals and anaerobic digester. Appl. Energy 2023, 343, 121253. [Google Scholar] [CrossRef]
  22. Ladide, S.; Fathi, A.E.; Bendaoud, M.; Hihi, H.; Faitah, K. Flexible design and assessment of a stand-alone hybrid renewable energy system: A case study Marrakech, Morocco. IJRER Int. J. Renew. Energy Res. 2019, 9, 2003–2022. [Google Scholar] [CrossRef]
  23. Purlu, M.; Beyarslan, S.; Türkay, B.E. On-Grid and Off-Grid Hybrid Renewable Energy System Designs with HOMER: A Case Study of Rural Electrification in Turkey. TEPES Turk. J. Electr. Power Energy Syst. 2022, 2, 75–84. [Google Scholar] [CrossRef]
  24. Li, C.; Zhou, D.; Zhang, L.; Shan, Y. Exploration on the feasibility of hybrid renewable energy generation in resource-based areas of China: Case study of a regeneration city. Energy Strategy Rev. 2022, 42, 100869. [Google Scholar] [CrossRef]
  25. Kapen, P.T.; Nouadje, B.A.M.; Chegnimonhan, V.; Tchuen, G.; Tchinda, R. Techno-economic feasibility of a PV/battery/fuel cell/electrolyzer/biogas hybrid system for energy and hydrogen production in the far north region of cameroon by using HOMER pro. Energy Strategy Rev. 2022, 44, 100988. [Google Scholar] [CrossRef]
  26. Kumar, R.; Channi, H.K. A PV-Biomass off-grid hybrid renewable energy system (HRES) for rural electrification: Design, optimization and techno-economic-environmental analysis. J. Clean. Prod. 2022, 349, 131347. [Google Scholar] [CrossRef]
  27. Chaichan, W.; Waewsak, J.; Nikhom, R.; Kongruang, C.; Chiwamongkhonkarn, S.; Gagnon, Y. Optimization of stand-alone and grid-connected hybrid solar/wind/fuel cell power generation for green islands: Application to Koh Samui, southern Thailand. Energy Rep. 2022, 8, 480–493. [Google Scholar] [CrossRef]
  28. Odetoye, O.A.; Olulope, P.K.; Olanrewaju, O.M.; Alimi, A.O.; Igbinosa, O.G. Multi-year techno-economic assessment of proposed zero-emission hybrid community microgrid in Nigeria using HOMER. Heliyon 2023, 9, e19189. [Google Scholar] [CrossRef]
  29. Mbasso, W.F.; Naoussi, S.R.D.; Molu, R.J.J.; Saatong, K.T.; Kamel, S. Technical assessment of a stand-alone hybrid renewable system for energy and oxygen optimal production for fishes farming in a residential building using HOMER pro. Clean. Eng. Technol. 2023, 17, 100688. [Google Scholar] [CrossRef]
  30. Irshad, A.S.; Ahmadullah, A.B.; Kamal, K.; Haidari, N.; Qanit, A.; Osmani, J.A.; Elias, S. Optimization of coal sustainability via hybrid renewable integration: A PVsyst-HOMER Synergistic framework for sustainable energy transitions. Energy Convers. Manag. X 2025, 27, 101110. [Google Scholar] [CrossRef]
  31. Chisale, S.W.; Eliya, S.; Taulo, J. Optimization and design of hybrid power system using HOMER pro and integrated CRITIC-PROMETHEE II approaches. Green Technol. Sustain. 2023, 1, 100005. [Google Scholar] [CrossRef]
  32. Pal, P.; Mukherjee, V. Off-grid solar photovoltaic/hydrogen fuel cell system for renewable energy generation: An investigation based on techno-economic feasibility assessment for the application of end-user load demand in North-East India. Renew. Sustain. Energy Rev. 2021, 149, 111421. [Google Scholar] [CrossRef]
  33. Mouaky, A.; Rachek, A. Energetic, exergetic and exergeoeconomic assessment of a hybrid solar/biomass poylgeneration system: A case study of a rural community in a semi-arid climate. Renew. Energy 2020, 158, 280–296. [Google Scholar] [CrossRef]
  34. Gueymard, C.A. Clear-sky irradiance predictions for solar resource mapping and large-scale applications: Improved validation methodology and detailed performance analysis of 18 broadband radiative models. Sol. Energy 2012, 86, 2145–2169. [Google Scholar] [CrossRef]
  35. Gueymard, S.A. Solar thermal collectors and applications. Prog. Energy Combust. Sci. 2004, 30, 231–295. [Google Scholar] [CrossRef]
  36. Ammari, N.; Merrouni, A.A.; Mendyl, A.; Chaabelasri, E.; Weidinger, T. Energy, Economic and Environmental (3E) Analysis for an Optimal CSP Technology Integration in Morocco. Energies 2024, 17, 3020. [Google Scholar] [CrossRef]
  37. Ackermann, T. Wind Power in Power Systems; John Wiley & Sons: Hoboken, NJ, USA, 2012. [Google Scholar]
  38. Duman, A.C.; Güler, Ö. Techno-economic analysis of off-grid PV/wind/fuel cell hybrid system combinations with a comparison of regularly and seasonally occupied households. Sustain. Cities Soc. 2018, 42, 107–126. [Google Scholar] [CrossRef]
  39. Lamnadi, M.; Trihi, M.; Boulezhar, A. Study of a hybrid renewable energy system for a rural school in Tagzirt, Morocco. In Proceedings of the 2016 International Renewable and Sustainable Energy Conference (IRSEC), Marrakech, Morocco, 14–17 November 2016; pp. 381–386. [Google Scholar] [CrossRef]
  40. Boqtob, O.; El Moussaoui, H.; El Markhi, H.; Lamhamdi, T. Optimal sizing of grid connected microgrid in Morocco using Homer Pro. In Proceedings of the 2019 International Conference on Wireless Technologies, Embedded and Intelligent Systems (WITS), Fez, Morocco, 3–4 April 2019; pp. 1–6. [Google Scholar] [CrossRef]
  41. Choukri, N.E.; Touili, S.; Azzaoui, A.; Merrouni, A.A. Techno-economic analysis for a 100% renewable hybrid energy systems integration in a research facility in Morocco. iScience 2025, 28, 113132. [Google Scholar] [CrossRef]
  42. El-Houari, H.; Allouhi, A.; Rehman, S.; Buker, M.S.; Kousksou, T.; Jamil, A.; El Amrani, B. Feasibility evaluation of a hybrid renewable power generation system for sustainable electricity supply in a Moroccan remote site. J. Clean. Prod. 2020, 277, 123534. [Google Scholar] [CrossRef]
  43. Singh, A.; Baredar, P. Techno-economic assessment of a solar PV, fuel cell, and biomass gasifier hybrid energy system. Energy Rep. 2016, 2, 254–260. [Google Scholar] [CrossRef]
  44. Bravo, Y.; Carvalho, M.; Serra, L.M.; Monné, C.; Alonso, S.; Moreno, F.; Muñoz, M. Environmental evaluation of dish-Stirling technology for power generation. Sol. Energy 2012, 86, 2811–2825. [Google Scholar] [CrossRef]
  45. Hafez, A.Z.; Soliman, A.; El-Metwally, K.A.; Ismail, I.M. Solar parabolic dish Stirling engine system design, simulation, and thermal analysis. Energy Convers. Manag. 2016, 126, 60–75. [Google Scholar] [CrossRef]
  46. Touili, S.; Merrouni, A.A.; El Hassouani, Y.; Amrani, A.; Rachidi, S. Analysis of the yield and production cost of large-scale electrolytic hydrogen from different solar technologies and under several Moroccan climate zones. Int. J. Hydrogen Energy 2020, 45, 26785–26799. [Google Scholar] [CrossRef]
  47. Babu, M.K.; Ray, P. Sensitivity analysis; optimal design, cost and energy efficiency study of a hybrid forecast model using HOMER pro. J. Eng. Res. 2023, 11, 100033. [Google Scholar] [CrossRef]
  48. Mahdavi, M.; Vera, D. Importance of renewable energy sources and agricultural biomass in providing primary energy demand for Morocco. Int. J. Hydrogen Energy 2023, 48, 34575–34598. [Google Scholar] [CrossRef]
  49. Mana, A.A.; Allouhi, A.; Ouazzani, K.; Jamil, A. Feasibility of agriculture biomass power generation in Morocco: Techno-economic analysis. J. Clean. Prod. 2021, 295, 126293. [Google Scholar] [CrossRef]
  50. Allouhi, A.; Saadani, R.; Buker, M.S.; Kousksou, T.; Jamil, A.; Rahmoune, M. Energetic, economic and environmental (3E) analyses and LCOE estimation of three technologies of PV grid-connected systems under different climates. Sol. Energy 2019, 178, 25–36. [Google Scholar] [CrossRef]
  51. Shaikh, P.H.; Lashari, A.A.; Leghari, Z.H.; Memon, Z.A. Techno-enviro-economic assessment of a stand-alone parabolic solar dish stirling system for electricity generation. Int. J. Energy Res. 2021, 45, 10250–10270. [Google Scholar] [CrossRef]
  52. Lund, C.; Biswas, W. A Review of the Application of Lifecycle Analysis to Renewable Energy Systems. Bull. Sci. Technol. Soc. 2008, 28, 200–209. [Google Scholar] [CrossRef]
  53. Kumar, P.; Channi, H.K.; Kumar, R.; Prakash, C.; Bhowmik, A.; Pandey, S.; Singh, A.K.; Ali, M.M.; Soudagar, M.E.M. Efficient integration of photo voltaic and hydro energy technologies for sustainable power generation in rural areas: A case study. Mater. Sci. Energy Technol. 2024, 7, 297–308. [Google Scholar] [CrossRef]
  54. Samy, M.M.; Barakat, S.; Ramadan, H.S. Techno-economic analysis for rustic electrification in Egypt using multi-source renewable energy based on PV/wind/FC. Int. J. Hydrogen Energy 2020, 45, 11471–11483. [Google Scholar] [CrossRef]
  55. Wang, Y.; He, X.; Liu, Q.; Razmjooy, S. Economic and technical analysis of an HRES (Hybrid Renewable Energy System) comprising wind, PV, and fuel cells using an improved subtraction-average-based optimizer. Heliyon 2024, 10, e32712. [Google Scholar] [CrossRef]
  56. Roy, D.; Shivaprasad, K.V.; Wang, Y.; Roskilly, A.P. Techno-economic feasibility assessment for a standalone hybrid energy system integrating renewable energy sources. Clean. Eng. Technol. 2025, 28, 101045. [Google Scholar] [CrossRef]
Figure 1. The study location.
Processes 13 02801 g001
Figure 2. Solar GHI map (left) and wind speed map (right) of eastern Morocco.
Processes 13 02801 g002
Figure 3. Typical daily load profile for rural village.
Processes 13 02801 g003
Figure 4. Daily GHI and DNI over one year.
Processes 13 02801 g004
Figure 5. Monthly variation in global horizontal and direct normal irradiance.
Processes 13 02801 g005
Figure 6. Daily wind speed variation over one year.
Processes 13 02801 g006
Figure 7. Monthly wind speed variation over one year.
Processes 13 02801 g007
Figure 8. A block diagram of all the HRES components considered in this study.
Processes 13 02801 g008
Figure 9. Design of the 10 kWe EURODISH System [45]. Reproduced with permission from [A.Z. Hafez et al.], [Energy conversion and management]; published by [Elsevier], [2016].
Processes 13 02801 g009
Figure 10. The flow diagram of the different HRESs optimized in this study.
Processes 13 02801 g010
Figure 11. Comparison of the LCOE for all HRES scenarios.
Processes 13 02801 g011
Figure 12. Heat map of PV system performance over the year.
Processes 13 02801 g012
Figure 13. Heat map of wind turbine performance over the year.
Processes 13 02801 g013
Figure 14. Heat map of Eurodish unit performance over the year.
Processes 13 02801 g014
Figure 15. Battery SoC heat map for: (a) scenario 1; (b) scenario 2; (c) scenario 3; (d) scenario 4; (e) scenario 13; (f) scenario 14; (g) scenario 15.
Processes 13 02801 g015
Figure 16. Annual heat maps of biomass generator power output for: (a) scenario 5; (b) scenario 6; (c) scenario 7; (d) scenario 8; (e) scenario 9; (f) scenario 10; (g) scenario 11; (h) scenario 12.
Processes 13 02801 g016
Figure 17. Annual biomass consumption for each HRES scenario.
Processes 13 02801 g017
Figure 18. Total cost of HRES over its lifetime.
Processes 13 02801 g018
Figure 19. Potential CO2 emissions reduction for HRES scenarios.
Processes 13 02801 g019
Figure 20. Impact of discount rate (DR) and inflation rate (IR) variation on LCOE.
Processes 13 02801 g020
Table 1. Technical specifications of the selected wind turbine [41].
PropertiesSpecifications
Brand nameAWS HC 5.1 kW wind turbine
Rated capacity (kW)5.1
Number of blades3
Rotor diameter (m)5.24
Hub height (m)12
Lifetime25 years
Table 2. Technical specifications of the selected battery.
PropertiesSpecifications
Nominal capacity (kWh)1 kWh
Nominal capacity (Ah)167 Ah
Nominal voltage7 V
Maximum discharge current500 A
Maximum charge current167 A
Lifetime15 years
Table 3. Optimal HRES results for all simulated scenarios.
ScenarioPV
(kW)
Wind
(kW)
Eurodish
(kW)
Biomass
(kW)
Battery
(Number)
Converter (kW)Energy Production
(kWh)
Excess Energy
(kWh)
LCOE
(USD/kWh)
1: PV/Battery48.8 21343.8117,45410,3630.184
2: PV/Wind/Battery46.65.1 21241.1115,76191140.187
3: PV/Eurodish/Battery42.6 10 21941.1120,63615,4070.214
4: PV/Wind/Eurodish/Battery41.75.110 22840.7122,08317,2120.220
5: PV/Biomass38.7 30 22.2146,41351,2590.300
6: PV/Wind/Biomass36.25.1 30 37.7143,34648,4390.314
7: PV/Eurodish/Biomass34.5 1030 16.7153,61560,2900.332
8: PV/Wind/Eurodish/Biomass32.85.11030 31.3152,00358,8380.342
9: Eurodish/Biomass 3040 117,24926,2720.472
10: Wind/Eurodish/Biomass 5.13040 119,05728,0810.474
11: Wind/Biomass 127.5 40 136,33145,3550.572
12: Biomass 40 90,97600.602
13: Eurodish/Battery 110 73265.1198,98494,0290.739
14: Wind/Eurodish/Battery 96.990 62755.4234,306135,3580.759
15: Wind/Battery 357 140454.9263,427168,2361.15
Disclaimer/Publisher’s Note: The statements, opinions and data contained in all publications are solely those of the individual author(s) and contributor(s) and not of MDPI and/or the editor(s). MDPI and/or the editor(s) disclaim responsibility for any injury to people or property resulting from any ideas, methods, instructions or products referred to in the content.