Abstract
This study investigates the formation mechanism and stress response characteristics of normal faults in coal-bearing strata through large-scale physical simulation experiments. A multi-layer heterogeneous model with a geometric similarity ratio of 1:300 was constructed using similar materials that were tailored to match the mechanical properties of real strata. Real-time monitoring techniques, including fiber Bragg grating strain sensors and a DH3816 static strain system, were employed to record the evolution of deformation, strain, and displacement fields during the fault development. The results show that the normal fault formation process includes five distinct stages: initial compaction, fault initiation, crack propagation, fault slip, and structural stabilization. Quantitatively, the vertical displacement of the hanging wall reached up to 5.6 cm, equivalent to a prototype value of 16.8 m, and peak horizontal stress increments near the fault exceeded 0.07 MPa. The experimental data reveal that stress concentration during the fault slip stage causes severe damage to the upper coal seam roof, with localized vertical stress fluctuations exceeding 35%. Structural planes were found to control crack nucleation and slip paths, conforming to the Mohr–Coulomb shear failure criterion. This research provides new insights into the dynamic coupling of tectonic stress and fault mechanics, offering novel experimental evidence for understanding fault-induced disasters. The findings contribute to the predictive modeling of stress redistribution in fault zones and support safer deep mining practices in structurally complex coalfields, which has potential implications for petroleum geomechanics and energy resource extraction in similar tectonic settings.
1. Introduction
Fault systems, as complex assemblies of interconnected fault segments, play a crucial role in controlling crustal deformation, stress redistribution, and fluid migration in the lithosphere. They are typically classified into normal faults, reverse faults, and strike-slip faults, according to the orientation of the principal stresses and the direction of displacement. Normal fault systems, in particular, are commonly associated with extensional tectonic regimes and are characterized by a network of en echelon fault segments, relay ramps, and graben structures. The interaction between these components often leads to complex stress fields, spatial variability in fault slip, and heterogeneous deformation patterns in the surrounding rock mass. In coal-bearing basins, such fault systems not only disrupt the continuity of strata but also serve as potential pathways for gas migration and zones of mechanical weakness, significantly increasing the risk of mining-induced hazards. Therefore, a comprehensive understanding of the formation and evolution of normal fault systems is essential for both geological modeling and the design of safe mining operations in fault-affected zones. Faults are geological structures formed by the displacement of rock layers during crustal movement. This displacement disrupts the continuity of the layers, causing significant differences in the surrounding rock stress and displacement fields [1,2,3,4]. Such disruptions can trigger a series of disasters, including roof slip and surface subsidence [5,6,7], posing a major challenge for the stability control of surrounding rock. Therefore, understanding the key geological conditions controlling fault formation and its evolutionary mechanical mechanisms is crucial for comprehending the nature of fault-induced disasters and ensuring safe and efficient deep mining [8,9,10,11].
The presence of faults significantly complicates regional stress fields by altering the intensity and evolution of the stress distribution, which can easily induce instability in the surrounding rock [12,13]. Fault zones, created by long-term compression and displacement, often represent the weakest areas of the surrounding rock [14,15]. In recent years, many scholars have studied the formation and evolution of faults under various stress conditions using methods such as high-speed photography and digital image correlation (DIC) techniques. Lee F.Y. et al. [16] first used high-speed photography to reveal the three-stage rupture morphology of reverse faults; Wang G. et al. [17] achieved quantitative control of joint angles and shear displacement; Sibson R.H. et al. [18] explored the impact of early fault formation on the seismic resistance of infrastructure. In deep, high-stress regions, rock masses exhibit the entire process of crack initiation to macro-scale fault linkage through physical signals such as electromagnetic and microseismic signals [19,20,21,22]. Impact-based mechanical tests have revealed the critical relationship between impact rate and crack propagation during fault formation [23]. PIV visualization technology and medium-scale simulation experiments have quantified the displacement, strain, and energy fields during normal fault development [24]. The combination of physical simulations and numerical calculations for thick coal seams and protective layers indicates that spatiotemporal coupling in the model can effectively predict the stress redistribution and instability mechanisms of fault zones [25,26].
The presence of faults induces uneven distribution of the original stress in rocks, especially the tectonic stress. The accumulation of structural stress energy forms the basis for dynamic mining disasters, with the uneven distribution of structural stress controlling the regional distribution of disaster points [27,28,29]. However, the true formation of faults is often accompanied by crack initiation, structural plane deflection, and multi-phase stress superposition [30,31,32]. How to realistically reproduce these evolutionary characteristics in experiments remains a challenge in current research [33,34,35]. To address this, scholars have constructed multi-layer heterogeneous models to simulate typical coal-bearing sedimentary fault zones, combining high-resolution stress, displacement, and fiber-optic monitoring technologies to explore the control mechanisms of structural plane coupling and tectonic stress on normal fault development [36,37,38].
This study aims to investigate the impact mechanism of tectonic stress on the formation and evolution of normal faults through physical simulation experiments, integrating high-resolution stress, displacement, and fiber-optic monitoring technologies. In addition, try to construct a multi-layer heterogeneous model to simulate a typical coal-bearing sedimentary fault zone, studying the control effect of tectonic stress on normal faults, to provide theoretical and experimental data support for stress prediction in fault zones and safe mining practices.
2. Experiment Design and Research Methods
2.1. Experimental Equipment and Parameters
In this study, a physical simulation system for fault evolution and rock mass mining response, equipped with adjustable tilt-angle functionality, was used. The system includes both vertical and horizontal loading devices, with a transparent front panel for observing the surface deformation of the rock layers. The prototype fault zone is located in a coalfield in Anhui Province, eastern China, on the eastern margin of the North China Craton. The area is dominated by Carboniferous to Permian coal-bearing strata, which are overlain by Mesozoic sedimentary rocks. The study area is approximately at 32°37′ N, 116°58′ E. The representative normal faults used for simulation have dip angles of 68 to 72 degrees and displacements of about 18 to 20 m, and are related to extensional tectonic activities from the late Mesozoic to the Cenozoic. Geological and structural data were obtained from regional geological survey reports and on-site mine mapping records. The geometric similarity ratio was set to 1:300, and the proportion between the model material density and the prototype rock density to 1:1.5, according to the formula for calculating elastic modulus and stress: CE = Cσ = Cl × Cλ, resulting in a modulus of elasticity and strength similarity ratio of 1:450. The experiment simulated a coal seam depth of 330 m, considering the unlined portion of the overlying strata at 201.6 m. In the simulation test, the load required to simulate the upper rock layer was provided by the upper loading device. The required upper load was given by equation , and the corresponding upper stress qm was calculated by equation . A compensatory load of 0.11 MPa was applied to achieve an equivalent treatment. This system effectively reproduces the fault formation mechanisms and stress field evolution characteristics at different stages of normal fault development.
2.2. Normal Fault Formation Mechanism
According to Anderson’s fault classification model, when the maximum principal stress σ1 acts vertically, and σ2 and σ3 are in the horizontal direction, forming a vertical compressive stress environment, it is more likely to induce the development of normal faults. When the vertical principal stress exceeds the frictional resistance of the fault plane, the upper block slides downward to form a fault. Since the sliding is driven by the vertical stress, the upper block is regarded as the active sliding side and is called the “active block”. The typical stress field corresponding to the formation of a normal fault is shown in Figure 1.
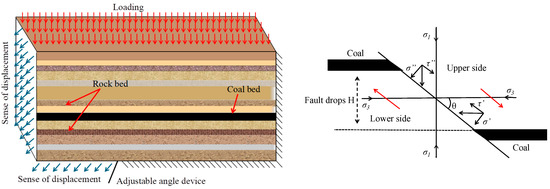
Figure 1.
Mechanical model of normal fault formation.
2.3. Physical Model Materials and Proportions
When conducting physical simulation experiments, it is essential to follow the principle of similarity to ensure that the model exhibits the necessary similarity to the prototype. According to the design requirements of the model, various parameters must satisfy the basic relationships in similarity theory. The mathematical expressions are as follows [39,40,41]:
where represents the strength similarity constant, represents the bulk density similarity constant, represents the geometric similarity constant, and represents Geometric similarity ratio. Additionally, the subscript “p” denotes the prototype, the subscript “m” denotes the physical model, the subscript “” denotes stress or strength values in the prototype and model (in MPa or KPa), the subscript “” denotes geometric length in the prototype and model, respectively.
According to the requirements of the simulation experiments, the physical parameters, such as the thickness, density, and elastic modulus of the rock layers, were strictly calculated and controlled. By adjusting the proportions of sand, calcium carbonate, gypsum, and water, the mechanical responses of each rock layer material in the simulation, as shown in Table 1, were ensured to effectively reproduce the fracture, sliding, and deformation processes of the rock layers, thereby realistically simulating the formation and evolution of normal faults. The similar materials prepared can simulate the stress concentration, crack propagation, and displacement behaviors of the real rock layers, providing a reliable foundation for the simulation experiments. At each stage of fault formation, the physical properties of these materials play a crucial role in stress concentration, crack propagation, and rock displacement. Through this material development, the simulation experiments can realistically reproduce the entire process from crack initiation to macroscopic fault, providing a powerful experimental basis for the study of the formation mechanism of normal faults and effectively simulating the physical properties of different rock layers. In this study, the model strength parameters were evaluated via uniaxial compression tests conducted on cylindrical specimens fabricated using each material mixture. The specimens were cured under standard lab conditions and tested to verify their mechanical response and match the target strength similarity ratio of 1:450. The “proportion number” listed in Table 1 serves as a unique identifier for each batch formulation, ensuring repeatability and traceability of material proportions across experiments.

Table 1.
Mechanical parameters of each rock stratum and material usage.
2.4. Data Collection and Analysis
The test procedure is shown in Figure 2. The length × height × width of this box has been adjusted to 160 cm × 60 cm × 30 cm and with an inclination angle of 70°. Prior to construction, the left and right baffles were fixed to the designated boundaries, and the upper loading frame was restored to its initial height to allow full model assembly. The left and right base plates were carefully leveled, and a Teflon plate was placed adjacent to the left baffle to minimize boundary friction. A transparent acrylic plate was installed at the front for visual observation, while U-shaped steel channels were mounted on the rear side, marked with the target thickness of each stratigraphic layer to guide accurate deposition. Model construction followed a layer-by-layer compaction approach. For each simulated stratum, the required quantities of sand, calcium carbonate, gypsum, and water were weighed using an electronic scale, mixed thoroughly, and poured into the box. The material was then leveled and compacted uniformly to the designed thickness. Between each layer, a thin layer of mica powder was spread to ensure stratigraphic separation and simulate bedding planes or potential slip surfaces. This process was repeated sequentially to replicate the full sedimentary sequence, as shown in Figure 2. Following model preparation, a comprehensive monitoring system was deployed. Stress monitoring was performed using a DH3816 static strain acquisition system, while strain monitoring employed TV-1600-08 grating optical fiber sensors embedded at key locations. The sensor layout is shown in Figure 3, a total of 184 reflective markers were arranged at 70 mm intervals on the model surface, and high-resolution video recording was used to document the full process of fault initiation and propagation. Boundary conditions were strictly controlled: the right and bottom sides of the model were fixed, and a vertical compensating load was applied from above to simulate the overburden stress of unmodeled strata. Dynamic loading was introduced via two actuators—one on the left boundary moved horizontally, while a second hydraulic actuator at the lower left applied vertical loading downward—both at a constant rate of 0.01 mm/s. Additionally, an upper actuator above the fault region applied vertical load at 0.015 mm/s. The test concluded once fault slip stabilized and the displacement reached the pre-defined drop height of the coal seam.
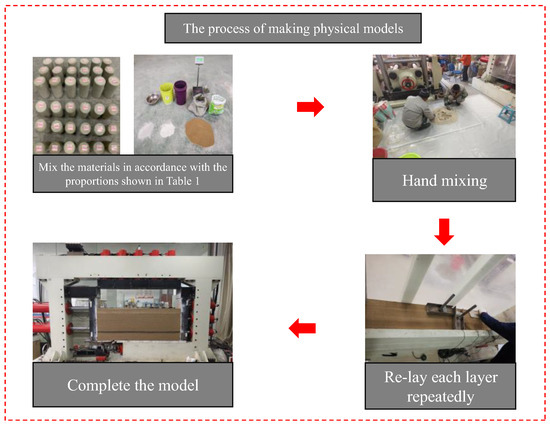
Figure 2.
The preparation process of the tomographic physical model.
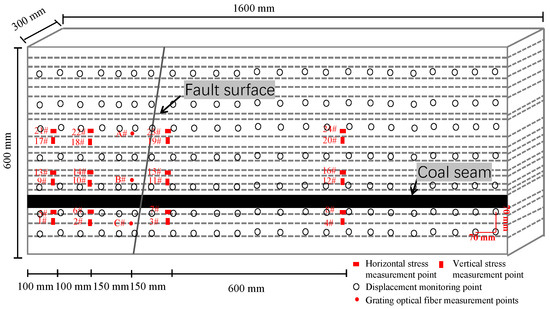
Figure 3.
Layout map of monitoring points.
3. The Movement Laws of Rock Layers During the Development of Normal Faults
3.1. The Development Process of Normal Faults, the Movement Characteristics of Rock Layers, and Fracture Features
The development process of the normal fault is shown in Figure 4. Initially, the rock layers were intact. After loading, stress accumulated, causing fractures to initiate and extend inward; during the expansion stage, the deformation of the upper and lower parts of the rock layers intensified, and the shear displacement of the lower block was significant, showing a non-uniform characteristic. As the fault slipped, the fault gap increased, the rock layers bent and deviated, forming a distinct fold structure, and on both sides of the fault zone, fractured zones gradually developed. Eventually, the fault became stable and took on a bent shape, with a fracture angle greater than 70°, and the coal layer showed a significant drop. The fractures were mainly concentrated from the initiation to the early stage of slip and then gradually closed. Overall, it presented strong deformation of the rock layers and significant redistribution of stress, with more severe damage to the lower block. The figure clearly shows the spatial characteristics of the rock layer deflection and the development of the fractured zone under the control of the fault, further revealing the complexity of the rock mass structure during the fault evolution process.
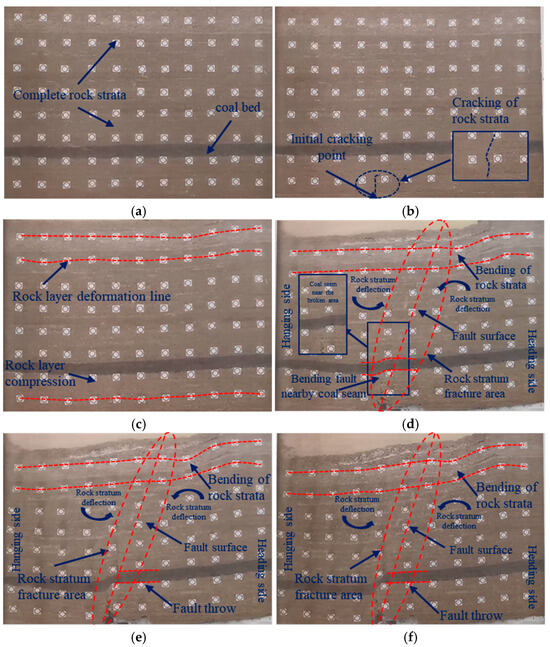
Figure 4.
Formation process of a normal fault. (a) Initial state, (b) Fault initiation, (c) Fracture propagation, (d) 50% of final drop, (e) 75% of final drop, (f) Final stable fault structure.
3.2. Characteristics of Rock Mass Displacement Caused by Faults
3.2.1. Evolution of Displacement Field at Fault Formation
During the formation of a normal fault, the evolution process of the rock layer displacement field closely corresponds to the fault development stages described in Section 3.1, reflecting the non-uniform deformation response driven by tectonic stress. Figure 5a illustrates the stage of fault initiation and fracture expansion, at which the rock layer stress is concentrated, the vertical displacement of the upper plate increases rapidly, the fractures expand inward from the fault plane, and the deformation of the upper and lower parts of the rock layer is significant. Figure 5b corresponds to the fault slip stage, where significant non-uniform displacement occurs on the upper plate of the fault, the rock layer bends and deflects, and a fracture zone develops, reflecting the intense structural adjustment during the stress release process. Figure 5c is consistent with the stable fault stage, where the displacement field becomes more gentle, the fault structure is formed, and the rock layer enters a relatively stable state. Overall, the displacement evolution process in Figure 5 clearly reflects the deformation characteristics of the normal fault development from initiation to slip to stability, verifying the temporal sequence and stress control mechanism of fault structure evolution in Figure 4.
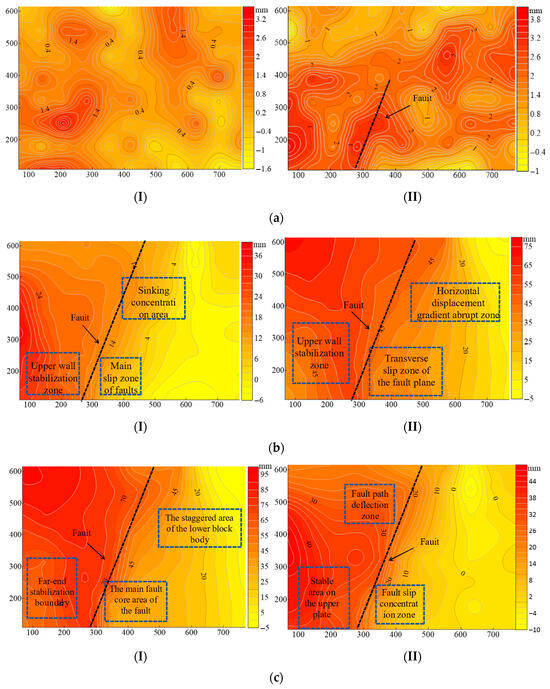
Figure 5.
Displacement Contour Plots After the Formation of a Normal Fault: (a) Crack propagation and non-uniform displacement, (b) Slip and displacement reduction in faults, (c) Stress release and displacement field stability in the steady state. (I) Vertical displacement field, (II) Horizontal displacement field.
3.2.2. The Absolute Value Variation Characteristics of Rock Layer Displacement After the Formation of a Normal Fault
During the formation of a normal fault, the absolute value changes in the rock layer displacement reflect the dynamic response characteristics of the rock mass under tectonic stress. Figure 6 shows the displacement diagram after the formation of a normal fault. The displacement of the rock layer shows obvious spatial heterogeneity. The displacement near the fault is significant, especially in the upper part of the fault zone; the displacement in the area far from the fault changes slowly and approaches zero. This non-uniform feature is closely related to the spatial distribution of tectonic stress. During the slip stage, the redistribution of stress causes a rapid increase in local displacement, while the area far from the fault maintains a low displacement state. Experiments show that the displacement increases rapidly at the initial stage, gradually slows down, and stabilizes as stress is released. Fault slip not only changes the geometric shape of the rock layer but also triggers stress reconfiguration, further affecting the displacement distribution. Overall, the displacement evolution shows a “rapid initial stage-slow later stage” stage characteristic and the displacement of the upper coal layer is significantly greater than that of the lower layer, reflecting the spatial heterogeneity and stress response differences during the fault slip process. To further investigate the spatial variation in displacement, eight survey lines were selected across different structural positions relative to the fault zone. Lines No. 1–2 are located in the hanging wall near the fault core, where displacement is most severe. Lines No. 3–4 are positioned near the fault centerline, experiencing mixed bending and shear. Lines No. 5–8 extend into the footwall and peripheral zones, where displacement gradients are more gradual. The displacement profiles in Figure 6 show that: Lines 1–2 exhibit sharp vertical drops and high horizontal displacements, indicating active fault slip and rock bending in the hanging wall. Lines 3–4 show moderate displacement, reflecting transitional deformation. Lines 5–8 display relatively gentle displacement curves, located farther from the fault plane, mainly undergoing passive stress redistribution. This spatial pattern confirms that the deformation response of rock masses is strongly dependent on their relative position within the fault structure, with maximum displacement concentrated near the fault core and upper coal seam roof.
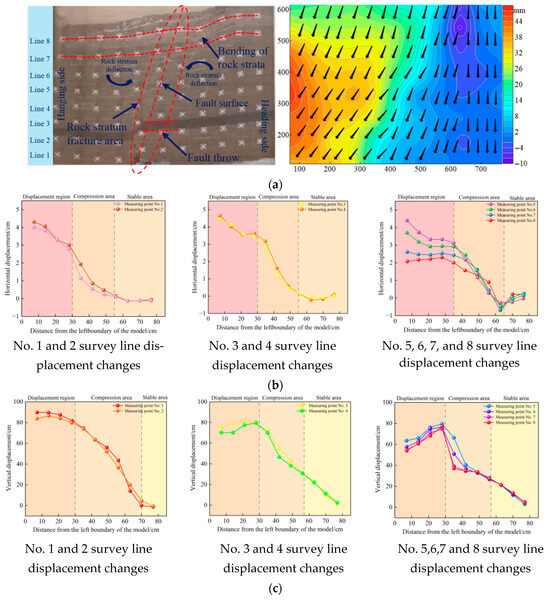
Figure 6.
Final displacement after normal fault formation. (a) Deformation of rock layers after the formation of a normal fault. (b) Horizontal displacement changes after the formation of a normal fault. (c) Vertical displacement changes after the formation of a normal fault.
3.3. The Deformation Evolution Law of the Fault Plane During the Formation Process of a Normal Fault
By measuring the internal deformation of the rock mass, the deformation laws of the rock mass under the action of force can be revealed, providing a basis for the stability analysis of the rock mass. Three horizontal sensing optical fibers are laid at the predicted fault plane to monitor the internal strain. The strain is calculated using the fiber Bragg grating strain formula based on the wavelength change:
In the equation: λB0 is the initial Bragg wavelength; λB1 is the strained Bragg wavelength; ΔλB = λB1 − λB0 is the change in wavelength; Pe is the effective photoelastic coefficient, with the value of 0.22 for quartz fiber at a wavelength of 1550 nm.
Figure 7 presents the strain data of different measurement points, reflecting the deformation process of the rock layer under the action of tectonic stress. It can be divided into four stages: fracture initiation, expansion, sliding, and stability. In the initiation stage, the strain at point A# increases, indicating that cracks have appeared in the rock layer in the stress concentration area; in the expansion stage, the strain at point B# rises slowly, and the crack extension is controlled by the regional stress, and the deformation is relatively gentle; in the sliding stage, the strain at point A# increases sharply, indicating that the stress is rapidly released and the rock layer undergoes intense deformation, which is the stage with the maximum displacement and strain; in the stability stage, the three curves tend to be stable, indicating that the stress release is sufficient and the rock layer enters a stable state, demonstrating the self-regulation ability of the rock mass.
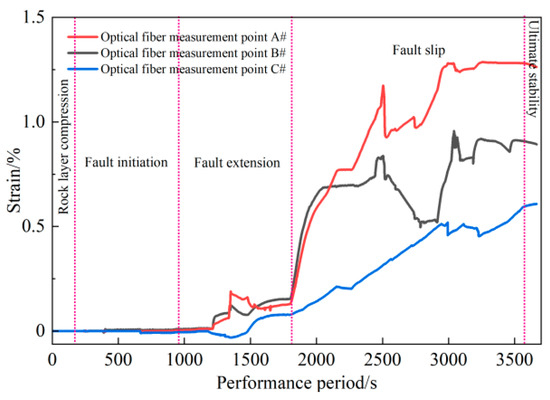
Figure 7.
Vertical strain near the fault plane.
3.4. The Influence of Tectonic Stress During the Formation of Normal Faults
3.4.1. Vertical Stress Distribution of Rock Mass
Figure 8 shows the strain evolution characteristics of different measurement points, revealing the four-stage deformation process of the rock layer under tectonic stress: initiation, expansion, sliding, and stabilization. In the initiation stage, the strain at point A# increases, indicating that local stress concentration has caused the rock layer to crack; in the expansion stage, the strain at point B# rises slowly, and fractures continue to expand under the regional stress drive; in the sliding stage, the strain at point A# increases sharply, reflecting the rapid release of stress and the intense deformation of the rock layer; in the stabilization stage, the curves of the three measurement points tend to be stable, indicating that the stress release of the rock layer has been completed, the deformation has stabilized, and demonstrating the self-regulating characteristics of the rock mass.
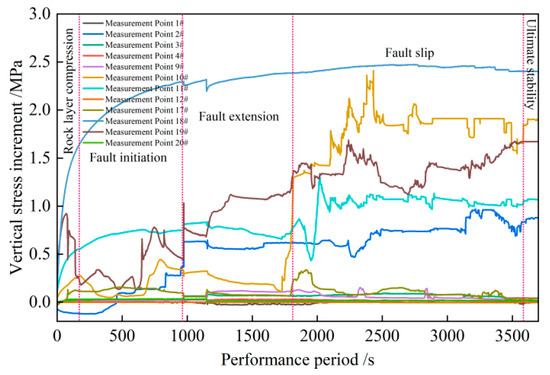
Figure 8.
Evolution of the vertical stress field at different stages of the fault.
3.4.2. Distribution of Horizontal Stress in Rock Mass
Figure 9 shows the changes in the horizontal stress increment of the rock layers during the formation of the fault. For the 5–8# measurement points beneath the coal seam, the horizontal stress increment of the upper block is significantly greater than that of the lower block, especially in the area close to the fault, indicating that the upper block has been subjected to a strong horizontal tensile force. The stress increment differences at the 13–16# measurement points above the coal seam are relatively large. The horizontal stress near the fault increases sharply, while the area far from the fault shows a decrease in stress. This indicates that the fault activity has caused the redistribution of stress. At the 21–24# measurement points above the coal seam, due to the change in the fault dip angle, the horizontal stress increment of the upper block and the area far from the fault is small, even showing a decrease, while the increment of the lower block is larger. Overall, during the formation of the fault, the horizontal stress increment shows a significant spatial distribution characteristic. During the formation of a normal fault, the horizontal stress increment in the sample area exhibits obvious spatial differences: in the lower area, the horizontal stress increment of the upper block is greater than that of the lower block. In the middle area, the increment near the fault is the largest, while in the area far from the fault, the stress decreases; in the upper area, the horizontal stress distribution characteristics change due to the change in the fault dip angle.
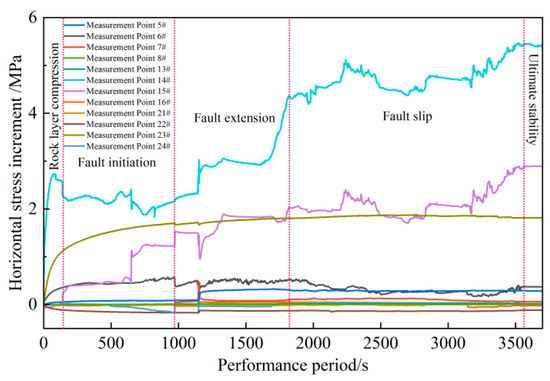
Figure 9.
Changes in horizontal stress of rock layers during fault formation.
3.4.3. The Destruction and Change Patterns of the Roof of the Upper Coal Seam
Figure 10 shows the changes in the stress of the upper coal seam roof during the formation of the normal fault. As loading progresses, the horizontal and vertical stresses of the upper coal seam roof exhibit periodic fluctuations. Initially, the stress growth is slow, especially near the fault plane. Subsequently, the increase in pressure leads to a sharp rise in both horizontal and vertical stresses. The vertical stress of the upper coal seam roof undergoes a complex change of “first increasing, then decreasing, and then increasing again”, reflecting the redistribution process of stress in the fault zone. The experimental results show that in the early stage of fault activity, crack propagation, and rock layer displacement cause significant stress changes. As the fault becomes stable, cracks close, and the local structure is adjusted, resulting in a stress rebound. The rebounded stress does not fully return to the initial state but tends towards a relatively stable equilibrium. The stress accumulation and release near the fault plane form a local deformation zone. Therefore, the stress of the upper coal seam roof is influenced by tectonic stress, coal seam structure remodeling, and energy release.
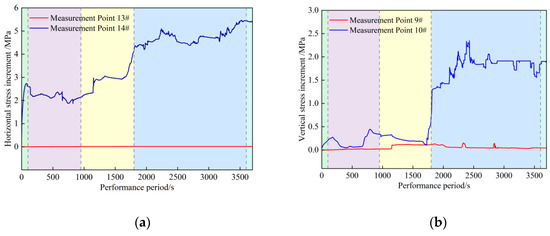
Figure 10.
Stress changes in the roof of the upper coal seam. (a) Horizontal stress variation in the top plate on the upper plate, (b) Vertical stress variation in the upper plate roof.
3.4.4. The Stress Variation Pattern of the Overlying Coal Seam Roof
Figure 11 shows that during the formation of the normal fault, the stress concentration in the roof of the lower coal seam mainly occurs in the area close to the fault plane. As the fault develops, the stress gradually spreads along the fault plane to other areas of the coal seam, causing an increase in roof stress. Especially during the fault slip stage, due to the shear effect, there are significant differences in the stress transfer patterns between the upper and lower coal seam regions. The stress in the area close to the fault is the most significant, while the area far from the fault is relatively stable. The experimental results show that with the accumulation of structural stress and fault activity, the stress variation in the roof of the lower coal seam follows a “first increasing then decreasing” trend. During the fault activity period, the roof of the coal seam near the fault experiences a significant increase in stress, while the change in the area far from the fault is relatively small. The stress variation in the roof of the lower coal seam reflects the combined influence of structural stress and fault activation, especially during the slip stage. The redistribution of stress within the fault zone plays a decisive role in the stress state of the lower coal seam.
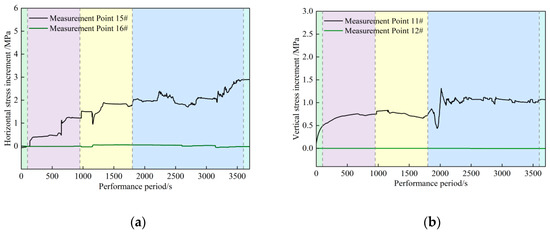
Figure 11.
Stress changes in the roof of the lower coal seam. (a) Horizontal stress variation in the roof of the lower plate, (b) Vertical stress variation of the lower roof panel.
4. Discussion
4.1. The Mechanical Effects of the Fault Plane and the Mechanism of Fault Formation
A fault plane, as a planar structure formed by the fracture of rocks in the crust, plays a significant role in geological structural movements, the occurrence of geological disasters, and engineering practices in terms of its mechanical effects. The formation mechanism of faults is closely related to the behavior of rock masses under different stress conditions. When rock masses are subjected to external stress, if the stress exceeds the shear strength of the rock, the fault plane will rupture and displace, thereby triggering the formation of the fault.
According to Anderson’s theory and the Mohr–Coulomb shear failure criterion for structural plane shear rupture, the failure of rocks is related to the interaction between shear stress and normal stress. By analyzing the geometric relationship between the dip angle of the fault plane and the principal stress components, it is possible to explain that the fault plane will become active when the maximum principal stress direction and the minimum principal stress direction satisfy specific conditions. Specifically, the formation of a normal fault is usually accompanied by a change in the principal stress direction. The maximum principal stress is typically vertical, while the minimum principal stress is horizontal. Before the fault plane becomes active, this stress state will change, making the originally stable structural plane unstable and eventually forming a slip zone.
Based on the geometric relationship between the fault dip angle and the principal stress components, it can be considered that the maximum principal stress and the minimum principal stress satisfy the following relationship [42,43]:
Before fault activation, the maximum principal stress in the normal fault is the vertical stress , and the minimum principal stress is the horizontal stress . Their ratio is . Substituting into Equation (4) and simplifying, we obtain:
4.2. Fault Activation and Energy Release
When the fault becomes active, the rock mass undergoes displacement along the fault plane, releasing a large amount of internal stress and energy. This energy-release process causes the fault plane to enter a new stable state. Specifically, in the stress decomposition after the activation of a normal fault, the minimum principal stress remains in the horizontal direction, while the maximum principal stress transforms into vertical stress. At this time, the rock on the fault plane will undergo significant sliding and displacement, gradually forming an active fault with a band-like structure. The activation of the fault plane is not merely the simple release of stress; it also involves the complex mechanical process of rock sliding and displacement on the fault plane.
The stress components in the horizontal and vertical directions after fault activation are represented by and , respectively. By substituting into Equation (6), the equilibrium equation can be obtained to describe the equilibrium state satisfied at the moment when the hanging wall stops sliding along the fault plane, which corresponds to the lower limit of equilibrium [44].
Through experiments, we observed that after the activation of the fault, the stress within the fault zone was rapidly released, and a distinct structural zone was formed through sliding and dislocation. This process further verified that during the activation stage of the fault, the stress state of the rock mass underwent significant changes, and the sliding zone gradually developed into a stable fault zone with clear boundaries.
4.3. Friction and Fault Sliding Mechanism
The effect of friction force is of vital importance in the sliding of faults. According to the Mohr–Coulomb shear fracture criterion, when the stress on the fault plane reaches a certain critical value, the rock mass will undergo relative sliding along the fault plane. If the dip angle of the structural plane reaches a certain range, the rock mass will slide and dislocate along the fault plane, gradually developing into a structural plane with obvious dislocation characteristics. At this time, the structural plane not only includes the original fracture plane but also exhibits deformation caused by the dislocation, forming a stable sliding surface. The relationship between the friction angle and the shear strength of the fault plane determines the speed and characteristics of fault formation.
When there is no friction on the section, i.e., when , is the friction angle of the fault plane. The upper limit of hanging wall sliding is given by Equation (7).
Thus, the relationship between the lower and upper limits of the ratio of stress components after fault activation can be obtained:
Since the vertical stress is caused by the weight of the overlying rock mass, it can be assumed that there was no significant change in the fault activation process. If the ratio of the horizontal stress components perpendicular to the strike of the fault before and after fault activation is introduced , as in Equation (9):
Experimental data show that at the initial stage of the fault, the fault plane shows almost no slip. However, when the stress accumulates to a certain extent, the fault plane rapidly begins to slide and forms obvious deformation features within the fault zone. We also found that the change in the friction angle has a significant impact on the sliding rate, indicating that friction force plays a crucial role in the early sliding of the fault, controlling the activation and sliding characteristics of the fault.
4.4. Stability of Faults and the Equilibrium State of Sliding
By analyzing the stress decomposition after the activation of faults, the equilibrium equation for fault sliding can be derived. In the absence of frictional force, the rock mass reaches a stable state under specific stress. This further indicates that the stability of faults is closely related to the ratio of stress. By comparing different stress component ratios, we can further explore the stability and sliding behavior during the formation process of faults and reveal the evolution mechanism of faults.
Under certain stress conditions, the structural planes, as weak planes or interfaces within the rock mass, will undergo a certain degree of sliding or displacement. When the sliding effect reaches a certain level, and the fractures expand under specific inclination conditions, the original structural planes may evolve into slip planes with obvious misalignment characteristics. Specifically, when the rock mass undergoes relative displacement along the structural planes, the cracks and slips on the structural planes gradually develop into band-like structures. At this time, this structure not only includes the original structural planes but also exhibits significant deformation caused by the rock mass’s misalignment. The relationship between the shear strength of the structural planes and the Mohr–Coulomb shear failure criterion is shown in Figure 12. From the shear strength curve in the figure and the geometric relationship of the Mohr stress circle, it can be seen that when the dip angle of the structural plane is , the rock masses above and below the structural plane will undergo relative sliding and displacement along the plane, ultimately forming an active structural plane. However, when the dip angles of the structural plane are or , the rock masses in the upper and lower layers are in a stable state, and the structural plane remains in an unslipped state.
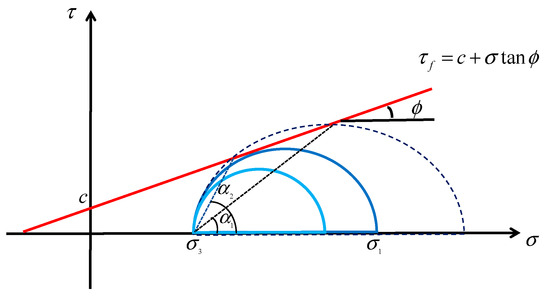
Figure 12.
Relationship between shear strength of fault and coulomb criterion.
5. Conclusions
- (1)
- The formation of normal faults in coal-bearing strata progresses through five stages: compaction, initiation, propagation, slip, and stabilization. Displacement and strain evolve from micro-cracks to macroscopic fault structures, with fault slip driven by localized stress concentration.
- (2)
- Tectonic stress significantly influences stress redistribution during fault evolution, especially in the slip stage, causing pronounced spatial heterogeneity and structural deformation, particularly in coal seam roofs.
- (3)
- Structural planes control fault geometry and slip behavior, guiding crack initiation and slip paths. The slip process conforms to the Mohr–Coulomb criterion, indicating a clear mechanical mechanism underlying fault activation.
- (4)
- The multi-stage evolution of stress fields observed in physical simulation provides quantitative insights into fault-induced damage. These findings contribute to stress prediction and disaster mitigation strategies in fault zones during deep coal mining.
Author Contributions
Conceptualization, C.M.; methodological W.D.; verification B.C.; resource B.C.; data integration W.D.; writing-original draft preparation J.W.; writing-review and editing Z.X.; funding acquisition Z.X. All authors have read and agreed to the published version of the manuscript.
Funding
The research is financially supported by the National Natural Science Foundation of China (No. 52204137), and the National Natural Science Foundation of China (Grant No. 52409132), and the Basic Research Program of Jiangsu (Grant No. BK20240431), and The Education Department Foundation of Liaoning Province (LJ212510146001).
Institutional Review Board Statement
Not applicable for studies not involving humans or animals.
Data Availability Statement
The original contributions presented in this study are included in the article. Further inquiries can be directed to the corresponding authors.
Conflicts of Interest
On behalf of all authors, the corresponding author states that there is no conflict of interest. The authors declare that they have no known competing financial interests or personal relationships that could have appeared to influence the work reported in this study.
References
- Xie, H.; Gao, M.; Zhang, R.; Peng, G.; Wang, W.; Li, A. Study on the Mechanical Properties and Mechanical Response of Coal Mining at 1000 m or Deeper. Rock Mech. Rock Eng. 2019, 52, 1475–1490. [Google Scholar] [CrossRef]
- Huang, Q.; Han, P.; Hattori, K.; Ren, H. Electromagnetic signals associated with earthquakes: A review of observations, data processing, and mechanisms in China. In Seismoelectric Exploration: Theory, Experiments, and Applications; American Geophysical Union: Washington, DC, USA, 2020; pp. 415–436. [Google Scholar] [CrossRef]
- Cox, S.J.D.; Scholz, C.H. On the formation and growth of faults: An experimental study. J. Struct. Geol. 1988, 10, 413–430. [Google Scholar] [CrossRef]
- Hui, G.; Chen, Z.; Schultz, R.; Chen, S.; Song, Z.; Zhang, Z.; Song, Y.; Wang, H.; Wang, M.; Gu, F. Intricate unconventional fracture networks provide fluid diffusion pathways to reactivate pre-existing faults in unconventional reservoirs. Energy 2023, 282, 128803. [Google Scholar] [CrossRef]
- Zhang, L.; Li, X.; Ren, T. A theoretical and experimental study of stress–strain, creep and failure mechanisms of intact coal. Rock Mech. Rock Eng. 2020, 53, 5641–5658. [Google Scholar] [CrossRef]
- Li, W.; Ren, T.; Busch, A.; den Hartog, S.A.M.; Cheng, Y.; Qiao, W.; Bin, L. Architecture stress state and permeability of a fault zone in Jiulishan coal mine, China: Implication for coal and gas outbursts. Int. J. Coal Geol. 2018, 198, 1–13. [Google Scholar] [CrossRef]
- Li, X.; Gu, H.; Tao, M.; Peng, K.; Cao, W.; Li, Q. Failure characteristics and meso-deterioration mechanism of pre-stressed coal subjected to different dynamic loads. Theor. Appl. Fract. Mech. 2021, 115, 103061. [Google Scholar] [CrossRef]
- Liu, X.; Zhou, X.; Zhang, Z.; Zhang, H.; Gu, Z.; Zhang, S.; Yan, G. Compound disaster characteristics of rock burst and coal spontaneous combustion in island mining face: A case study. Case Stud. Therm. Eng. 2024, 63, 105240. [Google Scholar] [CrossRef]
- Niu, H.-Y.; Zhu, H.-L.; Wang, G.-D.; Pan, H.-Y.; Sun, S.-W.; Yu, X.-D.; Yang, X.; He, J.-X. A Review of the Mechanisms and Control Technologies of Coal and Gas Outbursts: Recent Advances and Future Perspectives. Energy Fuels 2024, 38, 23230–23245. [Google Scholar] [CrossRef]
- Dou, L.; Yang, K.; Liu, W.; Chi, X.; Wen, Z. Mining-Induced Stress-Fissure Field Evolution and the Disaster-Causing Mechanism in the High Gas Working Face of the Deep Hard Strata. Geofluids 2020, 2020, 8849666. [Google Scholar] [CrossRef]
- Elliott, J.R.; Walters, R.J.; Wright, T.J. The role of space-based observation in understanding and responding to active tectonics and earthquakes. Nat. Commun. 2016, 7, 13844. [Google Scholar] [CrossRef]
- Ponomarev, A.V.; Zavyalov, A.D.; Smirnov, V.B.; Lockner, D.A. Physical modeling of the formation and evolution of seismically active fault zones. Tectonophysics 1997, 277, 57–81. [Google Scholar] [CrossRef]
- Baroň, I.; Koktavý, P.; Trčka, T.; Rowberry, M.; Stemberk, J.; Balek, J.; Plan, L.; Melichar, R.; Diendorfer, G.; Macků, R.; et al. Differentiating between artificial and natural sources of electromagnetic radiation at a seismogenic fault. Eng. Geol. 2022, 311, 106912. [Google Scholar] [CrossRef]
- Zeigarnik, V.A.; Bogomolov, L.M.; Novikov, V.A. Electromagnetic Earthquake Triggering: Field Observations, Laboratory Experiments, and Physical Mechanisms—A Review. Izv. Phys. Solid Earth 2022, 58, 30–58. [Google Scholar] [CrossRef]
- De Santis, F.; Renaud, V.; Gunzburger, Y.; Kinscher, J.; Bernard, P.; Contrucci, I. In situ monitoring and 3D geomechanical numerical modelling to evaluate seismic and aseismic rock deformation in response to deep mining. Int. J. Rock Mech. Min. Sci. 2020, 129, 104273. [Google Scholar] [CrossRef]
- Lee, F.-Y.; Tan, E.; Chang, E.T. Stress evolution of fault-and-thrust belts in 2D numerical mechanical models. Front. Earth Sci. 2024, 12, 1415139. [Google Scholar] [CrossRef]
- Wang, G.; Liu, W.; Jiang, F.; He, P.; Huang, N.; Xiao, Z.; Zheng, C. Shear damage mechanisms of jointed rock mass: A macroscopic and mesoscopic study. Sci. Rep. 2024, 14, 8619. [Google Scholar] [CrossRef] [PubMed]
- Sibson, R.H. Earthquakes and rock deformation in crustal fault zones. Annu. Rev. Earth Planet. Sci. 1986, 14, 149. [Google Scholar] [CrossRef]
- Park, S.K.; Johnston, M.J.S.; Madden, T.R.; Morgan, F.D.; Morrison, H.F. Electromagnetic precursors to earthquakes in the ULF band: A review of observations and mechanisms. Rev. Geophys. 1993, 31, 117–132. [Google Scholar] [CrossRef]
- Conti, L.; Picozza, P.; Sotgiu, A. A critical review of ground based observations of earthquake precursors. Front. Earth Sci. 2021, 9, 676766. [Google Scholar] [CrossRef]
- Aben, F.M.; Doan, M.-L.; Mitchell, T.M.; Toussaint, R.; Reuschlé, T.; Fondriest, M.; Gratier, J.-P.; Renard, F. Dynamic fracturing by successive coseismic loadings leads to pulverization in active fault zones. J. Geophys. Res. Solid Earth 2016, 121, 2338–2360. [Google Scholar] [CrossRef]
- Hosseini, A.; Mostofinejad, D.; Hajialilue-Bonab, M. Displacement and strain field measurement in steel and RC beams using particle image velocimetry. J. Eng. Mech. 2014, 140, 04014086. [Google Scholar] [CrossRef]
- Wang, H.; Shi, R.; Lu, C.; Jiang, Y.; Deng, D.; Zhang, D. Investigation of sudden faults instability induced by coal mining. Saf. Sci. 2019, 115, 256–264. [Google Scholar] [CrossRef]
- Kong, P.; Jiang, L.; Shu, J.; Wang, L. Mining stress distribution and fault-slip behavior: A case study of fault-influenced longwall coal mining. Energies 2019, 12, 2494. [Google Scholar] [CrossRef]
- Wang, K. Coupling of tectonic loading and earthquake fault slips at subduction zones. Pure Appl. Geophys. 1995, 145, 537–559. [Google Scholar] [CrossRef]
- Wallace, L.M.; Ellis, S. Upper plate tectonic stress state may influence interseismic coupling on subduction megathrusts. Geology 2012, 40, 895–898. [Google Scholar] [CrossRef]
- Deyong, G.; Jianguo, Z.; Guochuan, Z. Controlling effect of tectonic stress field on coal and gas outburst. J. China Coal Soc. 2023, 48, 3076–3090. [Google Scholar] [CrossRef]
- Zhao, X.; Wang, P.; Wang, P.; Liao, Z.; Li, H.; Zhou, Z. On the Mechanism of Stress Superposition Inducing Outburst Under the Influence of Blind Fault Instability. Geotech. Geol. Eng. 2022, 40, 3973–3984. [Google Scholar] [CrossRef]
- Lin, J.; Zuo, Y.; Zhang, K.; Sun, W.; Jin, B.; Li, T.; Chen, Q.-G. Coal and gas outburst affected by law of small fault instability during working face advance. Geofluids 2020, 2020, 8880091. [Google Scholar] [CrossRef]
- Wu, W. A review of unloading-induced fault instability. Undergr. Space 2021, 6, 528–538. [Google Scholar] [CrossRef]
- Simpson, R.W. Quantifying Anderson’s fault types. J. Geophys. Res. Solid Earth 1997, 102, 17909–17919. [Google Scholar] [CrossRef]
- Yin, Z.M.; Ranalli, G. Critical stress difference, fault orientation and slip direction in anisotropic rocks under non-Andersonian stress systems. J. Struct. Geol. 1992, 14, 237–244. [Google Scholar] [CrossRef]
- An, Y. Origin of regional, rooted low-angle normal faults: A mechanical model and its tectonic implications. Tectonics 1989, 8, 469–482. [Google Scholar] [CrossRef]
- Neng, Y.; Li, Y.; Qi, J.; Ma, X.; Zuo, L.; Chen, P. Deformation styles and multi-stage evolution history of a large intraplate strike-slip fault system in a Paleozoic superimposed basin: A case study from the Tarim Basin, NW China. Front. Earth Sci. 2022, 10, 837354. [Google Scholar] [CrossRef]
- Wang, J.; Jiang, L.; Cang, T.; Zhou, X.; Wang, B. Simulation of a Multi-Stage Stress Field and Regional Prediction of Structural Fractures in the Tucheng Syncline, Western Guizhou, China. Geosciences 2025, 15, 132. [Google Scholar] [CrossRef]
- Hopp, C.; Guglielmi, Y.; Rinaldi, A.P.; Soom, F.; Wenning, Q.; Cook, P.; Robertson, M.; Kakurina, M.; Zappone, A. The effect of fault architecture on slip behavior in shale revealed by distributed fiber optic strain sensing. J. Geophys. Res. Solid Earth 2022, 127, e2021JB022432. [Google Scholar] [CrossRef]
- Gutscher, M.-A.; Royer, J.-Y.; Graindorge, D.; Murphy, S.; Klingelhoefer, F.; Aiken, C.; Cattaneo, A.; Barreca, G.; Quetel, L.; Riccobene, G. Fiber optic monitoring of active faults at the seafloor: I the FOCUS project. Photoniques 2019, 32–37. [Google Scholar] [CrossRef]
- Moore, J.R.; Gischig, V.; Button, E.; Loew, S. Rockslide deformation monitoring with fiber optic strain sensors. Nat. Hazards Earth Syst. Sci. 2010, 10, 191–201. [Google Scholar] [CrossRef]
- Zhang, S.; Lu, L.; Wang, S. A physical model study of surrounding rock failure near a fault under the influence of footwall coal mining. Int. J. Coal Sci. Technol. 2021, 8, 626–640. [Google Scholar] [CrossRef]
- Tian, S.; Qiao, Y.; Zhang, Y.; Hu, D.; Zhou, H.; Iqbal, S.M. Analysis of Fault Influence on Geostress Perturbation Based on Fault Model Test. Processes 2024, 12, 1240. [Google Scholar] [CrossRef]
- Xu, X.; Jing, H.; Zhao, Z.; Yin, Q.; Li, J.; Li, H. Physical model experiment research on evolution process of water inrush hazard in a deep-buried tunnel containing the filling fault. Environ. Earth Sci. 2022, 81, 488. [Google Scholar] [CrossRef]
- Wang, H.; Shi, R.; Song, J.; Tian, Z.; Deng, D.; Jiang, Y. Mechanical model for the calculation of stress distribution on fault surface during the underground coal seam mining. Int. J. Rock Mech. Min. Sci. 2021, 144, 104765. [Google Scholar] [CrossRef]
- Feng, W.; Niu, S.; Qiao, C.; Zou, D. Nonlinear constitutive models of rock structural plane and their applications. J. Rock Mech. Geotech. Eng. 2024, 16, 790–806. [Google Scholar] [CrossRef]
- Li, Q.; Jia, H.; Yang, G.; Yang, L.; Yang, C.; Liu, X. Compressive failure response and thermal melting softening effect of ice-filled fractured rock mass. Chin. J. Rock Mech. Eng. 2024, 43, 103–119. [Google Scholar] [CrossRef]
Disclaimer/Publisher’s Note: The statements, opinions and data contained in all publications are solely those of the individual author(s) and contributor(s) and not of MDPI and/or the editor(s). MDPI and/or the editor(s) disclaim responsibility for any injury to people or property resulting from any ideas, methods, instructions or products referred to in the content. |
© 2025 by the authors. Licensee MDPI, Basel, Switzerland. This article is an open access article distributed under the terms and conditions of the Creative Commons Attribution (CC BY) license (https://creativecommons.org/licenses/by/4.0/).