Article

Optimized Extraction and Component Identification of Physalis alkekengi L. Calyx Polyphenols and Antioxidant Dynamics During Thermal Processing

1
College of Food and Biology Engineering, Xuzhou University of Technology, Xuzhou 221018, China
2
College of Food Science & Nutritional Engineering, China Agricultural University, Beijing 100083, China
*
Author to whom correspondence should be addressed.
These authors contributed equally to this work.
Processes 2025, 13(9), 2793; https://doi.org/10.3390/pr13092793
Submission received: 6 August 2025 / Revised: 27 August 2025 / Accepted: 29 August 2025 / Published: 31 August 2025
(This article belongs to the Section Food Process Engineering)

Abstract

Physalis alkekengi L. has attracted widespread attention and cultivation due to its unique lantern-shaped fruit and various bioactivities. Existing studies have mainly focused on its fruit, while the calyx, despite its significant bioactivity, has long been neglected. In particular, research on the changes in polyphenol content and antioxidant activity during its drying process remains scarce. This study aimed to optimize the extraction process, comprehensively profile the polyphenol composition, and evaluate the effects of the drying temperature on the polyphenol content and antioxidant capacity in the calyx of Physalis alkekengi L. (CPAL). Ultrasound-assisted extraction (40 kHz, 300 W) combined with response surface methodology was used to optimize the extraction conditions. The optimized parameters were determined as a 49% ethanol concentration, a 42 mL/g liquid-to-material ratio, a 64 °C extraction temperature, and a 29 min extraction time. Under these settings, the yield reached 10.44 ± 0.16 mg GAE/g, exceeding that of the conventional heat reflux extraction method. Using high-resolution mass spectrometry, 63 polyphenolic compounds were identified, primarily derivatives of kaempferol, quercetin, and hydroxycinnamic acid; 43 of these compounds were first reported in CPAL. CPAL polyphenols possess potent antioxidant activities, with IC50 values of 68.77, 12.76, and 101.24 μg/mL for DPPH, ABTS, and FRAP, respectively. Furthermore, as the drying temperature increased, the polyphenol content and antioxidant activity of CPAL increased significantly. These findings provide a scientific basis for the development of natural antioxidants and functional foods.

1. Introduction

Physalis alkekengi L., commonly known as Chinese lantern, is a perennial herbaceous plant in the genus Physalis (Solanaceae family). This species exhibits high resilience in the wild, rich nutritional value, and exceptional cold tolerance. It is widely distributed across the Eurasian continent, with particularly extensive use in Northeast China [1]. Its dual medicinal and edible properties mainly derive from the various bioactive compounds abundant in its fruit, such as steroids, flavonoids, and polyphenols [2]. These compounds confer significant bioactivities to the fruit, including antitumor, anti-inflammatory, and metabolic regulatory effects [3,4]. To date, research on Physalis alkekengi L. has primarily focused on its fruit, with relatively in-depth investigations into its chemical constituents and pharmacological activities [5].
However, research on the calyx of Physalis alkekengi L. (CPAL) is limited. In traditional Chinese medicine, the calyx is regarded as having effects such as relieving cough, clearing heat and detoxifying, and resolving phlegm, and is considered as a potential medicinal and edible resource [6]. Modern studies have confirmed that it is rich in various bioactive compounds with promising medicinal potential [7]. However, traditional analytical techniques are limited in terms of sensitivity and resolution [8]. Consequently, existing studies have mostly been confined to qualitative or quantitative analyses of a few polyphenols in the calyx [9]. A comprehensive and systematic characterization of the calyx’s polyphenol profile is needed.
The efficient extraction of polyphenols is the basis for subsequent research and application [10]. However, current research on the optimization of CPAL polyphenol extraction processes is relatively limited and requires further investigation [11]. Studies have shown that ultrasound-assisted extraction (UAE), by virtue of its unique cavitation effect, demonstrates certain advantages over conventional extraction methods [12]. For example, González-Silva et al. compared UAE with aqueous–organic extraction for extracting polyphenols from Psidium cattleianum leaves. They found that UAE significantly increased the total phenolic content (TPC) from 65.27 ± 3.85 to 158.18 ± 2.00 mg GAE/g DW and enhanced DPPH radical-scavenging activity from 282.83 ± 3.67 to 418.19 ± 4.32 mmol Trolox/g while reducing the extraction time from 2 h to 4 min [13]. Similarly, Çavdar et al. reported that UAE yielded a higher TPC from Inula viscosa compared to conventional Soxhlet extraction (489.54 ± 5.87 vs. 289.55 ± 5.21 mg GAE/g) [14]. Mnayer et al. also demonstrated that UAE improved the polyphenol yield from thyme from 4.03 to 5.93 g/100 g dry weight [15]. These results indicate that after optimization, UAE can effectively enhance the extraction efficiency of polyphenols, shorten extraction time, and provide higher antioxidant activity compared to conventional methods [16].
The optimization of extraction processes aims to efficiently obtain functional components. Meanwhile, the post-harvest drying process is crucial for maximizing the stability and bioactivity of these active components. Physalis alkekengi L. is typically harvested in October, when environmental temperatures are low [17]. This results in inefficient natural drying and difficulty in maintaining calyx quality. Therefore, developing suitable drying processes is essential to maintain the stability and bioactivity of its polyphenolic compounds.
The aim of this study is to optimize the UAE process to efficiently extract polyphenolics from CPAL using the response surface methodology (RSM). A comprehensive and systematic characterization of the polyphenols from CPAL was performed using high-resolution mass spectrometry (UPLC-HRMS). Additionally, this study investigates the changes in TPC and antioxidant activity during drying treatments at different temperatures. This research provides a scientific basis for the development of natural antioxidants and functional foods.

2. Materials and Methods

2.1. Plant Materials

Physalis alkekengi L. was purchased from a market in Fuxin, Liaoning, China. The plant material was identified by Professor Chao Li, a taxonomic expert at our university. The voucher specimen (No. XZUT-PAL) is deposited in the specimen collection of the laboratory at the College of Food and Biological Engineering, Xuzhou University of Technology. The samples were divided into two portions: one for experiments to optimize the extraction process and the other for the drying process.

2.2. Chemicals and Reagents

All the reagents used in this study, including anhydrous ethanol, hydrochloric acid, sodium hydroxide, anhydrous sodium carbonate, the Folin–Ciocalteu phenol reagent, AB-8 macroporous adsorption resin, 2,2-diphenyl-1-picrylhydrazyl (DPPH), persulfate, 2,2′-azino-bis (3-ethylbenzothiazoline-6-sulfonic acid) diammonium salt (ABTS), potassium ferricyanide, trichloroacetic acid, ferric chloride, disodium hydrogen phosphate, and monosodium dihydrogen phosphate, were analytical grade and purchased from Shanghai Macklin Biochemical Technology Co., Ltd. (Shanghai, China). Standard compounds, including gallic acid and ascorbic acid, were obtained from Beijing Bailingwei Technology Co., Ltd. (Beijing, China). LC-MS-grade methanol, acetonitrile, formic acid, and 2-chlorophenylalanine were procured from Shanghai Anpu Biological Technology Co., Ltd. (Shanghai, China).

2.3. Extraction of Polyphenols from CPAL

2.3.1. Preparation of CPAL Powder

The fruits of Physalis alkekengi L. were removed from the calyxes, which were then washed, freeze-dried for 48 h, ground into powder, passed through an 80-mesh sieve, and stored at −80 °C until further use.

2.3.2. CPAL-Drying Experiment

After removing the fruits of Physalis alkekengi L., the calyxes were washed thoroughly with clean water and divided into four portions, each weighing approximately 100 g. These portions were dried in an oven at 40 °C, 60 °C, 80 °C, and 120 °C, until a constant weight was reached (a weight change of <0.01 g). The final moisture content of the samples was determined to be below 6%. Upon the completion of drying, each sample was ground into powder under liquid nitrogen, passed through an 80-mesh sieve, and then used to analyze how different drying temperatures affect the total phenolic content and antioxidant activity of CPAL.

2.3.3. Ultrasonic-Assisted Extraction

An ethanol solution, with appropriate concentration and volume, was added to 0.5000 g of CPAL powder before the ultrasonic treatment. Ultrasonic treatment was performed using an ultrasonic device (KQ-300E, Kunshan Shumei Ultrasonic Instruments Co., Ltd., Suzhou, China) at a fixed frequency of 40 kHz, a power of 300 W, and a set temperature. Subsequently, the solution was centrifuged (at 10,000 rpm for 20 min), and the supernatant was diluted using a corresponding ethanol solution in a 50 mL volumetric flask before TPC quantification. The ethanol concentration, solvent volume (liquid-to-material ratio), time, and temperature were adjusted as required by single-factor experiments or the RSM design.

2.3.4. Quantification of the Total Phenolic Content

A 10 mL test tube was taken, and 1.0 mL of the sample solution (or gallic acid) and 5 mL of the 10% Folin–Ciocalteu phenol reagent were added sequentially. After standing for 5 min, 4 mL of 7.5% Na2CO3 solution was added, followed by incubation at room temperature for 60 min in darkness. The absorbance at 765 nm was then measured using a spectrophotometer (T6, Beijing Purkinje General Instrument Co., Ltd., Beijing, China). The TPC was calculated based on Equation (1) and expressed as milligrams of gallic acid equivalents per gram of dry weight (mg GAE/g) as follows [18]:
T P C   m g   G A E / g   = C × 50 × N M  
where C is phenolic concentration calculated from the standard curve (mg/mL), 50 is the volume of the CPLA crude solution (mL), N is the dilution ratio of the sample, and M is the weight of the CPAL powder (g).
The polyphenol yield was expressed as the TPC measured in the CPAL samples, following the method described by Che et al. [19].

2.4. Extraction Optimization of CPAL Polyphenols

2.4.1. Design of the Single-Factor Experiment

The TPC of the CPAL was assessed using single-factor experiments. Investigated parameters included the ethanol concentration (40–90% v/v), liquid-to-material ratio (30 to 80 mL/g), extraction time (10–60 min), and extraction temperature (30–70 °C). Each variable was evaluated individually while the others remained unchanged, and each experiment was repeated three times.

2.4.2. RSM Experiment

Based on the results from the single-factor experiments, the 43-level Box–Behnken experiment was performed (Table 1). The TPC of the CPAL was used as the response value. The center points (0 level) were set at the observed optimum, while the adjacent parameter values were selected as the −1 and +1 levels [20,21]. As reported in ref. [22], a quadratic polynomial equation characterizes the associations between the predictor and outcome variables [22].
Y = α 0 + i = 1 n   α i X i + i = 1 n   α i i X i 2 + i j = 1 n   α i j X i X j
where Y represents the TPC of the CPAL; Xi and Xj represent independent parameters; n (1–4) represents the number of independent parameters, α0 represents the intercept, and αi, αii, and αij represent the linear, quadratic, and interaction model coefficients, respectively.
The significance of the derived mathematical model was tested using analysis of variance (ANOVA). The reliability of this model’s predictions of CPAL’s total phenolic contents in different extraction scenarios was determined by the assessment of its overall significance and lack-of-fit statistics. To gain deeper insights into the model’s explanatory power and precision, the coefficient of determination (R2), adjusted determination coefficient (Radj2), and coefficient of variance (CV, %) values were scrutinized [23,24].

2.5. Characterization of Polyphenolics in CPAL

2.5.1. Purification of the CPAL Ethanol Extract

The purification of the CPAL polyphenol extract was carried out according to previous research [25]. Briefly, the CPAL polyphenol extract was rotary-evaporated at 40 °C and lyophilized for 48 h. Then, 2.00 g of the CPAL ethanol extract powder was dissolved in 20 mL of ddH2O, and the pH of the solution was adjusted to 4.6 ± 0.1 with HCl. Subsequently, the 20 mL solution was added to a column (AB-8 macroporous resin) for adsorption. After washing with ddH2O, 95% ethanol was used to elute the desired fraction. The eluent was concentrated and lyophilized for future use, as discussed in Section 2.5.2 and Section 2.6.

2.5.2. Analysis by UPLC-Q Exactive HF Orbitrap-MS

Methanol (1 mL, 80% (v/v)) was added to 100 mg of purified CPAL powder and then homogenized for 3 min. The mixture was centrifuged (at 9000 rpm for 10 min) and transferred to a tube. A 10 μL aliquot of an internal standard solution (2-amino-3-(2-chlorophenyl)-propionic acid, 100 μg/mL) was added, and the extract was filtered through a 0.22 μm PTFE membrane prior to the analysis [26].
The analysis was performed using a Thermo UPLC-Q Exactive HF Orbitrap-MS system [27]. Chromatographic separation was performed in a Zorbax Eclipse C18 column (2.1 × 100 mm, 1.8 μm, Agilent Technologies, Inc., Santa Clara, CA, USA) maintained at 30 °C. The mobile phases consisted of a 0.1% HCOOH aqueous solution (A) and acetonitrile (B). The elution program was executed at a flow rate of 0.3 mL/min with a 2 μL injection volume (Table 2). Mass spectrometry parameters were consistent with those employed in our earlier work [25].
Compound Discoverer 3.3 was used to perform preprocessing steps, including peak detection, retention time (RT) alignment, and feature extraction. Subsequently, compound identification was conducted based on the Thermo mzCloud online database and the mzVault local database. A strict set of multi-criteria filters was applied for identification, requiring an RT deviation of within ± 0.2 min relative to the reference standards, a precursor ion mass error of less than 5 ppm, and a fragment ion spectral match score of greater than 70.

2.6. Antioxidant Assays

2.6.1. DPPH Radical-Scavenging Assay

Ascorbic acid is a widely used standard antioxidant with a well-characterized mechanism and high stability; it is commonly employed as a positive control in antioxidant assays to facilitate comparison with other studies [28]. Equal volumes of the sample and DPPH (1.6 mM) solution were placed in a 96-well plate and put in the dark for 30 min. Then, A517 nm was measured. Equation (3) was used to calculate the DPPH-scavenging percentage [29].
S c a v e n g i n g   p e r c e n t a g e   % = 1 A s A b   A c × 100
where As stands for the sample absorbance, Ab stands for the blank absorbance (without the addition of DPPH), and Ac stands for the negative control (using ddH2O to take the place of the sample solution).

2.6.2. ABTS Radical-Scavenging Assay

The ABTS working solution was prepared by combining 7 mM ABTS and 2.45 mM K2S2O8 and was then diluted with 10 mM PBS (pH 7.4) to an appropriate absorbance. Then, 0.02 mL of the sample was mixed with 0.18 mL of the ABTS solution. After incubation in darkness for 6 min, the absorption, at 734 nm of the mixture was measured. For the reference antioxidant, an ascorbic acid solution was used to replace the samples. Equation (3) was used to calculate the ABTS-scavenging percentage [30].

2.6.3. Ferric-Reducing Antioxidant Power Assay

A 100 μL aliquot of the sample was mixed with 250 μL of phosphate buffer (0.2 mol/L, pH 6.6) and 250 μL of a 1% (w/v) K3[Fe(CN)6] solution. The mixture was vortexed thoroughly and incubated in a water bath at 50 °C for 20 min. After cooling to room temperature, 200 μL of 10% (w/v) trichloroacetic acid was added and mixed. The solution was then centrifuged at 3000 rpm for 10 min. Subsequently, 150 μL of the supernatant was collected and mixed with 50 μL of a 0.1% (w/v) FeCl3 solution. A700nm was measured. The ferric-reducing antioxidant power (FRAP) of the sample is proportional to the measured absorbance value.
Figure 1 shows the sample preparation process.

2.7. Statistical Analysis

Three independent samples were used for each trial, and the results were reported as means ± standard deviations. RMS was performed using Design Expert 13.0 (Stat-Ease Inc., Minneapolis, MN, USA). One-way ANOVA with Duncan’s multiple range test was performed and IC50 values were obtained using SPSS (version 25.0, IBM Corp., Armonk, NY, USA).

3. Results and Discussion

3.1. Single-Factor Experiment

This research examined how extraction conditions impact the TPC of CPAL, concentrating on four main factors: the ethanol concentration, liquid-to-material ratio, extraction time, and extraction temperature. These factors are widely recognized in the literature as critical variables influencing polyphenol extraction, as they significantly impact the extraction efficiency and total phenolic yield [31,32,33,34]. Previous studies have also emphasized that these parameters are crucial for optimizing the recovery of polyphenols from various plant materials [18,35].
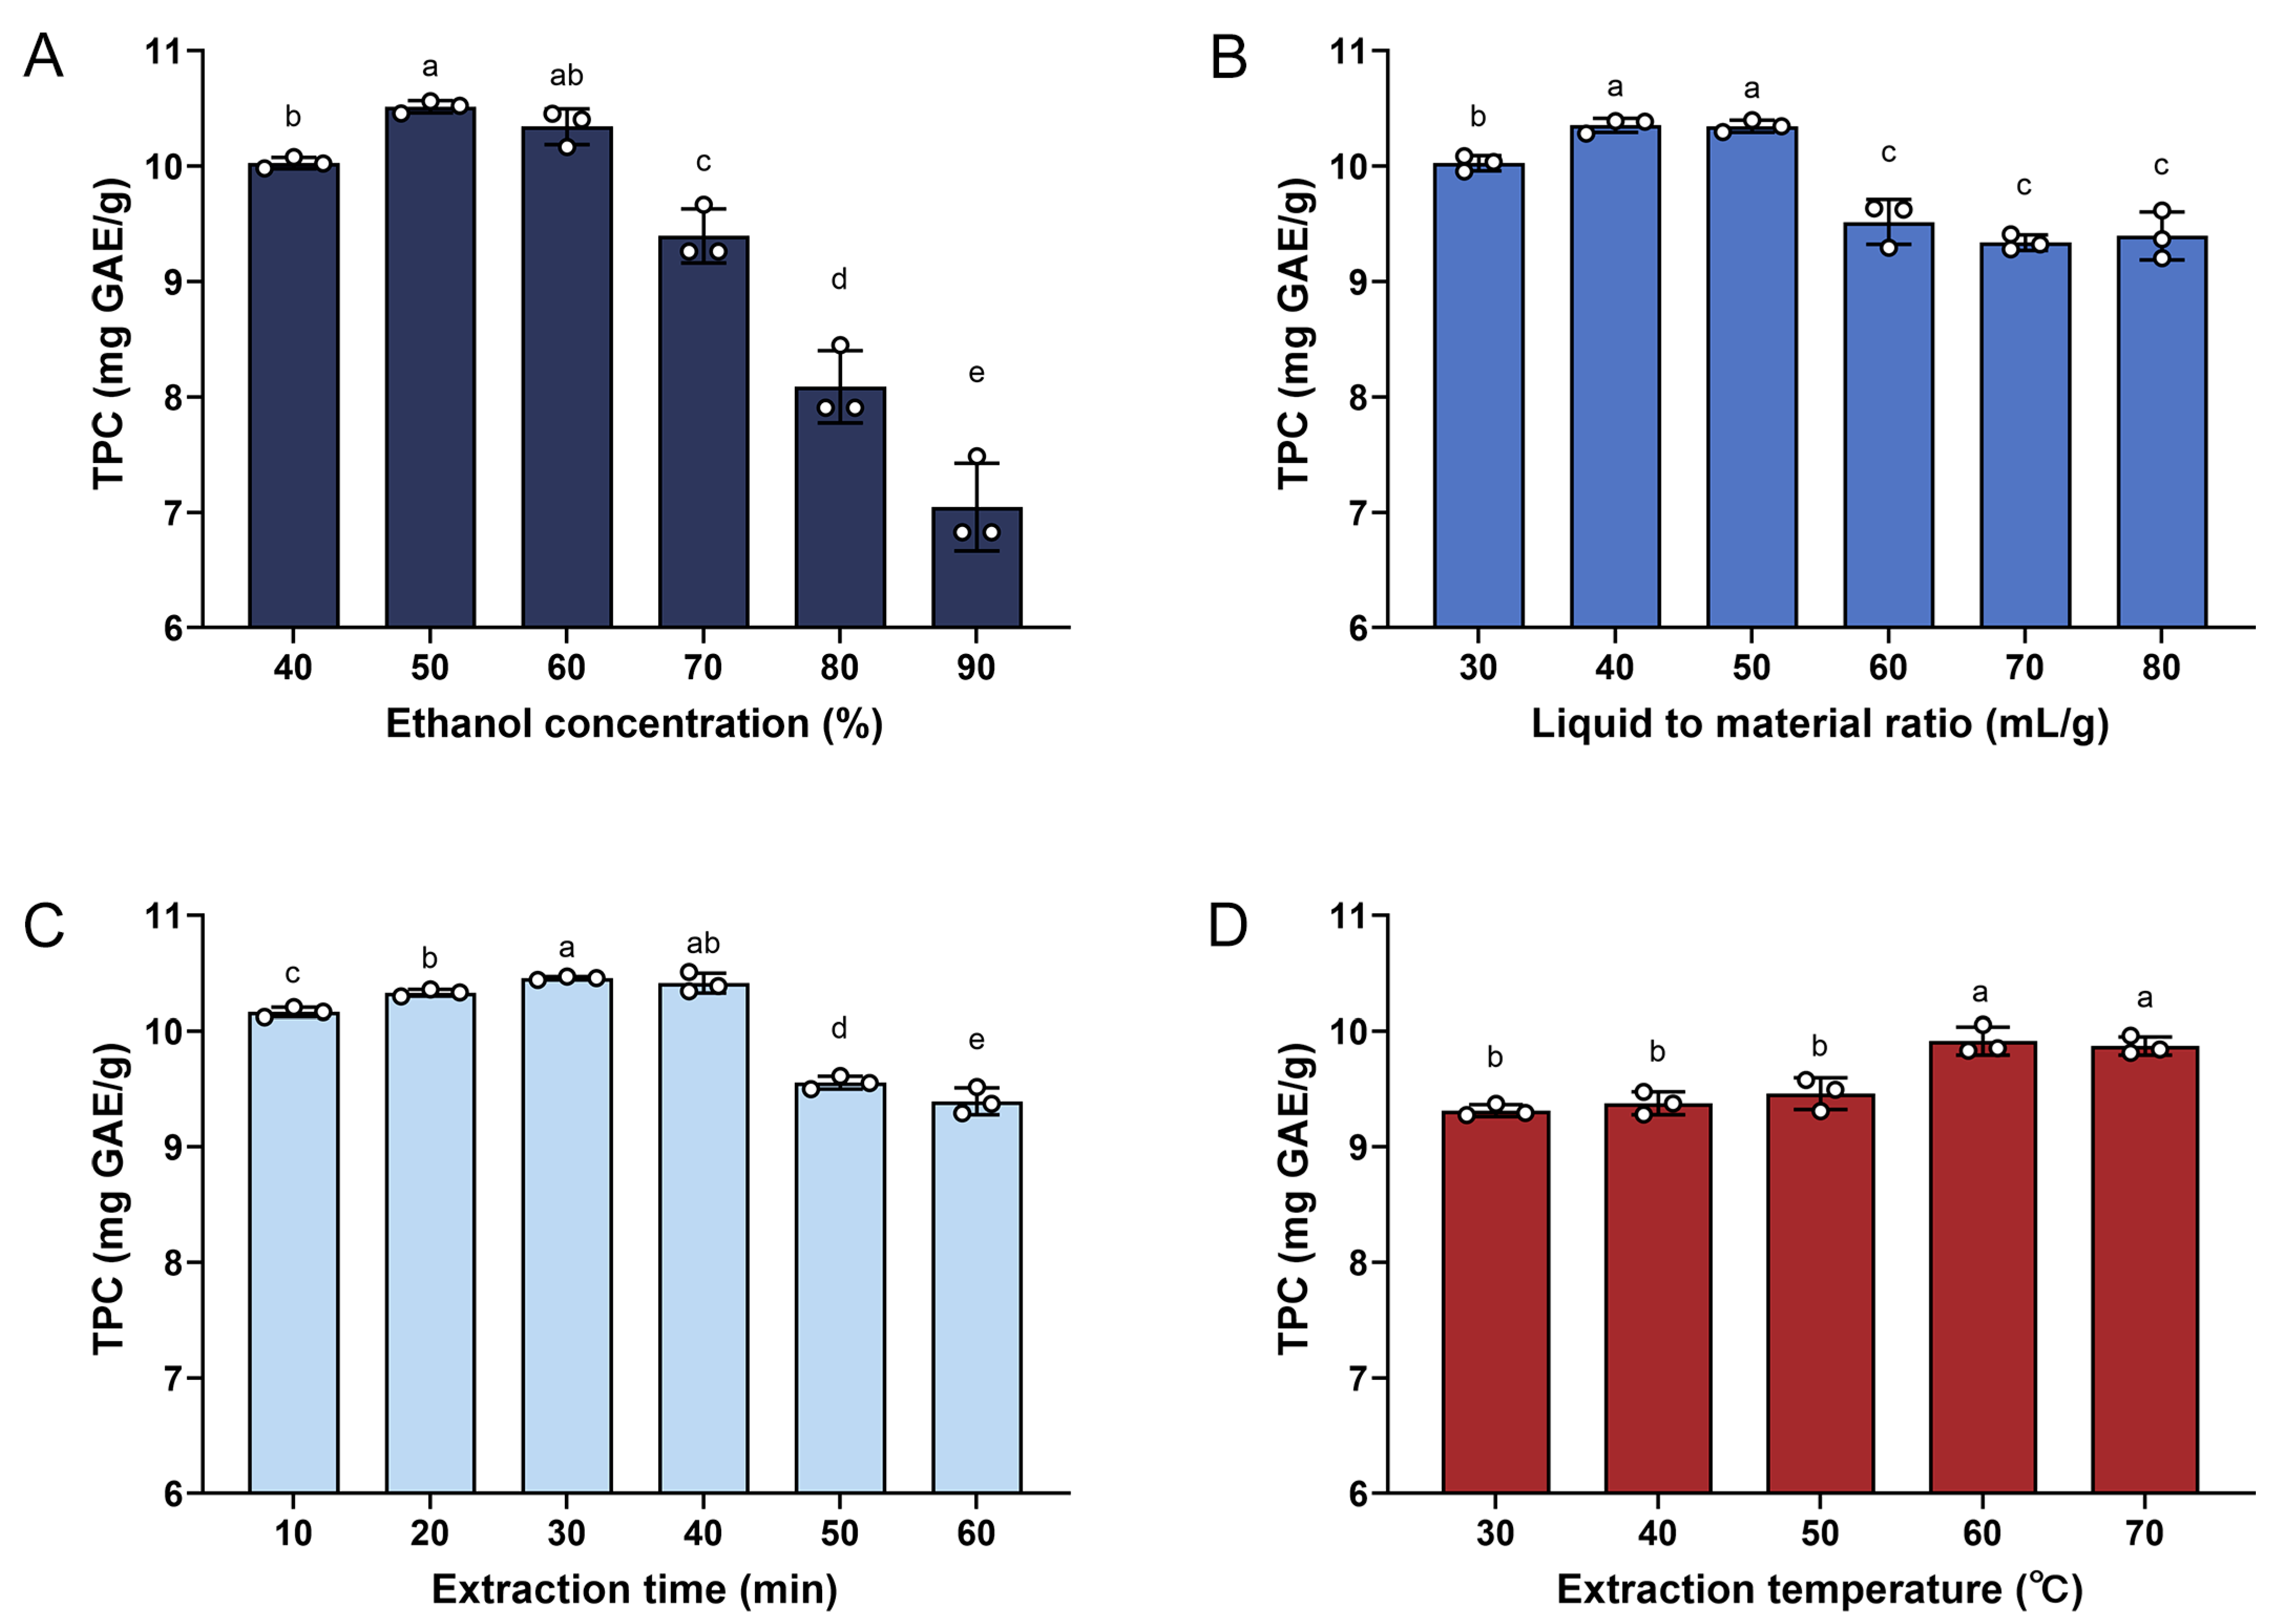
Ethanol, being a polar solvent, is efficient at dissolving and extracting polyphenols from plant materials [19]. As shown in Figure 2A (the liquid-to-material ratio, extraction time, and extraction temperature were fixed at 50 mL/g, 30 min, and 60 °C, respectively), when the ethanol concentration is increased from 30% to 50%, the total phenolic content significantly increases; however, when the concentration exceeds 50%, the yield gradually decreases. This effect is mainly because ethanol can break the bonds linking polyphenols to the plant matrix [36]. However, when the ethanol concentration becomes too high, it changes the polarity of the solvent, reducing its effectiveness at dissolving highly polar polyphenols and, thus, negatively impacting the extraction efficiency [37]. Therefore, a 50% ethanol volume fraction was selected as optimal, consistent with the “like-dissolves-like” principle, meaning that an appropriate ethanol concentration can efficiently dissolve and extract polyphenolic compounds [38].
In Figure 2B (the extraction concentration, extraction time, and extraction temperature were fixed at 50%, 30 min, 60 °C, respectively), the total phenolic yield is seen to initially increase and then decrease with a rising liquid-to-material ratio, hitting a maximum at 40 mL/g. In the initial stage, insufficient solvents lead to incomplete extraction; however, an excessively high liquid-to-material ratio may reduce the extraction efficiency [39]. Increasing the solvent volume appropriately can expand the contact area, boost the osmotic pressure, and lower the solution viscosity, which, in turn, speed up mass transfer and enhance the ultrasonic cavitation effect. Conversely, an overly high liquid-to-material ratio may weaken the penetration ability of the ultrasound, hindering effective extraction [40]. Considering both the extraction efficiency and economic feasibility, a liquid-to-material ratio of 40 mL/g was determined to be optimal.
As shown in Figure 2C (the ethanol concentration, liquid-to-material ratio, and extraction temperature were fixed at 50%, 40 mL/g, and 60 °C, respectively), the TPC was maximized after 30 min of ultrasonic treatment. Extending the treatment time may lead to a decrease in yield due to the degradation of phenolic compounds. The diffusion and release of polyphenols is facilitated by an appropriate duration of ultrasonic treatment [19]. However, excessive treatment can lead to polyphenol degradation due to prolonged oxidative exposure and the mechanical shearing effects of ultrasound [20,41]. Therefore, it is essential to control the ultrasonic treatment time to achieve optimal extraction efficiency. Considering both energy efficiency and cost factors, 30 min was selected as the optimal ultrasonic extraction time.
In Figure 2D (the ethanol concentration, liquid-to-material ratio, and extraction time were fixed at 50%, 40 mL/g, and 30 min, respectively), the total phenolic yield continuously increased with rising temperature, reaching a maximum at 60 °C. Further temperature elevation may lead to the oxidation or degradation of phenolic compounds [20]. The increase in the temperature primarily enhances the extraction efficiency by accelerating the thermal motions of phenolics and solvents [42,43]. However, excessively high temperatures can damage the structure of the target compounds, which negatively impacts the extraction process [19]. Therefore, 60 °C was determined to be the optimal temperature for subsequent ultrasonic extraction.
In summary, the ethanol concentration, liquid-to-material ratio, extraction time, and extraction temperature are the key factors that influence the polyphenol extraction yield of CPAL. These factors were selected as parameters for optimization using RSM.

3.2. Analysis of RSM

3.2.1. Analysis of Variance and Regression Equation

Based on the results of the single-factor experiment, the following factors were selected for the Box–Behnken design: ethanol concentration (X1), liquid-to-material ratio (X2), extraction time (X3), and extraction temperature (X4). The design comprises twenty-nine experimental runs, including twenty-four interactive experiments and five central experiments. The TPC of CPAL was employed as the response value, and the results are presented in Table 3.
Regression analysis was performed on the data in Table 3 using Design Expert software, yielding the following quadratic polynomial regression equation with TPC (Y) as the response variable:
Y = 10.65 − 0.1250X1 + 0.0208X2 − 0.0583X3 + 0.1858X4 − 0.0875X1X2 + 0.0850X1X3 − 0.0775X1X4 + 0.0875X2X3
− 0.0425X2X4 − 0.0775X3X4 − 0.5422X12 − 0.2110X22 − 0.5223X32 − 0.2310X42.
The ANOVA results for this model are summarized in Table 4. The model showed an exceptionally high F-value (83.12) and a very significant p-value (p < 0.0001), indicating the model is highly significant. The non-significant lack-of-fit p-value (0.1046) demonstrates a good model fit. The coefficient of determination (R2 = 0.9881) and adjusted R2 (Radj2 = 0.9762) indicate that the model explains over 97.62% of the variation in the response. The accuracy and reliability of the experimental results are further confirmed by the low coefficient of variation (CV = 0.5787%).
According to the ANOVA results in Table 4, the linear terms for the ethanol concentration (X1) and extraction temperature (X4) were both highly significant (p < 0.001), indicating that these two factors have significant effects on the extraction of the total phenolics from CPAL. The linear term for the extraction time (X3) was also significant (p < 0.05), whereas the linear effect of the liquid-to-material ratio (X2) was not significant (p = 0.2341). Nonetheless, X2 was retained in the final model for the following reasons: First, removing X2 and fitting a three-factor model produced a significant lack-of-fit (p = 0.0398), indicating that X2 contributes to the model’s overall explanatory power. Second, X2 exhibits significant interaction effects with other factors (e.g., X1X2, p = 0.0093), suggesting that it modulates the influence of other factors on the response value when the liquid-to-material ratio varies. Additionally, retaining all the factors helps to maintain the structural integrity of the response surface design, thereby enhancing the robustness and predictive capability of the model. Similar approaches have been reported in previous studies. For instance, Su et al., while optimizing the extraction of polyphenols from Ilex asprella roots, retained the extraction time factor, despite its non-significant individual effect (p = 0.0862), due to its significant interaction with the extraction power (p = 0.0036) [44]. Likewise, Huo et al. adopted the same strategy in their study on polyphenol extraction from Flammulina velutipes, retaining statistically non-significant factors for model integrity [21].
The quadratic terms of all the factors (X12, X22, X32, and X42) exhibited extremely high significance (p < 0.0001), indicating a clear nonlinear relationship between the response value and each factor, with a distinct optimum point within the investigated factor range [21]. These results demonstrate that in interpreting and optimizing the extraction process, it is necessary to fully consider not only the main effects but also the quadratic effects and significant interaction effects in order to achieve the best parameter combination. The order of the influence of the various variables on the CPAL polyphenol extraction yield was as follows: X12 > X32 > X4 > X42 > X22 > X1 > X3 > X1X2 > X2X3 > X1X3 > X1X4 > X3X4 > X2X4 > X2.
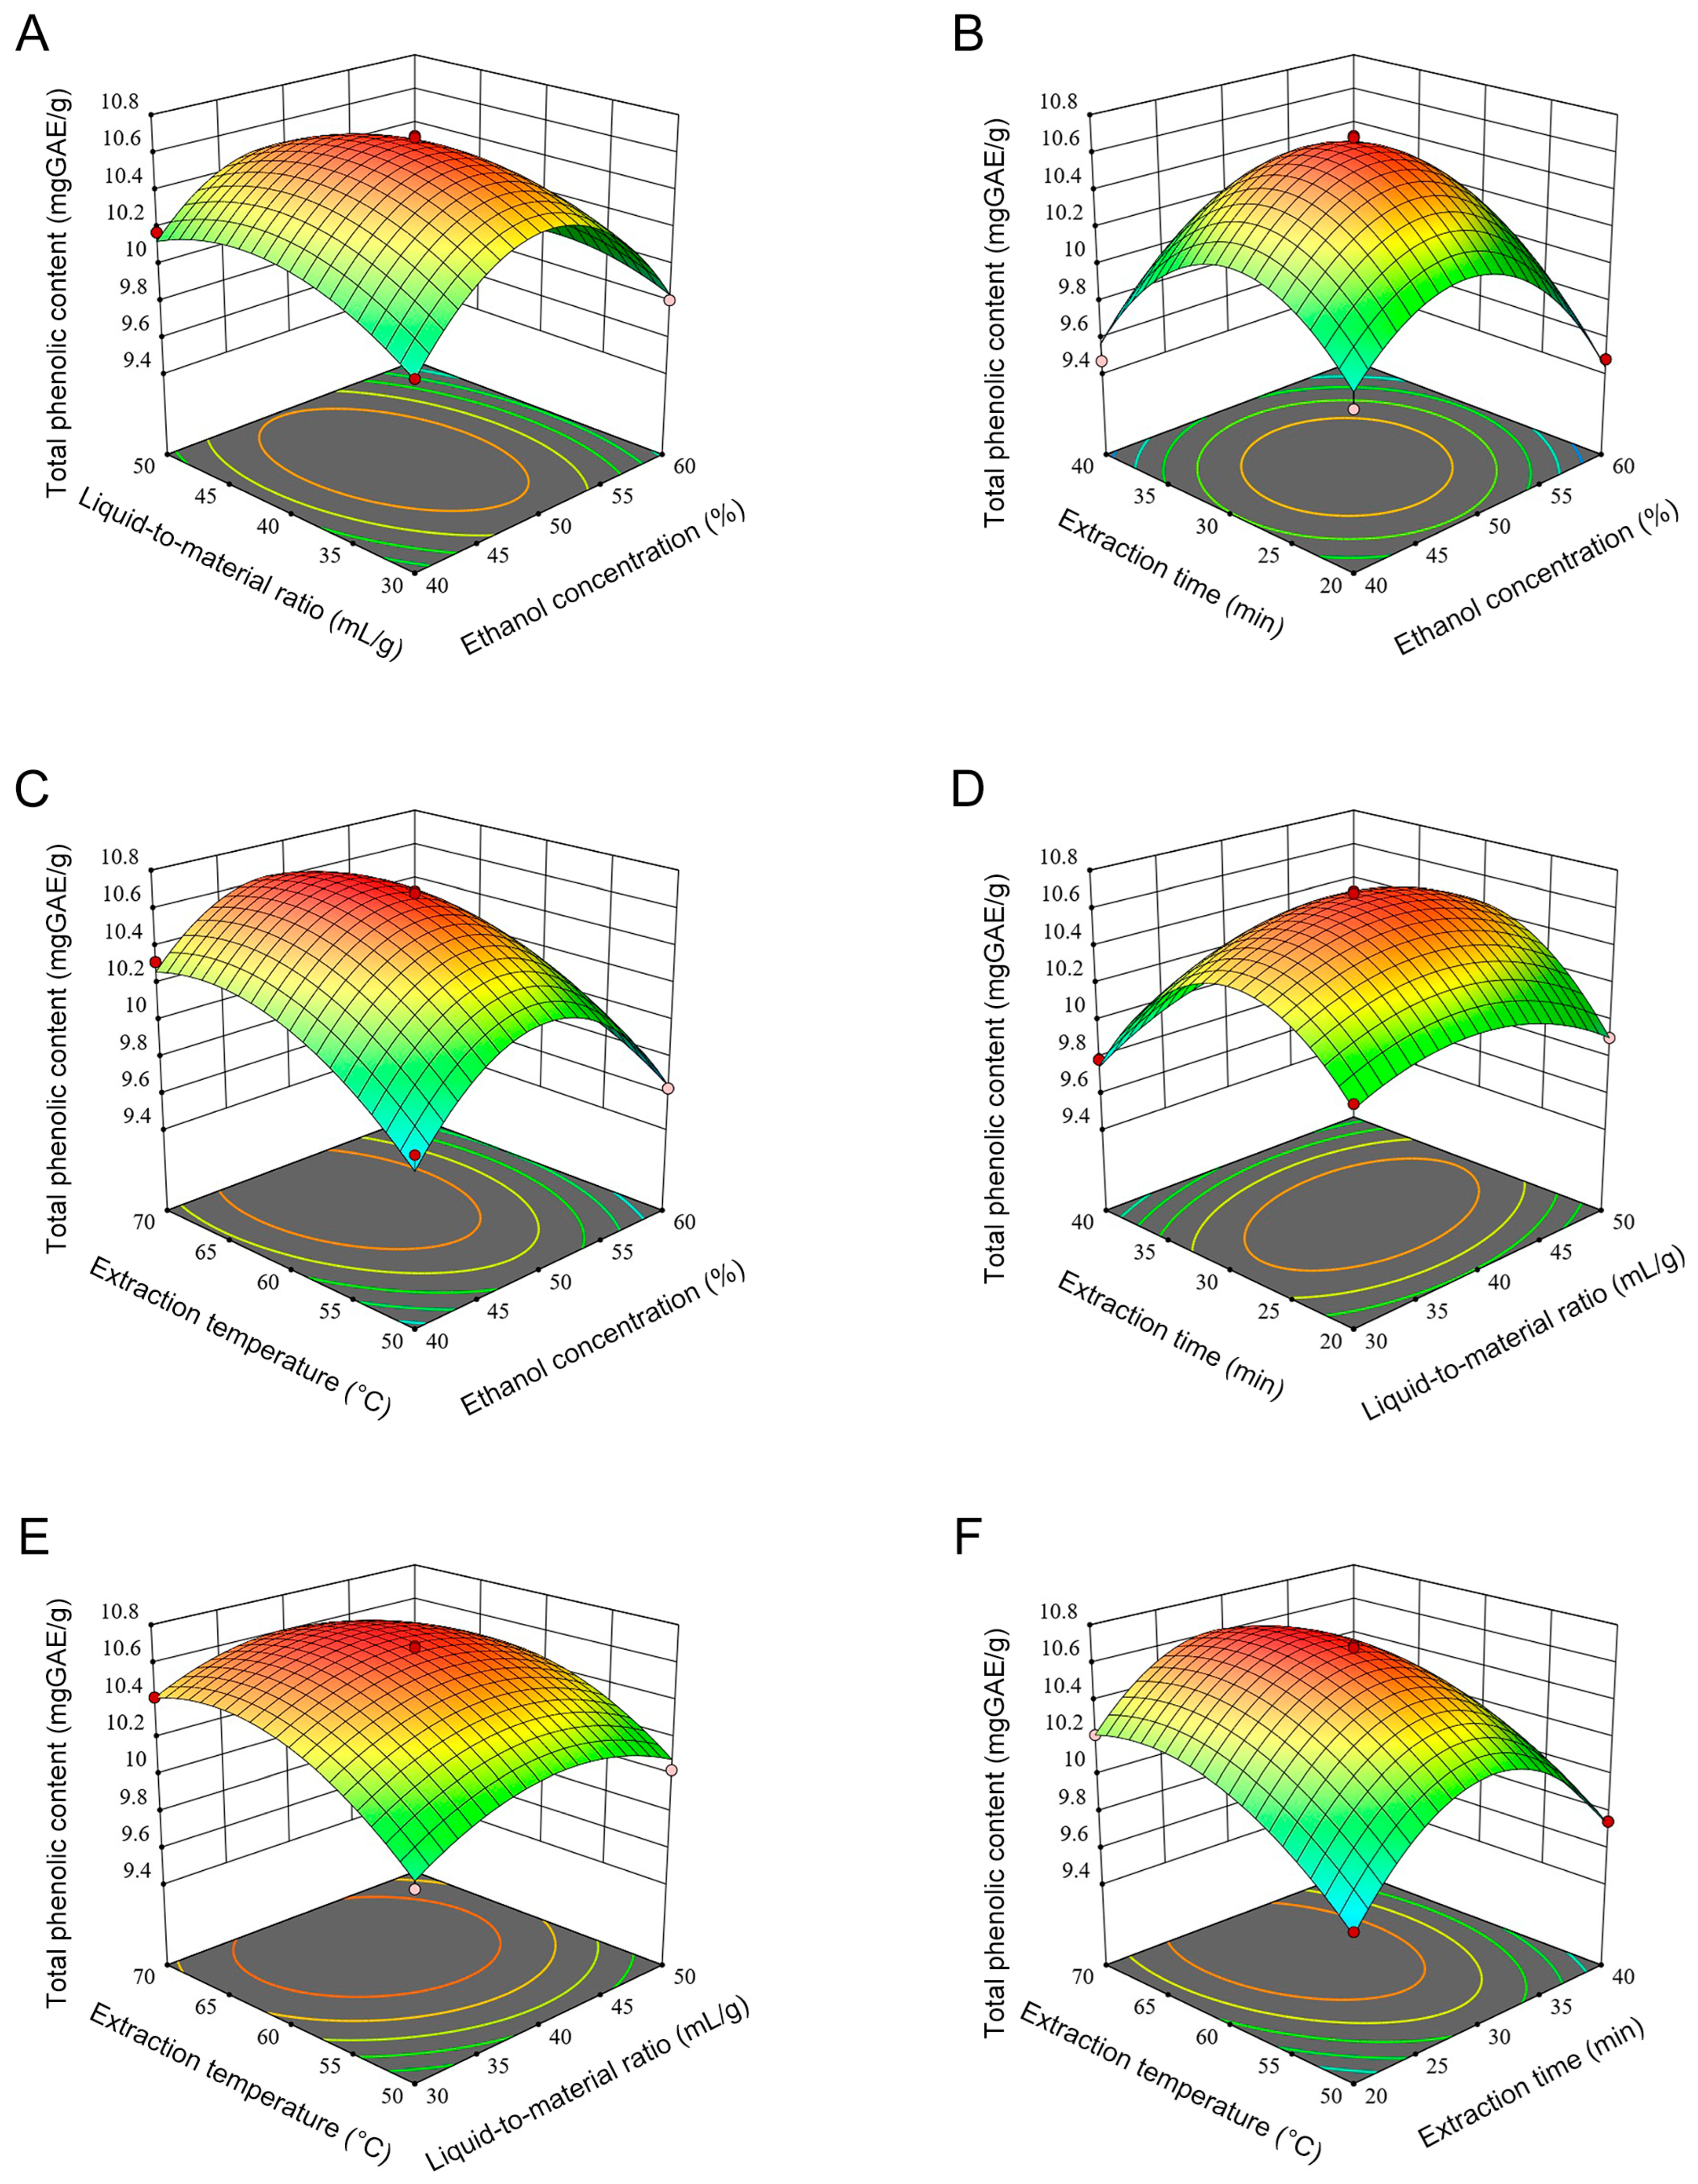
Based on the response surface plots in Figure 3A–F and Supplementary Figure S1, it can be analyzed that among the interactions of the four factors influencing the total phenolic content of CPAL, different factors exhibit varying degrees of influence and trends.
First, Figure 3A shows that when the extraction time (30 min) and temperature (60 °C) are fixed, the interaction between the liquid-to-material ratio and ethanol concentration results in a response surface where the phenolic content first increases and then decreases. Compared to the liquid-to-material ratio, the surface slope related to the ethanol concentration is significantly steeper, indicating that the ethanol concentration has a greater effect on phenolic extraction than the liquid-to-material ratio in this interaction.
Figure 3B demonstrates that when the liquid-to-material ratio (40 mL/g) and extraction temperature (60 °C) were fixed, the TPC initially increased and then decreased with variations in the extraction time and ethanol concentration, indicating the existence of an optimal balance between these two factors for maximizing the polyphenol extraction yield. It should be noted that excessively long extraction times or overly high ethanol concentrations lead to reduced extraction efficiency.
Figure 3C reflects the interactive effects of the ethanol concentration and extraction temperature on the TPC at a fixed liquid-to-material ratio (40 mL/g) and extraction time (30 min). The surface shows the highest extraction efficiency near 65 °C and an approximately 50% ethanol concentration. The prominent peak on the surface indicates a significant synergistic effect of the temperature and ethanol concentration on the total phenolic content (p < 0.05, Table 4).
From Figure 3D, which presents the interactions of the extraction time with the liquid-to-material ratio, there is a significant interaction between the two factors (p < 0.01). This suggests that when the level of one factor changes, the degree of influence of the other factor on the TPC alters significantly.
Figure 3E demonstrates the interaction between the extraction temperature and liquid-to-material ratio (at a 30 min extraction time and a 50% ethanol concentration). The response surface was relatively flat, and the interaction was statistically non-significant (p > 0.05, Table 4). The gentler slope along the liquid-to-material ratio axis compared to that along the extraction temperature axis indicates that the liquid-to-material ratio had a limited influence on the total phenolic content.
Figure 3F illustrates the interaction between the extraction time and temperature (at a 50% ethanol concentration and a 40 mL/g liquid-to-material ratio), with a clear peak on the surface, showing that a proper combination (approximately 30 min and 65 °C) can achieve the maximum total phenolic content. Excessive temperatures or prolonged extraction times will result in a decrease in the phenolic content.
In summary, direct observation of the response surfaces and Table 4 indicates that the ethanol concentration and extraction temperature have more significant effects on the phenolic content, with clear optimal ranges [21]. The extraction time has a moderate effect and interacts with the temperature and ethanol concentration to some extent. The liquid-to-material ratio was not significant as a main effect, but it exhibits significant interactions with the ethanol concentration and extraction time. Therefore, proper adjustment of the ethanol concentration and extraction temperature is the key to enhance the polyphenol extraction efficiency [20].

3.2.2. Verification Experiment

The predicted optimal parameters for the TPC were an ethanol concentration of 48.76%, a liquid-to-material ratio of 41.82 (mL/g), an extraction temperature of 63.98 °C, and an extraction time of 28.51 min. Based on actual conditions, the optimal parameters were finely adjusted to 49% ethanol, a ratio of 42 mL/g, a temperature of 64 °C, and a time of 29 min. The TPC was found to be 10.44 ± 0.16 mg GAE/g under these optimal conditions (n = 5 independent samples). The predicted value from the model was 10.70 ± 0.02 mg GAE/g. The difference between them was less than 3%. This extraction method significantly improved the extraction efficiency compared to those in previous reports (17.74 ± 0.15 mg GAE/100 g fresh weight, corresponding to approximately 63.08 mg GAE/100 g dry weight) [45].
Furthermore, a comparative analysis was conducted between UAE and conventional heat reflux extraction (CHRE) under the identical conditions (a 0.5000 g CPAL sample in a 50 mL tube with 21 mL of a 49% ethanol solution, extracted in a water bath shaker at 64 °C for 29 min; subsequent steps followed the UAE protocol). The results demonstrated a 19.04% increase in the polyphenol yield using the UAE method compared to CHRE (8.77 ± 0.28 mg GAE/g), indicating that ultrasonic treatment significantly enhances the extraction efficiency under the equivalent conditions. The UAE method will be compared with other conventional extraction methods in future studies.

3.3. Profiles of Polyphenolic Compounds from CPAL

The composition of CPAL was investigated through UPLC-Q Exactive HF Orbitrap-MS in both negative and positive ionization modes (please see the total ion chromatograms in Supplementary Figure S2). Sixty-three polyphenolic compounds were identified in CPAL, including twenty compounds that were reported in previous studies. They were apigenin, cosmosiin, cynaroside, luteolin and its 4′-O-glucoside derivative, nobiletin, astragalin, isoquercitrin, hyperoside, quercetin, rutin, kaempferol, vanillic acid, syringic acid, (2E)-3-(4-hydroxyphenyl)-N-[2-(4-hydroxyphenyl) ethyl] acrylamide, cryptochlorogenic acid, chlorogenic acid, ferulic acid, caffeic acid, and esculetin. Significantly, the remaining 43 compounds (marked with superscript b in Table 5), including kaempferol-7-O-β-D-glucopyranoside and diosmetin, represent novel findings, as they were characterized in CPAL for the first time. As shown in Table 5, the sixty-three polyphenolic constituents are classified as follows: flavonols (sixteen), flavonoids (nineteen), bioflavonoids (two), isoflavones (one), phenolic acids (nineteen), and others (six).
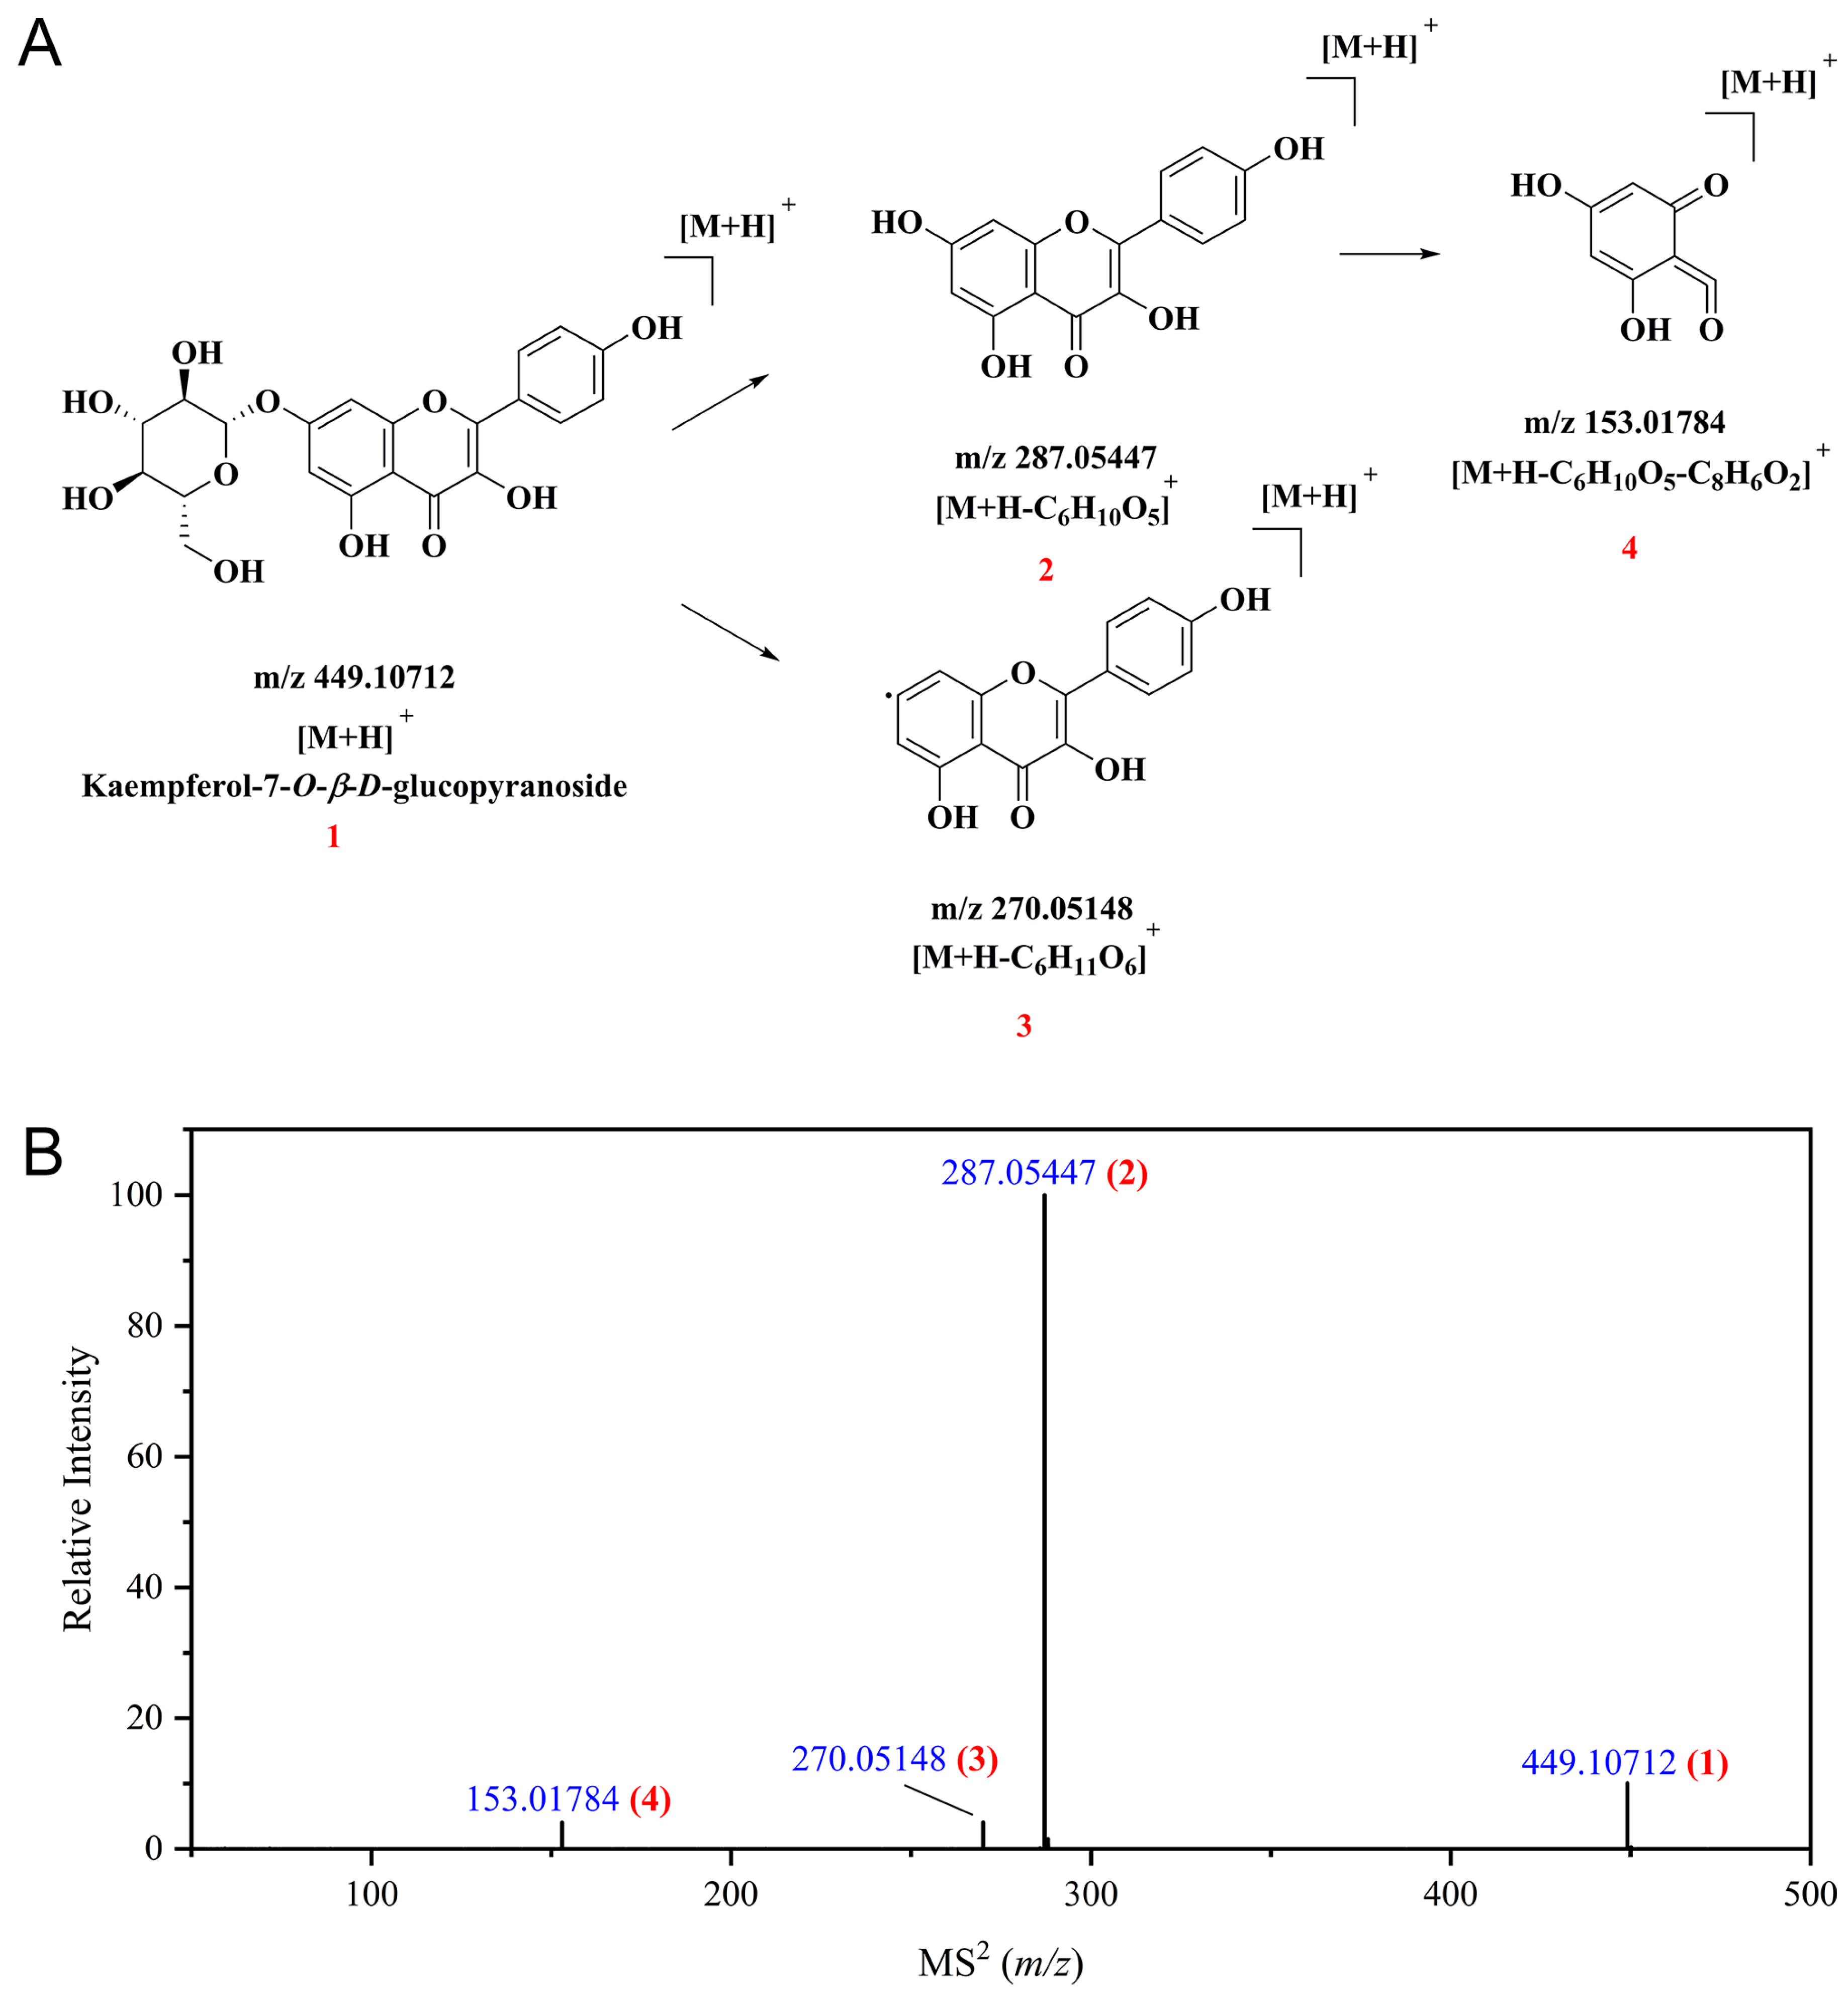
Kaempferol-7-O-β-D-glucopyranoside belongs to the flavonoid family, which features a 2-phenylchromone backbone with a C6-C3-C6 arrangement. A defining trait of this molecule is the glycosidic bond formed between glucose and the hydroxyl group located at the C7 position of kaempferol. Among the typical fragmentation mechanisms observed in flavonoids, the retro Diels–Alder (RDA) reaction is particularly significant. When analyzed in the positive ion mode, the precursor ion [M+H]+ was recorded at m/z 449.10712 (1). Subsequent neutral losses involving the glucose unit yielded product ions at m/z 287.05447 (2, [M+H−C6H10O5]+) and m/z 270.05148 (3, [M+H−C6H11O5]+). Ion 2 then underwent RDA cleavage, leading to the formation of a diagnostic fragment at m/z 153.01784 (4, [M+H−C6H10O5−C8H6O2]+). The corresponding MS2 spectrum and a proposed mechanism for this fragmentation are illustrated in Figure 4.
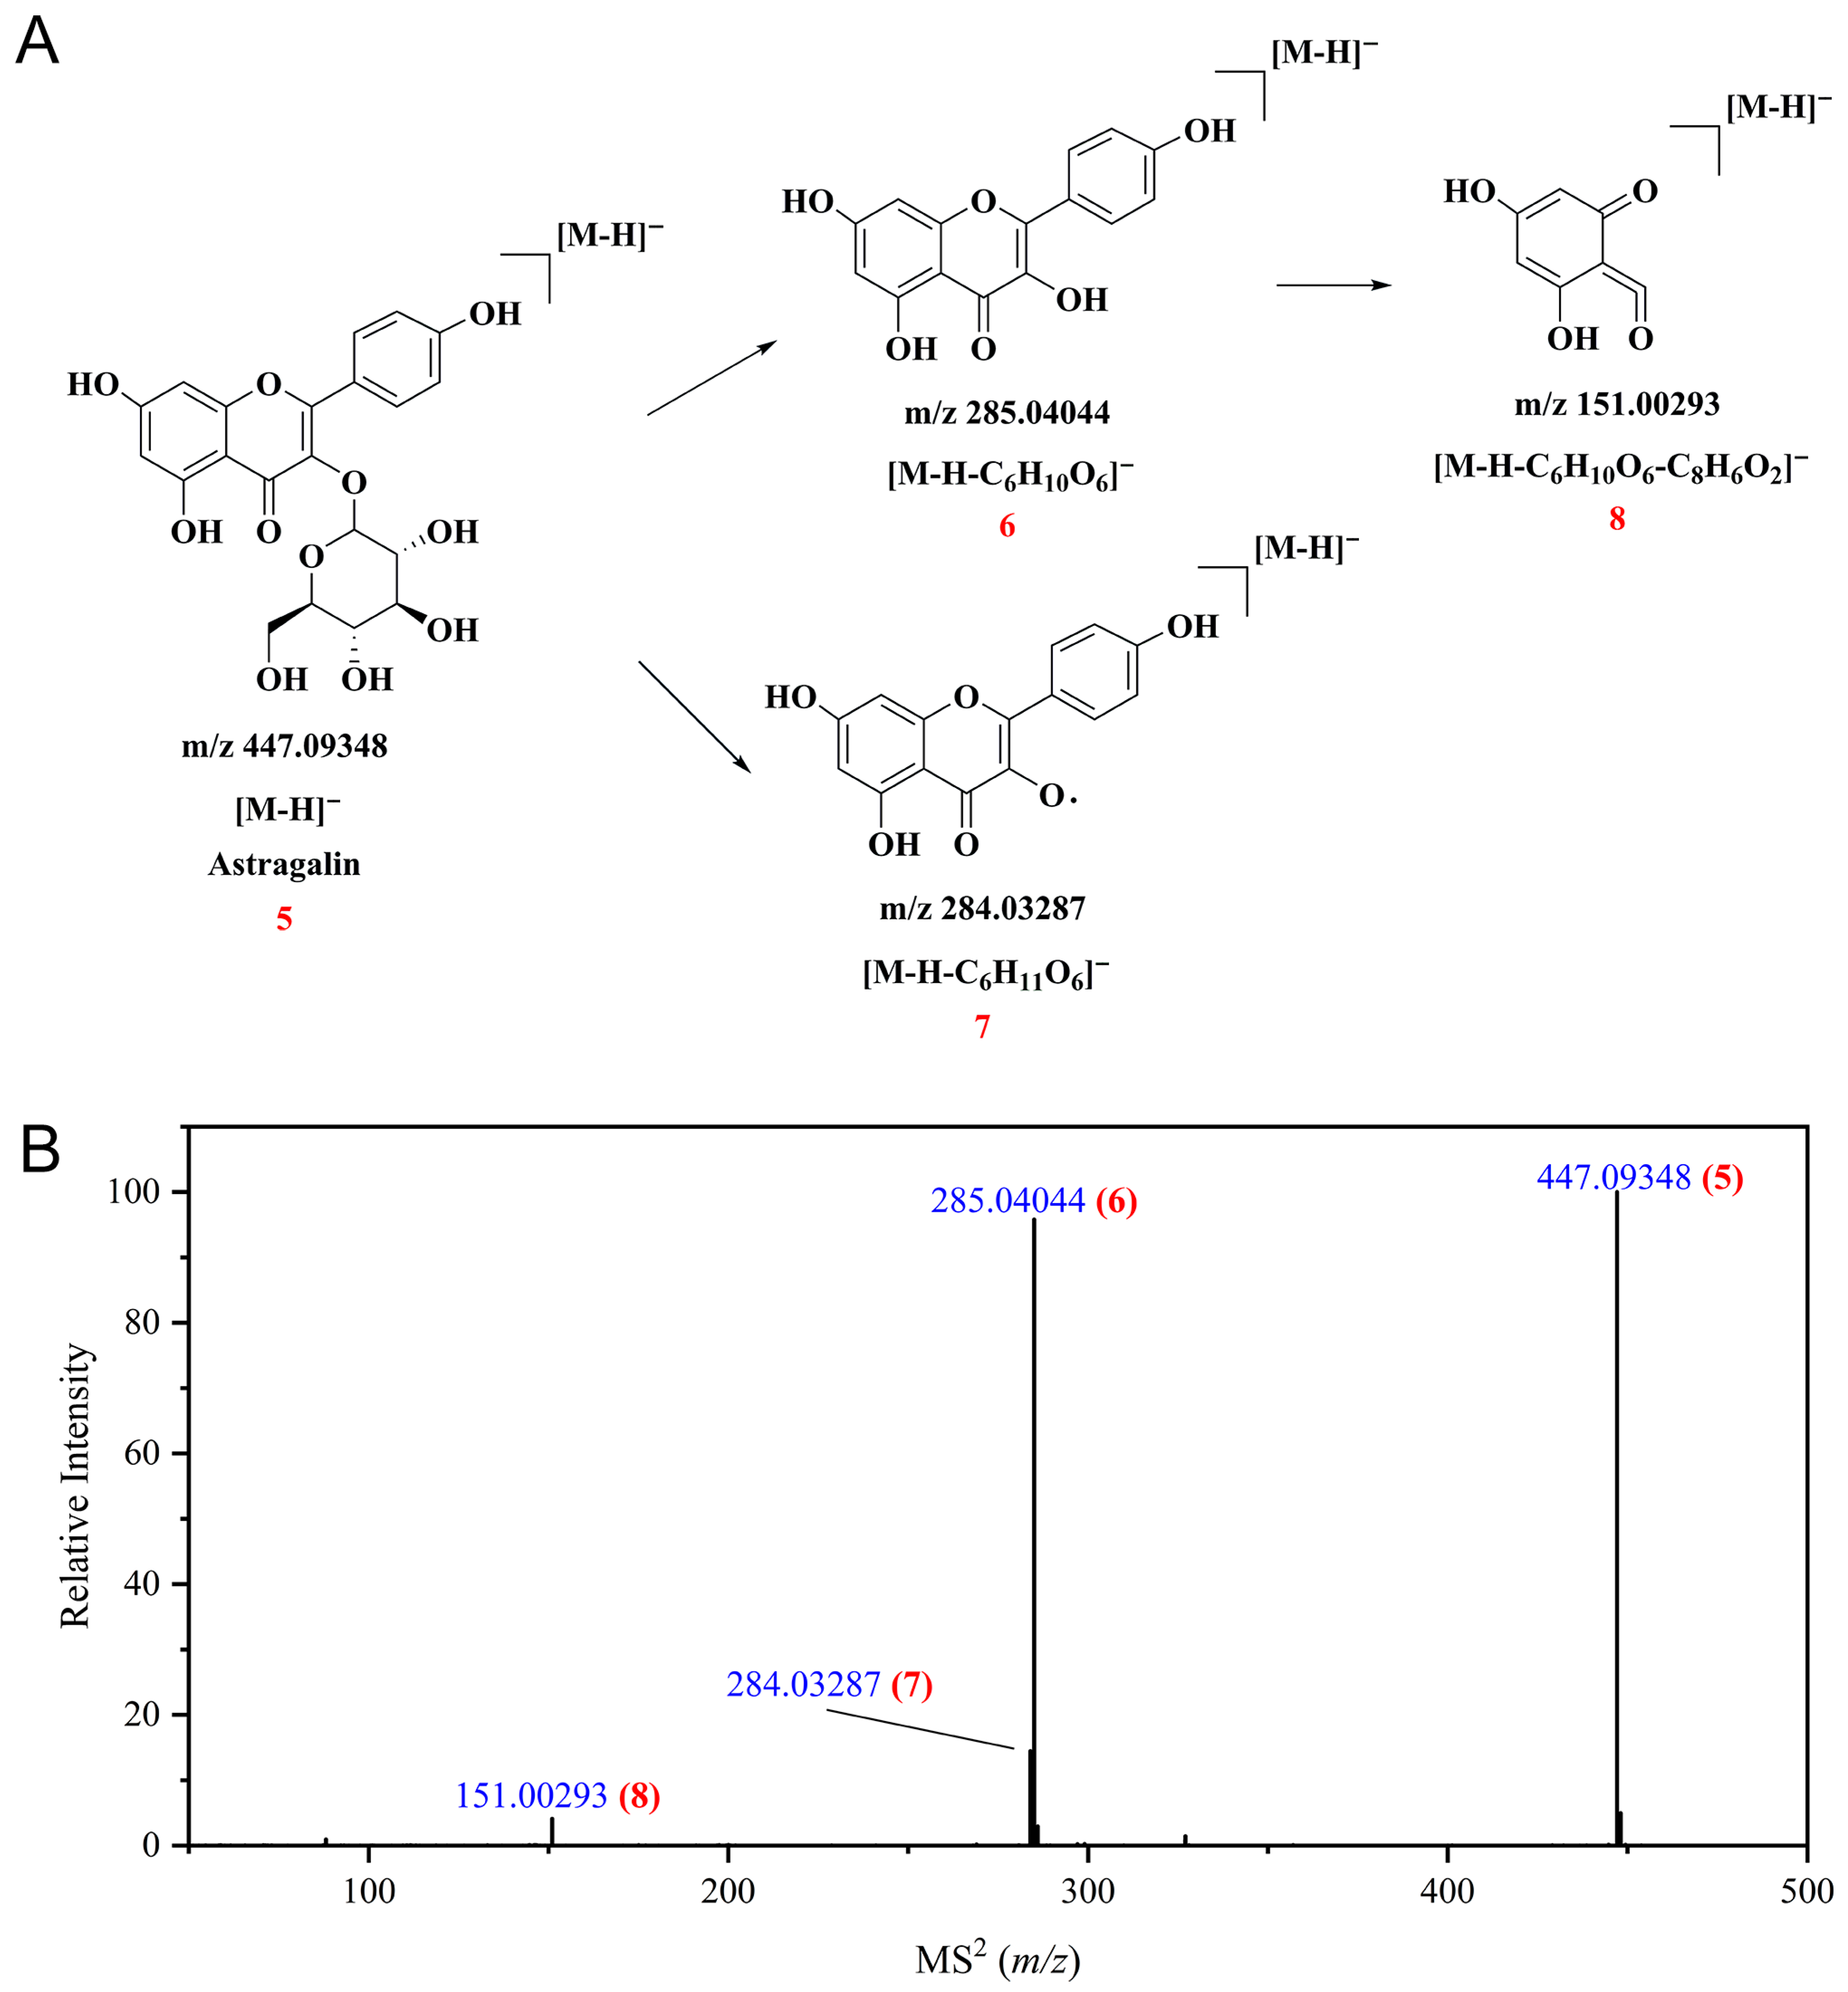
Astragalin, another flavonoid compound, shares a comparable fragmentation pattern with kaempferol-7-O-β-D-glucopyranoside. Its distinctive structural attribute is the substitution at the C-3 hydroxyl group of the kaempferol aglycone with a glucose unit. When analyzed in the negative ion mode, the precursor ion [M−H] of astragalin was observed at m/z 447.09348 (5). Following the elimination of the glucosyl unit, fragment ions appeared at m/z 285.04044 (6, [M−H−C6H10O6]) and m/z 284.03287 (7, [M−H−C6H11O6]). Fragment ion 6 subsequently experiences an RDA reaction, yielding a signature product ion at m/z 151.00293 (4, [M−H−C6H10O6−C8H6O2]). The associated MS2 spectrum along with the suggested fragmentation route are presented in Figure 5.
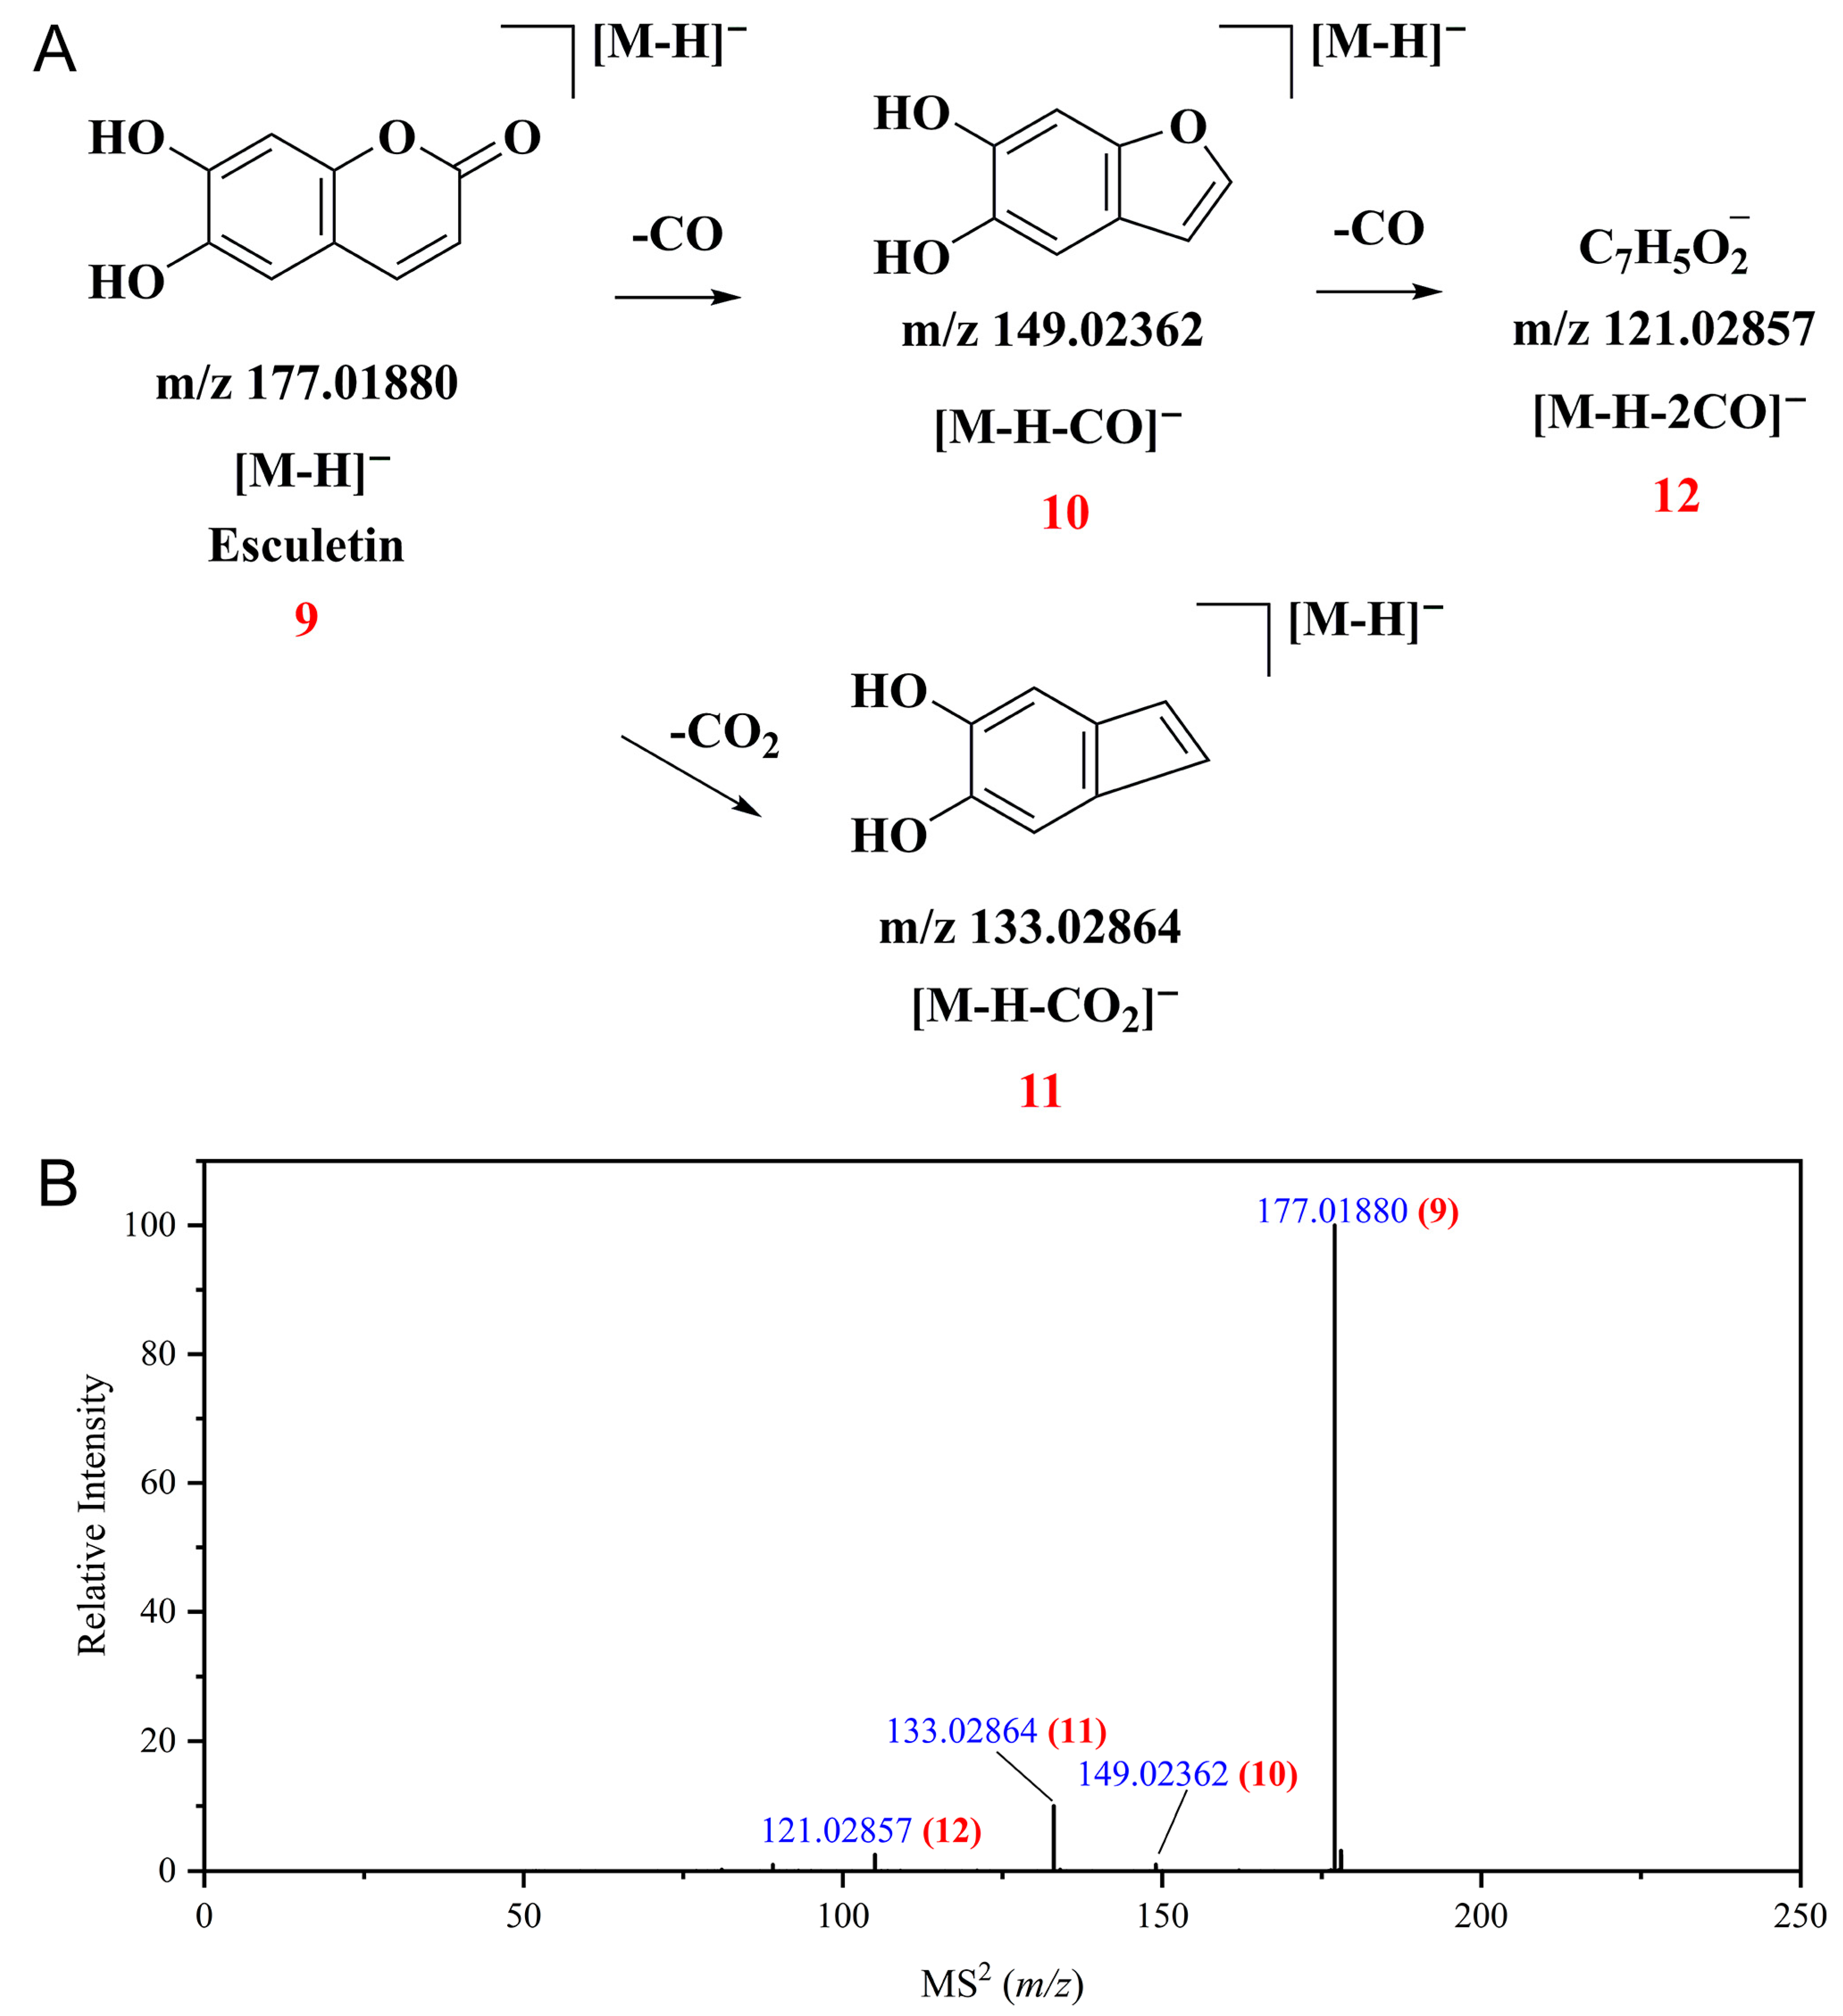
Esculetin is a type of coumarin, and its fragmentation pattern typically involves the loss of CO or CO2 molecules from the parent ion [50]. Under negative-ion-mode analysis, the precursor ion ([M−H]) of esculetin was observed at m/z 177.01880 (9). Subsequent elimination of a CO unit resulted in the formation of fragment ions at m/z 149.02362 (10, [M−H−CO]) and m/z 121.02857 (12, [M−H−2CO]). Additionally, the loss of a CO2 molecule yielded a diagnostic fragment at m/z 133.02864 (11, [M−H−CO2]). Figure 6 shows the corresponding MS2 spectrum and the fragmentation mechanism.
In non-targeted profiling, relative abundance is frequently employed to provide a preliminary characterization of the comparative levels of various compounds within samples [51,52]. As illustrated in Figure 7A, the polyphenolic composition in CPAL is mainly composed of flavonols, representing 67.543% of the total, with flavones (17.252%) and phenolic acids (9.354%) being the next most abundant classes; the remainder consists of minor constituents. A more detailed subclass distribution analysis (Figure 7B) indicates that kaempferol derivatives are the most prevalent, followed by those of quercetin and hydroxycinnamic acids. Figure 7C displays the seven most abundant polyphenols based on relative abundance, namely, kaempferol, astragalin, esculetin, cryptochlorogenic acid, diosmetin, apigenin, and kaempferol-7-O-β-D-glucopyranoside.
It should be specially noted that the relative abundance data used in this study are essentially based on peak areas from mass spectrum. Although this approach cannot achieve the accuracy of absolute quantification using standards, it can effectively distinguish the relative content differences of various compounds to provide a preliminary and overall understanding of the composition ratios of polyphenols in CPAL.
Furthermore, by comparing with the relevant literature, the results of this study show a high degree of consistency with previously reported findings. For example, Liu et al. reported that CPAL contains major polyphenolic components, such as quercetin, kaempferol, and luteolin [2]. Wang et al. also successfully isolated kaempferol and quercetin from Physalis alkekengi L., which further supports the reliability and representativeness of the compounds identified in this study [46].
In summary, although the current study uses relative abundance data, this approach has provided valuable insights into the distribution of polyphenol categories and the predominant components in CPAL. In the future, we plan to perform accurate absolute quantification using authentic standards to elucidate more deeply the precise content and biological activities of each polyphenol, thereby providing stronger data support for the development and utilization of CPAL.

3.4. Antioxidant Activities

The DPPH assay serves as a widely employed technique for evaluating the radical-scavenging potential inherent in botanical extracts [53]. As depicted in Figure 8A, both CPAL and ascorbic acid demonstrated concentration-dependent increases in DPPH radical inhibition. Specifically, across tested concentrations (5.00–250.00 μg/mL for CPAL; 2.51–40.16 μg/mL for ascorbic acid), inhibition rates progressed from 9.53 ± 0.61% to 88.31 ± 0.56% for CPAL and from 10.76 ± 0.99% to 95.89 ± 0.44% for the reference compound. Calculated IC50 values were 68.77 μg/mL for CPAL and 10.12 μg/mL for ascorbic acid.
ABTS-radical-cation-scavenging activity provides insight into a substance’s hydrogen-donating and radical-chain-breaking capabilities [54,55]. The results for CPAL using this method are presented in Figure 8B. CPAL exhibited a dose-responsive capacity to quench ABTS radicals. Within the concentration range of 1.00–50.00 µg/mL, the scavenging effect rose from 11.01 ± 0.43% to 94.86 ± 3.52%. The IC50 value determined for CPAL was 12.76 μg/mL, exceeding that of ascorbic acid (4.07 μg/mL), indicating lower potency.
The FRAP assay quantifies an antioxidant’s ability to donate electrons, reducing ferric ions (Fe3+) to ferrous ions (Fe2+). This reduction yields ferrocyanide. The subsequent addition of ferric chloride facilitates the reaction between Fe2+ and ferricyanide, generating the Prussian blue complex. Consequently, absorbance measured at 700 nm correlates directly with reducing capacity. Figure 8C illustrates CPAL’s FRAP activity. Absorbance values at concentrations between 28.13 and 168.75 μg/mL increased from 0.185 ± 0.001 to 0.782 ± 0.012. Corresponding IC50 values were 101.24 μg/mL for CPAL and 9.73 μg/mL for ascorbic acid.
In summary, the CPAL plant extract exhibits clear, concentration-dependent in vitro antioxidant activity, effectively scavenging DPPH and ABTS free radicals and demonstrating a certain degree of FRAP-reducing power. Although its overall potency is lower than that of the standard antioxidant (ascorbic acid), it is noteworthy that CPAL showed relatively strong activity in the ABTS-radical-scavenging assay (IC50 = 12.76 μg/mL), consistent with the findings reported by Liu et al. [1].
Furthermore, Gao et al. evaluated the antioxidant activities of polysaccharides from Physalis pubescens L. fruits, reporting DPPH- and ABTS-radical-scavenging capacities of 1.2 mg/mL and 0.8 mg/mL, respectively, which are significantly lower than the antioxidant activities of CPAL polyphenols observed in this study [43]. This comparison further highlights the superior antioxidant efficacies of CPAL polyphenols, strengthening the credibility of the current findings. Popova et al. compared the antioxidant activities of polyphenol extracts from Physalis alkekengi L. fruits sourced from different regions and found that samples from Northeastern Bulgaria exhibited higher antioxidant activities than those from Central Southern Bulgaria [45], indicating that geographical origin may influence the antioxidant properties of polyphenols. Wang et al. reported that adding the total flavonoids from the calyx of Physalis alkekengi L. to chitosan yielded a PCTF–CS composite film with higher mechanical and barrier properties, as well as improved antioxidant and antimicrobial activities, making it a promising packaging material for food preservation [56]. The potential applications of CPAL in functional foods and the food industry will be further explored.
In summary, this study provides a solid experimental basis for the potential application of CPAL as a natural antioxidant. Future research should further evaluate its antioxidant effects in more complex systems, such as cellular and in vivo models, as well as explore its potential health-promoting benefits.

3.5. The Changes in the Polyphenol Content and Antioxidant Capacity of CPAL During Drying

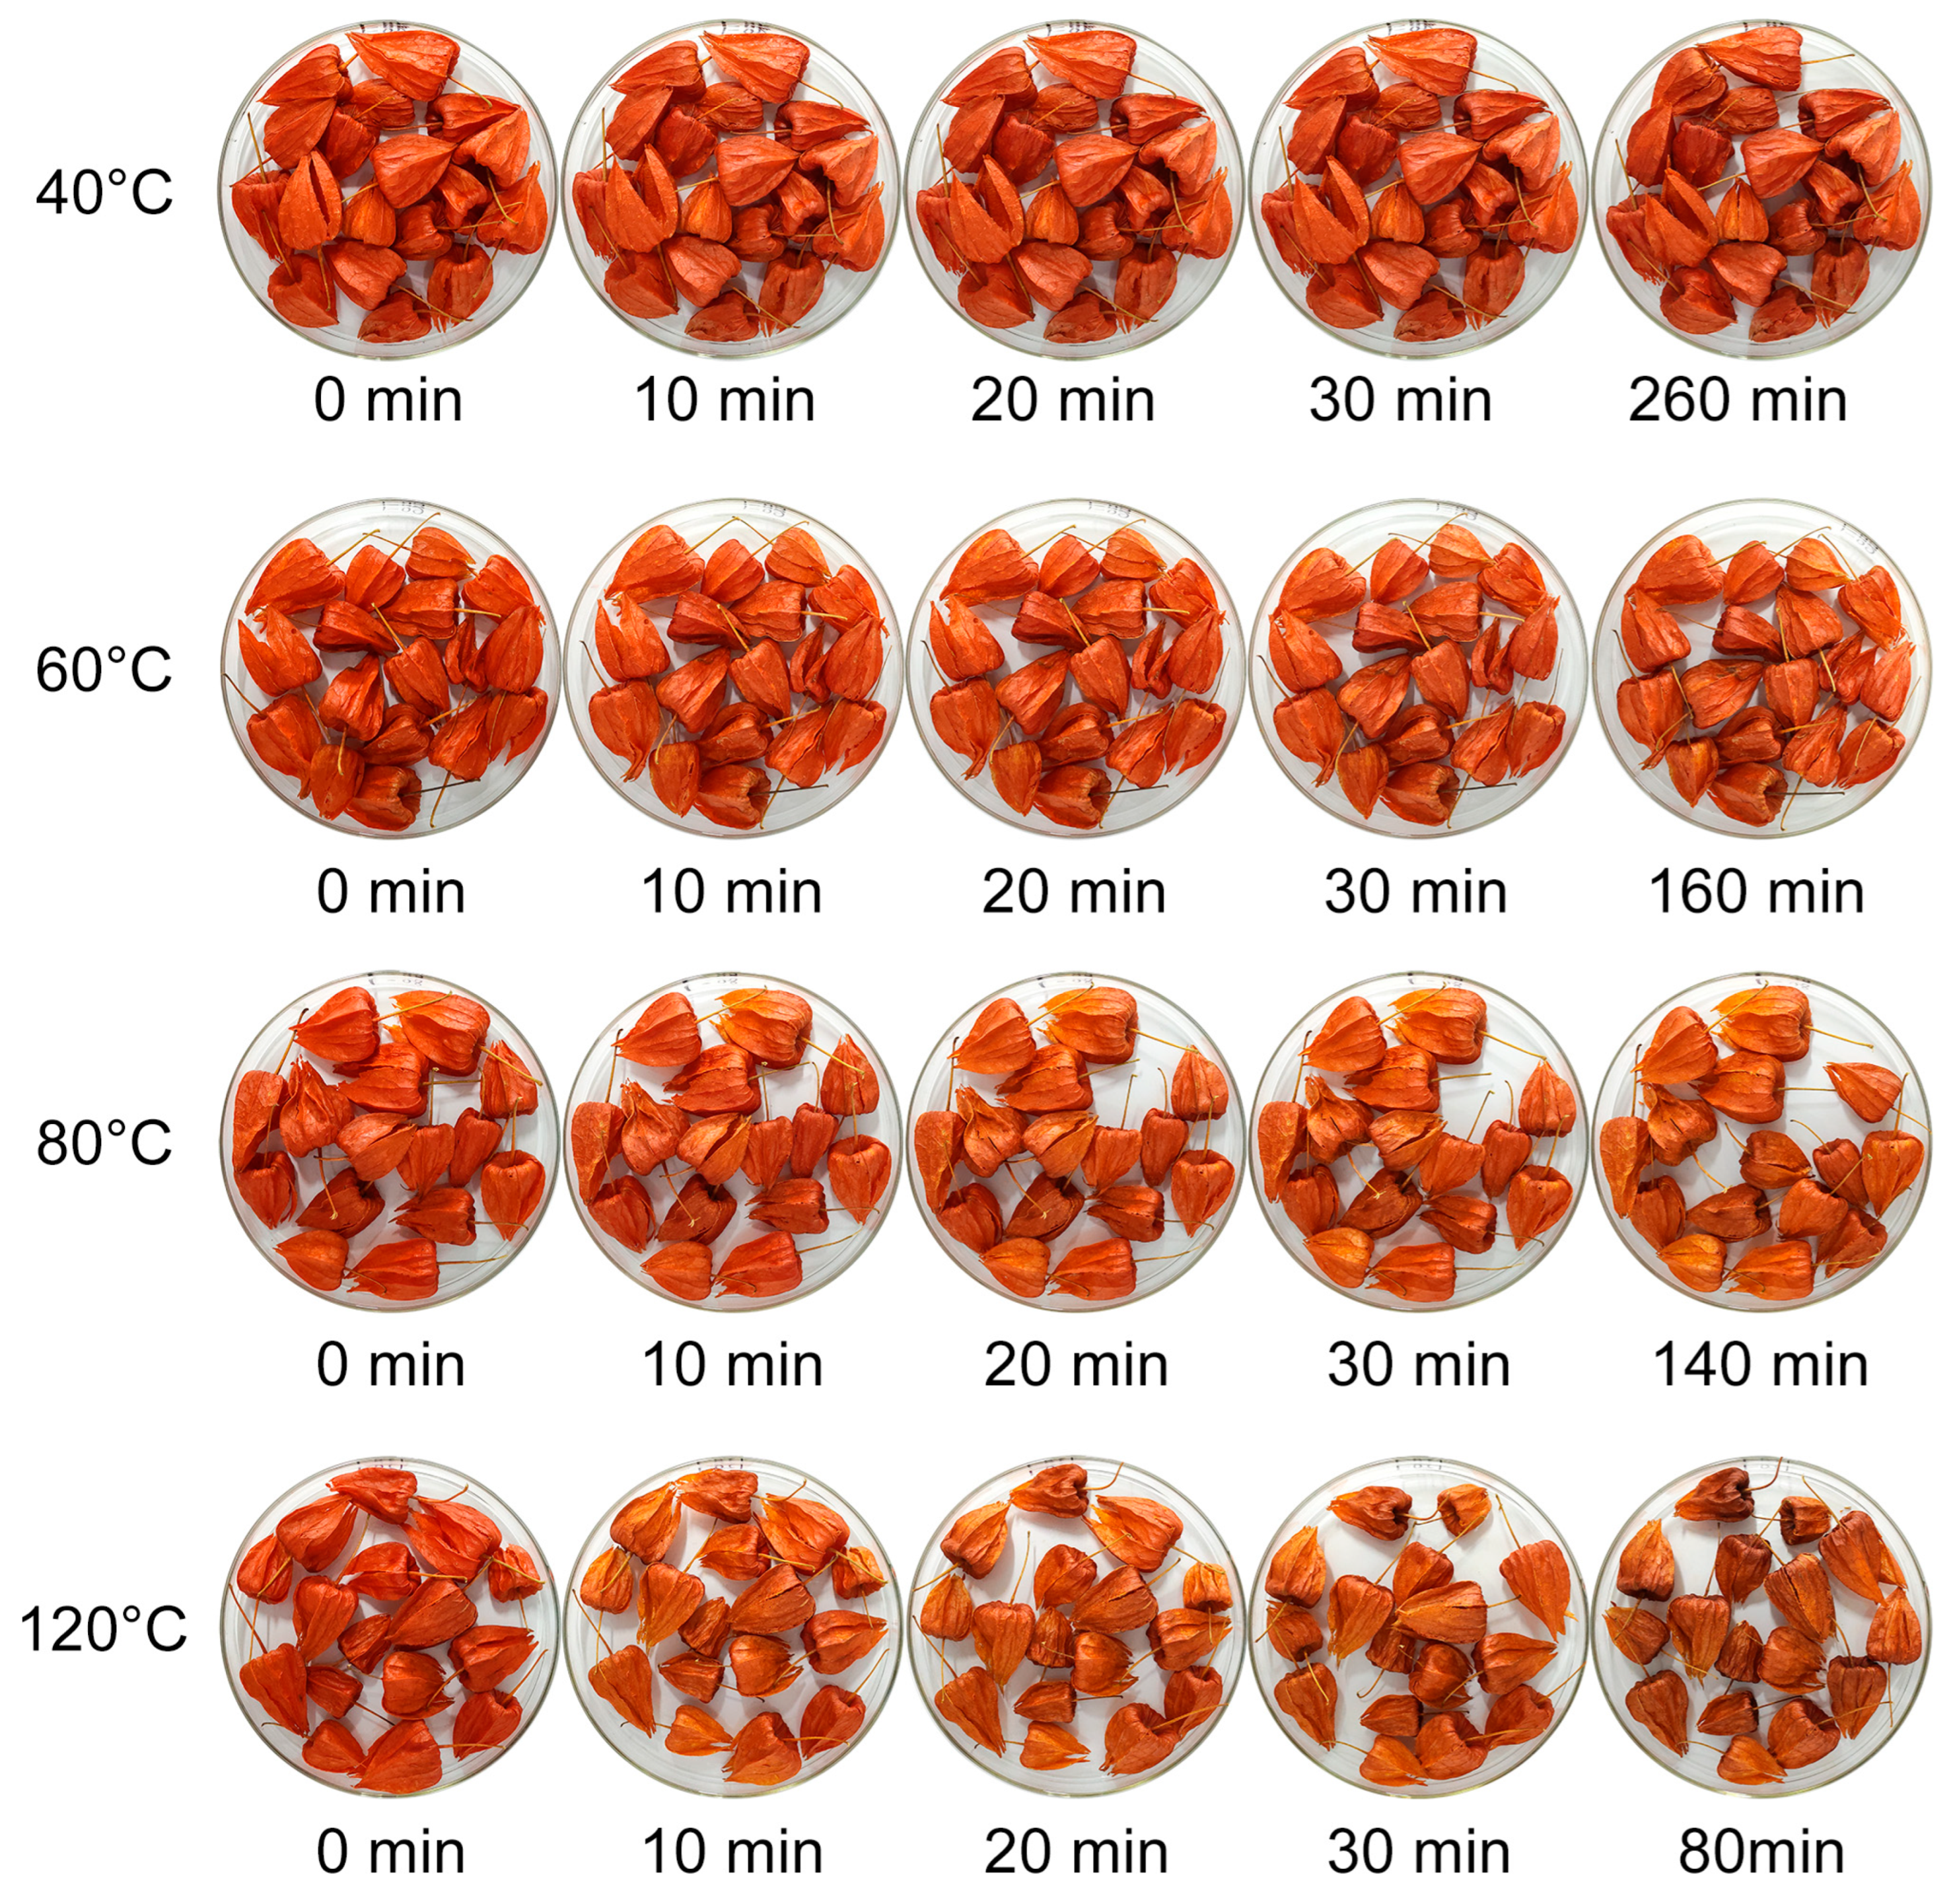
CPAL exhibits significant changes in appearance during the drying process, which are notably influenced by the drying temperature. As shown in Figure 9, at 40 °C, the drying process is relatively slow, lasting about 260 min. During the first 0 to 30 min, there is little change in color, with only slight wrinkling observed on the surface; at the end of drying, the product displays a deep reddish-brown color, with overall moderate shrinkage of the calyx. When the temperature increases to 60 °C, the drying time shortens to approximately 160 min, and the wrinkling occurs more quickly. After 30 min, obvious folds appear on the calyx; the final product is lighter in color compared to that dried at 40 °C, with noticeable fading and increased shrinkage. At 80 °C, the drying process accelerates further, reducing the drying time to about 140 min. The calyxes wrinkle and fade rapidly within 20 to 30 min; the final product is a light orange color, showing more pronounced shrinkage than at 60 °C. At a high temperature of 120 °C, drying efficiency reaches its peak, with the drying time shortened to around 80 min. The calyx undergoes severe wrinkling and fades within 10 to 20 min; the final product is extremely shriveled and exhibits browning, with the calyx color turning dark brown to nearly black. The texture becomes brittle and fragile, while both the degrees of shrinkage and color intensity reach their maximum levels. In summary, as the drying temperature increases, the drying time is significantly shortened, the final product experiences more pronounced shrinkage, and the color undergoes noticeable fading. At higher temperatures, browning occurs, causing the color to gradually deepen to dark brown or nearly black.
As shown in Figure 10, during the drying process, the TPC of CPAL samples exhibits a significant increase with rising temperature. Specifically, the TPC is 17.68 ± 0.08 mg GAE/g at 40 °C and increases to 22.17 ± 1.62 mg GAE/g at 120 °C, representing a 25.40% increase. Correspondingly, the DPPH- and ABTS-radical-scavenging rates also rise from 63.55% and 51.13% to 67.77% and 59.34%, with increases of 6.64% and 16.16%, respectively. Similarly, the FRAP values show an overall upward trend, increasing from 0.558 at 40 °C to 0.668 at 120 °C, with a growth of 19.71%. Taken together, these data indicate that as the drying temperature increases, both the total phenolic contents and antioxidant activities of the samples are enhanced. This phenomenon contradicts the usual expectation that high temperatures lead to the degradation of heat-sensitive components, and its underlying mechanisms may be attributed to several factors.
The effect of increasing the temperature on the phenolic content is complex and involves multiple mechanisms. On the one hand, thermal effects can effectively disrupt plant cell structures, promoting the release of phenolics originally bound to cell-wall components and converting them to more readily extractable free forms (thermal-induced release). On the other hand, thermal effects may degrade some heat-labile free phenolic compounds (thermal degradation) [57]. The TPC measured is the net effect of these two processes. According to the results shown in Figure 10, we speculate that the amount of bound phenolics released by elevated temperature exceeded the losses from the degradation of free phenolics. In future work, the specific mechanisms underlying this issue will be investigated. Additionally, high temperatures may induce non-enzymatic browning reactions (such as the Maillard reaction), producing reductive byproducts that may interfere with TPC measurements and antioxidant activity evaluations, leading to inflated data [58,59,60]. Future studies will employ high-performance liquid chromatography or liquid chromatography–mass spectrometry to quantitatively analyze characteristic polyphenols (e.g., kaempferol) in the test samples (CPAL), thereby accurately determining the true polyphenol content and eliminating interference from Maillard reaction products.
In summary, considering the drying time, the appearance quality of CPAL (excessive temperatures may cause charring), and consumer acceptance, this study recommends 60 °C as the optimal drying temperature among these four temperatures. Future research will further refine the understanding of temperature effects and explore the impacts of other drying parameters on CPAL quality.

4. Conclusions

This study utilized RSM to optimize the UAE process for the efficient extraction of polyphenolic compounds from CPAL. A comprehensive and systematic characterization of the polyphenols in CPAL was performed using UPLC-HRMS. Additionally, this study investigated the changes in the total phenolic content (TPC) and antioxidant activity during drying treatments at different temperatures. RSM was used to determine the optimal extraction conditions for CPAL: an ethanol concentration of 49%, a liquid-to-material ratio of 42 mL/g, an extraction temperature of 64 °C, and an extraction time of 29 min. Under these optimized conditions, the polyphenol yield increased by 19.04% using the UAE method (10.44 ± 0.16 mg GAE/g) compared to the conventional heat reflux extraction method (8.77 ± 0.28 mg GAE/g).
Sixty-three kinds of polyphenolics were identified using UPLC-HRMS, which significantly expanded the known chemical profile of CPAL. They are primarily derivatives of kaempferol, quercetin, and hydroxycinnamic acid; to the best of our knowledge, 43 of these compounds were reported in CPAL for the first time, including kaempferol-7-O-β-D-glucopyranoside, diosmetin, and so on.
In vitro antioxidant evaluations demonstrated that CPALs have potent radical-scavenging capacities, with IC50 values for DPPH, ABTS, and FRAP being 68.77, 12.76, and 101.24 μg/mL, respectively. Furthermore, increasing the drying temperature significantly increased both the polyphenol content and antioxidant performance. Specifically, the total phenolic content increased by 25.4%, while the DPPH-radical-scavenging activity, ABTS activity, and FRAP activity increased by 6.64%, 16.16%, and 19.71%, respectively. These enhancements may be attributed to the activation of plant defense systems under environmental stress and the release of bound phenolic forms. Further mechanistic studies are warranted to elucidate these processes. This study provides a theoretical foundation and practical support for the further development of natural products. The potential applications of CPAL in functional foods and the food industry will be further explored.

Supplementary Materials

The following supporting information can be downloaded at: https://www.mdpi.com/article/10.3390/pr13092793/s1, Figure S1: A family of surfaces from Figure 3C illustrate the interaction between extraction temperature and ethanol concentration. (A) Liquid-to-material ratio and extraction time were fixed at 40 mL/g and 20 min; (B) Liquid-to-material ratio and extraction time were fixed at 50 mL/g and 30 min; (C) Liquid-to-material ratio and extraction time were fixed at 50 mL/g and 40 min; (D) Liquid-to-material ratio and extraction time were fixed at 30 mL/g and 30 min; (E) Liquid-to-material ratio and extraction time were fixed at 40 mL/g and 30 min; (F) Liquid-to-material ratio and extraction time were fixed at 50 mL/g and 30 min; Figure S2: Total ion current (TIC) chromatogram of the identified polyphenolic compounds in CPAL (A: negative mode; B: positive mode).

Author Contributions

Writing—original draft, H.Y. and Z.W.; data curation, X.X. and Y.H.; writing—review and editing, J.W.; visualization, H.G. and X.C. All authors have read and agreed to the published version of the manuscript.

Funding

This work is funded by the National Natural Science Foundation of China (31401553), Major Natural Science Research Projects for Higher Education Institutions in Jiangsu Province (19KJA480002), the Natural Science Foundation of the Jiangsu Higher Education Institutions (21KJA550001 and 22KJA240003), and the Natural Science Foundation of Jiangsu Province (BK20211051).

Data Availability Statement

The data are contained within the article and Supplementary Materials.

Acknowledgments

The authors would like to thank all those who contributed directly or indirectly to this project.

Conflicts of Interest

The authors declare no conflicts of interest.

Abbreviations

The following abbreviations are used in this manuscript:
CPALCalyx of Physalis alkekengi L.
DPPH2,2-Diphenyl-1-picrylhydrazyl
ABTS2,2′-Azino-bis (3-ethylbenzothiazoline-6-sulfonic acid)
FRAPFerric-reducing antioxidant power
TPCTotal phenolic content
UPLCUltra-performance liquid chromatography

References

  1. Liu, X.; Bian, J.; Li, D.; Liu, C.; Xu, S.; Zhang, G.; Zhang, L.; Gao, P. Structural features, antioxidant and acetylcholinesterase inhibitory activities of polysaccharides from stem of Physalis alkekengi L. Ind. Crops Prod. 2019, 129, 654–661. [Google Scholar] [CrossRef]
  2. Liu, Y.; Wang, X.; Li, C.; Yu, D.; Tian, B.; Li, W.; Sun, Z. Research progress on the chemical components and pharmacological effects of Physalis alkekengi L. var. franchetii (Mast.) Makino. Heliyon 2023, 9, e20030. [Google Scholar] [CrossRef]
  3. Cao, C.; Zhu, L.; Chen, Y.; Wang, C.-H.; ShenTu, J.-z.; Zheng, Y.-L. Physalin B induces G2/M cell cycle arrest and apoptosis in A549 human non-small-cell lung cancer cells by altering mitochondrial function. Anticancer Drugs 2019, 30, 128–137. [Google Scholar] [CrossRef]
  4. Popova, V.; Petkova, Z.; Mazova, N.; Ivanova, T.; Petkova, N.; Stoyanova, M.; Stoyanova, A.; Ercisli, S.; Okcu, Z.; Skrovankova, S.; et al. Chemical composition assessment of structural parts (seeds, peel, pulp) of Physalis alkekengi L. fruits. Molecules 2022, 27, 5787. [Google Scholar] [CrossRef]
  5. Teng, Y.; Yuan, Q.; Wu, Y.; Wu, S.; Su, J.; Zhang, P.; Zhang, Y. Research on the chemical constituents against Alzheimer’s disease of the fruits of Physalis alkekengi L. var. franchetii (Mast.) Makino. Chem. Biodivers. 2023, 20, e202301075. [Google Scholar] [CrossRef]
  6. Yang, J.; Sun, Y.; Cao, F.; Yang, B.; Kuang, H. Natural products from Physalis alkekengi L. var. franchetii (Mast.) Makino: A review on their structural analysis, quality control, pharmacology, and pharmacokinetics. Molecules 2022, 27, 695. [Google Scholar] [CrossRef]
  7. Ge, Y.; Duan, Y.; Fang, G.; Zhang, Y.; Wang, S. Polysaccharides from fruit calyx of Physalis alkekengi var. francheti: Isolation, purification, structural features and antioxidant activities. Carbohyd. Polym. 2009, 77, 188–193. [Google Scholar] [CrossRef]
  8. Chang, H.-T. Grand challenges in analytical science. Front. Anal. Sci. 2021, 1, 725070. [Google Scholar] [CrossRef]
  9. Liu, M.; Qiu, Z.; Zhao, X.; Sun, L.; Wang, L.; Ren, X.; Deng, Y.; Mafra, I. Assessing the quality of calyx of Physalis alkekengi L. var. franchetii based on quantitative analysis of Q-marker combined with chemometrics and machine learning algorithms. J. Chem. 2021, 2021, 8502929. [Google Scholar] [CrossRef]
  10. Osorio-Tobón, J.F. Recent advances and comparisons of conventional and alternative extraction techniques of phenolic compounds. J. Food Sci. Technol. 2020, 57, 4299–4315. [Google Scholar] [CrossRef] [PubMed]
  11. Cao, M.; Yang, S.; Tao, A.; Li, J. Advancements in the extraction, characterization and function activities of polysaccharides from Physalis L.: A review. Int. J. Biol. Macromol. 2025, 303, 140685. [Google Scholar] [CrossRef]
  12. Luque-García, J.L.; Luque de Castro, M.D. Ultrasound: A powerful tool for leaching. TrAC Trends Anal. Chem. 2003, 22, 41–47. [Google Scholar] [CrossRef]
  13. González-Silva, N.; Nolasco-González, Y.; Aguilar-Hernández, G.; Sáyago-Ayerdi, S.G.; Villagrán, Z.; Acosta, J.L.; Montalvo-González, E.; Anaya-Esparza, L.M. Ultrasound-assisted extraction of phenolic compounds from Psidium cattleianum Leaves: Optimization using the response surface methodology. Molecules 2022, 27, 3557. [Google Scholar] [CrossRef]
  14. Keskin Çavdar, H.; Avşar, S. Ultrasonic extraction of Inula viscosa: Enhancing antioxidant bioactivity and its application in sunflower oil as an antioxidant. Ultrason. Sonochem. 2024, 109, 106992. [Google Scholar] [CrossRef]
  15. Mnayer, D.; Fabiano-Tixier, A.-S.; Petitcolas, E.; Ruiz, K.; Hamieh, T.; Chemat, F. Extraction of green absolute from thyme using ultrasound and sunflower oil. Resour.-Effic. Technol. 2017, 3, 12–21. [Google Scholar] [CrossRef]
  16. Shen, L.; Pang, S.; Zhong, M.; Sun, Y.; Qayum, A.; Liu, Y.; Rashid, A.; Xu, B.; Liang, Q.; Ma, H.; et al. A comprehensive review of ultrasonic assisted extraction (UAE) for bioactive components: Principles, advantages, equipment, and combined technologies. Ultrason. Sonochem. 2023, 101, 106646. [Google Scholar] [CrossRef]
  17. Mazova, N.; Popova, V.; Stoyanova, A. Phytochemical composition and biological activity of Physalis spp.: A mini-review. Food Sci. Appl. Biotechnol. 2020, 3, 56–70. [Google Scholar] [CrossRef]
  18. Yang, M.; Wang, S.; Zhou, R.; Zhao, Y.; He, Y.; Zheng, Y.; Gong, H.; Wang, W. Optimization and component identification of ultrasound-assisted extraction of functional compounds from waste blackberry (Rubus fruticosus Pollich) seeds. J. Sci. Food Agric. 2024, 104, 9169–9179. [Google Scholar] [CrossRef] [PubMed]
  19. Che, H.; Zhang, R.; Wang, X.; Yu, H.; Shi, X.; Yi, J.; Li, J.; Qi, Q.; Dong, R.; Li, Q. Ultrasound-assisted extraction of polyphenols from Phyllanthi Fructus: Comprehensive insights from extraction optimization and antioxidant activity. Ultrason. Sonochem. 2024, 111, 107083. [Google Scholar] [CrossRef] [PubMed]
  20. Xu, B.; Feng, M.; Tiliwa, E.S.; Yan, W.; Wei, B.; Zhou, C.; Ma, H.; Wang, B.; Chang, L. Multi-frequency power ultrasound green extraction of polyphenols from Pingyin rose: Optimization using the response surface methodology and exploration of the underlying mechanism. LWT-Food Sci. Technol. 2022, 156, 113037. [Google Scholar] [CrossRef]
  21. Huo, H.; Bao, H.; Yin, H. Optimization of bioactive polyphenols recovery from Flammulina velutipes stem waste using nonionic surfactant-integrated ultrasound-assisted extraction. Ultrason. Sonochem. 2025, 119, 107408. [Google Scholar] [CrossRef]
  22. Al-Dhabi, N.A.; Ponmurugan, K.; Maran, P. Development and validation of ultrasound-assisted solid-liquid extraction of phenolic compounds from waste spent coffee grounds. Ultrason. Sonochem. 2017, 34, 206–213. [Google Scholar] [CrossRef]
  23. Bezerra, M.A.; Santelli, R.E.; Oliveira, E.P.; Villar, L.S.; Escaleira, L.A. Response surface methodology (RSM) as a tool for optimization in analytical chemistry. Talanta 2008, 76, 965–977. [Google Scholar] [CrossRef]
  24. Haque, S.K.M. Application of combined Box–Behnken design with response surface methodology and desirability function in optimizing pectin extraction from fruit peels. J. Sci. Food Agric. 2024, 104, 149–173. [Google Scholar] [CrossRef] [PubMed]
  25. Yuan, H.; Xie, C.; Ma, Y.; Miao, Y.; Chen, X.; Gong, H.; Wang, J. Optimization and component identification of ultrasound-assisted extraction of polyphenols from coriander (Coriandrum sativum L.) and evaluation of polyphenol content changes and antioxidant activity during storage. Separations 2025, 12, 217. [Google Scholar] [CrossRef]
  26. Kostikova, V.A.; Chernonosov, A.A.; Kuznetsov, A.A.; Petrova, N.V.; Krivenko, D.A.; Chernysheva, O.A.; Wang, W.; Erst, A.S. Identification of flavonoids in the leaves of Eranthis longistipitata (Ranunculaceae) by liquid chromatography with high-resolution mass spectrometry (LC-HRMS). Plants 2021, 10, 2146. [Google Scholar] [CrossRef] [PubMed]
  27. Barnaba, C.; Larcher, R.; Nardin, T.; Dellacassa, E.; Nicolini, G. Glycosylated simple phenolic profiling of food tannins using high resolution mass spectrometry (Q-Orbitrap). Food Chem. 2018, 267, 196–203. [Google Scholar] [CrossRef] [PubMed]
  28. Munteanu, I.G.; Apetrei, C. Analytical methods used in determining antioxidant activity: A Review. Int. J. Mol. Sci. 2021, 22, 3380. [Google Scholar] [CrossRef]
  29. Alonso-Carrillo, N.; Aguilar-Santamaría, M.d.l.Á.; Vernon-Carter, E.J.; Jiménez-Alvarado, R.; Cruz-Sosa, F.; Román-Guerrero, A. Extraction of phenolic compounds from Satureja macrostema using microwave-ultrasound assisted and reflux methods and evaluation of their antioxidant activity and cytotoxicity. Ind. Crops Prod. 2017, 103, 213–221. [Google Scholar] [CrossRef]
  30. Ozgen, M.; Reese, R.N.; Tulio, A.Z.; Scheerens, J.C.; Miller, A.R. Modified 2,2-azino-bis-3-ethylbenzothiazoline-6-sulfonic acid (ABTS) method to measure antioxidant capacity of selected small fruits and comparison to ferric reducing antioxidant power (FRAP) and 2,2′-diphenyl-1-picrylhydrazyl (DPPH) methods. J. Agric. Food Chem. 2006, 54, 1151–1157. [Google Scholar] [CrossRef]
  31. Chu, J.; Ming, Y.; Cui, Q.; Zheng, N.; Yang, S.; Li, W.; Gao, H.; Zhang, R.; Cheng, X. Efficient extraction and antioxidant activity of polyphenols from Antrodia cinnamomea. BMC Biotechnol. 2022, 22, 9. [Google Scholar] [CrossRef]
  32. Hu, Y.; Yan, B.; Stephen Chen, Z.; Wang, L.; Tang, W.; Huang, C. Recent technologies for the extraction and separation of polyphenols in different plants: A Review. J. Renew. Mater. 2022, 10, 1471–1490. [Google Scholar] [CrossRef]
  33. Gavrila, A.I.; Damian, E.J.; Rosca, A.; Calinescu, I.; Hodosan, C.; Popa, I. Optimization of microwave-assisted extraction of polyphenols from Crataegus monogyna L. Antioxidants . Antioxidants 2025, 14, 357. [Google Scholar] [CrossRef]
  34. Liu, J.-Z.; Lu, X.-X.; Yang, X.-T.; Jiang, L.-J.; Cui, Q. An efficient approach for the extraction of polyphenols from pomegranate peel using the green solvent and profiling by UPLC-Q-TOF-MS/MS analysis. Microchem. J. 2024, 205, 111421. [Google Scholar] [CrossRef]
  35. Slimani, C.; Fadil, M.; Rais, C.; El-hanafi, L.; Benjelloun, M.; Shin, H.-M.; Giesy, J.P.; Lazraq, A.; Abulmeaty, M.M.A.; Almutairi, K.M.; et al. Extraction of natural antioxidants from Moroccan saffron (Crocus sativus L.) using ultrasound-assisted extraction: An optimization approach with box-behnken design. Ultrason. Sonochem. 2025, 120, 107448. [Google Scholar] [CrossRef] [PubMed]
  36. Medina-Plaza, C.; Beaver, J.W.; Lerno, L.; Dokoozlian, N.; Ponangi, R.; Blair, T.; Block, D.E.; Oberholster, A. Impact of temperature, ethanol and cell wall material composition on cell wall-anthocyanin interactions. Molecules 2019, 24, 3350. [Google Scholar] [CrossRef] [PubMed]
  37. Huo, H.; Bao, H.; Li, J.; Li, H. Optimization and antioxidant evaluation of clean and efficient recovery of polyphenols from Phellodendron amurense waste leaves via ultrasound-assisted extraction. Ultrason. Sonochem. 2025, 120, 107512. [Google Scholar] [CrossRef]
  38. Espada-Bellido, E.; Ferreiro-González, M.; Carrera, C.; Palma, M.; Barroso, C.G.; Barbero, G.F. Optimization of the ultrasound-assisted extraction of anthocyanins and total phenolic compounds in mulberry (Morus nigra) pulp. Food Chem. 2017, 219, 23–32. [Google Scholar] [CrossRef] [PubMed]
  39. Xu, H.; Zhang, Y.; Wang, S.; Wang, W.; Yu, N.; Gong, H.; Ni, Z. Optimization of functional compounds extraction from Ginkgo biloba seeds using response surface methodology. Qual. Assur. Saf. Crop. 2022, 14, 102–112. [Google Scholar] [CrossRef]
  40. Li, J.; Chen, Z.; Shi, H.; Yu, J.; Huang, G.; Huang, H. Ultrasound-assisted extraction and properties of polysaccharide from Ginkgo biloba leaves. Ultrason. Sonochem. 2023, 93, 106295. [Google Scholar] [CrossRef]
  41. Wu, W.; Jiang, S.; Liu, M.; Tian, S. Simultaneous process optimization of ultrasound-assisted extraction of polyphenols and ellagic acid from pomegranate (Punica granatum L.) flowers and its biological activities. Ultrason. Sonochem. 2021, 80, 105833. [Google Scholar] [CrossRef]
  42. Boateng, I.D.; Kumar, R.; Daubert, C.R.; Flint-Garcia, S.; Mustapha, A.; Kuehnel, L.; Agliata, J.; Li, Q.; Wan, C.; Somavat, P. Sonoprocessing improves phenolics profile, antioxidant capacity, structure, and product qualities of purple corn pericarp extract. Ultrason. Sonochem. 2023, 95, 106418. [Google Scholar] [CrossRef]
  43. Liu, C.; Qiao, L.; Gao, Q.; Zhang, F.; Zhang, X.; Lei, J.; Ren, M.; Xiao, S.; Kuang, J.; Deng, S.; et al. Total biflavonoids extraction from Selaginella chaetoloma utilizing ultrasound-assisted deep eutectic solvent: Optimization of conditions, extraction mechanism, and biological activity in vitro. Ultrason. Sonochem. 2023, 98, 106491. [Google Scholar] [CrossRef]
  44. Su, J.; Li, P.; Tang, X.; Chen, Z.; Peng, Q.; Li, H.; Zhang, Q.; Lu, S.; Wen, F.; Qin, H.; et al. Ultrasonic extraction of polyphenols from roots of Ilex asprella: Structural characterization, antioxidant, antimicrobial, anti-inflammatory, and anti-hyperlipidemic activities. Ultrason. Sonochem. 2025, 120, 107462. [Google Scholar] [CrossRef] [PubMed]
  45. Popova, V.; Mazova, N.; Ivanova, T.; Petkova, N.; Stoyanova, M.; Stoyanova, A.; Ercisli, S.; Assouguem, A.; Kara, M.; Alshawwa, S.Z.; et al. Phytonutrient composition of two phenotypes of Physalis alkekengi L. fruit. Horticulturae 2022, 8, 373. [Google Scholar] [CrossRef]
  46. Wang, Y.; Wang, S.; Zhang, J.; Song, X.; Zhang, Z.; Li, J.; Li, S. Anti-ulcer and anti-Helicobacter pylori potentials of the ethyl acetate fraction of Physalis alkekengi L. var. franchetii (Solanaceae) in rodent. J. Ethnopharmacol. 2018, 211, 197–206. [Google Scholar] [CrossRef]
  47. Chen, L.-X.; Xia, G.-Y.; Liu, Q.-Y.; Xie, Y.-Y.; Qiu, F. Chemical constituents from the calyces of Physalis alkekengi var. franchetii. Biochem. Syst. Ecol. 2014, 54, 31–35. [Google Scholar] [CrossRef]
  48. Li, X.; Zhang, C.; Wu, D.; Tang, L.; Cao, X.; Xin, Y. In vitro effects on intestinal bacterium of physalins from Physalis alkekengi var. Francheti. Fitoterapia 2012, 83, 1460–1465. [Google Scholar] [CrossRef]
  49. Zhang, C.; Yang, L.; Gong, Q.; Liu, X.; Deng, F. Metabolic profiling of different parts of Physalis alkekengi L. var. franchetii (Mast.) Makino based on UPLC-Q-Orbitrap-HRMS coupled with bioactivity assays. J. Pharmaceut. Biomed. 2024, 249, 116388. [Google Scholar] [CrossRef] [PubMed]
  50. Lv, Z.; Wang, B.; Wang, B.; Zhang, H. In vivo comprehensive metabolite profiling of esculetin and esculin derived from chicory in hyperuricemia rats using ultra-high-performance liquid chromatography coupled with quadrupole-orbitrap high-resolution mass spectrometry. J. Sep. Sci. 2023, 47, e2300664. [Google Scholar] [CrossRef]
  51. Buszewski, B.; Walczak, J.; Žuvela, P.; Liu, J.J. Non-target analysis of phospholipid and sphingolipid species in egg yolk using liquid chromatography/triple quadrupole tandem mass spectrometry. J. Chromatogr. A 2017, 1487, 179–186. [Google Scholar] [CrossRef] [PubMed]
  52. Li, H.; Zhao, X.; Li, X.; Liang, J.; Qin, S.; Li, J.; Zhang, A.; Xu, L.; Tang, D.; Li, F. Characterization of volatile flavour compounds and characteristic flavour precursors in poultry eggs based on multi-omics and machine learning. Food Chem. 2025, 489, 144840. [Google Scholar] [CrossRef] [PubMed]
  53. Adesegun, S.A.; Alabi, S.O.; Olabanji, P.T.; Coker, H.A.B. Evaluation of antioxidant potential of Melanthera scandens. J. Acupunct. Meridian 2010, 3, 267–271. [Google Scholar] [CrossRef]
  54. Pérez-Jiménez, J.; Arranz, S.; Tabernero, M.; Díaz- Rubio, M.E.; Serrano, J.; Goñi, I.; Saura-Calixto, F. Updated methodology to determine antioxidant capacity in plant foods, oils and beverages: Extraction, measurement and expression of results. Food Res. Int. 2008, 41, 274–285. [Google Scholar] [CrossRef]
  55. Li, C.; Wang, E.; Elshikh, M.S.; Alwahibi, M.S.; Wang, W.; Wu, G.; Shen, Y.; Abbasi, A.M.; Shan, S. Extraction and purification of total flavonoids from Gnaphalium affine D. Don and their evaluation for free radicals’ scavenging and oxidative damage inhabitation potential in mice liver. Arab. J. Chem. 2021, 14, 103006. [Google Scholar] [CrossRef]
  56. Wang, J.; Li, Z.; Wu, X.; Wang, Z.; Liang, B.; Gao, Y.; Dai, Y.; Wu, Q. Preparation of Physalis alkekengi L. calyx total flavonoids-chitosan composite film and its effect on preservation of chilled beef. Int. J. Biol. Macromol. 2024, 283, 137768. [Google Scholar] [CrossRef] [PubMed]
  57. Li, R.; Rosado-Souza, L.; Sampathkumar, A.; Fernie, A.R. The relationship between cell wall and postharvest physiological deterioration of fresh produce. Plant Physiol. Bioch. 2024, 210, 108568. [Google Scholar] [CrossRef]
  58. Que, F.; Mao, L.; Fang, X.; Wu, T. Comparison of hot air-drying and freeze-drying on the physicochemical properties and antioxidant activities of pumpkin (Cucurbita moschata Duch.) flours. Int. J. Food Sci. Tech. 2008, 43, 1195–1201. [Google Scholar] [CrossRef]
  59. Mouhoubi, K.; Boulekbache-Makhlouf, L.; Madani, K.; Palatzidi, A.; Perez-Jimenez, J.; Mateos-Aparicio, I.; Garcia-Alonso, A. Phenolic compounds and antioxidant activity are differentially affected by drying processes in celery, coriander and parsley leaves. Int. J. Food Sci. Tech. 2022, 57, 3467–3476. [Google Scholar] [CrossRef]
  60. Joseph Bassey, E.; Cheng, J.-H.; Sun, D.-W. Comparative elucidation of bioactive and antioxidant properties of red dragon fruit peel as affected by electromagnetic and conventional drying approaches. Food Chem. 2024, 439, 138118. [Google Scholar] [CrossRef]
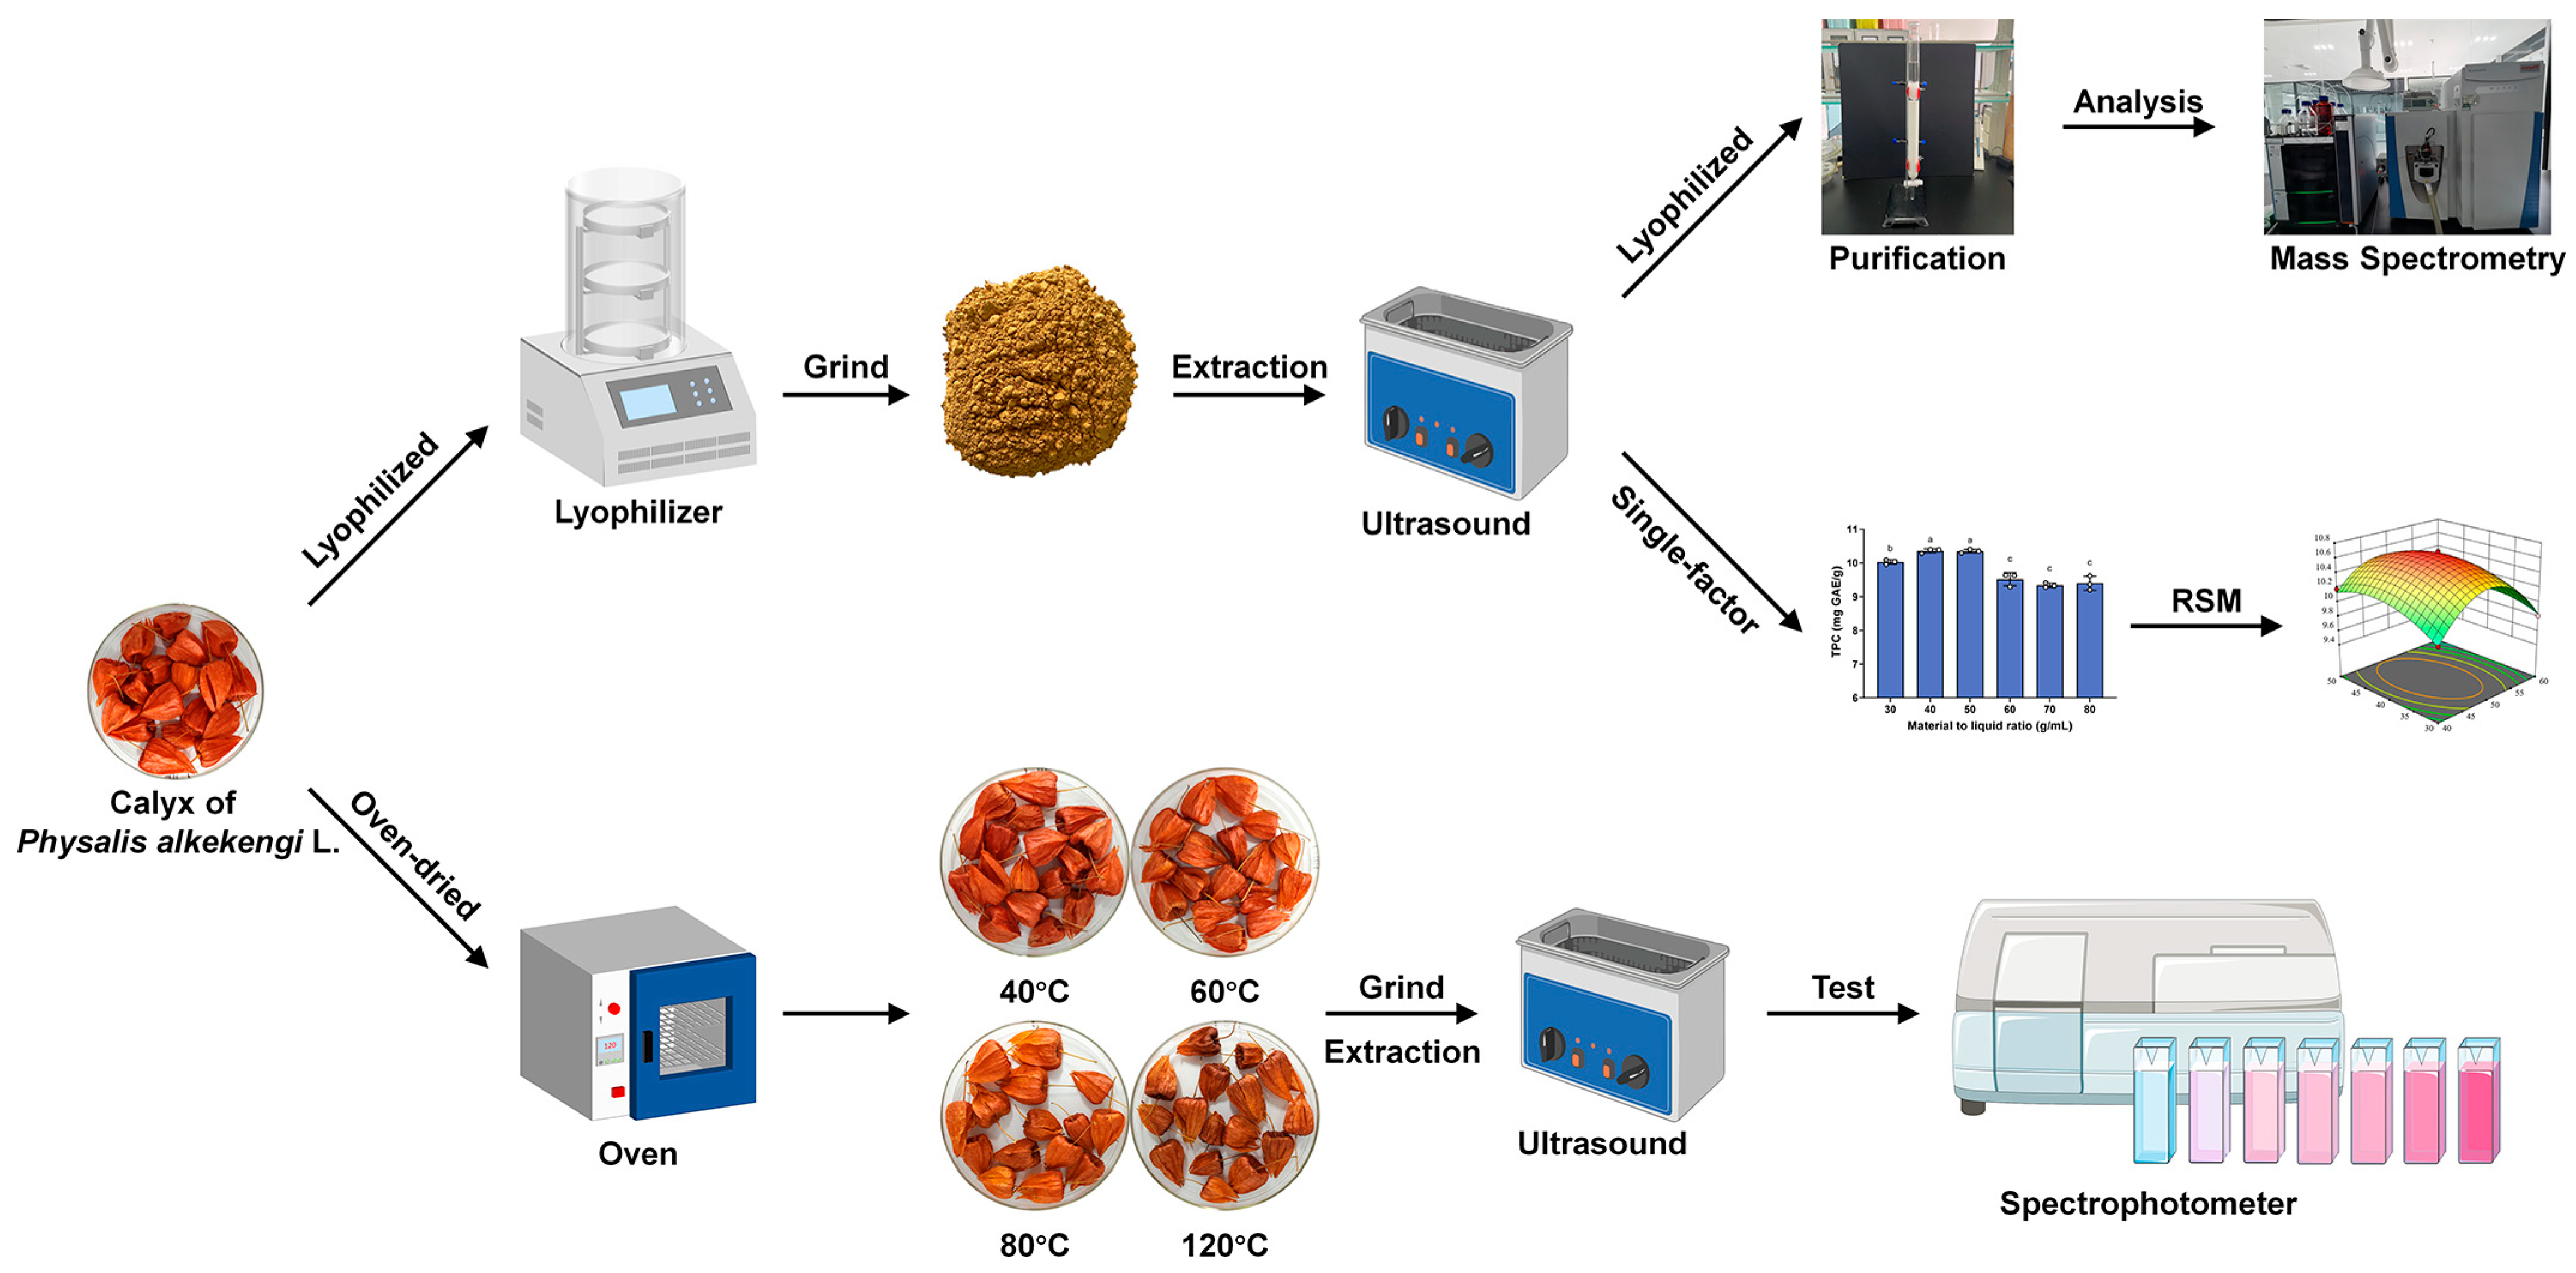
Figure 1. The process of sample preparation (RSM, response surface methodology).
Processes 13 02793 g001
Figure 2. The total phenolic content (TPC) of CPALs (calyxes of Physalis alkekengi L.) in the single-factor test. (A) Ethanol concentration (n = 3 independent samples), (B) liquid-to-material ratio (n = 3 independent samples), (C) extraction time (n = 3 independent samples), and (D) extraction temperature (n = 3 independent samples). Data are shown as means ± SDs. Significant differences are shown by different lowercase letters, which are determined using one-way ANOVA followed by Duncan’s multiple range test (p < 0.05).
Processes 13 02793 g002
Figure 3. Three-dimensional (3D) response surfaces illustrate the interactive effects of independent variables. For each pair of variables, the remaining two variables were fixed at their central levels. (A) The interaction between the liquid-to-material ratio and ethanol concentration (the extraction time and extraction temperature were fixed at 30 min and 60 °C, respectively); (B) the interaction between the extraction time and ethanol concentration (the liquid-to-material ratio and extraction temperature were fixed at 40 mL/g and 60 °C, respectively); (C) the interaction between the extraction temperature and ethanol concentration (the liquid-to-material ratio and extraction time were fixed at 40 mL/g and 30 min, respectively); (D) the interaction between the extraction time and liquid-to-material ratio (the ethanol concentration and extraction temperature were fixed at 50% and 60 °C, respectively); (E) the interaction between the extraction temperature and liquid-to-material ratio (the ethanol concentration and extraction time were fixed at 50% and 30 min, respectively); (F) the interaction between the extraction time and extraction temperature (the ethanol concentration and liquid-to-material ratio were fixed at 50% and 40 mL/g, respectively).
Processes 13 02793 g003
Figure 4. (A) Possible fragmentation mechanisms and (B) MS/MS spectrum of kaempferol-7-O-β-D-glucopyranoside.
Processes 13 02793 g004
Figure 5. (A) Possible fragmentation mechanisms and (B) MS/MS spectrum of astragalin.
Processes 13 02793 g005
Figure 6. (A) Possible fragmentation mechanisms and (B) MS/MS spectrum of esculetin.
Processes 13 02793 g006
Figure 7. Polyphenol profiling in CPAL. Primary classification (A), secondary classification (B), and tertiary classification (C).
Processes 13 02793 g007
Figure 8. The antioxidant activities of CPAL: (A) DPPH, (B) ABTS, and (C) FRAP (ferric-reducing antioxidant power).
Processes 13 02793 g008
Figure 9. Appearance changes of CPAL during drying at different temperatures.
Processes 13 02793 g009
Figure 10. Changes in the TPCs and antioxidant activities of CPAL at different drying temperatures. (A): Total phenolic content (n = 3 independent samples), (B): DPPH (n = 3 independent samples), (C): ABTS (n = 3 independent samples), and (D): FRAP (n = 3 independent samples). Data are shown as means ± SDs. Significant differences are shown by different lowercase letters, which are determined using one-way ANOVA followed by Duncan’s multiple range test (p < 0.05).
Processes 13 02793 g010
Table 1. RSM design.
Independent VariableCoded SymbolLevel
10−1
Ethanol concentration (%)X1605040
Liquid-to-material ratio (mL/g)X2504030
Extraction time (min)X3403020
Extraction temperature (°C)X4706050
Table 2. Mobile phase conditions.
Time (min)B: AcetonitrileA: 0.1% HCOOH Aqueous Solution
0–2595
2–63070
6–73070
7–127822
12–147822
14–17955
17–20955
20–21595
Table 3. Box–Behnken design results.
RunX1 (%)X2 (mL/g)X3 (Min)X4 (°C)Actual Value
(mg GAE/g)
Predicted Value
(mg GAE/g)
14040307010.3210.27
2604030509.639.65
35030307010.4210.42
44050306010.1810.13
55050307010.3610.37
6505020609.919.91
7504040709.959.95
8503040609.799.75
9503030509.929.96
105050305010.0310.09
11404030509.829.74
12504020509.719.69
13604020609.489.44
145040306010.6910.65
15505040609.989.97
165040306010.6110.65
17605030609.729.71
18404040609.479.57
195040306010.6810.65
205040306010.6310.65
21603030609.819.84
22604040609.529.49
23404020609.779.86
245040306010.6510.65
255030206010.0710.04
265040207010.2210.22
27604030709.829.86
28403030609.929.92
29504040509.759.73
Table 4. ANOVA results for the extraction of polyphenols from CPAL.
SourceSum of SquaresDFMean-Squared ValueF-Valuep-ValueSignificant
Model3.92140.280083.12<0.0001**
X10.187510.187555.67<0.0001**
X20.005210.00521.550.2341
X30.040810.040812.120.0037*
X40.414410.4144123.04<0.0001**
X1X20.030610.03069.090.0093*
X1X30.028910.02898.580.0110*
X1X40.024010.02407.130.0183*
X2X30.030610.03069.090.0093*
X2X40.007210.00722.150.1651
X3X40.024010.02407.130.0183*
X121.19111.191566.25<0.0001**
X220.288810.288885.74<0.0001**
X321.7711.77525.25<0.0001**
X420.346110.3461102.76<0.0001**
Residual0.0472140.0034
Lack of fit0.0427100.00433.810.1046Not significant
Pure error0.004540.0011
Cor total3.9728
R20.9881
Radj20.9762
CV (%)0.5787
* Significant at p < 0.05; ** significant at p < 0.001. DF: degrees of freedom; Radj2: adjusted R2; R2: coefficient of determination; CV: coefficient of variation.
Table 5. Major polyphenolic compounds in CPAL.
NO.NameClassificationIonization
Mode
RT
(min)
FormulaPredictedMeasuredDelta Mass
(ppm)
MS/MS
(m/z)
Score
A: Flavonoids
1Apigenin a [34]Apigenin derivatives[M−H]9.854C15H10O5270.05282270.052830.04151.00290, 117.0336482.36
2Cosmosiin a [35][M−H]7.291C21H20O10432.10565432.105770.27269.04559, 268.0377575.89
3Isovitexin b[M+H]+6.599C21H20O10432.10565432.10533−0.72415.10175, 397.09218, 313.07013, 283.0596981.53
4Hydroxy- genkwanin bBaicalein derivatives[M+H]+9.948C16H12O6300.06339300.06269−2.31287.05069, 286.04666, 153.0176778.96
5Homoplantaginin b[M+H]+7.33C22H22O11462.11621462.11547−1.61301.07007, 286.04657, 161.5641875.46
6Cynaroside a [2]Luteolin derivatives[M−H]7.316C21H20O11448.10056448.100620.14285.04050, 284.03275, 151.0031981.36
7Luteolin-4′-O-glucoside a [2][M−H]7.523C21H20O11448.10056448.100780.5369.05130, 285.04065, 135.0444282.58
8Pectolinarigenin b[M−H]11.586C17H14O6314.07904314.07899−0.15299.05167, 298.04837, 283.0249079.50
9Vicenin II b[M-H]5.763C27H30O15594.15847594.158960.83575.14117, 503.12006, 473.10941, 353.0669982.36
10Luteolin a [35][M−H]6.842C15H10O6286.04774286.047760.06151.00304, 133.02873, 107.0130178.68
11Vicenin III b[M−H]9.328C26H28O14564.14791564.148471.01519.15125, 443.13525, 401.0878178.33
122″-O-β-L-Galactopyranosylorientin b[M+H]+5.524C27H30O16610.15338610.15294−0.73593.23419, 449.10721, 287.0545373.24
13Luteolin 7-rutinoside b[M−H]6.59C27H30O15594.15847594.159171.17430.09146, 285.04056, 254.0327571.51
14Diosmetin bDiosmetin derivatives[M−H]9.995C16H12O6300.06339300.06325−0.46284.03268, 190.90388, 151.011076.14
15Diosmetin-7-O-β-D-glucopyranoside b[M−H]7.38C22H22O11462.11621462.11640.4446.08563, 299.05612, 284.03293, 283.0247872.31
165,7,3′-Trihydroxy-6,4′,5′-trimethoxyflavone bOthers[M+H]+11.432C18H16O8360.08452360.08394−1.6346.06757, 345.05988, 301.07010, 153.05444, 151.0388370.26
17Sinensetin b[M+H]+11.735C20H20O7372.1209372.12031−1.59358.10406, 343.08066, 312.0984571.49
18Eupafolin b[M+H]+10.653C16H12O7316.0583316.05779−1.63302.04141, 299.05426, 271.05963, 151.0388373.29
19Nobiletin a [2][M+H]+11.209C21H22O8402.13147402.13074−1.8388.11447, 373.09100, 343.2259284.56
B: Flavonols
20Astragalin a [2]Quercetin derivatives[M−H]6.82C21H20O11448.10056448.10080.53429.08334, 285.04044, 284.03287, 151.0029372.89
21Isoquercitrin a [2][M+H]+6.738C21H20O12464.09548464.09478−1.51315.04922, 303.04922, 145.0493281.14
22Hyperoside a [9][M−H]6.766C21H20O12464.09548464.095690.46301.03510, 300.02753, 151.0029486.25
23Quercetin a [34][M+H]+6.736C15H10O7302.04265302.04201−2.12285.03864, 219.06436, 153.0179994.37
24Tiliroside b[M+H]+8.558C30H26O13594.13734594.13666−1.15577.20520, 416.14600, 291.08575, 287.05450, 147.0439171.67
25Rutin a [35][M−H]6.549C27H30O16610.15338610.15350.19301.03528, 300.02737, 151.0029096.12
26Quercetin-3-O-β-D-glucose-7-O-β-D-gentiobioside b[M−H]4.799C33H40O22788.20112788.202341.55625.14160, 463.08853, 301.0354074.24
27Kaempferol-7-O-β-D-glucopyranoside bKaempferol derivatives[M+H]+6.749C21H20O11448.10056448.09991−1.45287.05447, 270.05148, 153.0178484.64
28Kaempferol a [46][M−H]9.069C15H10O6286.04774286.047850.4267.02969, 151.0029886.11
29Afzelin b[M+H]+7.648C21H20O10432.10565432.10512−1.21287.05450, 271.05960, 151.1116876.98
30Leucoside b[M−H]6.621C26H28O15580.14282580.143080.46543.17456, 447.09277, 285.04077, 284.03250, 151.0028475.69
31Kaempferol-3-gentiobioside b[M−H]5.582C27H30O16610.15338610.154111.18447.09357, 446.08575, 563.27118, 285.0405972.78
32Nicotiflorin b[M+H]+6.857C27H30O15594.15847594.15781−1.11449.10699, 287.05435,147.0649074.56
33Isorhamnetin bOthers[M−H]10.717C16H12O7316.0583316.05830300.02762, 287.05621, 165.0187182.03
34Fisetin b[M+H]+6.75C15H10O6286.04774286.04717−1.97270.05154, 255.10130, 121.0647099.32
35Morin b[M+H]+6.496C15H10O7302.04265302.04193−2.39285.12283, 257.04382, 153.0179697.32
C: Phenolic acids
36Vanillic acid a [2]Hydroxybenzoic acids[M−H]5.853C8H8O4168.04226168.04157−4.13152.01082, 139.03932, 124.0157586.33
37Salicylic acid b[M+H]+5.061C7H6O3138.03169138.03161−0.61121.02849, 111.04427, 93.0338981.21
38Protocatechuic acid b[M−H]3.948C7H6O4154.02661154.02587−4.79109.02859, 91.0178675.65
39Methyl gallate b[M−H]6.654C8H8O5184.03717184.03664−2.92168.00578, 165.01874, 149.54288, 124.0157973.25
404-Amino-3-hydroxybenzoic acid b[M+H]+1.143C7H7NO3153.04259153.04252−0.45136.03918, 109.05241, 92.0498797.17
414-Methoxysalicylic acid b[M−H]3.07C8H8O4168.04226168.0417−3.33149.02376, 123.04437, 122.0287270.61
42p-Coumaric acid b[M+H]+5.681C9H8O3164.04734164.04726−0.52147.04385, 137.05957, 135.0439578.93
43Propylparaben b[M−H]7.728C10H12O3180.07864180.07806−3.22153.09145, 151.07579, 135.08072, 120.0572283.21
44Syringic acid a [2][M−H]5.926C9H10O5198.05282198.05242−2.03182.02158, 166.99803, 153.05508, 138.03154, 123.0079772.87
45(2E)-3-(4-Hydroxyphenyl)-N-[2-(4-hydroxyphenyl)ethyl]acrylamide a [46]Hydroxycinnamic acids[M+H]+8.256C17H17NO3283.12084283.12038−1.65266.17459, 147.04390, 121.0648997.10
46Cryptochlorogenic acid a [2][M−H]5.338C16H18O9354.09508354.095210.35317.62381, 191.05566, 179.03450, 173.0450477.58
47Chlorogenic acid a [47][M−H]5.463C16H18O9354.09508354.095120.12336.67032, 191.05548, 179.03432, 173.0448577.76
48Ferulic acid a [48][M−H]7.103C10H10O4194.05791194.05735−2.9178.02657, 149.06009, 134.0365485.06
49Methyl 4-hydroxy-3-methoxycinnamate b[M+H]+7.719C11H12O4208.07356208.07332−1.13191.07005, 181.08571, 177.05444, 145.0595975.33
50Sinapic acid b[M+H]+5.243C11H12O5224.06847224.06827−0.93207.06480, 175.03867, 147.04376, 119.0491490.36
511-Caffeoylquinic acid b[M-H]4.511C16H18O9354.09508354.095190.3191.05565, 179.03445, 135.0444278.87
522-Hydroxycinnamic acid b[M−H]7.012C9H8O3164.04734164.04673−3.73135.00790, 119.04932, 118.7240972.15
53Caffeic acid a [35][M+H]+5.777C9H8O4180.04226180.04212−0.78163.03876, 145.02826, 135.0439680.77
54Rosmarinic acid b[M+H]+7.54C18H16O8360.08452360.08395−1.57251.06993, 181.04936, 163.03879, 145.0282981.75
D: Dihydroflavonoids
55Naringenin bDihydroflavonols[M−H]9.888C15H12O5272.06847272.06827−0.75253.05063, 151.00368, 117.0345978.96
56Didymin b[M+H]+5.21C28H34O14594.19486594.19428−0.96449.10712, 287.05444, 153.0182473.09
E: Isoflavones
57Iridin bIsoflavones[M−H]9.012C24H26O13522.13734522.137590.47359.07727, 358.06967, 343.04602, 344.05377, 329.2334370.98
F: Other Polyphenolics
58Esculetin a [49]Coumarin derivatives[M−H]5.779C9H6O4178.02661178.02596−3.36158.90924, 133.02864, 105.03358, 89.0385485.72
595,7-Dihydroxy-4-methylcoumarin b[M+H]+7.04C10H8O4192.04226192.04204−1.14175.03882, 161.05952, 151.03882, 123.04411, 95.0495176.21
60Esculin b[M−H]4.875C15H16O9340.07943340.07931−0.36177.01865, 176.01111, 133.0287899.17
61Salidroside bPhenylethanoid glycosides[M−H]4.724C14H20O7300.1209300.12083−0.24179.05545, 176.35088, 161.04488, 119.03410, 89.0233084.61
62Forsythoside E b[M−H]4.524C20H30O12462.17373462.173880.32317.12265, 309.11725, 293.13855, 179.07007, 147.06500, 129.0545574.27
63Aurantioobtusin β-D-glucoside bOthers[M+H]+9.071C23H24O12492.12678492.12632−0.94475.17490, 331.08060, 316.05716, 299.0542680.64
Compounds reported in previous studies were marked with a; others are marked with b. MS: mass spectrometry; m/z: mass-to-charge ratio; RT: retention time.
Disclaimer/Publisher’s Note: The statements, opinions and data contained in all publications are solely those of the individual author(s) and contributor(s) and not of MDPI and/or the editor(s). MDPI and/or the editor(s) disclaim responsibility for any injury to people or property resulting from any ideas, methods, instructions or products referred to in the content.