Article

Optimization of Fracturing Sweet Spot in Deep Carbonate Reservoirs by Combining TOPSIS and AHP Algorithm

1
Drilling and Production Technology Research Institute, PetroChina Qinghai Oilfield Company, Dunhuang 736200, China
2
College of Petroleum Engineering, China University of Petroleum (Beijing), Beijing 102200, China
3
SINOPEC Research Institute of Petroleum Engineering Co., Ltd., Beijing 102206, China
4
CNPC Engineering Technology R&D Company Limited, Beijing 102206, China
*
Author to whom correspondence should be addressed.
Processes 2025, 13(9), 2777; https://doi.org/10.3390/pr13092777
Submission received: 31 July 2025 / Revised: 22 August 2025 / Accepted: 27 August 2025 / Published: 29 August 2025
(This article belongs to the Special Issue Recent Advances in Hydrocarbon Production Processes from Geoenergy)

Abstract

The deep carbonate reservoirs in the Yingzhong Block of the Qaidam Basin exhibit strong vertical heterogeneity and complex natural fracture development. Conventional fracability evaluation methods struggle to accurately characterize formation features, thereby affecting the stimulation effectiveness. To enhance the evaluation accuracy of fracturing sweet spot intervals, automatic mineral scanning equipment is employed to obtain formation micro-physical property parameters at continuous depths. Considering the temperature-pressure coupling effect under deep conditions, a rock mechanics computational model based on mineral composition was established to derive macroscopic mechanical parameters such as brittleness index and in situ stress. Based on a combined algorithm of the improved Technique for Order Preference by Similarity to Ideal Solution (TOPSIS) and Analytic Hierarchy Process (AHP), a fracturing sweet spot prediction model integrating micro- and macro-multi-factors is established, and sweet spot index levels are classified. The research results indicate that the rock mechanics computational model demonstrates high accuracy, the calculated macroscopic parameters are reliable, and the fracturing sweet spot index model can fracability and meticulously evaluate the characteristics of deep carbonate formations. The fracturing sweet spots can be classified into three levels: Level I with an index higher than 0.50, Level II with an index between 0.35 and 0.50, and Level III with an index lower than 0.35. After using this method for layer selection, the fracture pressure decreases by 11.6%, and the sand addition success rate increases by 24%. Applying this method to guide the optimization of fracturing intervals demonstrates good on-site practical value, providing an important reference for identifying fracturing sweet spots in deep carbonate reservoirs.

1. Introduction

With the expansion of global oil and gas exploration and development into deep and ultra-deep fields, carbonate rock reservoirs have become important alternative resources. Both the Tarim Basin and the Qaidam Basin have large areas of carbonate rock reservoirs, which are superimposed and interbedded with high-quality source rocks. They are rich in oil and gas resources and are the focus of oil and gas exploration and development, with huge development potential [1,2]. However, such reservoirs generally have characteristics such as deep burial, strong heterogeneity, and complex development of natural fractures, which leads to low identification accuracy of sweet spots in fracturing and modification projects. In the actual stimulation process, problems such as single well rupture/excessive stimulation pressure, difficulty in sand addition, and poor modification efficiency are often encountered, seriously restricting the economic and effective development of deep carbonate reservoirs. Therefore, it is urgently necessary to explore fine evaluation methods for deep carbonate reservoirs and carry out research on the identification of fracturing sweet spots, in order to improve the success rate of fracturing in such reservoirs.
The core of fracturing layer section optimization is the fine characterization of the reservoir. In recent years, scholars at home and abroad have conducted relevant research. In 2012, Huang Jinliang et al. [3] considered geological engineering conditions such as shale thickness, gas content, burial depth, permeability, and fracture distribution, and selected the favorable area for shale gas exploration and development in the Longmaxi Formation. In 2014, Li Huayang et al. [4] established a calculation model for the inversion of the brittleness index of tight sandstone using conventional logging by applying rock mechanics experiments and whole-rock X-ray diffraction analysis experiments, providing technical support for the selection of oil and gas “sweet spots” in tight sandstone. In 2017, Yang Hongwei et al. [5] established a continuous compressible mathematical model for long horizontal sections of shale based on logging data by using the Analytic Hierarchy process (AHP) and fuzzy mathematics methods, guiding the design of perforation parameters. In 2018, Zhai Wenbao et al. [6] introduced the mutation theory to develop a new method for evaluating the fractionability of shale reservoirs, providing a theoretical basis for pre-pressure evaluation and the effect of stimulation. In 2020, Lin Yu et al. [7] conducted research on OVT domain migration processing and sensitive attribute optimization, and developed a set of fine seismic characterization techniques for small-scale fracture-cave reservoirs in deep carbonate rocks. In 2023, Feng Xinyuan et al. [8] developed a sweet spot evaluation technology for shale oil development projects by constructing a digital model of the spatial structure of mineral composition and calculating the fracability index of shale oil in the Qaidam Basin.
With scholars’ further understanding of the complexity of strata, the optimization technology of fracturing sweet spots has gradually shown a development trend of diversified influencing factors and diversified evaluation methods. The evaluation criteria for fracturing sweet spots have evolved from initial reliance solely on brittleness index to a comprehensive quantitative characterization system that incorporates multiple factors including rock mechanical properties, in-situ stress, and natural fractures.. The acquisition of rock mechanical properties and in situ stress parameters is typically based on well logging data such as acoustic wave, density, gamma ray, and caliper logs, with inverse calculations performed using Huang’s model. However, for deep reservoir conditions, this method has not undergone block-specific corrections, and both the logging data and the inversion results exhibit limitations in terms of accuracy. Therefore, in existing research methodologies, there remains a problem of insufficient availability of formation data and inadequate adaptability of model representation. Deep carbonate rock formations have the characteristics of ultra-high temperature and ultra-high pressure. Key parameters such as acoustic waves and density in logging data are significantly affected by wellbore conditions, and logging quality degradation may occur; secondly, core sampling is costly and has limited representativeness, making it difficult to fully reflect the heterogeneity of the reservoir. In terms of sweet spot prediction models, current research predominantly focuses on sandstone and shale formations, commonly employing the Analytic Hierarchy Process (AHP) to establish linear fracability index calculation models. However, these models often neglect the influence of reservoir burial depth and fail to account for the lateral heterogeneity of the reservoir, which limits the effective application of existing achievements in the fracturing of deep carbonate reservoirs.
This paper fully considers the characteristics of deep carbonate reservoirs, introduces automatic mineral identification scanning equipment, and conducts electron microscopy scanning experiments on logging cuttings to obtain microscopic physical parameters such as formation mineral content, the number of micro-fractures and porosity under continuous well sections. Considering the temperature–pressure coupling effect under deep conditions, a rock mechanics calculation model based on mineral components was established to obtain macroscopic mechanical parameters such as formation brittleness index and in situ stress. Based on the TOPSIS-AHP joint algorithm, fracability considering four micro-macro data such as porosity, the number of micro-fractures, brittleness index, and bidirectional stress difference coefficient, a multi-factor fusion fracturing sweet spot prediction model was established. The fracturing sweet spot index (IFSS) was calculated and the sweet spot levels were classified, achieving a comprehensive characterization of deep carbonate rock formations. It provides a new idea for the selection of sweet spot layers for fracturing in this type of reservoir.

2. Methods for Obtaining Microscopic-Macroscopic Parameters

2.1. Methods for Obtaining Microscopic Parameters

Clarifying the mineral composition and micro-pore structure of reservoirs is a prerequisite for understanding their fundamental characteristics. To precisely characterize the features of deep carbonate formations, formation mineral data, pore structure data, and the number of micro-fractures are obtained through cutting scanning electron microscopy (SEM) experiments. The equipment used for cutting scanning is the RoqSCAN automated mineral analysis SEM (CGG Company, Houston, TX, USA), a novel quantitative analysis technology for reservoir rock mineral composition and microstructure. The scanning device is equipped with a high-resolution SEM (Carl Zeiss, New York, NY, USA), a backscattered electron detector, a high-performance energy-dispersive spectrometer (Bruker Corporation, Billerica, MA, USA), and automated analysis software, providing essential parameters for reservoir evaluation through its scanning results.
The automated mineral analysis SEM employs electron imaging, with its working principle illustrated in Figure 1. The electron gun at the top of the column generates electrons in a vacuum environment, and the released electrons accelerate towards the positively charged anode. After passing through the condenser lens, they form a high-energy electron beam that bombards the surface of the scanned sample. When electrons collide with the sample surface, various types of photons, electrons, and rays are produced. The equipment identifies different elements by capturing the characteristic X-rays of the scanned points and then classifies these elements into different mineral types [9,10]. Pores and micro-fractures are identified through the grayscale values of backscattered images, enabling the derivation of scanning data at different formation depths [11,12].
The flowchart of the RoqSCAN rock cuttings scanning experiment is shown in Figure 2. The preparation of the experimental samples mainly consists of three steps: rock cuttings sample curing, sample surface grinding, and sample surface carbon plating. The rock cuttings samples are cured using acrylic resin powder and liquid curing agent. After curing, the sample size is Φ 30 mm × H13 mm (±2 mm). The surface of the rock cuttings samples was roughly ground, finely ground and polished using a geological grinding instrument to expose the fresh side of the rock cuttings, eliminate the shadow effect in backscattered imaging. A carbon film was deposited onto the surface of the sample using a Leica EM ACE200 carbon coater to mitigate the charging effect during electron microscopy scanning and enhance the signals of secondary electrons and backscattered electrons. After the sample preparation is completed, it is placed in the vacuum chamber stage of the RoqSCAN equipment. The instrument is evacuated and then demagnetized, filament correction, focusing, contrast adjustment and other operations are carried out in sequence. After debugging, the sample is scanned point by point. After the scanning is completed, high-resolution scanning result images, mineral composition and content data, pore size distribution and porosity data, and the number of micro-fractures are generated through SmartPI software (Version 5.06), providing data support for calculating macroscopic rock mechanical parameters.

2.2. Macroscopic Rock Mechanics Parameter Calculation Model

2.2.1. Rock Mechanics Model

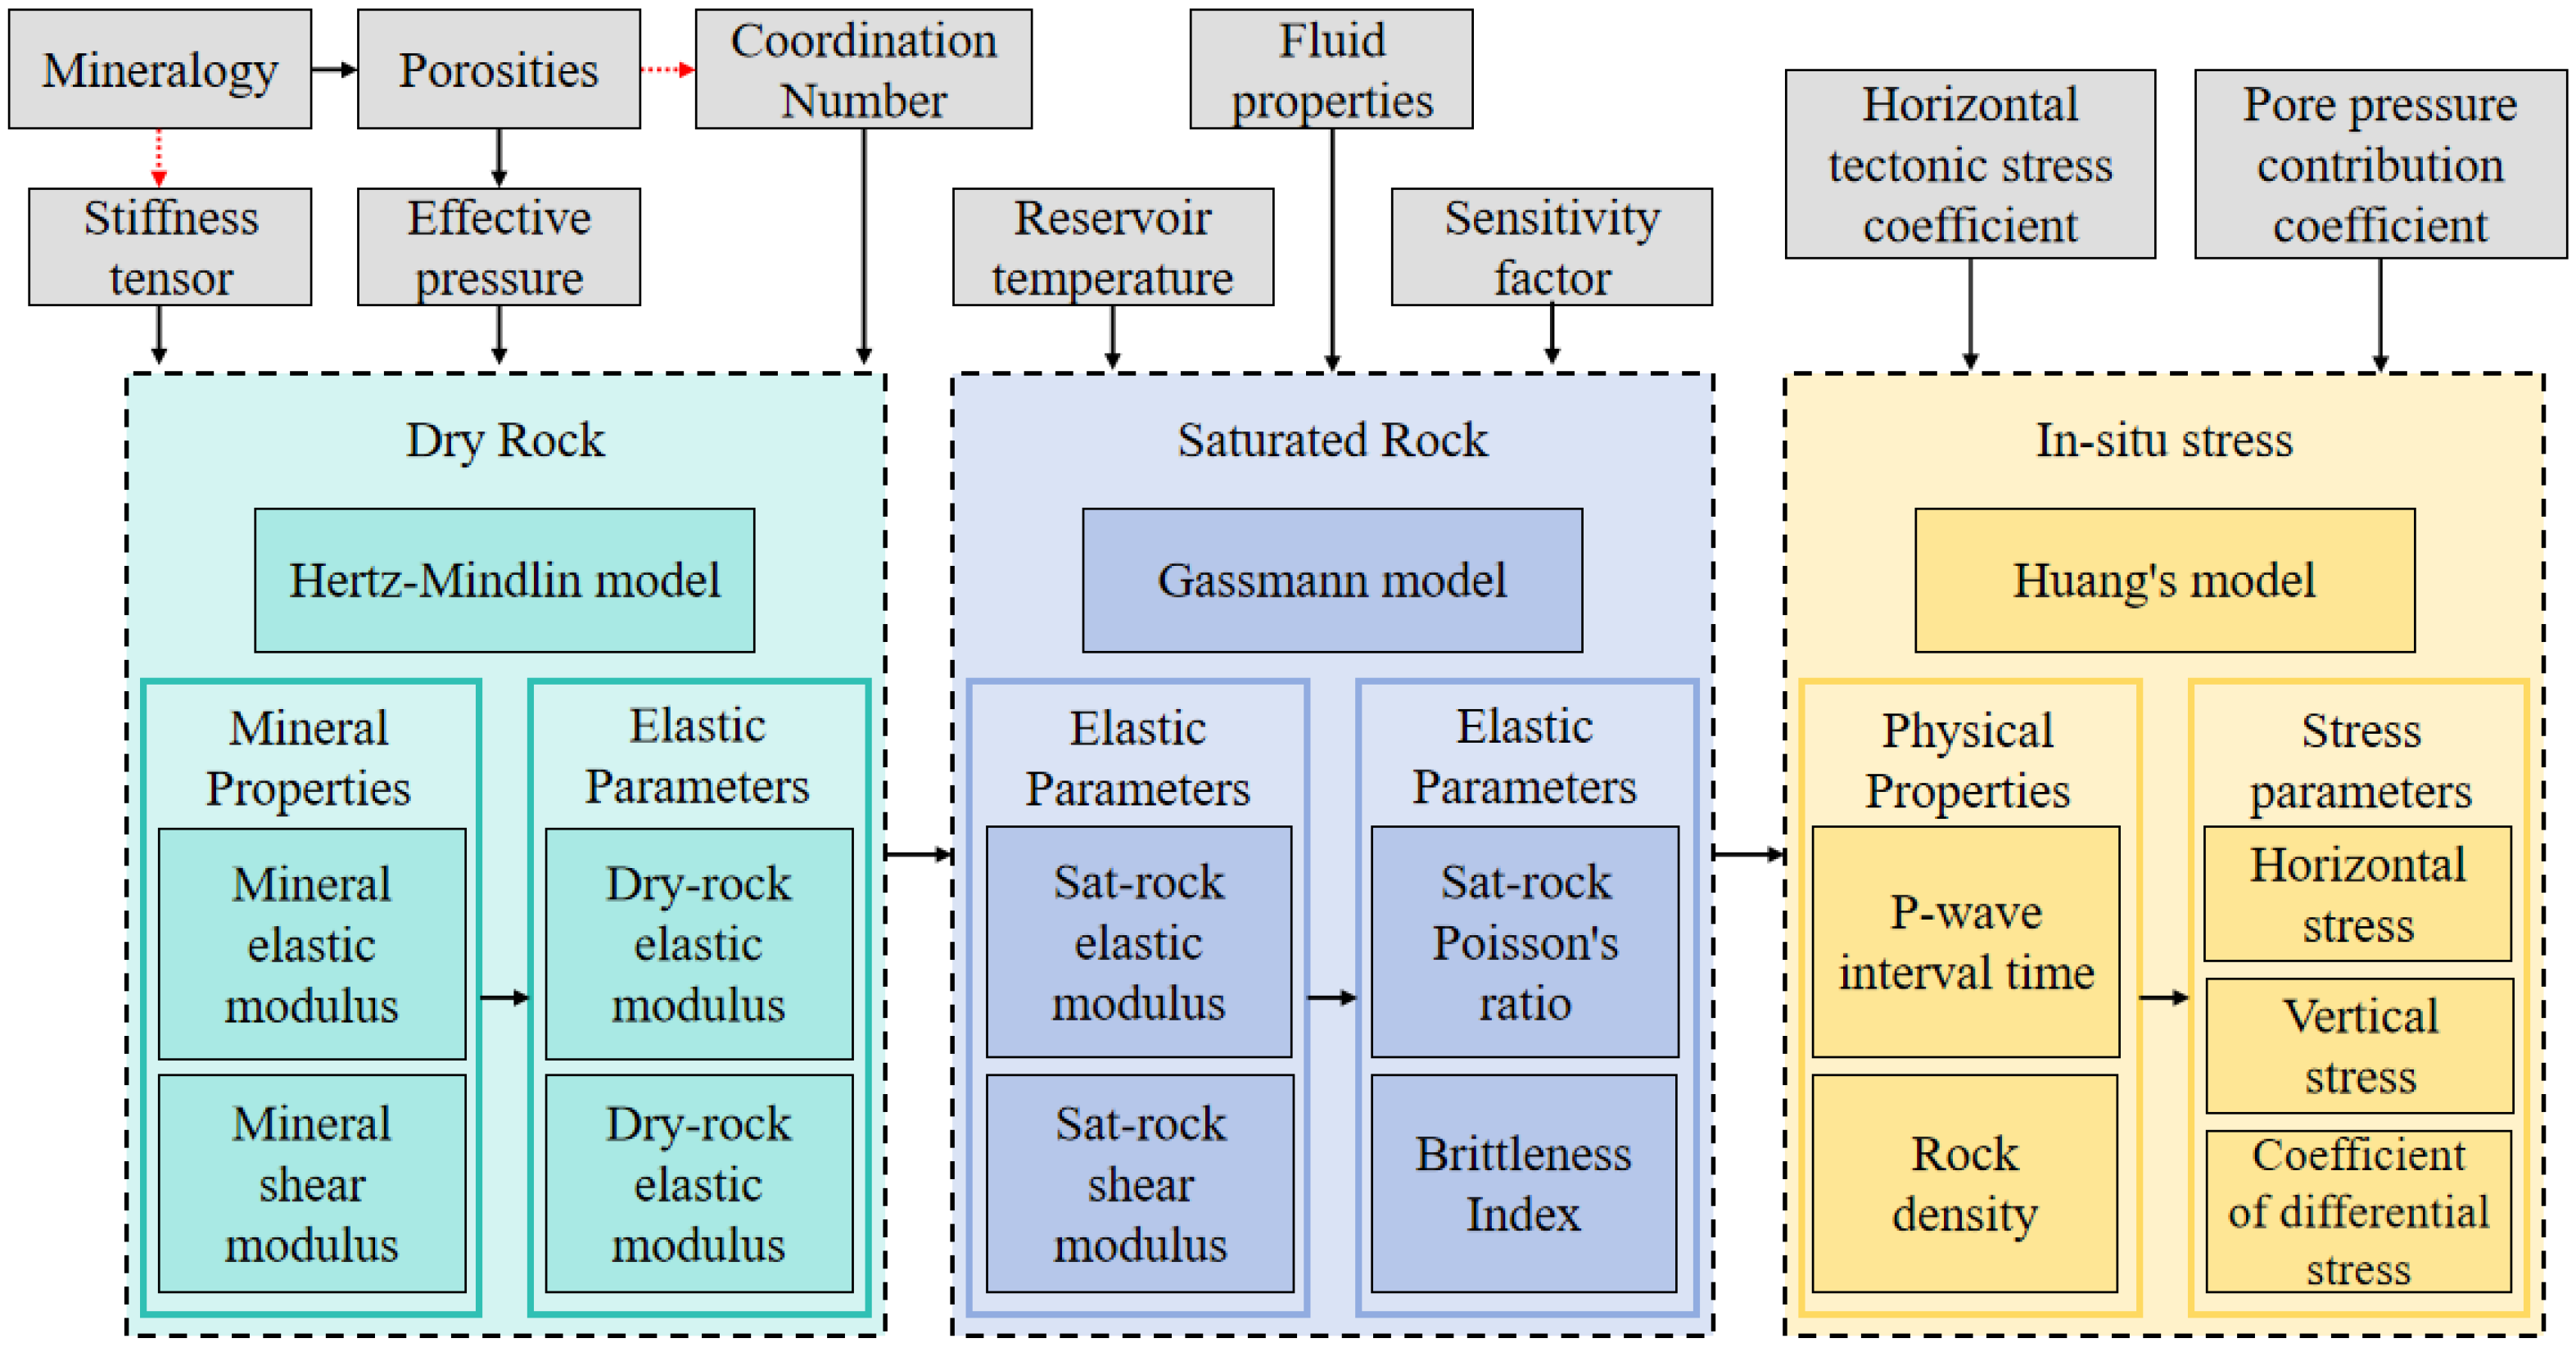
The construction of the macroscopic rock mechanical model primarily encompasses three core components: a dry rock mechanical model, a saturated rock mechanical model [13,14,15], and an in situ stress calculation model. The calculation workflow for macroscopic mechanical parameters based on mineral composition is illustrated in Figure 3. The model first calculates the initial elastic parameters of the rock based on the mineral components and their contents. Combining factors such as pore structure data, effective formation pressure, rock stiffness tensor, and coordination number, it then employs a model based on Hertz-Mindlin theory to derive the mechanical properties of the dry rock formation. The Hertz-Mindlin model is applicable to unconsolidated or weakly consolidated granular media. Its fundamental principle involves simulating the elastic contact behavior of spherical particles under effective stress, calculating the effective modulus based on Hertzian contact theory.
Building upon the dry rock modulus, the model further assumes that the pore fluid has a zero shear modulus (i.e., the fluid’s influence on shear stiffness is neglected). Simultaneously, considering the properties of the formation fluid and the impact of reservoir temperature changes on fluid properties, a temperature sensitivity factor is introduced. The Gassmann model is then used for fluid substitution to compute the mechanical characteristics of the saturated rock. The Gassmann model is suitable for low-frequency saturation conditions and requires the rock to be macroscopically homogeneous, with connected pores and no chemical interaction between the fluid and the rock frame. Its basic principle relies on the contribution of the pore fluid to the bulk modulus, calculating the saturated rock modulus through the relationship between the fluid and the dry rock frame modulus.
Finally, based on the calculated saturated rock mechanical parameters (such as dynamic elastic modulus) and incorporating formation temperature and pressure conditions, Huang’s model is adopted to compute macroscopic mechanical parameters like the brittleness index and in situ stress. This model comprehensively accounts for the complex influence of formation temperature and pressure on rock mechanical properties and is suitable for the quantitative assessment of stress parameters in tight reservoirs. Through the synergistic application of the aforementioned models, cross-scale prediction from mineral composition, pore structure, and temperature-pressure environment to macroscopic mechanical responses is achieved, providing reliable theoretical support for reservoir mechanical characterization and engineering decision-making.
Regression calculation of rock properties based on weighted average values of different mineral inherent property parameters:
E m = i f i E i
μ m = i f i μ i
In Equations (1) and (2), Em represents the initial elastic modulus of the rock, GPa; μm is the initial rock shear modulus, GPa; Ei is the elastic modulus of the i-th mineral itself, GPa. μi is the shear modulus of the i-th mineral itself, GPa. fi represents the percentage of the i-th mineral content, %.
In deep carbonate reservoirs, formation pressure has a significant impact on the internal pore structure of rocks. In dry rock mechanics calculation models, the influence of confining pressure needs to be considered. The dry rock mechanics model based on the contact conditions of rock component particles and pore structure is:
E dry = C 2 1 φ 2 E m 2 18 π 2 1 μ m 2 P eff 1 / 3
μ dry = 5 4 μ m 5 2 μ m 3 C 2 1 φ 2 μ m 2 2 π 2 1 μ m 2 M P eff 1 / 3
In Equations (3) and (4), Edry represents the elastic modulus of the dry rock sample, GPa; C is the particle contact coefficient of the rock component, dimensionless. Em is the initial elastic modulus of the rock, GPa; μdry is the shear modulus of the dry rock sample, GPa; μm is the initial rock shear modulus, GPa; μm is the shear modulus, GPa; φ represents total porosity, %; Peff stands for effective formation pressure, in MPa. M is the rock stiffness tensor, GPa.
In deep carbonate reservoirs, minerals exhibit temperature sensitivity. Under high-temperature conditions, carbonate minerals may undergo thermal pyrolysis. By introducing a temperature sensitivity coefficient, we can characterize the rate of change in elastic parameters under deep high-temperature conditions. When the rock pores are given a fluid saturated state, the calculation model for the mechanical property parameters of saturated rocks considering the temperature sensitivity coefficient is:
E sat = E dry + 1 E dry / E m 2 φ / E fl + 1 φ / E m E dry / E m 2 1 α E T T 0
μ sat = μ dry 1 α v T T 0
v sat = 3 E sat 2 μ sat 2 3 E sat + μ sat
In Equations (5)–(7), Esat represents the elastic modulus of saturated rock, GPa; Efl is the elastic modulus of the fluid, GPa. αE is the temperature sensitivity coefficient of the elastic modulus, with a value of 1.49 × 10⁻³, 1/°C. αv is the temperature sensitivity coefficient of Poisson’s ratio, with a value of 1.53 × 10⁻³, 1/°C [16]. T represents the formation temperature, in °C. T0 is room temperature, °C. μsat is the shear modulus of saturated rock samples, GPa; vsat is the Poisson’s ratio of saturated rocks and is dimensionless.
Based on the calculation models of rock elastic modulus and Poisson’s ratio, the calculation models of formation rock density, longitudinal wave time difference, brittleness index and in situ stress can be further constructed:
ρ R = 1 φ ρ m + φ φ s ρ f + φ s ρ w
V p = K sat + 4 3 v sat / ρ R
B I = K sat K min 2 K max K min + v max v sat 2 v max v min
σ H = v 1 v + β H σ v V P eff + V P eff
σ h = v 1 v + β h σ v V P eff + V P eff
σ v = 0 H ρ R d h
C h = σ H σ h / σ h
In Equations (8)–(14), ρR represents the density of the formation, in g/cm3. ρm is the density of pure rock, g/cm3. ρf represents the density of the reservoir fluid, g/cm3. ρw is the density of bound water, g/cm3. φ represents total porosity, %; φs is the porosity occupied by the imflowable fluid, %; Vp represents the velocity of the longitudinal wave, in m/s. vsat is the Poisson’s ratio of saturated rocks and is dimensionless. BI is the brittleness index and is dimensionless. Emax is the upper limit of the elastic modulus of saturated rocks, GPa; Emin is the lower limit of the elastic modulus of saturated rock, GPa; vsat is the Poisson’s ratio of saturated rock, dimensionless. vmax is the upper limit of the Poisson’s ratio of saturated rocks and is dimensionless. vmin is the lower limit of the Poisson’s ratio of saturated rocks and is dimensionless. σH represents the maximum horizontal principal stress, in MPa; σv is the vertical stress, MPa; σh is the minimum horizontal principal stress, MPa; βH and βh are horizontal structural stress coefficients, dimensionless. V is the contribution coefficient of formation pore pressure, dimensionless; Ch is the coefficient of stress difference in both directions, dimensionless.

2.2.2. Model Verification

A typical carbonate reservoir fracturing vertical well in the Anglo-Chinese block was selected as the verification object. The distribution of carbonate rocks in the controlled reservoir of this well is stable and the data is complete. The reservoir of the example well was buried at a depth of 5600 to 5700 m. Electron microscopy scans of 20 groups of rock cuttings samples were conducted for the test oil layer. Based on the above rock mechanics calculation model, the reservoir density, longitudinal wave time difference and other rock physical property parameters were calculated. The key input parameter values of the model are shown in Table 1. The accuracy of the model was verified using the actual logging data of this well. The measured data were fitted through the calculation results of the model. The fitting results are shown in Figure 4. The range of the actual logging acoustic time difference data is 174.9–201.5 μs/m, and the density range is 2.645–2.785 g/cm3. According to the Pearson correlation calculation, the correlation coefficient between the longitudinal wave time difference calculated by the model and the logging acoustic data is 0.631, and the correlation coefficient of the density data is 0.817. The main reason for the difference is that the immersion of the drilling fluid or formation fluid on the wellbore will affect the acoustic characteristics of the rock, thereby affecting the acoustic time difference. Secondly, the accuracy of electrical measuring instruments and operation methods, among other factors, can all lead to data errors. The Pearson correlation coefficients between the electrical measured values and the calculated values are all greater than 0.6, which proves that the two sets of data have a high similarity, verifies the agreement between the model’s calculated results and the measured data, and indicates that the model in this paper can accurately calculate the mechanical parameters of reservoir rocks.

2.3. Fracturing Sweet Spot Index Model

In view of the characteristics of deep carbonate reservoirs, when optimizing the fracturing layer sections, both geological and engineering sweet spots should be fracability considered [17]. Perforation fracturing modification should be carried out in the layer sections with good pore connectivity, well-developed micro-fractures, high brittleness index, and small bidirectional stress difference [18]. To quantitatively evaluate the influence of various indicators on the optimization of fracturing layer sections, a combination of the improved superior and inferior solution distance method (TOPSIS) and the analytic hierarchy process method [19] was adopted to establish the calculation model of the fracturing sweet spot index (IFSS), and to precisely and quantitatively evaluate the reservoir properties.

2.3.1. Model Establishment

(1)
Positive indicator transformation: Unify the indicator types and convert all indicators into extremely large ones. That is, the larger the indicator value, the more favorable it is for the evaluation result. In the optimization of fracturing layers, four indicators obtained by RoqSCAN technology, namely the hole-to-surface ratio, the number of micro-fractures, the brittleness index, and the bidirectional stress difference coefficient, are mainly selected as evaluation indicators. Among them, the smaller the bidirectional stress difference coefficient, the more likely the artificial fractures are to turn, and the higher the complexity of the fracture network. Therefore, the bidirectional stress difference coefficient needs to be positively processed.
(2)
Standardization of positive indicators: Eliminate the influence of the dimensions of various indicators and standardize the positive indicators. Suppose there are n evaluation schemes and 4 evaluation indicators, then the forward matrix is:
X = x 11 x 12 x 14 x 21 x 22 x 24 x n 1 x n 2 x n 4 ,
Its normalization matrix is denoted as Z, and the zij calculation formula for each element in the Z matrix is:
z i j = x i j / i = 1 n x i j 2
(3)
Construct the calculation formula for the fracturing sweet spot index: assuming there are n evaluation schemes and 4 evaluation indicators, then the normalized matrix Z is:
Z = z 11 z 12 z 14 z 21 z 22 z 24 z n 1 z n 2 z n 4 ,
Define the maximum value:
Z + = Z 1 + , Z 2 + , , Z 4 + = max z 11 , z 21 , , z n 1 , max z 12 , z 22 , , z n 2 , , max z 14 , z 24 , , z n 4
Define the minimum value:
Z = Z 1 , Z 2 , , Z 4 = min z 11 , z 21 , , z n 1 , min z 12 , z 22 , , z n 2 , , min z 14 , z 24 , , z n 4
Define the i-th (i = 1, 2, …) The calculation formulas for the distances Di+ from the maximum value and Di from the minimum value of n evaluation objects are:
z i j = x i j / i = 1 n x i j 2
In the formula,
Di+—represents the distance between the evaluated object and the maximum value;
Di—The distance between the evaluated object and the minimum value;
ωj—The weight of the evaluation index, calculated by the Analytic Hierarchy Process [20].
The i (i = 1, 2, …) The calculation formula for the fracking sweet spot index of n evaluation objects is:
I FSS = D i D i + + D i
In the formula, IFSS represents the fracking sweet spot index.
In the fracturing engineering sweet spot evaluation of deep carbonate reservoir, considering the convenience of obtaining parameters and field treatment experience, the influencing indicators in the sweet spot index model are ranked in descending order of importance as follows: brittleness index, pore-to-surface ratio, number of micro-fractures, and difference in horizontal biaxial stresses [21,22]. An Analytic Hierarchy Process (AHP) judgment matrix A is constructed (Equation (15)):
A = 1.00 1.50 2.00 2.50 0.67 1.00 1.50 2.00 0.50 0.67 1.00 1.50 0.40 0.50 0.67 1.00
After calculation, the consistency index (CI) of judgment matrix A is 0.0031, and the consistency ratio (CR) is 0.0035. To enhance the robustness of the weight calculation results, the arithmetic mean method, geometric mean method, and eigenvalue method are employed respectively to calculate the weight vector of judgment matrix A. The calculation results are shown in Table 2.

2.3.2. Fracking Sweet Spot Index Classification

Classifying the fracking sweet spot index into different levels is conducive to quantitatively evaluating the quality of layers at different depths. Due to the different evaluation models, there is currently no unified classification standard for fracking desserts in the industry. Based on the existing research foundation of brittiness classification and compressible classification of different blocks, and in accordance with the mineral composition characteristics and rock mechanical parameter characteristics of the deep carbonate reservoirs in the E32 layer of the Yingzhong area, the fracturing sweet spot index classification standard suitable for this block is determined: IFSS ≥ 0.50, which is a Class I fracturing sweet spot layer section, representing the best fracturing sweet spot of reservoir quality. The IFSS is between 0.35 and 0.50, which is a type II fractured sweet spot layer section, representing a fractured sweet spot with medium reservoir quality. If IFSS ≤ 0.35, it is classified as a sweet spot section of Class III fracturing, indicating poor reservoir quality. It is not recommended to be used as a modified section.

3. On-Site Practical Application

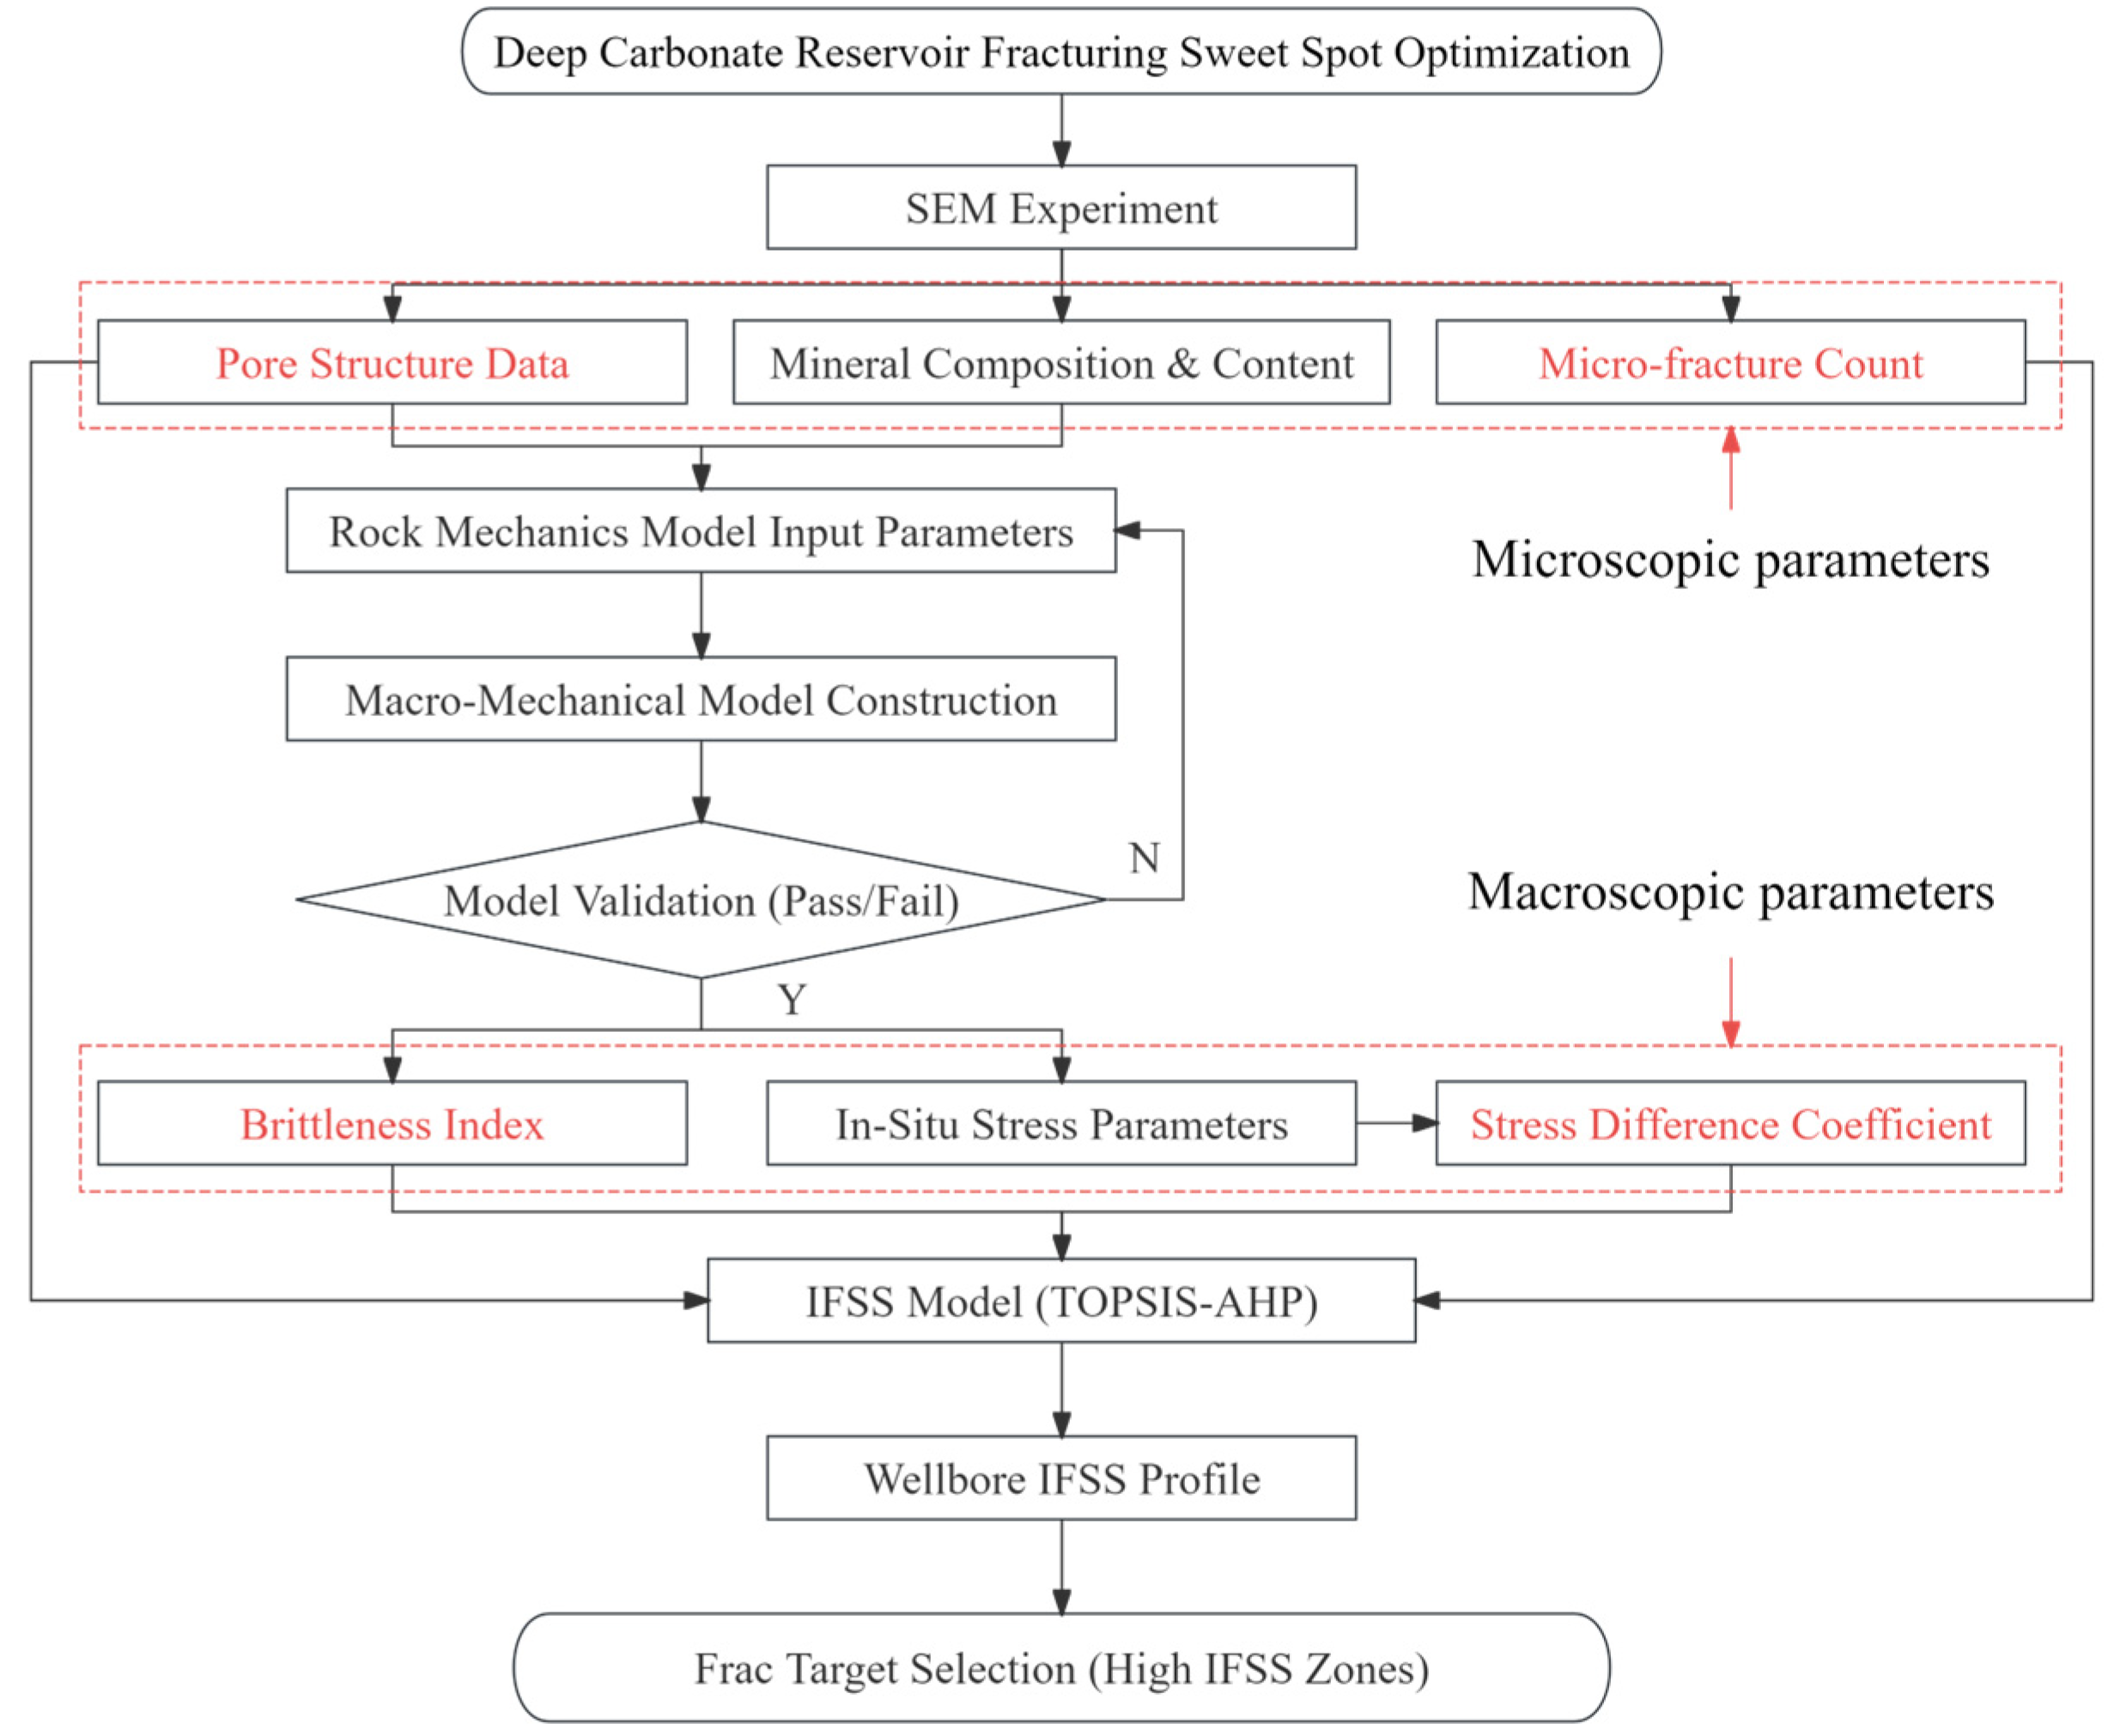
The application workflow for optimizing fracture engineering sweet spots based on the integrated TOPSIS-AHP algorithm is shown in Figure 5. First, scanning electron microscope (SEM) experiments are conducted on cuttings from a continuous carbonate reservoir interval to obtain microphysical properties such as mineral composition, pore structure data, and micro-fracture count. Next, parameters including mineral composition and content, effective pressure, fluid properties, and reservoir temperature are used as model inputs. A rock mechanics model is then applied to calculate macro-mechanical parameters such as Young’s modulus, Poisson’s ratio, and in situ stress parameters, from which the brittleness index and horizontal stress difference coefficient are further derived. The obtained pore data, micro-fracture count, brittleness index, and stress difference coefficient are used as factors influencing fracture sweet spot identification and incorporated into the IFSS calculation model based on the integrated TOPSIS-AHP algorithm, resulting in a continuous IFSS profile along the sampled well section. Finally, based on the variation characteristics of the IFSS curve, intervals with high IFSS values are selected as target zones for fracture stimulation, thereby completing sweet spot optimization.
The field application of the layer section optimization method was carried out by taking the typical carbonate reservoir pre-exploration well S1 as the example well. This well is located in the Yingzhong No. 2 structural Zone of the Yingzhong area in the Qaidam Basin, with a completion depth of 5500 m and the completion layer position being the upper section E32 of the Lower Ganchaigou Formation. The effective permeability of the formation is 0.08 mD, the formation pressure coefficient is 2.09, and the formation temperature gradient is 3.12 °C/100 m.

3.1. Cuttings Scanning Results and Analysis

The RoqSCAN equipment was applied to conduct rock cuttings scanning tests on the 4932–4970 m well section of the E32-IV oil group in the S1 well’s test oil layer. The sampling interval was 2 m, and a total of 20 rock cuttings samples were prepared. The scanning experiment results were used to analyze the formation mineral composition characteristics and pore development degree characteristics of the sampled well section.

3.1.1. Characteristics of Mineral Composition in Strata

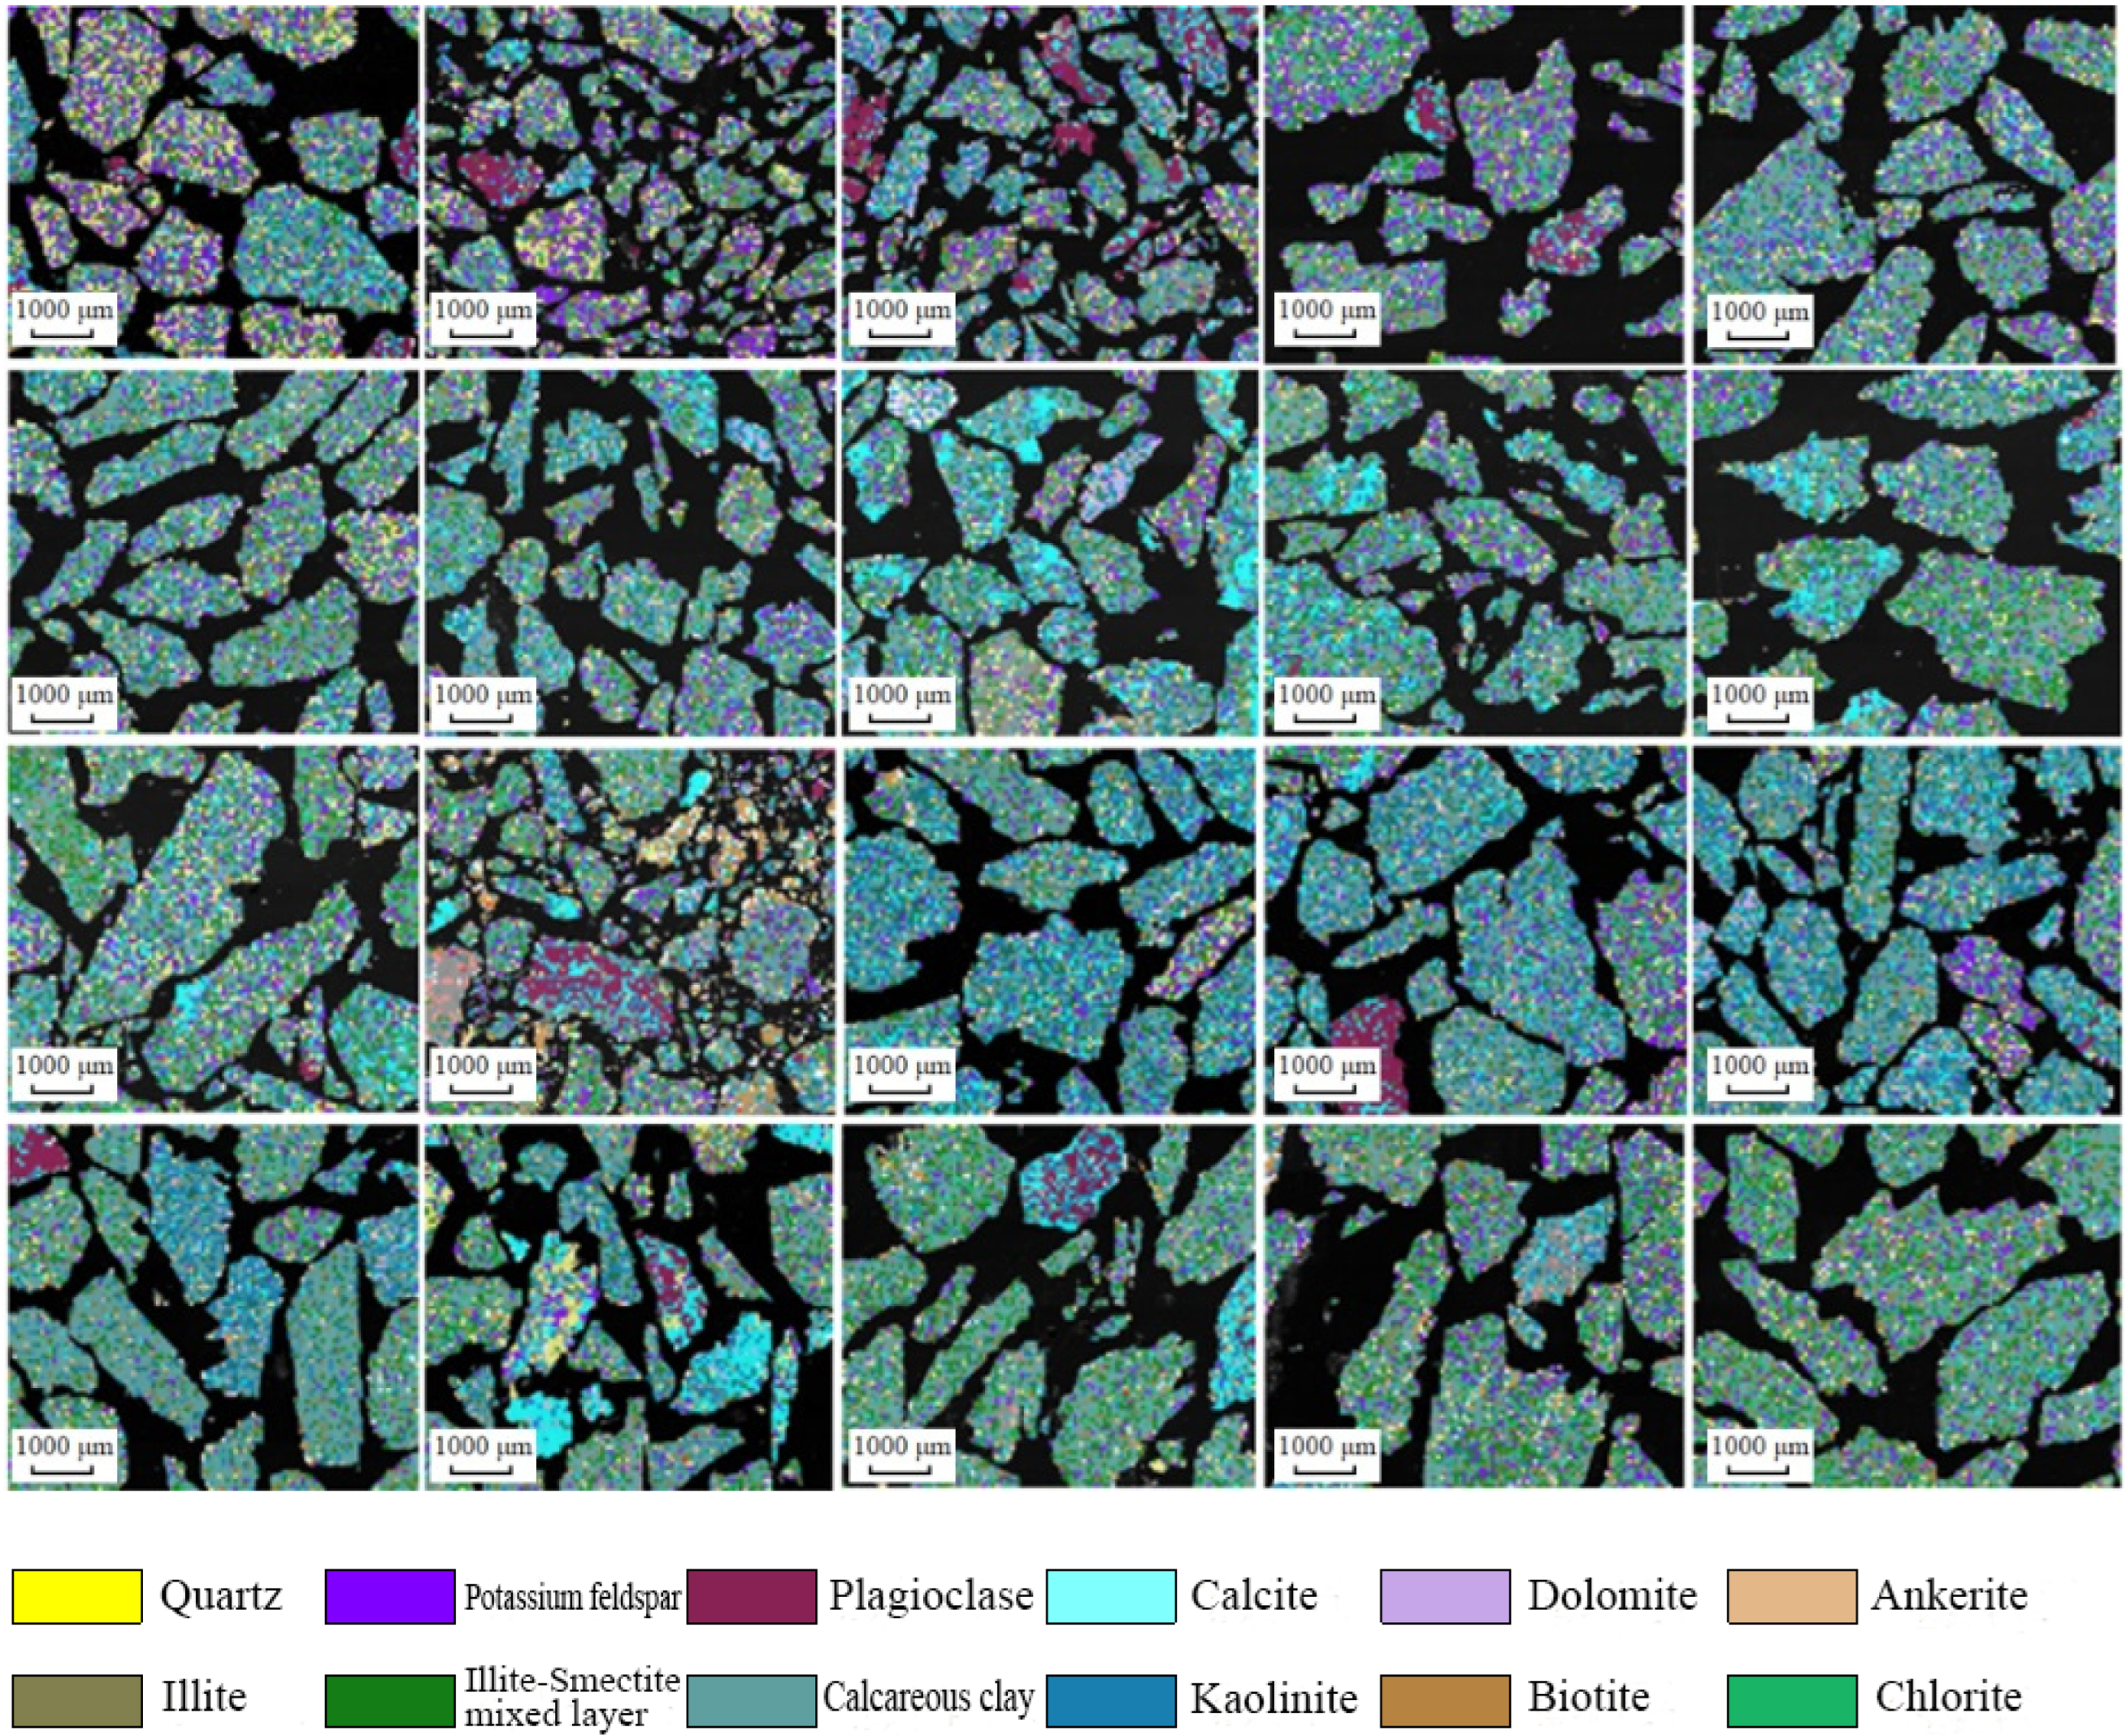
The coloring diagrams of mineral composition at different depths in the sampling section of Well S1 are shown in Figure 6. According to the scanned mineral images, it can be seen that the composition and content of rock minerals in strata at different depths are complex and variable. Within the depth range of 4932–4940 m, the content of potassium feldspar minerals in the strata is relatively high. Within the range of 4942–4964 m, the mineral content of carbonate rocks mainly composed of calcite is relatively high. Within the range of 4966–4970 m, the content of clay minerals mainly composed of Immon mixed layers is relatively high.
The main mineral components and content data are shown in Table 3. The stratum is dominated by clay minerals, with an average proportion of 44.7%. The content of carbonate minerals ranks second, with an average proportion of 30.2%, mainly consisting of calcite, dolomite and iron dolomite minerals. Silicate minerals have the lowest content, averaging 19.8%, mainly consisting of quartz, plagioclase and potassium feldspar minerals.

3.1.2. Characteristics of Formation Pore Development

The pore size distributions at different sampling points below the sampling location in Well S1 are shown in Figure 7. Based on the statistical analysis of pore sizes obtained from scanning, pores with sizes ranging from 0 to 100 μm are classified as small pores, those from 100 to 200 μm as mesopores, and pores larger than 200 μm as macropores. By examining the proportions of small, meso-, and macropores, along with the total pore area ratio data, the degree of formation connectivity and pore development at different depths can be evaluated. At the depths of the sampled interval (4932~4970 m) in Well S1, the pore area ratio ranges from 0.19% to 3.30%, with an average of 0.98%. Among them, the proportion of small holes (0~100 μm) was 21.14–68.54%, with an average of 40.49%. The proportion of mesopores (100~200 μm) was 5.43–15.78%, with an average of 9.55%. The proportion of macropores (>200 μm) ranged from 14.30% to 62.21%, with an average of 40.17%. Overall, the proportion of small pores and macropores was comparable, and the connectivity was relatively good.
The RoqSCAN electron microscope scanning technique is capable of identifying pore structures with apertures as small as 0.1 μm. Among these, nanoscale microcracks, with widths less than 1 μm, are typically intergranular microcracks, while microscale microcracks have apertures ranging from 1 to 100 μm and are usually interparticle microcracks. To differentiate microscale microcracks from intergranular pores or other minute structures, the focus is placed on examining the development extent of microscale microcracks with apertures > 1 μm and an aspect ratio (length-to-width ratio) of 30 or more. Within the sampled interval, the number of identified micro-fractures per cutting sample ranged from 1 to 7, with an average of 3.1 micro-fractures per sample. The vertical distribution of micro-fractures exhibited strong heterogeneity; micro-fractures were poorly developed at depths of 4932~4936 m, with only 1~2 micro-fractures detected per sample, whereas they were relatively well-developed at depths of 4958~4962 m, with 5~7 micro-fractures detected per sample, as shown in Figure 8. The precise identification of micro-fracture counts provides robust support for the fracability evaluation of deep carbonate reservoirs.

3.2. Analysis of Rock Mechanics Characteristics

Based on the macroscopic rock mechanics model considering the temperature-pressure coupling effect, the elastic modulus, Poisson’s ratio, brittleness index and in situ stress parameters under the scanning well section were calculated. The calculation results are shown in Table 4. The elastic modulus (E) of the deep carbonate rock strata in the Anglo-Chinese block ranges from 43.15 GPa to 54.89 GPa. The Poisson’s ratio (v) ranges from 0.261 to 0.330. The brittleness index (BI) ranges from 25.06 to 48.89, with an average of 33.03. The brittleness of the reservoir is at a moderately weak level. The range of the minimum horizontal principal stress (σh) is 108.5 to 109.4 MPa, the stress difference in both horizontal directions is 8.7 MPa, and the range of the stress difference coefficient (Ch) is 0.067 to 0.090.

3.3. Interval Optimization Based on Fracturing Sweet Spot Index

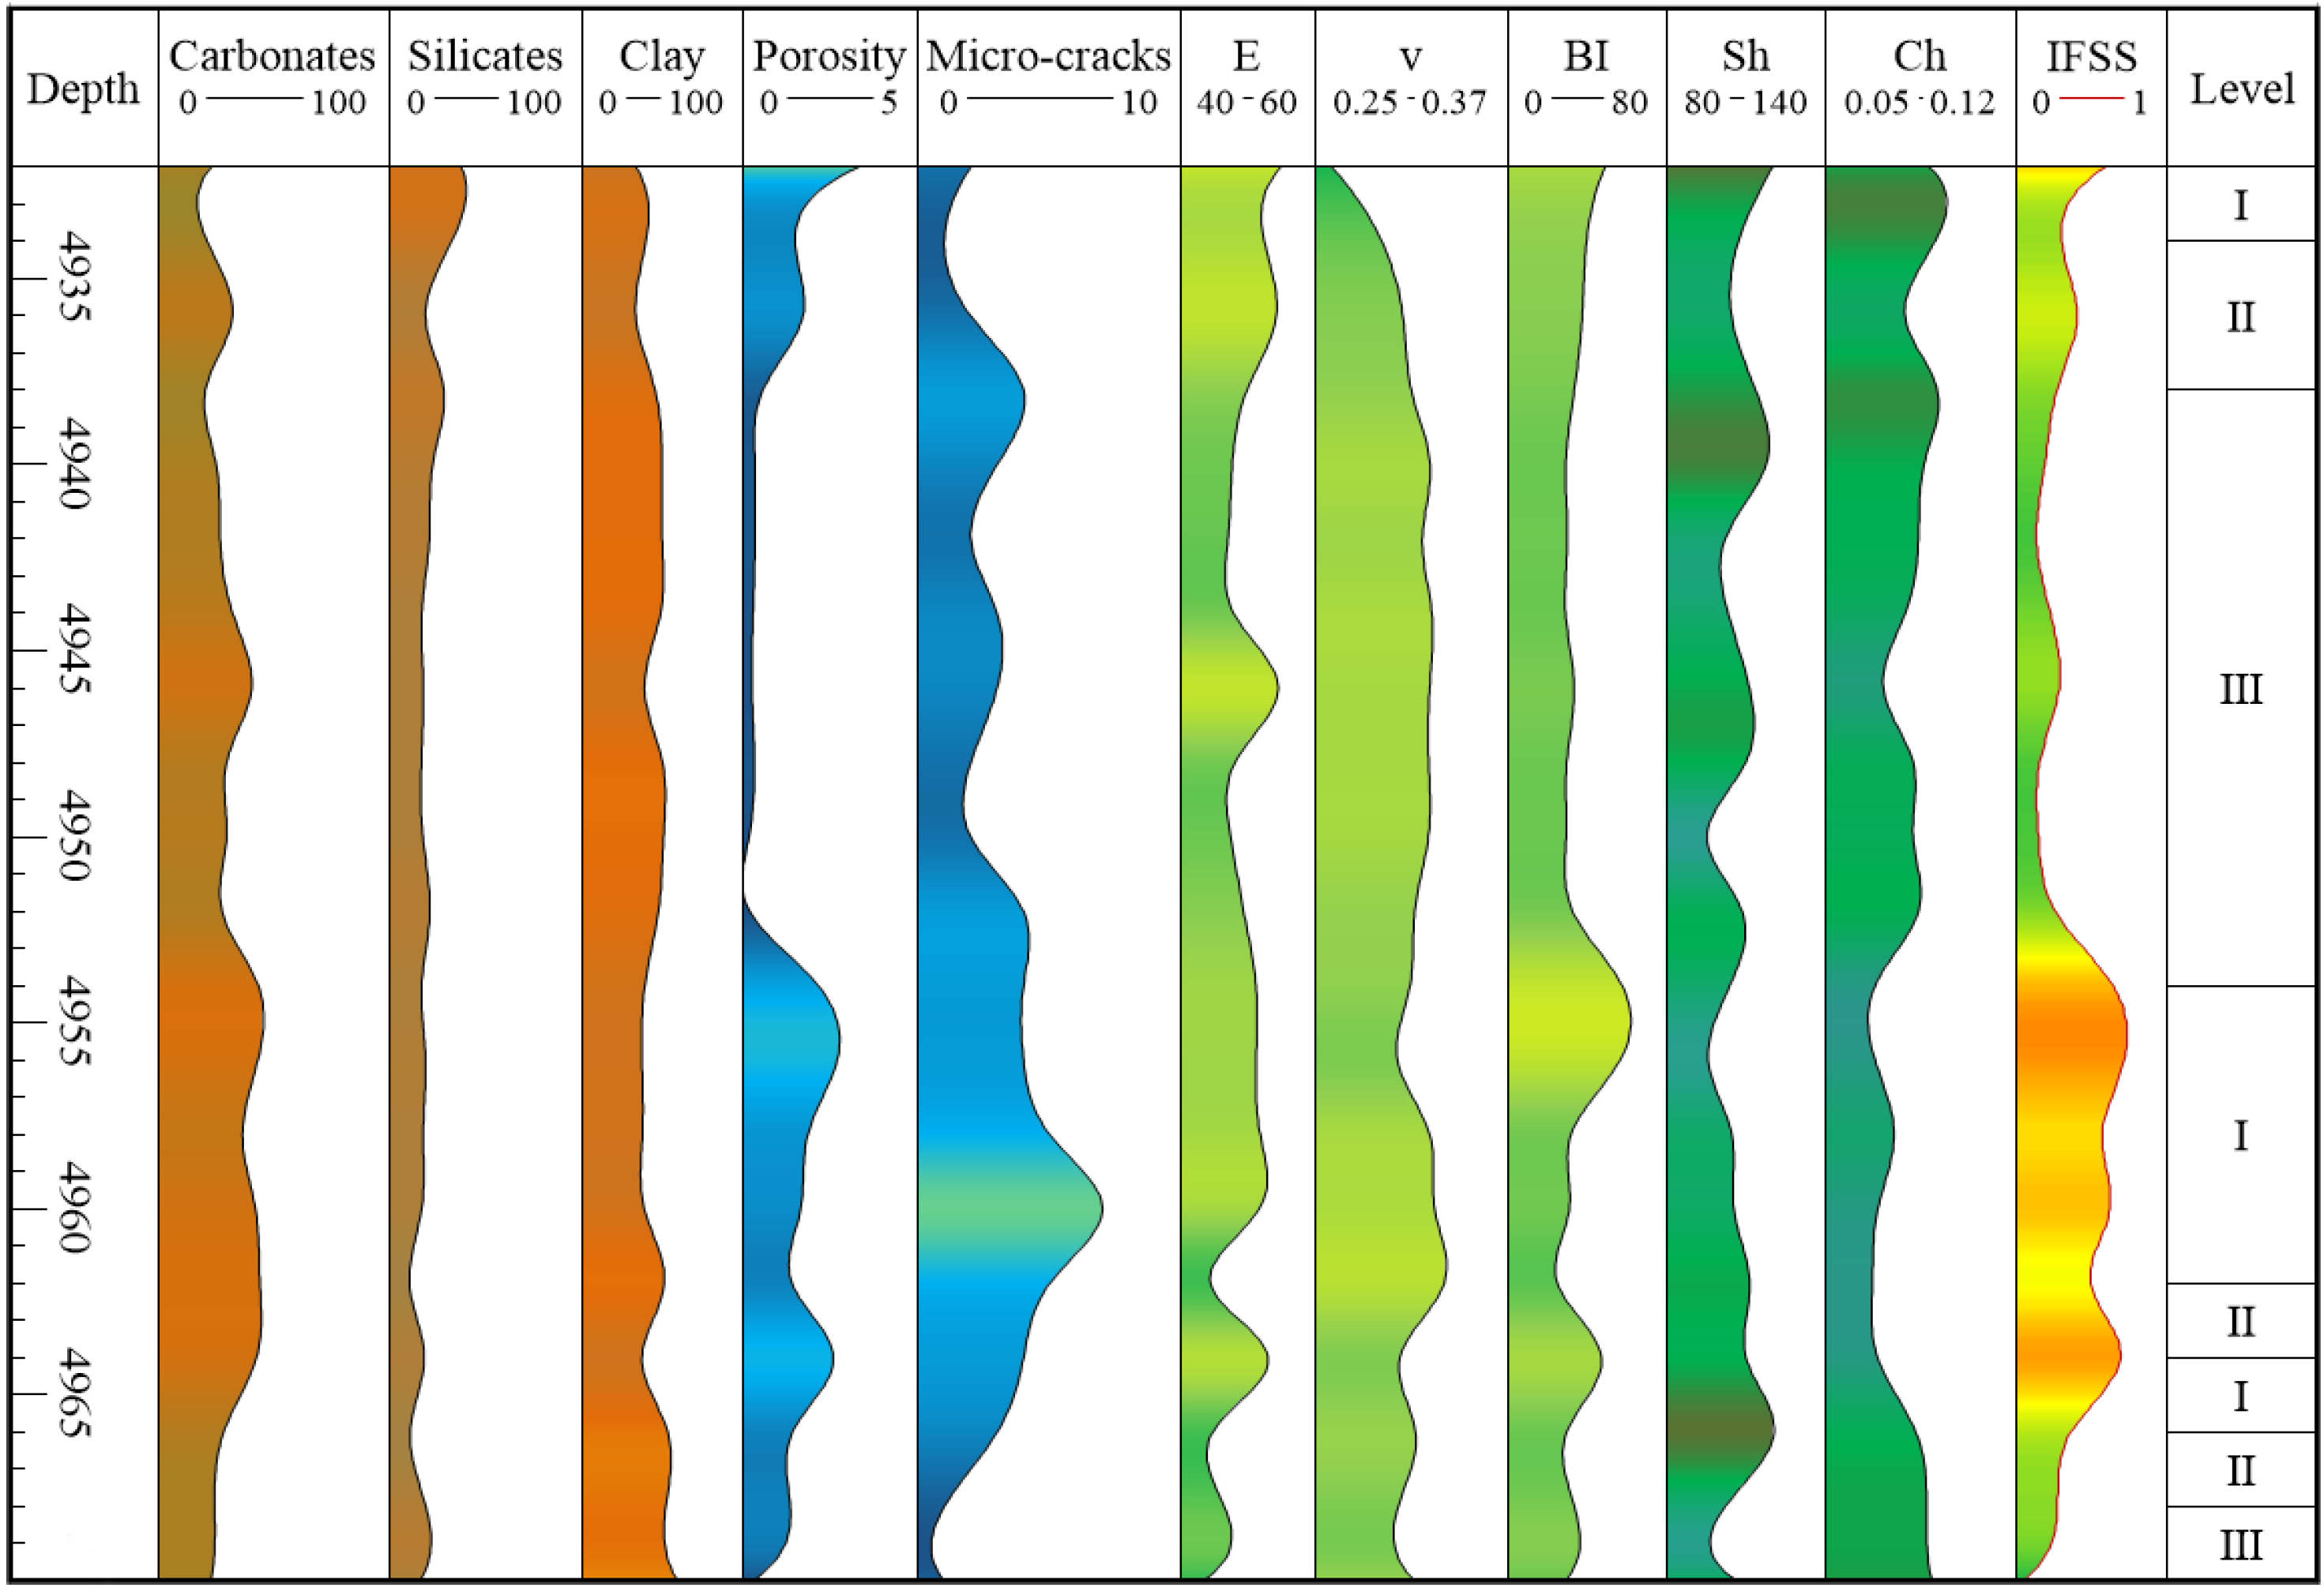
The fracture sweet spot index (IFSS) model was utilized to calculate the sweet spot index at the sampling depths of Well S1. The calculation results of the IFSS are shown in Table 5. A continuous profile of the IFSS was generated using the cubic spline interpolation method, and the resulting index profile is illustrated in Figure 9. According to the calculation results, the range of the fracturing sweet spot index of Well S1 is 0.045 to 0.712. According to the classification standard of the fracturing sweet spot index of deep carbonate reservoirs in the Yingzhong area, the IFSS corresponding to the depth of 4954 m~4964 m is relatively high, with an average value of 0.622, which belongs to the type I fracturing sweet spot layer section. Therefore, this interval is selected for perforation fracturing modification. The fracturing operation flow rate was 7 m3/min, with a total fluid inflow of 605 m3 and a total sand inflow of 45 m3, meeting the fracturing design requirements and the stimulation process went smoothly.
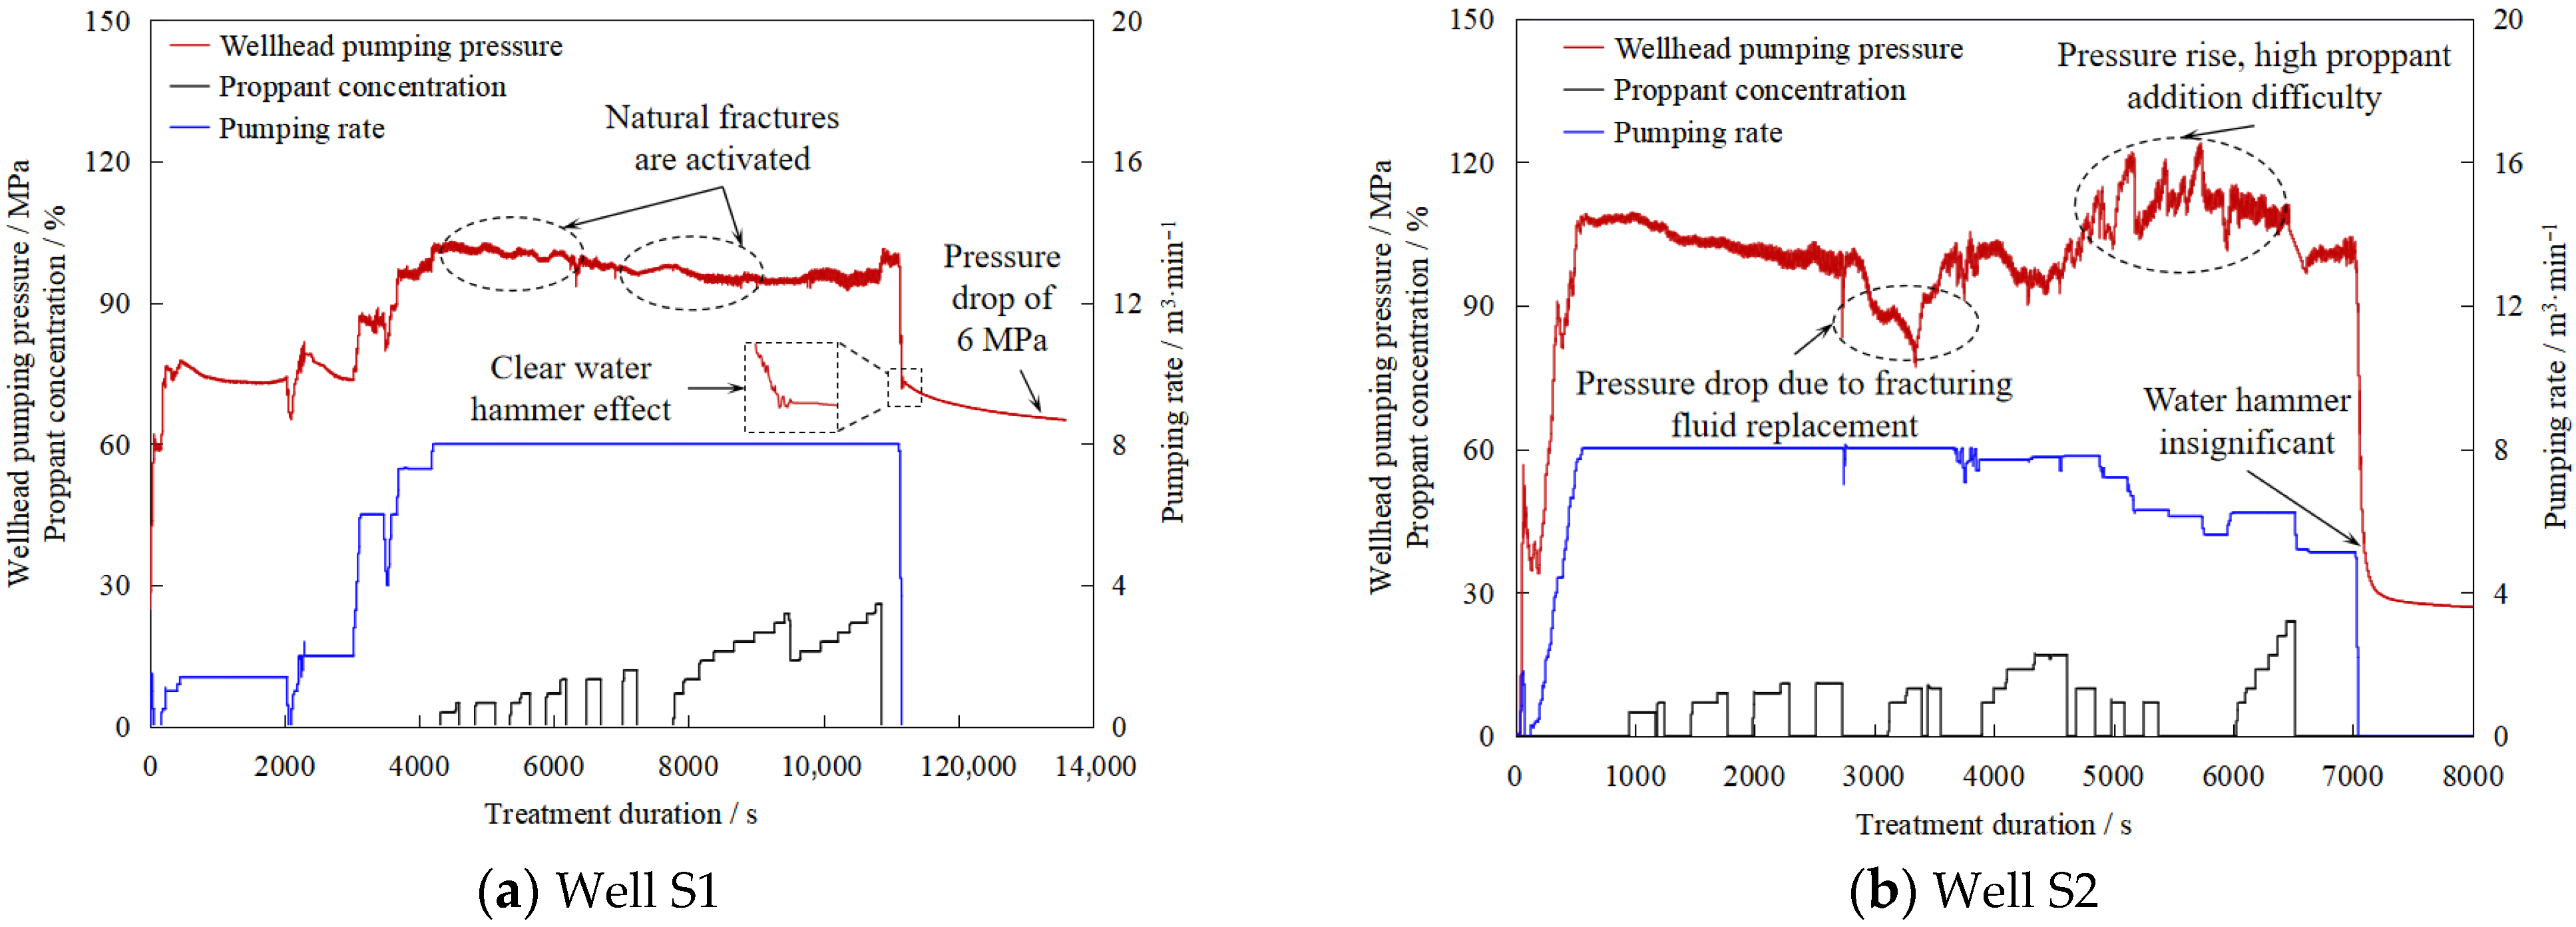
The adjacent well S2 at the same layer was selected as the control well. Well S2 had a total depth of 5330 m and was also in the E32 formation, with geostress gradients and pressure coefficients comparable to those of Well S1. Well S2 employed conventional methods for selecting fracturing intervals, i.e., choosing locations with high brittleness indices in well-interpreted logging sections as perforation zones. The brittleness index was calculated using a general logging regression empirical formula, which lacked reservoir specificity. Well S2 targeted the 5034–5046 m interval for fracturing, with a stimulation scale similar to that of Well S1. A comparison of the stimulation pressure curves for the two wells is shown in Figure 10. It can be observed that during the main proppant addition phase in Well S1, the stimulation pressure ranged from 95.4 to 103.5 MPa, averaging 97.5 MPa. Small fluctuations in the pressure curve might be attributed to the activation of natural fractures in the formation, while the pressure curve remained relatively stable during proppant addition, with the actual proppant volume reaching 100% of the designed amount. In Well S2, during proppant addition, the stimulation pressure ranged from 82.9 to 123.9 MPa, averaging 108.8 MPa, with frequent pressure fluctuations. Between 76 and 107 min of stimulation, the pressure showed an overall upward trend with intensified fluctuations, indicating difficulties in proppant addition and a risk of sand plugging in the formation [23,24]. The actual proppant volume added in Well S2 only reached 76% of the designed amount.
Comparing the pump shutdown phases of the two wells, Well S1 exhibited a significant water hammer effect upon instantaneous pump shutdown, with a pressure drop of 6 MPa after 30 min, indicating obvious pressure diffusion within the formation and suggesting high fracture network connectivity. In contrast, Well S2 showed no obvious water hammer effect upon instantaneous pump shutdown, with the pressure drop remaining essentially unchanged after shutdown, indicating poor conductivity of artificial fractures in the formation and a failure to form an effective reserve production zone. Compared to adjacent Well S2, Well S1 achieved an approximately 11.6% reduction in average stimulation pressure and a smooth stimulation process, effectively addressing issues such as high treatment pressure and difficulties in proppant addition in deep carbonate reservoirs.

4. Conclusions

(1)
In light of the characteristics of deep carbonate reservoirs in the Yingzhong Block of the Qaidam Basin, combined with automatic mineral identification scanning experiments, and considering the deep temperature-pressure coupling effect, a rock mechanics model based on mineral components is established. Upon verification, the correlation coefficient between the acoustic transit time calculated by the model and the actual logging acoustic transit time is 0.631, while the correlation coefficient for density is 0.817. The verification results demonstrate that this model can accurately characterize the mechanical and in situ stress properties of carbonate reservoirs under high-temperature and high-stress conditions, providing data support for the evaluation of formation fractionability.
(2)
The porosity and the number of micro-fractures in the scanning results are selected as the microscopic physical property indicators affecting the fracturing sweet spot, and the brittleness index and the bidirectional stress difference coefficient calculated by the rock mechanics model are selected as the macroscopic mechanical indicators. A multi-factor fusion fracturing sweet spot prediction model fracability considering reservoir physical properties, mechanical properties and stress states was established by using the TOPSIS-AHP joint algorithm, and the fracturing sweet spots of deep carbonate reservoirs were divided into three levels: IFSS ≥ 0.50 belongs to Class I desserts, 0.35 ≤ IFSS < 0.50 belongs to Class II desserts, and IFSS < 0.35 belongs to Class III desserts.
(3)
The formation evaluation technology based on the fracturing sweet spot index was successfully applied to the test oil Wells in the study work area. By using this method for fracturing section selection, the stimulation operation pressure was reduced by 11.6%, and the sand addition success rate was increased by 24%, effectively improving the fracturing effect of deep oil Wells. This research has positive guiding significance for the benefit development of deep carbonate reservoirs.

Author Contributions

Conceptualization, Y.L. and X.M.; methodology, H.Z.; software, G.R.; validation, H.M.; formal analysis, G.X.; investigation, X.F.; resources, W.Z.; data curation, F.L.; writing—original draft preparation, H.Z.; writing—review and editing, Y.L.; visualization, G.X.; supervision, X.M.; project administration, Y.L.; funding acquisition, Y.L. All authors have read and agreed to the published version of the manuscript.

Funding

This research received no external funding.

Data Availability Statement

The original contributions presented in this study are included in the article. Further inquiries can be directed to the corresponding author(s).

Conflicts of Interest

Authors Yong Liu, Guiqi Xie, Xinyuan Feng, Wenkai Zhao and Fengyu Lei were employed by the company PetroChina Qinghai Oilfield Company. Author Honglin Zheng was employed by the company SINOPEC Research Institute of Petroleum Engineering Co., Ltd. Author Guangcong Ren was employed by the company CNPC Engineering Technology R&D Company Limited. The remaining authors declare that the research was conducted in the absence of any commercial or financial relationships that could be construed as a potential conflict of interest.

References

  1. He, Z.L.; Ma, Y.S.; Zhu, D.Y.; Duan, T.Z.; Geng, J.H.; Zhang, J.T.; Ding, Q.; Qian, Y.X.; Wo, Y.J.; Gao, Z.Q. Theoretical and technological progress and research direction of deep and ultra-deep carbonate reservoirs. Oil Gas Geol. 2021, 42, 533–546. [Google Scholar] [CrossRef]
  2. Shao, X.P.; Guan, S.W.; Jin, J.Q.; Shen, Y.; Meng, Q.Y.; Wang, L.N.; Wang, P. Differences in structural characteristics and control factors of Yingxiong Range structural belt in the western Qaidam Basin. Pet. Geol. Recovery Effic. 2018, 25, 67–72. [Google Scholar] [CrossRef]
  3. Huang, J.L. Shale gas accumulation conditions and favorable zones of Silurian Longmaxi Formation in south Sichuan Basin, China. J. China Coal Soc. 2012, 37, 782–787. [Google Scholar]
  4. Li, H.Y.; Zhou, C.C.; Li, C.X.; Li, C.L.; Shi, Y.J.; Wang, C.S. Logging Evaluation and Application of Brittleness Index in Tight Sandstone Reservoir—A case study of Chang -7 tight sandstone reservoir in Longdong area of Ordos basin. Xinjiang Pet. Geol. 2014, 35, 593–597. [Google Scholar]
  5. Yang, H.W. Quantitative evaluation of shale fracability based on logging data. Fault-Block OilGas Field 2017, 24, 382–386. [Google Scholar]
  6. Zhai, W.B.; Li, J.; Zhou, Y.C.; Huang, T.; Song, X. New evaluation method of shale reservoir fracability based on logging data. Lithol. Reserv. 2018, 30, 112–123. [Google Scholar]
  7. Lin, Y.; Li, C.M.; Gu, W.; Luo, W.J.; Wang, Z.Y.; Yu, Z.; Zhang, J.; Bie, J.; Li, W.Q. Seismic fine characterization of deep carbonate fractured-vuggy reservoir: Case study of the 4th Member of Sinian Denying Formation in Anyue Gas Field, Sichuan Basin. Nat. Gas Geosci. 2020, 31, 1792–1801. [Google Scholar] [CrossRef]
  8. Feng, X.Y.; Zhang, C.J.; Xie, G.Q.; Guo, D.L.; Liu, Y. Evaluation techniques and applications of sweet spots in shale oil engineering in the Qaidam Basin. Nat. Gas Oil 2023, 41, 63–69. [Google Scholar]
  9. Zhu, J.Y.; Tan, Z.J.; Zhang, G.Q.; Li, D. A comprehensive lithology identification technology for the buried-hill reservoirs with complex lithology in the Bohai Sea. Oil Drill. Prod. Technol. 2018, 40, 62–65. [Google Scholar]
  10. Ashton, T.; Vinh Ly, C. Portable Technology Puts Real-time Automated Mineralogy On The Well Site. In Proceedings of the SPE Unconventional Resources Conference and Exhibition-Asia Pacific, Brisbane, Australia, 11–13 November 2013. [Google Scholar] [CrossRef]
  11. Oliver, G.; Spence, G.; Davis, A.; Stolyarov, S. Advanced cuttings analysis provides improved completion design, efficiency and well production. Unconv. Carbon Capture Storage 2016, 34, 69–76. [Google Scholar] [CrossRef]
  12. El Sherbeny, W.; Nuic, I.; Madkour, A. Significance of advanced cuttings evaluation (ACE) technologies for Chemostratigraphy purposes while drilling; technology overview & applications. In Proceedings of the SPE North Africa Technical Conference and Exhibition, Cairo, Egypt, 14–16 September 2015. [Google Scholar]
  13. Yang, G.; Zhang, S.; Zheng, H.; Tian, G. Analysis of Cuttings’ Minerals for Multistage Hydraulic Fracturing Optimization in Volcanic Rocks. ACS Omega 2020, 5, 14868–14878. [Google Scholar] [CrossRef]
  14. Duan, Y.T.; Feng, X.T.; Li, X. Study on the influence of mesomineral bands of shale on its macro failure Mode. Chin. J. Rock Mech. Eng. 2021, 40, 43–52. [Google Scholar] [CrossRef]
  15. Ly, C.V.; Oliver, G.M.; Spence, G.; Centurion, S.; Jackson, C.E.; Hearn, F.P.; Palomarez, V. Cross Correlation of Logging Data with SEM-Based Mineralogical and Textural Well Data: A New Tool for Optimized Completion Design. In Proceedings of the SPE Russian Oil and Gas Exploration & Production Technical Conference and Exhibition, Moscow, Russia, 14–16 October 2014. [Google Scholar] [CrossRef]
  16. Yang, W.; Wang, B.; Yao, J.; Jing, W.; Zhang, X. Experimental study on mechanical properties of carbonate rocks under real-time high temperature and heat treatment under triaxial compression. Chin. J. Rock Mech. Eng. 2024, 43, 1347–1358. [Google Scholar]
  17. Wang, J.B.; Feng, M.G.; Yan, W.; Liu, S. Influence factors and evaluation methods for shale reservoir fracability in Jiaoshiba Area. Fault-Block Oil Gas Field 2016, 2, 216–220. [Google Scholar]
  18. Zhang, M.L.; Zhang, J.P.; Tang, Z.Y.; Li, M.Q.; Xu, Y.M.; Luo, W.J.; Peng, Y.; Jiang, R. Preferential selection of favorable development areas of tight sandstone gas reservoir in the second Member of Xujiahe Formation in Anyue gas field of central Sichuan Basin. Fault-Block Oil Gas Field 2022, 29, 171–177. [Google Scholar]
  19. Zhang, J.; Liang, C. Application of TOPSIS Model Based on Gray Correlation Coefficient Matrix in the Evaluation of Water Environmental Quality. J. Sichuan Univ. 2009, 41, 97–101. [Google Scholar]
  20. Liu, Y.T.; Sun, B.L.; Yu, Y.S. Fuzzy recognition and quantitative calculation method for large pore channels. Oil Drill. Prod. Technol. 2003, 25, 054–059. [Google Scholar]
  21. Jin, X.; Shah, S.N.; Roegiers, J.C.; Zhang, B. An integrated petrophysics and geomechanics approach for fracability evaluation in shale reservoirs. SPE J. 2015, 20, 518–526. [Google Scholar] [CrossRef]
  22. Li, Z.H.; Deng, P.; Yang, C.H.; Guo, Y.T.; Hou, L.F. Study on mechanical properties and compressibility evaluation of carbonate reservoir. J. Guangxi Univ. 2019, 44, 1450–1460. [Google Scholar]
  23. Xiao, Z.H.; Liu, J.S.; Chen, Y.G. Analysis of Fracturing Operation Curve Characteristics and Their Applications. Pet. Geol. Eng. 2008, 22, 99–102. [Google Scholar]
  24. Huang, J.; Gong, Y.G.; Xu, Y.T.; Guo, B.M.; Zhang, B.K. The Application of G Function in Bohai Oilfield Frac-pack Treatment. Dffshore Oil 2019, 39, 57–61. [Google Scholar]
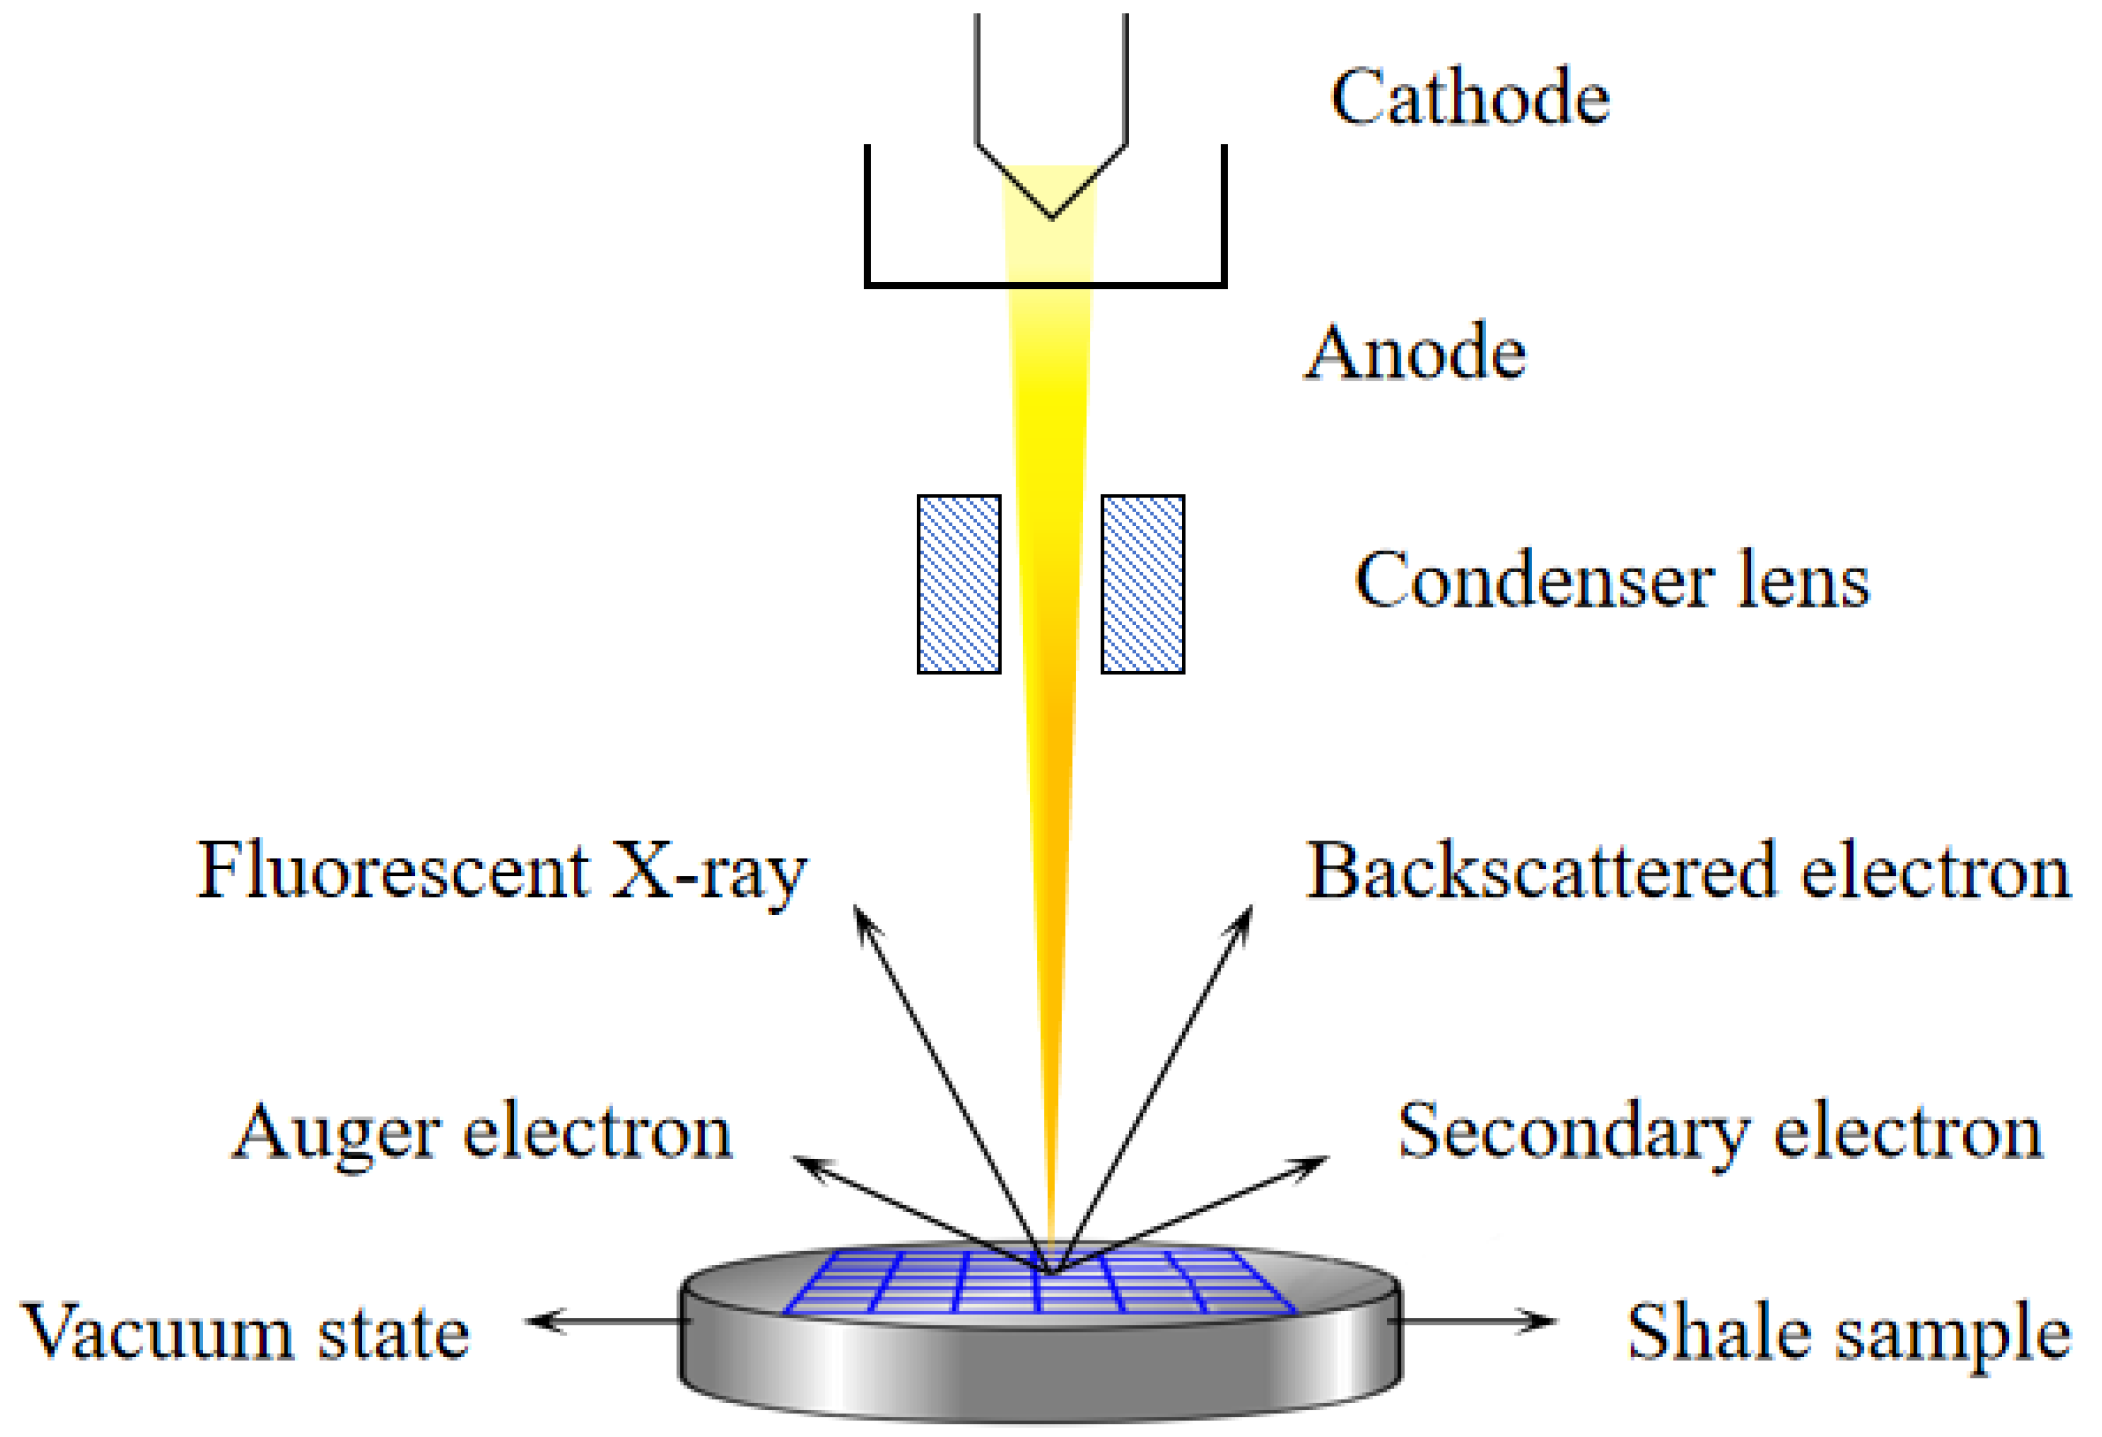
Figure 1. Schematic diagram of the working principle of a scanning electron microscope.
Processes 13 02777 g001
Figure 2. Physical diagram of production process of rock cutting scanning sample.
Processes 13 02777 g002
Figure 3. Calculation procedure for the macroscopic rock mechanics model.
Processes 13 02777 g003
Figure 4. Calculation results of fitting correlation between acoustic time difference and density curve. (a) Correlation coefficient of acoustic transit time = 0.631. (b) Correlation coefficient of density = 0.817.
Processes 13 02777 g004
Figure 5. Fracture sweet spot optimization workflow based on the integrated TOPSIS-AHP algorithm.
Processes 13 02777 g005
Figure 6. Coloring diagram of mineral composition at different depths at 4932–4970 m (sampling interval of 2 m) of well S1.
Processes 13 02777 g006
Figure 7. Variation of pore structure data of well S1 with depth.
Processes 13 02777 g007
Figure 8. Scan results for micro-fracture identification at 4958~4962 m.
Processes 13 02777 g008
Figure 9. The continuous profile of the IFSS obtained through cubic spline interpolation.
Processes 13 02777 g009
Figure 10. Comparison of stimulation curves between S1 and S2 wells.
Processes 13 02777 g010
Table 1. Key input parameters for rock mechanics calculation model.
Parameter NameParameter ValueUnit
Elastic modulus of quartz minerals Eq7.85 × 104MPa
Elastic modulus of calcite mineral Ec5.80 × 104MPa
Elastic modulus of feldspar minerals Ea4.5 × 104MPa
Percentage of quartz mineral content fq5.7~13.1%
Percentage of calcite mineral content fc16.0~25.3%
Percentage of plagioclase mineral content fa8.6~17.8%
Particle contact coefficient C9.0Dimensionless
Total porosity φ1.82%
Porosity of non-flowable fluids φs0.58%
Effective formation pressure peff54.9MPa
Rock stiffness tensor M0.82MPa
Density of pure rock ρm2.65g/cm3
Table 2. Weight scale for fracturing sweet spot influencing factors.
Influencing FactorsArithmetic Mean MethodGeometric Mean MethodEigenvalue MethodComprehensive Weight
Brittleness Index0.38550.38550.38560.3855
Pore-to-Surface Ratio0.27730.27740.27730.2773
Number of Micro-fractures0.19620.19610.19610.1961
Difference in Horizontal Biaxial Stresses0.14110.14090.1410 0.1410
Table 3. Data of various main mineral compositions and contents in the sampling well section of well S1.
Mineral ClassificationMain Mineral NamesMain Mineral Content Range (%)Average Value of
Major Minerals (%)
Total Average Value (%)
SilicatesQuartz5.2–18.78.9019.8
Potassium feldspar0.25–1.810.61
Plagioclase3.36–21.4010.31
CarbonatesCalcite16.8–37.626.8030.2
Dolomite0.05–3.921.00
Iron dolomite1.18–3.762.40
Clay mineralsImon mixed floor4.99–20.4211.6644.7
Illite3.99–17.2210.17
Calcareous clay14.33–33.8122.82
Kaolinite0–0.160.05
Accessory mineralsAnhydrite0.08–13.322.745.3
Hematite0–0.070.02
Pyrite0.37–1.030.63
Siderite0–0.110.03
Table 4. Summary of calculation results of rock mechanical parameters in sampling well section.
Value RangeE (GPa)vBI (%)σh (MPa)Ch
Max54.890.33048.89109.50.067
Min43.150.26125.06108.30.090
Average49.510.31133.03108.90.079
Table 5. Calculation results of dominant perforation index for S1 Well.
Depth
(m)
BI
(%)
Microcrack
/
Porosity (%)Ch
/
IFSSLevel
493248.8923.29960.088 0.590 I
493439.6311.49560.090 0.301 II
493637.4221.72160.079 0.401 II
493833.4540.58020.091 0.270 III
494029.2230.35510.086 0.188 III
494230.0120.35690.084 0.133 III
494429.1030.30390.079 0.225 III
494633.4430.27090.071 0.285 III
494829.6820.33760.082 0.154 III
495029.3620.18540.082 0.145 III
495232.6440.20890.084 0.259 III
495457.4942.16750.068 0.636 I
495656.4242.69790.068 0.712 I
495831.7951.85820.075 0.568 I
496030.9471.65630.069 0.619 I
496225.0651.41420.067 0.492 II
496447.1742.5940.069 0.687 I
496629.6731.42650.083 0.361 II
496833.4611.36090.087 0.273 III
497028.8310.28990.089 0.047 III
Disclaimer/Publisher’s Note: The statements, opinions and data contained in all publications are solely those of the individual author(s) and contributor(s) and not of MDPI and/or the editor(s). MDPI and/or the editor(s) disclaim responsibility for any injury to people or property resulting from any ideas, methods, instructions or products referred to in the content.