Article

Real-Time Joint Fault Detection and Diagnosis of Hexapod Robot Based on Improved Random Forest

1
Beijing Engineering Research Center of Industrial Spectrum Imaging, School of Automation and Electrical Engineering, University of Science and Technology Beijing, Beijing 100083, China
2
Key Laboratory of Knowledge Automation for Industrial Processes of Ministry of Education, School of Automation and Electrical Engineering, University of Science and Technology Beijing, Beijing 100083, China
*
Author to whom correspondence should be addressed.
Processes 2025, 13(9), 2762; https://doi.org/10.3390/pr13092762
Submission received: 8 July 2025 / Revised: 23 August 2025 / Accepted: 27 August 2025 / Published: 28 August 2025
(This article belongs to the Section Process Control and Monitoring)

Abstract

In the field of robotic fault detection, although the random forest (RF) algorithm is widely adopted, its limited accuracy remains a critical constraint in practical engineering applications. To address this technical challenge, this study proposes a Two-Stages Random Forest (TSRF) algorithm. This approach constructs a hierarchical architecture with a dynamic adaptive weighting strategy, where the class probability vectors generated in the 1st-stage serve as meta-features for the 2nd-stage classifier. Such hierarchical optimization enables the model to precisely identify fault-sensitive features, effectively overcoming the performance limitations of conventional single-model frameworks. To validate the proposed approach, we conducted comparative experiments using a multidimensional kinematic feature dataset from hexapod robot joint fault detection. Benchmark models included geometry-feature-based RF and physics-informed RF as established baselines. Experimental results demonstrate that TSRF achieves a classification accuracy of 99.7% on the test set, representing an 18.8% improvement over standard RF. This significant advancement provides a novel methodological framework for intelligent fault diagnosis in complex electromechanical systems.

1. Introduction

In recent years, robotics has been a key area of technological advancement and has been widely applied in many fields. With its ability to integrate perception, decision-making, and execution, robotics has become a core driving force behind industrial automation. This technology accelerates flexible manufacturing systems in smart factories by enhancing production efficiency, improving product quality, and reducing operational costs [1,2,3]. Within bio-inspired robotics, hexapod robots demonstrate exceptional terrain adaptability through biologically optimized multi-legged locomotion mechanisms, enabling deployment in complex scenarios including disaster response and industrial inspection [4,5,6,7]. Hexapod robots are prone to faults: they have numerous joints and complex movements, making their joint motors highly susceptible to faults. Faults can have severe consequences, and untimely fault diagnosis may compromise system integrity and lead to catastrophic outcomes [8,9]. Therefore, reliable fault detection is crucial to ensure the safe operation of hexapod robot systems.
Fault detection of hexapod robots is a key link to ensure system reliability. With the wide application of hexapod robots in complex environments, the accurate diagnosis of their hardware faults is of great significance to ensure their stable operation. The hardware fault detection techniques for hexapod robots are mainly divided into the following two categories: first, model-based methods, which drive the algorithm design by constructing physical and mathematical models to match the environment. For example, Isermann developed a model-based fault detection method by using input and output signals and applying dynamic process models [10]; Chen, Jie developed robust fault diagnosis of dynamic systems based on nonlinear and linear modeling [11]; Gertler’s system for fault diagnosis is based on principal component modeling [10,12]. However, these model-based methods cannot accurately model hexapod robots in complex scenarios. Secondly, machine-learning-based approaches are used to train optimization models using data-driven strategies, such as the neural network (NN)-based FDD system proposed by Umar Asif [13]. The “black-box” nature of neural networks [14,15] makes their decision-making logic difficult to explain, hindering engineers from quickly identifying fault origins, which is particularly critical for robot systems that require rapid maintenance. Antoine Cully’s deep reinforcement learning (DRL) is based on intelligent trial-and-error algorithms [16] and other machine learning. Methods like DRL are highly sensitive to environmental disturbances [17,18], such as uneven ground, leading to false positives or missed detections. Despite drawbacks such as poor interpretability, weak robustness, and the risk of missing new types of faults, data-driven methods have seen rapid development and gained significant attention in recent years.
Among them, the RF method is a representative type of machine learning. RF models have demonstrated significant potential and competitive performance in this field [19,20]. However, the traditional RF method exhibits low accuracy in such complex tasks. Poor accuracy is mainly attributed to two factors: sensitivity to feature redundancy and insufficient adaptability to class imbalance. The random subsampling method in RF may lead to highly correlated high-dimensional features and low-frequency features being ignored, resulting in blurred classification boundaries. Spatial–Geometric Random Forest (SGRF) frameworks have also made some breakthroughs in other fields; by enhancing physical features, accuracy can be improved to a certain extent. They are widely used in fields such as weather storm warnings [21], optical signals [22], and geological exploration [23]. However, experimental results in other fields show that the accuracy of the results is highly dependent on the physically enhanced features, and the physical enhancement process relies on expert experience. There are also some methods based on improved RF that are applied to image recognition [24], knowledge retrieval [25], and other fields, but these methods still have low accuracy in complex motion scenes.
To overcome the accuracy limitations of traditional RF models in complex motion scenarios, this study proposes a two-stages random forest (TSRF) method for fault detection in hexapod robots and optimizes the training and testing framework. The proposed method significantly improves fault detection accuracy. Experimental results on a hexapod robot dataset show that compared to Logistic Regression (LR), K-Nearest Neighbors (KNNs), and Decision Tree (DT)—three classical classification methods—and SGRF and the Random Forest Algorithm with Fusion of Physical Features (PFRF)—two traditional RF algorithms—the proposed TSRF method significantly improves the accuracy and robustness of classification tasks in complex scenarios.
The next section of this paper briefly introduces the traditional RF method; the third section introduces the proposed TSRF method; the fourth section verifies the performance of the proposed method using hexapod robot data; and the fifth section summarizes the entire paper.

2. The Traditional Random Forest Framework for Fault Detection in Hexapod Robots

2.1. Random Forest Algorithm for Spatial Geometric Features (SGRF)

RF algorithms are extensively employed in robotic fault detection due to their robust ensemble architecture. This methodology constructs multiple decorrelated decision trees through bootstrap sampling and randomized feature selection. Each tree independently performs classification using Gini impurity minimization criteria, with final predictions determined by majority voting across the ensemble [26,27]. For a node T containing N t samples with C classes, the Gini impurity G ( T ) is defined as:
G ( T ) = 1 c = 1 C p c 2
Here, p c represents the proportion of samples belonging to class c in node T. Lower values indicate higher node purity. This ensemble mechanism enhances generalization capability while mitigating overfitting risks—particularly valuable for diagnosing complex electromechanical faults under noisy operational conditions, where traditional single-model approaches often fail [28].

2.2. Random Forest Algorithm with Fusion of Physical Features (PFRF)

To address the issue of limited classification performance in the fault detection system of hexapod robots due to insufficient feature dimensions, traditional optimization strategies have focused on integrating new physical features to enhance physical feature representation. In hexapod robots, three typical physical features can be introduced: (1) joint dynamic parameters; (2) kinematic coupling features; (3) terrain interaction descriptors. Specific physical features are shown in Table 1. Among them, X, Y, and Z are the displacement data of the robot center. slop(x) is the slope relative to the x-axis.
The RF method enhanced with physical features has improved the classification accuracy of the RF model to a certain extent.

3. Two-Stages Random Forest (TSRF)

To address the issue of poor accuracy when applying traditional RF methods directly to fault detection in hexapod robots, this paper proposes a two-stages random forest algorithm and optimizes the training and testing framework. The following sections provide a detailed introduction to the optimized training and testing processes.

3.1. Training Process

The core of the two-stages random forest algorithm lies in decomposing the classification training task into two stages: First, let the input sample set be X = { x i } i = 1 N and the label set Y = { y i } i = 1 N . The RF in the 1st stage generates a multidimensional probability distribution vector as a feature, which is used as one of the input features for the RF in the 2nd stage. The probability distribution vector is calculated using Equation (2):
Stage-1 RF constructs a decision tree containing by sampling the output category probability distribution:
P 1 ( y   |   x i ) = 1 T t = 1 T I ( ϕ t ( x i ) = y )
where ϕ t ( x i ) denotes the prediction result of the first tree, and I is the schematic function [29].
In the 2nd-stage RF, the probability distribution vector is first embedded into the original data for enhancement, as shown in Equation (3). The new enhanced set data X en is used as input for the 2nd-stage RF.
X en ( i ) = x i P 1 ( y | x i ) R d + C
where d is the dimension of the original features, and C is the number of categories.
The loss function L of the 2nd-stage RF t is calculated using Equation (4).
L = i = 1 N w i c = 1 C I ( y i = c ) log P 2 ( y = c | X en ( i ) )
The initialization of weight w is calculated using Equation (5).
w i = 1 + H P ( y | x i ) , H ( P ) = c = 1 C P ( c ) log P ( c )
The output results of the 2nd-stage RF are used to dynamically adjust the number of samples and the weighted random weights of the 2nd-stage RF through a feedback mechanism.
The feedback adjustment strategy for repeated sampling is as follows: the feedback mechanism defines classification errors in the 2nd-stage as negative feedback signals and updates the sampling probability p using exponential weighting, as shown in Equation (6).
p i ( sample ) exp α ϵ i , α R +
  α controls the feedback strength, and the error samples are selected preferentially in the next iteration.
The feedback adjustment strategy for weight w is as follows: the probability distribution vector is recalculated using Equation (2), based on the results of the two-stages RF, and then weight w is updated and adjusted using Equation (5).
After the feedback update is complete, start a new round of training and repeat until the optimal training results are achieved and training is complete.

3.2. Testing Process

Use the final training model parameters (sampling probability p and two-stages RF weight w ) as the test model parameters.
A Confidence test module has been added between stages one and two of the testing process. This module uses a threshold to determine whether to proceed to the 2nd stage of the RF process, as shown in Equation (7).
θ = inf t [ 0 , 1 ]   | t 1 K max P 1 ( y | x val ( j ) ) d x β
θ is calculated using kernel density estimation (KDE) of the probability distribution of the training set, as shown in Equation (8).
y ^ i = arg max c P 1 ( y = c | x i ) , if   max P 1 ( y | x i ) > θ arg max c P 2 ( y = c | X enhanced ( i ) ) , otherwise
If the result is greater than θ , then proceed directly to fault decision-making; if the result is less than θ , then proceed to the 2nd stage of RF discrimination.
The overall framework of the proposed method is shown in Figure 1 below.

4. Experiment

4.1. Datasets

This section analyzes a multidimensional motion dataset for single-joint fault detection in hexapod robots. The fault in the dataset is a joint motor fault, which is introduced by manually controlling the motor to pause its operation. The data in the dataset is described as follows:
Label: Indicates the state of the joints, with −1 representing all joints being fault-free, 0 for the first joint fault, 1 for the second joint fault, and so on up to 17.
X, Y, Z: Positional data of the robot center.
slop(x): Slope with respect to the x-axis.
slop(x/z): Slope with respect to the x-axis divided by the z-axis.
slop(1/z): Slope with respect to the reciprocal of the z-axis.
slop(1/x): Slope with respect to the reciprocal of the x-axis.
slop(z/x): Slope with respect to the z-axis divided by the x-axis.
slop(z): Slope with respect to the z-axis.
The number of normal data and eighteen joint fault data in the dataset is close, and there is no class imbalance issue. The dataset is randomly divided into a training set and a test set at a ratio of 4:1. The training set was used to train the classification model, and the test set was used to evaluate the outward prediction ability of the model. The dataset was also subjected to standard normalization to limit the data range to [−1, 1] to eliminate the effect of magnitude between features.
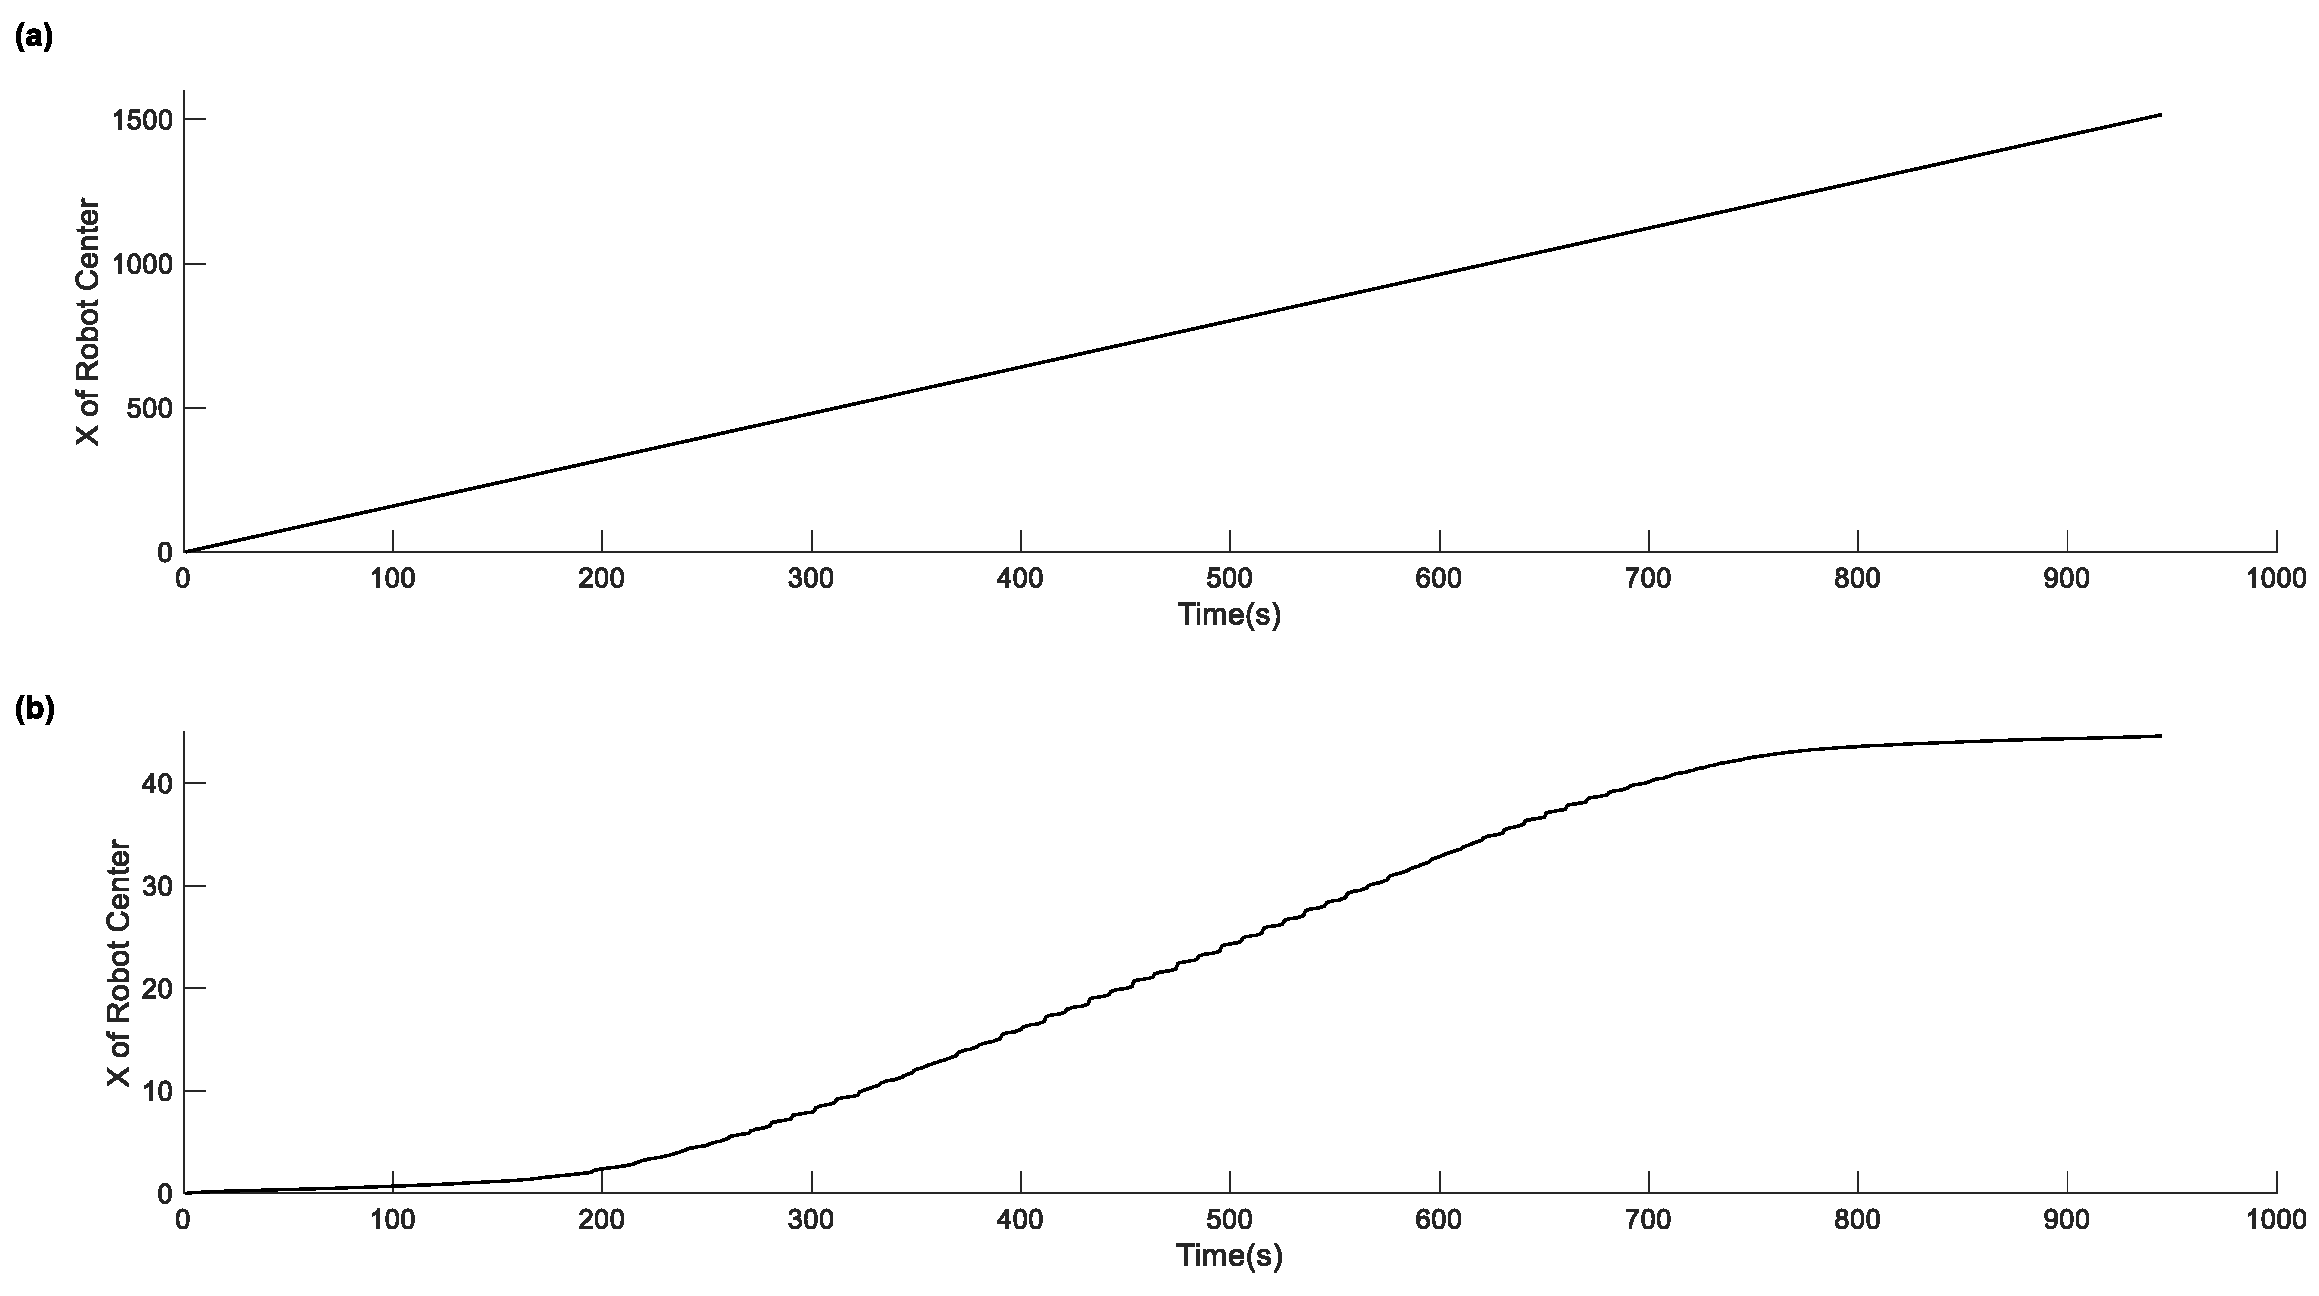
In the dataset used in this paper, samples data of the same fault type were at 1 s intervals. For example, the X data image of the normal type and the X coordinate data image labeled as 15 demonstrate the continuous sampling of a certain feature, as shown in Figure 2. However, it should be noted that our input vector is a nine-dimensional feature at a specific moment, rather than the continuous sampling of a single feature.

4.2. Comparative Experiment Setting

This study establishes a comprehensive comparative evaluation framework for single-joint fault detection in hexapod robots. Five machine learning models with distinct feature representation capabilities were selected for benchmarking against the proposed TSRF algorithm:
  • LR;
  • KNN;
  • DT;
  • SGRF;
  • PFRF;
The metrics used—accuracy, specificity, and sensitivity—are calculated as follows.
A ccuracy = T P + T N T P + T N + F P + F N
S p e c i f i c i t y = T N T N + F P
Sensitivity = T P T P + F N
TP—True Positive; FN—False Negative; TN—True Negative; FP—False Positive.

4.3. Results and Discussion

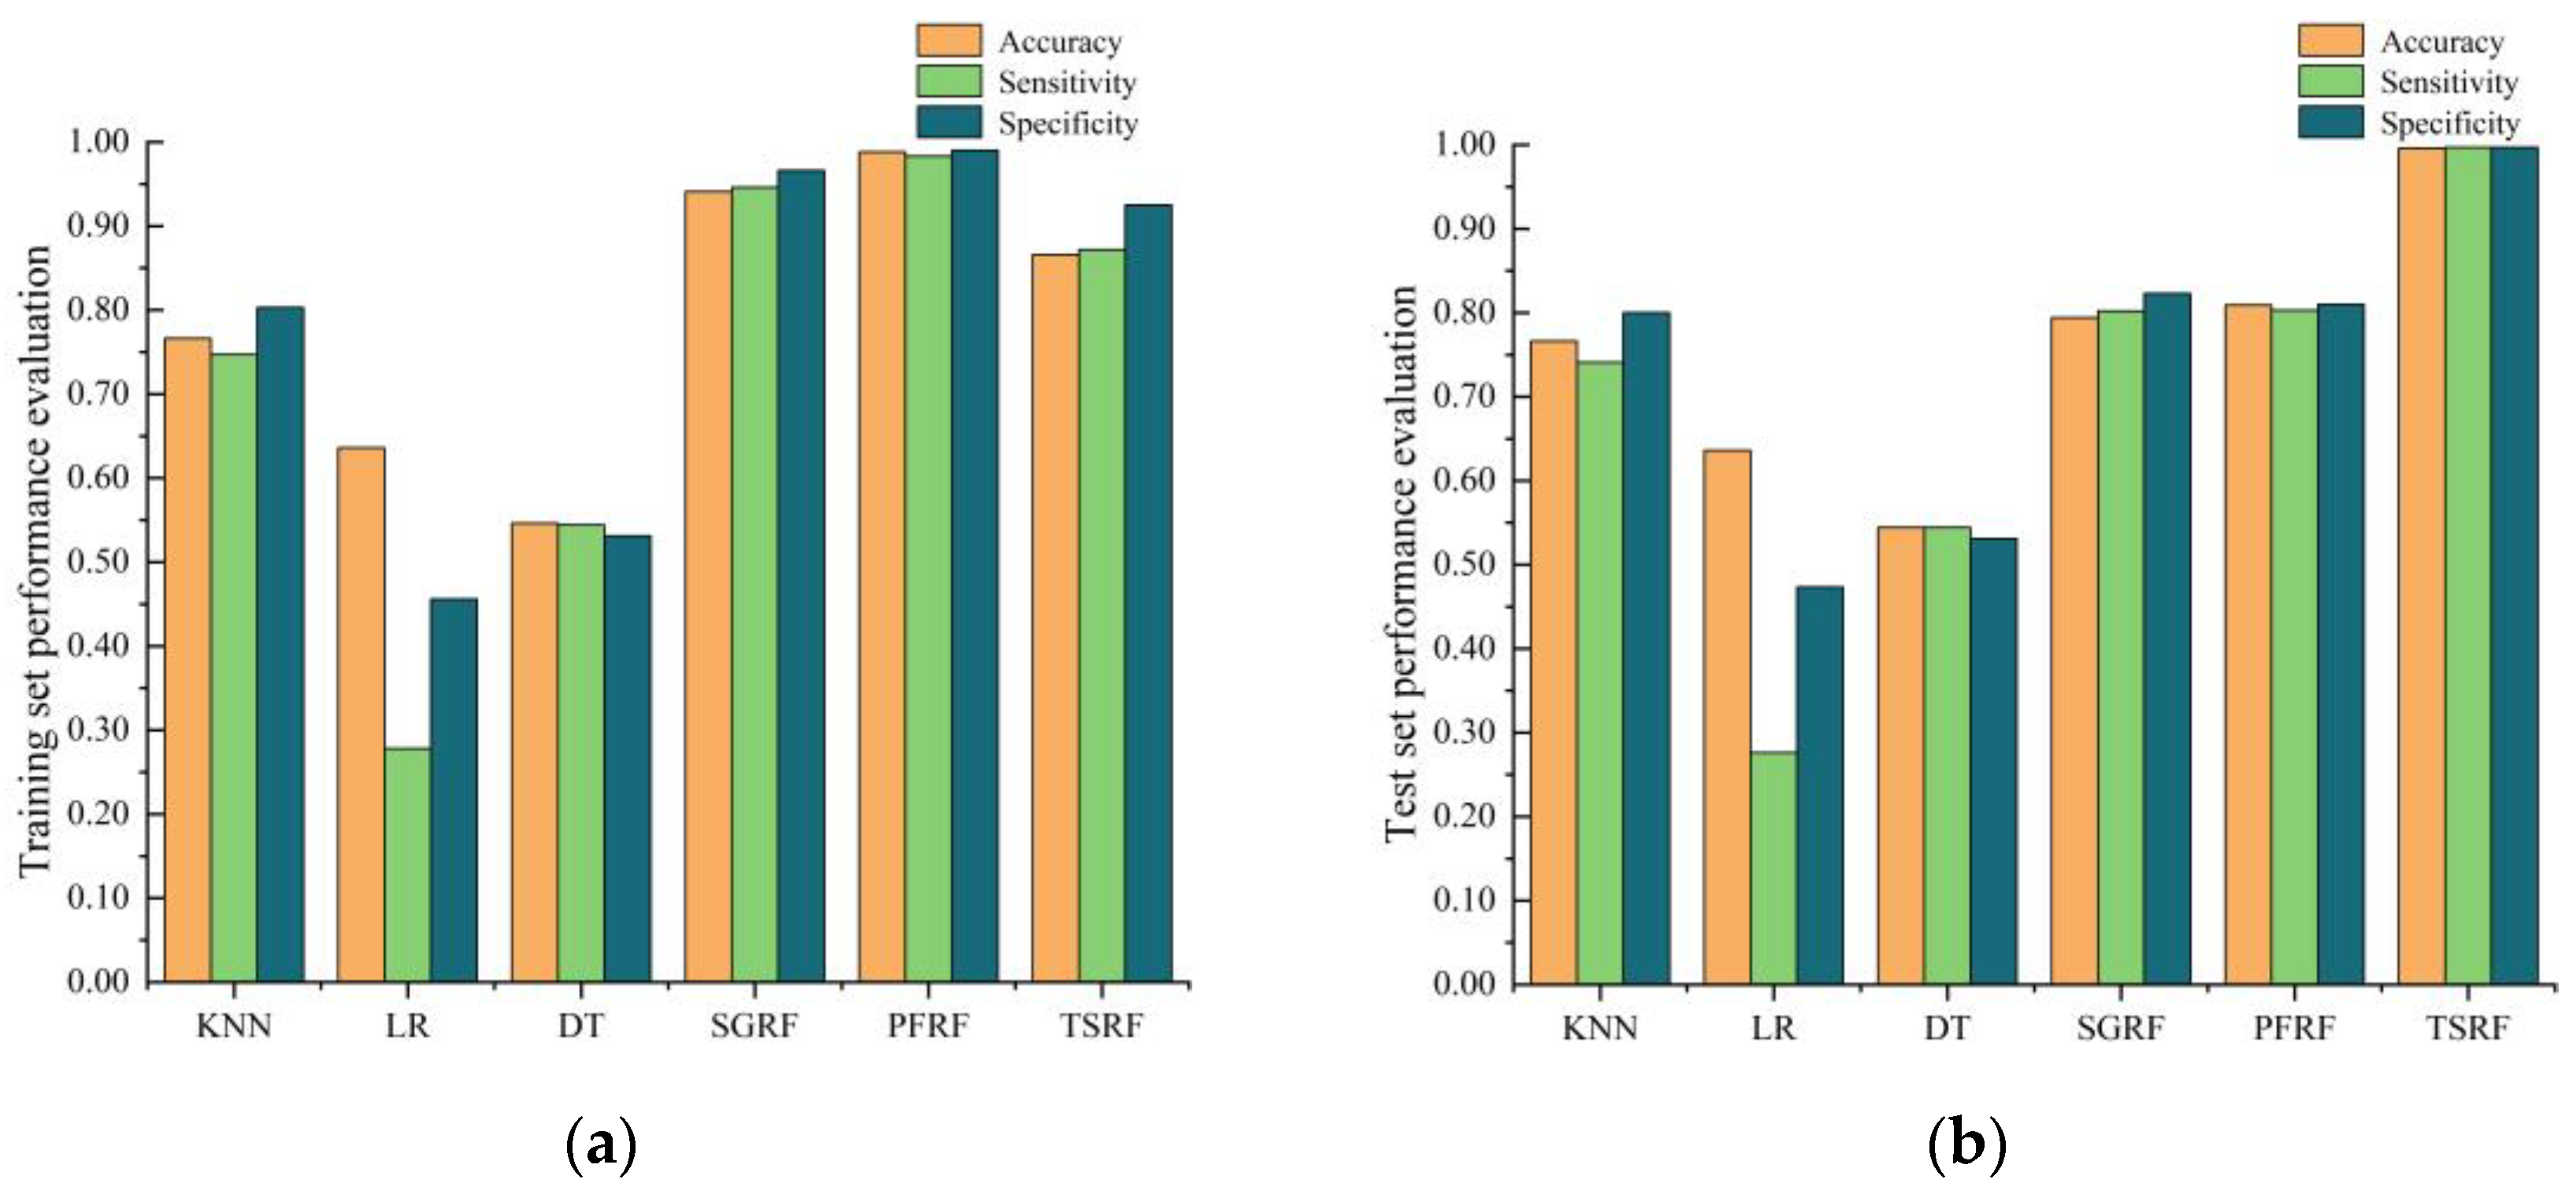
As demonstrated in Figure 3 (training set) and Figure 3b (test set)—the specific training data and test data are shown in Table 2 and Table 3—this study systematically compares six machine learning models in complex locomotion coupling tasks. The results show that traditional machine learning models have significant limitations: The accuracy of the KNN algorithm on the test set (80.0%) decreased by 6.2 percentage points compared to the training set, indicating that it is sensitive to localized features. LR, due to the inherent flaws of modeling nonlinear feature interactions, experienced a significant decrease of 16.3 percentage points in the test set compared to the training set, which highlighted the generalization limitations of the linear model in this type of task. DT performed well in terms of training test stability, but its maximum test accuracy was only 53.1%, which indicates that the single-tree structure has insufficient feature expression capability. In contrast, the performance of the integrated models shows differences. SGRF achieves 96.65% accuracy on the training set but drops to 79.4% on the test set, with 14.25 percentage points of performance degradation attributed to flaws in the feature selection mechanism. PFRF slightly improves the test set accuracy to 80.8% by expanding the feature dimensions but still falls short of the accuracy requirements for hexapod robot application scenarios. Notably, TSRF significantly improves the test set accuracy to 99.7%, with a training set accuracy of 86.6%, and the false detection rate decreases by 8%, which meets the engineering requirements for fault detection in hexapod robots. This result shows that the TSRF model effectively overcomes the limitations of the previous models in terms of feature representation, generalization ability, and accuracy, and is suitable for this complex task.
As shown in Figure 4a,b, this study further analyzes the classification accuracy of fault diagnosis for each joint of the hexapod robot. In the training phase, the SGRF method has an accuracy of more than 94% for all joints, except joint 0 (accuracy: 86.3%), while the PFRF method has an accuracy of more than 95% for all joints trained after feature enhancement. However, both methods showed significant performance decay in the test set, with the combined joint accuracy dropping to 78%. Notably, the TSRF method proposed in this study has relatively weak performance in the training set (with significant accuracy depressions in joints 0/3/9/14/17), but its test set performance shows essential improvement: the accuracy of most joints exceeds 95%, and the combined accuracy reaches 96%. This result confirms that TSRF effectively overcomes the overfitting problem through parameter optimization and regularization in the training phase, and finally forms a fault detection model with high generalization ability.

5. Conclusions

The TSRF architecture has achieved a major breakthrough in classification performance. Experimental results show that the model has improved classification accuracy to 99.7%, representing increases of 19.7%, 36.1%, and 46.6%, respectively, compared to traditional models (KNN, LR, DT), and by 20.3% and 18.7% compared to SGRF and PFRF, respectively, meeting the engineering standards for fault detection in hexapod robots. TSRF optimizes training and testing model parameters, introducing confidence into the testing model to generate high-confidence predictions, thereby reducing the risk of overfitting. However, the TSRF method has not yet been validated for its generalization capability in extreme class imbalance scenarios. Additionally, real-time deployment relies on hardware acceleration support. While significant breakthroughs have been achieved in classification accuracy, further optimization of the model structure is needed to enhance computational efficiency.

Author Contributions

Conceptualization, Q.F. and Y.L.; Methodology, Q.F., Y.M. and Y.L.; Software, Q.F., K.Z., M.Y. and Y.L.; Validation, Q.F., Y.M., M.Y. and Y.L.; Formal analysis, Q.F., Y.M., K.Z., M.Y. and Y.L.; Investigation, Y.L.; Resources, Q.F. and Y.L.; Data curation, Q.F., Y.M., K.Z. and Y.L.; Writing – original draft, Q.F. and Y.L.; Writing – review & editing, Q.F., Y.M., M.Y. and Y.L.; Supervision, Y.L.; Project administration, Y.L.; Funding acquisition, Y.L. All authors have read and agreed to the published version of the manuscript.

Funding

The authors acknowledge the support from the National Key Research and Development Program of China (2024YFC3015200), National Natural Science Foundation of China Program (62105020), Shenzhen Science and Technology Program (KJZD20230923114310021), and Fundamental Research Funds for the Central Universities (00007753).

Data Availability Statement

Data underlying the results presented in this paper are not publicly available at this time but may be obtained from the authors upon reasonable request.

Conflicts of Interest

The authors declare no conflicts of interest.

References

  1. Ono, K.; Hayashi, T.; Fujii, M.; Shibasaki, N.; Sonehara, M. Development for industrial robotics applications. IHI Eng. Rev. 2009, 42, 103–107. [Google Scholar]
  2. Li, G.; Luo, Y. Industrial Robots’ Application in Processing Production Line of Mechanical Parts. J. Phys. Conf. Ser. 2019, 1176, 052051. [Google Scholar] [CrossRef]
  3. Song, Q.; Zhao, Q. Recent advances in robotics and intelligent robots applications. Appl. Sci. 2024, 14, 4279. [Google Scholar] [CrossRef]
  4. Cong, Q.; Shi, X.; Xiong, Y.; Wang, J.; Yang, Z.; Tian, W. A novel bionic gripper based on the front tarsi of scutigers. Trans. Can. Soc. Mech. Eng. 2022, 46, 427–435. [Google Scholar] [CrossRef]
  5. Pan, Y.; Fan, J.; Liu, G.; Liu, Y.; Zhao, J. Design and hydrodynamic analysis of controllable soft-body extension-driven flippers inspired by swimming frog flippers. Eng. Appl. Comput. Fluid Mech. 2024, 18, 2342504. [Google Scholar] [CrossRef]
  6. Mar-Castro, E.; May-Rodríguez, S.A.; Núñez-Cruz, R.S.; Antonio-Yañez, E.D.; Aparicio-Lastiri, L.M.; Herrera-Vidal, J. Development of a Vertical Submerging and Emerging Bat-Ray-Inspired Underwater Vehicle. Biomimetics 2024, 9, 582. [Google Scholar] [CrossRef]
  7. Lee, J.H.; Michelis, M.Y.; Katzschmann, R.; Manchester, Z. Aquarium: A fully differentiable fluid-structure interaction solver for robotics applications. In Proceedings of the 2023 IEEE International Conference on Robotics and Automation (ICRA), London, UK, 29 May–2 June 2023; pp. 11272–11279. [Google Scholar]
  8. Zhang, C.; Chen, B.; Li, X. Fuzzy Failure Modes, Effect and Criticality Analysis on Electromechanical Actuators. Actuators 2024, 13, 510. [Google Scholar] [CrossRef]
  9. Gao, G.B.; Wang, J.S.; Yue, W.H.; Peng, J.H. Fault Diagnosis and Maintain of Manufacturing Equipment Based on Vulnerability. J. Mech. Eng. 2020, 56, 141–149. [Google Scholar]
  10. Isermann, R. Model-based fault-detection and diagnosis–status and applications. Annu. Rev. Control 2005, 29, 71–85. [Google Scholar] [CrossRef]
  11. Chen, J.; Patton, R.J. Robust Model-Based Fault Diagnosis for Dynamic Systems; Springer Science & Business Media: Heidelberg, Germany, 2012; Volume 3. [Google Scholar]
  12. Gertler, J. Fault Detection and Diagnosis in Engineering Systems; CRC Press: Boca Raton, FL, USA, 2017. [Google Scholar]
  13. Asif, U. Improving the navigability of a hexapod robot using a fault-tolerant adaptive gait. Int. J. Adv. Robot. Syst. 2012, 9, 34. [Google Scholar] [CrossRef]
  14. Szegedy, C.; Zaremba, W.; Sutskever, I.; Bruna, J.; Erhan, D.; Goodfellow, I.; Fergus, R. Intriguing properties of neural networks. arXiv 2013, arXiv:1312.6199. [Google Scholar]
  15. Dobson, J.E. On reading and interpreting black box deep neural networks. Int. J. Digit. Humanit. 2023, 5, 431–449. [Google Scholar] [CrossRef]
  16. Zhang, G.; Liu, H.; Qin, Z.; Moiseev, G.V.; Huo, J. Research on self-recovery control algorithm of quadruped robot fall based on reinforcement learning. Actuators 2023, 12, 110. [Google Scholar] [CrossRef]
  17. Mehta, D.; Salvi, A.; Krovi, V. Rough terrain path tracking of an ackermann steered platform using hybrid deep reinforcement learning. In Proceedings of the 2024 IEEE International Conference on Advanced Intelligent Mechatronics (AIM), Boston, MA, USA, 15–19 July 2024; pp. 685–690. [Google Scholar]
  18. Zhu, J.; Wei, Y.; Kang, Y.; Jiang, X.; Dullerud, G.E. Adaptive deep reinforcement learning for non-stationary environments. Sci. China Inf. Sci. 2022, 65, 202204. [Google Scholar] [CrossRef]
  19. Yang, B.-S.; Di, X.; Han, T. Random forests classifier for machine fault diagnosis. J. Mech. Sci. Technol. 2008, 22, 1716–1725. [Google Scholar] [CrossRef]
  20. Ma, S.; Chen, M.; Wu, J.; Wang, Y.; Jia, B.; Jiang, Y. Intelligent fault diagnosis of HVCB with feature space optimization-based random forest. Sensors 2018, 18, 1221. [Google Scholar] [CrossRef]
  21. Yang, C.; Yuan, H.; Zhang, F.; Xie, M.; Wang, Y.; Jiang, G.M. Convective initiation nowcasting in South China using physics-augmented random forest models and geostationary satellites. Earth Space Sci. 2024, 11, e2024EA003571. [Google Scholar] [CrossRef]
  22. Seifert, S. Application of random forest based approaches to surface-enhanced Raman scattering data. Sci. Rep. 2020, 10, 5436. [Google Scholar] [CrossRef] [PubMed]
  23. Wang, H.X.; Feng, S.Y.; Liu, Z.L. Geological structure recognition model based on improved random forest algorithm. Coal Sci. Technol. 2023, 51, 149–156. [Google Scholar]
  24. Xu, B.; Ye, Y.; Nie, L. An improved random forest classifier for image classification. In Proceedings of the 2012 IEEE international Conference on Information and Automation, Seoul, Republic of Korea, 20–24 August 2012; pp. 795–800. [Google Scholar]
  25. Xu, B.; Guo, X.; Ye, Y.; Cheng, J. An improved random forest classifier for text categorization. J. Comput. 2012, 7, 2913–2920. [Google Scholar] [CrossRef]
  26. Scornet, E.; Biau, G.; Vert, J.-P. Consistency of random forests. Ann. Statist. 2015, 43, 1716–1741. [Google Scholar] [CrossRef]
  27. Scornet, E. On the asymptotics of random forests. J. Multivar. Anal. 2016, 146, 72–83. [Google Scholar] [CrossRef]
  28. Mousaei, A.; Naderi, Y.; Mekhilef, S.; Golestan, S.; Iqbal, A. Optimal Placement of Electric Vehicle Charging Stations Using Machine Learning: A Comprehensive Review; SSRN: Rochester, NY, USA, 2025. [Google Scholar]
  29. Mousaei, A.; Naderi, Y.; Bayram, I.S. Advancing state of charge management in electric vehicles with machine learning: A technological review. IEEE Access 2024, 12, 43255–43283. [Google Scholar] [CrossRef]
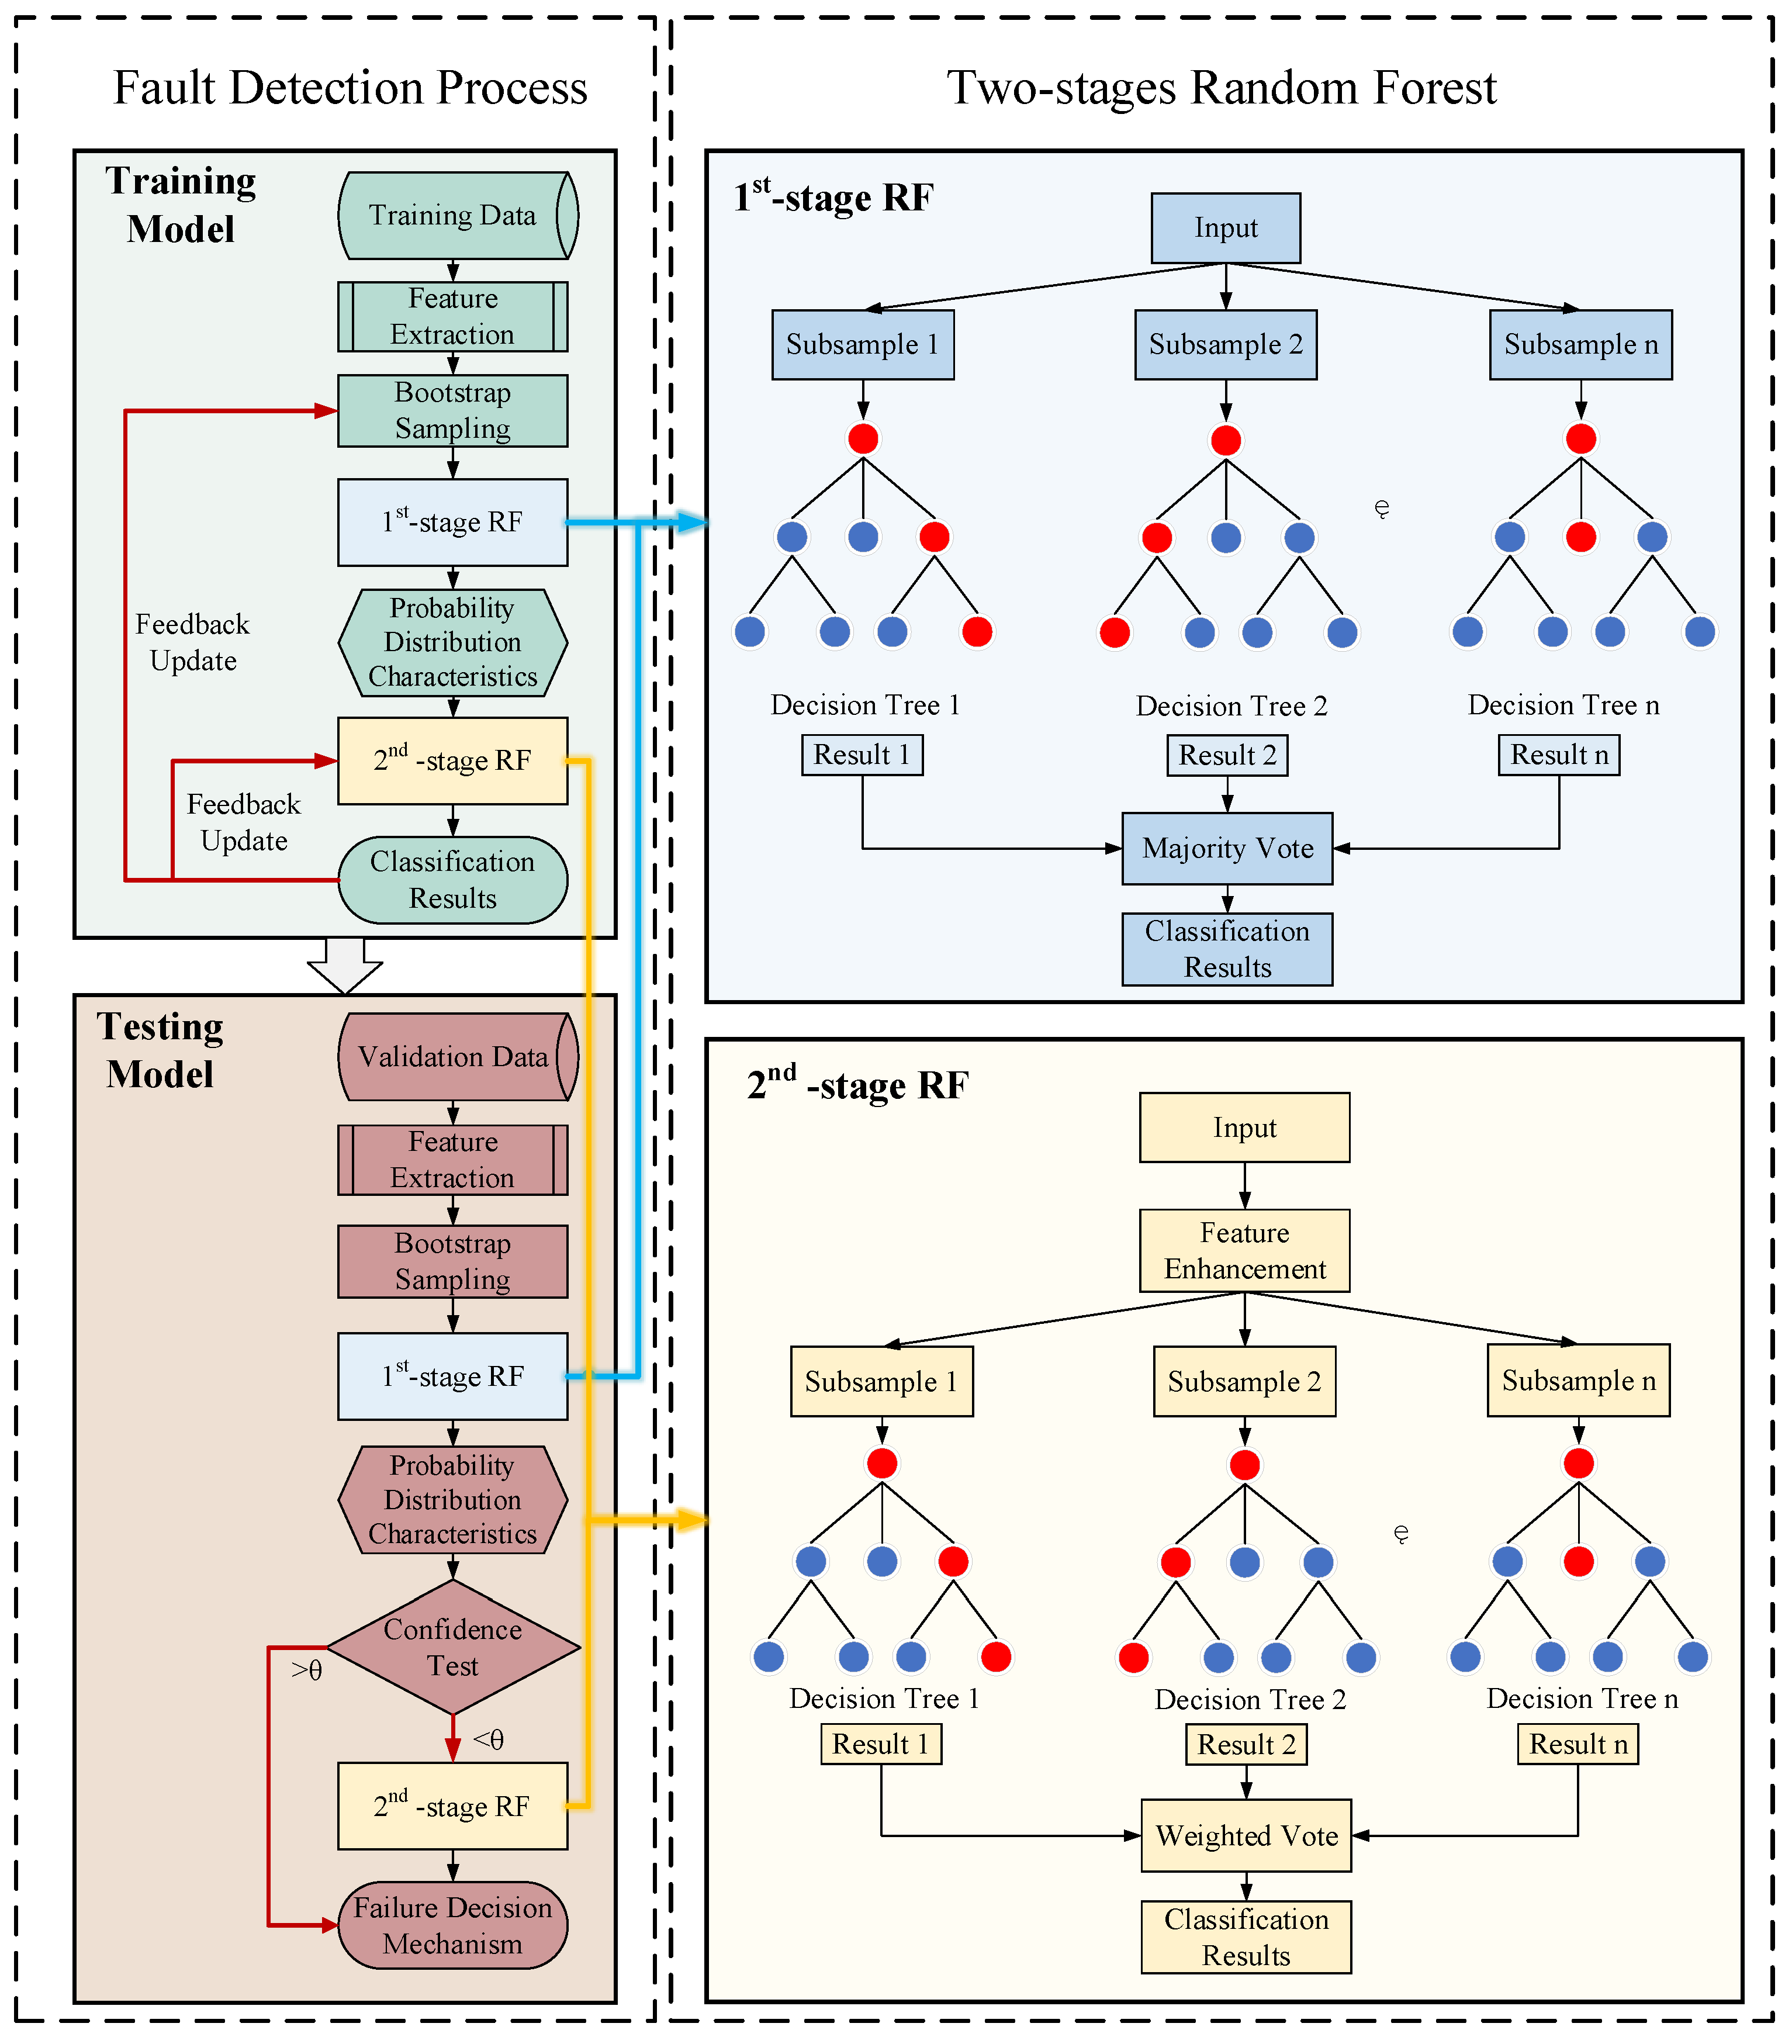
Figure 1. TSRF model flow chart.
Processes 13 02762 g001
Figure 2. (a) The sampling data labeled as 0 indicates no fault; (b) The fault sampling data labeled as 15, which corresponds to joint number 16.
Processes 13 02762 g002
Figure 3. (a) The training set performance of six comparative algorithms; (b) The test set performance of six comparative algorithms.
Processes 13 02762 g003
Figure 4. (a) Diagnostic accuracy of training set for each joint of a hexapod robot in three random forest algorithms; (b) Diagnostic accuracy of test set for each joint of a hexapod robot in three random forest algorithms. −1 indicates that all joints are functioning properly, 0 indicates that the first joint is malfunctioning, 1 indicates that the second joint is malfunctioning, and so on, up to 17.
Processes 13 02762 g004
Table 1. Comprehensive feature specifications.
Feature NameTechnical DefinitionMathematical Formulation
Kinetic Energy IndexQuantifies rotational kinetic energy of joint motion 0.5 × ( s l o p ( x / z ) 2 + s l o p ( z / x ) 2 )
Torque Ratio CoefficientRatio of principal torque components in Cartesian space   s l o p ( 1 / x ) s l o p ( 1 / z ) + 1 × 10 6
Trajectory Curvature MetricMeasures path deviation via Frenet–Serret formulas s l o p ( z / x ) × z x 2 + y 2 + 1 × 10 6  
Motion Stability IndicatorCharacterizes gait consistency through signal dispersion e | s l o p ( x ) s l o p ( z ) |
Spatial Orientation AngleDirection cosine relative to robot base frame a r c t a n 2 ( y , x 2 + z 2 )
Table 2. The training set performance.
MethodsKNNLRDTSGRFPFRFTSRF
accuracy76.6%63.6%53.1%97.9%98.8%86.6%
specificity74.7%27.8%52.9%97.1%98.3%87.0%
sensitivity80.3%45.6%52.0%98.1%99.0%92.4%
Table 3. The test set performance.
MethodsKNNLRDTSGRFPFRFTSRF
accuracy76.6%63.6%53.1%80.9%80.8%99.7%
specificity74.1%27.6%53.0%80.2%80.3%99.8%
sensitivity80.0%47.3%51.2%81.0%81.0%99.6%
Disclaimer/Publisher’s Note: The statements, opinions and data contained in all publications are solely those of the individual author(s) and contributor(s) and not of MDPI and/or the editor(s). MDPI and/or the editor(s) disclaim responsibility for any injury to people or property resulting from any ideas, methods, instructions or products referred to in the content.