Article

Numerical Study on the Energy-Harvesting Performance of Multiple Flapping Foils

1
School of Mechanical, Electrical and Information Engineering, Chongqing College of Humanities, Science and Technology, Chongqing 401524, China
2
National Computational Infrastructure, The Australian National University, Canberra, ACT 2600, Australia
*
Author to whom correspondence should be addressed.
Processes 2025, 13(9), 2739; https://doi.org/10.3390/pr13092739
Submission received: 9 August 2025 / Revised: 21 August 2025 / Accepted: 26 August 2025 / Published: 27 August 2025
(This article belongs to the Section Energy Systems)

Abstract

Flapping foils, inspired by the wing motions of birds and the swimming mechanisms of aquatic animals, offer a promising alternative to traditional turbines for extracting renewable energy from ambient flows found in nature. This study employs an immersed boundary-lattice Boltzmann method (IB-LBM) to numerically investigate the energy extraction performance of multiple flapping foils at a Reynolds number of 1100. Two staggered foils are systematically studied to identify the optimum spatial arrangements needed to achieve high energy-harvesting performance. The results show that the wake of the fore-foil mainly contributes to the negative performance of the hind-foil due to the loss of streamwise flow velocity, and the interaction between the two foils can enhance the energy-harvesting performance of the system, but cannot fully alleviate the effects of flow velocity loss. Therefore, the staggered arrangements, which help the hind-foil shed the wake, are essential to improve the energy-harvesting performance of the hind-foil. Comparable performance for the hind-foil is achieved at a horizontal gap of 2.5 c and vertical gap of 2.5 c with c being the chord length of the foil. The scaled-up systems, including three-, five-, and seven-foil configurations, are examined with gaps of 2.5 c (horizontal) and 2.5 c (vertical), and the results show that such ‘V’-shaped arrangements of these foils can achieve high energy-harvesting performance, with an enhancement up to 10.7 % when seven foils are used, by utilizing the high mean streamwise velocity at the boundary of the leader’s wake, confirming the versatility of the optimum staggered arrangements for flapping-foil arrays.

1. Introduction

The exponential increase in global energy demand is primarily driven by rapid population growth and ongoing advancements in modern civilization [1]. Although fossil fuels remain the dominant energy source, their continued use poses serious threats to both environmental sustainability and human health [2]. As a result, the transition to renewable energy has become increasingly urgent to replace traditional sources such as coal, oil, and natural gas—especially in reducing emissions of key greenhouse gases, including carbon dioxide, methane, and nitrous oxide. Among the various clean energy strategies being developed, such as solar photovoltaics and wind energy systems, bio-inspired energy harvesters have drawn growing interest [3,4]. In recent years, flapping foil devices that emulate the wing motions of birds and the swimming patterns of fish have emerged as promising alternatives. These systems are capable of efficient energy extraction even under low flow conditions—regimes where conventional wind turbines typically underperform due to their dependence on sustained flow attachment for effective power generation [5]. By contrast, flapping foils leverage unsteady fluid mechanisms such as the formation of leading-edge vortices (LEVs), which generate strong transient lift forces and contribute to their superior energy-harvesting capabilities [3].
One of the earliest studies on energy harvesting using oscillating foils dates back to the 1980s, when McKinney and DeLaurier proposed the “wingmill” concept [6]. They theoretically analyzed its performance using unsteady aerodynamics and validated predictions via low-speed wind tunnel tests, demonstrating efficiency comparable to rotary turbines. Subsequently, Platzer’s group employed the unsteady panel method (UPM) to explore the effects of kinematic parameters such as pivot location, phase difference, and plunging amplitude [7,8]. While UPM was efficient, its assumption of fully attached potential flow limited its accuracy under large-amplitude motions. To overcome this, researchers adopted discrete vortex methods with dynamic stall corrections and advanced computational fluid dynamics (CFD) techniques to better capture unsteady fluid–structure interactions. In recent years, the lattice Boltzmann method (LBM) coupled with the immersed boundary method (IBM) has become a popular tool for simulating flapping foil dynamics [9]. Hoke et al. [10] showed that morphing foil designs can significantly boost efficiency, while Liu et al. [11] and Liu et al. [12] highlighted the benefits of flexibility and bio-inspired trailing edge structures. Wu and Wang [13] explored double-symmetric flaps attached to the trailing edge of the foil to enhance energy harvesting.
Despite the remarkable progress in optimizing single-foil systems, practical applications often require multi-foil arrays to increase power output and spatial energy density. Most existing research has focused on dual-foil arrangements, including side-by-side and tandem configurations. For example, Kinsey and Dumas [14] conducted numerical investigations of a tandem oscillating-foil hydrokinetic turbine and revealed that unfavorable interactions may cause the downstream foil to contribute negatively to the total power extracted. Karakas and Fenercioglu [15] experimentally studied the fluid–structure interaction (FSI) of tandem foil systems and found that the downstream foil’s performance is strongly influenced by the upstream-induced wake structures. Young et al. [16] conducted a performance limit study on both single and tandem flapping foil turbines, suggesting that tandem configurations have the potential to reach efficiencies near the Betz limit. Zheng and Bai [17] studied the vertical distance and phase effects of a two-foil system, and pointed out that the tandem arrangement is not the optimum one, but very limited parameters are considered, and a significantly lower (than baseline) power coefficient is obtained in their optimum case. A more comprehensive review of flow-energy harvesters based on flapping foils can be found in Refs. [3,4,18]. In conclusion, most of these studies focus on side-by-side or tandem-arranged two-foil systems, while very few have systematically investigated staggered arrangements and cooperative energy-enhancement mechanisms in flapping arrays involving three or more foils. This remains an open challenge in the field of bio-inspired energy harvesting. This work aims to study the energy-harvesting performance of multiple flapping foils, to determine the effects of their spatial arrangements on the system’s performance, and to identify the optimum configurations of multiple flapping-foil systems.
In this paper, the energy-harvesting performance of multiple flapping foils is numerically studied by using an IB-LBM, including the two-foil system with staggered arrangements and the scaled-up multiple-foil system up to seven foils, as shown in Figure 1. The rest of this paper is organized as follows: the definition of the physical problem is described in Section 2; the numerical method used for the simulation is introduced in Section 3; the two-foil system with a range of horizontal and vertical gaps and phase differences is systematically studied and analyzed in Section 4; the optimum arrangements are extended to multiple-foil systems for further verification and analysis; and the conclusion is given in Section 5.

2. Physical Problem

This paper investigates an NACA0015-based energy harvester undergoing synchronized heaving and pitching motions, with the kinematics described as follows [13]:
θ = θ 0 s i n ( 2 π f t + ϕ ) , h = h 0 s i n ( 2 π f t + π 2 + ϕ ) .
The heaving and pitching are modeled as sinusoidal functions with an additional phase shift of π 2 to introduce temporal asymmetry, where h 0 and θ 0 are, respectively, the amplitudes of the heaving and pitching motion, f is the frequency, and ϕ is the phase difference. As shown in Figure 1, the pivot axis is positioned at a location c / 3 downstream from the foil’s leading edge, with c being the chord length of the foil, corresponding to one-third of the chord length. The horizontal and vertical gaps between the two foils are, respectively, represented by using g x and g y , which are scaled by using the chord length c. A uniform inflow of velocity u 0 is prescribed at the domain inlet, while far-field boundary conditions are imposed on all remaining boundaries to minimize reflection effects. Following the optimal parameters from Refs. [19,20], the motion parameters are set to h 0 = c , θ 0 = 76 . 3 o , with a Reynolds number R e = u 0 c / ν = 1100 and a reduced frequency f * = f c / u 0 = 0.14 . The low Reynolds number considered here is more likely for small-scale foils at low-speed flow environments, as used in other relevant studies, e.g., [12,14,17]. High Reynolds number flow is likely to generate smaller-scale vortical structures, which may entrain additional momentum and energy and therefore influence the interplay between multiple foils, and in particular require high-fidelity large-eddy simulation for resolution. But the low Reynolds number flow regimes still hold the major flow patterns (e.g., the flow separations and vortex interactions) of such problems. Therefore, the current low Reynolds number is still able to provide insights into the considered problem. In this paper, attention is directed toward the spatial configuration of a dual-foil system, particularly the streamwise gap (see Figure 1) and phase difference. The hydrodynamic performance is evaluated using a time-averaged power coefficient, formulated as
C P ¯ = 1 n T 0 n T C P ( t ) d t .
Here, T denotes the period of the flapping motion, and n is the number of cycles used for temporal averaging. n = 4 is adopted, which is sufficient to suppress periodic noise after the initial transient stage. The instantaneous power coefficient is defined as
C P ( t ) = f · u 0.5 u 0 3 c ,
where f denotes the instantaneous aerodynamic/hydrodynamic force acting on the foil and flap, and u denotes the instantaneous velocity. The spatial integral is evaluated as a discrete summation in the present solver, since both the foil and flap surfaces are discretized into Lagrangian nodes in the IB–LBM framework.

3. Numerical Methods

The present work investigates energy harvesting by using flapping foils, which is a typical problem involving fluid–structure interaction. The fluid dynamics are resolved using the lattice Boltzmann method (LBM), while no-slip constraints along complex moving boundaries of the flapping foil are enforced via an immersed boundary formulation. Only a concise summary of the numerical framework is provided here.

3.1. LBM for the Fluid Flow

Within the multi-relaxation-time (MRT) lattice Boltzmann framework, the evolution of the velocity distribution function g i in the i-th discrete direction at spatial location x is expressed, under the Bhatnagar–Gross–Krook (BGK) approximation for the collision term, as [21]:
g i ( x + e i Δ t , t + Δ t ) = g i ( x , t ) Ω i ( x , t ) + Δ t G i , i = 0 , 1 , , 8 ,
where Δ t denotes the time step. The collision term Ω i and the body-force contribution G i to the distribution function are denoted separately, and their explicit forms are given as
Ω i = ( M 1 S M ) i j [ g j ( x , t ) g j e q ( x , t ) ]
G i = [ M 1 ( I S / 2 ) M ] i j F j
where M denotes the transform matrix of size 9 × 9 for the D2Q9 model used here, and S is a diagonal matrix that is related to the fluid dynamic viscosity. Macroscopic flow variables (e.g., density and momentum) are evaluated from the particle distribution functions according to
ρ = i = 0 8 g i , ρ u = i = 0 8 g i e i + 1 2 f Δ t .
The local equilibrium distribution function g i e q and the force term G i can be calculated by
g i e q = ω i ρ [ 1 + e i · u c s 2 + u u : ( e i e i c s 2 I ) c s 4 ] ,
G i = ω i [ e i u c s 2 + e i · u c s 4 e i ] · f .
Here, ω i denotes the lattice weights [22], and the lattice sound speed is given by c s = Δ x / ( 3 Δ t ) . The term f represents the interaction force applied to a fluid node from its neighboring Lagrangian structure nodes. In the present two-dimensional simulations, the D2Q9 model is adopted in this work. The relaxation time τ is linked to the kinematic viscosity ν in the Navier–Stokes formulation through ν = ( τ 0.5 ) c s 2 Δ t . Furthermore, to enhance computational stability, the multi-block framework proposed by Yu et al. [23] is integrated with a dynamically adaptive mesh strategy.

3.2. The IB Method for FSI

To impose the no-slip condition at the fluid–structure interface, this study utilizes the penalty immersed boundary (pIB) scheme developed by Kim and Peskin [24]. In this method, a body force is simultaneously applied in the fluid and structural solvers, and the interaction force between the two domains is determined based on the feedback law [24]:
F = α 0 t ( U i b U ) d t + β ( U i b U ) .
Here, U i b denotes the velocity of the immersed boundary nodes, interpolated from the surrounding fluid field, while U refers to the actual structural velocity. The coupling parameters α and β are positive constants with α = 0 and β = 2.0 adopted in the present simulations, according to our previous work [13,25]. The no-slip boundary condition at the fluid–structure interface is enforced by introducing a body-force term into Equation (9). This term is obtained by distributing the force computed from Equation (10) to the Eulerian fluid nodes located in the vicinity of the corresponding Lagrangian boundary points. In contrast to the sharp-interface IB approach [26,27], the pIB formulation employs a unified governing equation for all grid points within the computational domain, a feature that makes it well-suited for the present numerical framework. In addition, the direct variant of the pIB method provides a more straightforward approach to handling complex geometries than the sharp-interface IB formulation. The transformation of forces between the Lagrangian and Eulerian frameworks is performed via a discrete Dirac delta function. The velocity interpolation from the Eulerian fluid field to the immersed boundary nodes, along with the distribution of Lagrangian forces to the neighboring fluid nodes, is formulated as
U i b ( s , t ) = V u ( x , t ) δ h ( X ( s , t ) x ) d x ,
f ( x , t ) = Γ F ( s , t ) δ h ( X ( s , t ) x ) d s ,
where u represents the fluid velocity, while X and x denote the positions of structural and fluid nodes, respectively. The parameter s refers to the arc length, V is the fluid domain, and Γ is the structure boundary. The smoothed delta function δ h is employed to approximate the Dirac delta function, following the formulation introduced by Peskin [28]. The computational domain spans 36 c × 40 c and is partitioned into six blocks, as illustrated in Figure 2. The base grid resolution is 0.16 c , with successive refinements by a factor of 2, achieving a minimum grid size of 0.005 c near the foil. The foil and the flap are discretized using a spacing of 0.004 c , ensuring consistency with the surrounding fluid resolution. During the computation, the fluid mesh was dynamically updated so that the mesh near the foil was refined to 0.005 c , and the time spent on the dynamic mesh process was negligible compared to the total computational time. The numerical framework used in this study builds upon our previous validated solvers; further implementation details and validation (considering comparisons of flapping-foil simulations with commercial software and experimental measurements) of the solver and its previous versions can be found in our earlier works [13,25,29].

4. Results and Discussions

The effects of the arrangements of two foils on the energy-harvesting performance are firstly studied in Section 4.1. Here, the horizontal gap (from 0 to 5 c with an interval of 0.25 c ) and vertical gap (from 2.5 c to 2.5 c with an interval of 0.25 c ) between the two foils are systematically examined to understand the interaction between the foils and figure out the optimum configurations. The phase difference (from 0 to π with an interval of 0.25 π ) is examined in Section 4.2. Then, the optimum arrangements of the two foils are used for multiple foils (up to 7) to verify their versatility in Section 4.3.

4.1. Effects of the Spatial Arrangements of Two Staggered Foils

In this section, two staggered foils with in-phase mode (no phase difference between the two foils) are considered. A wide range of gaps between the two foils is considered. For small gaps, the hind-foil flaps in the wake of the fore-foil, and strong interaction between them is expected. In contrast, the interaction between the two foils is weak for large gaps.
Figure 3 shows the mean power coefficients collected from all 336 cases. First, it was found that the fore-foil is less affected in the staggered formation, and its power coefficient decreases when the two foils are close, e.g., the minimum power coefficient for the fore-foil is around 0.73, which is around 13% lower compared with the single flapping foil baseline, because only the hind-foil affects the flow close to the fore-foil’s trailing edge. This can also be clearly demonstrated in Figure 4 and Figure 5, as the trend of the power coefficients over time is almost identical, and differences due to strong interaction appear at specific times, e.g., t = 0.2 T 0.5 T in Figure 5.
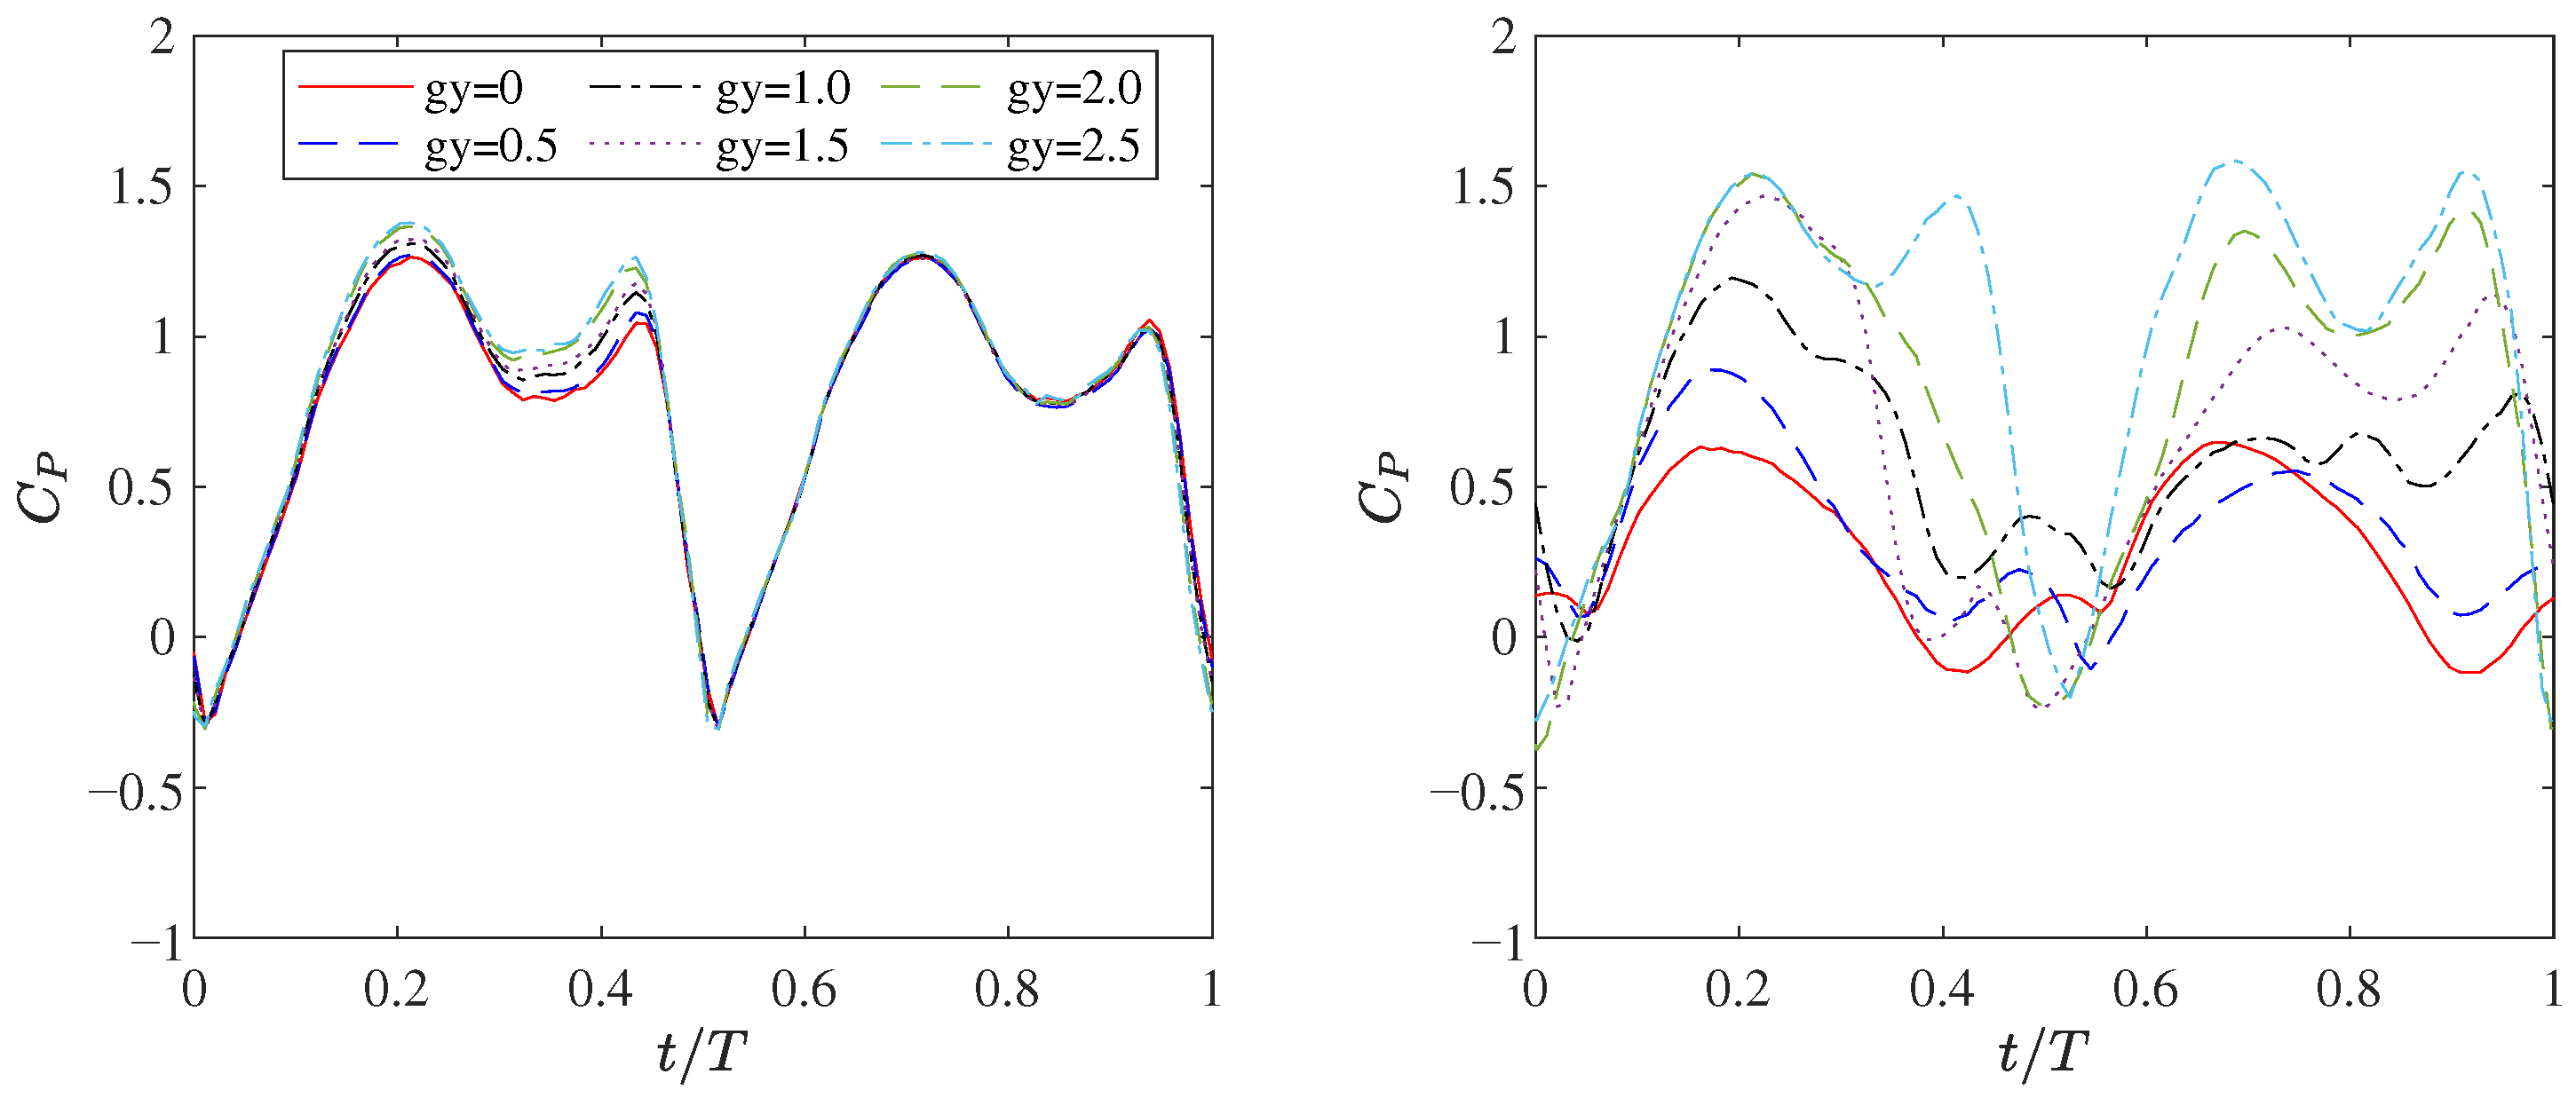
Second, the hind-foil flapping in the wake of the fore-foil generally generates significantly less power than the fore-foil, especially when the two foils are arranged in tandem (Figure 4 shows that the power coefficients of the hind-foil are significantly smaller than those of its fore-foil counterpart). This is consistent with the results for tandem foils in Ref. [17], because the energy in the flow has been harvested by the fore-foil, leaving less for the hind-foil. It also agrees with the observations that the vertical gap between the two foils is more important than the horizontal one, as the vertical gap can more easily move the hind-foil away from the wake of the fore-foil. To compare the effects of horizontal and vertical gaps, we collect the data along two lines, e.g., g x = 1.25 to 5 with g y = 0 , and g x = 3.0 with g y = 0 to 2.5 in Table 1 and Table 2, respectively. It shows that the horizontal gap can alleviate the interaction of the tandem foils and benefit the energy-harvesting performance of the hind-foil, but its enhancement effects are very limited, as we still observe a significantly negative effect of up to 35.2 % with a horizontal gap of 5 c . On the contrary, the vertical gap has a significantly positive effect on the staggered-foil system. The power coefficient of the hind-foil increases quickly as the vertical gap increases, and it recovers to the single-foil power coefficient when the vertical gap is large enough, e.g., g y = 2.5 in Figure 5.
However, it is also noted that the hind-foil achieves a comparable power coefficient to the single foil when the vertical gap is at least 2 c , which is quite larger than the half-amplitude of the fore-foil. To understand this point, the mean flow field of a single flapping foil is shown in Figure 6. It shows that the mean streamwise velocity in the wake is significantly reduced due to the existence of the flapping foil, which explains the dramatically reduced energy-harvesting performance of the hind-foil. However, the drop in mean streamwise velocity alone is not enough to explain the power coefficient generated by the hind-foil, e.g., when g x = 5.0 and g y = 0.0 , the mean streamwise velocity drops to 0.48 u 0 , but the power coefficient is more than 1 / 4 (since f, defined in Equation (3), scales with u 2 ) of that generated by the single flapping foil (i.e., 0.274 > 0.210 ). That is to say, the interaction between the two foils seems to be important in explaining the power coefficient of the hind-foil. Let us take three cases as examples—for comparison—to illustrate this point; namely, g x = 1.25 , 2.0, and 5.0, with g y = 0 . When g x = 1.25 , the mean streamwise velocity according to Figure 6 is still around 0.8 u 0 , but the power coefficient for the hind-foil is only 0.134, according to Table 1, indicating that the interaction of the hind-foil with the wake of the fore-foil has a further negative impact on energy harvesting. This can be visualized by the vortex interaction shown in Figure 7, where the positive trailing edge vortex (TEV) shed by the fore-foil strongly interacts with the negative LEV of the hind-foil at t = T / 2 , reducing the attachment of the LEV of the hind-foil. Conversely, when g x = 5.0 , the mean streamwise velocity drops, respectively, to 0.48 u 0 , but the power coefficients are much higher than their counterparts with g x = 1.25 , indicating the positive impact of the wake of the fore-foil on the energy-harvesting performance of the hind-foil. Figure 7 shows that the vortex interaction becomes a wake at g x = 3.0 and g x = 5.0 , and the power coefficient is likely due to the change in local velocity. The difference observed at different horizontal gaps indicates that the interaction of the two foils can be either negative or positive for the hind-foil in energy harvesting, depending on the gap between the two foils, which is consistent with previous observations in Refs. [15,17].
Although the interaction of the foils may increase or decrease energy-harvesting performance, it is clear that such interaction has a very limited ability to enhance the energy-harvesting performance of the hind-foil, as its power coefficient is mostly smaller than the single-foil baseline when the two foils interact with each other; see Figure 3. This indicates that the significant drop in mean streamwise velocity dominates the performance of the hind-foil. This explains the need to arrange the two foils in a staggered manner in order to minimize the negative influence of the fore-foil and achieve the best performance for the two-foil system. Finally, it is noted that the contours shown in Figure 3 are almost symmetric with respect to g y . Although the two foils interact with each other in different half-periods when the vertical gap is positive or negative, the overall behavior within one period is nearly identical.

4.2. Effects of Phase Difference of Two Staggered Foils

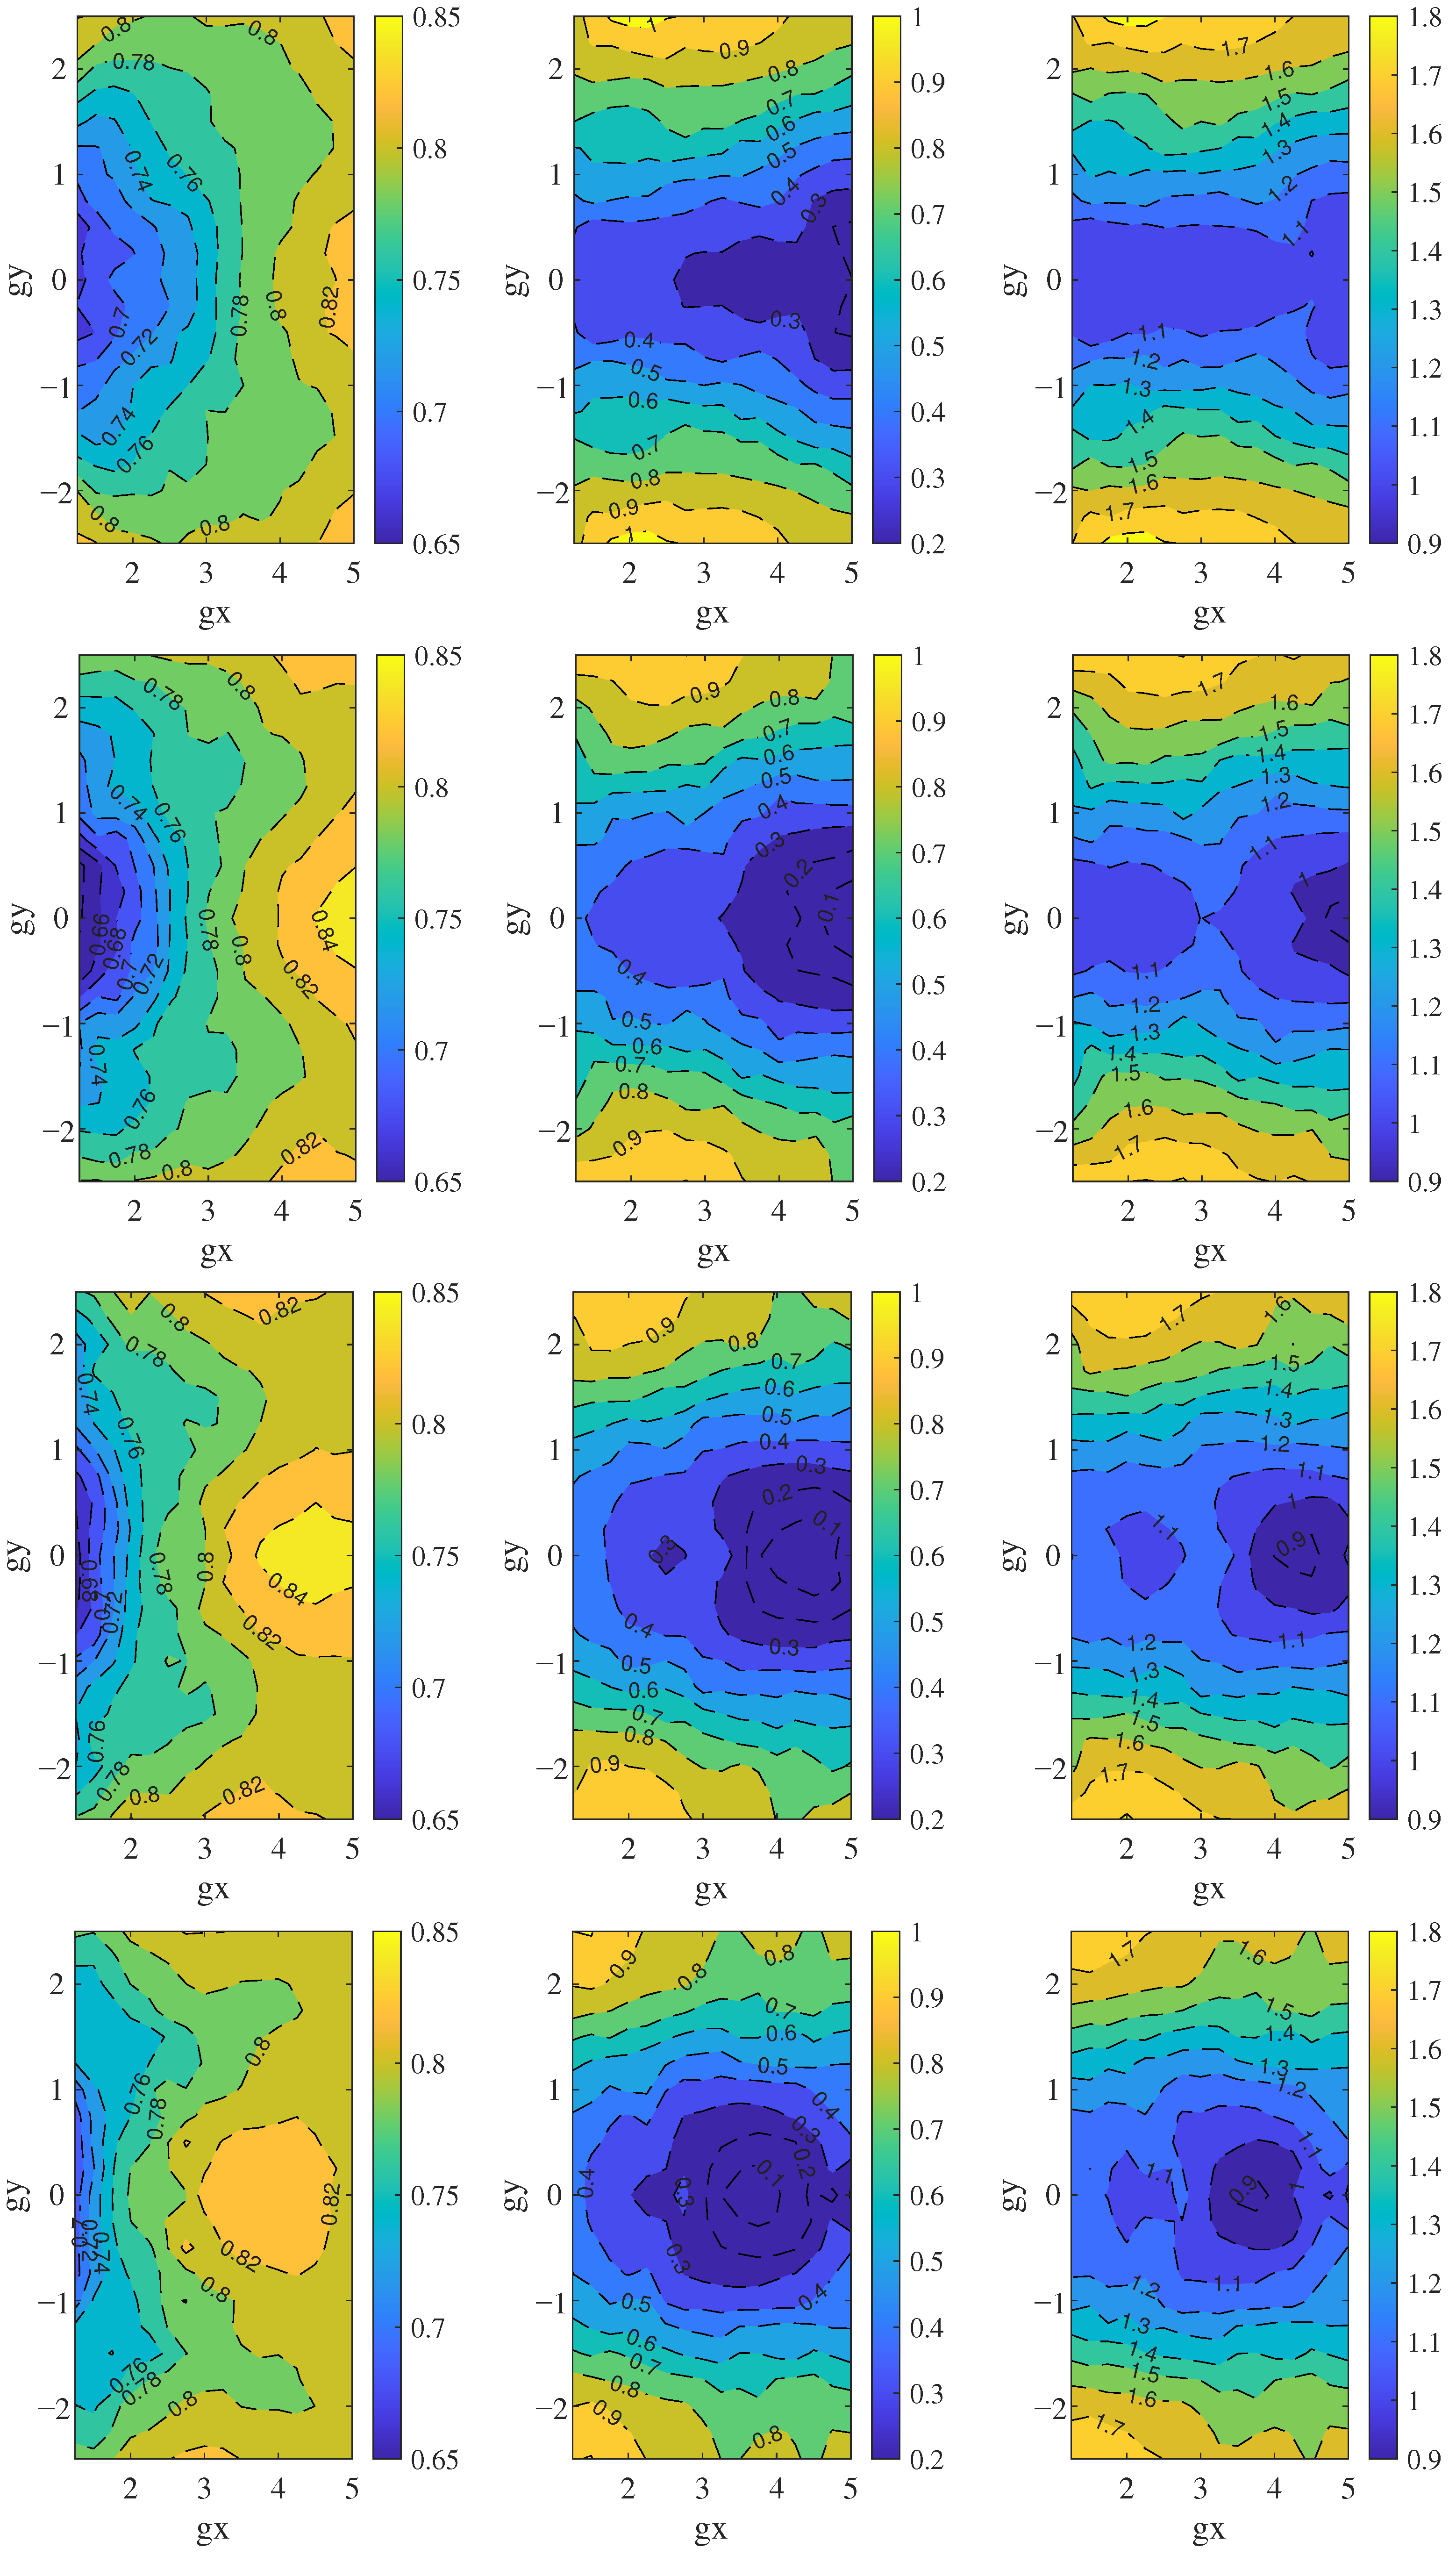
In this section, four phase differences, i.e., 0.25 π , 0.5 π , 0.75 π , and π , are further examined to analyze the associated effects on the staggered foils, where π denotes the out-of-phase mode opposite to the in-phase mode considered in Section 4.1, and the others are in between.
The power coefficients of the two foils and the overall are shown in Figure 8. First, it was found that the distribution of the power coefficients for the two-foil system is very similar, indicating that the phase difference is not a dominant factor here. Specifically, for smaller g x and g y , the hind-foil flaps in the wake of the fore-foil, leading to a significantly low power coefficient for both foils. When the hind-foil flaps out of the wake of the fore-foil, its power coefficient quickly recovers to the baseline. The phase difference slightly influences the horizontal gap required for the power coefficient recovery, e.g., g x = 2.0 is required for ϕ = 0 to achieve the highest value, while the highest power coefficient can be achieved with even g x < 1.25 for ϕ = 0.25 π and above. An interesting point is that the hind-foil achieves the lowest power coefficient at around g x = 3.0 to 5.0 , rather than at smaller g x , indicating that the streamwise velocity decrease shown in Figure 6 (bottom left) is still the dominant source rather than the vortex interaction. It is also noted that the fore-foil has a lower power coefficient than the baseline ( 0.84 ), and it recovers close to the baseline only at very large g x and g y . A plausible explanation is the blocking effects induced by the hind-foil, which may influence vortex separation on the fore-foil. In contrast, the hind-foil can achieve power coefficients slightly higher than the baseline when it is located vertically far enough from the fore-foil, which can be explained by the increased mean streamwise velocity in these regions, as shown in Figure 6.
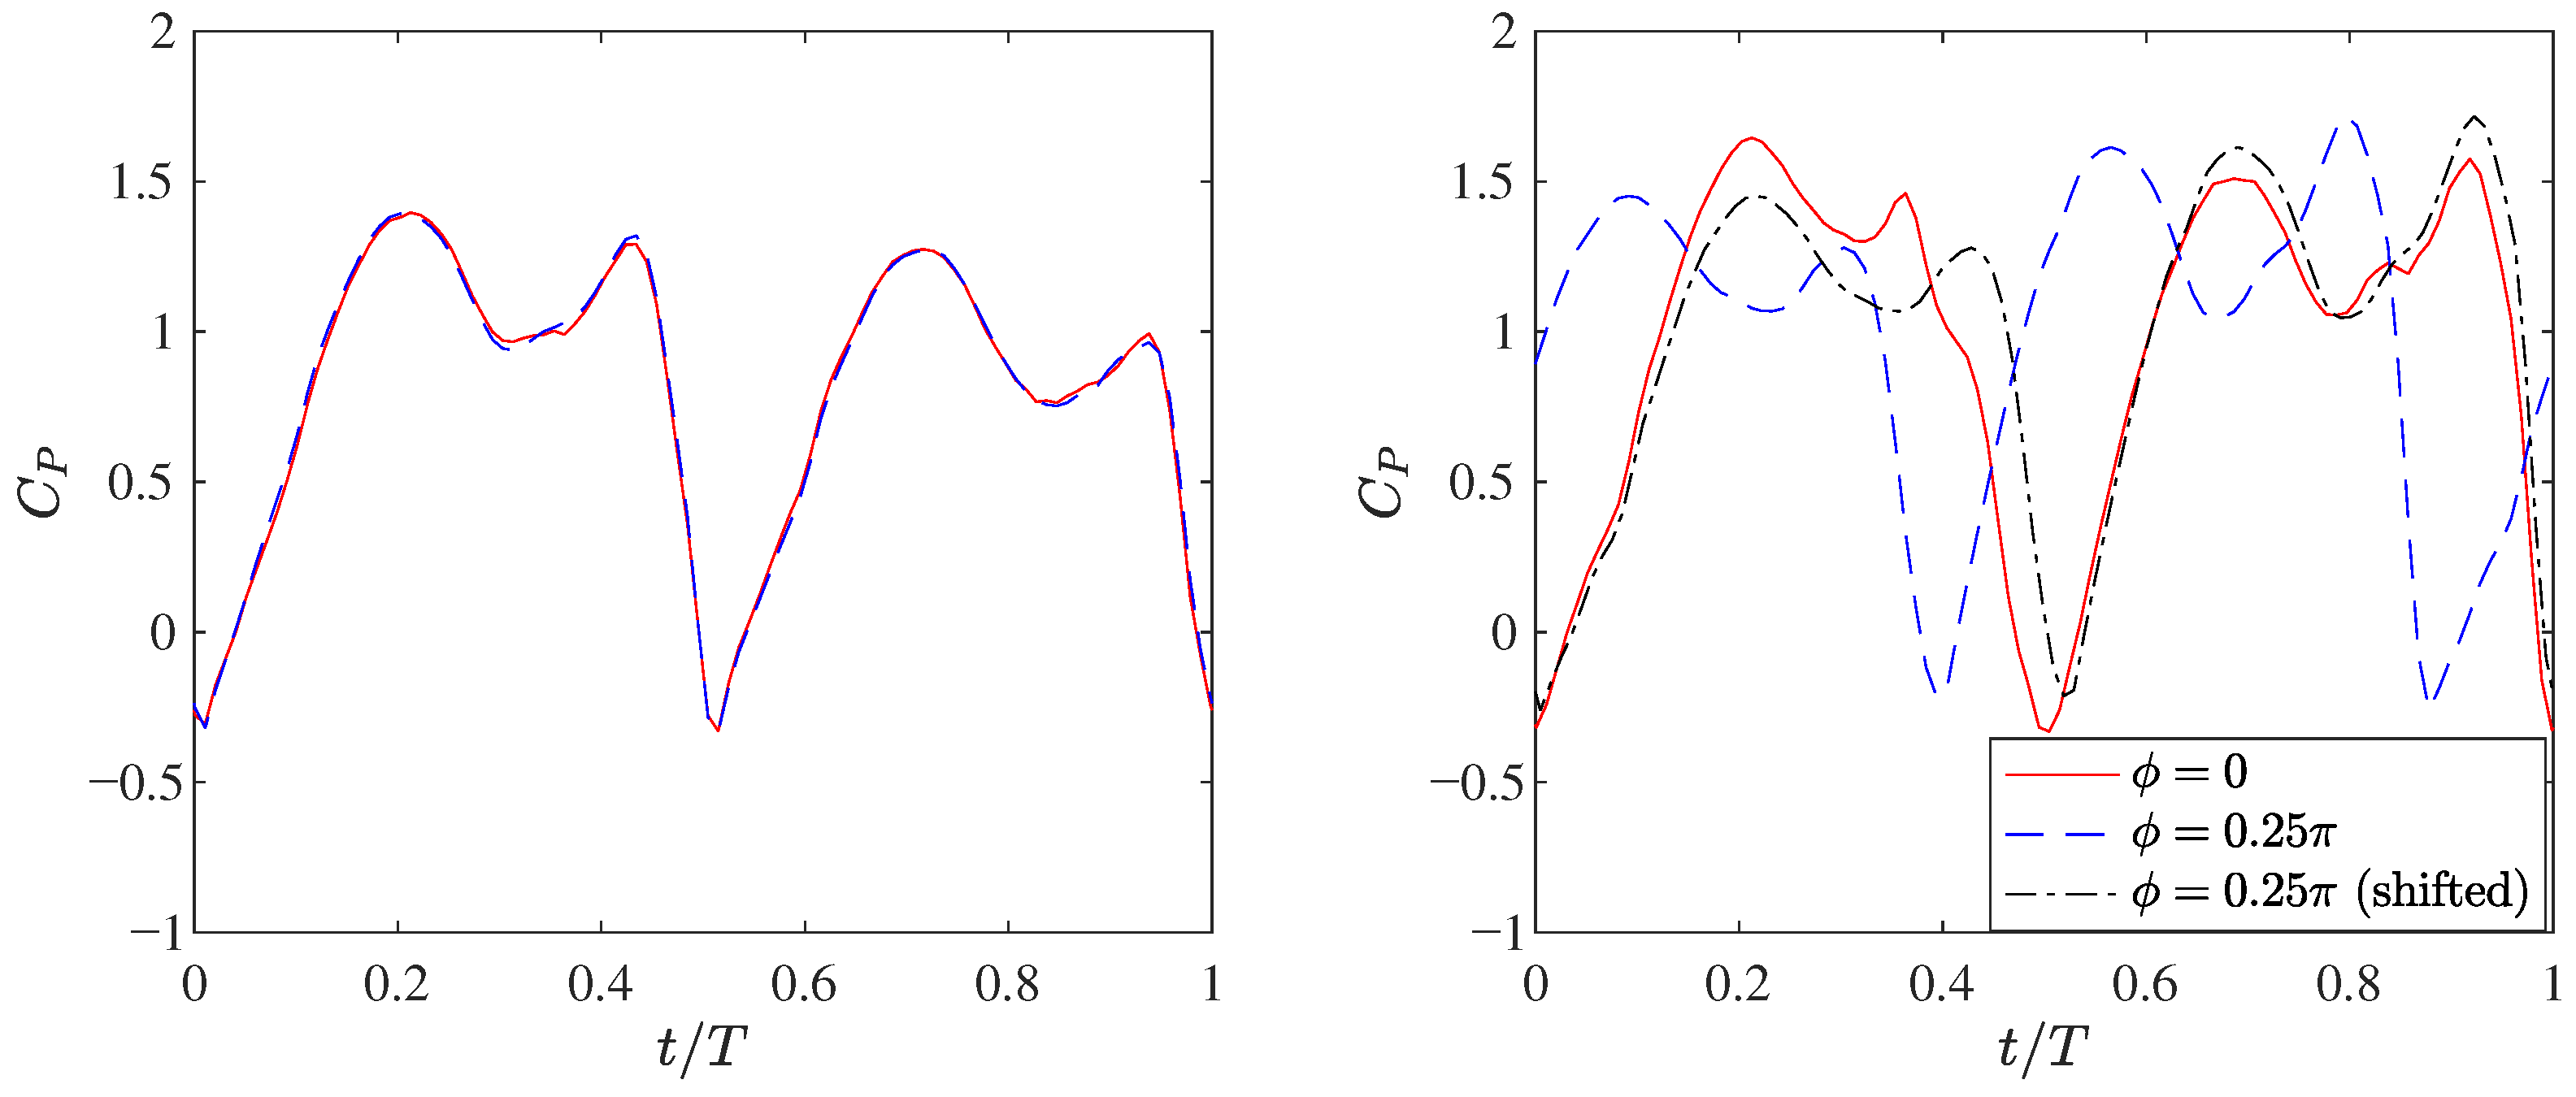
By reviewing all the cases considered for the two-foil system, it is now clear that the decrease in the streamwise velocity is the dominant factor in the decrease of the system’s power coefficient. The power coefficient of the fore-foil decreases in most cases due to the blocking effects induced by the hind-foil, and it recovers close to the baseline at very large horizontal and vertical gaps, with the vertical gap appearing to be more effective. For the hind-foil, the power coefficient increases quickly with the vertical gap, and a slightly higher-than-baseline value can be achieved, e.g., C P ¯ = 1.0 at g x = 2.5 and g y = 2.5 with ϕ = 0.25 π , which leads to the highest overall power coefficient of 1.84 in all considered cases. To illustrate this point, the time histories of the power coefficients for ϕ = 0 and 0.25 π with g x = 2.5 and g y = 2.5 are shown in Figure 9. The power coefficients of the fore-foil are almost identical, indicating weak blocking effects from the hind-foil at such large gaps. For the hind-foil, the power coefficient at ϕ = 0.25 π is shifted T / 8 to align with that at ϕ = 0 for a more straightforward comparison. It was found that the first peak for ϕ = 0.25 π is much smaller than that with ϕ = 0 , which is likely due to the closer distance of the two foils when ϕ = 0.25 π during t = 0 T / 4 . But it is clear that the one with ϕ = 0.25 π has a delayed separation as C P decreases much later; this can be explained by the opposite moving direction during T / 4 2 T / 4 , where the fore-foil moves downward and the hind-foil moves upward. The overall results show that the phase of ϕ = 0.25 π slightly increases the power coefficient of the hind-foil by about 5.1 % compared with that at ϕ = 0 .

4.3. Energy-Harvesting Performance of Multiple Flapping Foils

In this section, we consider multiple flapping foils to examine whether the optimum arrangements found in Section 4.1 can preserve performance when scaling up from a two-foil system to three-, five-, and seven-foil systems. g x = 2.5 , g y = 2.5 , or 2.5 are used for all foils, where g y = 2.5 indicates that the individual foil is located above its nearest leader, and vice versa. As ϕ = 0 is able to recover the baseline, to keep it simple, here, all foils in the system are set to flap in phase, and each one has the same relative distance to its fore-foil; see the schematic shown in Figure 1c.
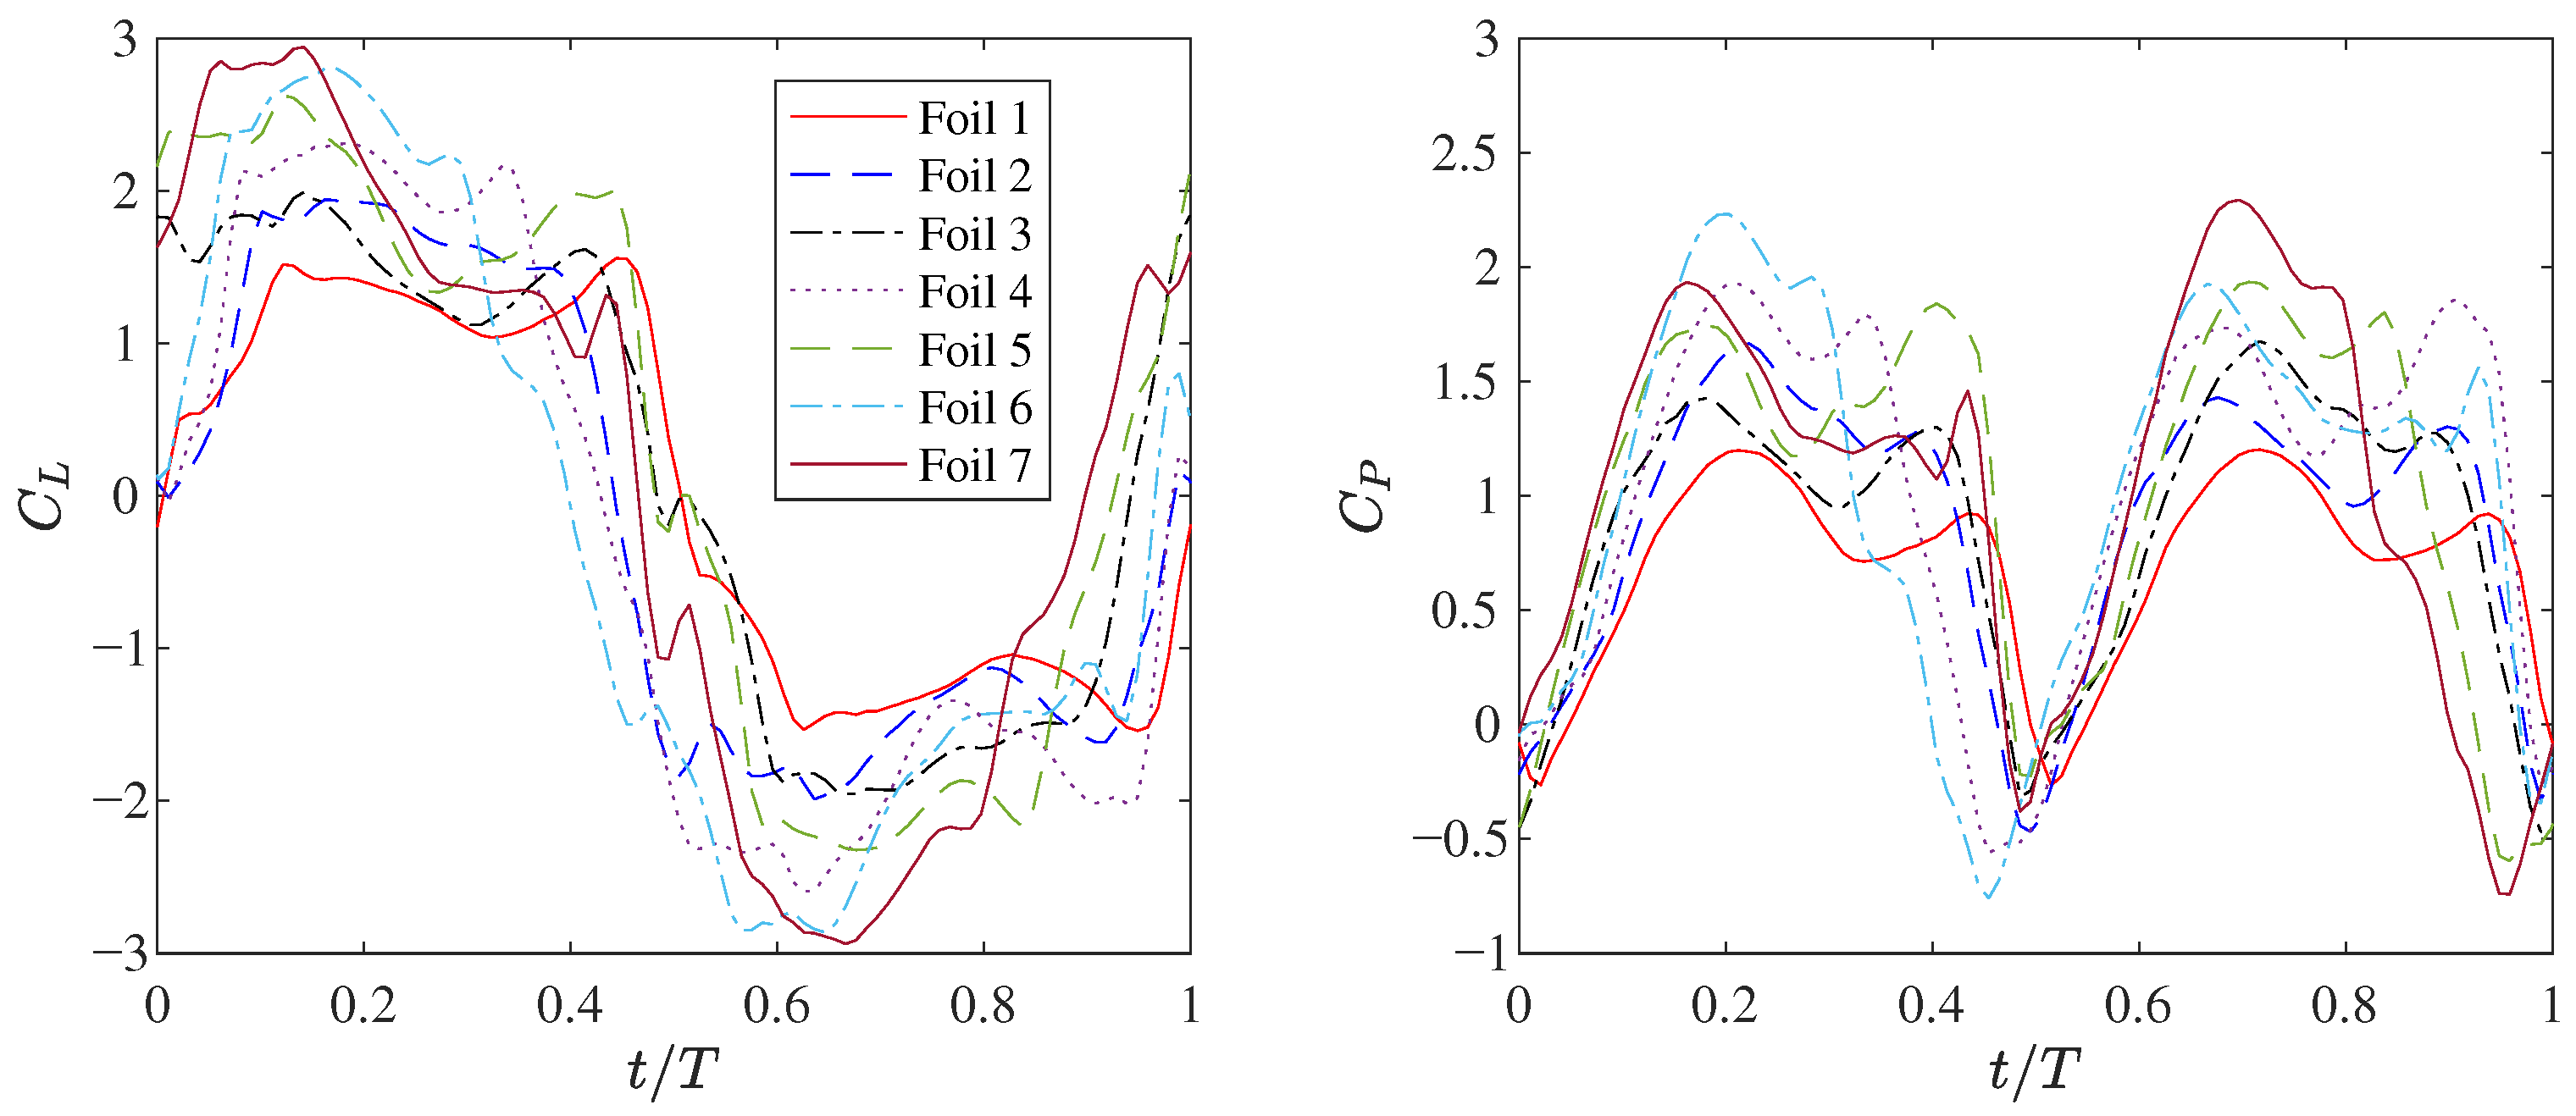
The time histories of the lift coefficients and power coefficients for all foils are shown in Figure 10. First, it was found that the first foil, which is the leading one of the system, always obtains the smallest power coefficients and lift amplitudes, which can be explained by the blocking effects from the downstream foils. Second, the two foils with the symmetric y-location, e.g., foils 2 and 3, have asymmetric power coefficients in one period. Specifically, foil 2 has a higher amplitude of C P during 0 T / 2 than that during T / 2 T . Because foil 2 is located above foil 1, the interaction is weak in the first half period, but the pressure side of foil 2 will encounter the negative vortex shed from foil 1 in the second half period, as shown in Figure 11 (right). Foil 3 has a reverse interaction compared with foil 2. For a more straightforward comparison, the time-averaged power coefficients generated by each foil are shown in Table 3. The close values of the time-averaged power coefficients for foils 2 and 3, 4 and 5, and 6 and 7 confirm that the symmetric distribution along the horizontal axis does not affect the energy-harvesting performance. Third, it was found that the leading foil has a slightly decreased power coefficient, but the followers all have increased power coefficients, benefiting from the increased mean streamwise velocity. The overall power coefficient of the multi-foil systems is enhanced compared with the baseline, and it further increases with the total number of foils in the system. The results show that the horizontal ‘V’-shaped arrangement of multiple flapping foils is able to achieve high energy-harvesting performance, outperforming the baseline by up to 10.7 % when seven foils are deployed. It should be noted that such a ‘V-shaped’ arrangement is used to shed the low mean streamwise velocity wake of the leading foil and to utilize the high mean streamwise velocity at the boundary of the leader’s wake. It is different from the birds’ ‘V’-shaped flight formation, which aims to use the upwash of the leader to enhance lift.

5. Conclusions

In this paper, the energy-harvesting performance of multiple flapping foils is numerically studied using an IB-LBM, and the two-foil system with a staggered arrangement is systematically studied by varying the horizontal and vertical gaps and the phase between the two foils. It was found that the decrease in streamwise velocity in the near wake of the fore-foil is the dominant factor behind the decrease in the system’s power coefficient. The power coefficient of the fore-foil decreases in most cases due to the blocking effects induced by the hind-foil. For the hind-foil, the power coefficient increases quickly with the vertical gap, and a slightly higher-than-baseline value can be achieved by arranging it at g x = 2.5 and g y = 2.5 away from the fore-foil.
The parametric study across all four phase differences between the two foils, i.e., ϕ = 0.25 π , 0.5 π , 0.75 π , and π , shows that the phase difference slightly decreases the horizontal gap required for power coefficient recovery, but the vertical gap required to obtain the optimum power coefficient remains essential, with values for all phase differences being almost identical up to g y = 2.5 . On the other hand, the phase angle is able to enhance the power coefficient slightly, which is around 5.1 % , as obtained at ϕ = 0.25 π .
The scaled-up systems, including three-, five-, and seven-foil configurations, are examined with the optimum gaps of g x = 2.5 and g y = 2.5 ; the results show that such horizontal ‘V’-shaped arrangements can achieve high energy-harvesting performance, with an enhancement of up to 10.7 % when seven foils are used, by utilizing the high mean streamwise velocity at the boundary of the leader’s wake.
Although the present study focuses on the hydrodynamic performance, it is worth noting that the concept of multiple flapping foils has promising implications for green and zero-carbon energy generation. By enhancing efficiency through cooperative foil arrangement, the system could reduce the overall cost of energy in marine environments. Moreover, the modular nature of flapping foil units allows flexible deployment in shallow or turbulent waters where conventional turbines are less effective. These aspects underline the potential practical feasibility of the proposed concept as a renewable energy solution. It should also be noted that this work only focuses on low Reynolds number flow regimes in a two-dimensional domain, and the turbulent flow effects in high Reynolds numbers are not considered. Small-scale vortical structures and their interaction with the foil may affect the aerodynamic/hydrodynamic forces and, therefore, the energy-harvesting performance. High-fidelity large-eddy simulation is required to resolve these vortical structures and obtain accurate hydrodynamic performance data for three-dimensional multiple flapping foils, which will be considered in future work. An experimental study on the proposed strategy is crucial for practical applications, and will also be the focus of future work.

Author Contributions

Project administration, funding acquisition, conceptualization, methodology, investigation, validation, formal analysis, resources, writing—review and editing, S.W. and L.W. All authors have read and agreed to the published version of the manuscript.

Funding

This research was funded by the Science and Technology Research Program of Chongqing Municipal Education Commission (grant no. KJZD-K202401801) and the Natural Science Key Project of Chongqing University of Humanities, Science and Technology (grant no. CRKZK202500).

Data Availability Statement

The original contributions presented in this study are included in the article. Further inquiries can be directed to the corresponding author.

Conflicts of Interest

The authors declare no conflicts of interest.

Abbreviations

The following abbreviations are used in this manuscript:
CFDComputational fluid dynamics
DVMDiscrete vortex method
FSIFluid–structure interaction
IBMImmersed boundary method
LBMLattice Boltzmann method
LEVLeading edge vortex
MRTMulti-relaxation-time
TEVTrailing edge vortex
UPMUnsteady panel method

References

  1. Olabi, A.; Abdelkareem, M.A. Renewable energy and climate change. Renew. Sustain. Energy Rev. 2022, 158, 112111. [Google Scholar] [CrossRef]
  2. Yang, X.; Pang, J.; Teng, F.; Gong, R.; Springer, C. The environmental co-benefit and economic impact of China’s low-carbon pathways: Evidence from linking bottom-up and top-down models. Renew. Sustain. Energy Rev. 2021, 136, 110438. [Google Scholar] [CrossRef]
  3. Young, J.; Lai, J.C.; Platzer, M.F. A review of progress and challenges in flapping foil power generation. Prog. Aerosp. Sci. 2014, 67, 2–28. [Google Scholar] [CrossRef]
  4. Wu, X.; Zhang, X.; Tian, X.; Li, X.; Lu, W. A review on fluid dynamics of flapping foils. Ocean Eng. 2020, 195, 106712. [Google Scholar] [CrossRef]
  5. Lewis, M.; Neill, S.; Robins, P.; Hashemi, M. Resource assessment for future generations of tidal-stream energy arrays. Energy 2015, 83, 403–415. [Google Scholar] [CrossRef]
  6. McKinney, W.; DeLaurier, J. The Wingmill: An oscillating-wing windmill. J. Energy 1981, 5, 109–115. [Google Scholar] [CrossRef]
  7. Davids, S.T. A Computational and Experimental Investigation of a Flutter Generator. Ph.D. Thesis, Naval Postgraduate School, Monterey, CA, USA, 1999. [Google Scholar]
  8. Lindsey, K. A Feasibility Study of Oscillating-Wing Power Generators. Ph.D. Thesis, Naval Postgraduate School, Monterey, CA, USA, 2002. [Google Scholar]
  9. Wang, L.; Liu, Z.; Rajamuni, M. Recent progress of lattice Boltzmann method and its applications in fluid-structure interaction. Proc. Inst. Mech. Eng. Part C J. Mech. Eng. Sci. 2023, 237, 2461–2484. [Google Scholar] [CrossRef]
  10. Hoke, C.M.; Young, J.; Lai, J.C. Enhancing the power-extraction efficiency of a flapping foil by active morphing. AIAA J. 2023, 61, 4056–4069. [Google Scholar] [CrossRef]
  11. Liu, W.; Xiao, Q.; Zhu, Q. Passive flexibility effect on oscillating foil energy harvester. AIAA J. 2016, 54, 1172–1187. [Google Scholar] [CrossRef]
  12. Liu, Z.; Lai, J.C.; Young, J.; Tian, F.B. Discrete vortex method with flow separation corrections for flapping-foil power generators. AIAA J. 2017, 55, 410–418. [Google Scholar] [CrossRef]
  13. Wu, S.; Wang, L. Numerical Study on the Energy Harvesting Performance of a Flapping Foil with Attached Flaps. Processes 2024, 12, 1963. [Google Scholar] [CrossRef]
  14. Kinsey, T.; Dumas, G. Optimal tandem configuration for oscillating-foils hydrokinetic turbine. J. Fluids Eng. 2012, 134, 031103. [Google Scholar] [CrossRef]
  15. Karakas, F.; Fenercioglu, I. Effect of phase angle on tandem flapping-wing power generation. Int. J. Energy Prod. Manag. 2017, 2, 95–105. [Google Scholar] [CrossRef]
  16. Young, J.; Tian, F.B.; Liu, Z.; Lai, J.C.; Nadim, N.; Lucey, A.D. Analysis of unsteady flow effects on the Betz limit for flapping foil power generation. J. Fluid Mech. 2020, 902, A30. [Google Scholar] [CrossRef]
  17. Zheng, M.; Bai, Y. The configuration effect of flapping foils for energy harvesting. Phys. Fluids 2022, 34, 113608. [Google Scholar] [CrossRef]
  18. Xiao, Q.; Zhu, Q. A review on flow energy harvesters based on flapping foils. J. Fluids Struct. 2014, 46, 174–191. [Google Scholar] [CrossRef]
  19. Kinsey, T.; Dumas, G. Parametric study of an oscillating airfoil in a power-extraction regime. AIAA J. 2008, 46, 1318–1330. [Google Scholar] [CrossRef]
  20. Liu, Z.; Tian, F.B.; Young, J.; Lai, J. Flapping foil power generator performance enhanced with a spring-connected tail. Phys. Fluids 2017, 29, 123601. [Google Scholar] [CrossRef]
  21. Guo, Z.; Zheng, C. Analysis of lattice Boltzmann equation for microscale gas flows: Relaxation times, boundary conditions and the Knudsen layer. Int. J. Comput. Fluid Dyn. 2008, 22, 465–473. [Google Scholar] [CrossRef]
  22. Tian, F.B.; Luo, H.; Zhu, L.; Liao, J.C.; Lu, X.Y. An efficient immersed boundary-lattice Boltzmann method for the hydrodynamic interaction of elastic filaments. J. Comput. Phys. 2011, 230, 7266–7283. [Google Scholar] [CrossRef] [PubMed]
  23. Yu, D.; Mei, R.; Shyy, W. A multi-block lattice Boltzmann method for viscous fluid flows. Int. J. Numer. Methods Fluids 2002, 39, 99–120. [Google Scholar] [CrossRef]
  24. Kim, Y.; Peskin, C.S. Penalty immersed boundary method for an elastic boundary with mass. Phys. Fluids 2007, 19, 053103. [Google Scholar] [CrossRef]
  25. Liu, Z.; Huang, Q.; Li, Z.; Li, Y.; Feng, X. Partial confinement effects on the performance of a flapping foil power generator. Phys. Fluids 2023, 35, 027108. [Google Scholar] [CrossRef]
  26. Tian, F.B.; Dai, H.; Luo, H.; Doyle, J.F.; Rousseau, B. Fluid–structure interaction involving large deformations: 3D simulations and applications to biological systems. J. Comput. Phys. 2014, 258, 451–469. [Google Scholar] [CrossRef] [PubMed]
  27. Mittal, R.; Dong, H.; Bozkurttas, M.; Najjar, F.; Vargas, A.; Von Loebbecke, A. A versatile sharp interface immersed boundary method for incompressible flows with complex boundaries. J. Comput. Phys. 2008, 227, 4825–4852. [Google Scholar] [CrossRef] [PubMed]
  28. Peskin, C.S. The immersed boundary method. Acta Numer. 2002, 11, 479–517. [Google Scholar] [CrossRef]
  29. Wang, L.; Tian, F.B. Numerical simulation of flow over a parallel cantilevered flag in the vicinity of a rigid wall. Phys. Rev. E 2019, 99, 053111. [Google Scholar] [CrossRef]
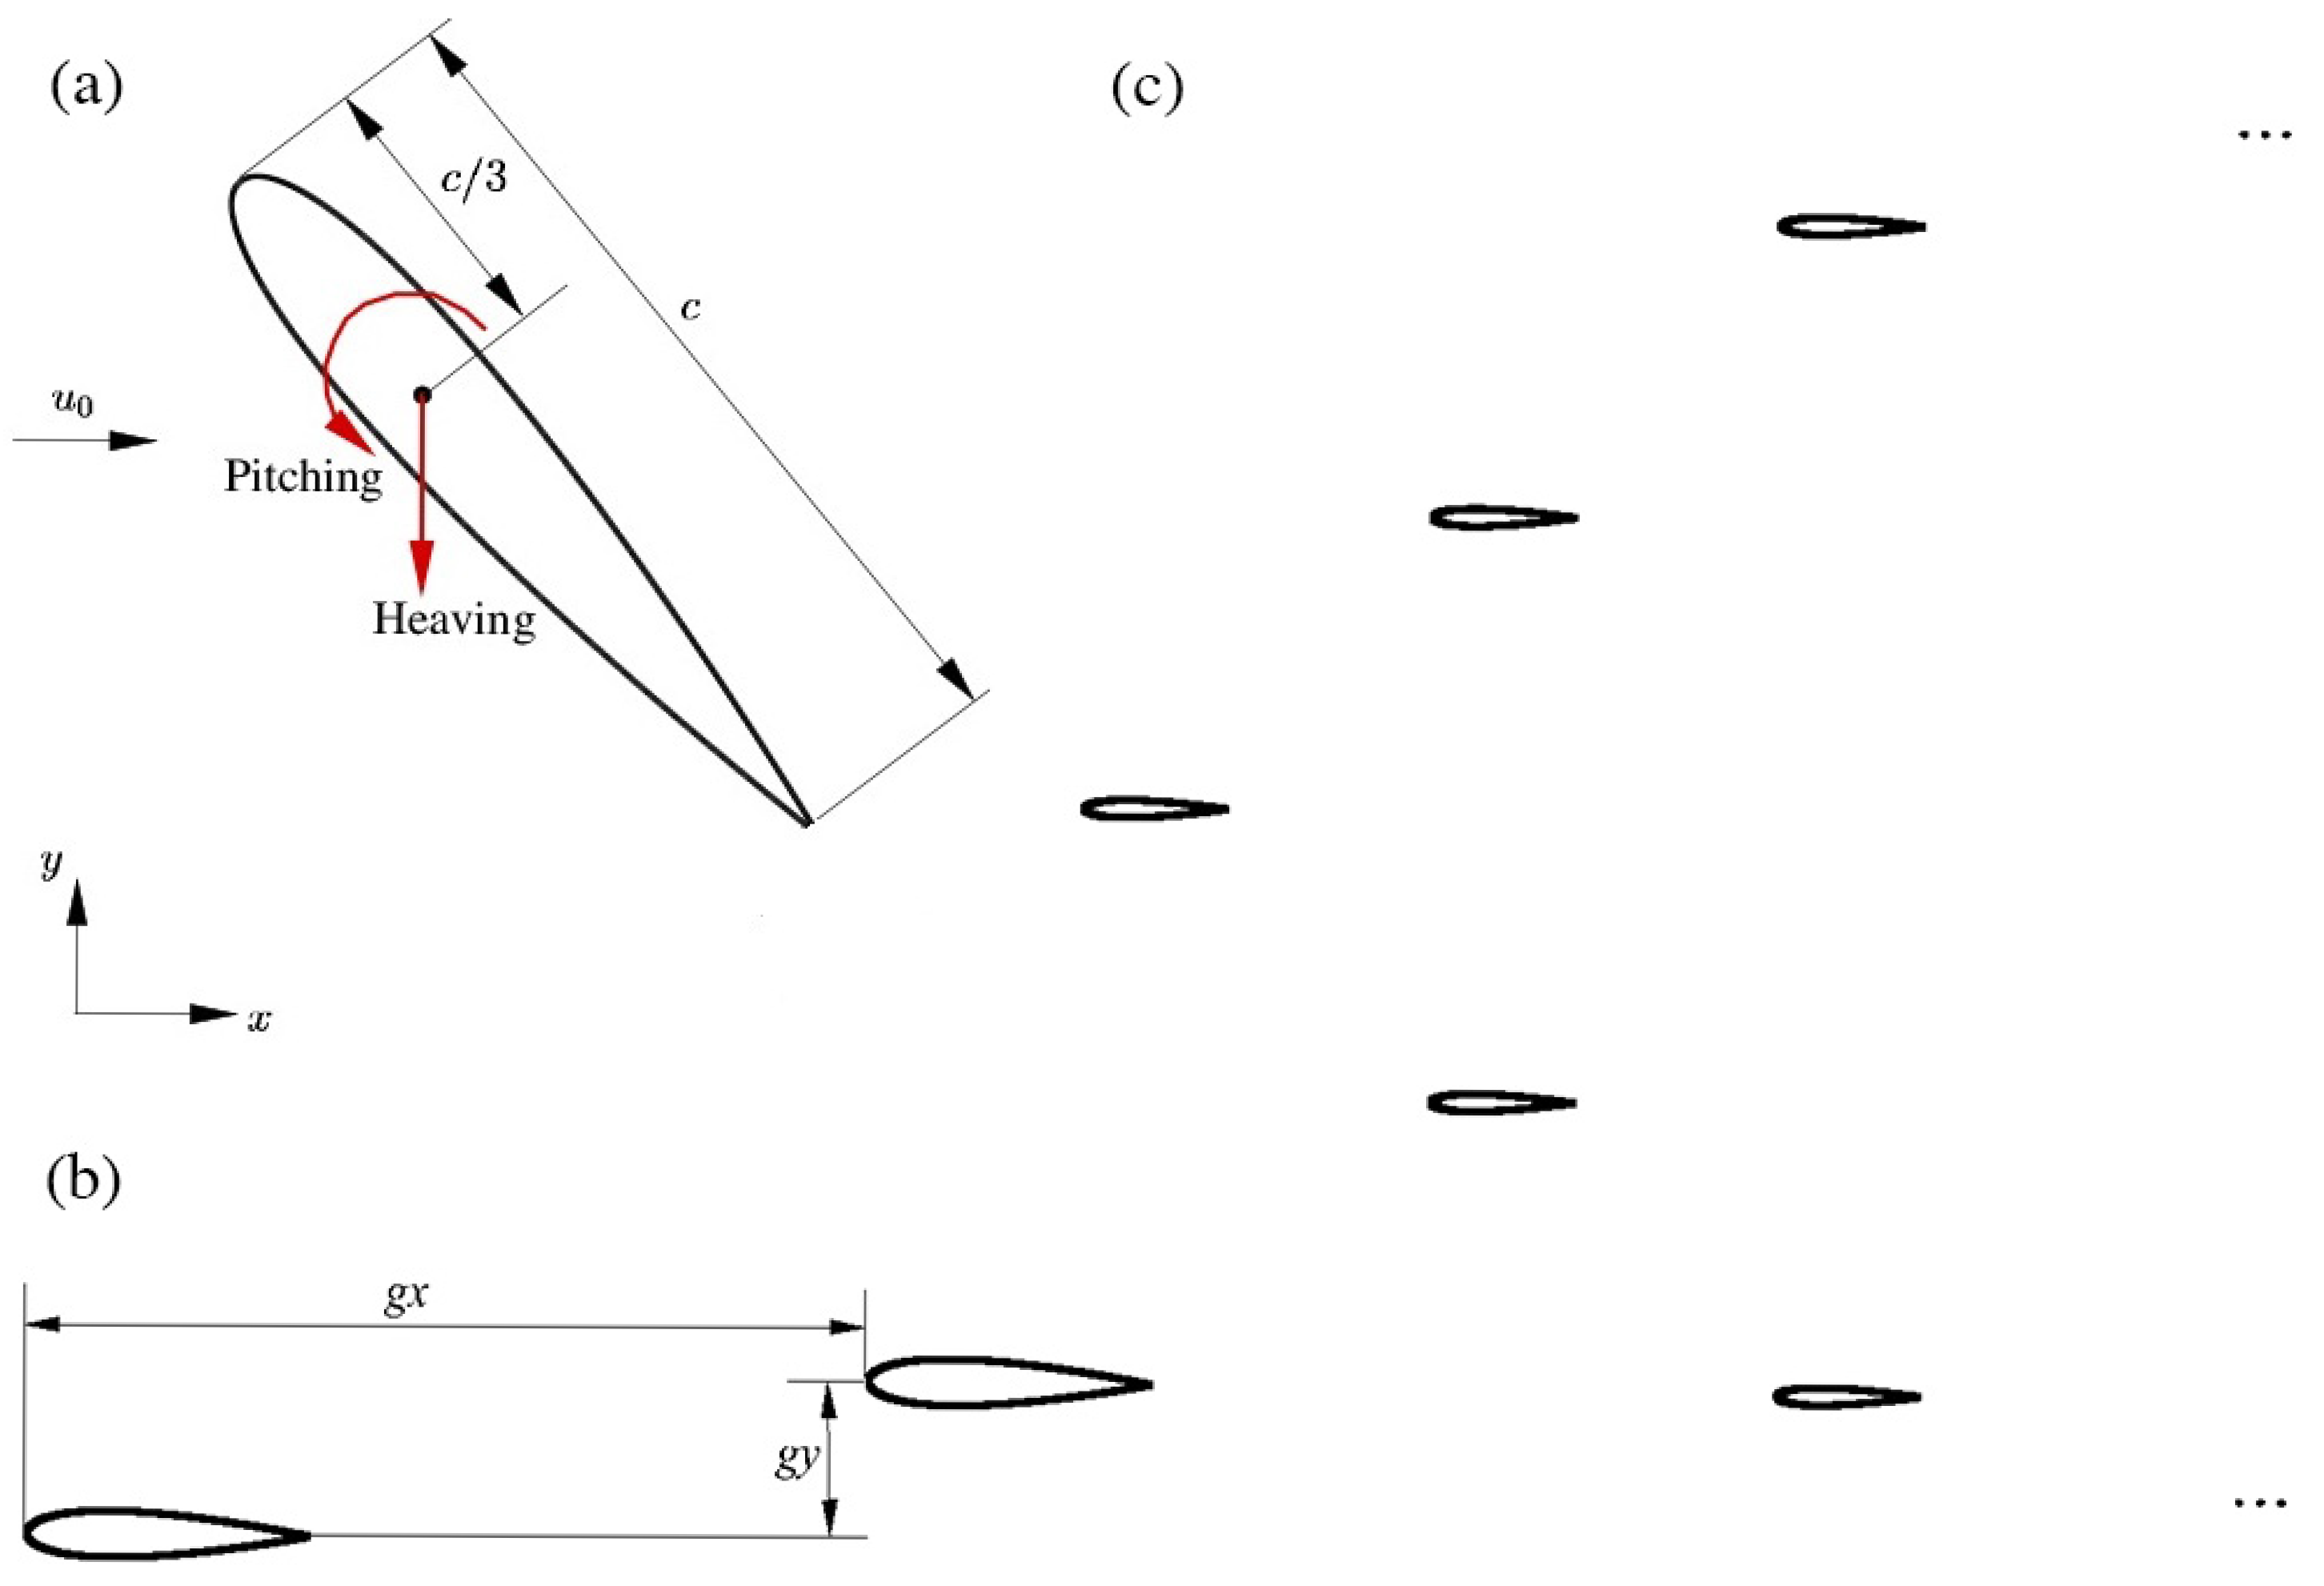
Figure 1. A schematic of the power generator (a), two-foil system (b) and multiple-foil system (c).
Processes 13 02739 g001
Figure 2. A schematic of the dynamic geometry-adaptive mesh used for the simulation, where only four zones close to the foil are visible due to the limited space, and six zones in total are used. The fluid mesh is dynamically updated to ensure that the mesh size close to the foil is 0.005 c .
Processes 13 02739 g002
Figure 3. Contours of mean power coefficients C P (left: fore-foil, middle: hind-foil, right: total) versus horizontal and vertical gaps between the two foils.
Processes 13 02739 g003
Figure 4. Time histories of power coefficients C P at g x = 1.25 , 2.0, 3.0, 4.0, and 5.0, g y = 0 , with ϕ = 0 , where (left) is for the fore-foil and (right) is for the hind-foil.
Processes 13 02739 g004
Figure 5. Time histories of power coefficients C P at g x = 3.0 , g y = 0 , 0.5, 1.0, 1.5, 2.0, 2.5, with ϕ = 0 , where (left) is for the fore-foil and (right) is for the hind-foil.
Processes 13 02739 g005
Figure 6. Contours of mean streamwise velocity (scaled by using the incoming flow velocity) for a single flapping foil (top), and mean streamwise velocity on line y = 0 (bottom left) and x = 2.5 (bottom right).
Processes 13 02739 g006
Figure 7. Contours of instantaneous vorticity at g x = 1.25 (top), 3.0 (middle), and 5.0 (bottom) with g y = 0 , where the left column is at t = T / 4 and the right column is at t = T / 2 .
Processes 13 02739 g007
Figure 8. Contours of mean power coefficients C P (left: fore foil, middle: hind-foil, right: total) versus horizontal and vertical gaps between the two foils at four phase differences ( 0.25 π , 0.5 π , 0.75 π , and π from top to bottom).
Processes 13 02739 g008
Figure 9. Comparison of power coefficients at ϕ = 0 and 0.25 π with g x = 2.5 and g y = 2.5 , where (left) is for the fore-foil and (right) is for the hind-foil.
Processes 13 02739 g009
Figure 10. Time histories of lift coefficient C L and power coefficient C P for three (top), five (middle), and seven (bottom) foils in a staggered arrangement.
Processes 13 02739 g010aProcesses 13 02739 g010b
Figure 11. Contours of instantaneous vorticity at g y = 0.5 (left) and 2.5 (right) with g x = 3.0 , where t = T / 4 , t = 2 T / 4 , 3 T / 4 , and 4 T / 4 (from top to bottom).
Processes 13 02739 g011
Table 1. Time-averaged power coefficient of the fore-foil C P ¯ f , hind-foil C P ¯ h , and the total efficiency difference compared with two single foils, defined as Δ η = 1 0.5 ( η f + η h ) / η s at g y = 0.0 .
g x C P ¯ f C P ¯ h Δ η
1.250.7740.134−45.9%
2.00.7660.232−40.6%
3.00.7490.281−38.7%
4.00.7810.272−37.3%
5.00.8140.274−35.2%
Table 2. Time-averaged power coefficient of the fore-foil C P ¯ f , hind-foil C P ¯ h , and the total efficiency difference compared with two single foils, defined as Δ η = 1 0.5 ( η f + η h ) / η s at g x = 3.0 .
g y C P ¯ f C P ¯ h Δ η
0.00.7490.281−38.7%
0.50.7500.348−34.6%
1.00.7640.589−19.5%
1.50.7710.665−14.5%
2.00.7840.808−5.2%
2.50.7890.9936.1%
Table 3. Time-averaged power coefficients of multiple-foil systems (where the subscript in C P ¯ i denotes the number of foils), and the total efficiency difference compared with the single-foil baseline, defined as Δ η = 1 i = 1 N η i / ( N η s ) , with N being the total number of foils in the system.
N C P ¯ 1 C P ¯ 2 C P ¯ 3 C P ¯ 4 C P ¯ 5 C P ¯ 6 C P ¯ 7 Δ η
1 (baseline)0.850-------
30.7330.9560.963----4.1%
50.7030.9030.9001.0471.062--8.6%
70.6920.8780.8771.0461.0361.0281.03110.7%
Disclaimer/Publisher’s Note: The statements, opinions and data contained in all publications are solely those of the individual author(s) and contributor(s) and not of MDPI and/or the editor(s). MDPI and/or the editor(s) disclaim responsibility for any injury to people or property resulting from any ideas, methods, instructions or products referred to in the content.