Article

Research on the Formation-Wellbore Temperature Profile Characteristics Under the Co-Existence of Kick and Leakage Condition

1
CNPC Engineering Technology R & D Company Limited, Beijing 102206, China
2
College of Petroleum Engineering, China University of Petroleum-Beijing, Beijing 102249, China
*
Author to whom correspondence should be addressed.
Processes 2025, 13(9), 2730; https://doi.org/10.3390/pr13092730
Submission received: 7 July 2025 / Revised: 5 August 2025 / Accepted: 14 August 2025 / Published: 26 August 2025
(This article belongs to the Section Energy Systems)

Abstract

During drilling, different kick locations significantly impact the formation-wellbore temperature (FWT) profile under the co-existence of kick and leakage condition (CKL). To ensure safety and efficiency during drilling, we study the effect of different kick locations on the FWT under the CKL. In this paper, a full transient heat transfer model based on the first law of thermodynamics is established to obtain four distinct WFT profiles under CKL conditions, incorporating both convective heat transfer and variable mass flow effects. Compared with the actual temperature measurement data, the reliability of the developed model is verified. The case studies show that the annular temperature (AT) is lower under the single-point leakage (SL), continuous leakage (CL), and CKL conditions than that in the normal drilling condition. Wellhead temperature in CKL differs significantly from that in normal drilling (ND). As the kick location gets closer to the bottom hole, the AT gets higher, and the temperature difference between the formation and annular gets smaller. Compared with the wellbore temperature profile under ND, the kick location can be detected by real-time monitoring of the FWT profile under the CKL.

1. Introduction

Efficient and safe development of oil and nature gas resources and reduction of drilling costs and risks are the goals we have been pursuing [1,2]. However, kick and leakage are prevalent in drilling and are increasingly easily observed, mainly in fractured formations [3]. When occurring, kick and leakage will threaten the drilling operations’ safety. This can lead to uncontrolled blowouts, reservoir injury, extended drilling cycles, increased drilling costs, and even significant property damage and casualties [4,5]. When kick and leakage co-occur, i.e., under the co-existence of a kick and leakage (CKL) condition, the situation becomes more complicated and more challenging to deal with [6]. Underbalanced drilling keeps the wellbore pressure below formation pressure, effectively attenuating or avoiding leakage [7]. Pressure-controlled drilling keeps the wellbore pressure near equilibrium, avoiding kick and leakage [8]. However, for formations when drilling narrow safety density windows in a bare borehole section, there is still a risk of CKL [9,10]. Consequently, drilling engineers have attached significant importance to this issue, undertaking comprehensive research and practical applications across various domains—including leakage prevention and plugging, well killing, and well control—resulting in substantial empirical insights and theoretical advancements [11,12,13,14]. However, there is little research on the formation-wellbore temperature (FWT) under the CKL, and there is also a lack of mechanical models to describe this phenomenon. Wellbore temperature (WT) not only significantly affects the rheology and density of drilling fluids but also impacts cementing quality and wellbore wall stability [15]. Meanwhile, real-time monitoring of WT changes to determine the kick and leakage location is critical for well-killing and control operations [16]. Therefore, accurate WT acquisition is the basis for effectively dealing with CKL.
Numerous researchers have made significant contributions to the modeling of well-bore temperature (WT) from a variety of perspectives. Existing studies on WT during drilling primarily focus on distinct operational modes, particularly shut-in and circulating conditions in deepwater or high-depth formations [17,18]. Li et al. [19] developed a numerical heat transfer model (NHTM) to estimate the formation temperature (FWT) under kick scenarios in deep formations. Their work analyzed the influence of kick intensity and wellbore geometry on FWT across both circulating and shut-in regimes.
Drawing on the principles of thermal interaction between the wellbore and surrounding formation during both circulation (CD) and shut-in (SI) stages, Yang et al. [20,21] developed a numerical heat transfer model (NHTM) to characterize thermal transport under leakage conditions, evaluating the influence of leakage depth and structural configuration on the overall thermal response of the wellbore system. Zhang et al. [16] further proposed a transient NHTM that incorporated varying leakage depths and examined formation temperature behavior under single-point (SL) and continuous leakage (CL) scenarios. Luheshi et al. [22] introduced an NHTM targeting near-wellbore thermal disturbances caused by leakage, with emphasis on how drilling fluid and adjacent rock thermal properties shape the radial temperature distribution. Tekin et al. [23] utilized the thermal contrast between inlet and outlet drilling fluids to estimate formation temperature, thereby assessing leakage-induced deviations in wellbore temperature. Considering the effect of leakage on fluid dynamics and heat transfer, Fomin et al. [24] proposed a predictive model for FWT in formations characterized by developed fracture networks. They analyzed how various fluid flow regimes, drilling rates, and primary fracture positions affect FWT. Zhang et al. [25] presented a transient NHTM based on the first law of thermodynamics, evaluating the impact of kick rate and kick location on WT in continuous formations at the bottom hole. Espinosa-Paredes et al. [26] introduced a transient NHTM under leakage conditions to study WT behavior during CD and SI. However, their model only accounted for conductive heat transfer in the formation and neglected convective effects from fluid flow. To address this, Chen et al. [27] developed a transient NHTM under leakage conditions based on energy and mass conservation laws, incorporating the change in heat transfer state between the drill pipe, annulus, and wellbore wall once mud enters the fractures. They proposed a method to determine leakage location using annulus fluid temperature profiles. Zhang et al. [28] constructed a transient heat transfer model of the formation-wellbore system under compound kick and leakage (CKL) conditions and proposed a new FWT-based detection method. However, their model did not compare the influence of single-point versus continuous kick or leakage on FWT, which may introduce inaccuracies in the detection method. Fluid loss or seepage may lead to reservoir property changes, such as wettability alteration or sediment instability, which can indirectly influence near-wellbore thermal behavior. Related studies have reported such effects during CO2 fracturing and gas production from hydrate-bearing sediments [29,30] Although these factors are not explicitly modeled in this study, they provide important context for understanding the complexity of wellbore-formation interactions.
In summary, existing studies have primarily examined the effects of kick and leakage on formation temperature (FWT) separately, with limited attention given to FWT under compound kick and leakage (CKL) conditions. Furthermore, most research has focused on single-point kick or leakage scenarios, while the influence of continuous kick or leakage on FWT remains insufficiently explored. Therefore, it is essential to investigate FWT under CKL conditions and to analyze the effects of different kick and leakage locations and types. To address this gap, the NHTM was developed based on the principles of energy and mass conservation. The model incorporates convective heat transfer and variable mass flow resulting from fluid exchange between the wellbore and formation under CKL conditions. Using this model, four representative cases were simulated and analyzed to evaluate the corresponding FWT behavior. The results offer theoretical insights that support the development of FWT-based detection methods for CKL during drilling operations.

2. Physical Model

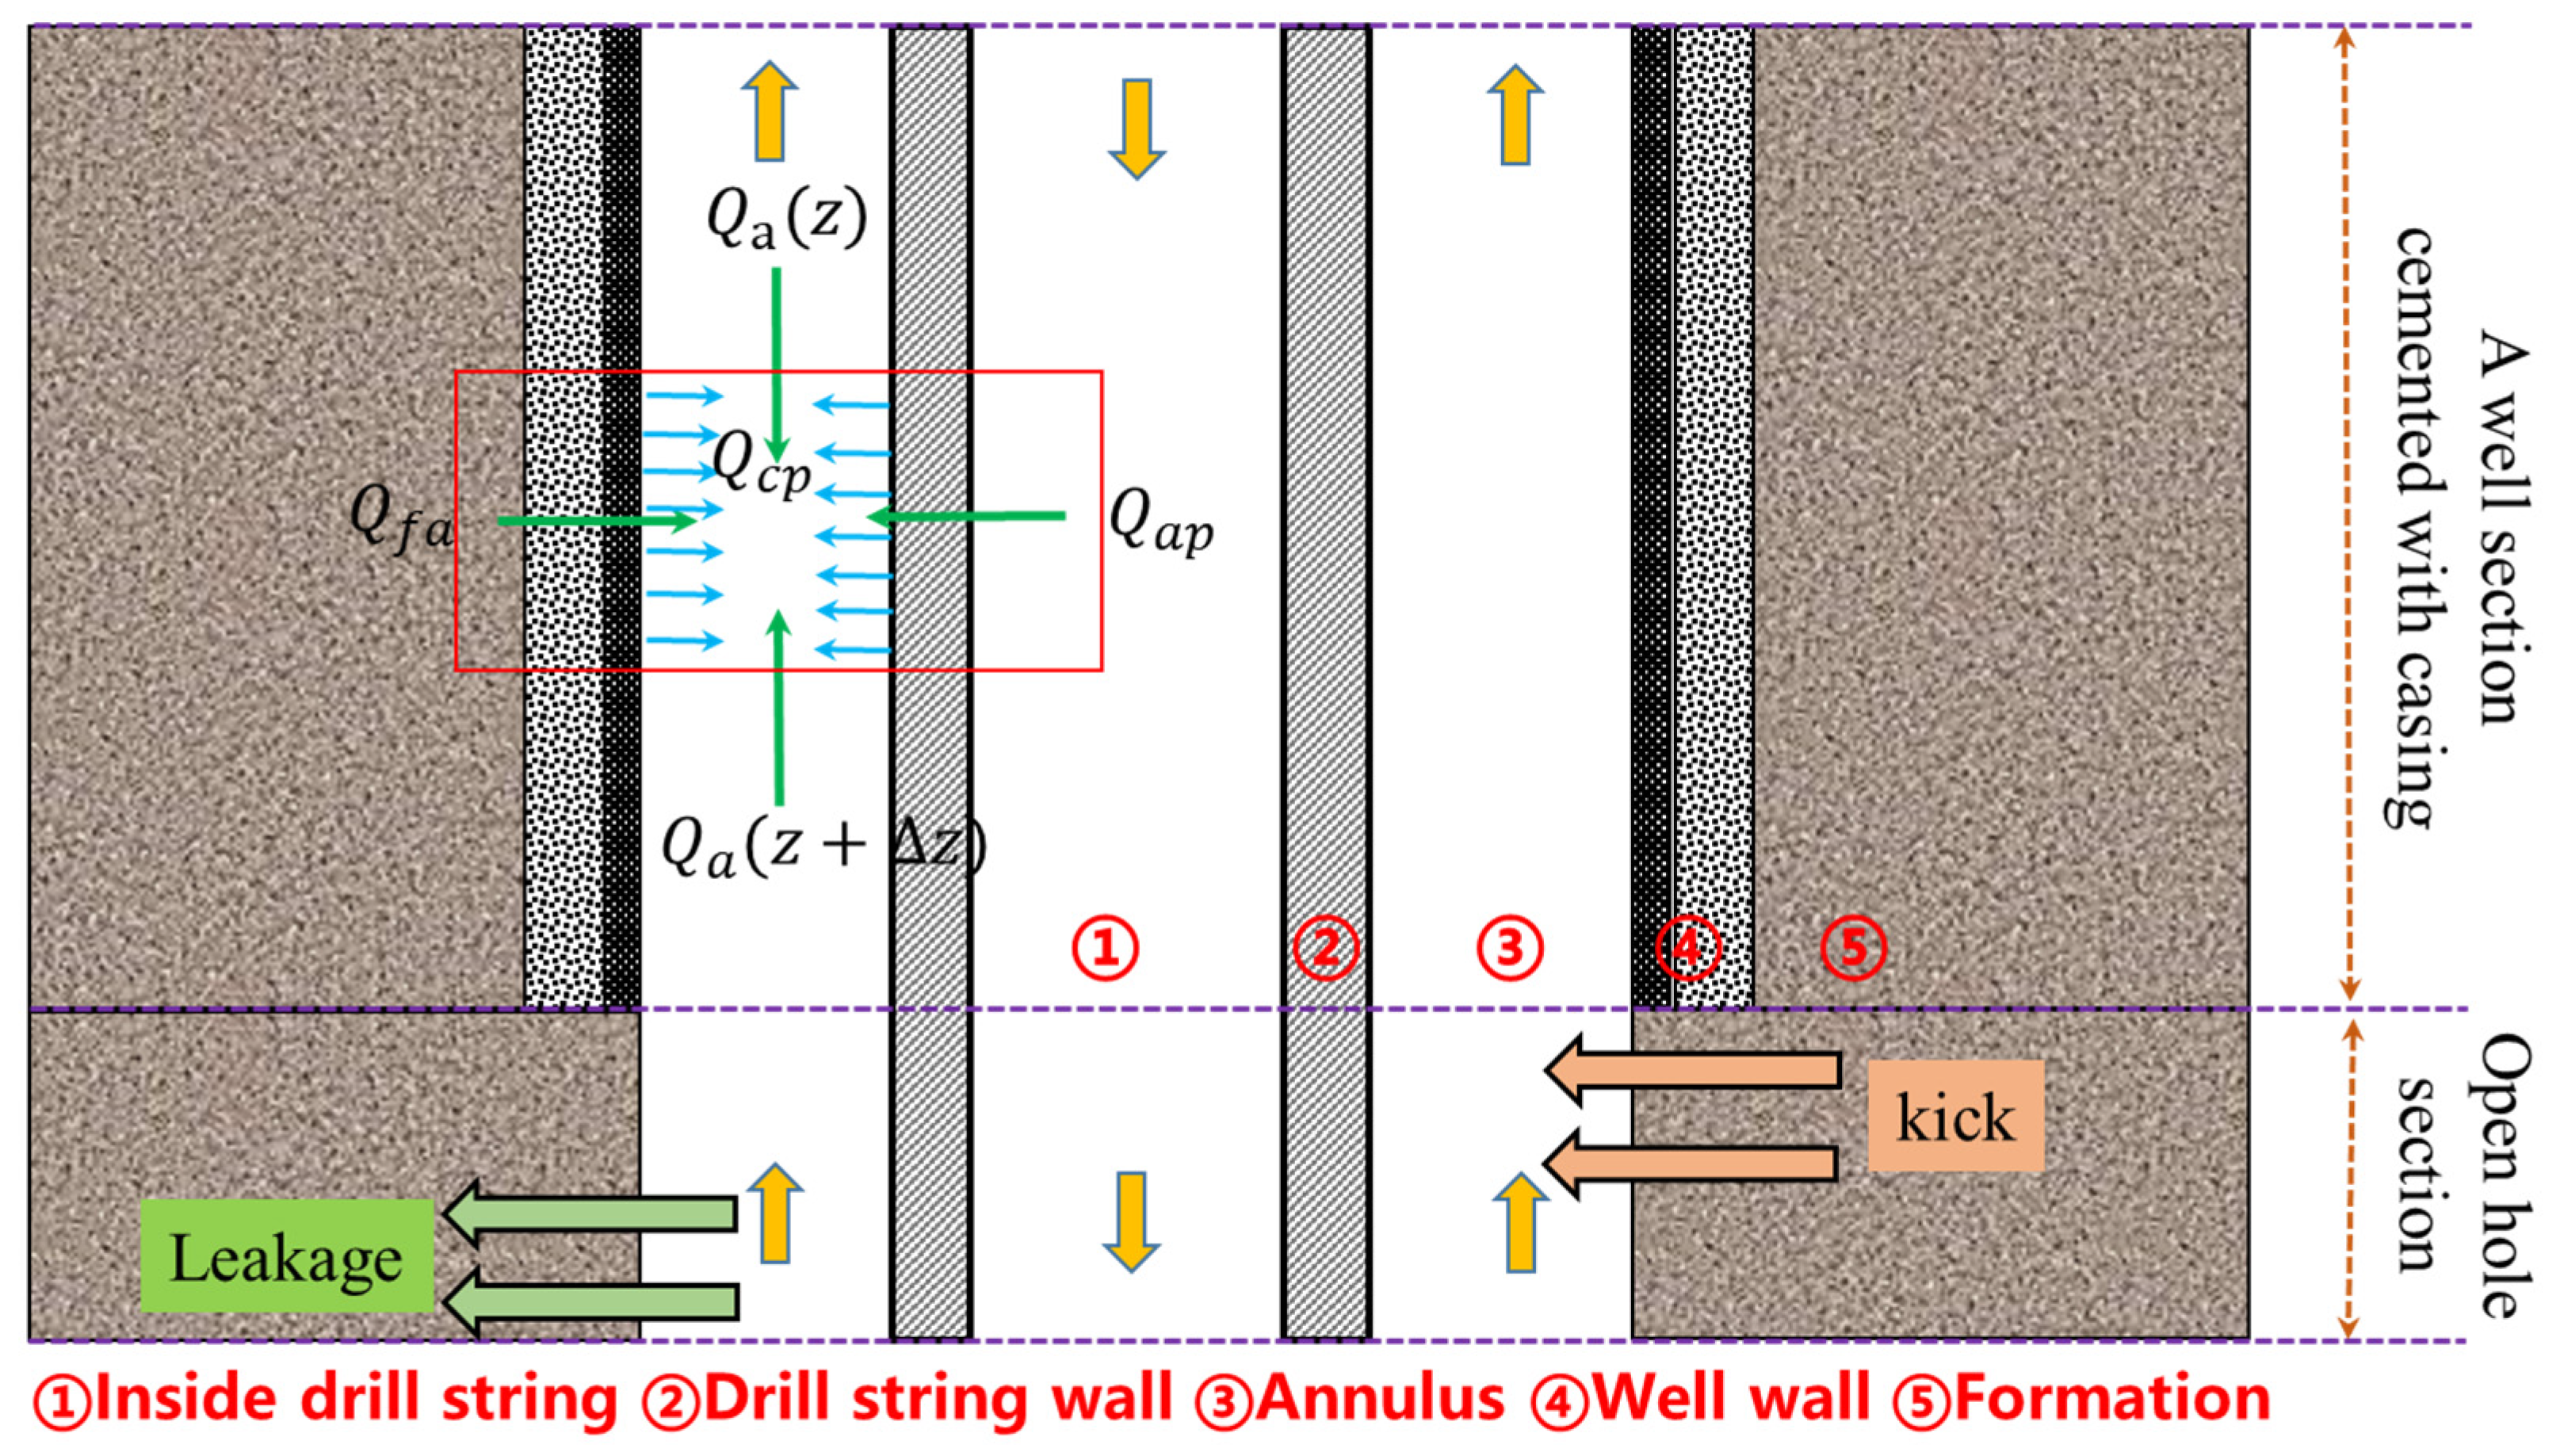
When drilling encounters an abnormally low-pressure formation, the wellbore pressure is greater than formation pressure, causing the mud in the annulus to leak into the formation, resulting in a rapid drop in annulus pressure and inducing a kick from the abnormally high-pressure formation. This kind of downhole complex accident is called the “co-existence of kick and leakage” (CKL), which often occurs in drilling in developed carbonate formations. As shown in Figure 1, we can classify the CKL into four cases according to the different types of kick and leakage.
  • Case 1. A single-point leakage at the bottom and a single-point kick (SK) at the upper bare borehole.
  • Case 2. A continuous leakage (CL) at the bottom and a single-point kick at the upper bare borehole.
  • Case 3. A single-point leakage at the bottom and a continuous kick (CK) at the upper bare borehole.
  • Case 4. A continuous leakage at the bottomhole and a continuous kick at the upper bare borehole.
In this study, the thermophysical properties of the formation, such as thermal conductivity and density, are assumed to be constant. This simplification is made deliberately, based on two primary considerations. First, the objective of this work is to develop and analyze a transient thermal model for annular temperature prediction under CKL (Co-existence of Kick and Leakage) conditions, with emphasis on mechanism exploration rather than comprehensive reservoir-formation coupling. Second, in practical field applications, in situ measurement of rock properties under dynamic stress or fracturing conditions is rarely available, especially in high-pressure/high-temperature (HP/HT) wells. Introducing spatially or temporally varying rock properties would significantly increase the model complexity and computational cost, reducing its applicability for rapid engineering evaluation.
Furthermore, the modeling domain is limited to a short time scale (on the order of hours) and follows a one-dimensional or axisymmetric framework, within which the impact of geo-mechanical deformation on heat transfer is considered as secondary. While carbonate reservoirs are known to contain natural fractures, the present model does not explicitly simulate fracture-induced thermal property changes. The potential coupling between mechanical deformation (e.g., fracture aperture variation) and heat transfer is indeed acknowledged and valuable, but is beyond the current scope. Future work will aim to incorporate pyroclastic and fracture-dependent thermal conductivity models, as pointed out by recent studies, to improve accuracy under complex geological conditions.
When a CKL event occurs, thermal interactions within the wellbore and surrounding formation become highly intricate. As shown in Figure 2, the injection of drilling mud into the drill string at a defined entry temperature initiates thermal energy transfer across the system through both convective and conductive mechanisms. This process leads to temperature redistribution across different zones, ultimately affecting the formation-wellbore temperature (FWT) profile. During a kick, formation fluids intrude into the annulus, bringing additional heat into the wellbore and causing an increase in AT. Conversely, leakage results in the loss of both mud and heat from the annulus, leading to a decrease in AT. Moreover, convective heat transfer driven by fluid exchange between the wellbore and formation during kick or leakage events further influences the FWT.
Therefore, temperature variations in the wellbore-formation system can be attributed to the following four factors:
  • Heat convection caused by drilling fluids flow in the annulus and drilling string.
  • Variable mass flow and heat convection due to formation fluid intrusion into the annulus.
  • Heat loss and convection due to mud leakage in the annulus.
  • Heat transfer between formation and wellbore.

3. Mathematical Model

After the CKL occurs, the heat exchange process between the formation and the wellbore can be regarded as a heat exchanger with certain boundary conditions. As shown in Figure 2, the wellbore to formation heat transfer system can be radially divided into five zones (inside drill string, drill string wall, annulus, well wall, and formation). According to the first law of thermodynamics, i.e., the energy increment in the unit is equal to the sum of the net heat flow into the unit and the work performed by the outside world on the unit, the governing equations are established for the five divided regions, respectively, and a complete transient heat transfer model of wellbore and formation under the CKL. Meanwhile, to solve the model, this paper made the following reasonable assumptions:
(1)
The thermophysical properties of solid media (pipe, cement and formation) are considered constant and do not depend on temperature changes.
(2)
There is one-dimensional axial flow in the wellbore.
(3)
The effect of cuttings on heat exchange between wellbore and formation is ignored
(4)
To reduce computational complexity, the wellbore wall is modeled as a homogeneous medium, and the multi-layer radial heat transfer within the “casing–cement–formation” system is neglected.

3.1. Heat Transfer Model in Drill String

The energy gain of the fluid in the drill string results from axial convective heat transfer, radial forced convection with the drill string wall, and a frictional heat source term. Accordingly, the governing heat transfer equation for the fluid inside the drill string can be expressed as follows:
Q p ρ l q l C l T p z 2 π r p i h p i T p T w = ρ l C l π r p i 2 T p t

3.2. Heat Transfer Model of Drill String Wall

The drill string wall serves as the thermal interface between the inner drill string and the annulus, facilitating forced convective heat transfer through both its inner and outer surfaces. As a result, the energy change in the drill string wall is governed by a combination of conductive and convective heat transfer. Based on this, the heat transfer equation for the drill string wall can be formulated:
k w 2 T w z 2 + 2 r p o h p o r p o 2 r p i 2 T a T w + 2 r p i h p i r p o 2 r p i 2 T p T w = ρ w C w T w t

3.3. Heat Transfer Model of the Annulus

The energy variation in the annulus includes axial heat convection, radial forced convection with both the outer surface of the drill string and the wellbore wall, and a heat source term. Additionally, the annular temperature is influenced by both the kick rate and leakage rate. In this study, the corresponding heat transfer equation for the annulus is established by considering various CKL scenarios.
Case 1: A single point of leakage occurred at the bottom of the well, and a single point of kick occurred at a certain depth of the upper open hole.
① Well section between bottom hole and kick location
Q a r c i 2 r p o 2 + ρ l C l q l q l o s s r c i 2 r p o 2 T a z + 2 π r c i h c i T c T a r c i 2 r p o 2 + 2 π r p o h p o T w T a r c i 2 r p o 2 = ρ l C l π T a t
② Well section above the kick location
Q a r c i 2 r p o 2 + ρ l C l q l q l o s s + q k i c k r c i 2 r p o 2 T a z + 2 π r c i h c i T c T a r c i 2 r p o 2 + 2 π r p o h p o T w T a r c i 2 r p o 2 = ρ l C l π T a t
Case 2: The continuous leakage occurred at the bottom hole, and a single point kick occurred at a certain depth of the upper open hole.
① Well section between bottom hole and kick location
Q a r c i 2 r p o 2 + ρ l C l q l j = 1 n q j l o s s r c i 2 r p o 2 T a z + 2 π r c i h c i T c T a r c i 2 r p o 2 + 2 π r p o h p o T w T a r c i 2 r p o 2 = ρ l C l π T a t
② Well section above the kick location
Q a r c i 2 r p o 2 + ρ l C l q l q l o s s + q k i c k r c i 2 r p o 2 T a z + 2 π r c i h c i T c T a r c i 2 r p o 2 + 2 π r p o h p o T w T a r c i 2 r p o 2 = ρ l C l π T a t
Case 3: A single point of leakage occurred at the bottom hole, and a continuous kick occurred at a certain depth of the upper open hole.
① Well section between bottom hole and kick location
Q a r c i 2 r p o 2 + ρ l C l q l q l o s s r c i 2 r p o 2 T a z + 2 π r c i h c i T c T a r c i 2 r p o 2 + 2 π r p o h p o T w T a r c i 2 r p o 2 = ρ l C l π T a t
② Well section above the kick location
Q a r c i 2 r p o 2 + ρ l C l q l q l o s s + j = 1 n q j k i c k r c i 2 r p o 2 T a z + 2 π r c i h c i T c T a r c i 2 r p o 2 + 2 π r p o h p o T w T a r c i 2 r p o 2 = ρ l C l π T a t
Case 4: The continuous leakage occurred at the bottom of the well and continuous kick occurred at a certain depth in the upper open hole.
① Well section between bottom hole and kick location
Q a r c i 2 r p o 2 + ρ l C l q l j = 1 n q j l o s s r c i 2 r p o 2 T a z + 2 π r c i h c i T c T a r c i 2 r p o 2 + 2 π r p o h p o T w T a r c i 2 r p o 2 = ρ l C l π T a t
② Well section above the kick location
Q a r c i 2 r p o 2 + ρ l C l q l j = 1 n q j l o s s + j = 1 n q j k i c k r c i 2 r p o 2 T a z + 2 π r c i h c i T c T a r c i 2 r p o 2 + 2 π r p o h p o T w T a r c i 2 r p o 2 = ρ l C l π T a t

3.4. Heat Transfer Model of the Well Wall

In field drilling, the casing and cement can be uniformly simplified in the wall. The well wall mainly carries out heat exchange with annular fluid and formation by forced convection heat transfer and, considering the influence of axial heat conduction, the heat transfer equation of the well wall can be expressed as follows:
k c 2 T c z 2 + 2 r c o h c o r c o 2 r c i 2 T f T c + 2 r c i h c i r c o 2 r c i 2 T a T c = ρ c C c T c t

3.5. Heat Transfer Model of the Formation

In the formation, only radial and axial heat conduction are considered. Additionally, heat exchange between the fluids in the kick and leakage layers is considered. Accordingly, the heat transfer equation for the formation can be expressed as follows:
① Normal layer
2 T f z 2 + 2 T f r 2 = ρ f C f k f T f t
② Leakage layer
2 T f z 2 + 2 T f r 2 + ρ f C f u l o s s k f T f r = ρ f C f k f T f t
③ Kick layer
2 T f z 2 + 2 T f r 2 + ρ f C f u k i c k k f T f r = ρ f C f k f T f t

3.6. Auxiliary Model

① Convective heat transfer coefficient
The convective heat transfer coefficient is related to the fluid composition, flow state and wall size, and can be calculated from the Nusser number (Nu), as follows:
h = N u k D h y
Petersen [31] and Rao [32] proposed Nusselt number calculation model in laminar and turbulent.
N u = 4.364 3 n + 1 / 4 n 0.323 Re < 2300 N u = 0.0152 Re 0.845 Pr 1 / 3 Re 2300
② Heat source term
The heat source terms in the drill string and annulus can be expressed as follows:
Q p = f ρ l u p 2 D h y p q l / A p Q a = f ρ l u a 2 D h y a q l / A a
In the formula, the friction coefficient (f) is calculated according to the research results of Chen et al. [27], as shown in Equation (18). The friction coefficient is used to determine the amount of heat generated by fluid friction during flow through the wellbore. This frictional heat is considered as a source term in the temperature field model, contributing to the thermal energy in both the drill string and annulus regions, as defined in Equation (17):
f = 16 Re Re 2100 1 4 log Δ / D 3.7065 5.0452 Re log Λ 2 Re > 2100
Re = ρ l u D h y μ e f f μ e f f = μ p γ n 1

4. Model Solution

4.1. Initial Condition

At the initial time, the initial temperature of the whole wellbore-formation heat transfer system is the original formation temperature:
T i z , 0 = T s + G z i = p , w , a , c , f

4.2. Boundary Condition

The drilling fluid temperature can be measured directly at the inlet. In the bottom hole, the temperature inside drill string, drill string wall and annulus is the same:
T p 0 , t = T i n T p H , t = T w H , t = T a H , t

4.3. Solution Process

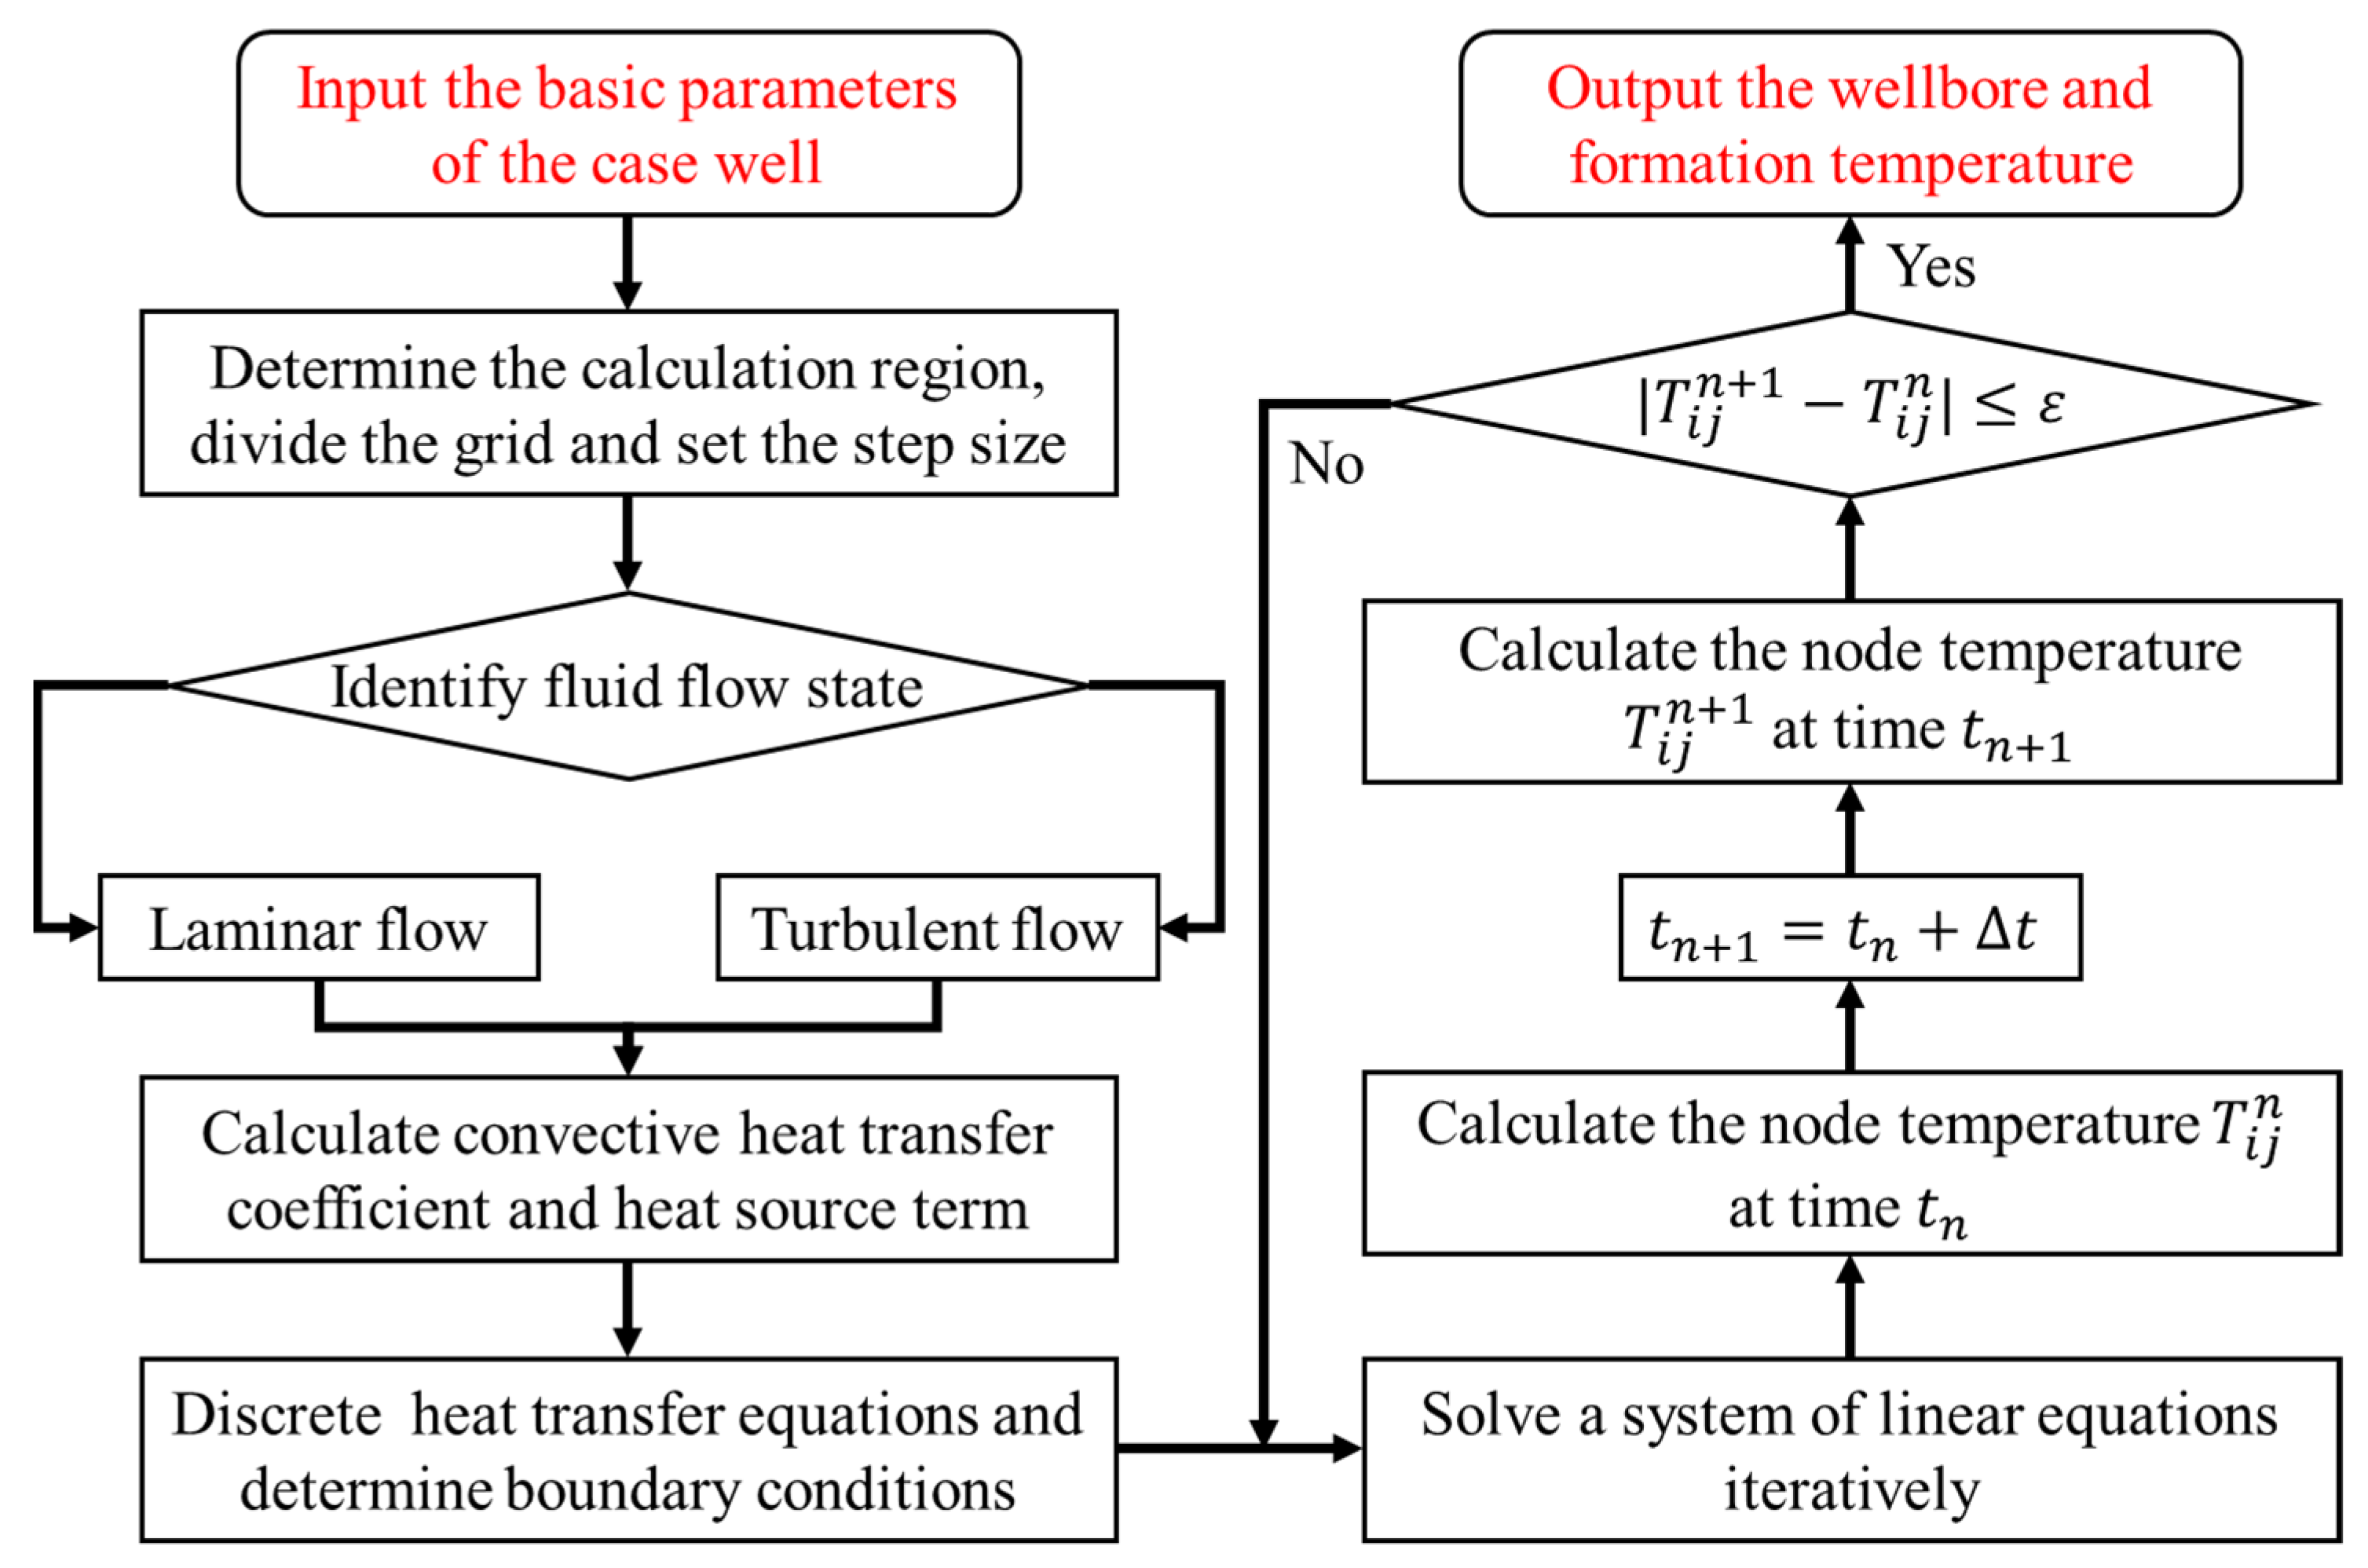
The transient heat transfer model of wellbore-formation is a complex partial differential form under the CKL. In this paper, the finite difference method is adopted to solve the model, and the detailed solution process is shown in Figure 3. A fully implicit scheme is applied to discretize the governing equations in both time and spatial domains, which ensures numerical stability and permits the use of relatively large time steps. The temporal derivative is discretized using a backward difference, while the spatial second-order derivatives are approximated by central differences. This leads to a tridiagonal system of algebraic equations at each time step. The resulting system is solved iteratively using the Gauss–Seidel method, which is suitable for banded matrices and provides reliable convergence for the thermal conduction problems involved. This numerical approach allows accurate simulation of dynamic temperature variations along the wellbore and formation under complex flow and boundary conditions during the co-existence of kick and leakage.

5. Model Validation

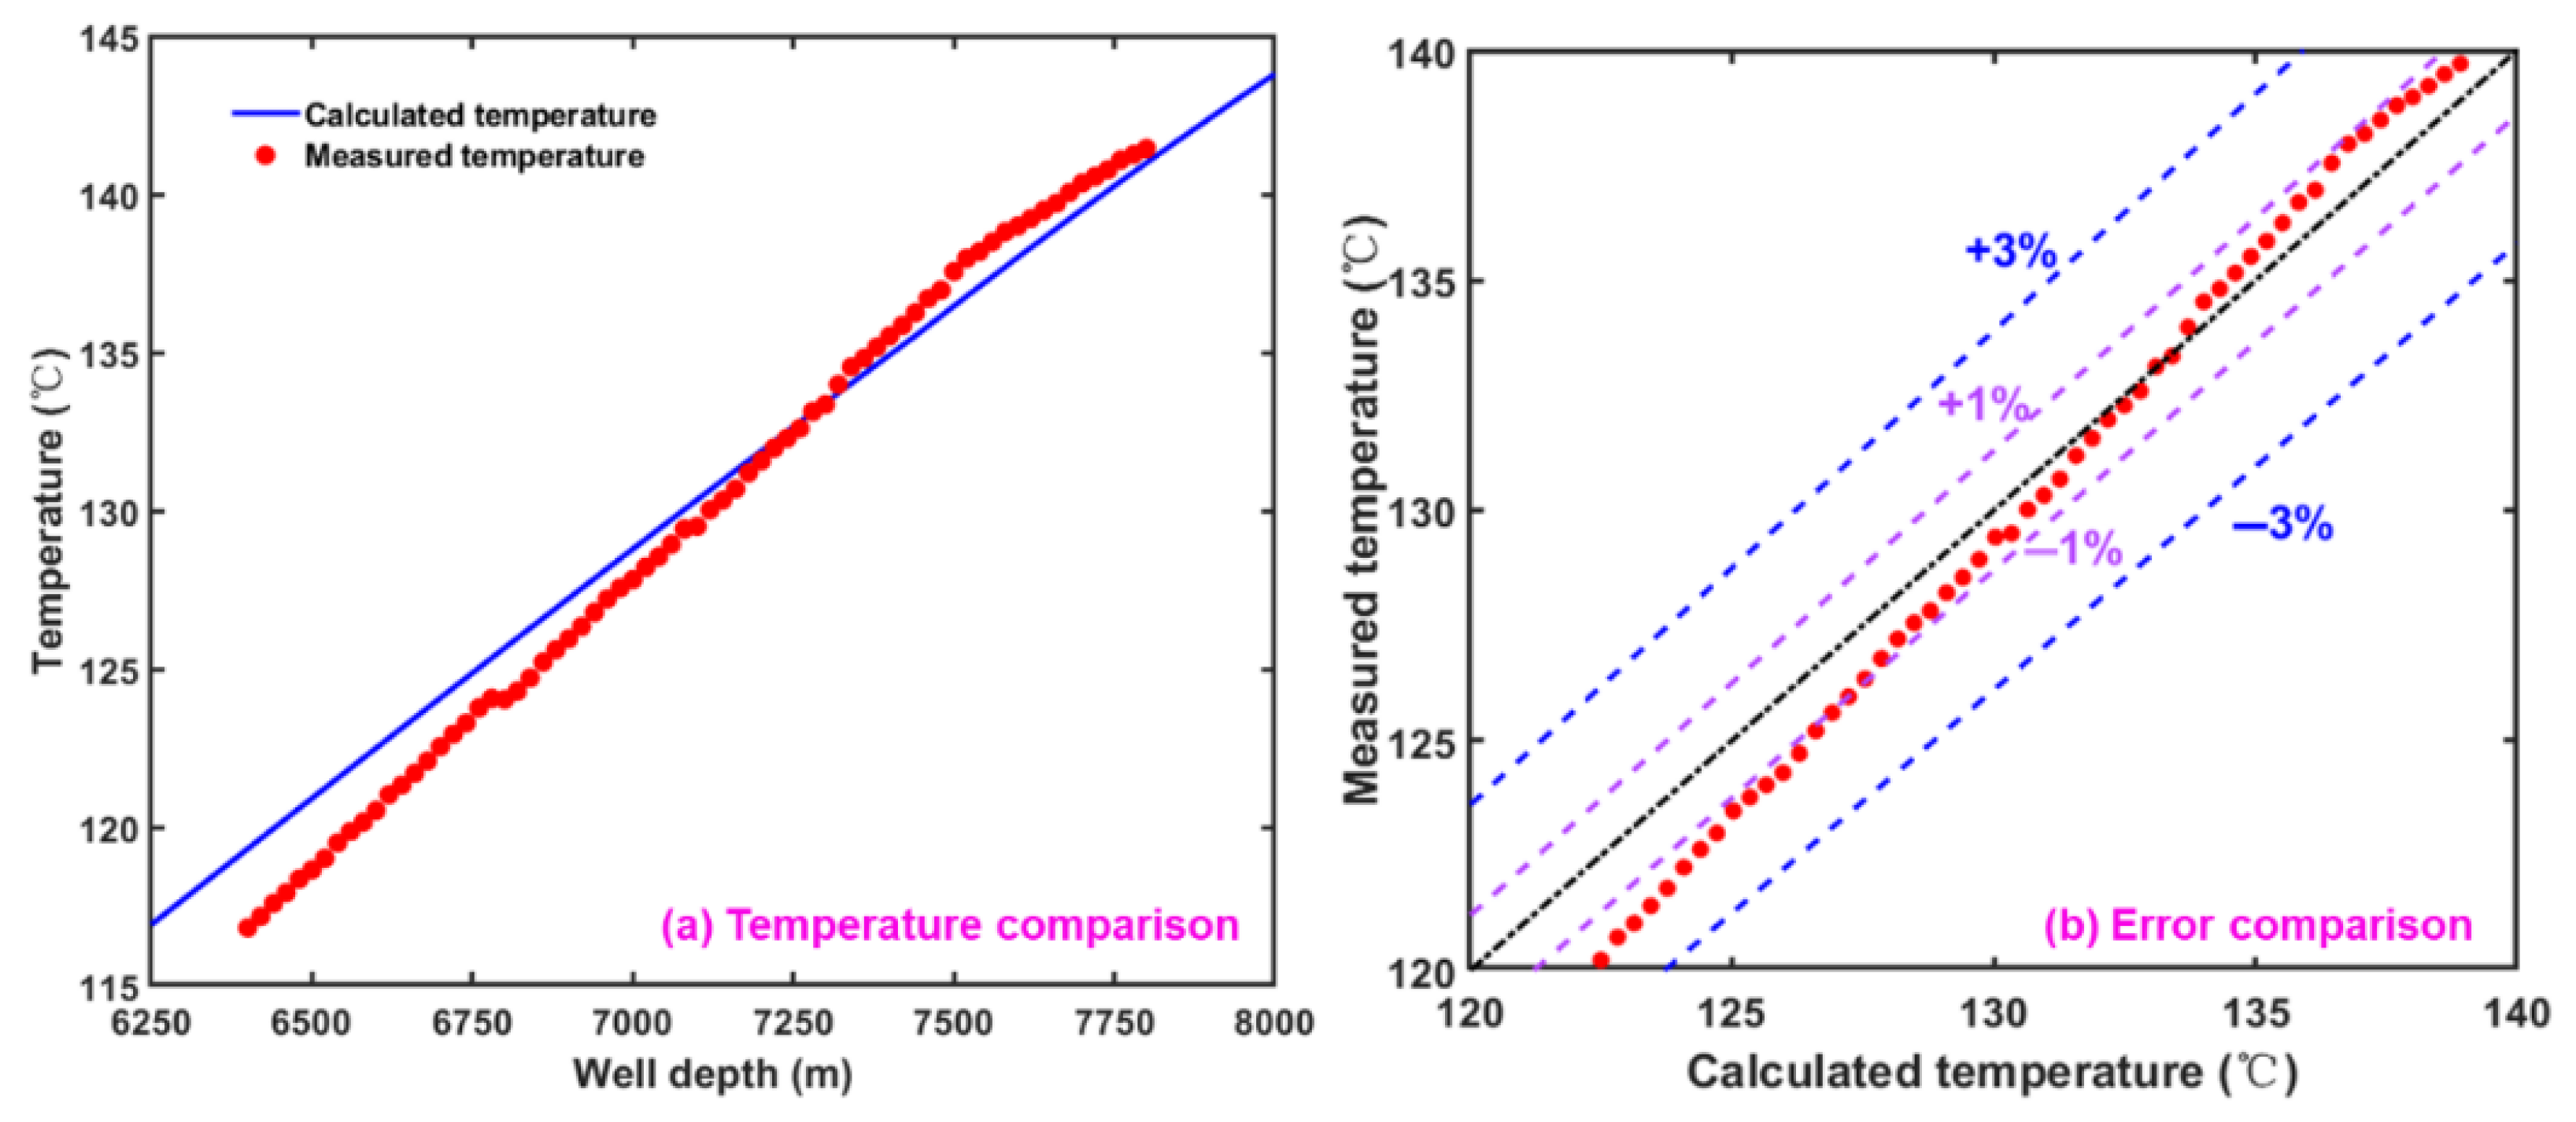
To verify the reliability of the established model, temperature readings were obtained continuously from the 6400–7800 m depth interval of Well Tazhong 862H using a measurement-while-drilling (MWD) system [28]. The pressure accuracy of the MWD system is typically ±0.5%, while the temperature accuracy is ±1 °C. The data acquisition frequency generally ranges from a few seconds to several minutes, with common updates occurring every 10 to 30 s. This well, situated in Xinjiang, China, is classified as ultra-deep and penetrates a carbonate reservoir, with a total depth of approximately 8000 m. Relevant data concern the borehole configuration, bottom hole assembly (BHA), and thermal characteristics of the formation. Following an extended circulation phase lasting 8 h, the recorded bottom hole temperature data were employed for numerical validation. A comparison between the computed and actual temperature values is illustrated in Figure 4.
Figure 4a shows that, as the well depth increases, the bottom hole temperature also rises. The calculation results increasingly align with the measured data, indicating a consistent trend. Figure 4b illustrates that the error range of the calculated results is between −1.2 °C and 3.0 °C, with a relative error of less than 3%. This demonstrates that the transient heat transfer model of the wellbore-formation system is both accurate and reliable.
In this study, the model is validated using downhole temperature data within the depth range of 6400–7800 m. These data were obtained from MWD tools and have undergone correction and filtering to reduce noise and eliminate circulation delay effects. Although the exact accuracy specifications of the MWD tools are unavailable, the processed data represent the best available reference for engineering comparison.
The validation is based on representative steady-state points and shows a relative error of less than 3%, which meets engineering requirements. However, we acknowledge that this comparison does not account for possible systematic errors or sensor-related uncertainties. Factors such as tool response delay and fluid circulation lag may affect the measured temperature values to some extent.
To enhance the robustness of model evaluation, we plan to introduce uncertainty quantification methods (e.g., Monte Carlo analysis) in future work. Furthermore, the current validation is limited to a deep section due to data availability. As more field data become accessible, broader validation across different depths and well conditions will be conducted.

6. Results and Discussion

To ensure practical relevance, Well YT1 was selected as a representative field case. This vertical exploratory borehole, located in China’s Junggar Basin, targets the evaluation of hydrocarbon presence within the Upper Permian Wuerhe conglomerate formation. During the drilling process, multiple incidents of fluid loss and wellbore influx were encountered in the third open-hole interval, adversely affecting operational efficiency. Key data—including borehole architecture, bottom hole assembly (BHA), thermal characteristics of the formation, and other core drilling parameters—are summarized in Table 1, Table 2, Table 3 and Table 4. In this context, OD (outer diameter) and ID (inner diameter) are used to describe the external and internal dimensions of casing components, respectively.
During the numerical simulation, a total inflow/outflow rate of 0.01 m3/s was assumed, with the continuous kick or loss zone extending 500 m in length. The specific depth intervals where these events occur are detailed in Table 5. For computational efficiency, this zone was discretized into ten sublayers along the axial direction, consistent with the mesh resolution used in the model. Each sublayer was assigned a uniform kick or leakage rate of 0.001 m3/s.
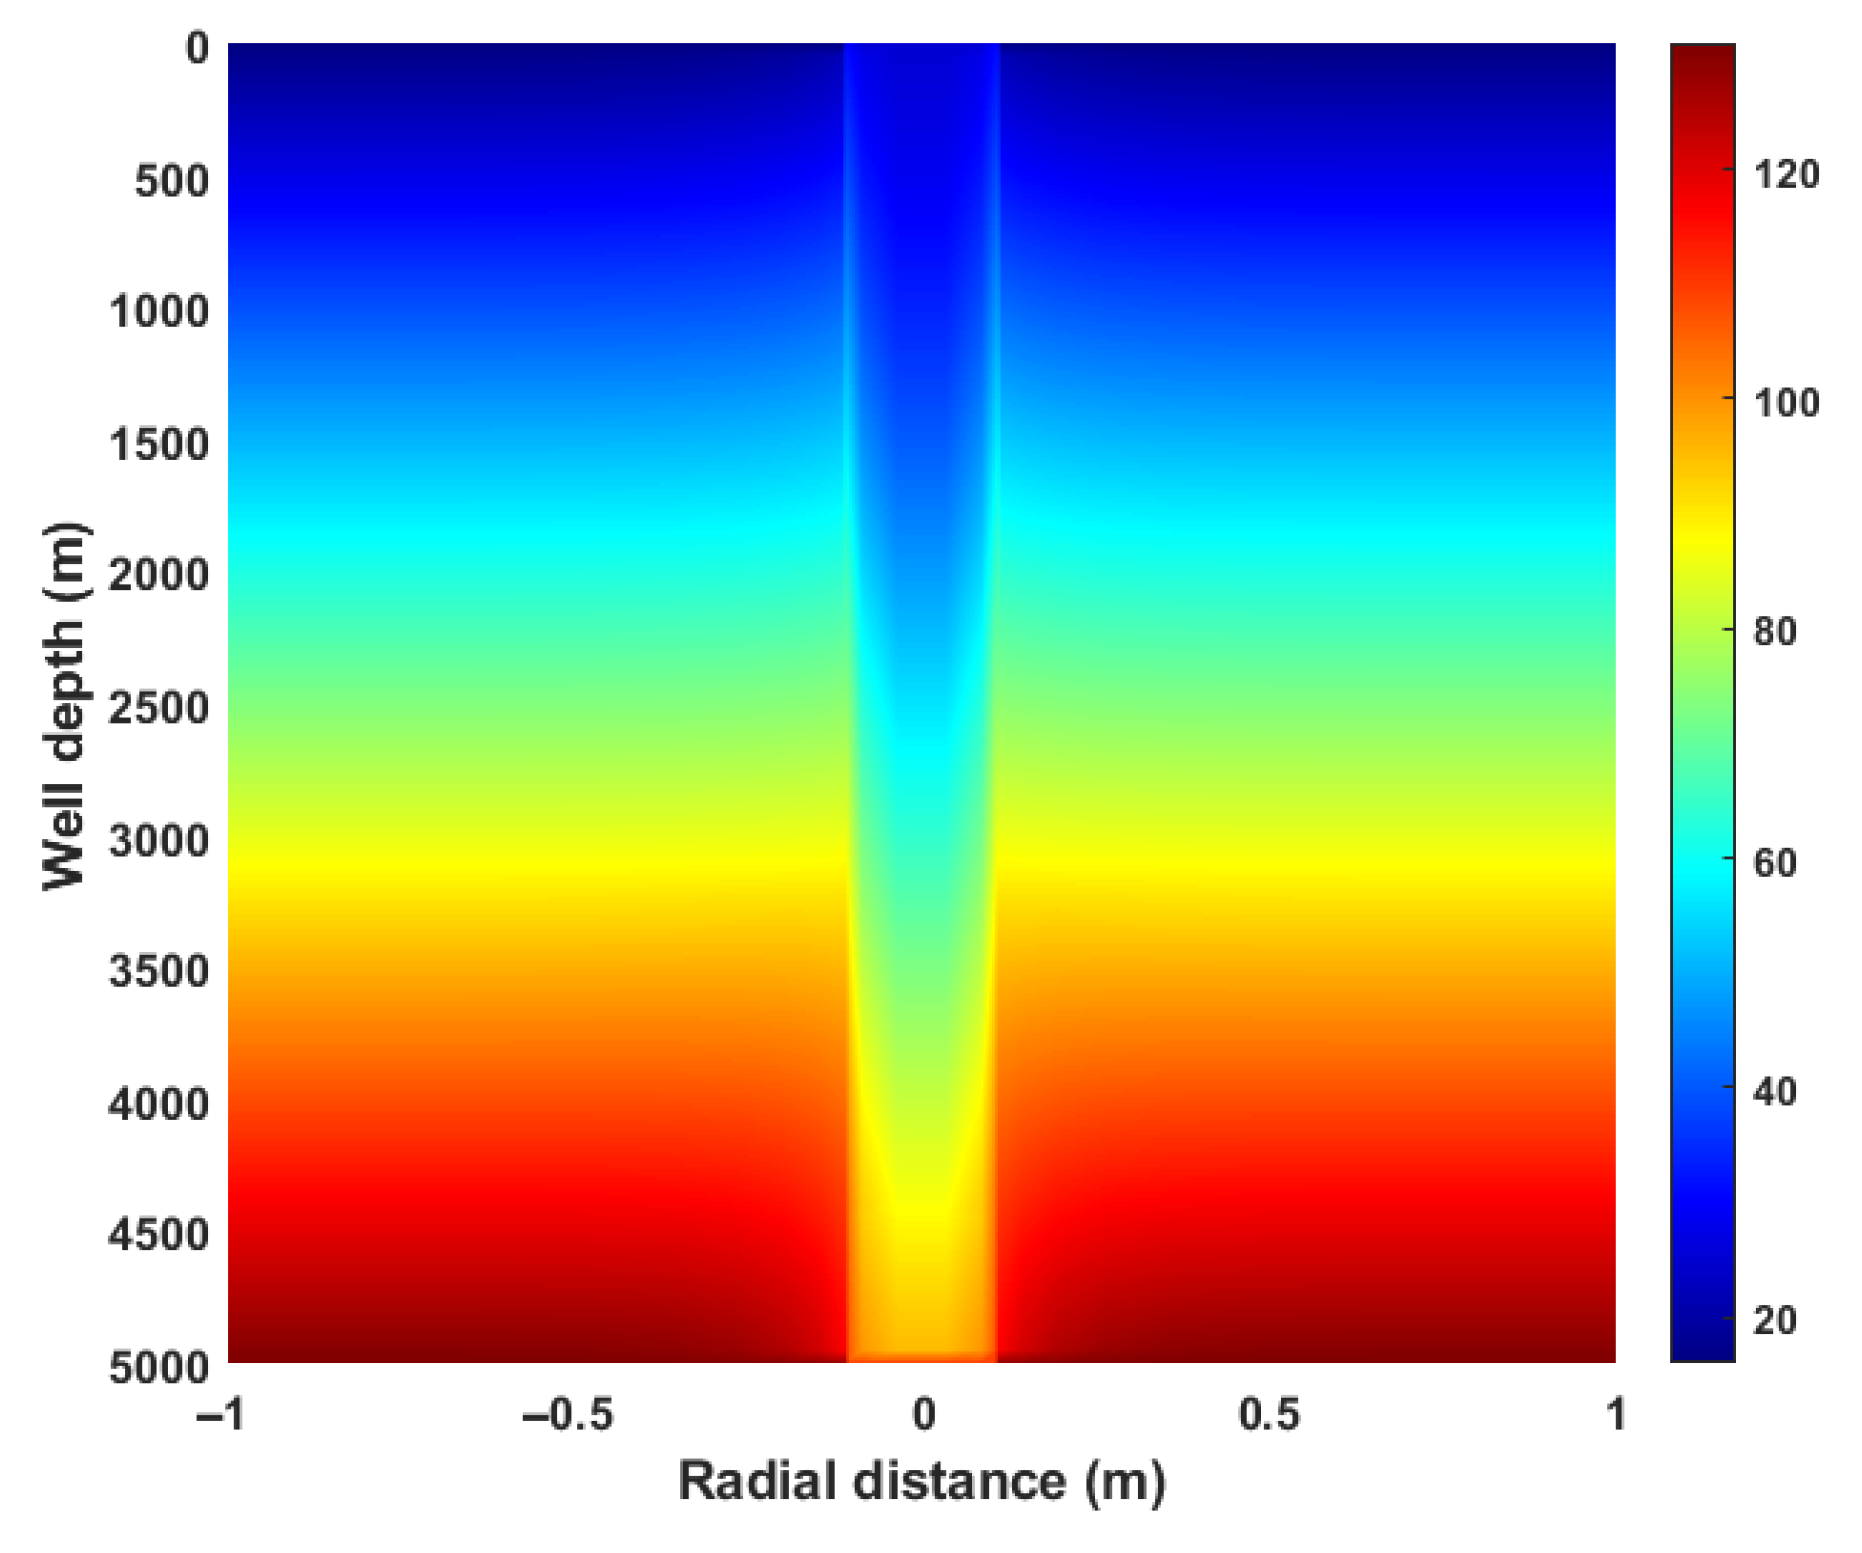
The FWT profile under both normal and abnormal conditions is illustrated in Figure 5 and Figure 6, respectively. As shown in Figure 5, when the depth exceeds 2000 m, the formation temperature surpasses that of the wellbore, resulting in heat transfer from the surrounding formation into the wellbore. Conversely, at depths shallower than 2000 m, the wellbore is hotter than the formation, leading to heat flow from the wellbore outward. In kick scenarios, high-temperature formation fluids intrude into the annulus, causing a noticeable increase in wellbore temperature. In contrast, during loss events, both drilling fluid and heat are depleted from the wellbore, resulting in a temperature decrease. Although the FWT profiles under abnormal conditions may appear similar, distinct differences arise depending on the specific kick–loss combinations. These variations will be explored in detail in the subsequent sections.

6.1. Annulus Temperature

Figure 7 presents the annular temperature (AT) profile after 8 h of circulation under normal, SL (shallow leakage), CL (concentrated leakage), and CKL (combined kick and loss) conditions. As the well depth increases, the AT initially rises and then declines. Across all three abnormal conditions, the AT remains lower than that of the normal scenario. This reduction is attributed to heat and mud loss at the bottom hole during the leakage events, which leads to decreased temperature and reduced fluid flow within the annulus.
Notably, the AT profiles under SL and CL conditions exhibit similar trends, except for a minor variation near the bottom hole. After 8 h of circulation, the AT values across the seven simulation cases follow the order: SL < CL < Case 3 < Case 4 < Case 1 < Case 2 < Normal condition.
A distinct temperature discontinuity is observed at the kick depth (3500 m), caused by high-temperature formation fluid entering the annular space. In the upper section of the wellbore (0–1000 m), the AT profiles for the normal and CKL conditions are nearly identical. This occurs because the total kick and loss rates are equal, resulting in comparable fluid flow rates above the open-hole section and thus similar temperature profiles near the wellhead. These results suggest that the effect of kick on annular temperature is more pronounced than that of shallow leakage.

6.2. Wellhead Temperature

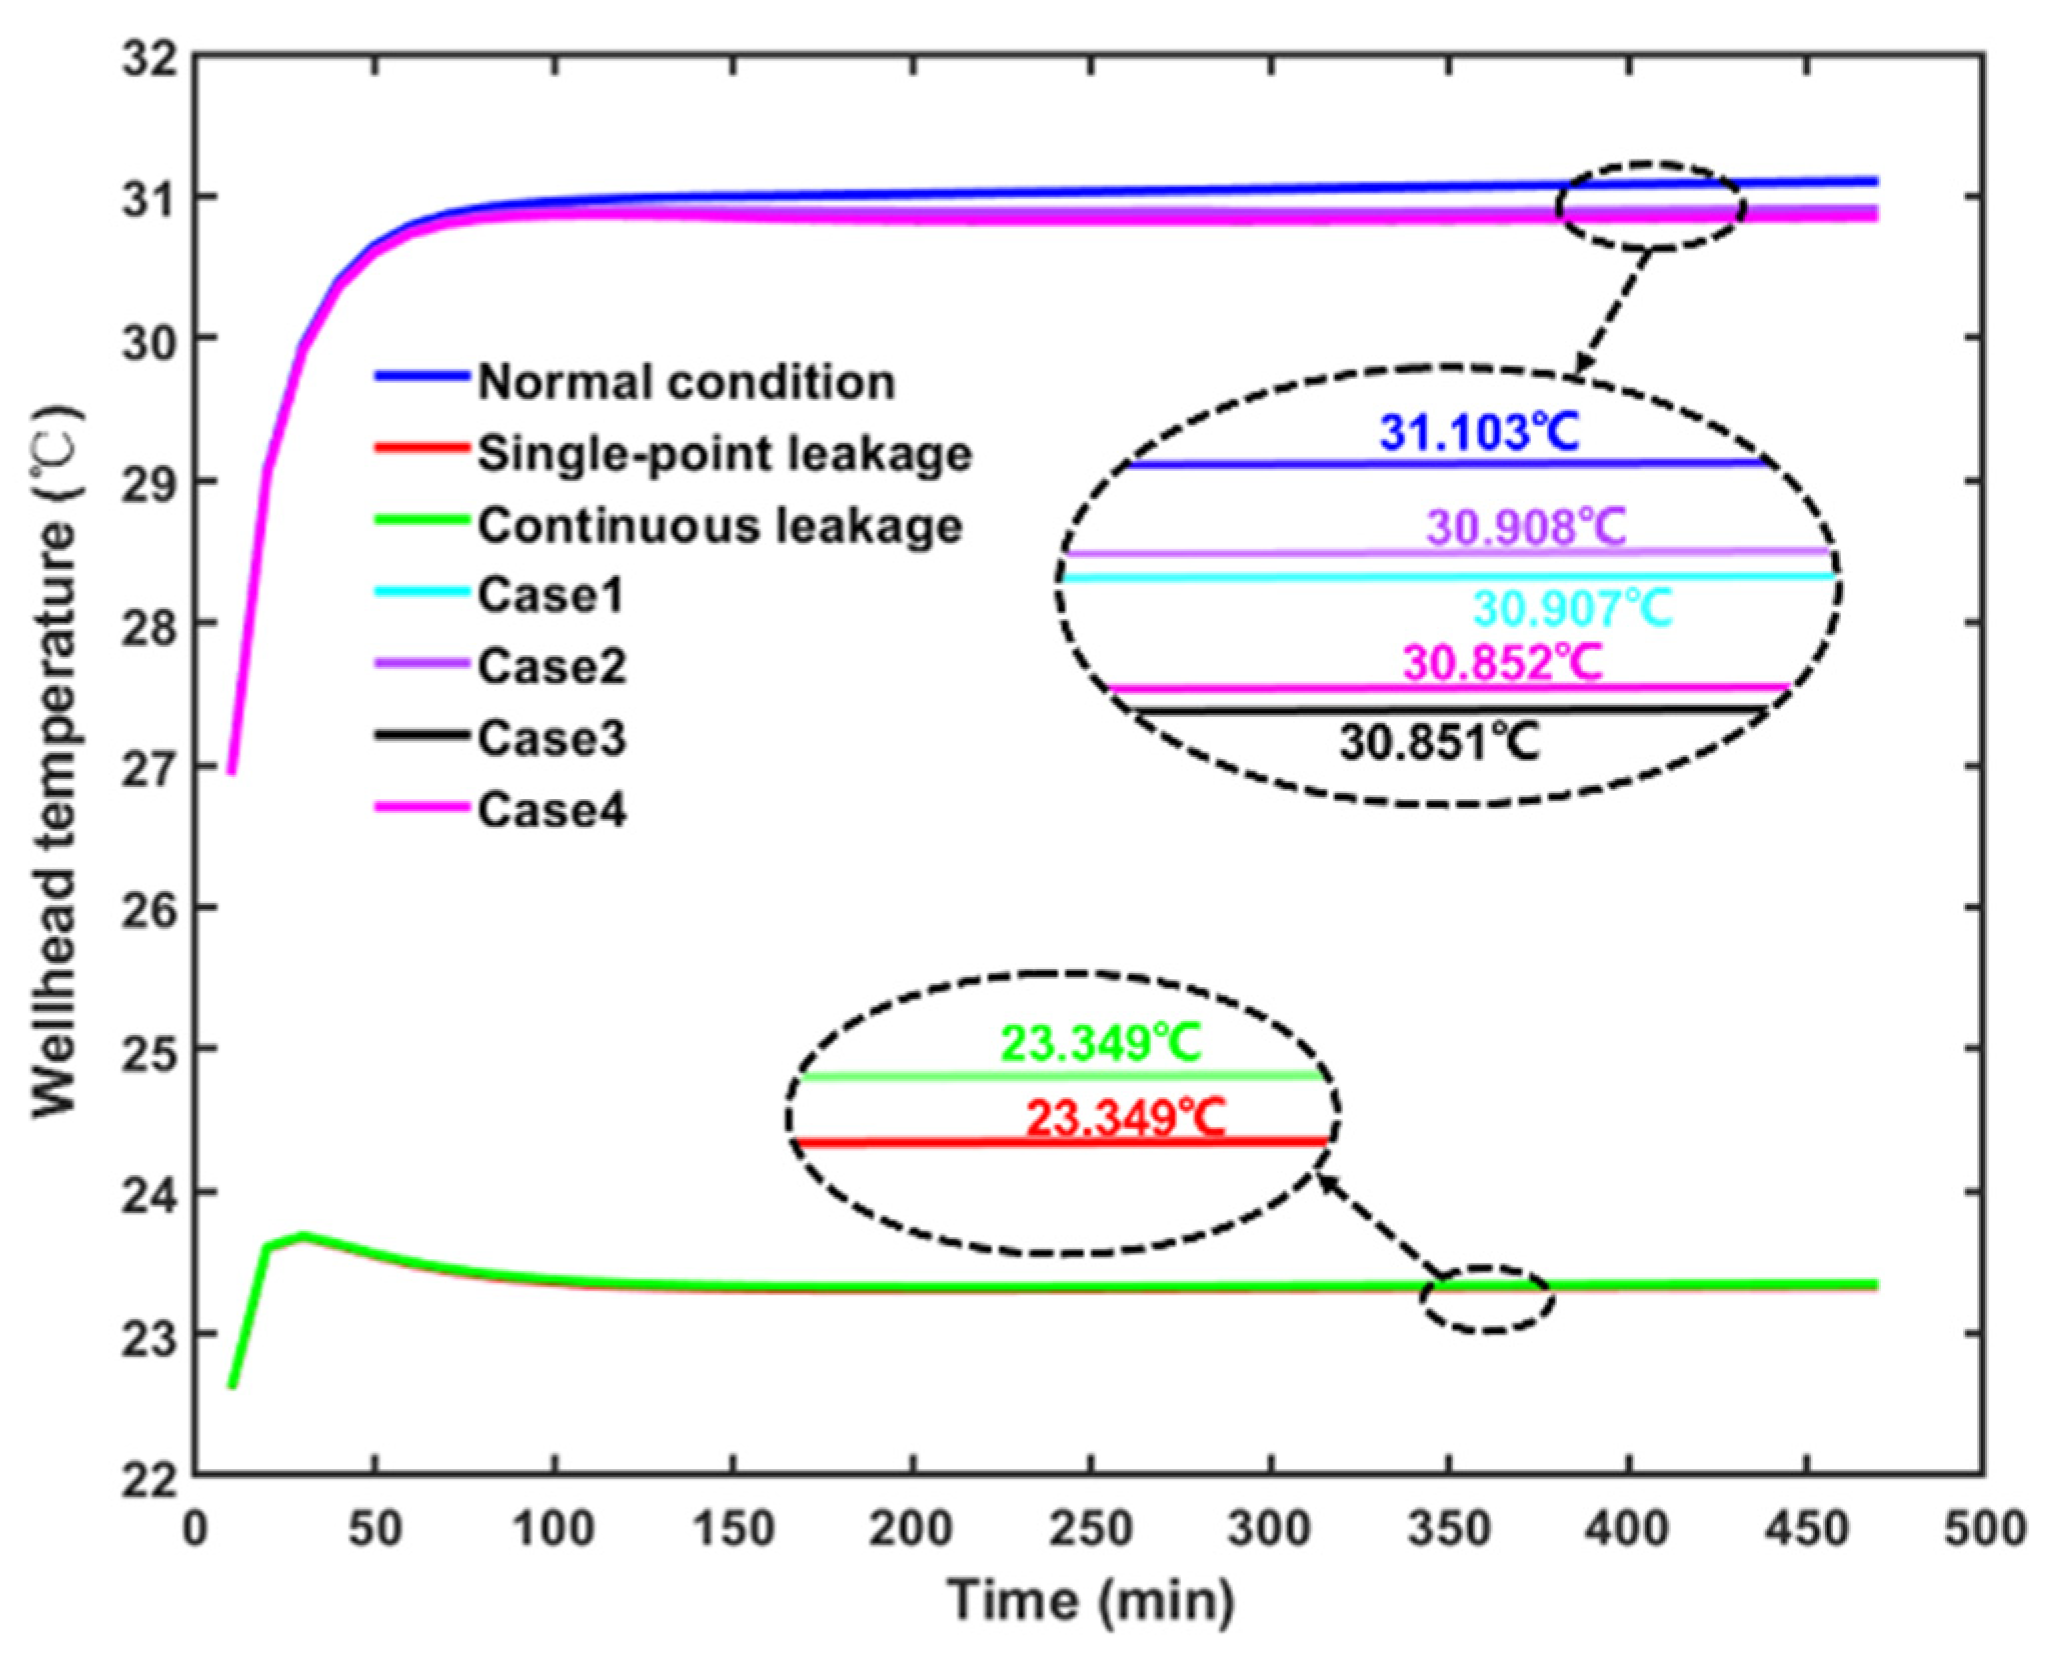
Figure 8 illustrates the temporal evolution of wellhead fluid temperature under various simulation scenarios. As circulation time increases, the wellhead temperature rises sharply at first and then gradually stabilizes. After 8 h of circulation, the wellhead temperatures corresponding to the seven scenarios are 31.103 °C, 23.348 °C, 23.349 °C, 30.907 °C, 30.908 °C, 30.851 °C, and 30.852 °C, respectively.
The results indicate that, in the presence of a kick, high-temperature formation fluid enters the annulus, introducing additional heat and consequently elevating the annular temperature. As a result, the wellhead temperature in the CKL scenario is significantly higher than that under pure leakage conditions. Moreover, due to the equal magnitudes of kick and loss rates set in the model, the temperature difference at the wellhead between the CKL and normal scenarios is relatively small.

6.3. The Temperature of the Bottom Hole

The temperature variation at the bottom hole with time under different conditions is shown in Figure 9. With the increase in circulation time, the bottom hole temperature first decreases rapidly and then tends to be stable. After cycling for 8 h, the bottom hole temperature under the seven conditions is 108.805 °C, 89.522 °C, 89.889 °C, 98.514 °C, 99.189 °C, 97.521 °C, and 98.157 °C, respectively. When the leakage occurs, the annulus will lose some fluid and heat, making the bottom hole temperature lower than that in normal conditions. Meanwhile, the intrusion of formation fluid during a kick event leads to an elevated bottom hole temperature in the CKL scenario compared to that observed under leakage conditions.

6.4. Temperature Difference Between Inside the Drill String and Annulus

Figure 10 displays the temperature difference between the interior of the drill string and the annulus after 8 h of circulation under various conditions. Under normal conditions, this temperature difference initially increases with depth and then decreases. In contrast, under both leakage and CKL cases, the temperature difference exhibits a fluctuating pattern characterized by a “rise–fall–rise–fall–rise” trend along the depth profile.
The SL case and the CL case show nearly identical temperature differences, with only slight deviations observed in the open-hole section. Variations in temperature difference are evident across different combinations of kick and leakage types. Specifically, in the kick zone, the temperature difference in Case 3 and Case 4 is smaller than that in Case 1 and Case 2, indicating that combined kick (CK) exerts a more significant influence on the temperature gradient than shallow kick (SK), assuming identical total influx rates.

6.5. Temperature Difference Between Formation and Annulus

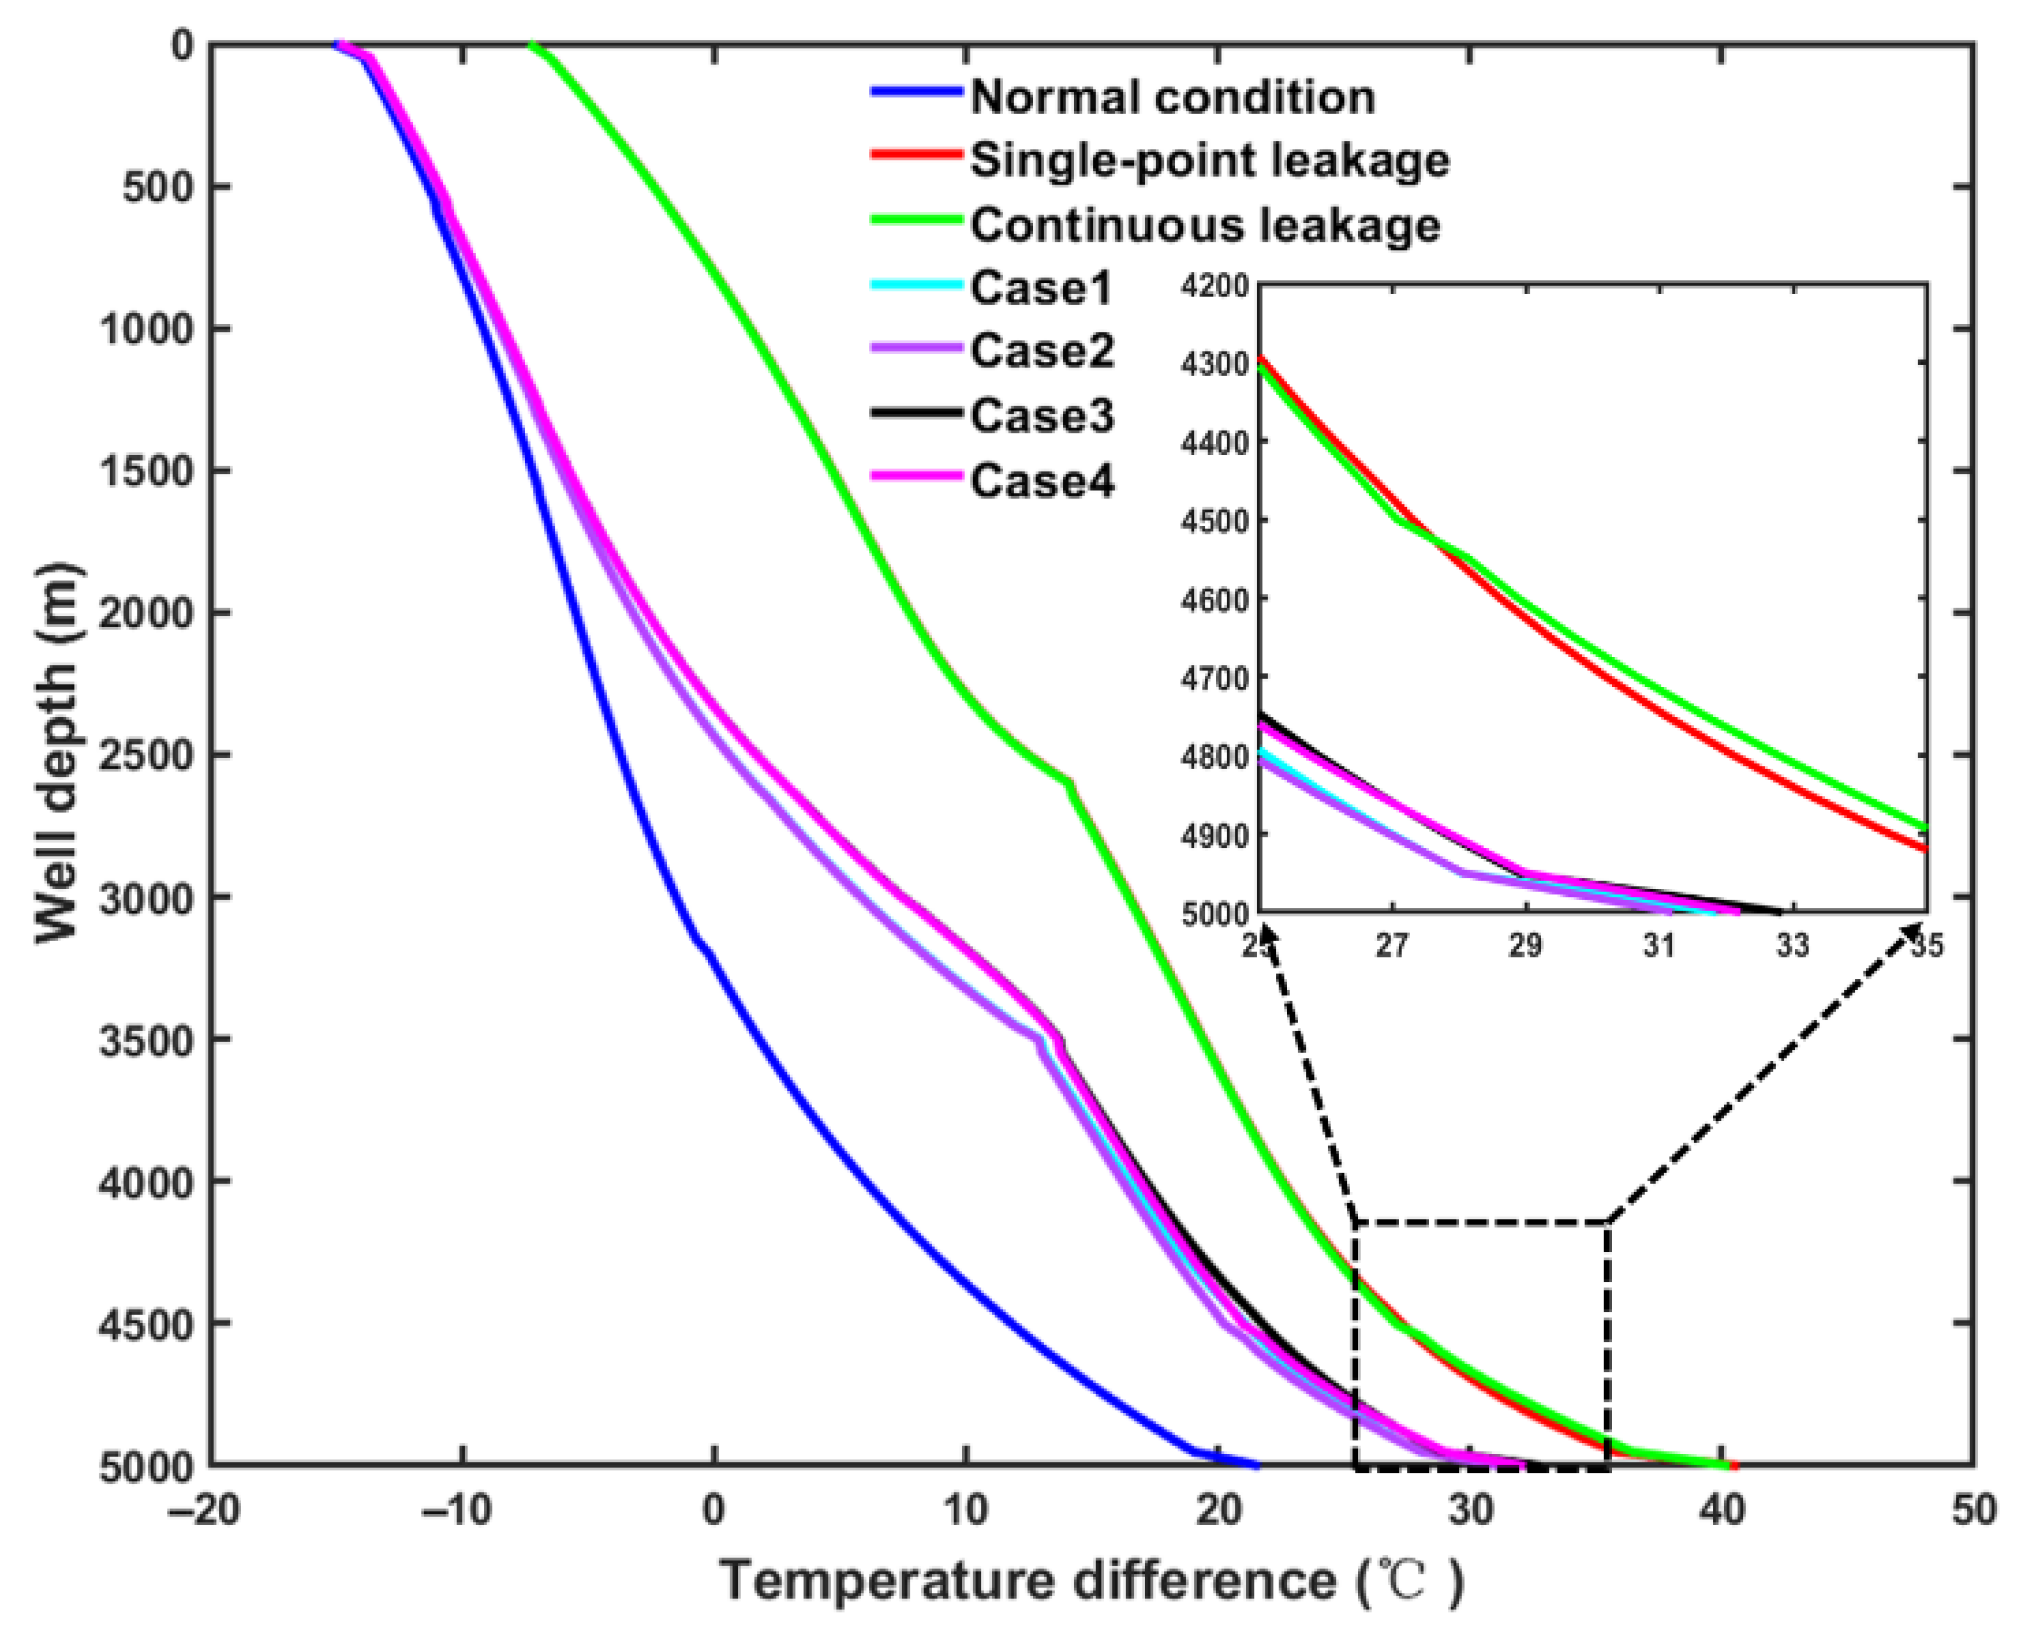
Figure 11 presents the temperature difference between the annulus and the surrounding formation after 8 h of circulation under various conditions. For comparison, the formation temperature was taken at a radial distance of 0.2655 m from the center of the wellbore. A positive temperature difference indicates that the formation is hotter than the annular fluid, whereas a negative value reflects a cooler formation relative to the annulus.
As illustrated in the figure, the temperature difference increases progressively with well depth. Under the CKL case, the difference is more pronounced than in the normal condition and falls between the values observed in the other two abnormal cases. This behavior can be attributed to the intrusion of high-temperature formation fluid into the annulus during a kick, which heats the annular fluid and raises its temperature. Simultaneously, the fluid influx increases the annular flow rate, further enhancing heat transfer and elevating the annular temperature (AT). In contrast, leakage leads to both fluid and heat loss from the annulus, thereby reducing the AT. As the returning mud passes through the leakage zone, the resulting temperature difference exceeds that observed under normal conditions.

7. Discussion

Based on the above analysis, the FWT is significantly different from those under single point or continuous leakage condition at the bottom hole and normal drilling conditions when the co-existence kick and leakage occurs. To further study the FWT under the kick and leakage condition, the influence of the kick locations on the FWT is discussed.

7.1. Influence of Kick Location on Annulus Temperature

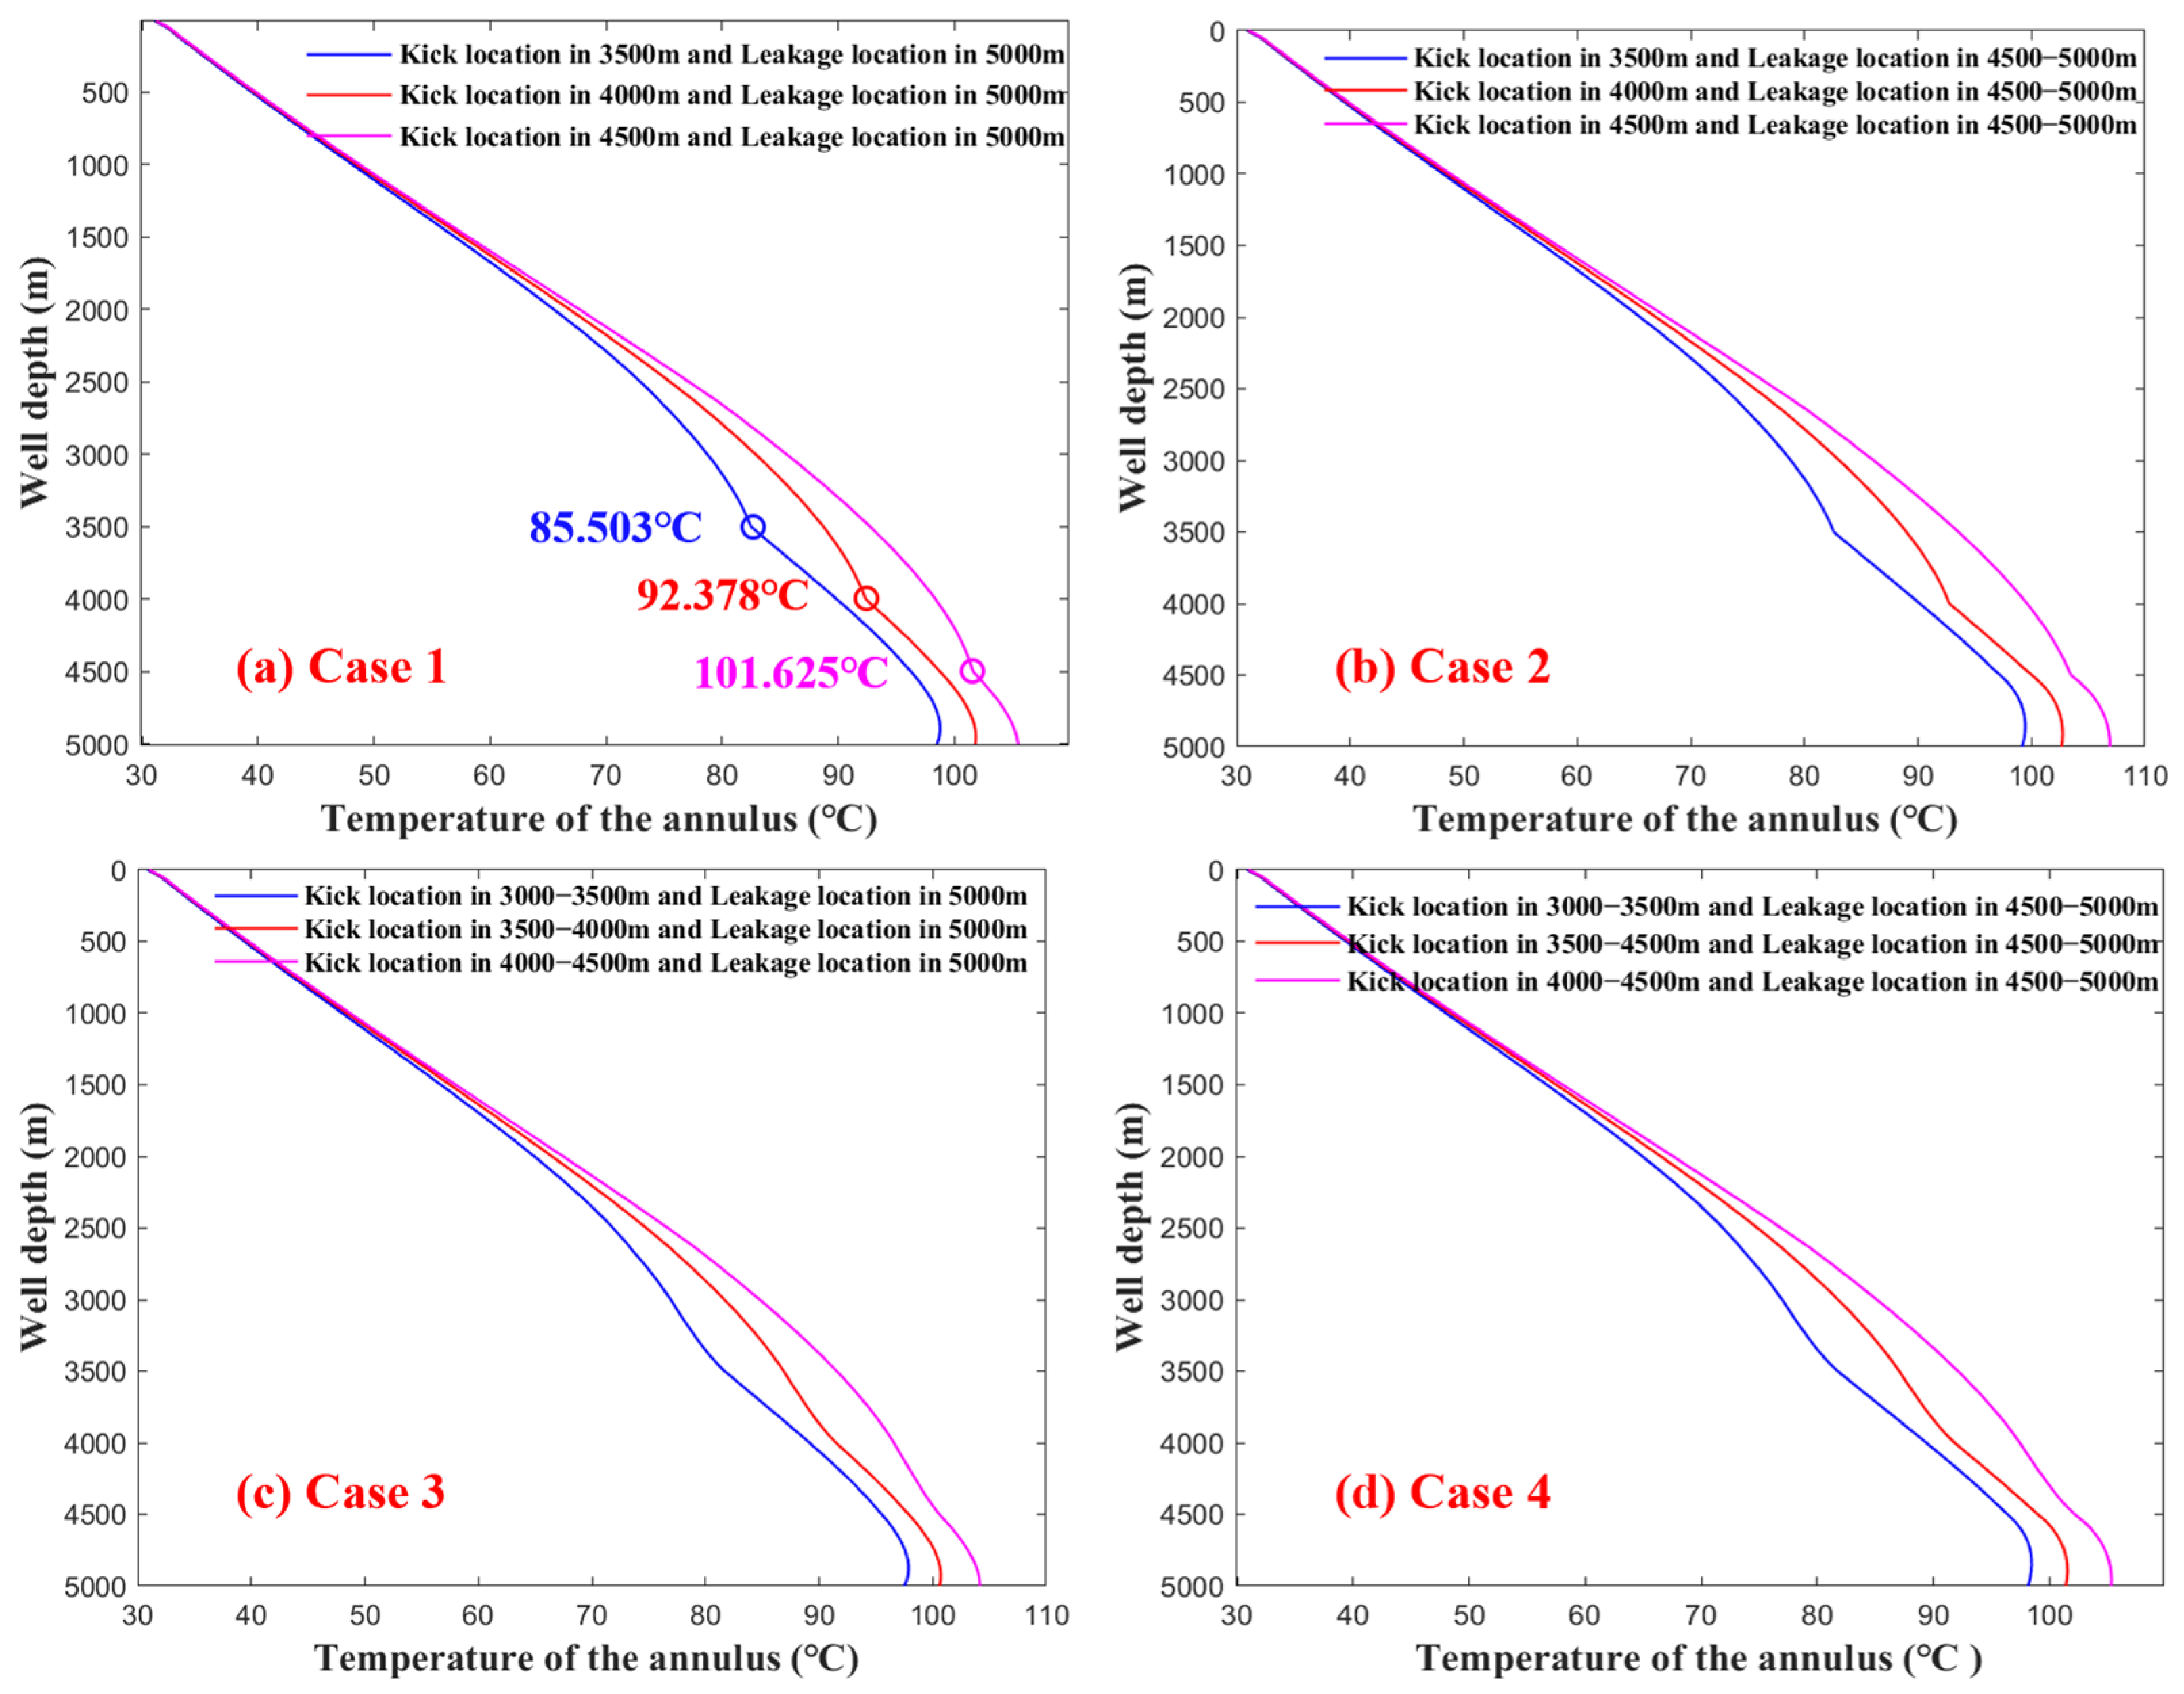
The AT under the four conditions with different kick locations is shown in Figure 12. From the figure, the AT increases as the kick location is located closer to the bottom hole. This is primarily because the closer the kick occurs to the bottom hole, the weaker the influence of leakage on the annular temperature (AT), while the thermal impact of the kick becomes more pronounced, leading to a higher AT. Specifically, the annular temperatures at the kick depths of 3500 m, 4000 m, and 4500 m are 82.503 °C, 92.378 °C, and 101.625 °C, respectively. At the same time, it can be seen from Figure 12 that the effect of the kick location on the AT in the four cases is the same, and the only difference is that the kick types (SK or CK) are different. When an SK occurs, there will be a clear “folding point” at the kick location; when a CK occurs, the “folding point” will not be significant. In addition, the effect of the kick location on the bottom hole temperature of the four cases is not significantly different.

7.2. Influence of Kick Depth on Drill String–Annulus Temperature Differential

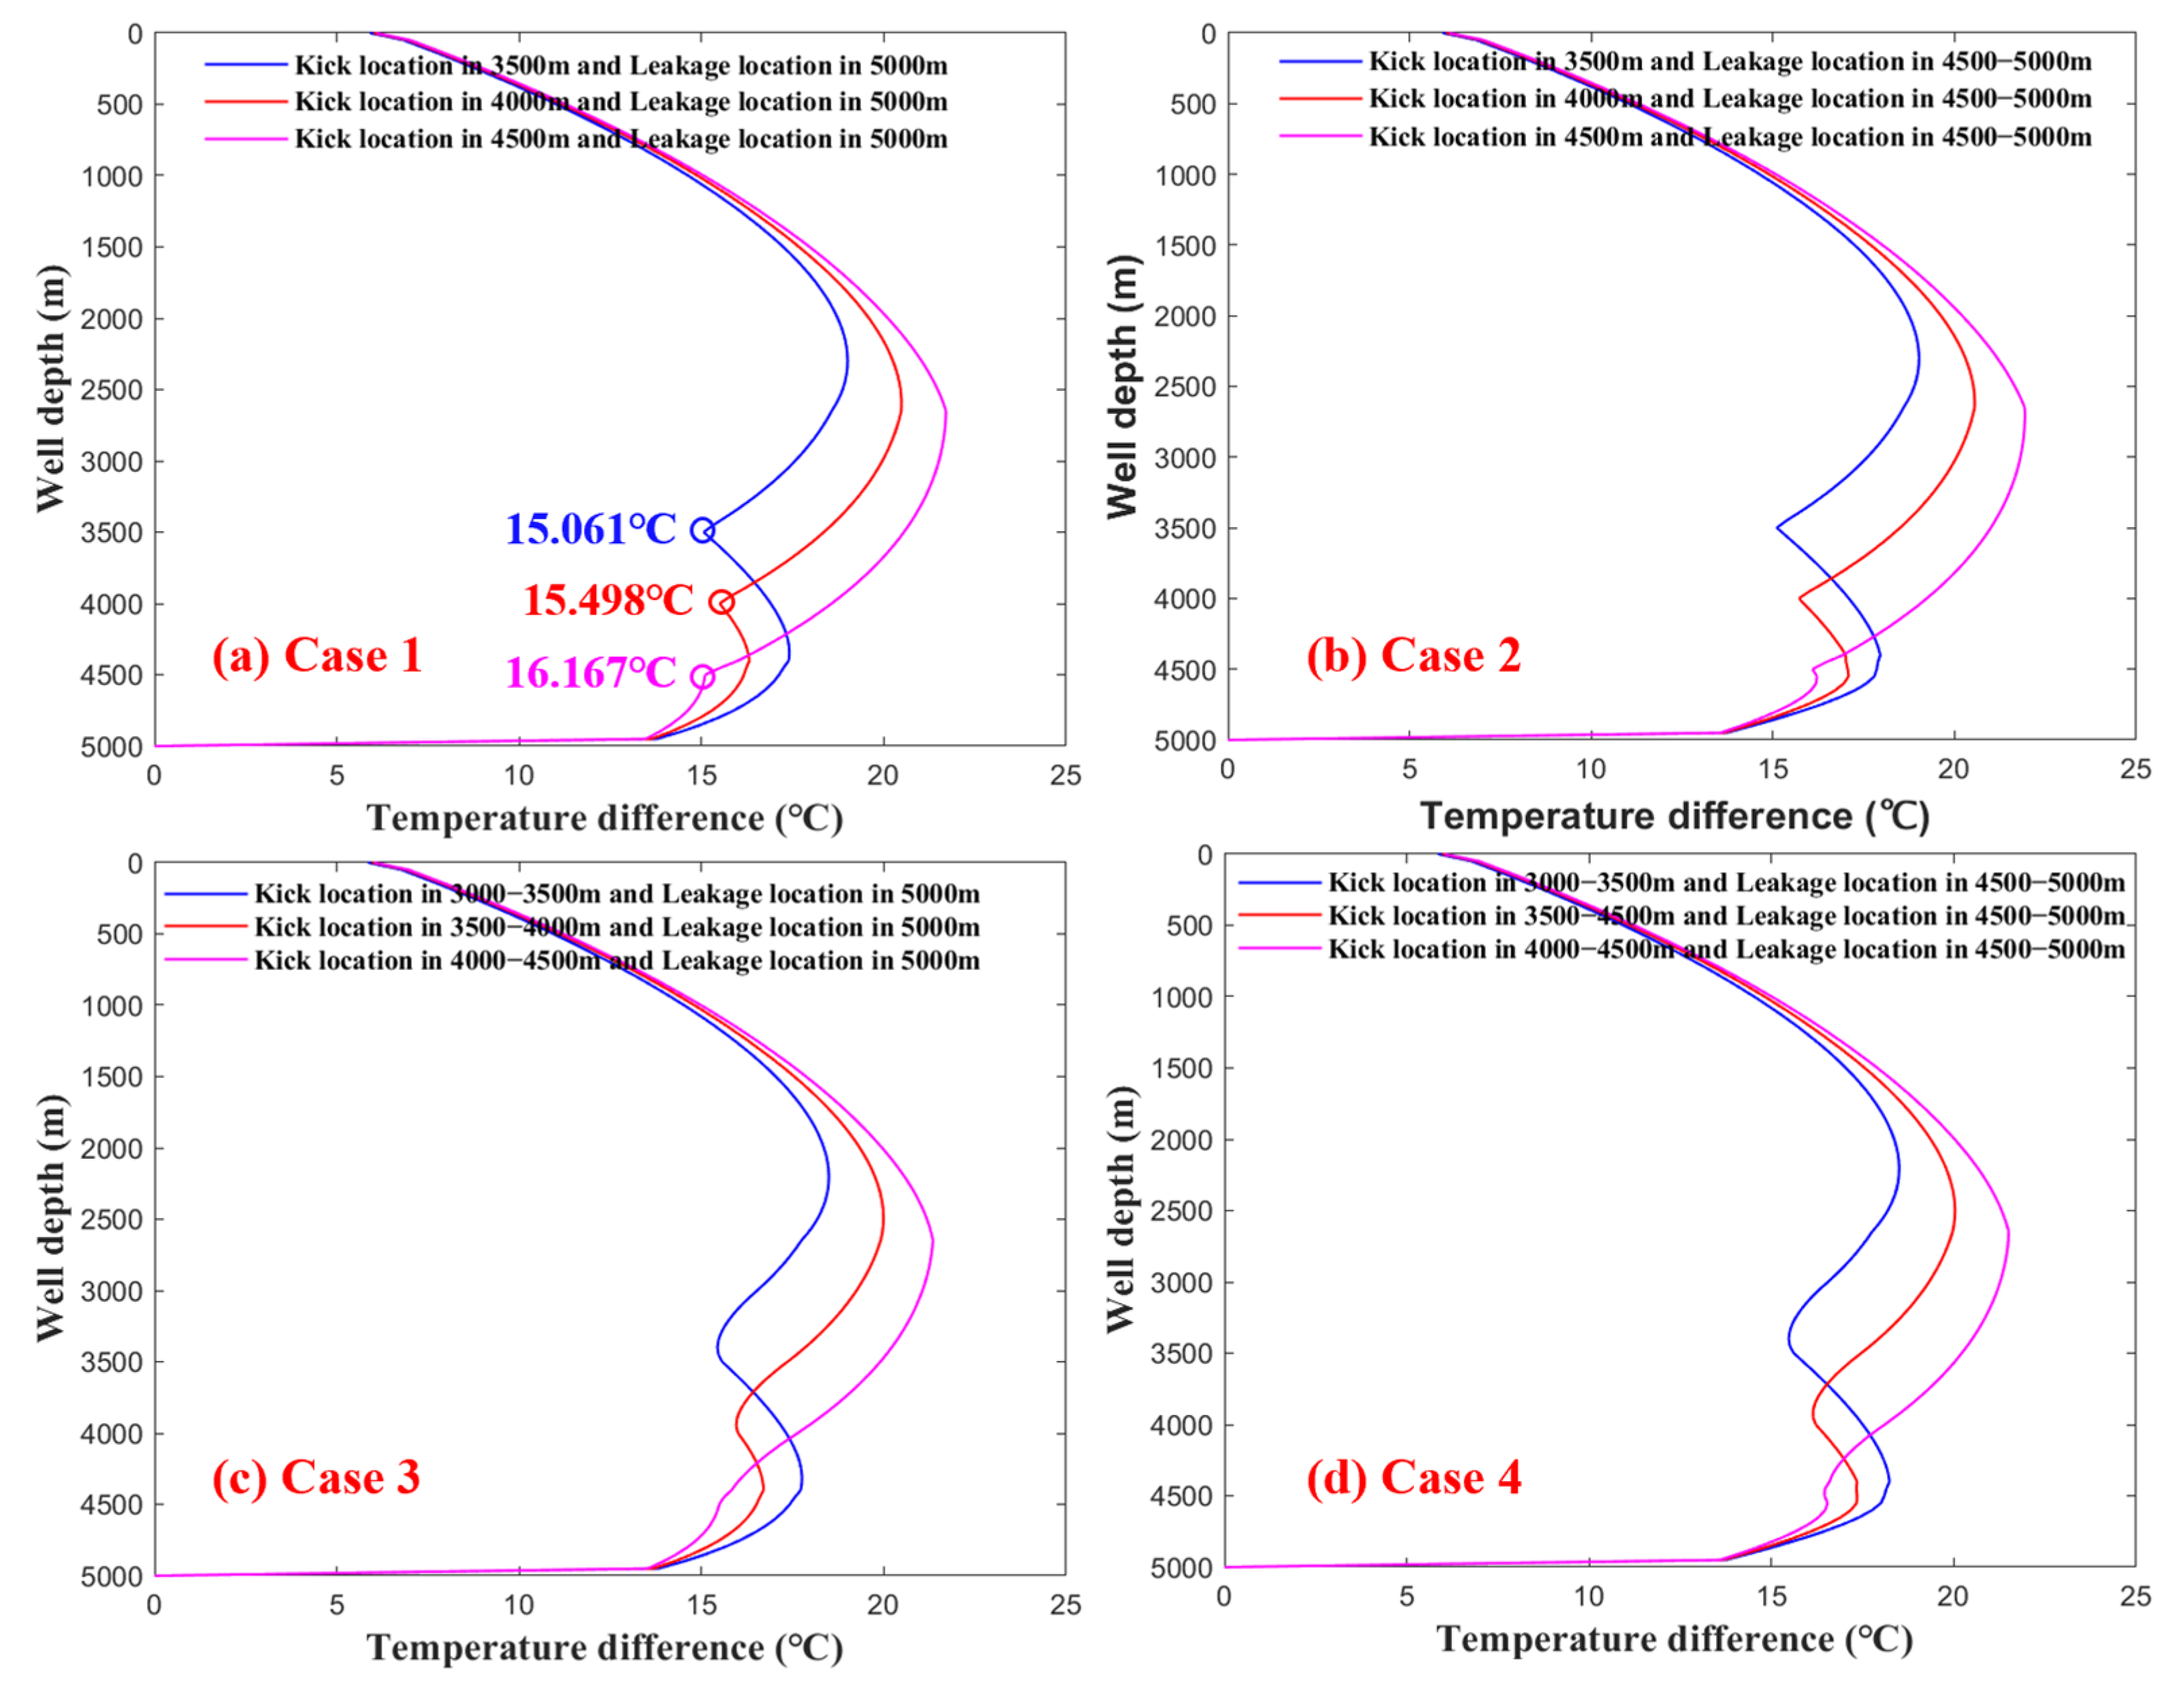
Figure 13 illustrates the profile of temperature difference between the interior of the drill string and the annulus after 8 h of circulation, with kick locations set at 1500 m, 1000 m, and 500 m above the bottom hole. In the upper section of the wellbore (0–2700 m), the temperature difference increases as the kick location approaches the bottom hole. This trend can be attributed to the diminishing influence of leakage on the annular temperature (AT) at deeper kick locations, resulting in higher AT values and thus greater temperature differences.
The temperature difference curves exhibit a “wavy” pattern, characterized by alternating increases and decreases, which leads to the presence of local minima. Taking Case 1 as an example, the minimum temperature differences corresponding to kick depths of 1500 m, 1000 m, and 500 m above the bottom hole are 15.061 °C, 15.498 °C, and 16.167 °C, respectively.
Furthermore, this trend is consistent across all four cases. However, due to the stronger thermal influence of combined kick (CK) compared to shallow kick (SK), no critical “folding point” is observed in the temperature difference profiles.

7.3. Influence of Kick Depth on Annulus–Formation Temperature Difference

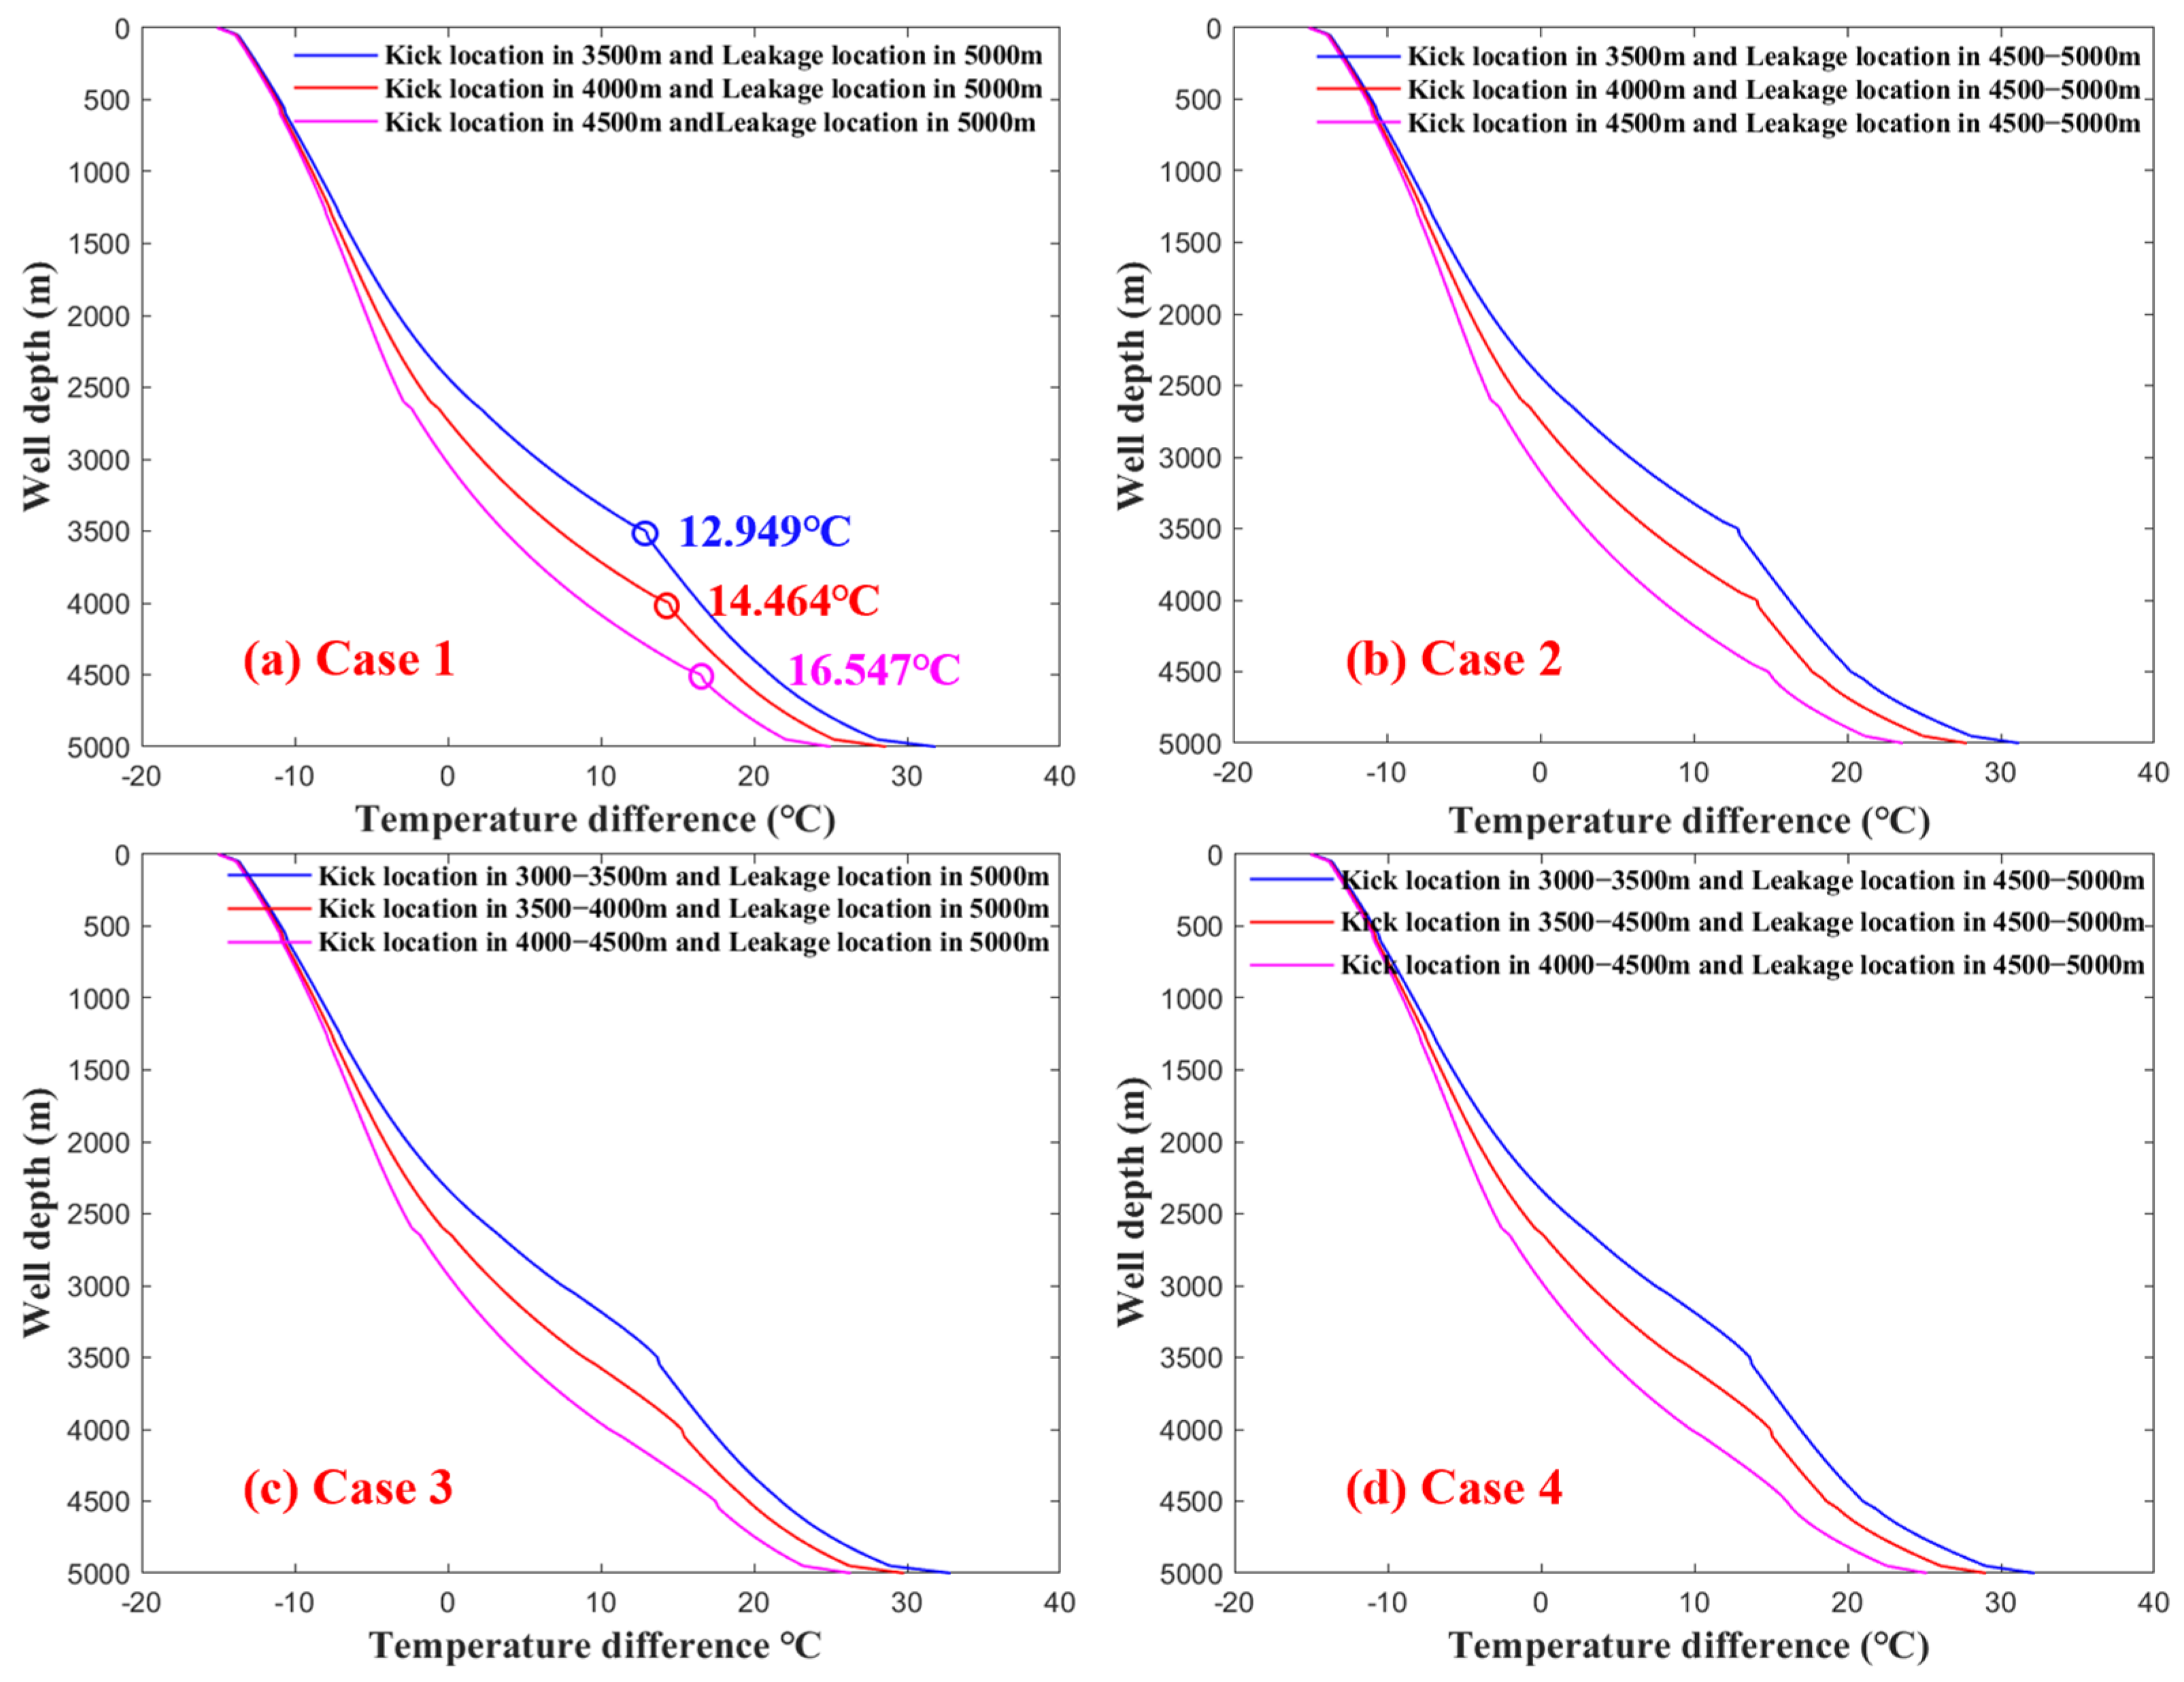
Figure 14 presents the profile curves of the temperature difference between the annulus and the formation for four cases with varying kick depths. As the kick and leakage locations shift deeper, the temperature difference gradually increases—exhibiting a trend opposite to that observed between the drill string and annulus.
When the leakage depth remains constant, a kick occurring closer to the leakage zone leads to a higher annular temperature (AT), thereby reducing the temperature difference between the annulus and formation. Additionally, a distinct change in the slope of the temperature difference curve is observed at the kick location. For Case 1, the temperature differences at kick depths located 1500 m, 1000 m, and 500 m above the bottom hole are 12.949 °C, 14.464 °C, and 16.547 °C, respectively.

8. Conclusions

By comparing the temperature profile under normal conditions, this study investigates the wellbore–formation temperature characteristics under single-point leakage, continuous leakage, and combined kick–leakage conditions. The influence of kick depth on temperature profile under different combined conditions is also analyzed. The main conclusions are as follows:
(1)
The annular temperature under single-point leakage, continuous leakage, and combined kick–leakage conditions is lower than that under normal conditions. Both the bottom hole and wellhead temperatures in the single-point and continuous leakage cases are significantly reduced compared to the normal case. However, the wellhead temperature difference between the combined kick–leakage condition and the normal condition is minimal. Moreover, the type of leakage (single-point or continuous) has limited impact on the annular temperature profile when kick and leakage coexist.
(2)
The temperature difference between the interior of the drill string and the annulus under kick, leakage, and combined kick–leakage conditions exhibits a wavy trend of alternating increases and decreases with depth. The curves for single-point and continuous leakage cases are nearly identical, with only minor deviations in the open-hole section. The drill string–annulus temperature difference in the combined kick–leakage condition is notably greater than that under normal conditions.
(3)
As the kick location gets closer to the bottom hole, the annular temperature increases and the temperature difference between annulus and formation decreases. Above the bare borehole section, the temperature difference between inside the drill string and annulus keeps decreasing as the distance between the kick and leakage location gradually increases.
(4)
In the future, the measurement of temperature by photonic environmental sensors or resistance sensors may be helpful in preventing kick and leakage, allowing workers to take timely action [27,29].

Author Contributions

Conceptualization, Y.C., Methodology, Y.C.; Validation, K.L.; Investigation, M.L. and H.W.; Data curation, M.L. and W.H.; Writing—original draft, Y.C.; Writing—review and editing, Y.C., M.L., H.W., K.L. and G.Z.; Visualization, Y.L. Supervision, H.Z. All authors have read and agreed to the published version of the manuscript.

Funding

This research work was supported by the Key Core Technology Research Project of China National Petroleum Corporation (2024ZG26), the Youth Science and Technology Program of China National Petroleum Corporation (2024DQ03086), the Joint Foundation Program of National Natural Science Foundation of China (U24B2030), and National Science and Technology Major Project (2025ZD1401905).

Data Availability Statement

The original contributions presented in this study are included in the article. Further inquiries can be directed to the corresponding author.

Conflicts of Interest

Authors Yufei Chen, Mu Li, Hao Wang, Weiwei Hao, Kerou Liu and Yafei Li were employed by CNPC Engineering Technology R & D Company Limited. The remaining authors declare that the research was conducted in the absence of any commercial or financial relationships that could be construed as a potential conflict of interest.

Nomenclature

Nomenclature
ρ Density, kg/m3
Q Viscous friction power, W/m
q Fluid rate, m3/s
T Temperature, °C
T s Surface temperature, °C
T i n Temperature of injected drilling fluid
h Convective heat transfer coefficient, W/(m2 °C)
HDepth of bottom hole, m
k Thermal conductivity, W/(m °C)
C Specific heat, J/(kg °C)
z Axial coordinate, m
r Radial coordinate, m
u velocity, m/s
t Time, s
N u Nusselt number
Re Reynolds number
Pr Prandtl number
n Liquidity index
D Pipe diameter, m
D h y Hydraulic diameter, m
D h y p Hydraulic diameter of drill string, m
D h y a Hydraulic diameter of annulus, m
f Friction coefficient
A p Cross-sectional area of drill string, m2
A a Cross-sectional area of annulus, m2
Δ Roughness of pipe
Λ Parameter of friction coefficient
G Geothermal gradient, °C/m
Subscript
lLiquid phase
pDrill string
wDrill string wall
aAnnuals
cCasing
piDrill string inner wall
poDrill string outer wall
ciCasing inner wall
coCasing outer wall
kickKick
lossLeakage

References

  1. Kaiser, M.J. Modeling the time and cost to drill an offshore well. Energy 2009, 34, 1097–1112. [Google Scholar] [CrossRef]
  2. Nian, Y.L.; Cheng, W.L. Evaluation of geothermal heating from abandoned oil wells. Energy 2018, 142, 592–607. [Google Scholar] [CrossRef]
  3. Jia, H.; Kang, Z.; Zhu, J.; Ren, L.; Cai, M.; Wang, T.; Xu, Y.; Li, Z. High density bromide-based nanocomposite gel for temporary plugging in fractured reservoirs with multi-pressure systems. J. Pet. Sci. Eng. 2021, 205, 108778. [Google Scholar] [CrossRef]
  4. Magzoub, M.I.; Salehi, S.; Hussein, I.A.; Nasser, M.S. Loss circulation in drilling and well construction: The significance of applications of crosslinked polymers in wellbore strengthening: A review. J. Pet. Sci. Eng. 2020, 185, 106653. [Google Scholar] [CrossRef]
  5. Yin, H.; Liu, P.; Li, Q.; Wang, Q.; Dao, D. A new approach to risk control of gas kick in high-pressure sour gas wells. J. Nat. Gas Sci. Eng. 2015, 26, 142–148. [Google Scholar] [CrossRef]
  6. Liu, G.; Meng, Z.; Luo, D.; Wang, J.; Gu, D.; Yang, D. Experimental evaluation of interlayer interference during commingled production in a tight sandstone gas reservoir with multi-pressure systems. Fuel 2020, 262, 116557. [Google Scholar] [CrossRef]
  7. Stone, R.; Tian, S. Sometimes Neglected Hydraulic Parameters of Underbalanced and Managed-Pressure Drilling. In Proceedings of the SPE/IADC Managed Pressure Drilling and Underbalanced Operations Conference and Exhibition, Abu Dhabi, United Arab Emirates, 28–29 January 2008; Society of Petroleum Engineers: Richardson, TX, USA, 2008. [Google Scholar]
  8. Iversen, F.P.; Gravdal, J.E.; Nygaard, G.H.; Gjeraldstveit, H.; Carlsen, L.A.; Low, E.; Munro, C.; Torvund, S. Feasibility study of managed-pressure drilling with automatic choke control in depleted HP/HT field. In Proceedings of the SPE Annual Technical Conference and Exhibition, San Antonio, TX, USA, 24–27 September 2006; Society of Petroleum Engineers: Richardson, TX, USA, 2006. [Google Scholar]
  9. Wu, X.; Wan, F.; Chen, Z.; Han, L.; Li, Z. Drilling and completion technologies for deep carbonate rocks in the Sichuan Basin: Practices and prospects. Nat. Gas Ind. B 2020, 7, 547–556. [Google Scholar] [CrossRef]
  10. Jia, H.; Chen, H.; Guo, S. Fluid loss control mechanism of using polymer gel pill based on multi-crosslinking during overbalanced well workover and completion. Fuel 2017, 210, 207–216. [Google Scholar] [CrossRef]
  11. Kamel, M.A.; Elkatatny, S.; Mysorewala, M.F.; Al-Majed, A.; Elshafei, M. Adaptive and real-time optimal control of stick–slip and bit wear in autonomous rotary steerable drilling. J. Energy Resour. Technol. 2018, 140, 032908. [Google Scholar] [CrossRef]
  12. Vajargah, A.K.; van Oort, E. Early kick detection and well control decision-making for managed pressure drilling automation. J. Nat. Gas Sci. Eng. 2015, 27, 354–366. [Google Scholar] [CrossRef]
  13. Feng, Y.; Gray, K.E. Review of fundamental studies on lost circulation and wellbore strengthening. J. Pet. Sci. Eng. 2017, 152, 511–522. [Google Scholar] [CrossRef]
  14. Jinsheng, S.U.N.; Yingrui, B.A.I.; Cheng, R.; Lyu, K.; Liu, F.; Feng, J.; Lei, S.; Zhang, J.; Hao, H. Research progress and prospect of plugging technologies for fractured formation with severe lost circulation. Pet. Explor. Dev. 2021, 48, 732–743. [Google Scholar] [CrossRef]
  15. Yang, H.; Li, J.; Liu, G.; Wang, C.; Li, M.; Jiang, H. Numerical analysis of transient wellbore thermal behavior in dynamic deepwater multi-gradient drilling. Energy 2019, 179, 138–153. [Google Scholar] [CrossRef]
  16. Zhang, Z.; Xiong, Y.; Gao, Y.; Liu, L.; Wang, M.; Peng, G. Wellbore temperature profile during circulation stage when well-kick occurs in a continuous formation from the bottom hole. Energy 2018, 164, 964–977. [Google Scholar] [CrossRef]
  17. Espinosa-Paredes, G.; Espinosa-Martínez, E.G. A feedback-based inverse heat transfer method to estimate unperturbed temperatures in wellbores. Energy Convers. Manag. 2009, 50, 140–148. [Google Scholar] [CrossRef]
  18. Li, M.; Liu, G.; Li, J.; Zhang, T.; He, M. Thermal performance analysis of drilling horizontal wells in high temperature formations. Appl. Therm. Eng. 2015, 78, 217–227. [Google Scholar] [CrossRef]
  19. Li, G.; Yang, M.; Meng, Y.; Wen, Z.; Wang, Y.; Yuan, Z. Transient heat transfer models of wellbore and formation systems during the drilling process under well kick conditions in the bottom hole. Appl. Therm. Eng. 2016, 93, 339–347. [Google Scholar] [CrossRef]
  20. Yang, M.; Li, X.; Deng, J.; Meng, Y.; Li, G. Prediction of wellbore and formation temperatures during circulation and shut-in stages under kick conditions. Energy 2015, 91, 1018–1029. [Google Scholar] [CrossRef]
  21. Yang, M.; Meng, Y.; Li, G.; Li, Y.; Chen, Y.; Zhao, X.; Li, H. Estimation of wellbore and formation temperatures during the drilling process under lost circulation conditions. Math. Probl. Eng. 2013, 2013, 579091. [Google Scholar] [CrossRef]
  22. Luheshi, M.N. Estimation of formation temperature from borehole measurements. Geophys. J. Int. 1983, 74, 747–776. [Google Scholar]
  23. Tekin, S. Estimation of the Formation Temperature from the Inlet and Outlet Mud Temperatures While Drilling Geothermal Formations. Master’s Thesis, Middle East Technical University, Ankara, Turkey, 2010. [Google Scholar]
  24. Fomin, S.; Hashida, T.; Chugunov, V.; Kuznetsov, A.V. A borehole temperature during drilling in a fractured rock formation. Int. J. Heat Mass Transf. 2005, 48, 385–394. [Google Scholar] [CrossRef]
  25. Zhang, Z.; Wei, Y.; Xiong, Y.; Peng, G.; Wang, G.; Lu, J.; Zhong, L.; Wang, J. Influence of the location of drilling fluid loss on wellbore temperature profile during drilling. Energy 2022, 244, 123031. [Google Scholar] [CrossRef]
  26. Espinosa-Paredes, G.; Garcia-Gutierrez, A. Thermal behavior of geothermal wells using mud and air–water mixtures as drilling fluids. Energy Convers. Manag. 2004, 45, 1513–1527. [Google Scholar] [CrossRef]
  27. Chen, N.H. An explicit equation for friction factor in pipe. Ind. Eng. Chem. Fundam. 1979, 18, 296–297. [Google Scholar] [CrossRef]
  28. Zhang, G.; Li, J.; Yang, H.; Huang, H. A new detection method of co-existence of well kick and loss circulation based on thermal behavior of wellbore-formation coupled system. Int. J. Hydrogen Energy 2024, 58, 239–258. [Google Scholar] [CrossRef]
  29. Li, Q.; Wang, Y.; Owusu, A.B. A modified Ester-branched thickener for rheology and wettability during CO2 fracturing for improved fracturing property. Environ. Sci. Pollut. Res. 2019, 26, 20787–20797. [Google Scholar] [CrossRef] [PubMed]
  30. Qingchao, L.; Jingjuan, W.; Qiang, L.; Fuling, W. Sediment Instability Caused by Gas Production from Hydrate-Bearing Sediment in Northern South China Sea by Horizontal Wellbore: Sensitivity Analysis. Nat. Resour. Res. 2025, 34, 1667–1699. [Google Scholar] [CrossRef]
  31. Petersen, J.; Bjørkevoll, K.S.; Lekvam, K. Computing the danger of hydrate formation using a modified dynamic kick simulator. In Proceedings of the SPE/IADC Drilling Conference, Amsterdam, The Netherlands, 27 February–1 March 2001; Society of Petroleum Engineers: Richardson, TX, USA, 2001. [Google Scholar]
  32. Rao, B.K. Heat transfer to non-Newtonian flows over a cylinder in cross flow. Int. J. Heat Fluid Flow 2000, 21, 693–700. [Google Scholar] [CrossRef]
Figure 1. Four cases of co-existence of well kick and leakage condition.
Processes 13 02730 g001
Figure 2. Wellbore-formation heat transfer unit.
Processes 13 02730 g002
Figure 3. Model solving process.
Processes 13 02730 g003
Figure 4. Evaluation of the agreement between simulated outcomes and in situ temperature measurements.
Processes 13 02730 g004
Figure 5. FWT profile under normal conditions.
Processes 13 02730 g005
Figure 6. FWT profile under abnormal conditions.
Processes 13 02730 g006
Figure 7. AT profile after 8 h cycling under different conditions.
Processes 13 02730 g007
Figure 8. The variation of wellhead temperature with time under different conditions.
Processes 13 02730 g008
Figure 9. The temperature variation at bottom hole with time under different conditions.
Processes 13 02730 g009
Figure 10. The temperature difference between inside the drill string and annulus under different conditions.
Processes 13 02730 g010
Figure 11. Comparison of formation–annulus temperature differences under various conditions.
Processes 13 02730 g011
Figure 12. The AT under the four conditions with different kick locations.
Processes 13 02730 g012
Figure 13. Profile curves of the temperature difference between inside the drill string and annulus under different kick locations.
Processes 13 02730 g013
Figure 14. Temperature difference between annulus and formation under various kick depths across four cases.
Processes 13 02730 g014
Table 1. [Casing and Borehole Dimensions for Well YT1] adapted from [28].
ConfigurationHole Diameter (mm)Casing OD (mm)Casing ID (mm)Depth (m)
Surface casing406.40273.05258.651200.00
Technical casing258.65244.50224.002500.00
Open-hole section215.90//5000.00
Table 2. [Tool String Composition and Dimensions for YT1 Drilling Operation] adapted from [28].
Tool TypeOD (mm)ID (mm)Individual Length (m)Total Length (m)
Main drill string149.20129.504728.004728.00
Heavy-weight pipe127.0076.2085.60272.00
Drill collar158.8057.20184.70186.40
Downhole stabilizer212.00159.001.401.70
Polycrystalline Diamond Compact bit215.90/0.300.30
Table 3. [Thermal and Physical Properties of Wellbore Media in YT1] adapted from [28].
MediumDensity (kg/m3)Specific Heat (J/kg·°C)Thermal Conductivity (W/m·°C)
Drilling mud120025001.75
Steel tubular/Casing assembly800040043.75
Cement sheath214020000.70
Geological formation26408002.25
Table 4. [Operational Drilling Parameters for YT1 Well] adapted from [28].
Variable NameNumerical Entry
Borehole total depth5000 m
Yield point of drilling mud10 Pa
Fluidity index (n)0.65
Consistency coefficient0.34 Pa·sn
Inlet temperature of circulating mud25 °C
Surface temperature16 °C
Geothermal gradient2.3 °C/100 m
Drilling fluid displacement15 L/s
Drill-pipe rotation rate60 r/min
Rate of penetration5.00 m/h
Bit diameter215.90 mm
Table 5. Defined scenarios for kick and leakage events in simulation cases.
ScenarioKick Rate (m3/s)Leakage Rate (m3/s)Kick Position (m)Leakage Position (m)
Case 10.010.0135005000
Case 20.010.0135004500–5000
Case 30.010.013000–35005000
Case 40.010.013000–35004500–5000
Disclaimer/Publisher’s Note: The statements, opinions and data contained in all publications are solely those of the individual author(s) and contributor(s) and not of MDPI and/or the editor(s). MDPI and/or the editor(s) disclaim responsibility for any injury to people or property resulting from any ideas, methods, instructions or products referred to in the content.