Abstract
The transport behavior of particles in tortuous fractures is prevalent in the oil and gas extraction process and has a profound impact on engineering. However, due to a variety of factors, drilling fluid leakage is prone to occur during drilling and completion, and an evaluation system for the influence of meander characteristics on the kinetic properties of particles has not yet been established. To this end, this paper constructs a numerical model based on CFD-DEM numerical simulation to simulate the particle–fluid two-phase flow in the meandering fracture, investigates the mechanism of surface meandering on particle force, particle transport velocity, and particle residence time, and proposes a mathematical method based on meandering for predicting particle transport velocity and particle residence time in the stable transport phase. The results show that the increase in tortuosity makes the force state of particles in the fracture show significant instability and intensifies the interaction between fluid and particles in the fracture; the effect of the tortuous wall intensifies the inhomogeneity of transport velocity, and the perturbation effect of the complex path structure on the x-direction velocity of particles is stronger; and the increase in tortuosity is not conducive to particle retention in the fracture. The results of the study can provide theoretical guidance for reducing the risk of drilling fluid leakage during drilling and completion.
1. Introduction
Particle transport in reservoir fractures is a widespread phenomenon in oil and unconventional natural gas extraction, such as coalbed methane and shale gas, including proppant transport [1,2,3], drilling fluid leakage [4,5], and clogging of fines transport [6,7], which has far-reaching impacts on engineering operations. Among them, during the drilling and completion of oil and gas wells, drilling fluid leakage is highly prone to occur due to a variety of factors, thus adversely affecting production and consequently reducing production efficiency [8,9,10]. Understanding the transport mechanism of particles in reservoir fractures is important for rational planning of drilling construction, optimizing the extraction process, reducing the risk of leakage, and improving production efficiency [11,12].
Fracture structures are widely found in geological reservoirs, which are important media for fluid and granular media transport [13], and their surface morphology usually shows irregularities due to their physical properties, stress conditions, and fluid scouring [14]. In order to quantitatively describe this irregularity, many parameters have been proposed, among which the more classical ones include surface tortuosity [15], joint roughness coefficient (JRC) [16], root-mean-square of the first-order derivative (Z2), structure function (SF), roughness exponent (Rp), and height of the peak bulge on the fracture surface (Rz) [17]. Among the more widely used parameters are surface tortuosity and JRC. The tortuous surface structure makes the fluid flow paths tortuous [18], and this tortuous property not only affects the fluid flow but also has an effect on the transport of particles in it under the action of the fluid and the wall.
The effects of rough wall surfaces on particle transport in a fracture are multifaceted, and current studies have extensively investigated particle transport behavior from a number of perspectives, including wall roughness, fluid properties, and particle properties. Within a flat channel, an increase in the Reynolds number (Re) helps to enhance lateral migration and collision of particles, which is detrimental to the retention of formed agglomerates [19]. An increase in flow inertia favors the flat migration of particles at the bifurcation of the flat channel [20], and an increase in flow velocity causes the particles to shift from creeping and sliding migration to suspension, which usually improves the transport efficiency of the particles [21]. Influenced by the rheological properties of the fluid, the viscosity of the fluid can change under conditions such as temperature, pressure, and shear strain, which affects the settling and transport processes of particles in the fracture [22]. Compared to smooth and one-sided rough fractures, the accumulation shape of particles in two-sided rough fracture channels is not the same [23]. By setting up a fracture model with different roughness, Wang [24] explored the effects of hydraulic gradient as well as surface roughness on particle transport aggregation, and found that according to the change in particle erosion rate, it can be divided into two phases. In the first phase, a large number of particles are carried away by the fluid, and the fluid velocity within the fracture rises with the erosion of particles. In the second phase, almost all particles pass through the fracture, the erosion rate tends to stabilize, and the fluid velocity also tends to stabilize. Rough fracture walls not only lead to more energy loss due to frequent particle-to-particle and particle-to-wall contact, but also cause more particles to be transported toward the center of the fracture [25]. The key to sealing a rough fracture lies in the ability to form an effective blocking zone inside the fracture cavity rather than in the entrance buffer zone; the distribution of the blocking zone depends on the surface morphology of the rough fracture [26], whereas the distribution of bridging-favorable zones, local pore size distributions, particle sizes, and bridging structures determine the location and morphology of the leading edge of the subsequent blocking zone [27,28]. An increase in particle diameter enhances the blocking effect [29] and conversely allows particles to have a longer pumping distance in the fracture. Changes in particle concentration and density result in changes in particle bridging structure in the fracture [28], and in mixtures of multiple particles coexisting together, such changes do not refer only to changes in concentration and density of a single particle size but depend on the distribution of particle concentration and density in the mixture. Differences in particle shape cause changes in the drag forces on the particles in the fracture, which in turn affect the transport and sealing process [30,31].
Although much research has been carried out on the particle transport and sealing process of particles in fractures and excellent results have been achieved, the effects of the meander characteristics of the fracture surface on particle dynamics (including particle force, particle transport velocity, and particle residence time) have not been investigated to date. Current research lacks quantitative evaluation of particle transport velocity, residence time, and their relationship with fracture tortuosity in fractured systems, resulting in an absence of effective predictive methods for particle migration. To address this gap, this study establishes a comprehensive methodology to assess solid particle transport capacity and residence time during drilling fluid loss incidents. A numerical model based on the coupled Computational Fluid Dynamics–Discrete Element Method (CFD-DEM) was developed in this study to simulate the particle transport process in fractures with different tortuosity characteristics, with the aim of elucidating the mechanism of tortuosity’s influence on particle transport. Based on the CFD-DEM numerical simulation method, this paper is organized as follows: firstly, a numerical model based on the CFD-DEM coupling method is established, and a one-dimensional fracture model with self-similarity is constructed based on fractal Brownian motion, with the validity of the numerical model verified by comparison with theoretical formulations. Then, the particle transport process in the fracture was simulated by setting different surface tortuosity. Finally, a quantitative analysis of the force, transport velocity, and residence time of the particle transport process was carried out, and a theoretical formula based on tortuosity was proposed to predict the average transport velocity and residence time of the particles in the fracture during the stable transport stage.
2. Numerical Simulation Model Construction
2.1. Numerical Method
The transport behavior of particles in fractured media is a typical multiphysics coupling process, in which particles interact with the fluid [32], and accurately simulating the interaction between particles and fluid is the key to investigating the effect of fracture meander structure on particle transport [7]. The coupled simulation technique, CFD-DEM, can achieve two-way coupling calculations between the particle phase and the fluid phase and can finely describe the particle transport trajectory, contact behavior, and coupling mechanism with the flow field on the particle scale [33]. In view of this, this paper adopts the unresolved CFD-DEM coupling algorithm to carry out the particle–fluid two-phase coupled simulation. The numerical simulation software used in this study is Fluent 19.2 and EDEM, which were used to calculate the motion of the fluid phase and the particle phase, respectively, and the coupled CFD-DEM simulation was achieved by coupling the two software through the UDF program.
In fluid dynamics calculations, water is used as the fluid phase, and during the simulations, the fluid is assumed to be continuous, incompressible, and in laminar flow. According to these assumptions, the fluid flow is consistent with the conservation of mass and momentum. The basic governing equations are as follows [34]:
where denotes the density of the fluid phase, is the velocity of the fluid phase, p is the pressure, is the acceleration due to gravity, and is the external force on the fluid.
In this study, particles are used as discrete phases and momentum is exchanged through particle–fluid interactions, and particle motion follows Newton’s second law. It is assumed that the particles are rigid, spherical, and uniform in size and that there is no heat exchange during particle motion. Based on these assumptions, the governing equations for particle motion are as follows:
where is the contact force between the particles, is the mass of the particles, is the velocity of the particle phase, is the density of the fluid phase, is the density of the particle phase, is the drag force on the particles, is the virtual mass force on the particles, is the pressure gradient force on the particles, and is the Saffman lift force on the particles.
The particles modeled in this study are all rigid particles, and the electrostatic force between particles and adhesion forces are not taken into account. The Hertz–Mindlin contact model is used, in which the contact force can be considered to consist of two components, the normal force and the tangential force [35,36]. The expression for the normal force component is as follows:
where is the normal overlap, and the equivalent Young’s modulus and the equivalent radius are defined by:
where and are the Poisson’s ratios of the particles, and and are the radii of the particles. In addition, the expression for the tangential force is as follows:
where is the tangential overlap and is the tangential stiffness, which is expressed as:
When the particle velocity is different from the fluid velocity, the drag force between the particle and the fluid is generated, and for the particle–fluid coupling conditions in this study, the Schiller–Naumann drag force model was chosen to simulate the drag of the fluid on the particles [37]:
where is the coefficient of drag, is the fluid density, is the contact area, is the velocity of the fluid phase, and is the velocity of the particle phase.
The virtual mass force and the pressure gradient force are negligible when the fluid density is much smaller than the particle density, and play a more important role in the transport of particles when the value is close to one. Considering that the density difference between the particles and the fluid in this study is not extreme, the effects of virtual mass forces as well as pressure gradient forces were considered during the numerical simulations. The virtual mass force on the particle can be obtained from the following equation [38].
where is the virtual quality factor, here taken as 0.5.
The particles are subjected to the pressure gradient force of the fluid due to the pressure gradient of the fluid [32]:
In addition, the effect of Saffman lift on particles in the fracture was considered [39]:
where K is a constant, here taken as 2.594, and is the deformation tensor.
2.2. Rock Fracture Model Generation
Fractal geometry methods are able to characterize the morphology of natural fracture surfaces more effectively, and studies have shown that the roughness of natural fracture surfaces is highly similar in statistical properties to random fracture surfaces generated based on fractal geometry methods [40]. As an extended form of the traditional Brownian motion theory, fractal Brownian motion is able to fully reflect the self-similar structural characteristics of rough interfaces in fracture modeling, and is particularly suitable for modeling fracture surfaces with complex geometric undulations. Among the various fractal Brownian motion-based fracture surface generation algorithms, the Stochastic Random Addition (SRA) method shows good flexibility and adaptability in constructing fracture surfaces with different roughness levels due to its high computational efficiency and simple implementation process.
In the simulation process of fractal Brownian motion in different dimensions, the basic mathematical expressions and computational methods are highly consistent in the theoretical framework, except that the number of function-dependent variables varies with the number of dimensions. In one-dimensional fractal Brownian motion, the position of any point on the fracture surface can be defined by a random and continuous single-valued function , and the increment at the lag distance h and the origin satisfies the Gaussian distribution with mean value 0 and variance . Based on the mean and variance of the increments, the self-affine nature of the fractal Brownian motion can be expressed by the following equation [41]:
where represents the mathematical expectation, r is an arbitrary constant, and H is the Hurst coefficient. The function increment can be expressed as:
Based on the self-affine generation algorithm, by controlling different Hurst numbers, seven one-dimensional fracture rough contour lines with different meandering characteristics are generated in this study, and their specific values are shown in Table 1. In order to better demonstrate the meandering characteristics of the different fracture contour lines and better reflect the tortuosity characteristics in the real fracture, by comparing and verifying with the study by Wang et al. [42], seven tortuosity degrees were selected, ranging from 1.03 to 1.21. As can be seen in Table 1, there is a good negative correlation between H and tortuosity, and as the H index gradually decreases, the tortuosity gradually increases. Figure 1 demonstrates the specific morphology of the different fracture contour lines, and the meandering degree of the fracture curves gradually increases.

Table 1.
Geometric parameters of fracture profiles.
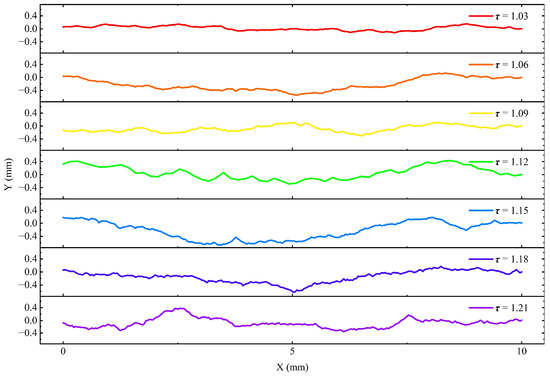
Figure 1.
One-dimensional fracture profile curves with different meander curvatures.
2.3. Simulation Parameters and Boundary Conditions
In the coupled liquid–solid two-phase CFD-DEM numerical model constructed in this study, the simulation domain is a two-dimensional fracture channel structure with natural roughness characteristics. In order to accurately reproduce the dynamic evolution process of particle transport, aggregation, and blockage in the fracture, the boundary conditions are reasonably set. As shown in Figure 2, the inlet of the liquid phase is set as the velocity inlet boundary, and the fluid is driven into the computational domain along the mainstream direction (x-axis) of the fracture by applying a constant flow rate. The outlet end is set as the pressure outlet boundary, so that the liquid can flow out naturally under the condition of approximate atmospheric pressure. The upper and lower boundaries of the fracture are rough wall surfaces defined as no-slip boundaries to simulate the adhesion and shear effects of the fluid on the fracture walls, and the front and back walls are also no-slip boundaries to limit the diffusion of lateral flow.

Figure 2.
Boundary conditions in CFD-DEM simulation (fluid phase boundary conditions in red, particle phase boundary conditions in black).
In the particle phase, the inlet shares the same inlet surface with the fluid, adopts the velocity inlet condition, and imposes a fixed volume fraction to control the particle concentration, thereby realizing the simultaneous injection of particles with the fluid. The upper, lower, front, and back walls are set as rigid impenetrable boundaries, where particles can elastically rebound or slip upon contact to simulate their actual physical interactions with the fracture walls, while the exit is set as an escape boundary, allowing particles to move to the exit and then directly leave the simulation domain. To isolate the effect of tortuosity on particle transport, key parameters—including fluid viscosity, particle density, and inlet velocity—were held constant throughout this study. This controlled approach enables quantitative characterization of tortuosity’s specific influence on particulate migration patterns, and other parameter settings used in the simulation are listed in Table 2. The main procedure of numerical simulation in this study is shown in Figure 3.

Table 2.
Simulation parameters in CFD-DEM simulation.

Figure 3.
Flowchart of the numerical study.
2.4. Mesh Independence Test
To ensure the computational accuracy of fluid flow behavior within the fracture channel, a grid independence study was conducted. Given the consistent geometry of fracture models in this study, Fracture Channel 1 was selected for this validation. Five distinct grid sizes were evaluated through single-phase fluid flow simulations, with results presented in Figure 4. Figure 4a demonstrates that grid sizes of 25 μm and 50 μm provide superior resolution in fluid velocity contour maps compared to coarser alternatives. Further validation in Figure 4b reveals close agreement between velocity profiles at the fracture outlet for these two grid sizes, while significant deviations occur with other resolutions. This confirms that both 25 μm and 50 μm grids enable high-fidelity simulation of fluid dynamics.
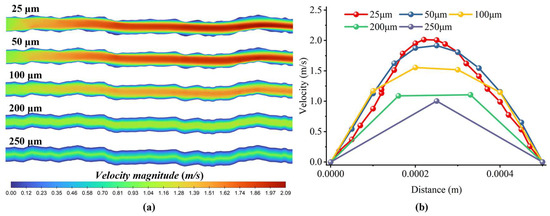
Figure 4.
Simulation results of fluid flow in the fracture channel with different mesh resolutions: (a) cloud map of fluid velocities; (b) fluid flow rate at the exit of the fracture.
For the unresolved CFD-DEM coupling framework employed in this work, the grid size must exceed particle diameters by a factor of 2–4. Balancing this requirement against the need for accurate fluid resolution, we selected a 50 μm hexahedral grid coupled with monodisperse 20 μm particles. This configuration satisfies the unresolved coupling criterion while maintaining sufficient accuracy for both fluid and particle phase simulations.
2.5. Model Validation
- (1)
- Case 1:
Prior to the simulation of coupled particle–fluid two-phase flow in a fracture, the validity of the numerical simulations used in this study was verified to ensure that the simulation method used is able to effectively simulate particle–fluid two-phase flow. When a large number of particles undergo transport and settlement in a fracture, it may significantly affect the pressure drop locally in the fracture as well as in the exit section. Therefore, the fluid pressure drop due to the granular body needs to be accurately modeled. Ergun’s formula, as a commonly used method for calculating the pressure drop of a fluid flowing through a porous medium, is given as follows:
where is the pressure drop; is the process length; is an empirical constant, 150; is the hydrodynamic viscosity; is the apparent flow rate; is the particle diameter; is the porosity; is an empirical constant, 1.75; and is the fluid density.
In this study, a computational domain with dimensions of 10.0 mm × 30 mm × 10 mm was generated, the porosity of the granular bed was 0.45, and spherical particles with a diameter of 1 mm were generated in the domain. Water flow with constant apparent velocity entered from the bottom, and the relevant parameters during the simulation are shown in Table 3. The pressure drop between the inlet and the outlet was measured, and the results are shown in Figure 5, which indicates that the fluid pressure drop computed by the simulation method used in this study is in good agreement with the fluid pressure drop computed by the theoretical formulation. This confirms that the CFD-DEM coupled model used can accurately capture the behavior of the fluid flowing through the granular body and can satisfy the needs of this study.

Table 3.
Simulation parameters in Case 1.
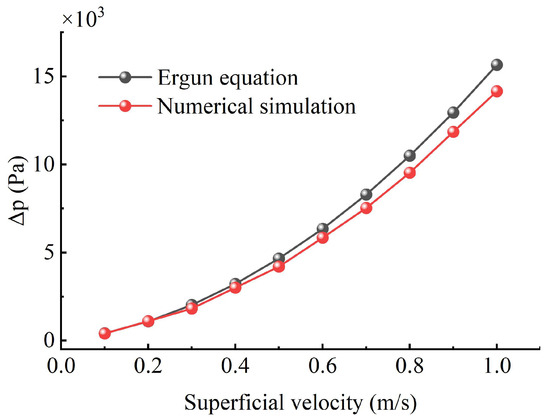
Figure 5.
Comparison of the results of numerical simulations and theoretical equations.
- (2)
- Case 2
To further validate the effectiveness of our simulation methodology for particle flow in fractures, a benchmark case was established using the experimental configuration from Tong et al. [43]. The experiment employed granular materials graded 20–40 mesh (median diameter d50 = 0.6 mm per particle size distribution analysis). Consequently, monodisperse spherical particles of 0.6 mm diameter were implemented in simulations, adopting the validated approach from Zhou et al. [44]. The simulation parameters are detailed in Table 4.

Table 4.
Simulation parameters in Case 2.
Figure 6 demonstrates the comparison between the experimental [43] and simulated results, showing good agreement. Figure 6 shows the distribution of particles at a given time in the experiment and simulation, respectively, and it can be seen that the simulation results are in closer agreement with the experimental results. DPBH (Dimensionless Proppant Bank Height), a commonly used parameter for verifying the effectiveness of sand dunes, can better reflect the discrepancy between the experimental and simulation results [44]. Figure 7 demonstrates the DPBH data obtained from experiment and simulation, and the average error between simulation and experimental results is 3.65%.
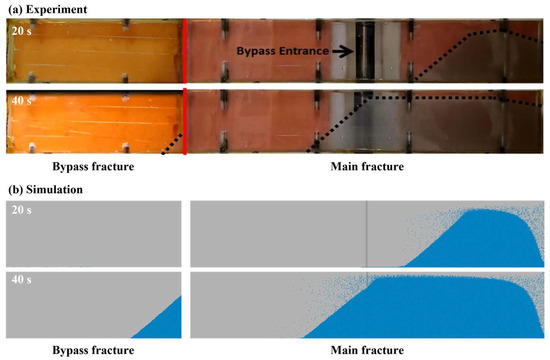
Figure 6.
Comparison of experimental and simulated particle distributions at different times: (a) experiment [43], (b) simulation.
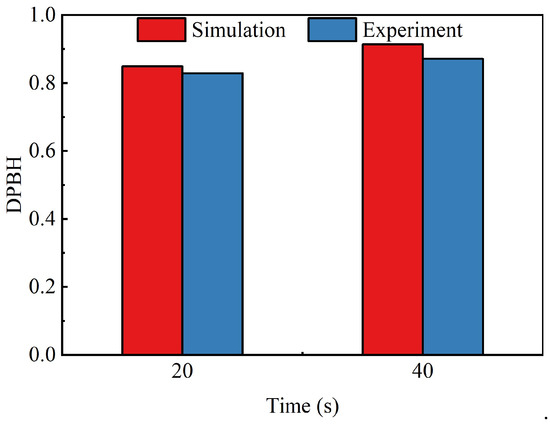
Figure 7.
Comparison of experimental [43] and simulated data for DPBH.
The above two validation cases show that the simulation method used in this study can simulate particle flow behavior in a fracture effectively and meet the simulation requirements of this study.
3. Particle Migration Behavior in Rough-Surface Fractures
3.1. Effect of Fracture Surface Tortuosity on Particle Migration Behavior
Figure 8 shows the particle transport velocity distribution in the fracture with different tortuosity. From the figure, it can be seen that as the tortuosity in the fracture increases from 1.03 to 1.21, the fluid flow channel in the fracture is gradually tortuous, the flow velocity distribution gradually becomes uneven, and the formation of the flow velocity distribution near the protrusion is more complicated (as shown in the pressure and streamline cloud diagram in Figure 9). Under the action of fluid force, the particles are transported in the fracture, and the tortuosity of the wall surface makes the particle flow path gradually more complex. When the tortuosity is 1.03, the particle transport velocity distribution in the fracture is more uniform, and the high-speed particles are concentrated in the middle of the fracture, which is more consistent with the flow velocity distribution of classical Poiseuille flow. As the tortuosity increases, the velocity distribution of particles in the fracture becomes gradually more discrete, with higher transport velocities at the more tortuous points. This is due to the fact that under the action of the tortuous wall, the flow path of the particle suspension in the fracture is tortuous, and the contact and collision between the particles and the tortuous wall significantly affect transport, intensifying the inhomogeneity of the transport velocity.

Figure 8.
Cloud view of particle transport velocity in fracture channels with different surface tortuosity.
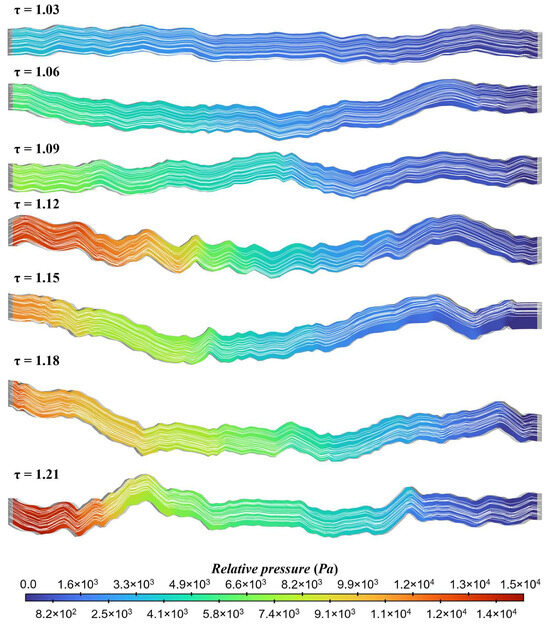
Figure 9.
Fluid pressure and streamline distribution in fracture channels.
3.2. Effect of Fracture Surface Tortuosity on Particle Force
Statistical analysis of the combined force on the particles in the fracture under different simulation conditions is shown in Figure 10a. The meandering wall of the fracture significantly affects the force on the internal particles during transport, and the combined force on the particles in the fracture tends to stabilize with increasing particle transport time in fractures with low meandering (τ = 1.03 and τ = 1.06). With the increase in surface tortuosity, the average value of the combined force on the particles in the fracture gradually increased, and there were obvious fluctuations with the change in particle transport time; such fluctuations became more and more intense with the increase in the surface tortuosity. This phenomenon indicates that the tortuous wall surface increases the probability of collision between the particles and the wall surface, which makes the force state of the particles in the fracture significantly unstable. The average value of the combined force gradually increases, and the fluctuation phenomenon of the force caused by the particle collision becomes more and more pronounced with increasing tortuosity. As shown in Figure 10b, the evolution pattern of fluid forces acting on particles is relatively smooth compared to the evolution trend of the combined force. Furthermore, the magnitude of fluid forces demonstrates significant variations across different fractures.
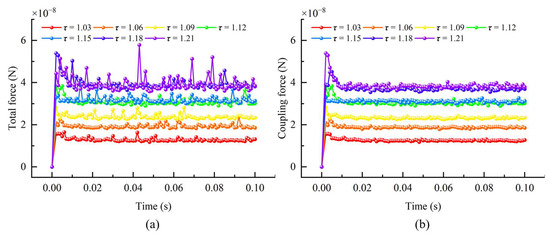
Figure 10.
Evolution of particle forces with transport time in fractures with different tortuosity: (a) combined forces, (b) fluid forces.
3.3. Effect of Fracture Surface Tortuosity on Particle Velocity
The transport velocity of particles in the fracture is an important parameter for characterizing the transport behavior of particles, and for evaluating the leakage rate of drilling fluid and the temporary plugging effect in the oil and gas reservoir. The average velocity of the particles in the fracture at different moments was statistically calculated. As seen in Figure 11a, the average velocity of the particles in the fracture changes gently with increasing transport time. The particles in the fracture are given a certain initial velocity from the generation to the initiation stage, and there is a small range of increase and decrease in the early stage of the transport, after which the system enters the stable transport stage, where particle velocity tends to stabilize. The average velocity of the particles in the fracture increased from 1.03 to 1.21, showing significant differences. At the beginning of the transport stage, the velocity of the particles in the fracture with low tortuosity varied greatly. In the stable transport stage, the particle transport velocity in the high-tortuosity fracture was significantly higher than that in the low-tortuosity fracture, with the average transport velocity of particles in the fracture increasing by 28.4% as tortuosity rose from 1.03 to 1.21. This phenomenon suggests that the wall surface of the fracture has a significant effect on particle transport with increasing tortuosity, which is reflected in the fact that the tortuosity of the flow channel makes particle transport in the channel more unstable, and the higher the tortuosity, the more pronounced the local perturbation of the wall surface, resulting in higher particle transport velocity. In order to further quantify the relationship between roughness and the average velocity Vsa of particles in the stable transport stage, Figure 11b demonstrates the relationship between the average velocity of particles in the stable transport stage and the tortuosity of the fracture surface under different working conditions in Figure 11a.
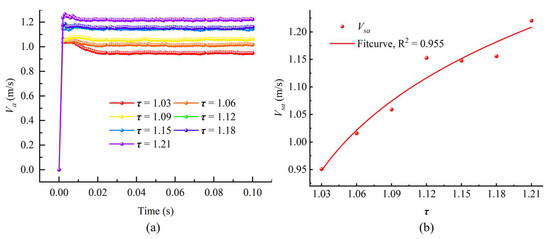
Figure 11.
(a) Variation in average particle velocity Va with transport time in fractures with different tortuosity. (b) Variation in average particle velocity Vsa with tortuosity of the fracture surface during the transport stabilization phase.
The mathematical relationship between the two is obtained through the fitting of the formula shown in Equation (16), with a fitting R2 of 0.955, which indicates that the formula effectively expresses the relationship between the average velocity and the tortuosity of the fracture surface during the stable transport phase of particles:
In order to further quantitatively analyze the proportion of particles with different velocities at a given moment, the particle velocity distribution in the fracture at 0.1 s of transport was statistically calculated, as shown in Figure 12a. The combined particle velocities show an obvious single-peak distribution under all meander degree conditions, with the peak velocity concentrated near 1.2 m/s. With increasing tortuosity τ, the percentage of particles at the peak shows a significant increasing trend, from 21.1% at τ = 1.03 to 30.9% at τ = 1.21. Meanwhile, as tortuosity increases, the range of velocity distribution becomes significantly wider, with more particles distributed in both the high-speed and the low-speed intervals, indicating that the increase in tortuosity strengthens the dispersion and fluctuation amplitude of particle velocity. This phenomenon suggests that the increase in peak percentage and enhancement of velocity dispersion coexist with higher tortuosity, reflecting the dual effects of complex fracture paths on the motion of particles.
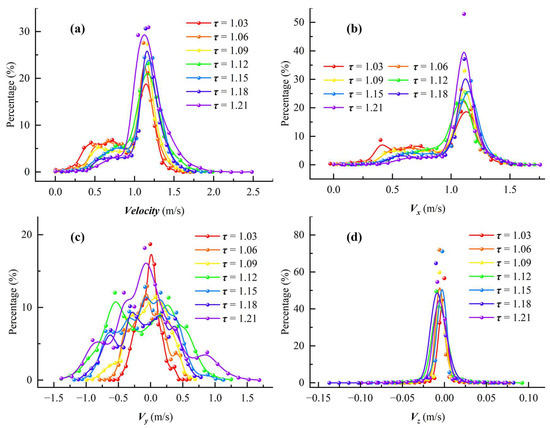
Figure 12.
Proportion of particles with different transport velocities in the particle population at t = 0.1 s: (a) combined velocity, (b) x-direction velocity, (c) y-direction velocity, (d) z-direction velocity.
The statistics of particle velocity distribution in the x-direction are shown in Figure 12b. The characteristics of the x-direction velocity distribution are similar to those of the combined velocity, with all curves showing obvious single-peak distribution characteristics, and the velocities corresponding to the peaks are close to the initial velocities set at the fracture entrance (1.0 m/s). With increasing tortuosity τ, the peak percentage shows a continuous upward trend, in which the percentage of peaks at τ = 1.03 is 19.5%, while it rises to 53% at τ = 1.21. As the deviation from the peak velocity in the x-direction increases, the percentage of particles gradually decreases, indicating that most of the particles still maintain a relatively stable main transport velocity at this moment. An increase in tortuosity leads to a rise in the proportion of particles corresponding to the peak, indicating that more particles fluctuate around the initial velocity, and the motion tends to concentrate. This suggests that the transport merging velocity in the fracture is mainly provided by the x-direction velocity, and the y- and z-directions have a relatively weak influence on the overall transport velocity. The perturbation effect of the complex path structure on the x-direction velocity of particles is stronger, leading to significant velocity differentiation in the x-direction.
The particle velocity distribution in the y-direction was statistically calculated, as shown in Figure 12c. Unlike the velocity distribution in the x-direction, the overall velocity distribution in the y-direction has a symmetric single-peak structure centered on 0 m/s, indicating that the transport of particles in the y-direction at t = 0.1 s is overall weak and that most of the particles fluctuate around 0 velocity. The velocity at the peak share of each curve is close to 0 m/s, but the peak share shows a certain trend with increasing tortuosity τ: when τ = 1.03, the peak share is 20%, while at τ = 1.21 it decreases to 17%. However, at this time, the peak share does not decrease monotonically with increasing tortuosity. In addition, as τ increases, the distribution range of particle velocities in the y-direction widens significantly, especially the proportion of particles in the velocity interval of ±1.0 m/s or more, which increases gradually. This indicates that the disturbance amplitude of particles in the y-direction widens significantly with the increased complexity of the fracture path, and velocity dispersion is enhanced. Compared with the x-direction, the velocity fluctuation in the y-direction mainly originates from the perturbation caused by the fracture structure, and does not directly reflect the characteristics of the main transport direction. This phenomenon indicates that the overall transport of particles in the fracture is still dominated by the x-direction, while the y-direction mainly reflects the lateral perturbation effects.
The statistics of the particle velocity distribution in the z-direction are shown in Figure 12d. The z-direction velocity distribution shows a spike-like single-peak structure centered on 0 m/s under all tortuosity conditions, indicating that the particle motion in the z-direction is extremely weak and concentrated at t = 0.1 s, and that most of the particle velocities are close to zero. The percentage of the peak is significantly higher than that in the x- and y-directions, and much higher than in other velocity intervals, indicating that the particles are not significantly perturbed in the z-direction. With increasing tortuosity τ, the change in the velocity distribution in the z-direction is small, and the overall distribution range is always maintained within ±0.1 m/s, with only a slight discrete enhancement under very few high-tortuosity conditions (e.g., τ = 1.12). This result further indicates that the z-direction motion contributes the least to the overall transport of particles in the fracture, and its velocity change mainly reflects the slight influence of structural perturbation. The z-direction experiences the least perturbation compared to the x- and y-directions.
Comparative analysis reveals distinct particle velocity distribution characteristics across the three dimensions: In the x-direction (primary flow axis), heterogeneous fluid pressure distributions and tortuous streamlines produce varying peak velocities across different fracture channels. The y-direction exhibits fundamentally different behavior, where increased tortuosity amplifies wall perturbations, driving particles toward central high-velocity regions through combined fluid shear and collision inertia effects, resulting in elevated peak velocities and enhanced velocity dispersion. Conversely, the z-direction shows minimal perturbation due to the dominant x-directional flow orientation and the deliberate exclusion of roughness features, yielding significantly reduced velocity variations compared to the other dimensions.
3.4. Effect of Fracture Surface Tortuosity on Particle Residence Time
Whether the particles can be stably transported and retained in the fracture is an important index for evaluating the stability of particle transport in the fracture, which plays an important role in evaluating the leakage of drilling fluid.
Figure 13 illustrates the variation in the average particle residence time within the fracture as a function of transport time. Initially, during the early stages of transport, the average residence time increases proportionally with transport time as particles are injected into the fracture and begin migrating under fluid flow, prior to outflow from the outlet. However, when the transport time exceeds 0.01 s, the growth rate of the average residence time gradually decreases until it stabilizes at a plateau value. This stabilization occurs as particles begin to exit the fracture outlet in significant quantities, marking the transition to a steady state of particle transport within the fracture. Furthermore, the trend of average residence time varies with fracture tortuosity: higher tortuosity prolongs the time required for the residence time to reach this stable stage, but once achieved, it results in a shorter average residence time during the stable stage.
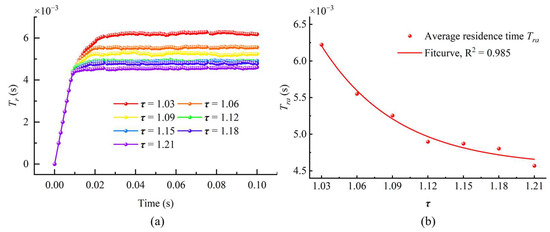
Figure 13.
(a) Variation in the mean particle residence time, , with transport time in the fracture. (b) Variation in the mean particle residence time, , with the tortuosity of the fracture surface during the stabilization phase..
Figure 13b demonstrates the trend of the mean value of particle residence time Tra during the stable stage as a function of fracture surface tortuosity. It can be seen that the mean residence time of the particles in the stable stage in the fracture decreases by 26.6% as τ increases from 1.03 to 1.21. This phenomenon indicates that the increase in the fracture surface tortuosity decreases the residence time of particles, which is unfavorable for particle retention.
Combining the relevant results of Section 3.2 and Section 3.3, it can be seen that the increase in tortuosity enhances the perturbation of the particles when they are transported in the fracture, which is not conducive to stable particle residence. In order to further quantify the relationship between Tra and τ, the data in Figure 13b were fitted, and the fitting equation is shown in Equation (17), with an R2 of 0.985, indicating that the equation can accurately represent the relationship between and τ.
The reduction in particle residence time indicates that, in the absence of bridging clogging, particles exhibit shorter residence times within higher-tortuosity fractures. This corresponds to greater particle transport distances through such fractures, consequently resulting in more severe drilling fluid loss.
4. Discussion
This study generated matching 2D fracture surfaces from 1D profiles, subsequently constructing pseudo-3D fracture models via lateral extension. This approach intentionally disregards both the potential mismatch between upper/lower fracture surfaces and the authentic 3D roughness characteristics in the z-direction. While these simplifications introduce discrepancies between simulations and actual fracture behavior, their impact remains limited within the current research scope. Future work will develop true 3D roughness-incorporated models to enhance engineering applicability.
Although irregular particle shapes exist in natural fractures, this study employs spherical particles, introducing some deviation from reality. However, Zhu et al. [1] demonstrated that spherical particles effectively capture essential particle transport behaviors in fractures. Therefore, spherical particles were adopted to represent aspherical grains. Future work will investigate the transport dynamics of non-spherical particles within fractures.
Drilling fluid loss during operations critically disrupts normal drilling activities, necessitating timely intervention strategies. When the particle diameter-to-fracture aperture ratio falls below 0.1, leakage propagates more extensively in high-tortuosity fractures, rendering conventional bridging plugging strategies ineffective. Utilizing the particle transport and retention prediction formulas (Equations (16) and (17)) developed in this study enables precise forecasting of fluid loss distribution across reservoir segments. This facilitates implementation of location-specific prevention measures, including LCM (Loss Control Material) formulations incorporating elongated fibers to accelerate bridging kinetics and enhance plugging efficacy.
5. Conclusions
Based on the CFD-DEM numerical simulation method, a coupled particle–fluid two-phase flow model was constructed in tortuous fractures, and the influence mechanism of the tortuosity of the fracture surface on particle force, transport velocity, and residence time was investigated. Prediction equations for particle transport velocity and particle residence time in the fracture were proposed based on tortuosity. The specific conclusions are as follows:
- (1)
- Under the action of a tortuous wall, the flow path of particle suspension in the fracture is tortuous. Contact and collision between the particles and the tortuous wall significantly affect particle transport, and the inhomogeneity of transport velocity is aggravated.
- (2)
- The increase in the degree of tortuosity raises the probability of collision between the particles and the wall, which results in significant instability in particle force states in the fracture, and exacerbates the interaction between the fluid and the particles in the fracture.
- (3)
- The transport of particles in the fracture can be divided into two stages: the initiation stage and the stable transport stage. The higher the tortuosity, the more obvious the local perturbation of the wall, and the higher the particle transport velocity; the complex path structure caused by the higher tortuosity has a stronger perturbation effect on particle x-direction velocity.
- (4)
- Higher tortuosity prolongs the time required for particles to reach the stable stage but shortens the average residence time once reached. Thus, increased tortuosity of the fracture surface is unfavorable for particle retention in the fracture.
Author Contributions
Methodology, Y.W. and K.X.; investigation, C.L. and X.Q.; resources, Y.W. and Y.L.; data curation, X.Q. and K.X.; writing—original draft preparation, Y.W. and K.X.; writing—review and editing, Y.L. and K.X.; supervision, C.L. All authors have read and agreed to the published version of the manuscript.
Funding
This study was financially supported by Kaili University Integrated Research Project (2024YB006, YTH-XM2025010, YTH-XM2024011, YTH-PT202403, YTH-PT202405), Guizhou Provincial Department of Education Higher Education Science Research Project (Qian Jiao ji, [2024]348; [2022]367), and the Key Science and Technology Projects of Anyang (No. 2023C01SF211).
Data Availability Statement
The original contributions presented in this study are included in the article. Further inquiries can be directed to the corresponding author.
Conflicts of Interest
The authors declare no conflicts of interest.
References
- Zhu, B.; Tang, H.; Yin, S.; Chen, G.; Zhao, F.; Xu, Y. Effect of fracture roughness on transport of suspended particles in fracture during drilling. J. Pet. Sci. Eng. 2021, 207, 109080. [Google Scholar] [CrossRef]
- Barton, N. Review of a new shear-strength criterion for rock joints. Eng. Geol. 1973, 7, 287–332. [Google Scholar] [CrossRef]
- Chang, O.; Dilmore, R.; Wang, J.Y. Model development of proppant transport through hydraulic fracture network and parametric study. J. Pet. Sci. Eng. 2017, 150, 224–237. [Google Scholar] [CrossRef]
- Drew, D.; Cheng, L.; Lahey, R.T. The analysis of virtual mass effects in two-phase flow. Int. J. Multiph. Flow 1979, 5, 233–242. [Google Scholar] [CrossRef]
- Huang, H.; Zheng, Y.; Wang, Y.; Wang, H.; Ni, J.; Wang, B.; Yang, B.; Zhang, W. Characteristics of proppant transport and placement within rough hydraulic fractures. Pet. Explor. Dev. 2024, 51, 453–463. [Google Scholar] [CrossRef]
- He, X.; Liu, X.; Orlecka-Sikora, B.; Zhang, Z.; Hao, S. Influence of cavity structure on fines migration and aggregation in rock fractures. Phys. Fluids 2025, 37, 053301. [Google Scholar] [CrossRef]
- He, X.; Zhang, Z.; Wang, Y.; Liu, X.; Hao, S. Modeling the relative permeability of gas and water flow in rock fractures with surface morphology parameters. Phys. Fluids 2024, 36, 123305. [Google Scholar] [CrossRef]
- Hertz, B.H. On the contact of elastic solids. J. Für Die Reine Und Angew. Math. 1881, 92, 156–171. [Google Scholar]
- Hu, X.W.; Yang, Z.B.; Chen, Y.F. Fluid-driven particle transport patterns in a confined geometry: Effect of flow velocity and particle concentration. J. Nat. Gas. Sci. Eng. 2021, 92, 103998. [Google Scholar] [CrossRef]
- Jain, R.; Vikas, M.; Mahto, T.K. Study of the Effect of Xanthan Gum Based Graft Copolymer on Water Based Drilling Fluid. J. Macromol. Sci. Part A 2014, 51, 976–982. [Google Scholar] [CrossRef]
- Kieckhefen, P.; Pietsch, S.; Dosta, M.; Heinrich, S. Possibilities and Limits of Computational Fluid Dynamics-Discrete Element Method Simulations in Process Engineering: A Review of Recent Advancements and Future Trends. Annu. Rev. Chem. Biomol. Eng. 2020, 11, 397–422. [Google Scholar] [CrossRef]
- Knappenberger, T.; Aramrak, S.; Flury, M. Transport of barrel and spherical shaped colloids in unsaturated porous media. J. Contam. Hydrol. 2015, 180, 69–79. [Google Scholar] [CrossRef] [PubMed]
- Li, J.; Liu, P.; Kuang, S.; Yu, A. Visual lab tests: Proppant transportation in a 3D printed vertical hydraulic fracture with two-sided rough surfaces. J. Pet. Sci. Eng. 2021, 196, 107738. [Google Scholar] [CrossRef]
- Li, R.; Li, G.; Feng, Y.; Yang, X.; Teng, Y.; Hu, Y. Innovative experimental method for particle bridging behaviors in natural fractures. J. Nat. Gas Sci. Eng. 2022, 97, 104379. [Google Scholar] [CrossRef]
- Lin, D.; He, M.; Xu, M.; Zhou, C.; Chen, X. An updated numerical model of fracture fluid loss coupled with wellbore flow in managed pressure drilling. Phys. Fluids 2023, 35, 053110. [Google Scholar] [CrossRef]
- Lind, Y.B.; Samsykin, A.V.; Galeev, S.R. Information and analytical system for prevention of drilling fluid loss. In Proceedings of the Society of Petroleum Engineers—SPE Russian Petroleum Technology Conference, Moscow, Russia, 26–28 October 2015. [Google Scholar]
- Lu, H.; Li, G.; Dai, S.; Zhang, T.; Quan, H.; Huang, Z. Synthesis and Properties of Aminoarylsulfonic Acid-Phenol-Formaldehyde Copolymer As Drilling Fluid Loss Reducer. J. Macromol. Sci. Part A 2012, 49, 85–91. [Google Scholar] [CrossRef]
- Magsipoc, E.; Zhao, Q.; Grasselli, G. 2D and 3D Roughness Characterization. Rock Mech. Rock Eng. 2020, 53, 1495–1519. [Google Scholar] [CrossRef]
- Manoorkar, S.; Krishnan, S.; Sedes, O.; Shaqfeh, E.S.G.; Iaccarino, G.; Morris, J.F. Suspension flow through an asymmetric T-junction. J. Fluid Mech. 2018, 844, 247–273. [Google Scholar] [CrossRef]
- Mindlin, R.D.; Deresiewicz, H. Elastic Spheres in Contact Under Varying Oblique Forces. J. Appl. Mech. 1953, 20, 327–344. [Google Scholar] [CrossRef]
- Pu, H.; Xue, K.; Wu, Y.; Zhang, S.; Liu, D.; Xu, J. Estimating the permeability of fractal rough rock fractures with variable apertures under normal and shear stresses. Phys. Fluids 2025, 37, 036635. [Google Scholar] [CrossRef]
- Saffman, P.G. The lift on a small sphere in a slow shear flow. J. Fluid. Mech. 1965, 22, 385–400. [Google Scholar] [CrossRef]
- Sanchez, C.J.; McHugh, M. Drilling fluid loss events in the Denver Basin aquifers. In H2GEO: Geotechnical Engineering for Water Resources; ASCE: Reston, VA, USA, 2004; pp. 220–227. [Google Scholar]
- Schiller, L.; Naumann, A. A drag coefficient correlation. Zeit. Ver. Deutsch. Ing. 1935, 77, 318–320. [Google Scholar]
- Stroeven, P. A stereological approach to roughness of fracture surfaces and tortuosity of transport paths in concrete. Cem. Concr. Compos. 2000, 22, 331–341. [Google Scholar] [CrossRef]
- Wang, D.Y.; Qian, Q.; Zhong, A.H.; Lu, M.J.; Zhang, Z.L. Numerical modeling of micro-particle migration in channels. Adv. Geo-Energy Res. 2023, 10, 117–132. [Google Scholar] [CrossRef]
- Wang, J.; Qi, H.; You, C. Experimental study of sedimentation characteristics of spheroidal particles. Particuology 2009, 7, 264–268. [Google Scholar] [CrossRef]
- Wang, P.; Li, Q.Y.; Ma, T.F.; Ou, X.L.; Shen, Y.X.; Yang, Y.; Tian, X.F. An unresolved CFD-DEM method for studying migration and clogging of fine particles through a packed bed. Ironmak. Steelmak. 2023, 50, 1618–1630. [Google Scholar] [CrossRef]
- Wang, T.; Wang, P.; Yin, Z.Y.; Laouafa, F.; Hicher, P.Y. Hydro-mechanical analysis of particle migration in fractures with CFD-DEM. Eng. Geol. 2024, 335, 107557. [Google Scholar] [CrossRef]
- Wang, Y.; Zhang, Z.; Ranjith, P.G.; Han, X. Flow structure transition and identification of two-phase fluid flow through rough rock fractures. Eur. Phys. J. Plus 2023, 138, 376. [Google Scholar] [CrossRef]
- Wang, Y.J.; Li, X.Y.; Zhao, B.; Zhang, Z.N. Numerical simulation of particle plugging in hydraulic fracture by element partition method. Int. J. Numer. Anal. Methods Geomech. 2020, 44, 1857–1879. [Google Scholar] [CrossRef]
- Xue, K.; Pu, H.; Li, M.; Luo, P.; Liu, D.; Yi, Q. Fractal-based analysis of stress-induced dynamic evolution in geometry and permeability of porous media. Phys. Fluids 2025, 37, 036630. [Google Scholar] [CrossRef]
- Wang, Y.K.; Zhang, Z.Y.; Ranjith, P.G.; Luo, Y. Water-gas flow in rough rock fractures: Insights from coupled triaxial compression experiments. Hydrogeol. J. 2022, 30, 1569–1581. [Google Scholar] [CrossRef]
- Xue, K.; Zhang, Z.; Zhong, C.; Jiang, Y.; Geng, X. A fast numerical method and optimization of 3D discrete fracture network considering fracture aperture heterogeneity. Adv. Water Resour. 2022, 162, 104164. [Google Scholar] [CrossRef]
- Yan, X.; Kang, Y.; You, L.; Xu, C.; Lin, C.; Zhang, J. Drill-in fluid loss mechanisms in brittle gas shale: A case study in the Longmaxi Formation, Sichuan Basin, China. J. Pet. Sci. Eng. 2019, 174, 394–405. [Google Scholar] [CrossRef]
- Yang, X.; Feng, J.; Li, G.; Li, R.; Li, Z.; Li, H. Transport behavior of particles and evolution of plugging zones in rough fractures: Insights from a novel coupled CFD-DEM model. Comput. Geotech. 2024, 173, 106553. [Google Scholar] [CrossRef]
- Yang, X.; Li, S.; Li, G.; Li, R.; Kadhim, M.M.K.; Li, H.; Duan, M.; Li, Z. Visualization experiment on dynamic migration and sealing mechanism of irregular materials in rough fractures. Geoenergy Sci. Eng. 2024, 242, 213251. [Google Scholar] [CrossRef]
- Yao, S.; Chang, C.; Hai, K.; Huang, H.; Li, H. A review of experimental studies on the proppant settling in hydraulic fractures. J. Pet. Sci. Eng. 2022, 208, 109211. [Google Scholar] [CrossRef]
- Zhang, L.; Yan, X.; Yang, X.; Tian, Z.; Yang, H. An elastoplastic model of collapse pressure for deep coal seam drilling based on Hoek-Brown criterion related to drilling fluid loss to reservoir. J. Pet. Sci. Eng. 2015, 134, 205–213. [Google Scholar] [CrossRef]
- Zheng, Y.; Wang, H.; Yang, B.; Hu, Y.; Shen, Z.; Wen, H.; Yan, W. CFD-DEM simulation of proppant transport by supercritical CO2 in a vertical planar fracture. J. Nat. Gas. Sci. Eng. 2020, 84, 103647. [Google Scholar] [CrossRef]
- Zhu, H.P.; Zhou, Z.Y.; Yang, R.Y.; Yu, A.B. Discrete particle simulation of particulate systems: Theoretical developments. Chem. Eng. Sci. 2007, 62, 3378–3396. [Google Scholar] [CrossRef]
- Wang, S.; Xu, Y.; Zhang, Y.; Yu, Q.; Wang, L. Evaluating the Influence of Fracture Roughness and Tortuosity on Fluid Seepage Based on Fluid Seepage Experiments. Appl. Sci. 2022, 12, 7661. [Google Scholar] [CrossRef]
- Songyang, T.; Mohanty, K.K. Proppant transport study in fractures with intersections. Fuel 2016, 181, 463–477. [Google Scholar] [CrossRef]
- Zhou, M.; Yang, Z.; Xu, Z.; Song, X.; Wang, B.; Zheng, Y.; Zhou, Q.; Li, G. CFD-DEM modeling and analysis study of proppant transport in rough fracture. Powder Technol. 2024, 436, 119461. [Google Scholar] [CrossRef]
Disclaimer/Publisher’s Note: The statements, opinions and data contained in all publications are solely those of the individual author(s) and contributor(s) and not of MDPI and/or the editor(s). MDPI and/or the editor(s) disclaim responsibility for any injury to people or property resulting from any ideas, methods, instructions or products referred to in the content. |
© 2025 by the authors. Licensee MDPI, Basel, Switzerland. This article is an open access article distributed under the terms and conditions of the Creative Commons Attribution (CC BY) license (https://creativecommons.org/licenses/by/4.0/).