Article

Pyrolytic Valorization of Polygonum multiflorum Residues: Kinetic, Thermodynamic, and Product Distribution Analyses

1
School of Environmental Science and Engineering, Guangdong University of Technology, Guangzhou 510006, China
2
Department of Civil and Environmental Engineering, University of Maine, Orono, ME 04469, USA
*
Author to whom correspondence should be addressed.
Processes 2025, 13(9), 2701; https://doi.org/10.3390/pr13092701 (registering DOI)
Submission received: 3 August 2025 / Revised: 21 August 2025 / Accepted: 23 August 2025 / Published: 25 August 2025
(This article belongs to the Special Issue Advances in Remediation of Contaminated Sites: 3rd Edition)

Abstract

Polygonum multiflorum (PM) residues represent an underutilized biomass resource, with pyrolysis offering a promising route for valorizing its biomass into valuable chemicals and biochar. This study elucidated how the intrinsic physicochemical properties of PM residue governed its pyrolysis kinetics, thermodynamics, mechanisms, and product distribution across varying thermal regimes (slow pyrolysis at 20 °C/min vs. fast pyrolysis). The primary devolatilization stage (174–680 °C) dominated the pyrolysis process. Applying three model-free kinetic approaches (FWO, KAS, Starink) over 0.1 < α < 0.7, this study observed a dramatic shift in apparent activation energy (219.7–354.7 kJ/mol). Major gaseous pyrolysis products identified included alcohols, aldehydes, ketones, acids, aromatic hydrocarbons, phenolics, CO, and CO2. Ketones constituted the predominant fraction (23.80%), followed by acids (18.18%), phenolic derivatives (18.18%), N-containing compounds (14.28%), and furans (4.54%). The findings of this study contribute significant theoretical understanding and practical solutions for the effective pyrolysis and resource recovery from Polygonum multiflorum processing byproducts.

1. Introduction

Fossil fuels are non-renewable resources underpinning societal development and economic activity; however, their intensive exploitation accelerates their depletion and precipitates severe ecological crises, such as climate change, land degradation, pollution, and ecosystem disruption [1]. These impacts challenge sustainable socioeconomic development. Currently, biomass provides approximately 10% of the worldwide energy supply, with the potential to reach 18–20% by mid-century contingent on robust policy support and continuous innovation [2]. Agricultural and forestry residues offer particular promise due to their C neutrality (typically achieving net-zero CO2 emissions over their lifecycle), high calorific value, and low waste generation [3].
Polygonum multiflorum (PM), a medicinally valued Polygonaceae herb, exemplifies this potential. Its tuberous roots are used clinically to tonify the liver/kidneys, enrich essence/blood, and promote hair darkening, thus making PM a key raw material in pharmaceuticals and health products. Expanding cultivation driven by demand generates substantial residues during planting, harvesting, and processing [4], primarily comprising pruned stems and post-extraction marc. In particular, bioactive constituent (e.g., anthraquinones and stilbene glycosides) extraction yields are only ~1% [5]; thus, approximately 99 kg of marc is produced per kg of extracted compounds. In China, annual plant-based medicine residue reaches ~70 million tons, with PM marc contributing tens of thousands of tons [4]. Valorizing this biomass could reduce fossil fuel dependence while generating economic and environmental benefits.
Current research on valorizing Chinese medicinal residues focuses on thermochemical pathways like pyrolysis. For instance, Zhao et al. [4] investigated changes in three-phase products of Chinese medicine residue pyrolysis and gasification under varying temperatures and oxygen contents (including PM as a component of mixed residues). Cho et al. [6] utilized red ginseng residue to improve the production of pyrolysis gas by maximizing the production of CO2 in the synthesis gas. Chen et al. [7] applied a multi-technique approach (thermogravimetric–fourier-transform infrared spectroscopy–gas chromatography–mass spectrometry—TG-FTIR-GC/MS) to study the pyrolysis kinetics, real-time gas evolution, and condensable products of herbal tea and Salvia miltiorrhiza residues, providing mechanistic insights into their thermal decomposition. Despite the prevalence of PM residues in plant-based medicinal waste, they lack dedicated studies that correlate their unique physicochemical properties with pyrolytic behavior. In contrast, PM research has emphasized chemical constituent isolation, pharmacological validation, such as regenerative medicine [8] and processing techniques [9], with limited focus on its thermochemical conversion. While sporadic studies explore PM use in fertilizers or feed [10], systematic investigations of its pyrolytic kinetics, product yields, and volatile evolution pathways are lacking. Addressing this gap, this study aimed to (1) characterize pyrolytic mass loss of PM via TG analysis and volatile evolution and composition via TG-FTIR-GC/MS analyses; (2) identify bio-oil compounds via pyrolysis (Py)-GC/MS analysis; and (3) determine key kinetic and thermodynamic parameters via model-free methods.

2. Materials and Methods

2.1. Sample Preparation

Processed PM roots were commercially obtained from a herbal medicine supplier in Guangdong Province, China. Pretreatment involved drying, milling and sieving, and storage for analysis. Raw material was dried at 105 °C in a forced-air oven for 24 h until constant weight was achieved, ensuring complete moisture removal. Dried samples were pulverized using a high-speed grinder. The resulting powder was sieved through a 100-mesh sieve (particle size < 150 μm), and the sub-150 μm fraction was collected. The processed powder was sealed in aluminum foil bags and stored in a desiccator with silica gel desiccant at room temperature (25 ± 2 °C) to prevent moisture absorption prior to analysis.

2.2. Physicochemical Analyses

Proximate analysis of PM was performed according to Chinese National Standard GB/T 28731-2012 [11] (solid biofuels), determining moisture (M), ash (A), and volatile matter (VM) contents (wt%, air-dried basis). Fixed carbon content (FC, wt%, air-dried basis) was calculated as follows:
FC = 100 − M − A − VM
Ultimate analysis was employed to quantify C, H, N, and S contents (wt%, air-dried basis) via an elementar analyzer (Vario EL cube, Elementar Analysensysteme GmbH, Langenselbold, Germany). Oxygen content (O, wt%, air-dried basis) was calculated by difference:
O = 100 − C − H − N − S − A − M
Higher heating value (HHV) was measured using a microprocessor-controlled oxygen bomb calorimeter (WZR-1T-CII, Changsha Kaiyuan Instruments Co., Changsha, China).

2.3. TG-DTG Experiment

Pyrolysis was performed using a TG analyzer (TG 209 F1, Netzsch, Selb, Germany) under high-purity N2 (99.999%) flowing at 50 mL/min. Experiments employed heating rates of 10, 20, and 40 °C/min with sample masses of 8.0 ± 0.20 mg lightly compacted in alumina crucibles, covering a temperature range of 25–1000 °C. This micro-scale configuration effectively minimized intraparticle heat and mass transfer limitations. The analyzer continuously recorded mass loss (TG) and derivative thermogravimetry (DTG) data as a function of temperature. System errors were corrected via blank baseline subtraction, and all analyses were performed in triplicate to ensure relative standard deviations (RSD) below 5%.

2.4. Pyrolysis Parameters and Performance Evaluation

The following key parameters derived from TG analysis were used to assess PM pyrolysis performance: ignition temperature (Ti), peak temperature (Tp), maximum pyrolysis rate (−Rp, max), average mass loss rate (−Rv, avg), and residual mass at the end of the reaction (Re). Also, the comprehensive pyrolysis index (CPI), a validated metric exhibiting feedstock reactivity and pyrolysis performance with a coefficient of determination (R2) of >0.98, was calculated as follows:
C P I = ( R p ) × ( R v ) × m T i × T p × T 1 / 2
where (−Rp, max) is the maximum mass loss rate (%/min); ΔW is the total mass loss over the main pyrolysis stage (wt%); Tp is the peak temperature (°C or K); and ΔTh is the temperature interval at half-maximum mass loss rate (°C or K).

2.5. Kinetic Analysis

Kinetic analysis decouples the synergistic effects of pyrolysis temperature and residence time on reaction pathways, enabling the prediction of biomass degradation behavior. While conventional models postulate reaction mechanisms a priori, inverse engineering from experimental data offers an alternative approach for identifying probable mechanistic frameworks [12]. Given the inherent complexity of biomass pyrolysis, characterized by competing endothermic/exothermic reactions, phase transitions, and mass transfer limitations, the one-step global reaction model provides a validated simplification for primary devolatilization kinetics [12]. Consistent with lignocellulosic decomposition studies, PM thermal degradation was described by the following reaction:
b i o m a s s ( s o l i d ) k ( T ) v o l a t i l e s g a s + c h a r ( s o l i d )
where the temperature-dependent rate constant k(T) follows the Arrhenius formalism as follows:
k T = A e E α R T
where E α is the activation energy (kJ·mol−1); A is the pre-exponential factor (s−1); R is the ideal gas constant (8.314 J·mol−1·K−1); and T is absolute temperature (K).

2.5.1. Model-Free Methods

Model-free isoconversional methods circumvent mechanistic assumptions to determine accurate apparent activation energy ( E α ) values for solid-state reactions, eliminating errors from preselected reaction models [13]. This study employed three methodologies: (1) Kissinger–Akahira–Sunose (KAS); (2) Flynn–Wall–Ozawa (FWO), and (3) Starink. Reaction mechanism consistency was verified by examining Eα dependence when α = 0.1 − 0.9. Kinetic parameters were derived from multi-heating-rate TG profiles (10, 20, and 40 °C/min) via nonlinear regression [14]. For PM exhibiting multi-stage decomposition, reaction progress was quantified as follows:
α = ( m 0 m t ) / ( m 0 m f )
where m 0 , m t ,   and   m f are the initial, instantaneous, and final sample masses (mg), respectively. The fundamental rate equation is as follows:
d α d t = k T f ( α ) = A e E α R T f ( α )
where f ( α ) is the reaction model. Given linear temperature ramping (β = dT/dt), Equation (5) transforms to
d α d t = A e E α R T f α   β = d T / d t   d α d T = A β e E α R T f α
When G α = 0 α d α f α ,integration yields
G α = 0 α d α f α = ( A β ) 0 T e ( E α R T ) · d T
Under initial reaction conditions (α→0, T→T0), Equation (7) simplifies to
G α = ( A β ) T 0 T e ( E α R T ) · d T
As a benchmark method for biomass kinetics [14], KAS is derived by logarithmically transforming Equation (7) and applying the Coats–Redfern approximation as follows:
l n β T 2 = ln A E α R G α E α R T
At a fixed conversion degree (α), G(α) is constant. Plotting ln(β/T2) versus 1/T yields a linear relationship where the slope m = − Eα/R directly determines the activation energy.
Utilizing Doyle’s approximation for the temperature integral, FWO kinetics is as follows [14]:
ln β = ln A E α R G α 5.3305 1.052 E α R T
For a constant value of α, plotting lnβ versus 1/T produces a linear fit. The activation energy is calculated from the slope m = −1.052 Eα/R.
Synthesizing KAS and FWO approaches, Starink’s equation achieves superior accuracy (±1.5% error) in Eα determination:
l n β T 1.92 = C o n s t a n t 1.0008 ( E α R T )
where Cs is a conversion-dependent constant. The plot of ln(β/T1.92) versus 1/T 1/T yields Eα from the slope m = −1.0008 Eα/R.

2.5.2. Master-Plots Method

The values of Eα obtained via FWO, KAS, and Starink enable the determination of the most probable reaction mechanism through the master-plot method as follows [15]:
P ( u )   =   e x p ( u ) u × ( 1.00198882 u + 1.87391198 )
where u = Eα/RT.
From Equation (7), the reaction model integral is expressed as follows:
G ( α )   =   A E α β R P ( u )
As a reference, when α = 0.5, this becomes
G ( 0.5 ) = A E α β R P ( u 0.5 )
where u0.5 = Eα/RT0.5, and T0.5 is the temperature when α = 0.5.
The normalized master plot equation is derived by combining Equations (13) and (14):
G ( α ) G ( 0.5 ) = P ( u ) P ( u 0.5 )
The common dynamic models are shown in Table 1.

2.6. Thermodynamic Parameter Estimation

The key thermodynamic parameters—pre-exponential factor (A), enthalpy change (ΔH), Gibbs free energy change (ΔG), and entropy change (ΔS)—were calculated as follows [16]:
A = β · E α · e E α R T P / R · T P 2
Δ H = E α R T
Δ G = E α + R · T P · l n ( K B · T P h · A )
Δ S = Δ H Δ G T P
where KB is the Boltzmann constant (1.381 × 10⁻²³ J/K); h is the Planck constant (6.626 × 10⁻³⁴ J·s); Eα is apparent activation energy (kJ·mol−1); β is heating rate (°C·min−1); TP is peak temperature (K); T is absolute temperature (K) for ΔH; and R is universal gas constant (8.314 J·mol−1·K−1).

2.7. TG-FTIR-GC/MS Experiment

The thermal degradation behavior and volatile evolution of PM were monitored in real-time using a coupled TG-FTIR-GC/MS system. Approximately 8.00 ± 0.20 mg of sample was loaded in an Al2O3 crucible within a TG analyzer (TGA/DSC 3+, Mettler Toledo, Schwerzenbac, Switzerland) operated under high-purity N2 (99.999%) at 50 mL/min. The temperature program comprised heating from 25 °C to 302 °C at 20 °C/min followed by a 10 min isothermal hold at 302 °C to simulate slow pyrolysis conditions. Evolved volatiles were continuously transferred via heated transfer lines (230 °C) to an FTIR (Nicolet iS 50, Thermo Fisher Scientific, Waltham, MA, USA) for functional group analysis and subsequently to a GC/MS system (GC: Trace 1300, MS: ISQ QD, Thermo Fisher Scientific, USA) for compound separation and identification. Liberated volatiles were transported through 230 °C heated lines to an FTIR spectrometer (Thermo Fisher Nicolet iS 50) for functional group analysis (4000–500 cm−1 range; 4 cm−1 resolution), and subsequently to a GC/MS system (Thermo Fisher Trace 1300 GC with ISQ QD MS) for compound separation/identification. Background signals were subtracted via blank tests. GC conditions included: initial oven temperature at 40 °C (15 min), ramped at 15 °C/min to 250 °C (1 min hold), 1 mL/min injection flow, and 5 mL/min purge gas flow. MS operated at 70 eV ionization energy with a 300 °C ion source. Spectra processing involved the use of OMNIC v9.0 software (FTIR) and NIST 2017 database matching (GC/MS).

2.8. Py-GC/MS Experiment

Fast pyrolysis products of PM were characterized using a pyrolyzer (PY-2020iD, Frontier Laboratories, Fukushima, Japan) coupled directly to a GC/MS (Trace Ultra-DSQ II, Thermo ScientificTM, Waltham, MA, USA). Approximately 1.00 mg of sample underwent pyrolysis under the high-purity He atmosphere at 600 °C, maintaining a 24 s residence time at each target temperature. Evolved vapors were immediately transferred through a 300 °C-heated transfer line (preventing condensation) to the GC inlet. Separation was achieved using an Rtx-5MS capillary column (30 m × 0.32 mm i.d. × 0.25 μm film thickness) with a temperature program (initial hold at 45 °C for 2 min; ramp at 4 °C/min to 300 °C; and final hold at 300 °C for 10 min). Mass spectrometric detection employed electron ionization (70 eV). Compounds were identified by matching mass spectra against the NIST 2017 database, validated with retention indices and literature data. This technique enables qualitative identification and semi-quantitative analysis of individual components within pyrolytic vapors.

3. Results and Discussion

3.1. Physicochemical Properties and Pyrolysis Suitability of PM Residues

Table 2 summarizes the proximate analysis, ultimate analysis, and higher heating value (HHV) of PM biomass. Its moisture content (4.10 wt%) was below the 10 wt% threshold optimal for pyrolysis [17], minimizing energy losses from water evaporation and volatile condensation. PM exhibited more volatile matter (69.83 wt% vs. 28.34 wt%), enhancing its devolatilization efficiency and ignition characteristics, but lower fixed carbon (20.81 wt% vs. 61.36 wt%) and reduced HHV, consistent with typical biomass fuels, than coal [18]. PM’s fixed carbon content (20.81 wt%) exceeded that of corn stover (5.80 wt%) [19] and wheat straw (17.54 wt%) [20], suggesting its higher energy density. Elemental analysis revealed that PM’s S content (0.03 wt%) was low, significantly reducing its SOx emission risks. Its N content (0.91 wt%) fell between those of corn stover (3.51 wt%) [21] and wheat straw (0.58 wt%) [20], indicating its NOx emission potential comparable to conventional biomass. Thus, this nitrogen content inherently translates into a potential for NOx emissions during the thermochemical conversion processes.
The higher heating value of PM (16.69 MJ/kg) aligned with energy-dense herbaceous biomass, falling within the range of rice husk (14.81 MJ/kg) [22] and closely matching wheat straw (17.00 MJ/kg) [23]. In particular, PM’s elemental composition revealed high C (43.10 wt%) and O (44.63 wt%) contents, indicating abundant oxygenated organic compounds that enhance thermal reactivity. Consequently, PM represents a viable pyrolysis feedstock with inherently lower SOx emission risks than conventional biomass or coal, while its NOx emission potential remains comparable to similar biomass.

3.2. Thermal Decomposition Regime with Stage/Heating Rate-Specific Effects

The PM pyrolysis followed stage-specific decomposition: initial removal of adsorbed/crystalline water, followed by sequential degradation of hemicellulose (dehydration/depolymerization), cellulose (pyrolysis), and lignin (aromatization/fragmentation) [24]. This pathway was effectively modeled as superimposed reactions of the three primary components [25], with residual char undergoing further thermochemical conversion. Figure 1 reveals the TG and DTG curves, with stage-specific mass loss for PM. Using 20 °C/min as representative, PM pyrolysis exhibited three distinct stages [24,25]. Stage I (30–174 °C) resulted in 3.7 wt% loss from water evaporation and light extractives volatilization. Stage II (174–680 °C) was the dominant degradation phase (71.16 wt% loss, ∼90% of total) with peak rate (−Rp, max) of 13.31%/min at 302.0 °C. Primary mechanisms included hemicellulose/cellulose depolymerization and partial lignin pyrolysis via bond scission, radical recombination, and oxygenated volatile formation [26]. Stage III (680–1000 °C) led to minimal mass loss (1.04 wt%) from lignin aromatization and mineral decomposition, yielding 24.1 wt% solid residue.
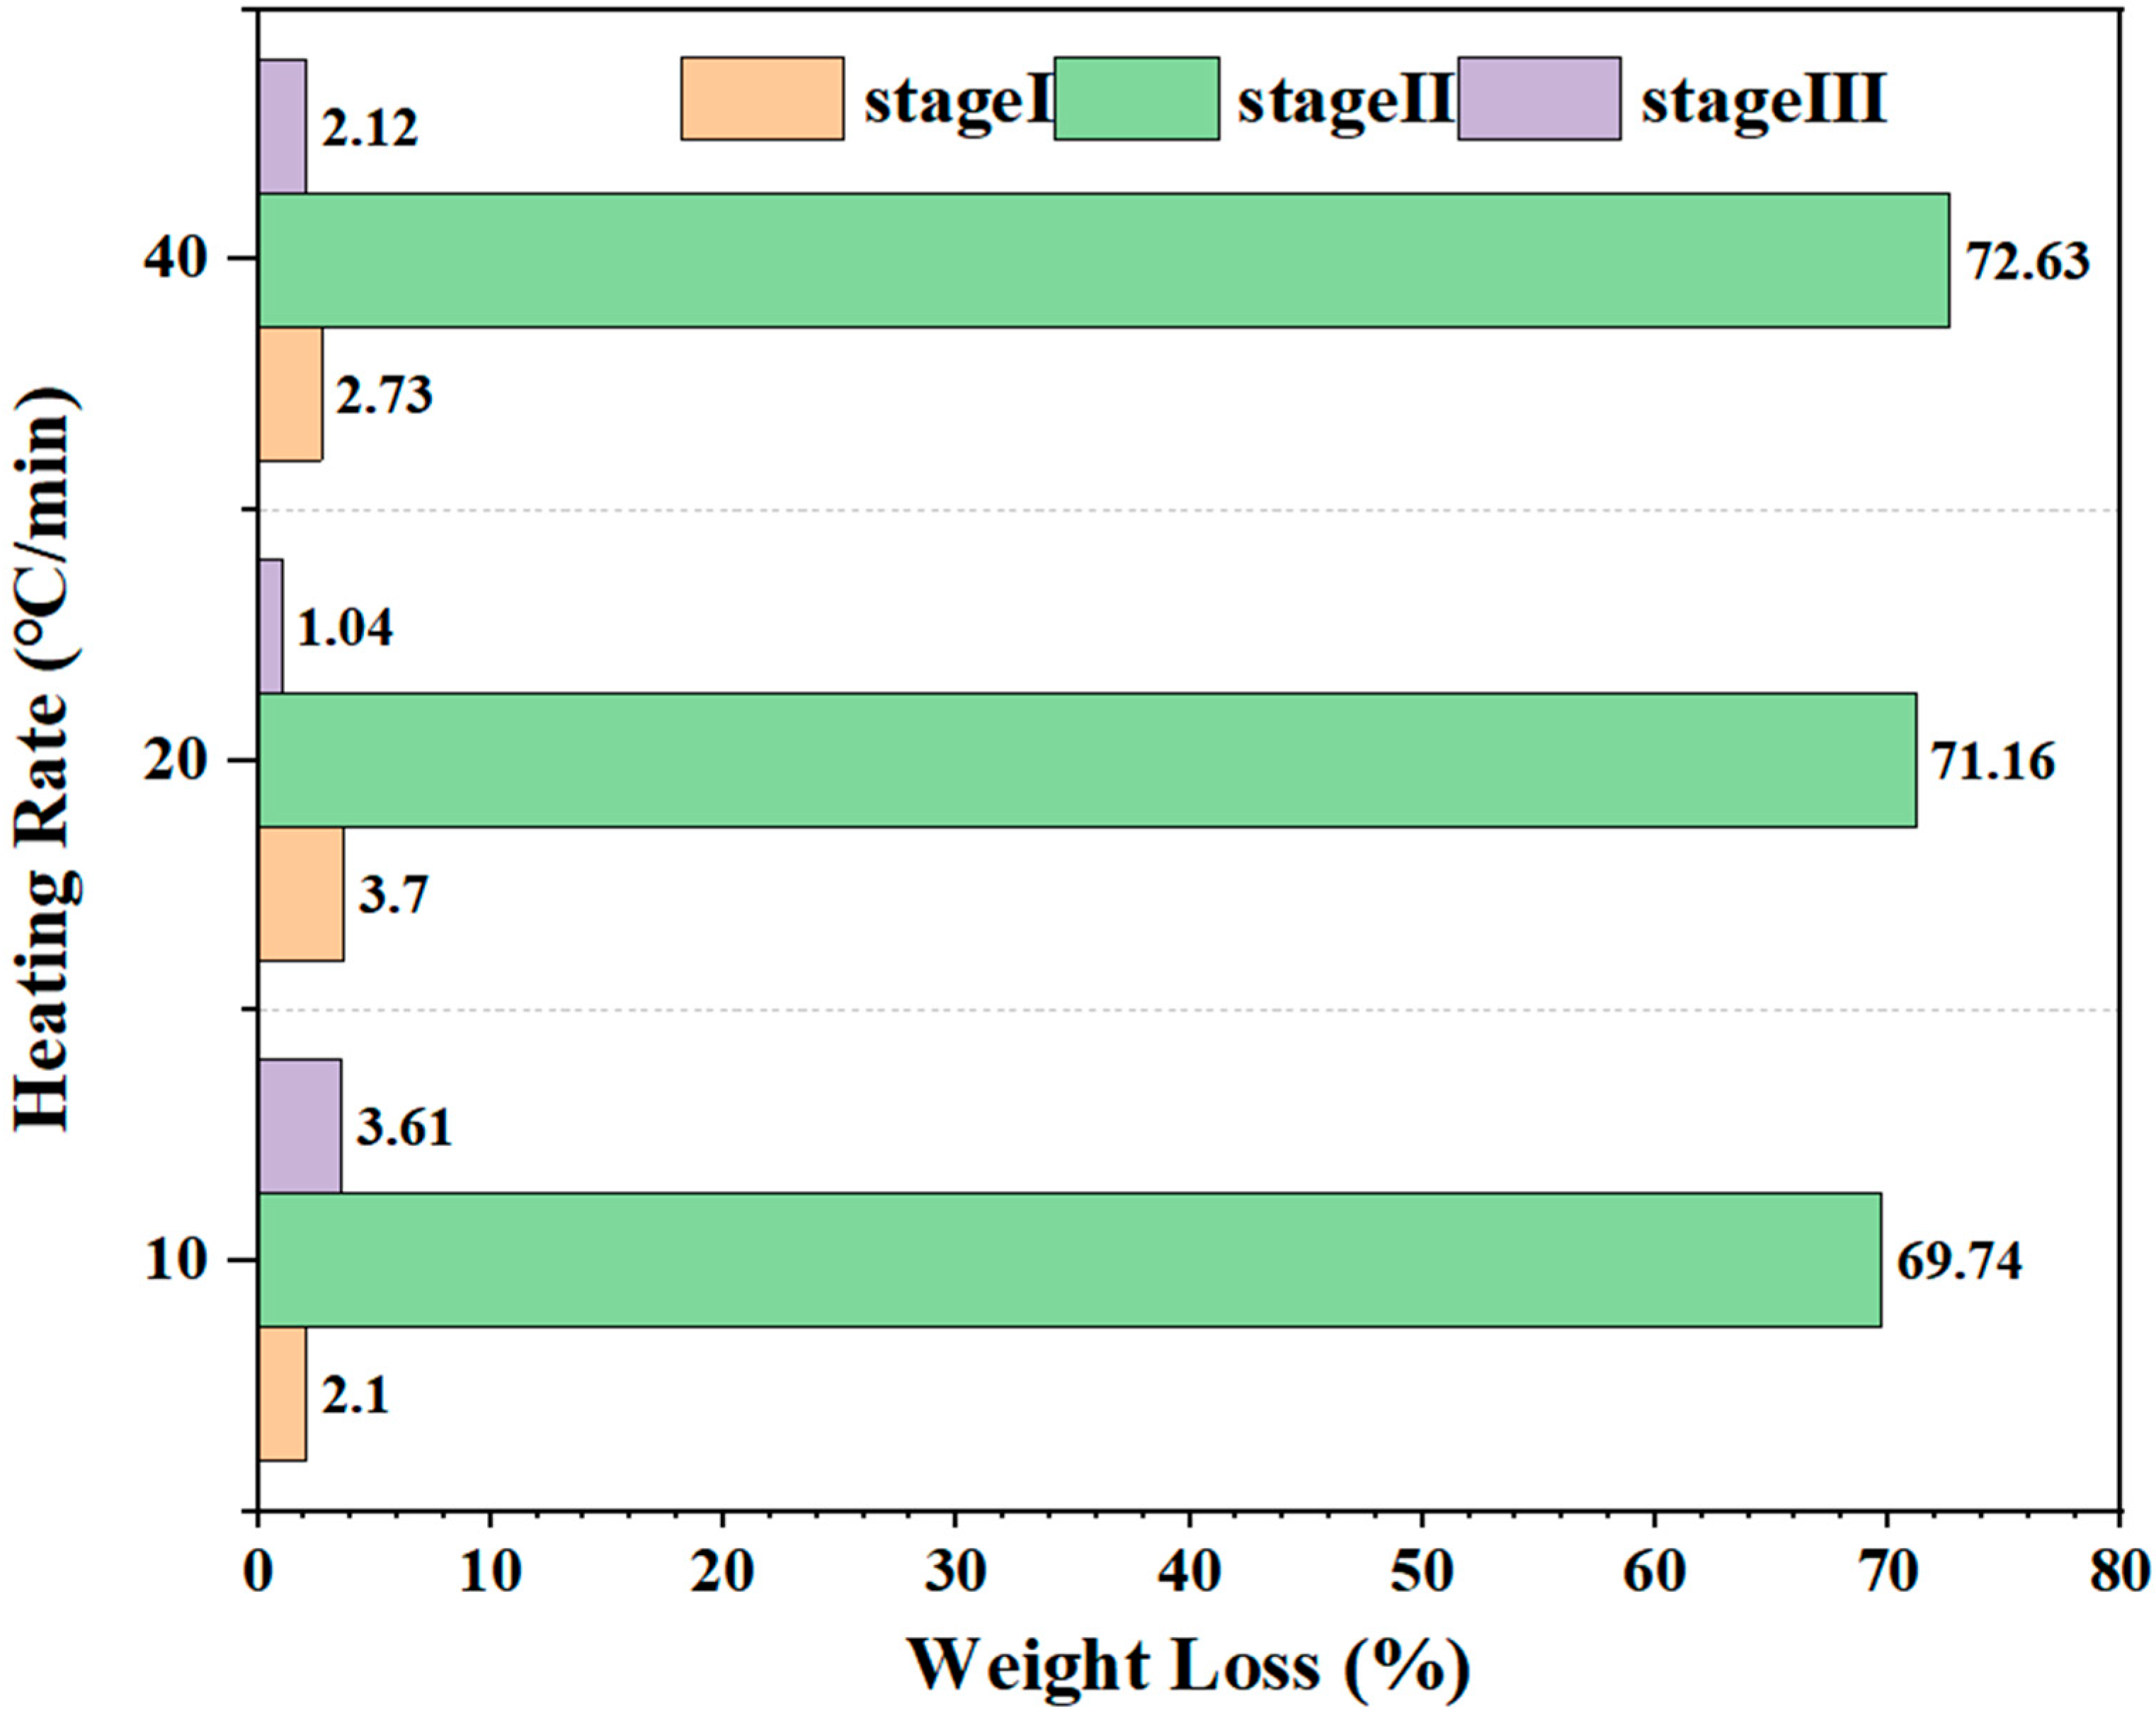
While the TG curve represents instantaneous sample mass, DTG characterizes the mass loss rate. Figure 1b reveals highly consistent DTG profile trends for the PM pyrolysis at 10, 20, and 40 °C/min, indicating heating-rate-independent reaction pathways. During the dominant Stage II decomposition, the DTG curves exhibited a single composite peak reflecting the overlapping decomposition of lignocellulosic constituents [27]. In particular, increasing heating rates from 10 to 40 °C/min amplified peak intensity (−Rp, max), shifted peak temperatures upward (292.1→312.2 °C), and reduced Stage II duration (97.5→22.5 min). These trends confirmed enhanced reaction intensity per unit time at the higher heating rates, attributed to thermal gradient lag effects and reaction kinetics. Specifically, the rapid heating induced internal heat transfer limitations, delaying the apparent peak decomposition temperature. Concurrently, the increased heating rates reduced the reaction time per temperature interval through Arrhenius kinetics, thus shifting the decomposition peaks to the higher temperatures [28]. In other words, the rapid heating induced internal heat transfer limitations, delaying peak decomposition temperatures [28]. Furthermore, Figure 2 shows increased Stage II mass loss and decreased solid residue yield with the elevated heating rates.

3.3. Key Pyrolysis Performance Indicators

Key pyrolysis parameters for PM are summarized in Table 3. As the heating rate (β) increased from 10 to 40 °C/min, ignition temperature (Ti) and peak temperature (Tp) significantly increased (292→312 °C), while total pyrolysis time decreased 8.1-fold from 182.8 to 22.5 min. Concurrently, maximum mass loss rate (−Rp, max) surged 3.9-fold (6.95→27.14%/min), while the CPI increased 12.7-fold from 9.72 × 10⁻⁵ to 123.76 × 10⁻⁵. This behavior reflected competing thermal kinetics. Although Arrhenius kinetics predicted accelerated reactions at the elevated temperatures, PM thermal lag delayed temperature thresholds [29]. The observed CPI enhancement confirms superior reaction intensity and efficiency at higher heating rates. Final mass loss (m ≈ 80%) aligns with PM’s inherent high volatile matter (69.83 wt%) and ash (5.26 wt%) content, consistent with thermal conversion patterns observed in medicinal herb residues [29] and fungal substrates [30].

3.4. Kinetic Analysis: Apparent Activation Energy Trends

FWO, KAS, and Starink were applied to determine the Eα values of the PM pyrolysis during Stage II (174–680 °C) when 0.1 < α < 0.7 at 0.05 intervals (Figure 3). The R2 values > 0.9 (0.994–0.999) for all linear regressions for lnβ (FWO), ln(β/T2) (KAS), and ln(β/T1.92) (Starink) vs. 1/T (Table 4) confirmed method validity and estimation reliability. The Eα profiles exhibited consistent conversion-dependent behaviors. During the low conversion (α < 0.6), stable Eα values (FWO: 219–228 kJ/mol; KAS: 225–237 kJ/mol; Starink: 230–242 kJ/mol) reflected the decomposition of labile components (hemicellulose/extractives) requiring consistent energy input. When α ≈ 0.7, Eα sharply rose to 354.72 kJ/mol (FWO model), which corresponded to simultaneous cellulose depolymerization and lignin fragmentation. The Eα values increased sharply when α > 0.7 and ranged from 354.72 to 627.99 kJ/mol. Therefore, the data when α > 0.7 were not analyzed in this study.

3.5. Thermal Decomposition Mechanisms

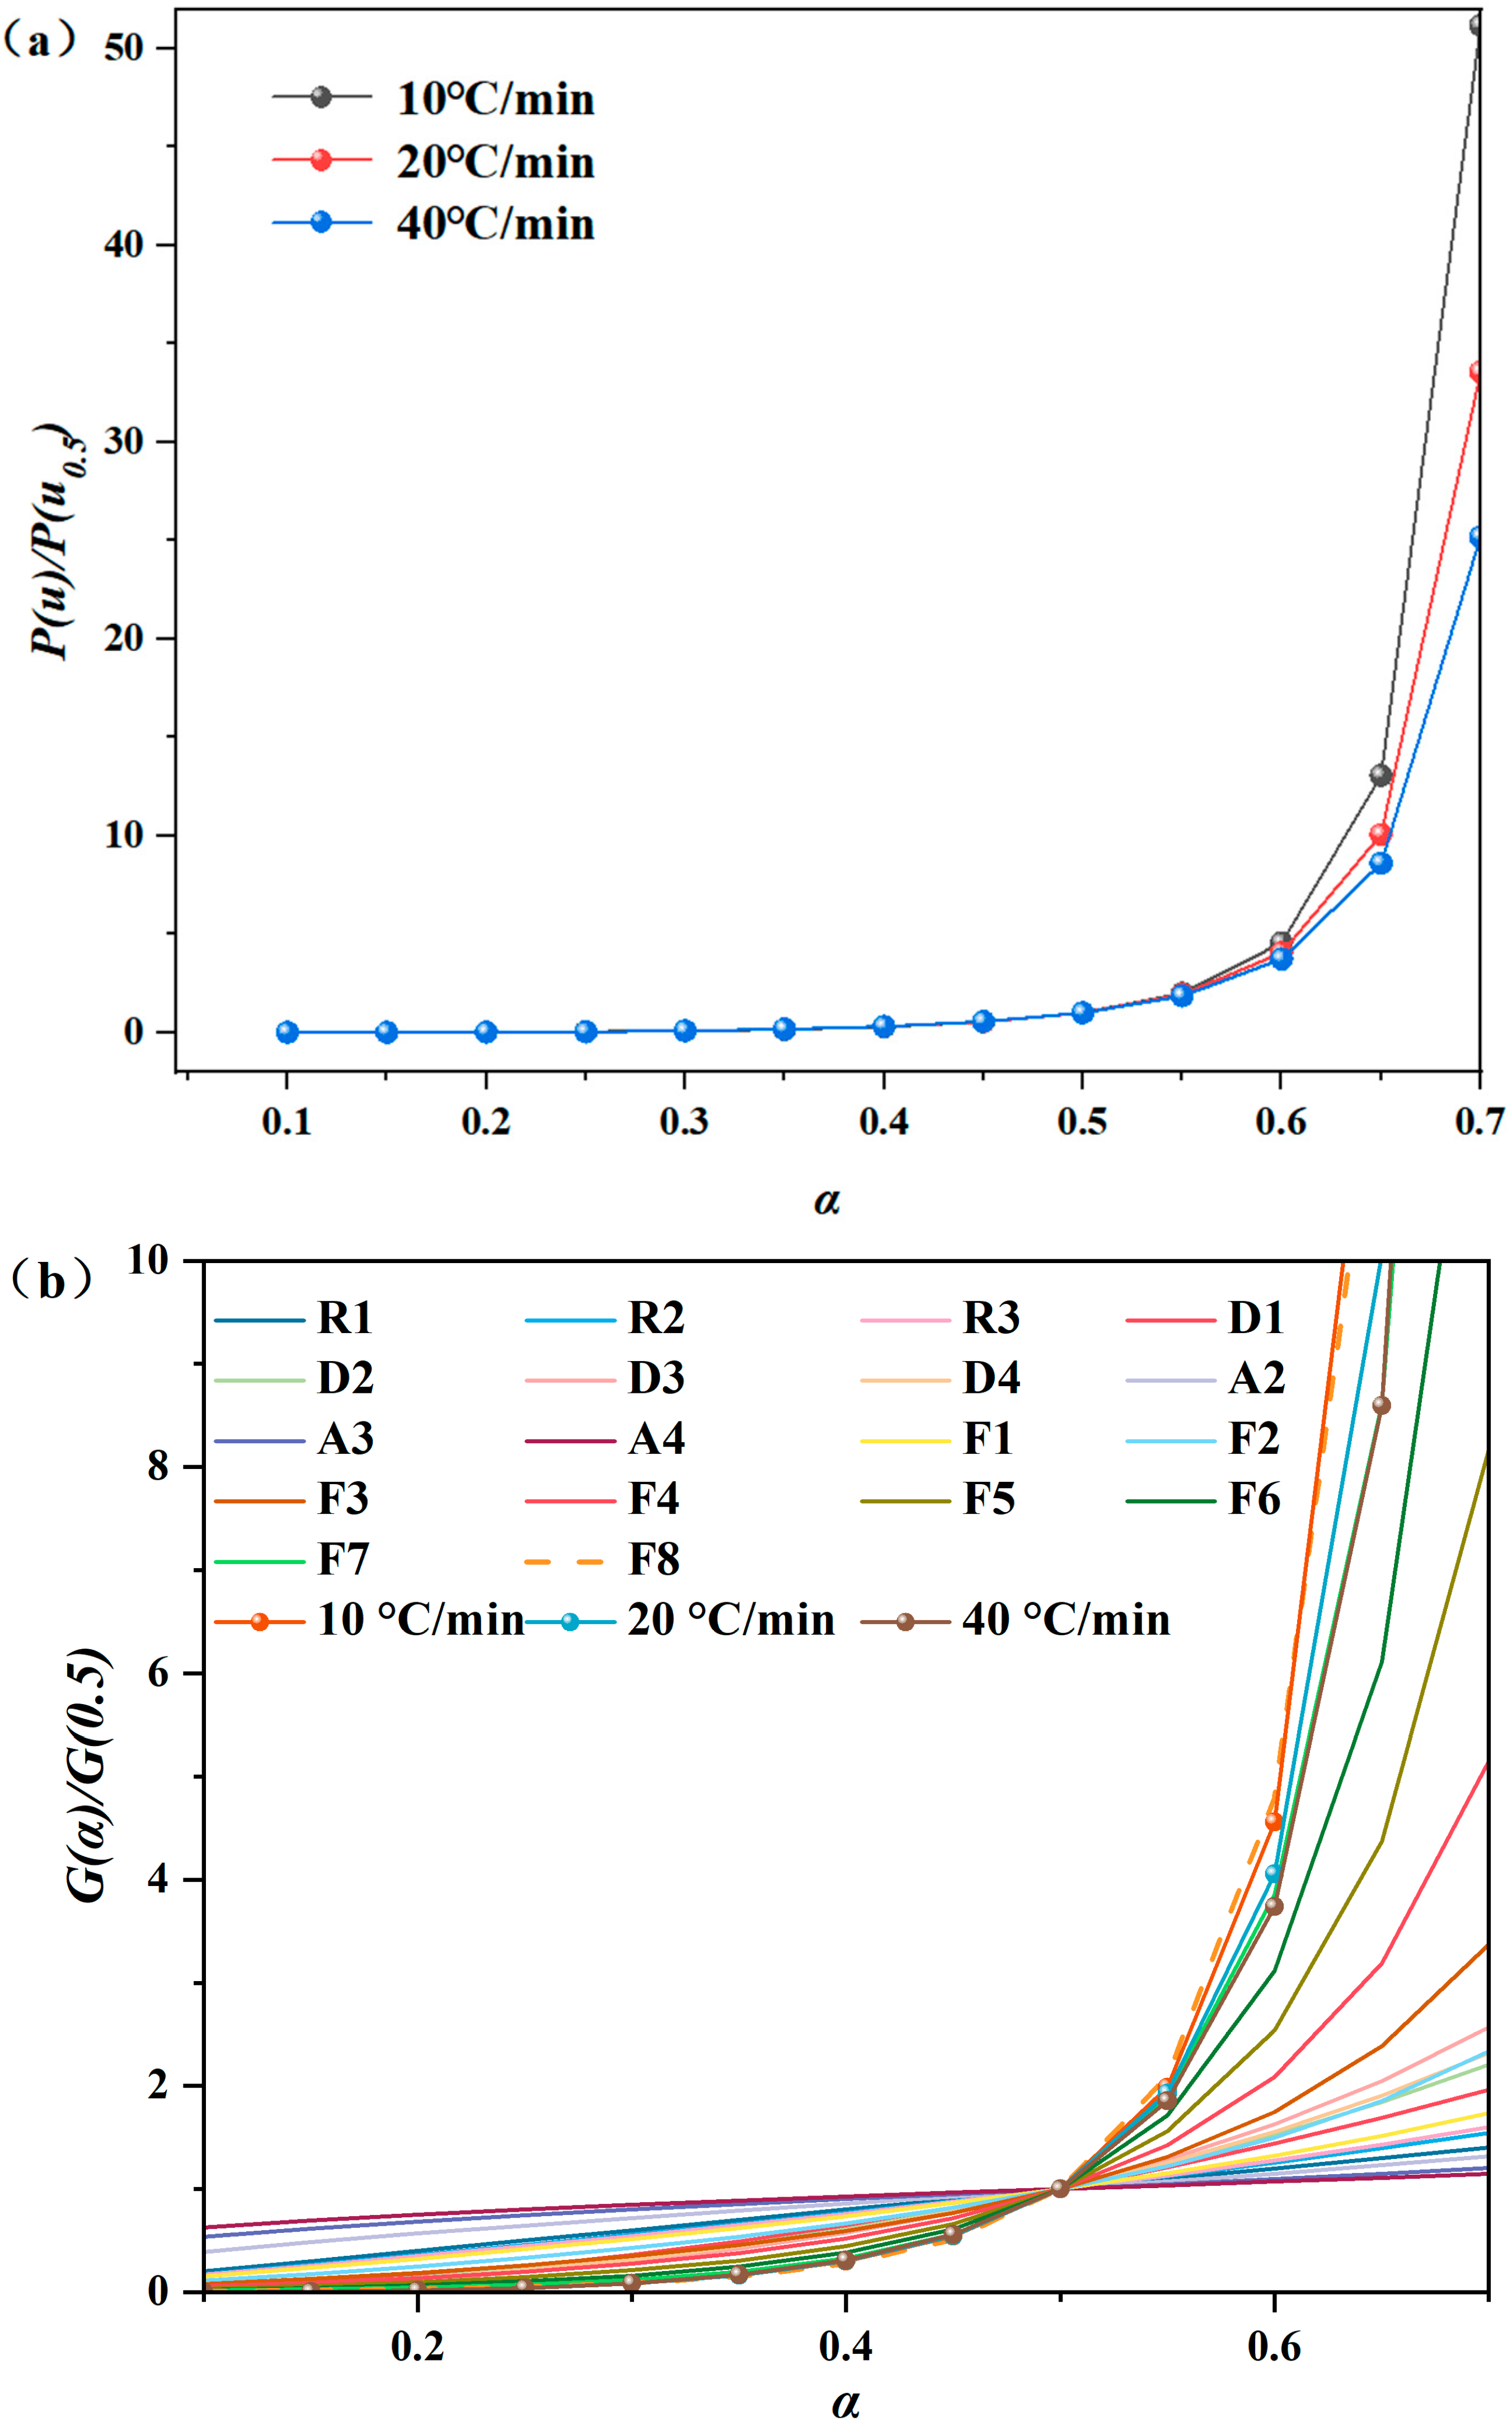
Model-free kinetic analysis yielded activation energies consistent with theoretical expectations, confirming that a single dominant reaction mechanism governed the PM pyrolysis. Given methodological consistency (Eα differences < 5% across FWO/KAS/Starink) and FWO’s superior regression quality (R2 > 0.99), we adopted FWO-derived Eα for quantitative analysis. Figure 4a demonstrates heating-rate independence in the normalized master plot P(u)/P(u0.5) versus α, confirming consistent reaction pathways across thermal regimes. Subsequent analysis, therefore, utilized the 20 °C/min profile. Figure 4b identifies the optimal reaction model by comparing experimental and theoretical master plots. The Fn (reaction-order) model family best described the kinetics, where the rate-determining step is chemical reaction control rather than diffusion. Specifically, the F8 model aligned with experimental data, evidenced by its integral form: G(α) = ((1 − α)−7 − 1)/7 (Figure 4b). This eighth-order reaction model signified multi-step decomposition pathways during Stage II pyrolysis (174–680 °C).

3.6. Thermodynamic Parameter Evolution

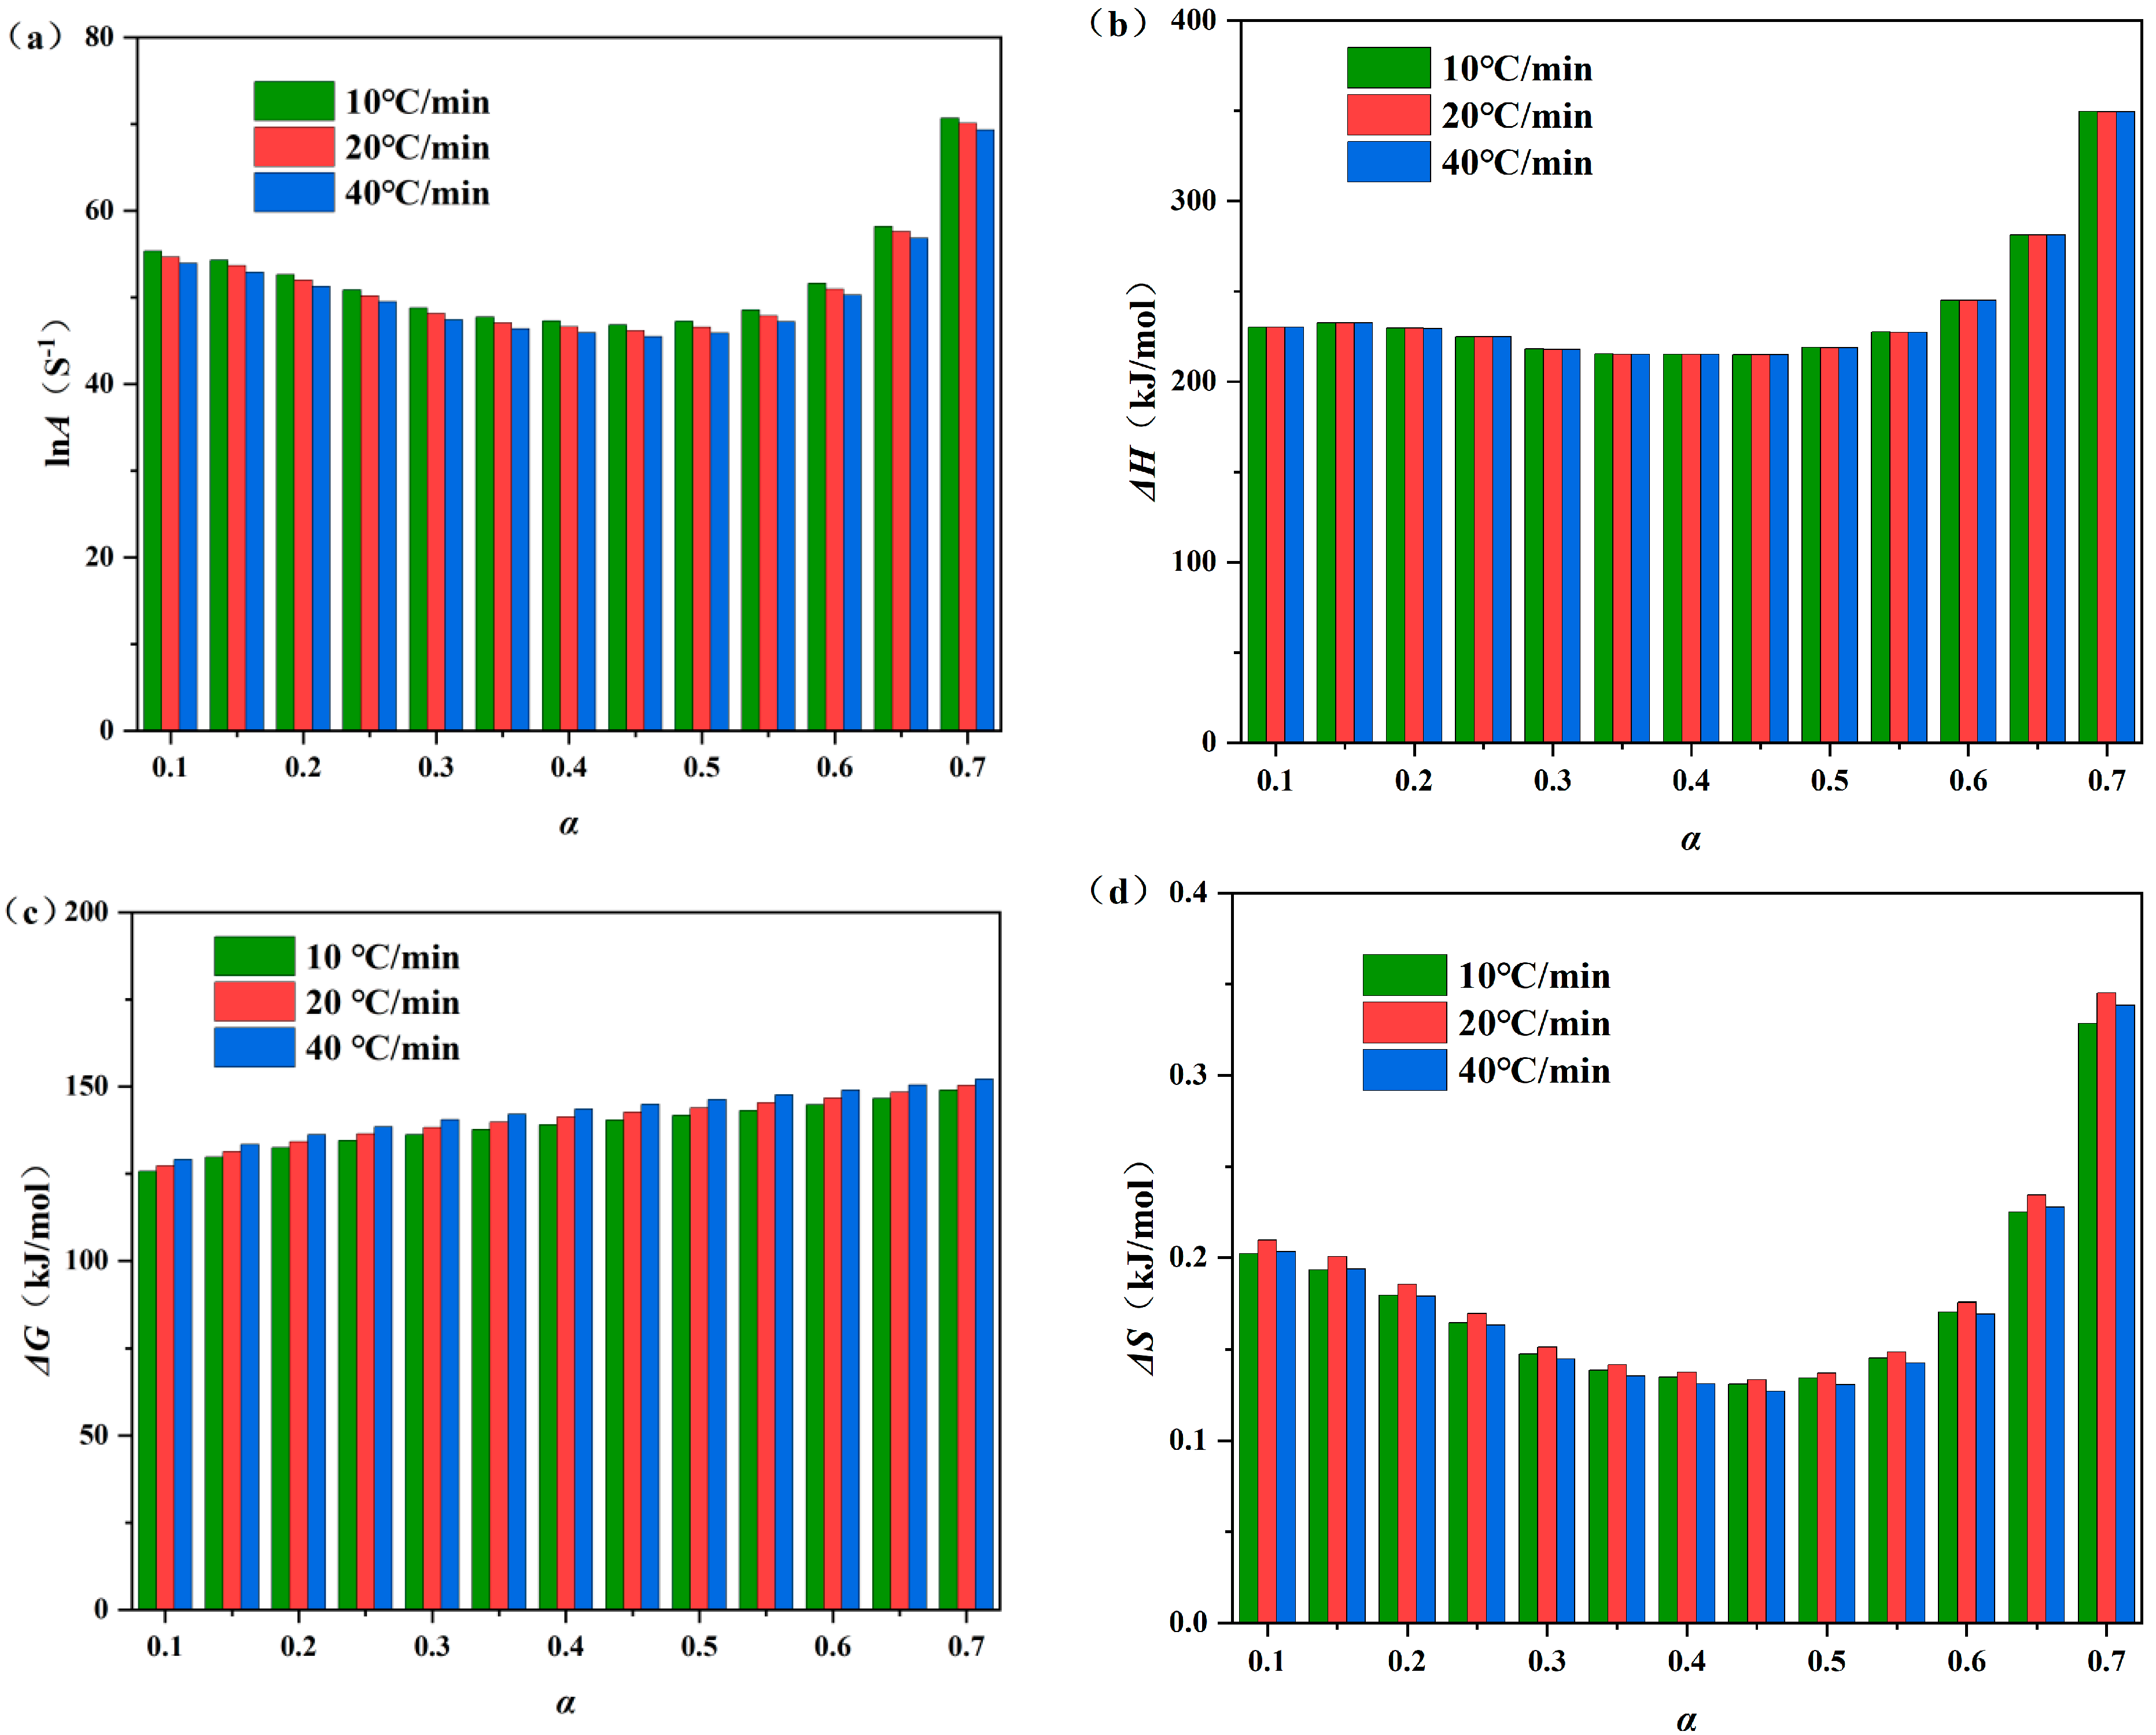
Figure 5a–d depicts the evolution of A, ΔH, ΔG, and ΔS as a function of α during the PM pyrolysis (see Table 5 for detailed data). The value of A reflects molecular collision frequency, where A > 109 s−1 characterizes highly reactive systems [31]. lnA values ranged from 46.17 to 70.12 (corresponding to 1020–1030 s−1) when α = 0.1–0.7, confirming sustained high reactivity throughout the decomposition. In particular, a 51% increase in lnA from 46.17 when α = 0.1 to 70.12 when α = 0.7 indicated accelerated thermal cracking driven by reaction front progression.
Enthalpy change (ΔH), representing net energy absorption for bond cleavage during pyrolytic product formation [31], progressively increased from α = 0.4 to 0.7 (Figure 5b), peaking at 349.60 kJ/mol. This 163% increase reflected escalating energy barriers in the advanced conversion stages, corresponding to maximal endothermic demand preceding reaction completion. The minimum energy barrier (ΔH − Eα) [32] rose from 4.35 kJ/mol (α = 0.4) to 5.12 kJ/mol (α = 0.7) while remaining < 10 kJ/mol, thus confirming PM’s inherently facile pyrolytic conversion.
Gibbs free energy change (ΔG), governing pyrolysis spontaneity (Figure 5c), remained positive (139 ± 11 kJ/mol) when α = 0.1–0.7, confirming non-spontaneous decomposition requiring continuous energy input. Its stability (±2% variation) indicated consistent thermodynamic driving forces across the stages. The heating-rate invariant values of ΔG confirmed its state–function behavior under non-isothermal conditions. Entropy change (∆S) remained positive across the decomposition (Figure 5d), reflecting increased disorder from volatile fragment generation. ΔS rose monotonically from α = 0.1 to 0.7, peaking when α = 0.7 due to maximal molecular diversity during terminal carbohydrate depolymerization.

3.7. Real-Time Volatile Evolution During Slow Pyrolysis

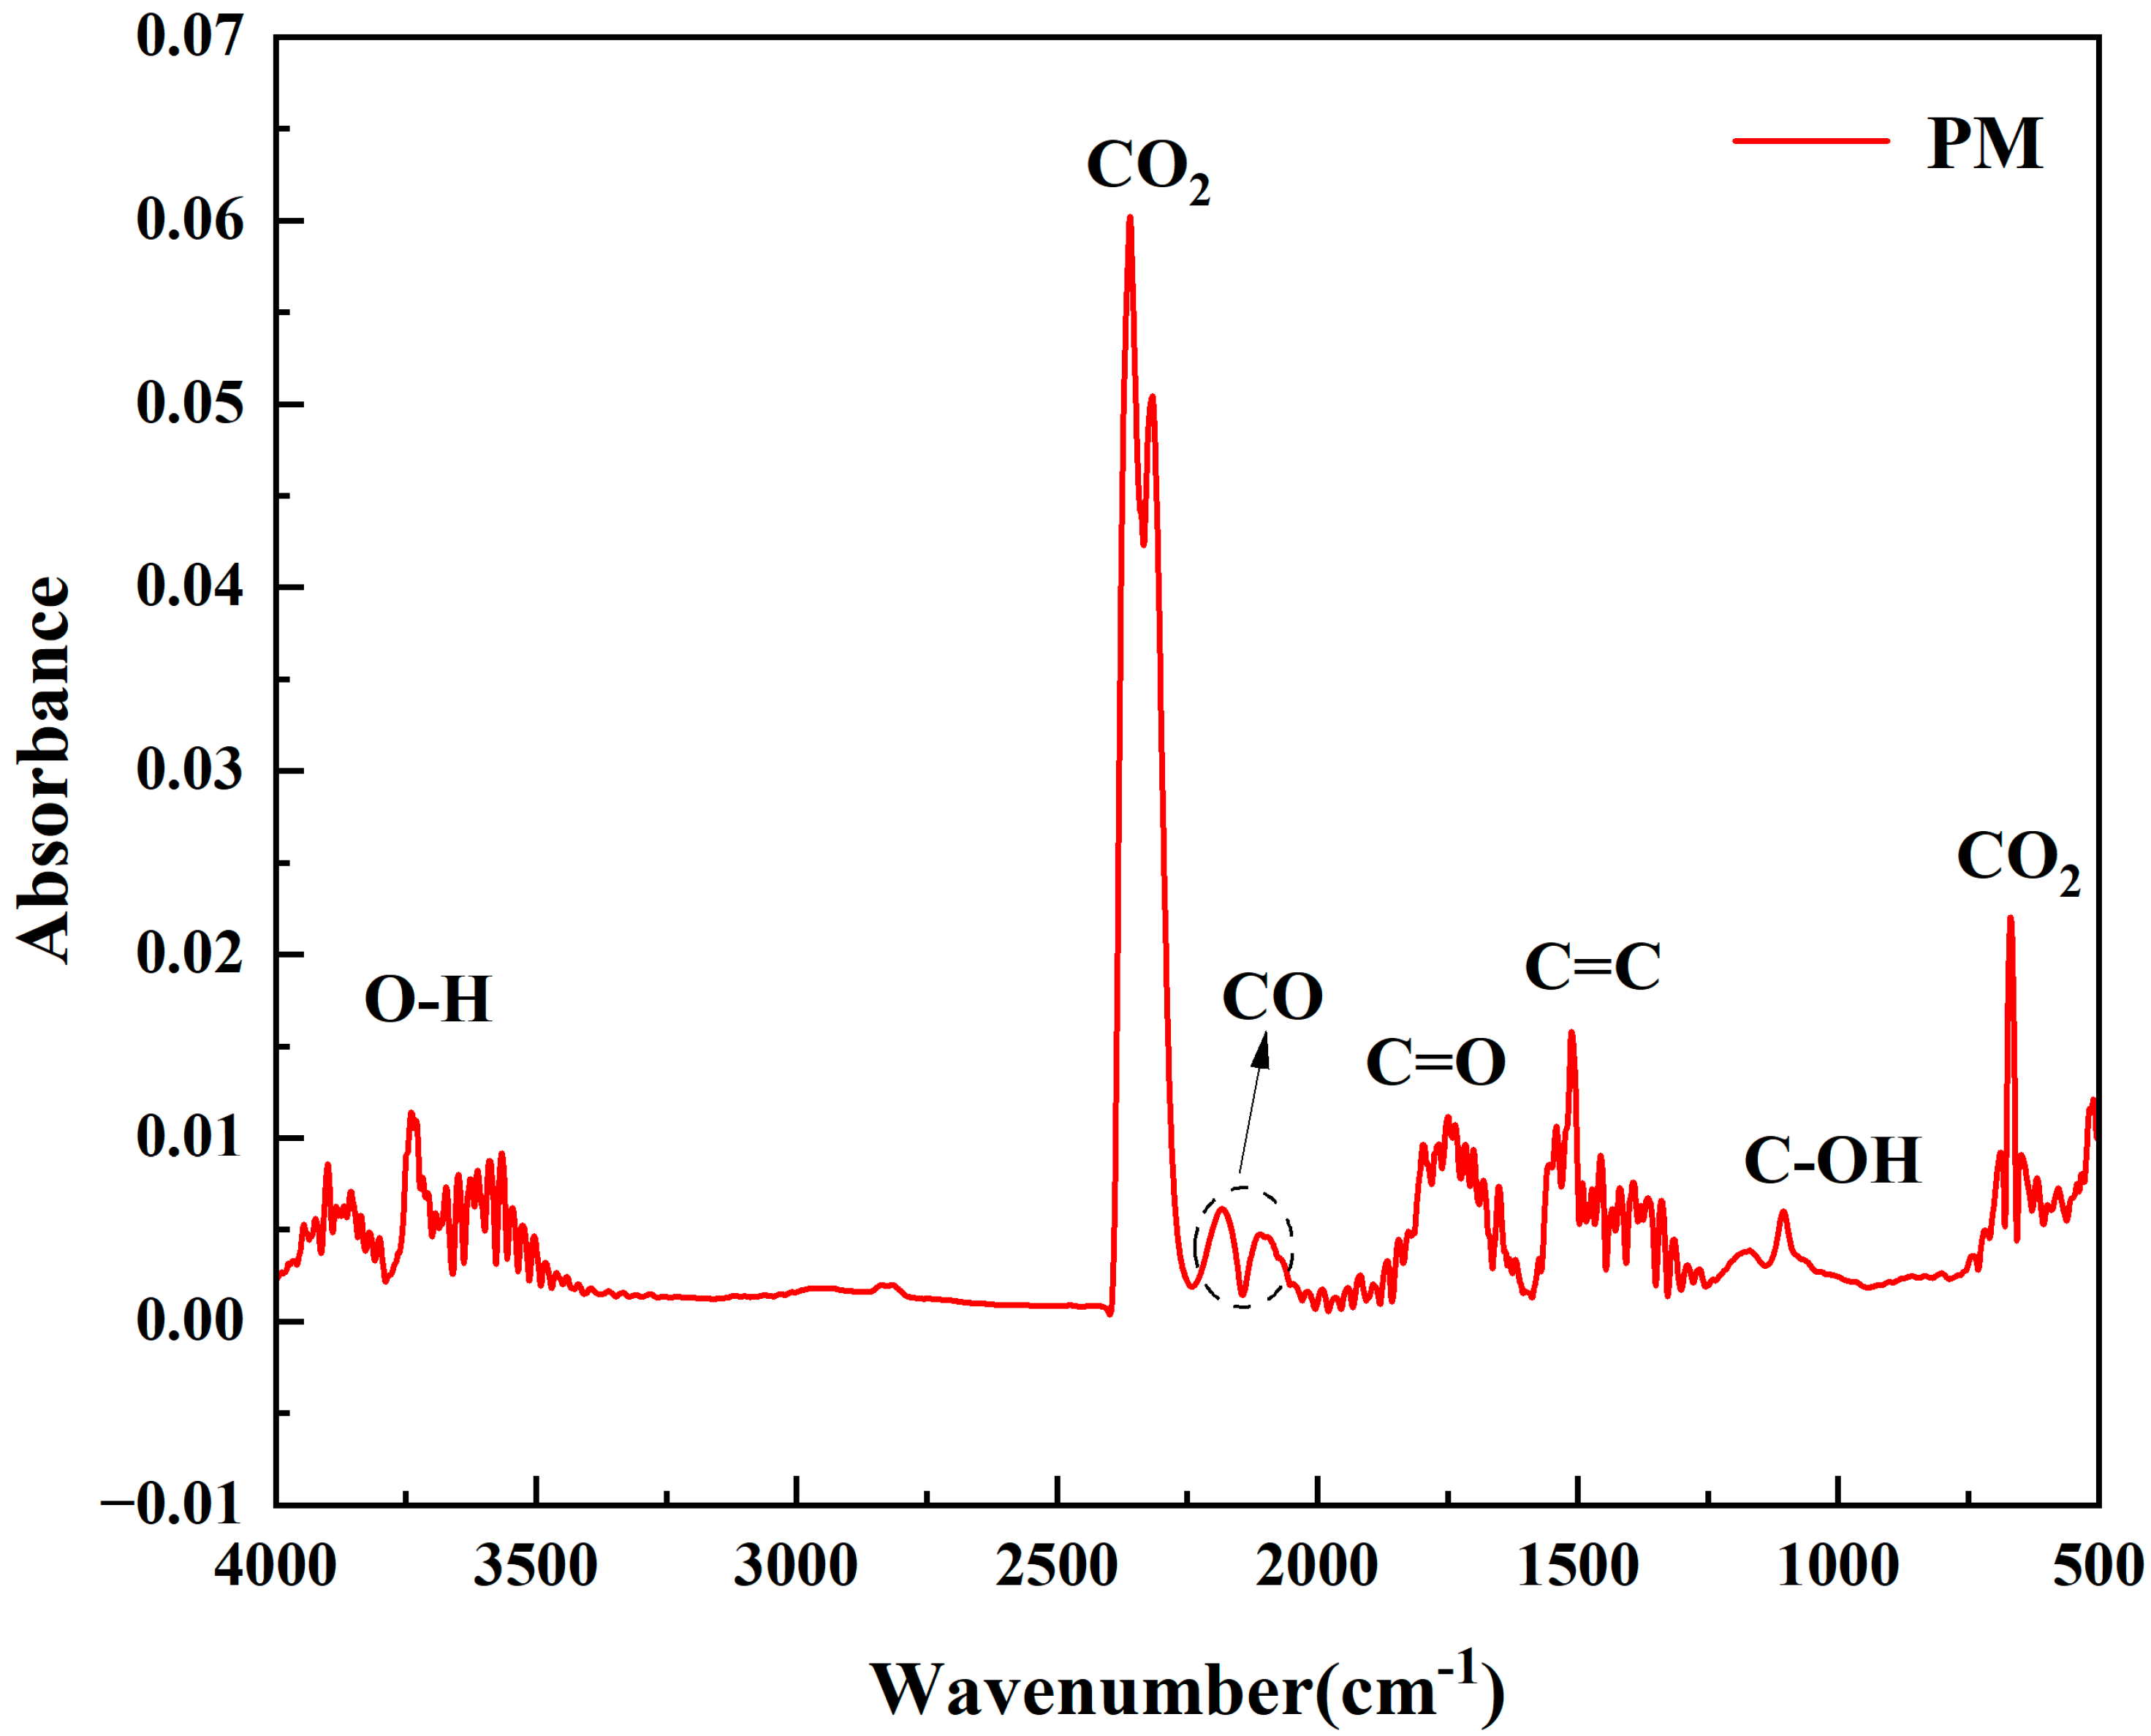
Functional group evolution and gaseous product composition during the PM slow pyrolysis were analyzed via coupled FTIR and GC/MS. Figure 6 shows the FTIR spectrum at the DTG peak temperature (302.0 °C, 20 °C/min), revealing characteristic functional groups of the pyrolysis products. Table 6 details (i) identified functional groups with vibrational modes and corresponding volatiles, and (ii) major pyrolysis compounds (GC/MS relative abundance > 1%) [33].
FTIR analysis of the PM pyrolysis products at 302 °C revealed key functional groups (Figure 6): O-H stretching (water release from mineral-bound/crystalline water and dehydration of oxygenated groups (180–530 °C)) between 4000 and 3500 cm−1; CO2 antisymmetric stretching (primary gas from decarboxylation of hemicellulose/cellulose acetyl/carboxyl groups) between 2400 and 2240 cm−1 + 670 cm−1; weak CO peak (carbonyl/ether bond degradation) between 2240 and 2020 cm−1; C=O stretching (aldehydes/ketones/acids; cellulose/hemicellulose markers [6]) between 1900 and 1650 cm−1; C=C aromatic vibration (phenolics; lignin pyrolysis signature) between 1650 and 1250 cm−1; and C-O/O-H stretching (alcohol formation) between 1250 and 1000 cm−1. GC/MS-identified high-value industrial precursors included benzene (C6H6) and 2,5-dimethylfuran (C6H8O) (Table 7). Products segregated into two classes: (1) Primary volatiles (174–680 °C): alcohols, aldehydes, phenols, toluene, and alkanes from direct hemicellulose/cellulose/lignin cracking. (2) Secondary gases (initiating at ≈300 °C and dominating > 680 °C): CO/CO2 from decarboxylation of primary aldehydes.

3.8. Fast-Pyrolysis Product Distribution

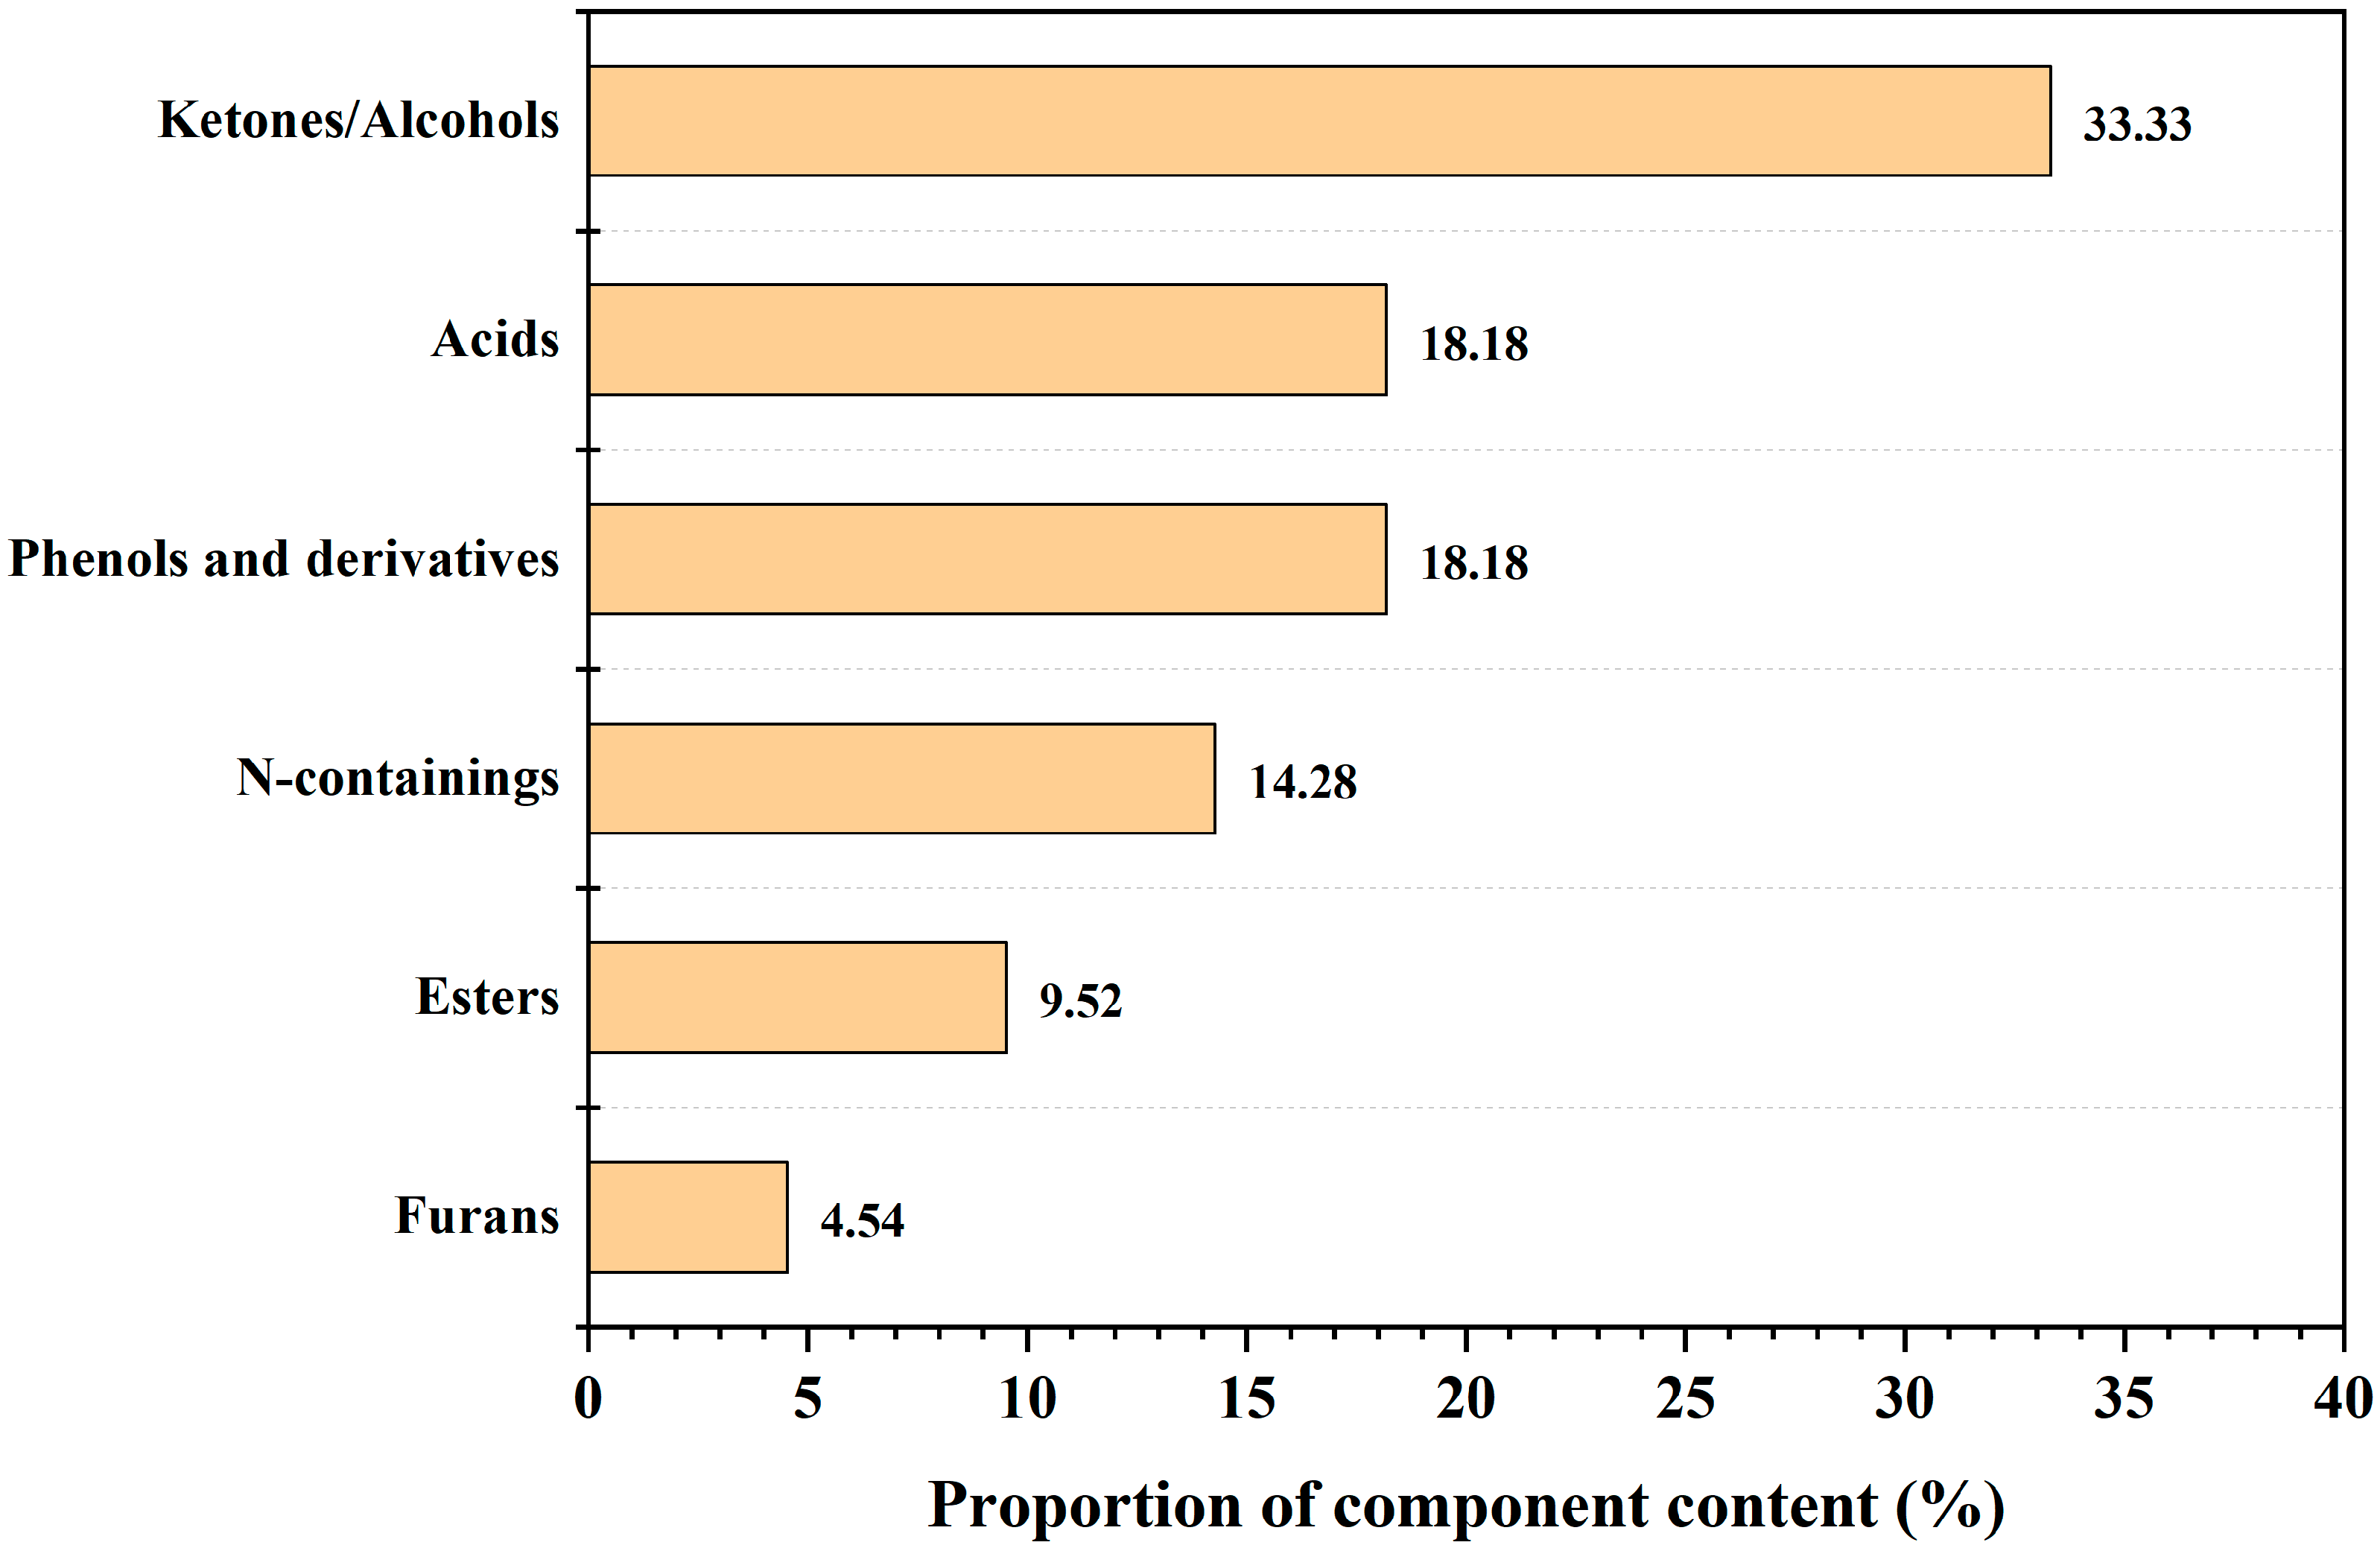
GC/MS analysis of the PM fast pyrolysis products at 600 °C (Table 8) identified 21 compounds (relative abundance > 1%) spanning 11 chemical classes. Ketones dominated (23.8%), followed by acids and phenolic derivatives (both 18.18%), N-containing compounds (14.28%), and furans (4.54%) (Figure 7). Product formation mechanisms reflected biopolymer decomposition pathways. Cellulose underwent β-1,4-glycosidic bond cleavage to yield platform compounds including D-glucan and 5-hydroxymethylfurfural (5-HMF) [26]. Hemicellulose depolymerization and dehydration generated furfural, furfuryl alcohol, and derivatives. These carbohydrate fractions collectively contributed alcohols, aldehydes/ketones, and organic acids. Lignin depolymerization primarily produced phenolic compounds (phenol, guaiacol, cresols, and catechol) and aromatic hydrocarbons.
The product spectrum and yield of PM residues demonstrated competitive advantages for valorization compared to other medicinal herb residues and dedicated energy crops. For instance, the yield of furfural from PM slow pyrolysis (19.68% relative abundance, Table 7) was notably higher than that of Salvia miltiorrhiza residues (approximately 10–15% under similar conditions) [7]. This highlights PM’s potential as a superior feedstock for producing this high-value chemical. Furthermore, the high abundance of phenolic compounds (18.18% in fast pyrolysis) was comparable to or exceeded that of many lignocellulosic energy crops, such as switchgrass (17.95%) [34]. High-value products included furfural, a platform chemical for resins and solvents [33], and hydroxyacetone, a demonstrated precursor for bio-based lactic acid synthesis [35]. Styrene and anthraquinone derivatives (notably 1,8-dihydroxy-3-methoxy-6-methylanthraquinone) were confirmed as PM-specific markers [36]. The presence of these specific compounds, particularly the anthraquinone derivatives, presents not only a challenge for downstream bio-oil fuel applications due to potential toxicity but also an opportunity for the recovery of high-value chemicals via an integrated biorefinery approach.

4. Conclusions

In the N2 atmosphere, the pyrolysis of root residues of PM proceeded through three stages: (1) dehydration below 174 °C involving moisture and light extractives release; (2) primary devolatilization (174–680 °C) accounting for 71.16 wt% mass loss through lignocellulose decomposition; and (3) carbonization above 680 °C characterized by char formation with minimal mass change. Kinetic and thermodynamic analyses revealed exceptional pyrolysis performance, evidenced by apparent activation energies ranging from 219.7 to 354.72 kJ/mol (average R2 > 0.994 across FWO/KAS/Starink), consistently low energy barriers (ΔHEα < 10 kJ/mol), and high reactivity (lnA = 46.17–70.12 s−1). Product distribution varied with pyrolysis regime: slow pyrolysis favored 3-methylfuran (C5H6O, 23.8%), while fast pyrolysis at 600 °C yielded phenol (C6H6O) and 2-furanmethanol (C5H6O2) as co-dominant products (18.18% each). These findings demonstrated PM’s dual-value potential through high bioenergy capacity (CPI = 123.76 × 10⁻⁵ at 40 °C/min; volatile matter 69.83 wt%) and recoverable chemicals. This work establishes an efficient pyrolytic pathway for PM residue valorization within a circular bioeconomy framework, thus reducing environmental impact while maximizing resource recovery.

Author Contributions

J.H.: software, validation, data curation, formal analysis, investigation, writing—original draft, and writing—review and editing. Y.C.: methodology, software, validation, data curation, formal analysis, writing—original draft, and writing—review and editing. X.C.: formal analysis, writing—original draft, and writing—review and editing. D.J.: formal analysis, writing—original draft, and writing—review and editing. F.E.: conceptualization, data curation—optimization and modeling, and writing—review and editing. J.L.: investigation, resources, formal analysis, writing—review and editing, project administration, and funding acquisition. All authors have read and agreed to the published version of the manuscript.

Funding

This research was funded by the Key Laboratory of Radioactive and Rare Scattered Minerals, Ministry of Natural Resources (2024-RRSM-02).

Data Availability Statement

The original contributions presented in this study are included in this article. Further inquiries can be directed to the corresponding author(s).

Acknowledgments

We are grateful to Yang at the Analysis and Testing Center of Guangdong University of Technology for her help with TG-FTIR-GC/MS analysis.

Conflicts of Interest

The authors declare no conflicts of interest. The funders had no role in the design of the study; in the collection, analyses, or interpretation of data; in the writing of the manuscript; or in the decision to publish the results.

References

  1. Müsellim, E.; Tahir, M.H.; Ahmad, M.S.; Ceylan, S. Thermokinetic and TG/DSC-FTIR study of pea waste biomass pyrolysis. Appl. Therm. Eng. 2018, 137, 54–61. [Google Scholar] [CrossRef]
  2. Mensah, P.; Yankson, E. Biomass energy as a catalyst for achieving global sustainability goals: Technological advancements and policy implications. Acad. Green Energy 2025, 2. [Google Scholar] [CrossRef]
  3. Konyannik, B.Y.; Lavie, J.D. Valorization techniques for biomass waste in energy Generation: A systematic review. Bioresour. Technol. 2025, 435, 132973. [Google Scholar] [CrossRef]
  4. Liuyang, Z.; Jishuo, L.; Kaili, X. Analysis of the pyrolysis and combustion behavior and product release characteristics of Chinese medicine residue under a nitrogen/oxygen atmosphere. Biomass Bioenergy 2025, 197, 107824. [Google Scholar] [CrossRef]
  5. Lin, L.; Ni, B.; Lin, H.; Zhang, M.; Li, X.; Yin, X.; Qu, C.; Ni, J. Traditional usages, botany, phytochemistry, pharmacology and toxicology of Polygonum multiflorum Thunb.: A review. J. Ethnopharmacol. 2015, 159, 158–183. [Google Scholar] [CrossRef] [PubMed]
  6. Cho, S.-H.; Lee, T.; Cha, H.; Chen, W.-H.; Tsang, Y.F.; Kwon, E.E. Production of combustible gas via incorporating CO2 to pyrolysis of medicinal herbal waste. Ind. Crops Prod. 2024, 219, 119110. [Google Scholar] [CrossRef]
  7. Chen, Y.; Liu, J.; Li, L.; Chen, X.; Lin, Z.; Yang, C.; Evrendilek, F.; Li, W.; Huang, W.; He, Y.; et al. Optimizing pyrolysis of herbal tea and Salvia miltiorrhiza residues for sustainable energy and product recovery. Chem. Eng. J. 2025, 513, 162694. [Google Scholar] [CrossRef]
  8. Chen, T.-Y.; Huang, T.-Y.; Chung, Y.-Y.; Lin, W.-C.; Lin, H.-Y.; Chiu, H.-C.; Lee, S.-Y. Exosomes derived from Polygonum multiflorum-treated human dental pulp stem cells (hDPSCs): New approach in regenerative medicine. J. Drug Deliv. Sci. Technol. 2024, 99, 105941. [Google Scholar] [CrossRef]
  9. Gong, L.; Shen, X.; Huang, N.; Wu, K.; Li, R.; Liu, Y.; Zhang, H.; Chen, S.; Sun, R. Research progress on hepatotoxicity mechanism of polygonum multiflorum and its main components. Toxicon 2024, 248, 108040. [Google Scholar] [CrossRef]
  10. Liu, D.; Ye, D.; Li, T.; Zheng, Z.; Zhang, X. Practicability of using Polygonum japonicum as a P accumulator for P phytoextraction from soil amended with swine manure. Appl. Soil Ecol. 2017, 112, 11–17. [Google Scholar] [CrossRef]
  11. Zhang, C.; Ma, J.; Wang, Y.; Hao, K. Microwave torrefaction of biomass waste: Fuel property evaluation and life cycle impact. Next Energy 2025, 9, 100380. [Google Scholar] [CrossRef]
  12. Maia, A.A.D.; de Morais, L.C. Kinetic parameters of red pepper waste as biomass to solid biofuel. Bioresour. Technol. 2016, 204, 157–163. [Google Scholar] [CrossRef] [PubMed]
  13. Abdalla, A.; Arudra, P.; Al-Khattaf, S.S. Catalytic cracking of 1-butene to propylene using modified H-ZSM-5 catalyst: A comparative study of surface modification and core-shell synthesis. Appl. Catal. A Gen. 2017, 533, 109–120. [Google Scholar] [CrossRef]
  14. Chandrasekaran, A.; Ramachandran, S.; Subbiah, S. Determination of kinetic parameters in the pyrolysis operation and thermal behavior of Prosopis juliflora using thermogravimetric analysis. Bioresour. Technol. 2017, 233, 413–422. [Google Scholar] [CrossRef]
  15. Carvalho, M.S.; Castro, J.D.S.; Camelo, E.R.; Sousa, H.O.; Oliveira, P.S.; Rodrigues, W.S.; Zhou, S.; Virgens, C.F. Impact of chemical treatment on the energy potential of Pachira aquatica A. fruit peel during pyrolysis. J. Anal. Appl. Pyrolysis 2025, 192, 107325. [Google Scholar] [CrossRef]
  16. Starink, M. The determination of activation energy from linear heating rate experiments: A comparison of the accuracy of isoconversion methods. Thermochim. Acta 2003, 404, 163–176. [Google Scholar] [CrossRef]
  17. Yu, Z.; Yang, P.; Fu, K.; Guo, W.; Li, H.; Hao, X.; Wang, J.; Yang, B.; Zhang, B.; Xie, T.; et al. Effect of reservoir moisture on underground in-situ pyrolysis of tar-rich coal: Experimental investigation and ReaxFF MD simulation. J. Anal. Appl. Pyrolysis 2025, 192, 107285. [Google Scholar] [CrossRef]
  18. Wu, F.; Huang, S.; Jiang, Q.; Jiang, G. Effects of pressure and heating rate on coal pyrolysis: A study in simulated underground coal gasification. J. Anal. Appl. Pyrolysis 2023, 175, 106179. [Google Scholar] [CrossRef]
  19. Rony, A.H.; Kong, L.; Lu, W.; Dejam, M.; Adidharma, H.; Gasem, K.A.M.; Zheng, Y.; Norton, U.; Fan, M. Kinetics, thermodynamics, and physical characterization of corn stover (Zea mays) for solar biomass pyrolysis potential analysis. Bioresour. Technol. 2019, 284, 466–473. [Google Scholar] [CrossRef]
  20. Guo, S.; Li, Y.; Tang, S.; Zhang, T. The nitrogen transformation behavior based on the pyrolysis products of wheat straw. Chin. J. Chem. Eng. 2024, 71, 58–65. [Google Scholar] [CrossRef]
  21. Li, S.; Hu, E.; Xu, G.; Liu, Z.; Zeng, Y.; Yu, J.; Zheng, G.; Pan, D.; Li, M.; Ma, Y. Rapid infrared co-pyrolysis performance of corn stover and polyurethane foam waste for upgrading oil yield and quality. Energy 2025, 333, 137258. [Google Scholar] [CrossRef]
  22. Bisen, D.; Lanjewar, R.; Alawa, B.; Chouhan, A.P.S.; Chakma, S. Kinetic analysis and fuel characterization with hydrocarbon distribution in pyro-oil produced from co-pyrolysis of rice husk and low-density polyethylene. J. Energy Inst. 2025, 121, 102175. [Google Scholar] [CrossRef]
  23. Hakeem, I.G.; Rathnayake, N.; Surapaneni, A.; Shah, K. Effects of mild acid pre-treatment on the co-pyrolysis behaviour of biosolids and wheat straw. Process Saf. Environ. Prot. 2024, 185, 375–391. [Google Scholar] [CrossRef]
  24. Gu, X.; Ma, X.; Li, L.; Liu, C.; Cheng, K.; Li, Z. Pyrolysis of poplar wood sawdust by TG-FTIR and Py–GC/MS. J. Anal. Appl. Pyrolysis 2013, 102, 16–23. [Google Scholar] [CrossRef]
  25. Hosoya, T.; Kawamoto, H.; Saka, S. Pyrolysis behaviors of wood and its constituent polymers at gasification temperature. J. Anal. Appl. Pyrolysis 2007, 78, 328–336. [Google Scholar] [CrossRef]
  26. Wang, S.; Dai, G.; Yang, H.; Luo, Z. Lignocellulosic biomass pyrolysis mechanism: A state-of-the-art review. Prog. Energy Combust. Sci. 2017, 62, 33–86. [Google Scholar] [CrossRef]
  27. Jia, D.; Liang, J.; Liu, J.; Chen, D.; Evrendilek, F.; Wen, T.; Cao, H.; Zhong, S.; Yang, Z.; He, Y. Insights into pyrolysis of ginger via TG-FTIR and Py-GC/MS analyses: Thermochemical behaviors, kinetics, evolved gas, and products. J. Anal. Appl. Pyrolysis 2024, 179, 106442. [Google Scholar] [CrossRef]
  28. Vyazovkin, S.; Burnham, A.K.; Criado, J.M.; Pérez-Maqueda, L.A.; Popescu, C.; Sbirrazzuoli, N. ICTAC Kinetics Committee recommendations for performing kinetic computations on thermal analysis data. Thermochim. Acta 2011, 520, 1–19. [Google Scholar] [CrossRef]
  29. Chen, Z.; Chen, H.; Wu, X.; Zhang, J.; Evrendilek, D.E.; Liu, J.; Liang, G.; Li, W. Temperature- and heating rate-dependent pyrolysis mechanisms and emissions of Chinese medicine residues and numerical reconstruction and optimization of their non-linear dynamics. Renew. Energy 2021, 164, 1408–1423. [Google Scholar] [CrossRef]
  30. Vuppaladadiyam, A.K.; Liu, H.; Zhao, M.; Soomro, A.F.; Memon, M.Z.; Dupont, V. Thermogravimetric and kinetic analysis to discern synergy during the co-pyrolysis of microalgae and swine manure digestate. Biotechnol. Biofuels 2019, 12, 170. [Google Scholar] [CrossRef] [PubMed]
  31. Boubacar Laougé, Z.; Merdun, H. Kinetic analysis of Pearl Millet (Penissetum glaucum (L.) R. Br.) under pyrolysis and combustion to investigate its bioenergy potential. Fuel 2020, 267, 117172. [Google Scholar] [CrossRef]
  32. Ahmad, M.S.; Mehmood, M.A.; Taqvi, S.T.H.; Elkamel, A.; Liu, C.-G.; Xu, J.; Rahimuddin, S.A.; Gull, M. Pyrolysis, kinetics analysis, thermodynamics parameters and reaction mechanism of Typha latifolia to evaluate its bioenergy potential. Bioresour. Technol. 2017, 245, 491–501. [Google Scholar] [CrossRef]
  33. Askari, F.; Abdulkhani, A.; Azadfallah, M.; Hamzeh, Y.; Ashori, A. Development and characterization of furfural-based bio-resins from lignocellulosic waste for eco-friendly wood resins. Int. J. Adhes. Adhes. 2025, 140, 104014. [Google Scholar] [CrossRef]
  34. Kumar Mishra, R. Pyrolysis of low-value waste switchgrass: Physicochemical characterization, kinetic investigation, and online characterization of hot pyrolysis vapours. Bioresour. Technol. 2022, 347, 126720. [Google Scholar] [CrossRef] [PubMed]
  35. Albuquerque, E.M.; Borges, L.E.P.; Fraga, M.A. Lactic acid production from aqueous-phase selective oxidation of hydroxyacetone. J. Mol. Catal. A Chem. 2015, 400, 64–70. [Google Scholar] [CrossRef]
  36. Li, H.-Y.; Yang, J.-B.; Li, W.-F.; Qiu, C.-X.; Hu, G.; Wang, S.-T.; Song, Y.-F.; Gao, H.-Y.; Liu, Y.; Wang, Q.; et al. In vivo hepatotoxicity screening of different extracts, components, and constituents of Polygoni Multiflori Thunb. in zebrafish (Danio rerio) larvae. Biomed. Pharmacother. 2020, 131, 110524. [Google Scholar] [CrossRef]
Figure 1. The (a) TG and (b) DTG curves of the PM pyrolysis at 10, 20, and 40 °C/min.
Processes 13 02701 g001
Figure 2. Stage-specific mass loss distributions of the PM pyrolysis at 10, 20, and 40 °C/min.
Processes 13 02701 g002
Figure 3. Variation in apparent activation energy (Eα) with conversion degree (α) for the PM pyrolysis at 20 °C/min determined by the FWO, KAS, and Starink methods.
Processes 13 02701 g003
Figure 4. (a) Normalized master plots (P(u)/P(u0.5) vs. α) and (b) experimental vs. theoretical reaction models for mechanism identification for the PM pyrolysis at 10, 20, and 40 °C/min.
Processes 13 02701 g004
Figure 5. Evolution of the four thermodynamic parameters during the PM pyrolysis: (a) lnA; (b) ΔH; (c) ΔG; and (d) ΔS as a function of conversion degree (α) and heating rate (β).
Processes 13 02701 g005
Figure 6. FTIR spectrum of volatile products from the PM slow pyrolysis at 302.0 °C.
Processes 13 02701 g006
Figure 7. Relative abundance of chemical classes in the fast pyrolysis products of PM at 600 °C.
Processes 13 02701 g007
Table 1. Isoconversional kinetic models for solid-state decomposition, including reaction mechanisms and f(α) (differential) and G(α) (integral) functions.
SymbolMechanismf(a)G(a)
Diffusion
D1One-dimension diffusion1/(2a)a2
D2Two-dimension diffusion[−ln(1 − a)]−1(1 − a)ln(1 − a) + a
D3Three-dimension diffusion[(3/2)(1 − a)2/3]/[1−(1 − a)1/3][1 − (1 − a)1/3]2
D4Four-dimension diffusion[(3/2)(1 − a)1/3]/[1 − (1 − a)1/3](1 − 2a/3)−(1 − a)2/3
Geometrical contraction
R2Contracting cylinder2(1 − a)1/21−(1 − a)1/2
R3Contracting sphere3(1 − a)1/31−(1 − a)1/3
Reaction order
F1First-order reaction1 − a−ln(1 − a)
F2Second-order reaction(1 − a)2(1 − a)−1 − 1
F3Third-order reaction(1 − a)3[(1 − a)−2 − 1]/2
Fnnth-order reaction(1 − a)n[(1 − a)(1−n) − 1]/(n − 1)
Power law
P2One-power law2a1/2a1/2
P3Two-power law3a1/3a1/3
P4Three-power law4a1/4a1/4
Nucleation
A1.5Avrami–Erofeev1.5(1 − a)[−ln(1 − a)]1/3[−ln(1 − a)]2/3
A2Avrami–Erofeev2(1 − a)[−ln(1 − a)]1/2[−ln(1 − a)]1/2
A3Avrami–Erofeev3(1 − a)[−ln(1 − a)]2/3[−ln(1 − a)]1/3
AnAvrami–Erofeevn(1 − a)[−ln(1 − a)](n−1)/n[−ln(1 − a)]1/n
Table 2. Physicochemical fuel properties of Polygonum multiflorum residues on an air-dried basis.
SampleProximate Analysis (wt%)Ultimate Analysis (wt%)HHV
MVAshFCCHNOS(MJ/kg)
PM4.1069.835.2620.8143.106.070.9144.630.0316.69
O (wt%) = 100 − C − H − N − S − M − Ash; M, V, Ash, FC, and HHV refer to moisture, volatile matter, ash content, fixed carbon, and high calorific value, respectively.
Table 3. Pyrolysis characteristic parameters of PM at the three heating rates.
β
(°C/min)
Ti
(°C)
Tp
(°C)
−Rp
(%/min)
−Rm
(%/min)
Re
(%)
CPI
(10−5·%3·min−2·°C−3)
10254.0291.86.950.7924.369.72
20263.9302.013.311.5823.8931.9
40270.0311.827.143.2622.27124
Table 4. Apparent activation energies (Eα) for the PM pyrolysis determined by the FWO, KAS, and Starink methods.
α FWOKASStarink
E α ( k J / m o l ) R 2 E α ( k J / m o l ) R 2 E α ( k J / m o l ) R 2
0.10234.380.999237.870.999238.030.999
0.15236.990.997240.360.997240.520.997
0.20234.070.998237.120.998237.290.998
0.25229.410.999232.090.999232.270.999
0.30222.600.999224.810.999225.010.999
0.35219.930.999221.920.999222.120.999
0.40219.840.999221.740.999221.950.999
0.45219.700.999221.510.999221.720.999
0.50223.670.999225.600.999225.810.999
0.55232.290.999234.570.999234.770.999
0.60249.890.999252.970.999253.170.999
0.65286.160.997290.980.997291.150.997
0.70354.720.994362.910.994363.030.994
Average243.36246.50246.68
Table 5. Thermodynamic parameters of the PM pyrolysis at 20 °C/min when α = 0.1–0.7.
αEaA
(s−1)
ΔH
(kJ/mol)
ΔG
(kJ/mol)
ΔS
(kJ/mol)
0.1234.385.52 × 1023230.04127.280.20
0.15236.992.04 × 1023232.52131.350.19
0.2234.073.77 × 1022229.51134.180.17
0.25229.416.38 × 1021224.79136.370.16
0.3222.608.08 × 1020217.92138.220.14
0.35219.932.78 × 1020215.21139.790.13
0.4219.841.76 × 1020215.08141.210.13
0.45219.701.12 × 1020214.89142.570.13
0.5223.671.69 × 1020218.82143.890.13
0.55232.296.37 × 1020227.39145.280.14
0.6249.891.37 × 1022244.94146.740.16
0.65286.161.04 × 1025281.13148.340.22
0.7354.722.80 × 1030349.60150.350.32
Table 6. Assignment of FTIR absorption bands for volatile products from the PM Slow pyrolysis at 302 °C.
Wavenumber
(cm−1)
Functional GroupPossible Compounds
4000–3500O-HWater, alcohols, and carboxylic acids
2400–2240C=OCO2
2240–2020C-OCO
1900–1650C=OAldehydes, ketones, acids
1650–1250C=C, benzene skeletonAromatics
1250–1000C-O,O-HEthers, alcohols
750–500C=OCO2
Table 7. Major volatile compounds identified by GC/MS during the slow pyrolysis of PM at 302.0 °C.
NoRTArea
(%)
SubstanceFormulaMWClass
12.7152.43-methyl-FuranC5H6O82Furan
23.4317.23BenzeneC6H678Benzene
37.8219.68FurfuralC5H4O296Aldehyde
49.095.024-[[(4-methylphenyl)sulfonyl]oxy]-CyclohexanoneC13H16O4S268Ketones
59.711.322-(9,12-octadecadienyloxy)-, (Z,Z)-EthanolC20H38O2310Alcohol
622.920.813-ethyl-5-(2-ethylbutyl)-OctadecaneC26H54366Hydrocarbons
723.830.86Methyl glycocholate, 3TMS derivativeC36H69NO6Si3695Ester
824.10.863-Desoxo-3,16-dihydroxy-12-desoxyphorbol 3,13,16,20-tetraacetateC28H38O10534Ester
924.120.85Withaferin AC28H38O6470Withaferin
1025.491.17Oleic acid, 3-(octadecyloxy)propyl esterC39H76O3592Ester
1126.880.493-acetoxy-7,8-Epoxylanostan-11-olC32H54O4502Alcohol
Table 8. Major products identified by Py-GC/MS during the fast pyrolysis of PM at 600 °C.
NoRTArea
(%)
SubstanceFormulaMWClass
11.495.54Carbamic acid, monoammonium saltCH6N2O278Carbamates
21.971.17Ethenyl esterC4H6O286Ester
32.022.223-Cyclopentene-1,2-diol, cis-C5H8O2100Alcohols
42.269.22Acetic acidC2H4O260Acids
52.4812.32-Propanone, 1-hydroxy-C3H6O274Ketones
62.652.31Furan, 2,5-dimethyl-C6H8O96Furan
73.281.29Hydrazinecarboxylic acid, phenylmethyl esterC8H10N2O2166Ester
83.563.053-Amino-2-oxazolidinoneC3H6N2O2102Ketones
94.449.492-FuranmethanolC5H6O298Alcohols
105.611.692-Cyclopenten-1-one, 2-hydroxy-C5H6O298Ketones
115.973.582-Furancarboxaldehyde, 5-methyl-C6H6O2110Aldehyde
126.3612.81PhenolC6H6O94Phenol
137.137.333-methyl-1,2-CyclopentanedioneC6H8O2112Ketones
147.494.0o-CresolC7H8O108Phenol
157.847.35p-CresolC7H8O108Phenol
168.490.413-ethyl-2-hydroxy-2-Cyclopenten-1-oneC7H10O2126Ketones
179.661.93Dodecanoic acid, 3-hydroxy-C12H24O3216Acids
189.880.94CatecholC6H6O2110Phenol
1918.86.41n-Hexadecanoic acidC16H32O2256Acids
2020.492.77Oleic acidC18H34O2282Acids
2124.784.209,10-Anthracenedione, 1,8-dihydroxy-3-methoxy-6-methyl-C16H12O5284Anthraquinone
Disclaimer/Publisher’s Note: The statements, opinions and data contained in all publications are solely those of the individual author(s) and contributor(s) and not of MDPI and/or the editor(s). MDPI and/or the editor(s) disclaim responsibility for any injury to people or property resulting from any ideas, methods, instructions or products referred to in the content.