Article

Shear-Induced Degradation and Rheological Behavior of Polymer-Flooding Waste Liquids: Experimental and Numerical Analysis

1
School of Mechanical Engineering, China University of Petroleum (East China), Qingdao 266580, China
2
Research Institute of Petroleum Engineering Technology, Shengli Oilfield, Dongying 257000, China
3
Petroleum Industry Training Center, China University of Petroleum, Qingdao 266580, China
4
CNOOC Research Institute, Beijing 100028, China
*
Author to whom correspondence should be addressed.
Processes 2025, 13(9), 2677; https://doi.org/10.3390/pr13092677
Submission received: 24 July 2025 / Revised: 18 August 2025 / Accepted: 19 August 2025 / Published: 22 August 2025

Abstract

Polymer flooding is an enhanced oil recovery (EOR) technique that improves oil extraction by injecting polymer solutions into reservoirs. However, the disposal and treatment of polymer flooding waste liquids (PFWL) present significant challenges due to their high viscosity, complex molecular structure, and environmental impact. This study investigates the shear-induced degradation of polymer solutions, focusing on rheological properties, particle size distribution, and morphological changes under controlled shear conditions. Experimental results show that shear forces significantly reduce the viscosity of polymer solutions, with shear rates of 4285.36 s−1 in the rotating domain and 3505.21 s−1 in the fixed domain. The particle size analysis reveals a significant reduction in average particle size, indicating polymer aggregate breakup. SEM images confirm these morphological changes. Additionally, numerical simulations using a power-law model highlight the correlation between shear rate, wall shear stress, and polymer degradation efficiency. This study suggests that optimizing rotor–stator configurations with high shear forces is essential for efficient polymer degradation, offering insights for designing more effective polymer waste liquid treatment systems in oilfields.

1. Introduction

Polymer flooding is a widely adopted enhanced oil recovery (EOR) technique that significantly improves oil production efficiency by injecting high molecular weight polymers [1,2,3,4], such as partially hydrolyzed polyacrylamide (HPAM), into reservoirs to increase the viscosity of the displacing fluid and improve sweep efficiency [5,6,7]. However, the large-scale application of polymer flooding generates substantial volumes of polymer flooding waste liquids (PFWL), which present considerable challenges for disposal and environmental management due to their high viscosity, complex molecular structure, and environmental risks. If not properly managed, PFWL can cause reservoir plugging, operational inefficiencies, and environmental contamination [7,8,9,10].
In recent years, many researchers have focused on studying polymer flooding waste liquids and their treatment methods. Scott et al. highlighted that the high viscosity and susceptibility of HPAM to shear, thermal, and chemical degradation are central obstacles in PFWL treatment [11]. Xin et al. demonstrated through physical experiments and numerical simulations that HPAM solution viscosity decreases with increasing shear rate and time, exhibiting exponential decay due to polymer degradation, which negatively impacts EOR efficiency [12,13]. Yang et al. constructed a near-wellbore shear device and found that high shear rates disrupt both intra- and inter-molecular polymer structures, leading to significant viscosity reduction [14]. Al-Shakry et al. investigated mechanical degradation in porous media and observed that both molecular weight and distribution are altered by shear, affecting flow rheology and injectivity [15,16]. Jiao et al. further reported that shear-induced degradation is largely irreversible, resulting in diminished rheological and adsorption properties, though flow resistance during porous media seepage can be enhanced [17].
To address the high viscosity of PFWL, various degradation methods have been explored, including thermal, chemical, ultrasonic, and mechanical shear treatments [18,19,20]. Rambeau et al. compared these approaches and found mechanical shear to be particularly effective for viscosity and molecular weight reduction, with practical advantages for field application [18]. Cao et al. showed that tighter pore structures exacerbate shear degradation, leading to irreversible polymer chain scission [21]. Chen et al. and Peng et al. investigated chemical and sub-/supercritical water degradation, respectively, both achieving high degradation rates and resource recovery from polymer-containing waste [19,22].
Additionally, numerical simulations using computational fluid dynamics (CFD) have enabled detailed analysis of shear fields and tool optimization for PFWL treatment. Herrera et al. used CFD to model HPAM degradation in turbulent flow, revealing the relationship between flow velocity, pressure gradients, and degradation extent [5]. Sun et al. applied numerical simulation to optimize grinding tool structures, enhancing erosion resistance and operational lifespan during PFWL treatment [23]. Díaz et al. developed a shear degradation model for HPAM solutions, providing a theoretical basis for regulator valve design in polymer flooding operations [24].
The impact of polymer degradation extends beyond waste management, directly influencing the economic and environmental sustainability of EOR projects. Ghosh et al. demonstrated that reinjecting sheared polymer can reduce fresh polymer demand by 10–15%, lowering operational costs and carbon footprints without compromising oil recovery [25]. Kumar et al. showed that nanohybrid additives can enhance HPAM’s resistance to mechanical and thermal degradation, improving rheological properties and recovery factors [26]. Liu et al. introduced microencapsulated polymers, which exhibit superior shear resistance and injectivity, offering a promising solution for future EOR applications [27].
In summary, efficient treatment of PFWL requires a comprehensive understanding of shear-induced degradation mechanisms and the optimization of both experimental and simulation-based methods [28,29,30,31,32,33]. While the shear-thinning behavior of semi-dilute polymer solutions is a well-established and widely documented phenomenon, the present study does not aim to revalidate this behavior. Instead, it focuses on investigating how the localized shear stress distributions within the tool—particularly at the rotor–stator interfaces—influence the degradation of polymer solutions and their rheological properties. Our approach emphasizes the correlation between microscale flow field heterogeneity and degradation efficiency, an aspect that has not been sufficiently addressed in the existing literature. This study aims to systematically investigate the effects of shear stress on the rheological and microstructural evolution of PFWL, combining experimental data with advanced numerical simulations to provide a theoretical basis for effective polymer waste liquid treatment. Specifically, the focus is on how shear affects the viscosity, particle size, and polymer structure of the waste liquid, and how these changes can be optimized through tool design to improve waste management efficiency. Furthermore, by integrating experimental data with numerical modeling, this research will analyze the flow field characteristics within shear tools, studying the interaction between the rotor and stator, the distribution of shear stress, and the velocity gradients in the flow field. The goal is to optimize the design of shear tools to ensure uniform shear action and effective waste liquid treatment. Through these studies, we aim to provide new insights for the efficient design of polymer waste liquid treatment tools and offer valuable guidance for practical applications.

2. Materials and Methods

2.1. Materials

Polymer flooding waste liquid (PFWL) represents a high-viscosity fluid with complex rheological properties, primarily consisting of partially hydrolyzed polyacrylamide (HPAM). This oilfield waste exhibits significant shear-thinning behavior, with apparent viscosity following characteristic power-law fluid dynamics in response to shear rate variations. PFWL shows particular sensitivity to environmental factors including mechanical shear, temperature fluctuations, and chemical exposure, all of which can induce polymer chain scission. Additionally, its composition extends beyond polymeric components to incorporate residual crude oil, formation particulates, and various injected chemicals from the flooding process.
To establish a controllable experimental system while preserving representative rheological behavior, a simulated polymer solution is prepared. The preparation process follows a standardized protocol to ensure homogeneity and stability of the solution: (1) a defined volume of deionized water is added to a beaker, and mechanical stirring is initiated; (2) a measured amount of HPAM powder is gradually added to the water to prevent clumping or agglomeration, followed by continuous stirring for more than 2 h to ensure complete dissolution; and (3) the solution is then allowed to stand for 24 h to complete the aging process, enabling full extension of polymer chains and achieving a stable state.
To investigate the influence of polymer concentration on rheological properties and shear-induced degradation, three simulated solutions with different mass concentrations are prepared, as illustrated in Figure 1, Figure 2 and Figure 3: low (0.25%), medium (0.5%), and high (0.75%) concentrations. Rheological tests show that the simulated solutions exhibit flow behavior highly consistent with that of actual polymer flooding waste liquid (PFWL) samples within a shear rate range of 1–1000 s−1. Figure 1 and Table 1 compares the rheological properties between actual PFWL and the 0.5% simulated solution, showing relative errors below 8% for all parameters. This level of agreement indicates the simulated solution effectively captures the essential rheological behavior of PFWL. While field-collected PFWL contains additional components (e.g., residual oil, solids), these primarily affect absolute viscosity values rather than the fundamental shear-thinning and degradation mechanisms under study [11,15].

2.2. Experimental Setup

Shear Experiment for Polymer Solutions
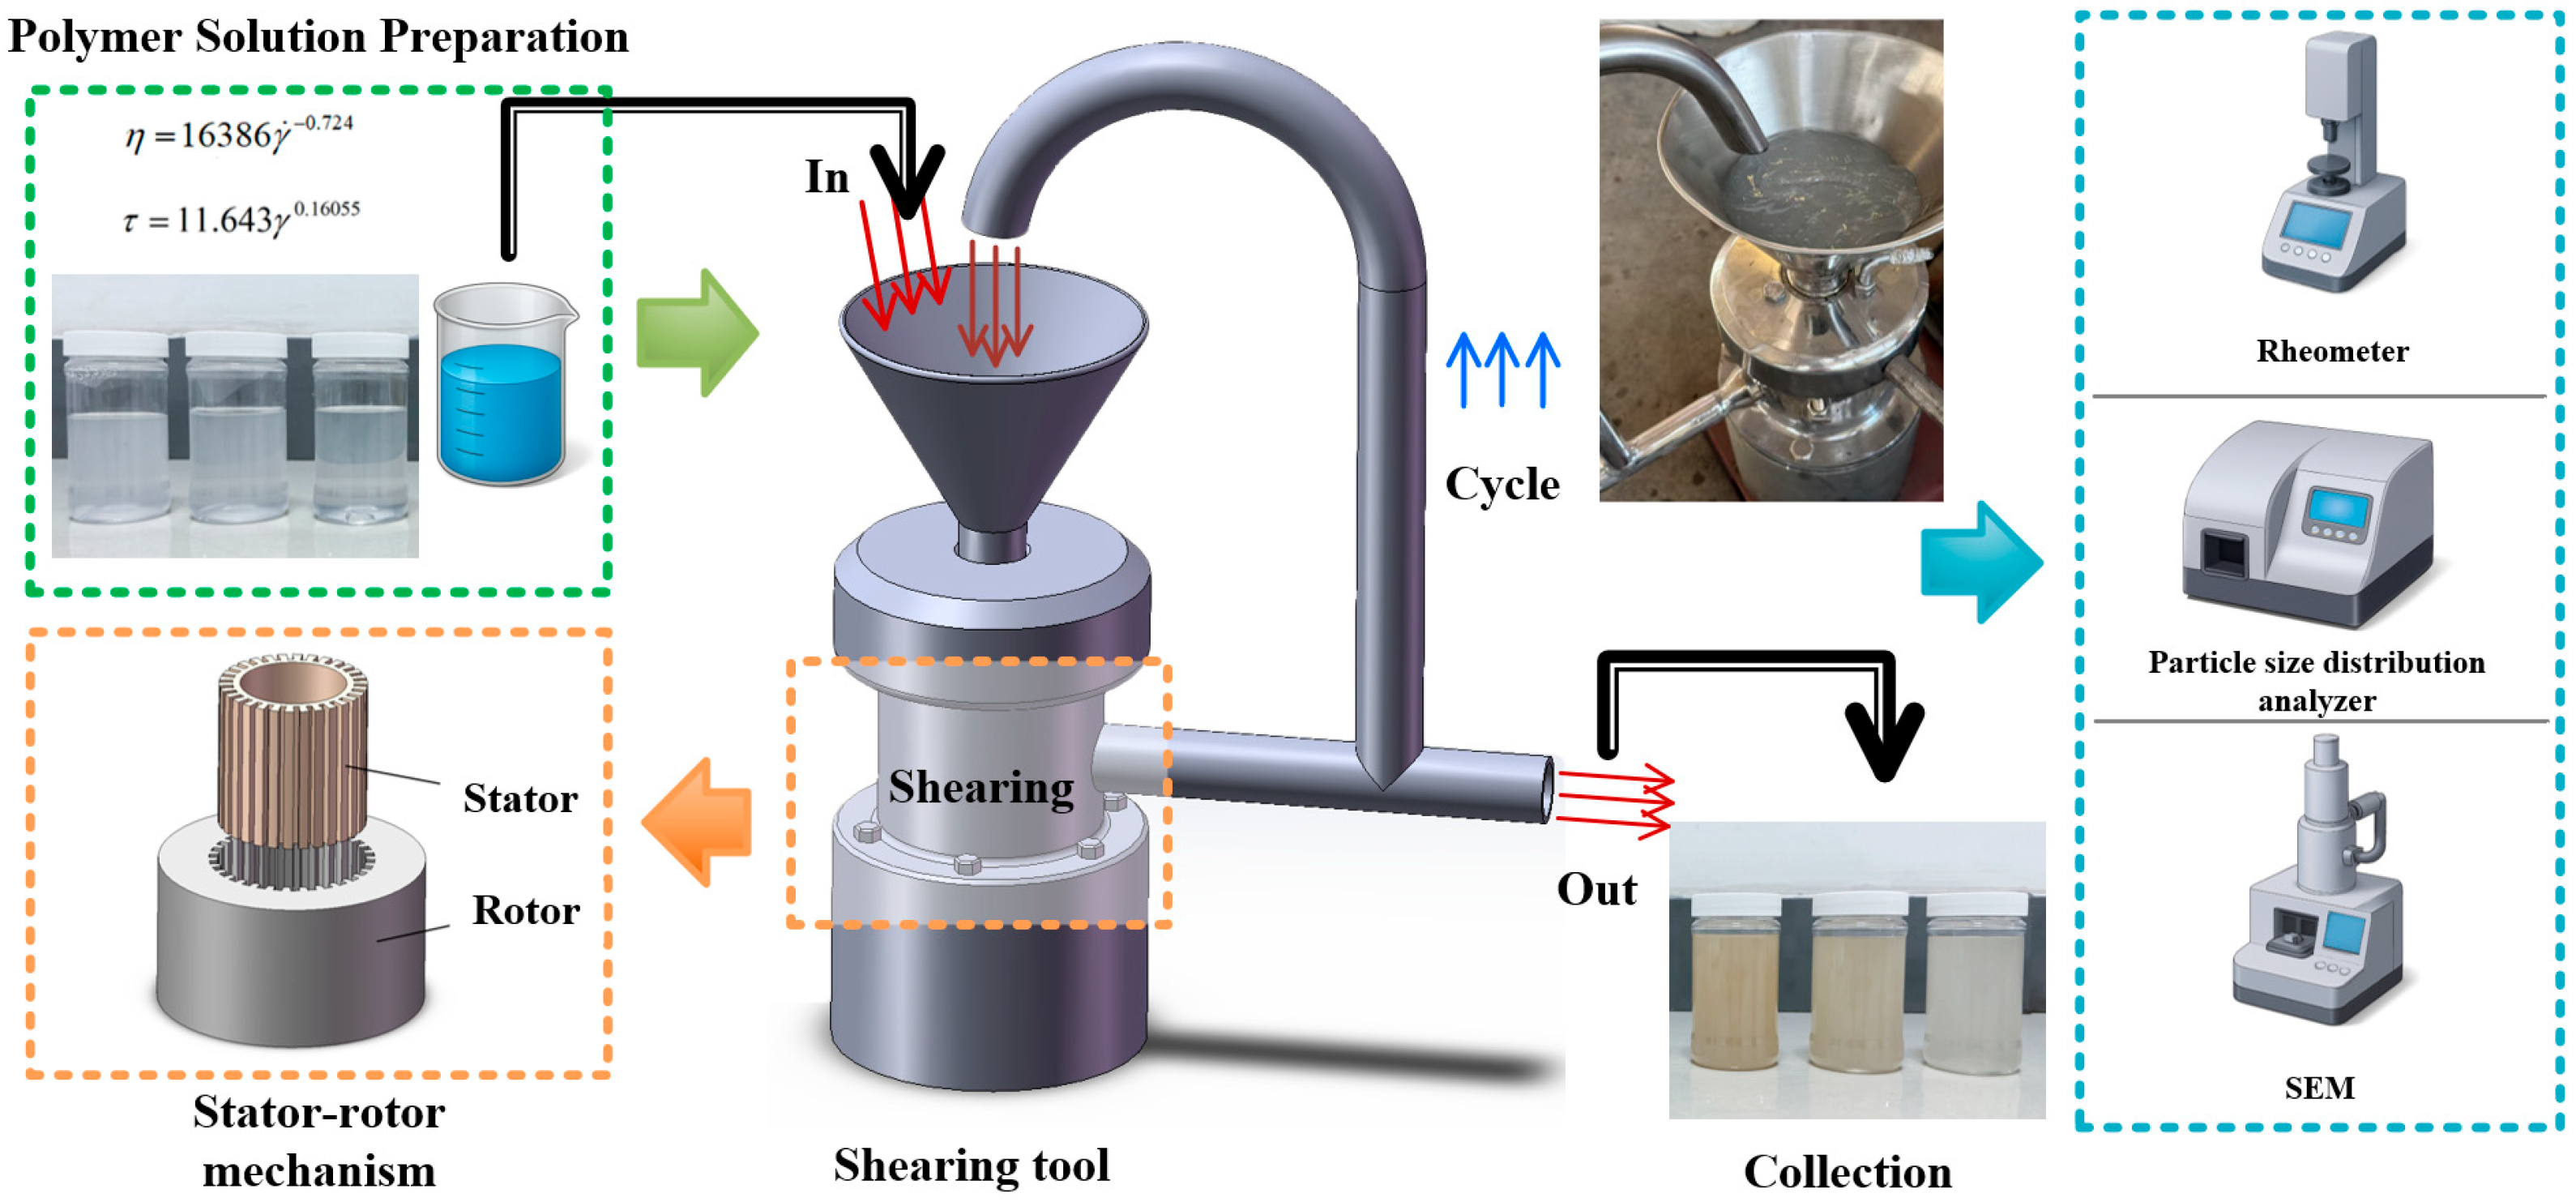
As shown in Figure 2, a rotor–stator shear device is used to shear the polymer solutions, with precise control of the shear conditions to achieve uniform treatment of the polymer solutions. The operating parameters of the device are set as follows: the rotor speed was fixed at 1450 RPM, corresponding to an angular velocity of 151.8 rad/s. The experiment followed a staged shear scheme:
  • Initial Stage (0–3 min): Open-loop shear mode, where the solution passed through the shear zone multiple times for effective treatment.
  • Stable Stage (3–20 min): Closed-loop shear mode to establish a stable flow field, maintained for 20 min to ensure shear equilibrium.
Rheological Testing of Polymer Flooding Systems
The rheological properties of the polymer flooding wastewater and simulated polymer solutions are evaluated using an Anton Paar MCR301 (Graz, Austria),rotational rheometer equipped with a cone-plate geometry. The shear rate is varied from 0.1 s−1 to 200 s−1 to characterize the non-Newtonian flow behavior of the fluids during shear. Viscosity and shear stress are recorded as functions of shear rate to compare the rheological performance of the polymer flooding waste liquid and the simulated polymer systems.
To assess the effect of shear treatment, the viscosity of the polymer solutions before and after shearing is measured under a constant shear rate. The relative viscosity reduction is calculated to quantify the degree of viscosity loss caused by shear.
In addition, the rheological behavior of the simulated polymer solution is investigated at various temperatures ranging from 25 °C to 65 °C. This analysis helps to examine the temperature dependence, non-Newtonian characteristics, and shear-thinning behavior of the polymer system under thermal variation.
Particle Size Distribution Testing of Polymer Flooding Systems
The particle size distribution of the polymer flooding simulation liquids before and after shear treatment is measured using a dynamic light scattering (DLS) particle size analyzer (Malvern Zetasizer Advance series, Malvern Panalytical, Great Malvern, UK). DLS results are used to qualitatively assess changes in the apparent size of molecular aggregates and network structures. Given the semi-dilute nature of the polymer solution and the potential interference of intermolecular interactions, the data are not used to infer absolute polymer chain lengths but rather to compare relative trends before and after shear treatment.
Morphological Characterization of Polymer Flooding Systems
The morphology of the polymer simulation liquid before and after shear treatment is observed using a scanning electron microscope (SEM). To preserve the structural integrity, the sample is prepared using a freeze-drying method. A small amount of the polymer solution is dropped onto a glass slide and frozen in liquid nitrogen for 30 min. The frozen sample is then transferred to a freeze-dryer for sublimation drying over a period of 48 h. After drying, the sample is metal-coated and examined under the SEM to analyze the morphological changes in the polymer solution induced by shear treatment.

2.3. Numerical Simulation Model Establishment

The numerical investigation employs a combined 3D model of the shear tool’s flow field and a complementary 2D cross-sectional model to analyze the interaction between rotating and fixed domains, as illustrated in Figure 3. The simulation parameters, summarized in Table 2, precisely match experimental conditions: a rotor speed of 151.8 rad/s, an inlet flow rate of 1.667 × 10⁻⁴ kg/s, and polymer solution properties including a density of 1031 kg/m3. The rheological behavior is characterized using a power-law model with parameters K = 16,386 Pa·s and n = 0.276, which are determined through rotational rheometer measurements across the relevant shear rate range (1–1000 s−1). These values are obtained by fitting the experimental flow curve data to the power-law equation τ = Kγ γ ˙ n−1, where τ represents shear stress and γ γ ˙ denotes shear rate. Boundary conditions are implemented with no-slip walls, a defined velocity inlet matching the experimental flow rate, and a pressure outlet. For turbulence modeling, the k-ω SST formulation is selected based on its established accuracy for rotating flow systems [23]. The power-law model proves particularly suitable for this analysis as it accurately captures the experimentally confirmed shear-thinning behavior (n < 1), maintains mathematical tractability in complex geometries, and has demonstrated effectiveness in comparable polymer systems [12,25].
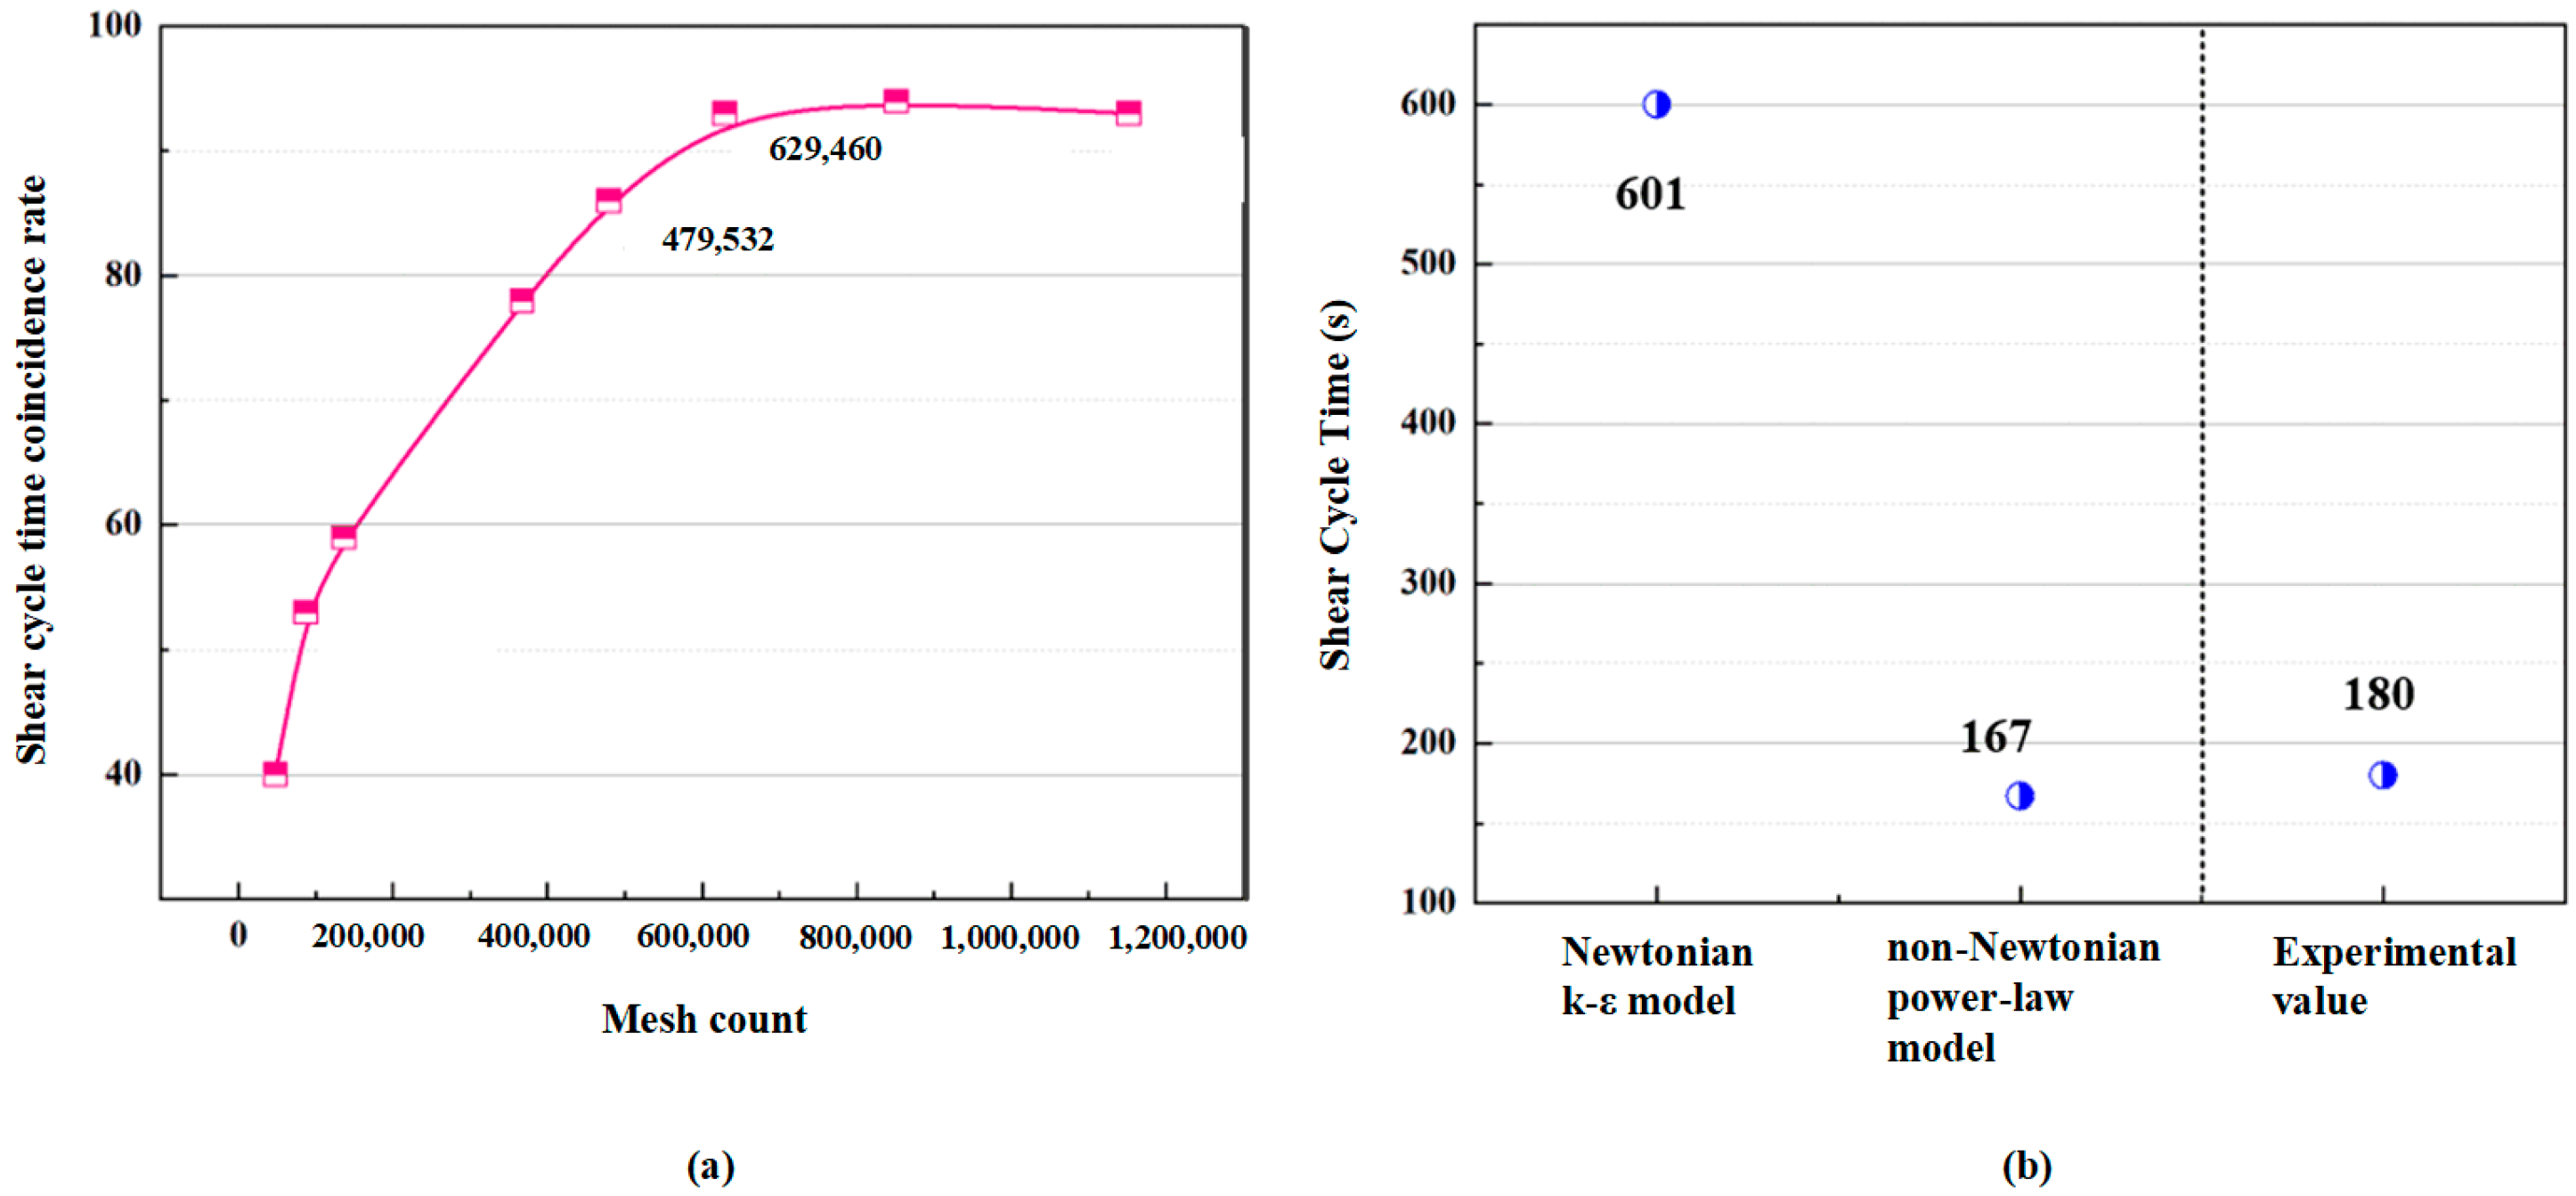
The numerical model is verified through comparison with experimental data and established models. As shown in Figure 4, the shear cycle time coincidence rate is plotted against the mesh count, indicating the convergence of the numerical model as the mesh count increases. The graph shows that with increasing mesh resolution, the shear cycle time approaches a stable value, reaching about 100% coincidence at a mesh count of approximately 629,460. Additionally, the shear cycle time for different models is compared. As shown in the right graph of Figure 4, the shear cycle time is calculated using three different models: the Newtonian k-ε model, the non-Newtonian power-law model, and the experimental value. The results show a significant difference between the models: The Newtonian k-ε model predicted a shear cycle time of 601 s, which is considerably higher than the experimental value. The non-Newtonian power-law model predicted a shear cycle time of 167 s, which is closer to the experimental value. The experimental value was 180 s, indicating that the non-Newtonian power-law model provides the best approximation of the actual shear behavior. These comparisons demonstrate the validity of the numerical model, with the non-Newtonian power-law model providing a more accurate prediction of shear behavior for the polymer solution.

3. Results and Discussions

3.1. Shearing Mechanism and Microstructural Evolution of Polymer Flooding Solutions

Shearing plays a pivotal role in altering the viscosity and microstructure of polymer flooding waste liquids (PFWL). The primary mechanism driving these changes is the disruption of polymer chain entanglements and the breakdown of polymer networks under shear forces. This shear-induced degradation leads to a reduction in viscosity, an improvement in flowability, and facilitates better management and disposal of polymer waste in oilfields.
As shown in Table 3, experimental results demonstrate that shear treatment significantly decreases the apparent viscosity of polymer solutions. For example, the 0.25% polymer solution experiences a 74.1% reduction in viscosity, from 993 mPa·s to 257 mPa·s, after shear treatment. The 0.5% and 0.75% polymer solutions show 63.8% and 57% reductions, respectively. These reductions highlight the effectiveness of shear in disrupting polymer chain entanglements, which is crucial for reducing the resistance of the polymer solution and enhancing its flow characteristics. The viscosity reduction is more pronounced in lower concentration solutions, as these solutions have less molecular entanglement and are, therefore, more susceptible to shear-induced degradation.
In addition, Table 4 presents the viscosity data of the 0.5% concentration polymer solution under different shear rates. The results show a clear trend of progressive viscosity reduction with increasing shear rate. Specifically, the viscosity reduction rate increases from 15.6% at 100 s−1 to 55.2% at 1200 s−1, indicating that stronger shear fields accelerate the disruption of polymer chain entanglements and enhance the breakdown of network structures. This exponential-like decay in viscosity demonstrates the strong sensitivity of the polymer solution to shear rate, which is consistent with its non-Newtonian and shear-thinning characteristics. These findings quantitatively link shear intensity to the extent of polymer degradation, providing a more direct connection between flow field conditions and macroscopic rheological evolution.
Further analysis of the shear-thinning behavior, shown in Figure 5, reveals that viscosity decreases significantly as shear rate increases. This is characteristic of non-Newtonian fluids, where polymer chains tend to align and partially disentangle under shear stress, thereby reducing the flow resistance of the solution. Figure 6, Figure 7 and Figure 8 present the particle size distribution curves before and after shear treatment. Dynamic light scattering (DLS) measurements indicate a shift toward smaller apparent particle sizes after shear, particularly for the 0.25% polymer solution, where the average hydrodynamic diameter decreases from approximately 300 nm to 160 nm. Although DLS measurements in semi-dilute polymer solutions are affected by inter-chain interactions and may not directly reflect individual chain sizes, the observed reduction in apparent particle size suggests disruption of larger polymeric aggregates or network-like structures. These findings imply that shear promotes structural disintegration at the supramolecular level, contributing to improved flow characteristics.
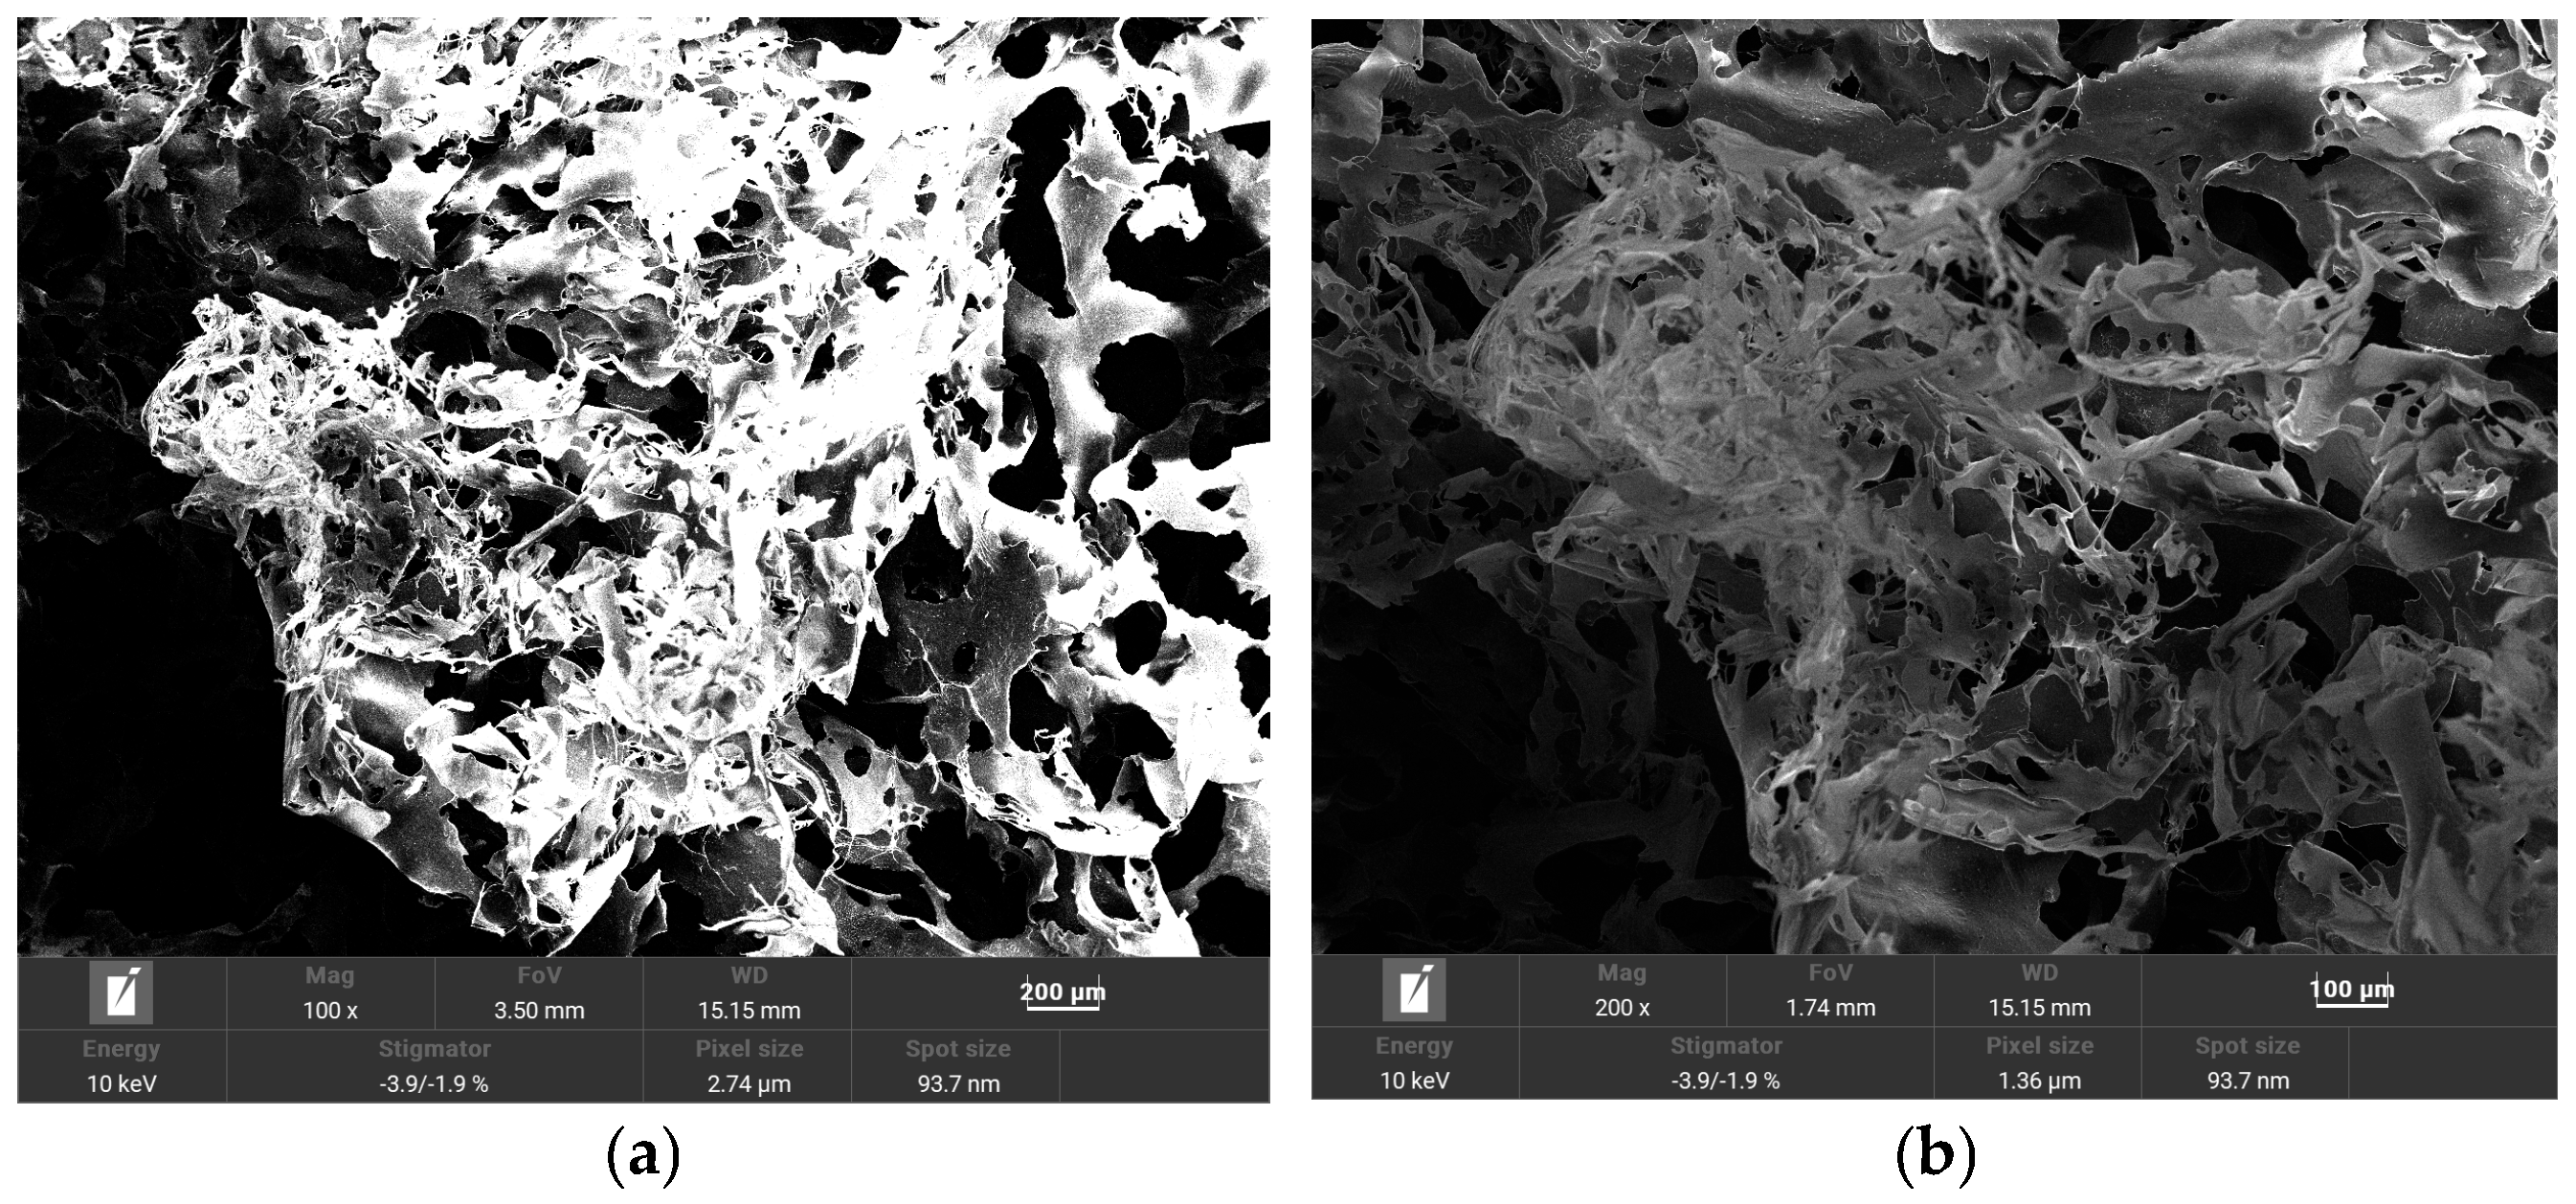
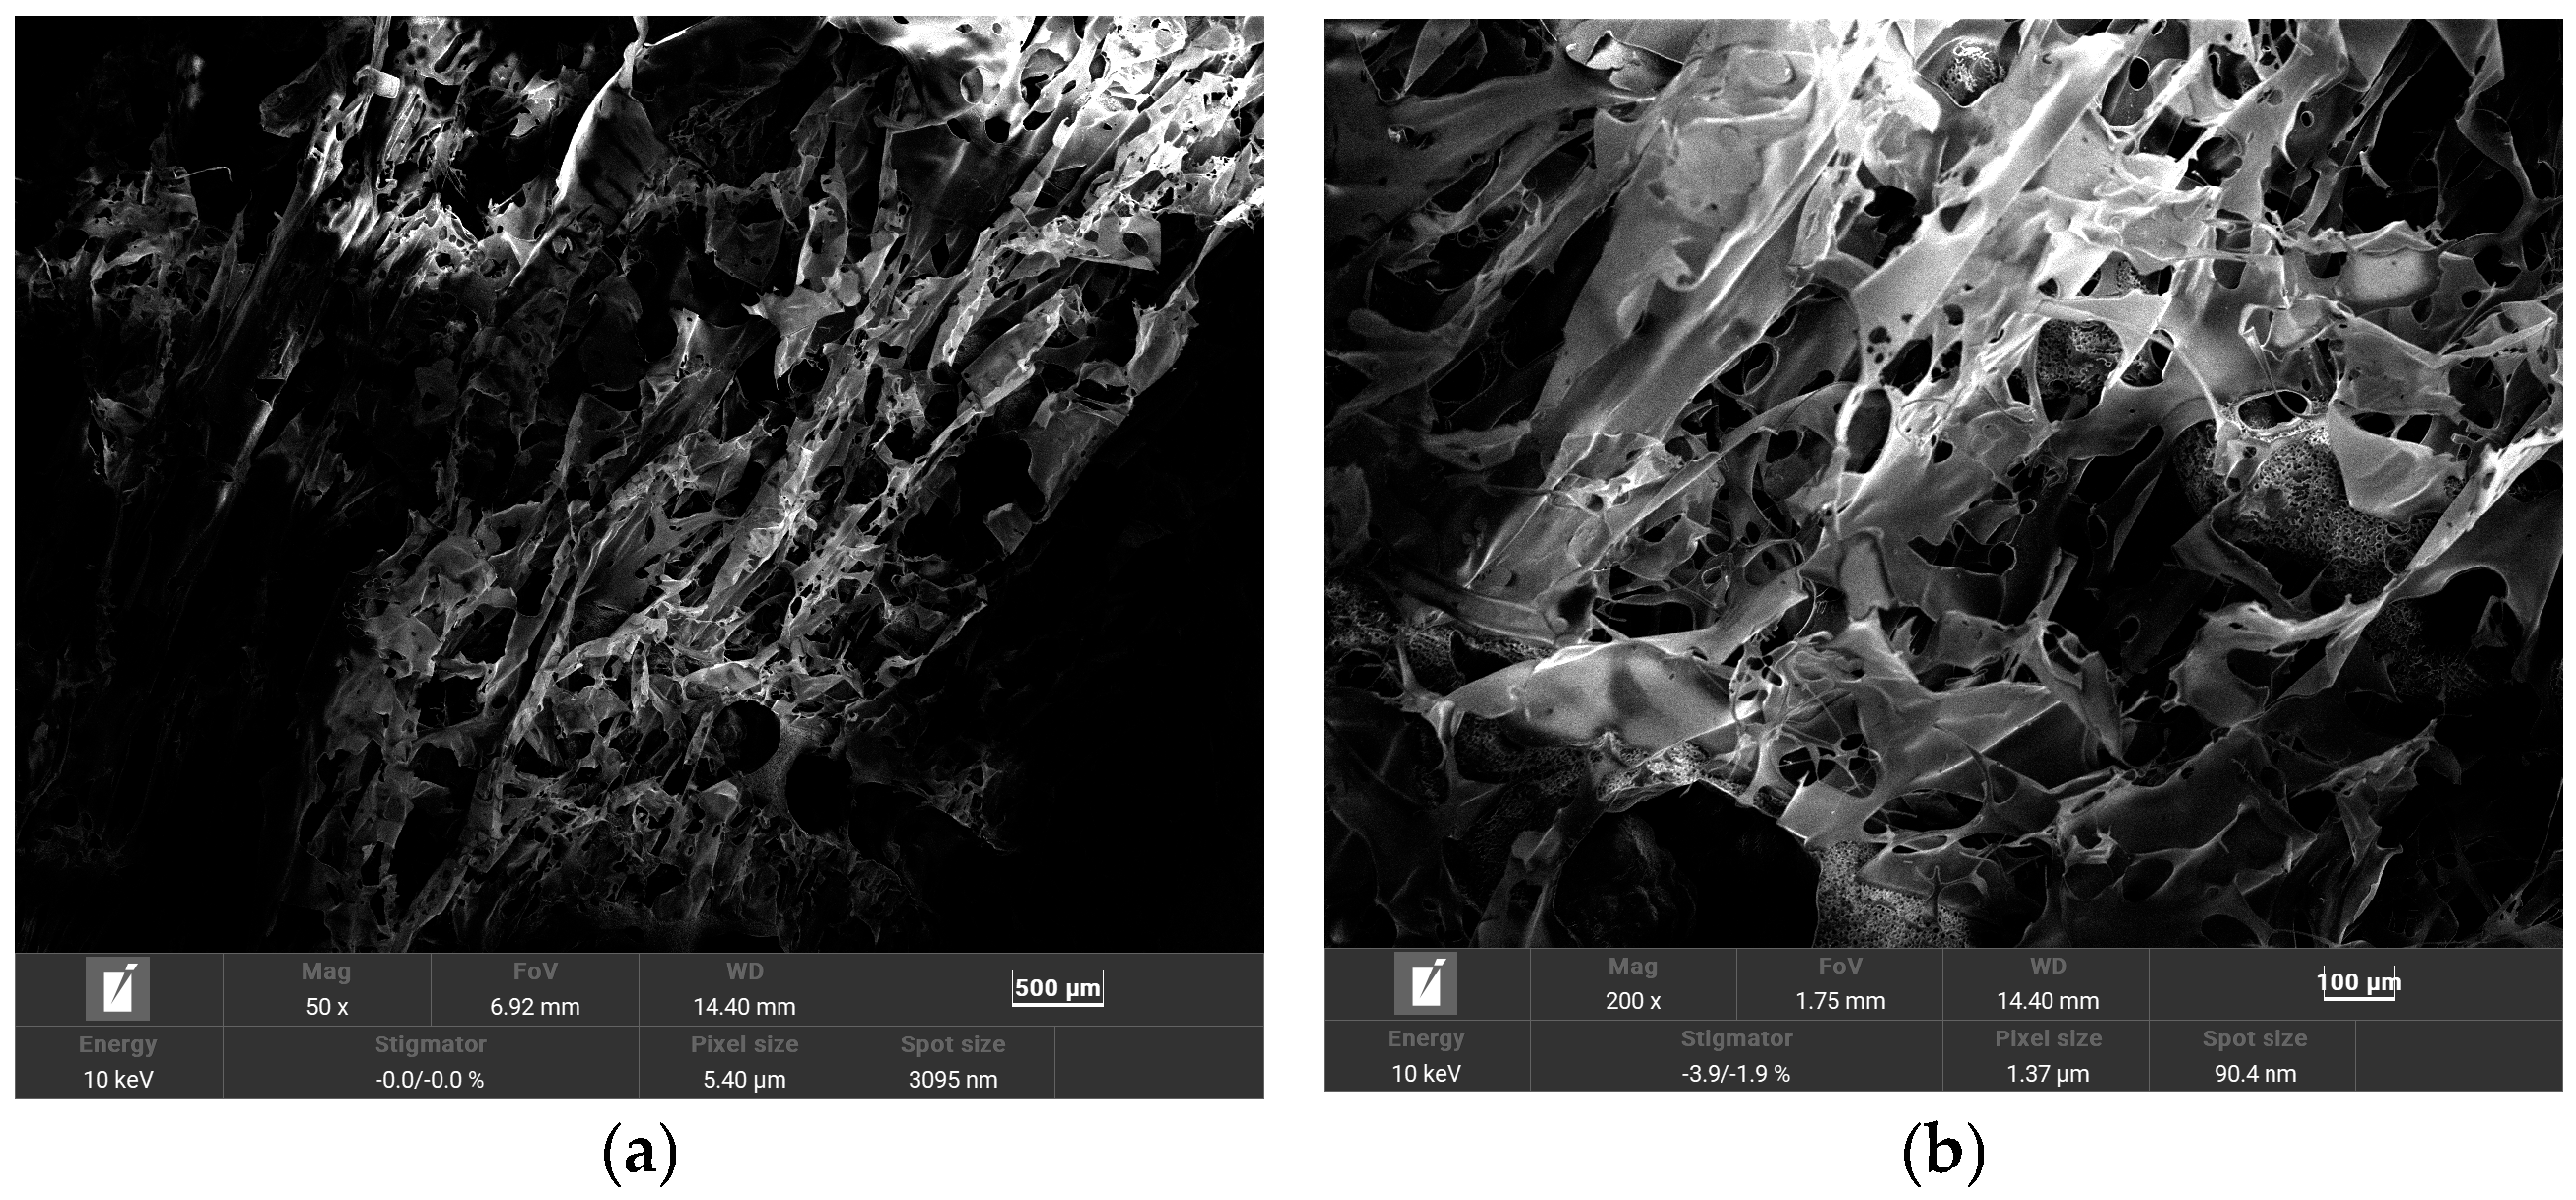
In addition to viscosity and particle size reduction, scanning electron microscopy (SEM) images, shown in Figure 9, Figure 10 and Figure 11, provide qualitative insights into the morphological changes in the freeze-dried polymer samples before and after shear treatment. Prior to shear, the samples exhibit dense and entangled surface textures, while post-shear samples appear looser and more fragmented. Although the lyophilization process alters the native configuration of the polymer chains in solution, the observed differences in dry-state morphology suggest that shear treatment may disrupt aggregated polymer structures. These morphological trends are consistent with the observed viscosity reduction and particle size distribution, supporting the hypothesis that shear forces contribute to microstructural changes in the polymer solution.
In addition to qualitative observation, quantitative analysis of the SEM images is performed to reduce subjectivity and provide further evidence of shear-induced microstructural changes. The results show that the average particle area decreases progressively with polymer concentration under shear. For the 0.25% solution, the mean projected area of polymer fragments is approximately 1850 px2 with a relatively broad distribution (standard deviation ≈ 960 px2). At 0.5% concentration, the average area decreases to 1210 px2, accompanied by a narrower distribution (standard deviation ≈ 640 px2), indicating that shear produces more uniformly sized fragments. For the 0.75% solution, the fragments further reduce to an average of 860 px2, and the distribution becomes sharper (standard deviation ≈ 480 px2), suggesting enhanced fragmentation of the network structure.
The porosity, defined as the proportion of dark regions in the SEM images, increases from 32% (0.25%) to 41% (0.5%), and reaches 48% (0.75%), reflecting the gradual opening of void structures under stronger entanglement and subsequent breakage. Furthermore, fractal dimension analysis yields values of 1.72 (0.25%), 1.68 (0.5%), and 1.63 (0.75%), showing a decreasing trend that indicates reduced structural complexity and smoother fragment boundaries after shear.
These quantitative results are consistent with the qualitative SEM observations and support the conclusion that shear treatment promotes progressive fragmentation and loosening of the polymer network. The decrease in average particle size, the increase in porosity, and the reduction in fractal dimension collectively demonstrate that shear forces not only break down large polymer aggregates but also simplify their structural organization.
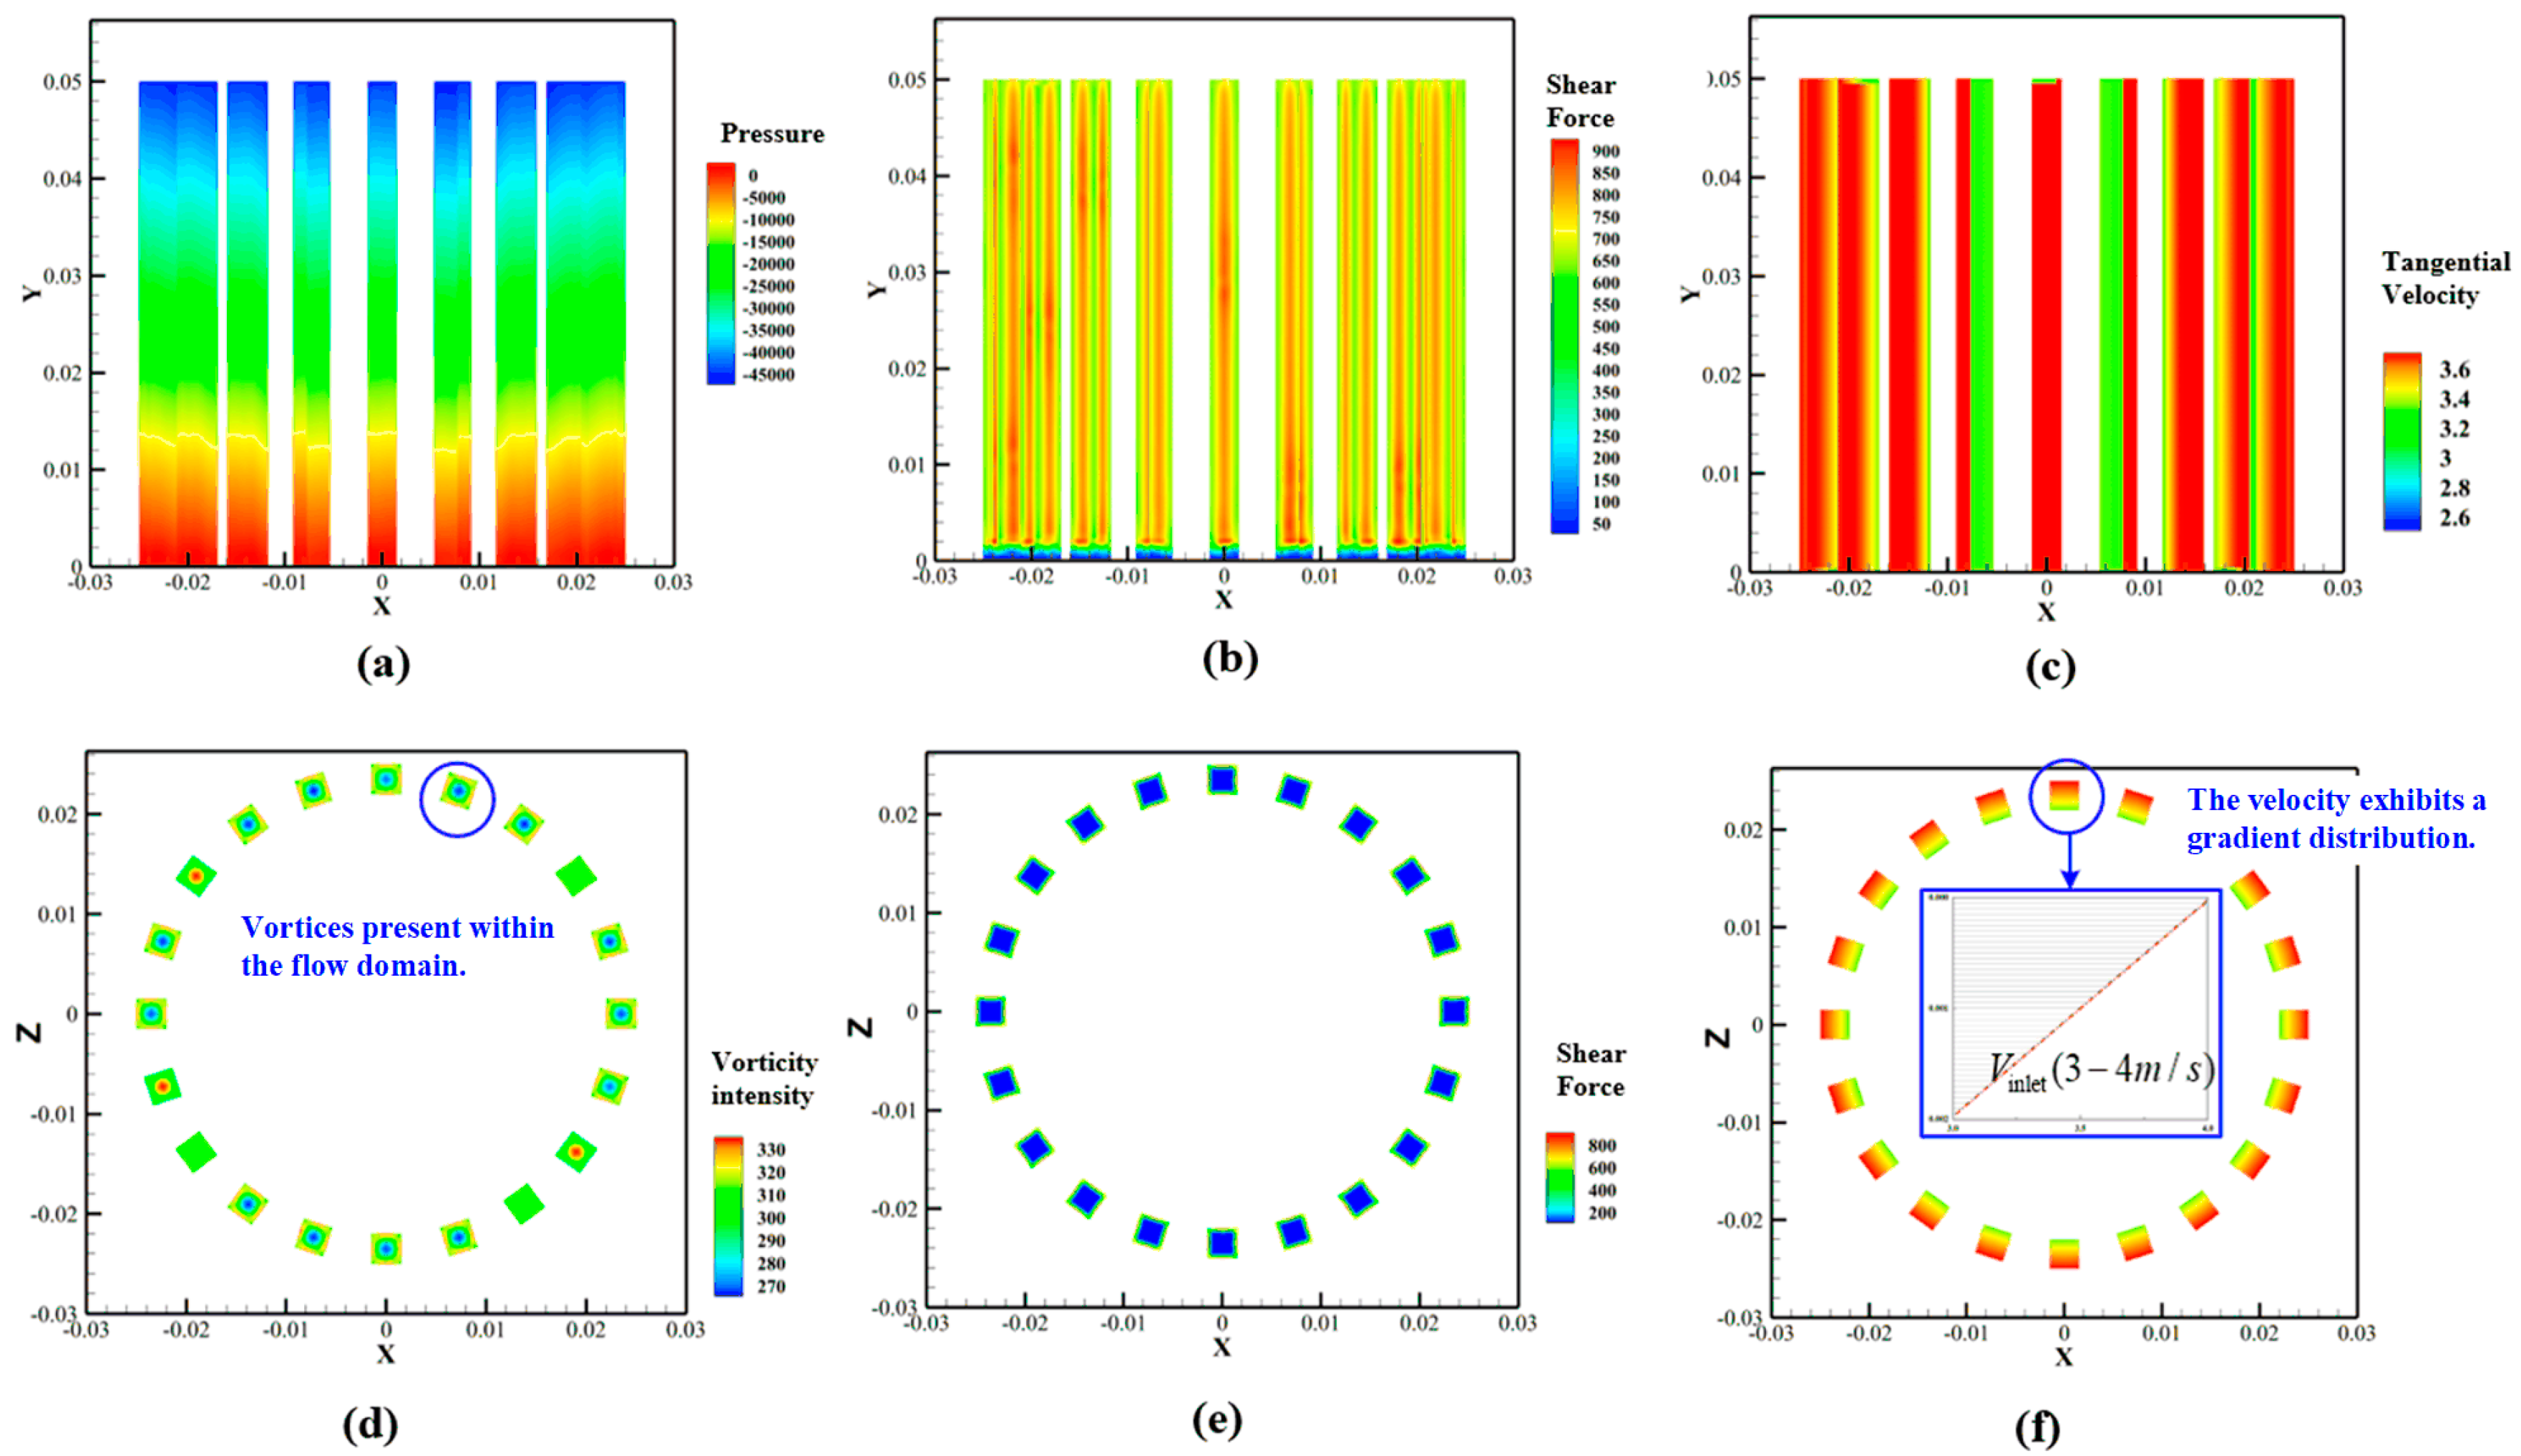
Figure 12 presents the overall modeling of the rotor–stator flow field, particularly focusing on the rotating rotor domain. The flow field characteristics are critical for understanding the shear forces applied to the polymer solution. In the shear tool, the velocity field displays a gradient distribution, with the inner wall speed approximately 3 m/s and the outer wall speed reaching up to 4 m/s, indicating that the shear force varies along the radius of the tool. The shear stress is significantly higher near the rotor surface, with values in the range of 600–800 Pa, which is sufficient to induce polymer degradation. The shear rate within the rotor domain is calculated to be approximately 800–1200 s−1, ensuring that polymer chains are sufficiently disrupted.
The flow field also exhibits significant vorticity near the rotor surface, where turbulence and shear-induced vortices are formed. These vortices enhance the mixing of the polymer solution and ensure that the shear forces are uniformly distributed throughout the solution. The highest shear stress and vorticity are found in the regions closest to the rotor, where the flow velocity gradients are steepest. This combination of high shear stress and vorticity promotes the breakdown of polymer aggregates and contributes to the overall reduction in viscosity.
These flow field parameters are essential for optimizing shear tool designs. By understanding how shear rate, wall shear stress, and vorticity influence polymer degradation, it is possible to improve the efficiency of shear tools used in polymer waste management. The relationship between shear effects and key flow parameters, such as velocity gradients and shear stress, provides the foundation for numerical simulations, which will be explored further in the subsequent sections to refine shear tool designs for better polymer waste treatment.

3.2. Shear Characteristics of Flow Field in Rotor–Stator Domains: A Comparative Analysis

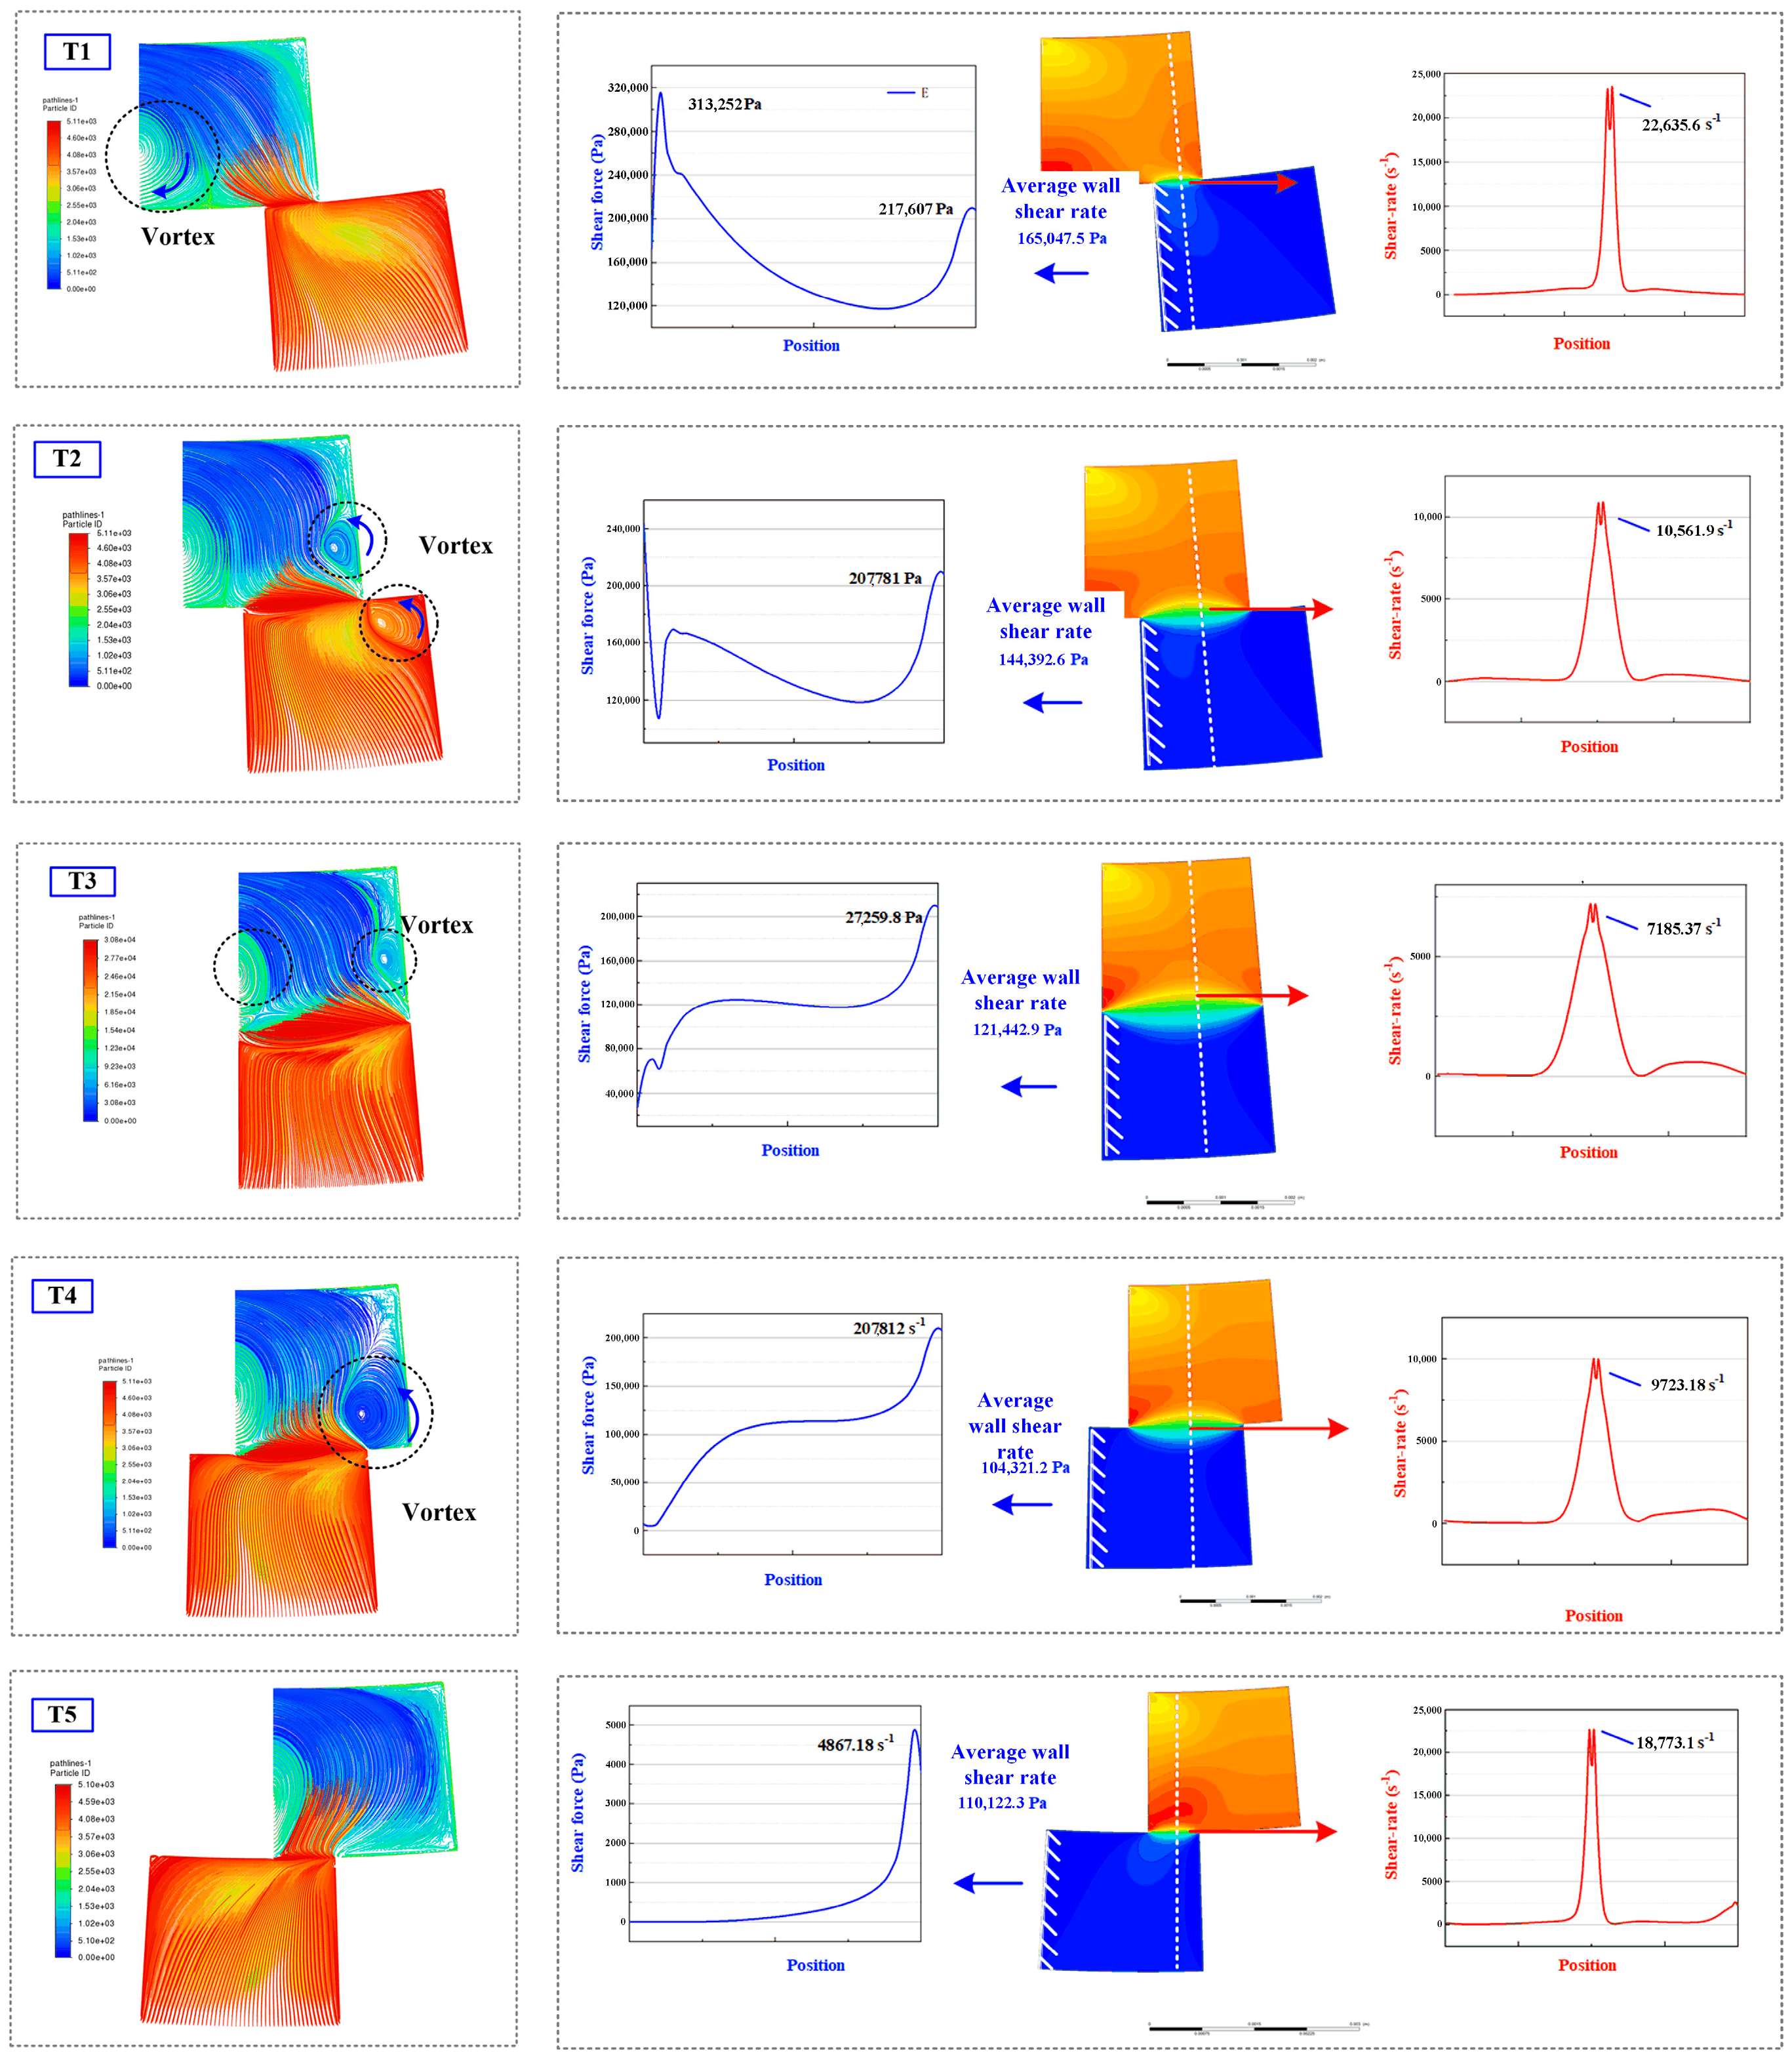
The interaction between rotating and fixed domains in the shear tool plays a critical role in determining the intensity and uniformity of shear forces imparted to the polymer solution. As shown in Figure 13, five typical contact forms (T1–T5) during a single flow field exchange cycle reveal dynamic variations in velocity fields and shear parameters. The velocity contour maps on the right and the velocity vectors on the left demonstrate the rotational shear progression, where shear rate peaks consistently occur near the interfacial regions. Specifically, the maximum shear rates for T1–T5 are 22,636, 10,561, 7185, 9723, and 18,773 s−1, respectively, indicating periodic enhancement and dissipation of shear as the rotor–stator domains transition through contact phases. Correspondingly, the average wall shear stresses on the outer wall exhibit a similar trend, ranging from 104,321 to 165,047 Pa, reflecting shear energy transfer to the boundary layers.
Figure 14 further illustrates the vorticity distribution across the same contact forms. The rotating domain consistently exhibits higher vorticity than the fixed counterpart, with peak values observed in the fully engaged T3 condition—2278 s−1 in the rotating region versus 1823 s−1 in the fixed domain. These vortex structures enhance turbulence, promoting the dispersion and fragmentation of polymer chains.
Mechanistically, as summarized in Figure 15, the shearing action between rotating and fixed domains induces significant molecular deformation and alignment of polymer chains. The interface region, characterized by high shear rate gradients, becomes the critical site for molecular scission and disentanglement. This contributes to the observed reduction in viscosity and particle size in the experiments discussed previously.
Moving to more complex configurations, Figure 16 depicts the scenario in which a single rotating domain interacts with two fixed domains, simulating conditions with increased stator segmentation. The streamline patterns highlight compound flow interference, which enhances the shear overlap region. As detailed in Figure 17, this configuration results in a peak shear rate of 34,221 s−1 along the interface and wall shear stresses of 56,013.88 Pa and 134,229 Pa for the two fixed walls, respectively. These high-gradient regions are essential for improving shear uniformity and mixing efficiency.
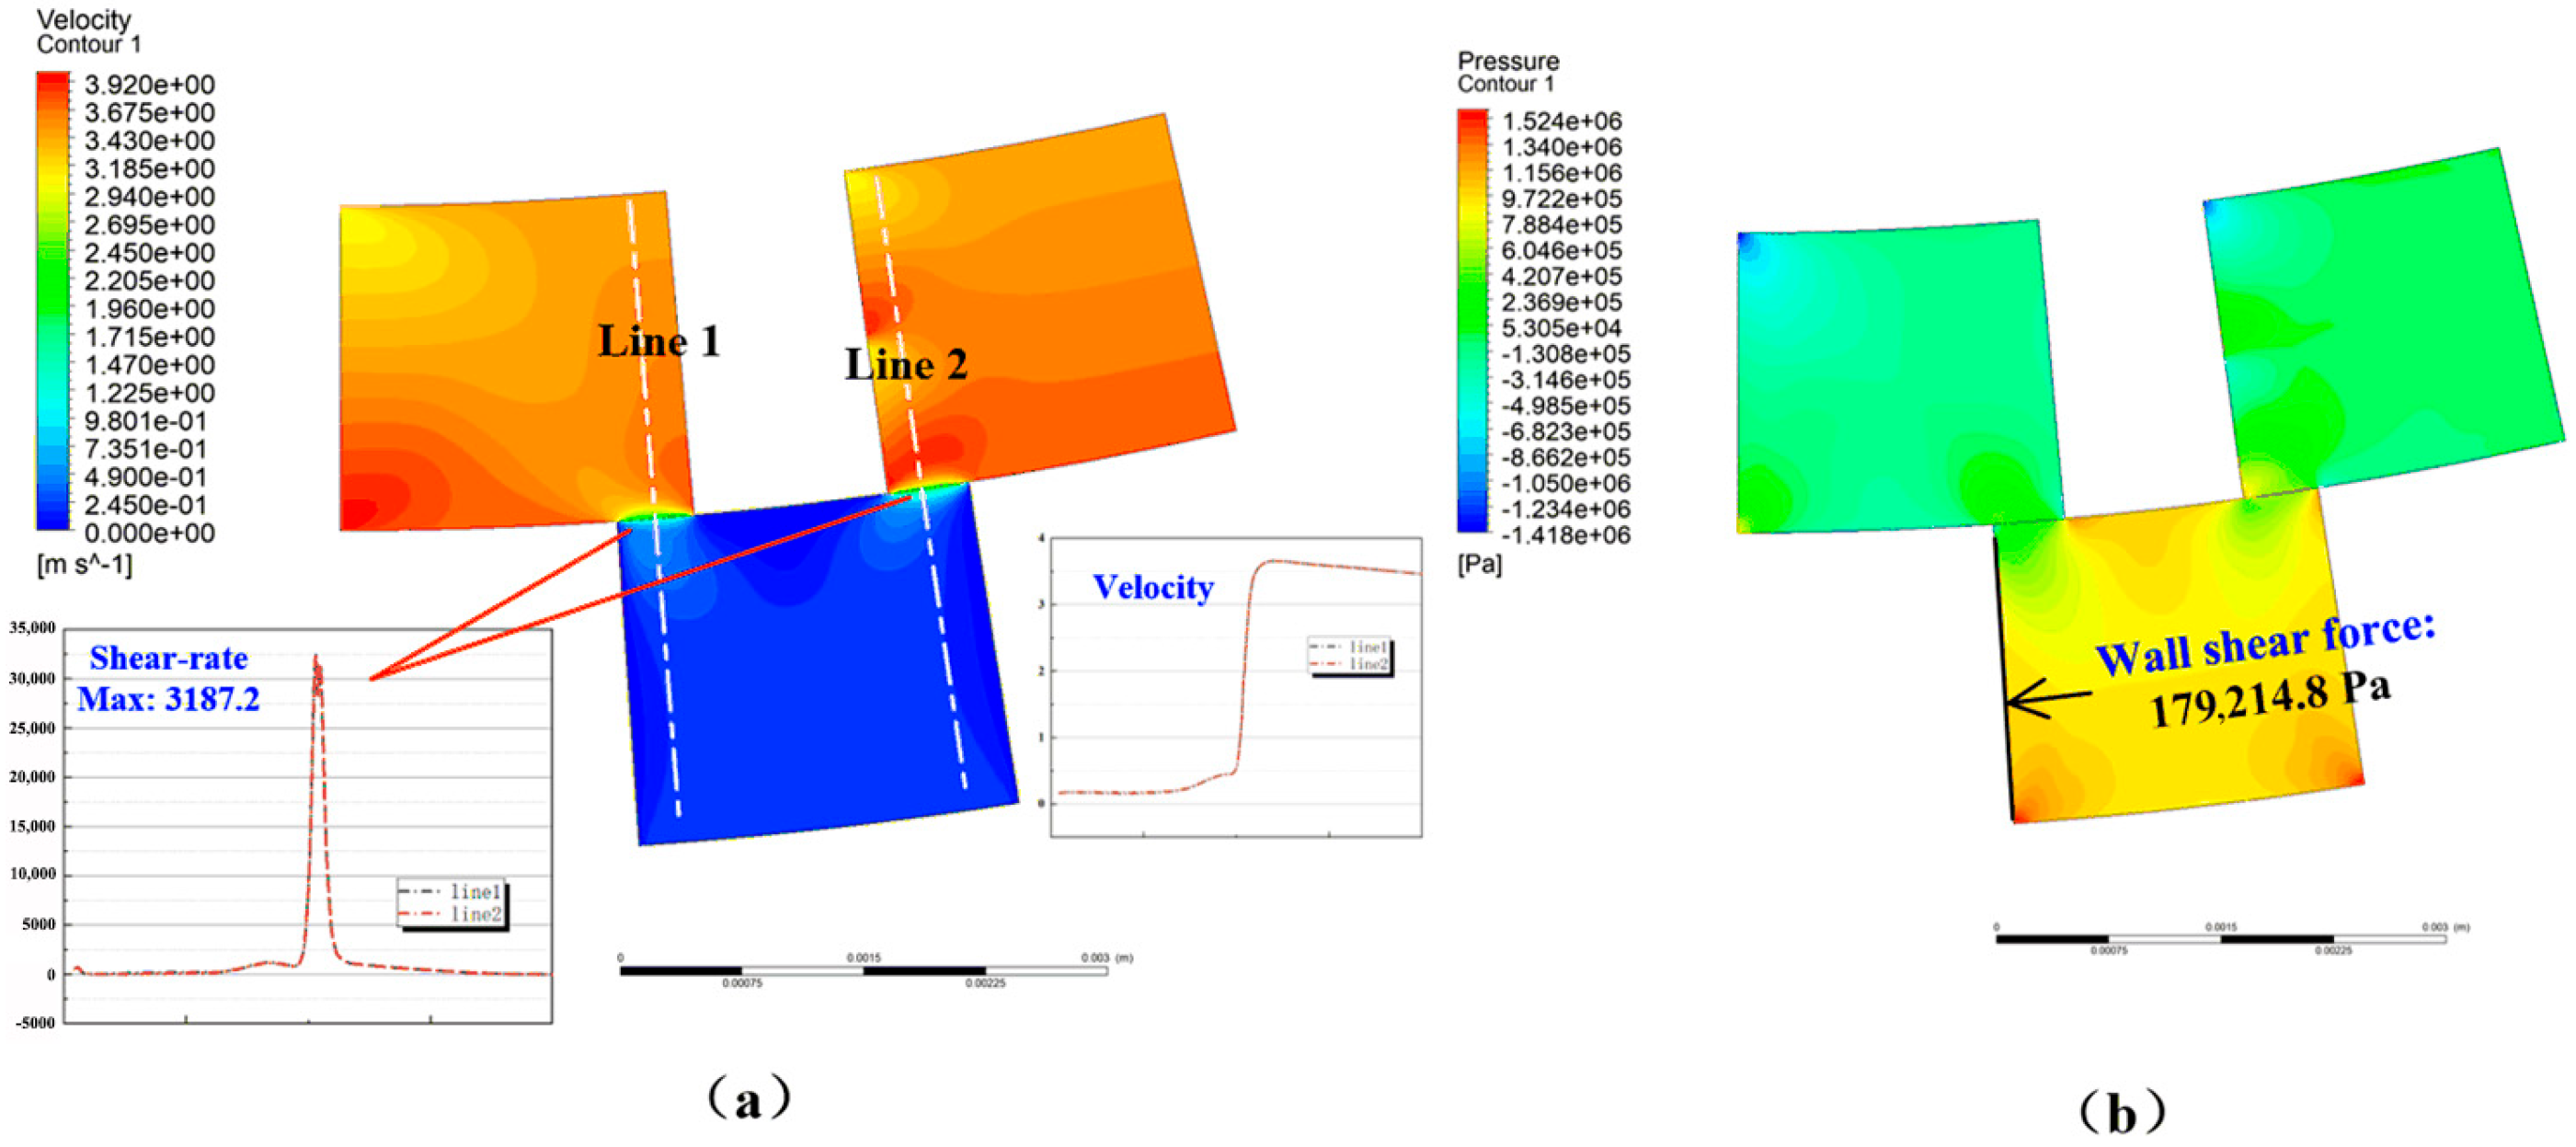
Conversely, when dual rotating domains engage with a single fixed domain—as shown in Figure 18 and Figure 19—the peak shear rate reaches 31,872 s−1, while the fixed wall experiences an elevated wall shear stress of 179,215 Pa. This arrangement generates a more intense and focused shear field within the fixed region, thereby altering the localization of degradation effects.
The comparative analysis in Figure 20 presents averaged vorticity and shear rate metrics across both configurations. In the one-rotor–two-stator configuration, the rotating domain achieves higher mean values (vorticity: 1690.6 s−1; shear rate: 1729.2 s−1) compared to the stators (715.6 s−1). In contrast, in the two-rotor–one-stator configuration, the fixed domain exhibits dominant values (vorticity: 1637.3 s−1; shear rate: 1448.3 s−1), while the rotors contribute less (vorticity: 1172.2 s−1; shear rate: 1134.5 s−1). This inversion underscores how domain arrangement directly dictates the spatial distribution of mechanical energy and polymer interaction zones.
In sum, these observations highlight that strategic domain configurations modulate shear intensity, vorticity formation, and stress localization. Such insights provide a crucial foundation for optimizing rotor–stator geometry in shear tool design, and will be expanded upon through numerical modeling in subsequent sections.

3.3. Study on the Influence of Rotor–Stator Flow Domain Structure on Shear Flow Characteristics

3.3.1. Rotating Flow Domain with 30° Torsion

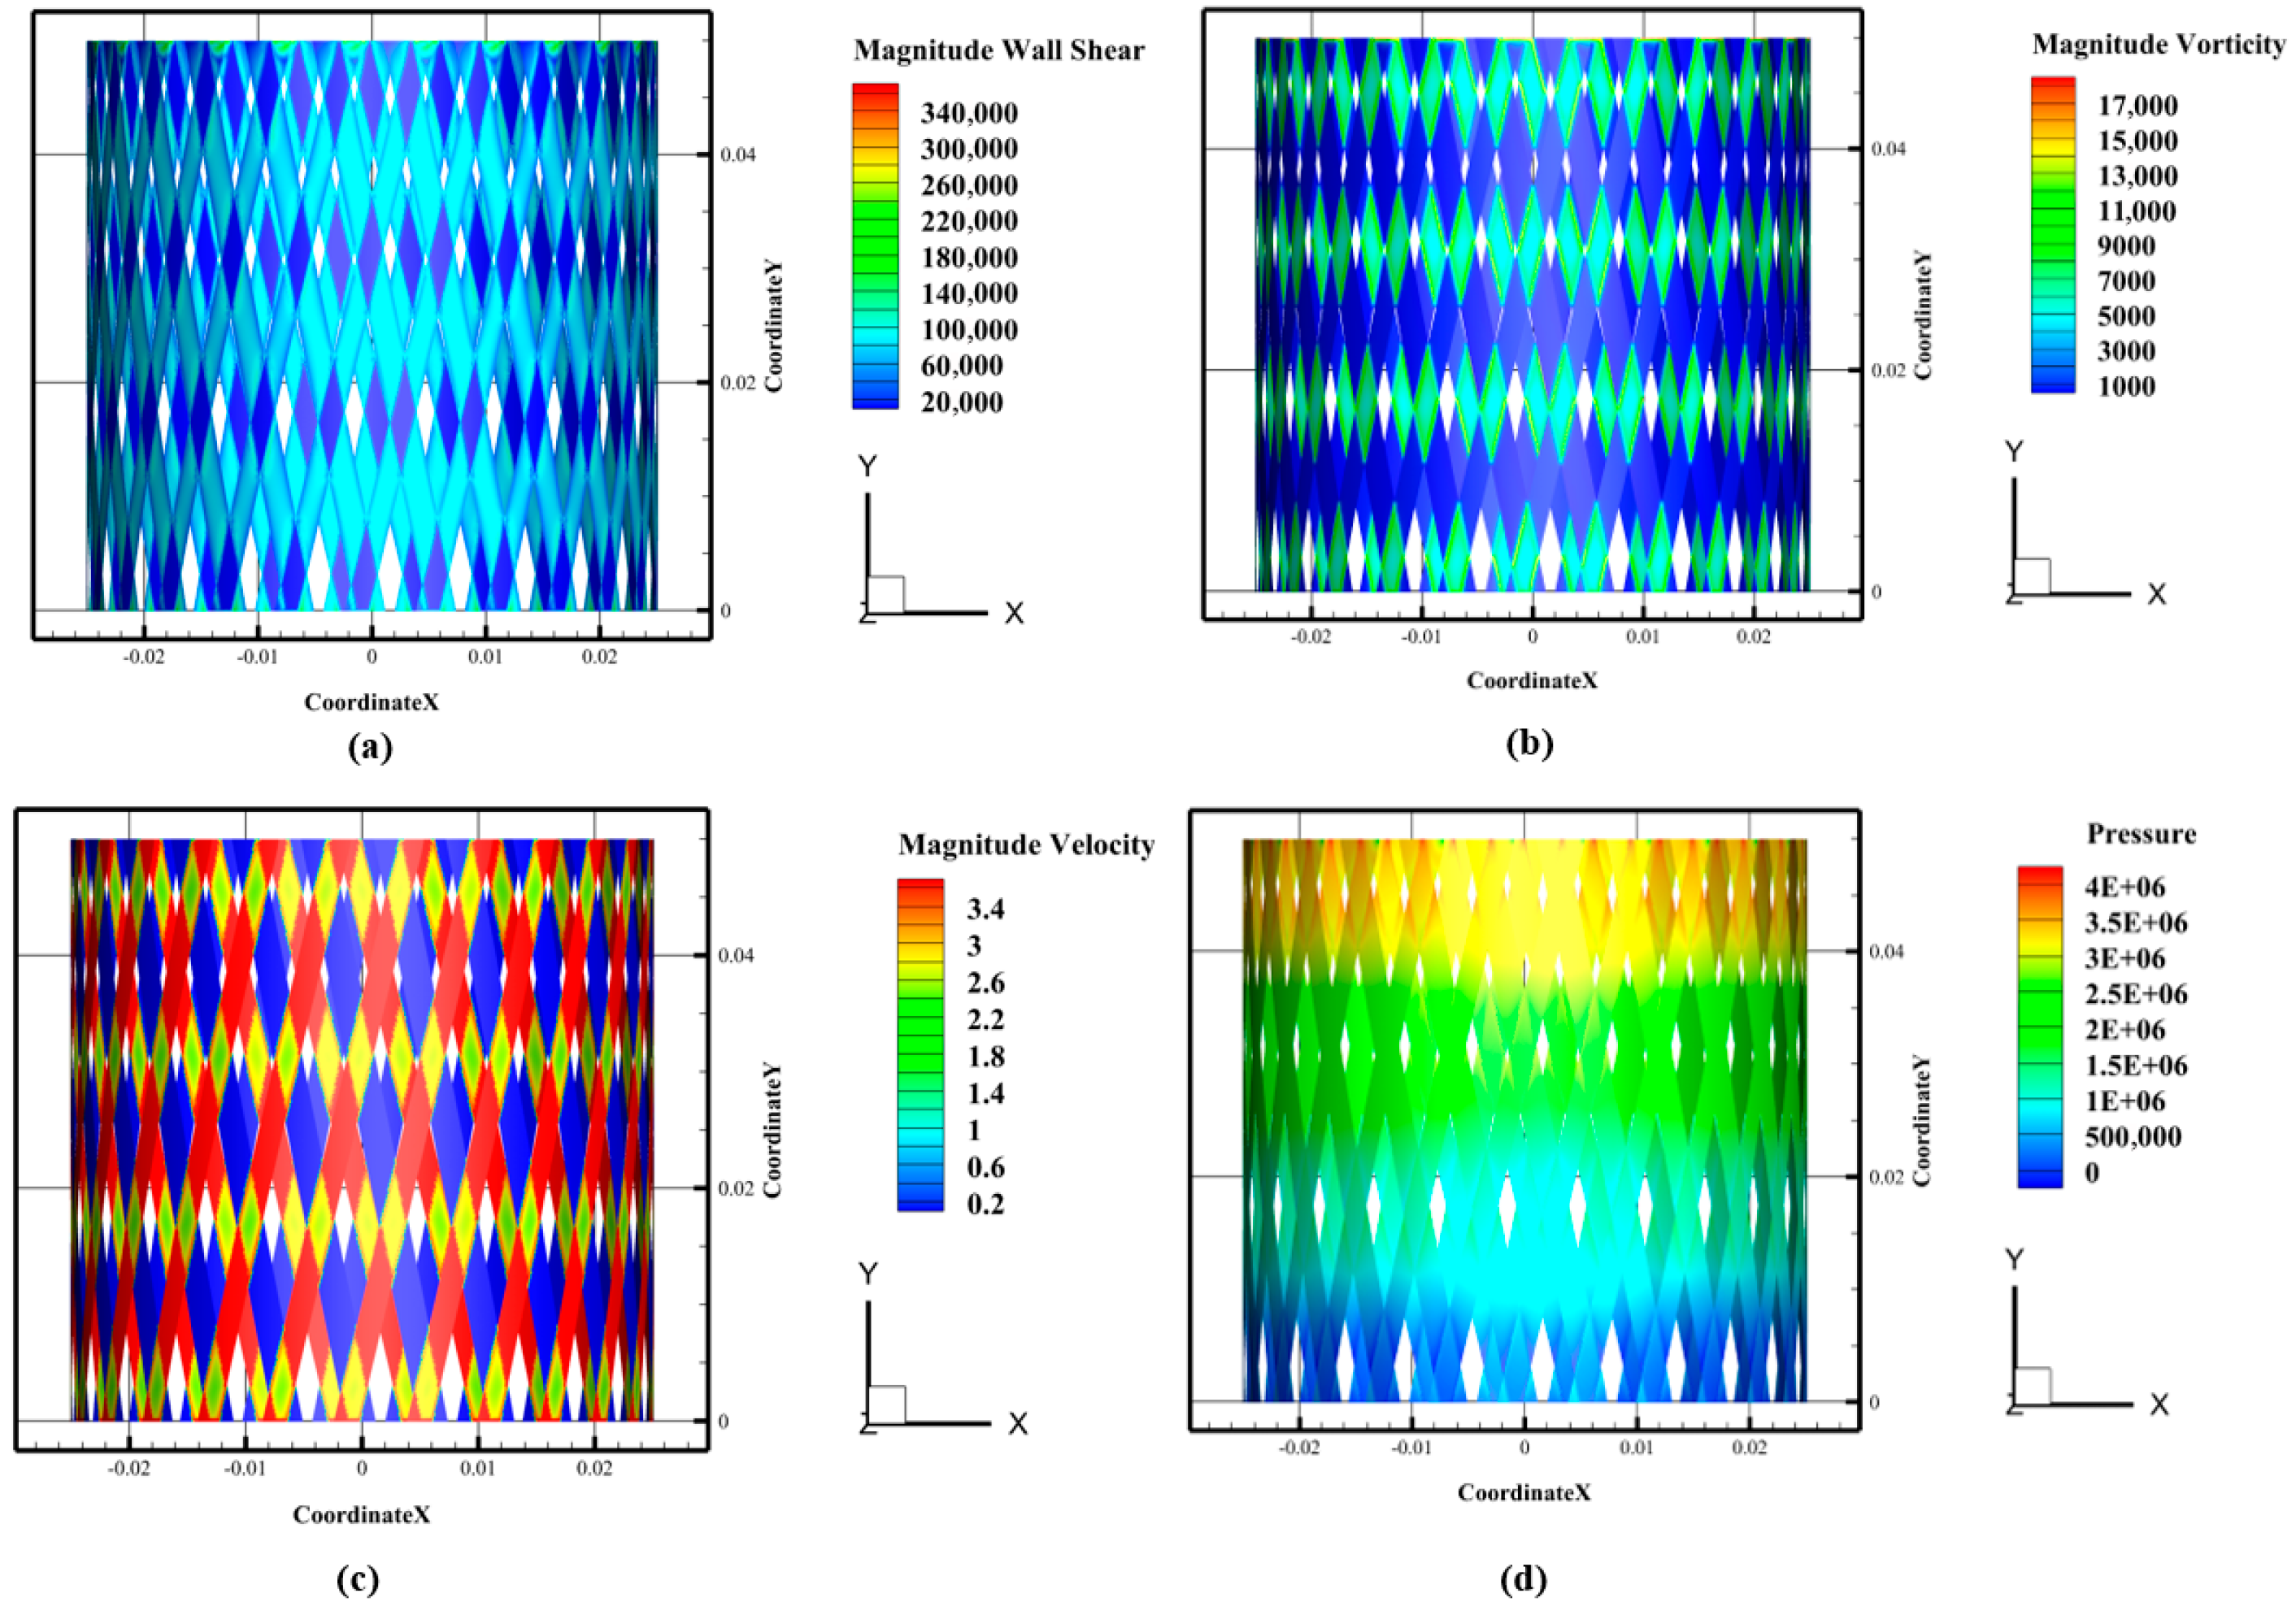
The configuration of rotor–stator systems play a crucial role in determining the shear characteristics and polymer degradation process within the shear tool. Changes in the geometries of the rotor and stator, as well as the relative contact angles between them, affect the distribution of shear forces and their subsequent impact on polymer solutions. This section focuses on analyzing the shear characteristics of various rotor–stator contact configurations by investigating three-dimensional flow field characteristics, velocity distributions, shear rate, and wall shear stress, as depicted in Figure 21, Figure 22 and Figure 23.
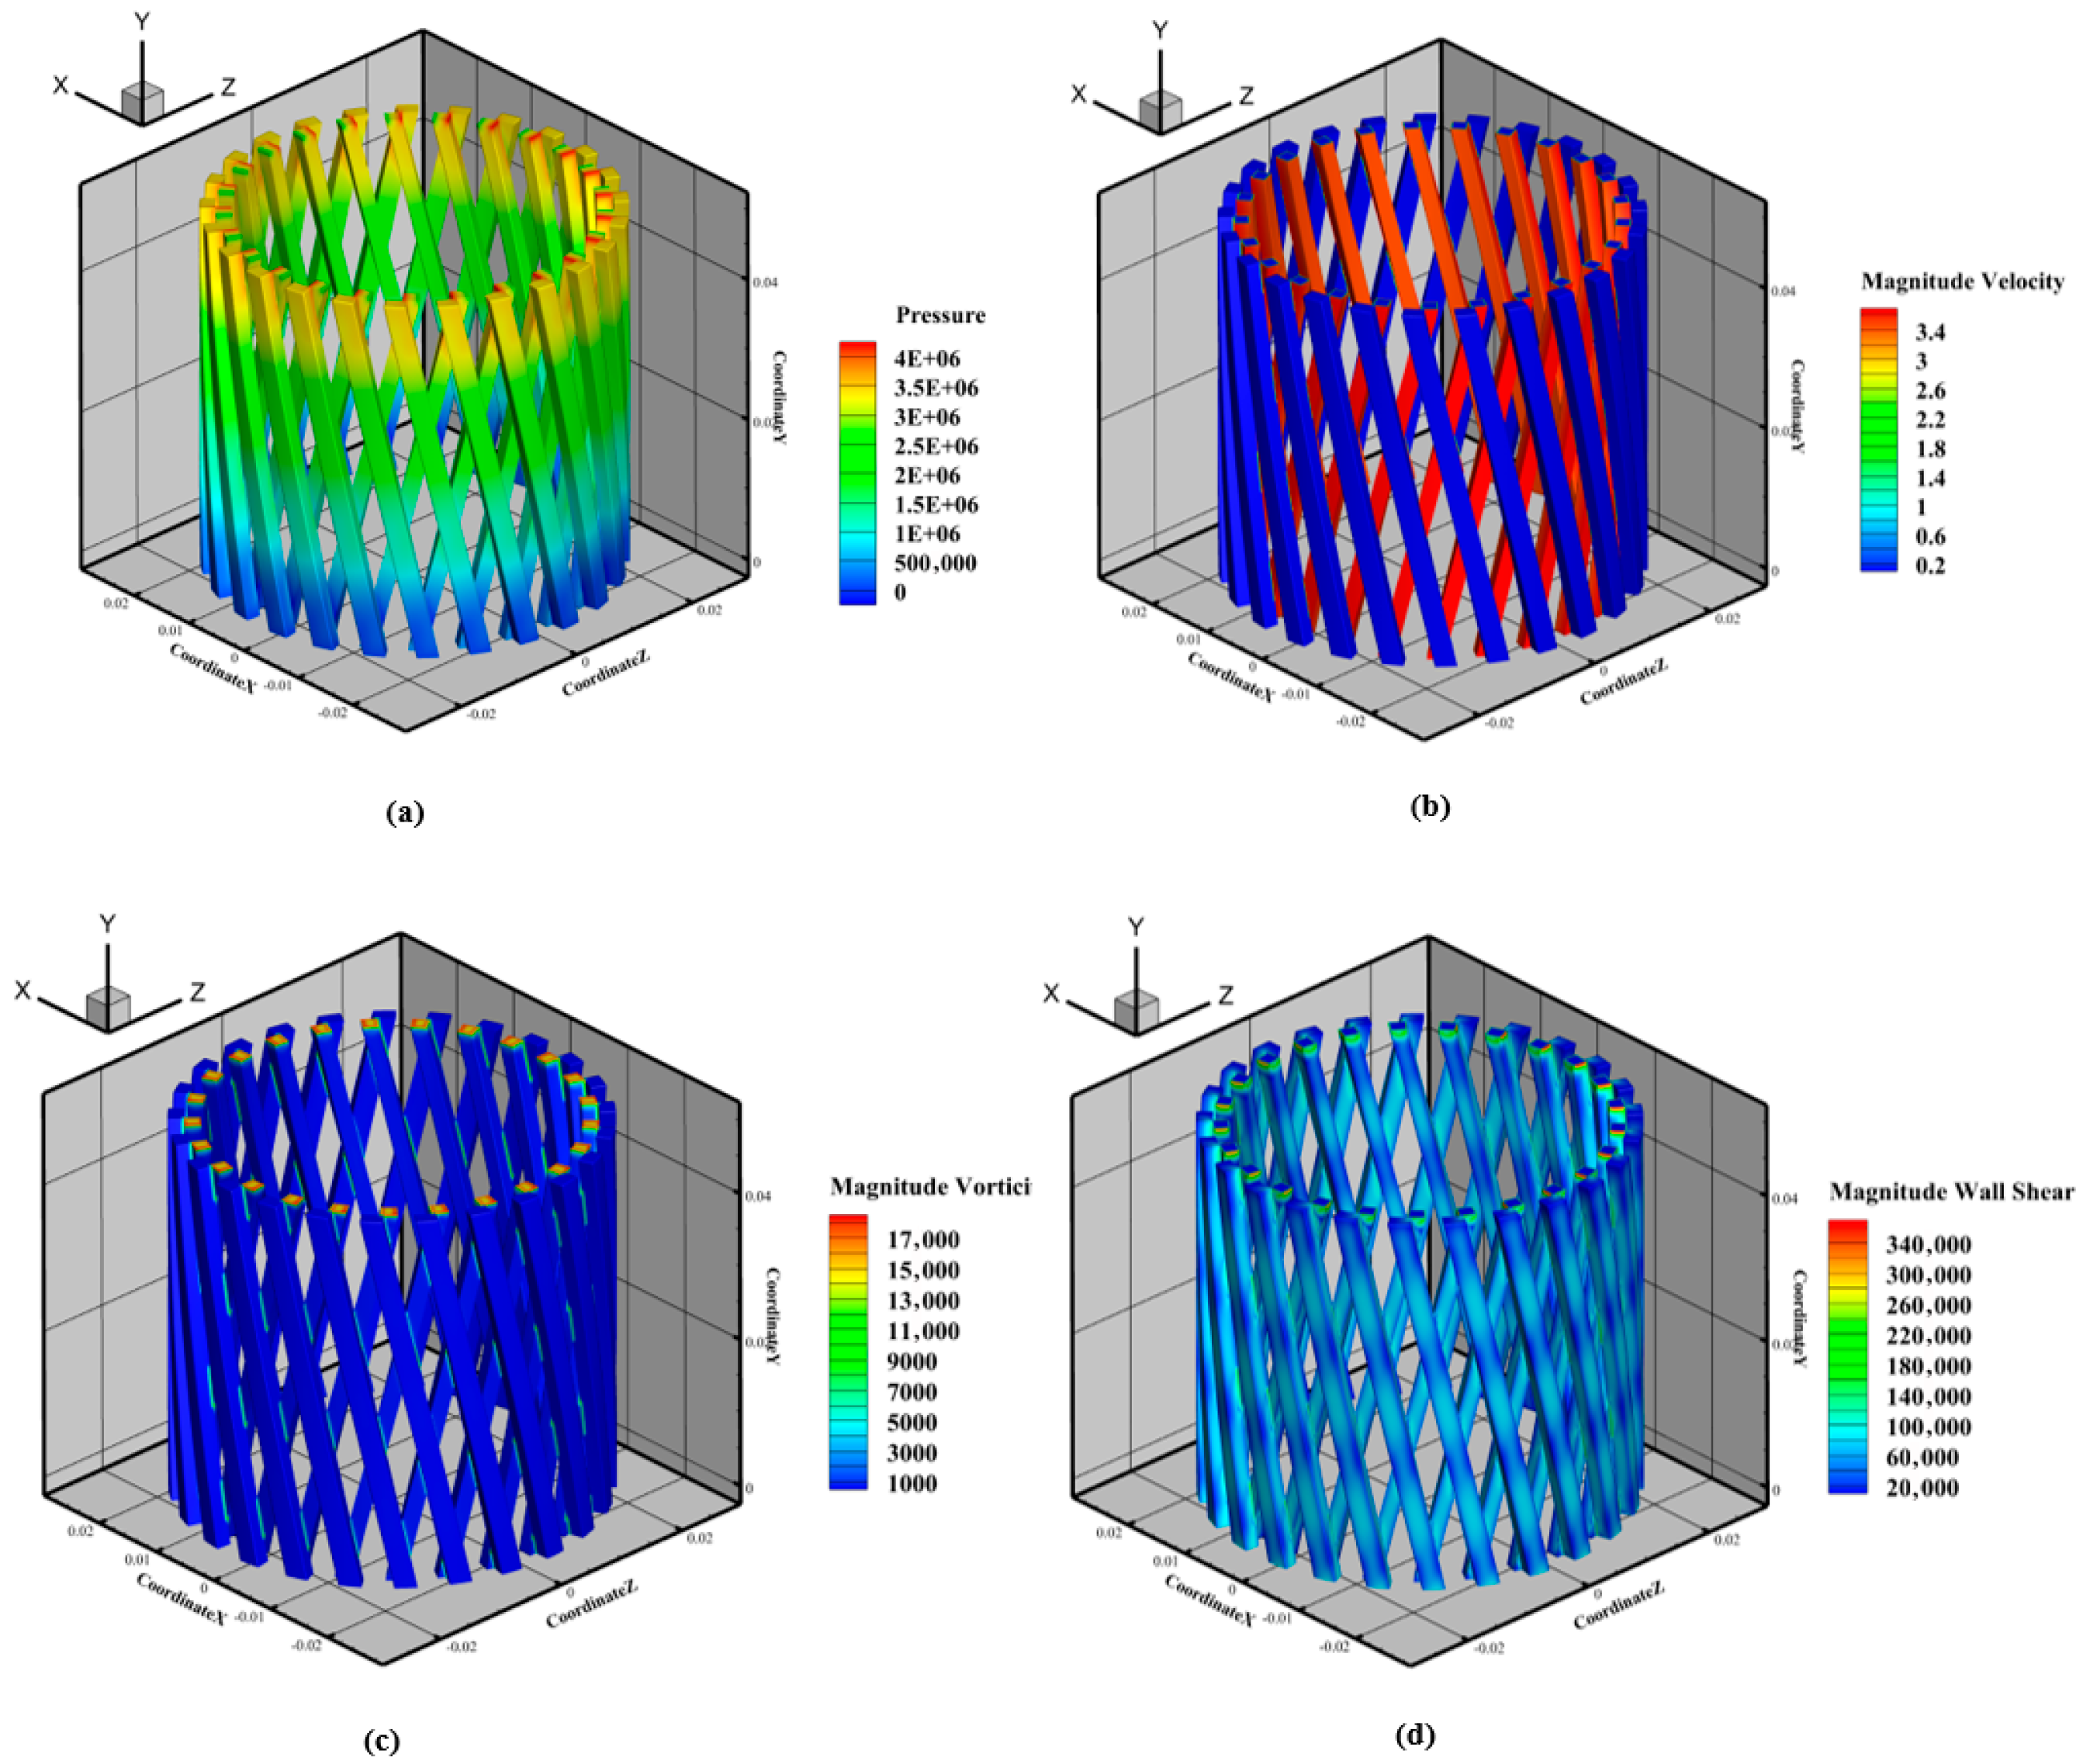
Figure 21 illustrates the three-dimensional flow field at the rotor–stator interface for a 30-degree twisted contact configuration. The flow field in this setup shows complex interactions between the rotor and stator domains, with velocity gradients varying significantly between the rotating rotor and the fixed stator. The spiral geometry of the rotor induces localized high shear forces, particularly near the contact interface. In the rotating domain (rotor), the velocity reaches 3.6 m/s, while in the fixed domain (stator), the velocity is slightly lower at 2.4 m/s. This difference in velocity results in significant shear forces at the interface, which are essential for polymer degradation and viscosity reduction.
Figure 22 presents the flow field characteristics at the Z cross-section of the rotor–stator interface for the 30-degree twisted contact. The flow is not uniform across the cross-section, with higher velocities near the rotor surface and lower velocities near the stator surface. This velocity difference leads to varying shear forces across the interface. The wall shear stress at the interface ranges from 150 Pa to 1000 Pa, with higher values near the rotor surface where shear forces are concentrated. These high shear forces are crucial for breaking down polymer chains and aggregates, thus enhancing the fluidity of the polymer solution.
Figure 23 shows the velocity, wall shear, and shear rate distribution in the Y-section of the shear flow domain. This section provides a detailed view of how shear forces are distributed radially across the flow field. The maximum wall shear stress is observed to be 1100 Pa near the rotor surface, while the shear rate increases exponentially as it approaches the rotor–stator interface, reaching up to 35,000 s−1. These high shear rates are essential for inducing shear thinning behavior in the polymer solution and facilitating the breakdown of polymer networks. The wall shear stress at 1100 Pa aids in breaking polymer aggregates, improving the solution’s flow properties.
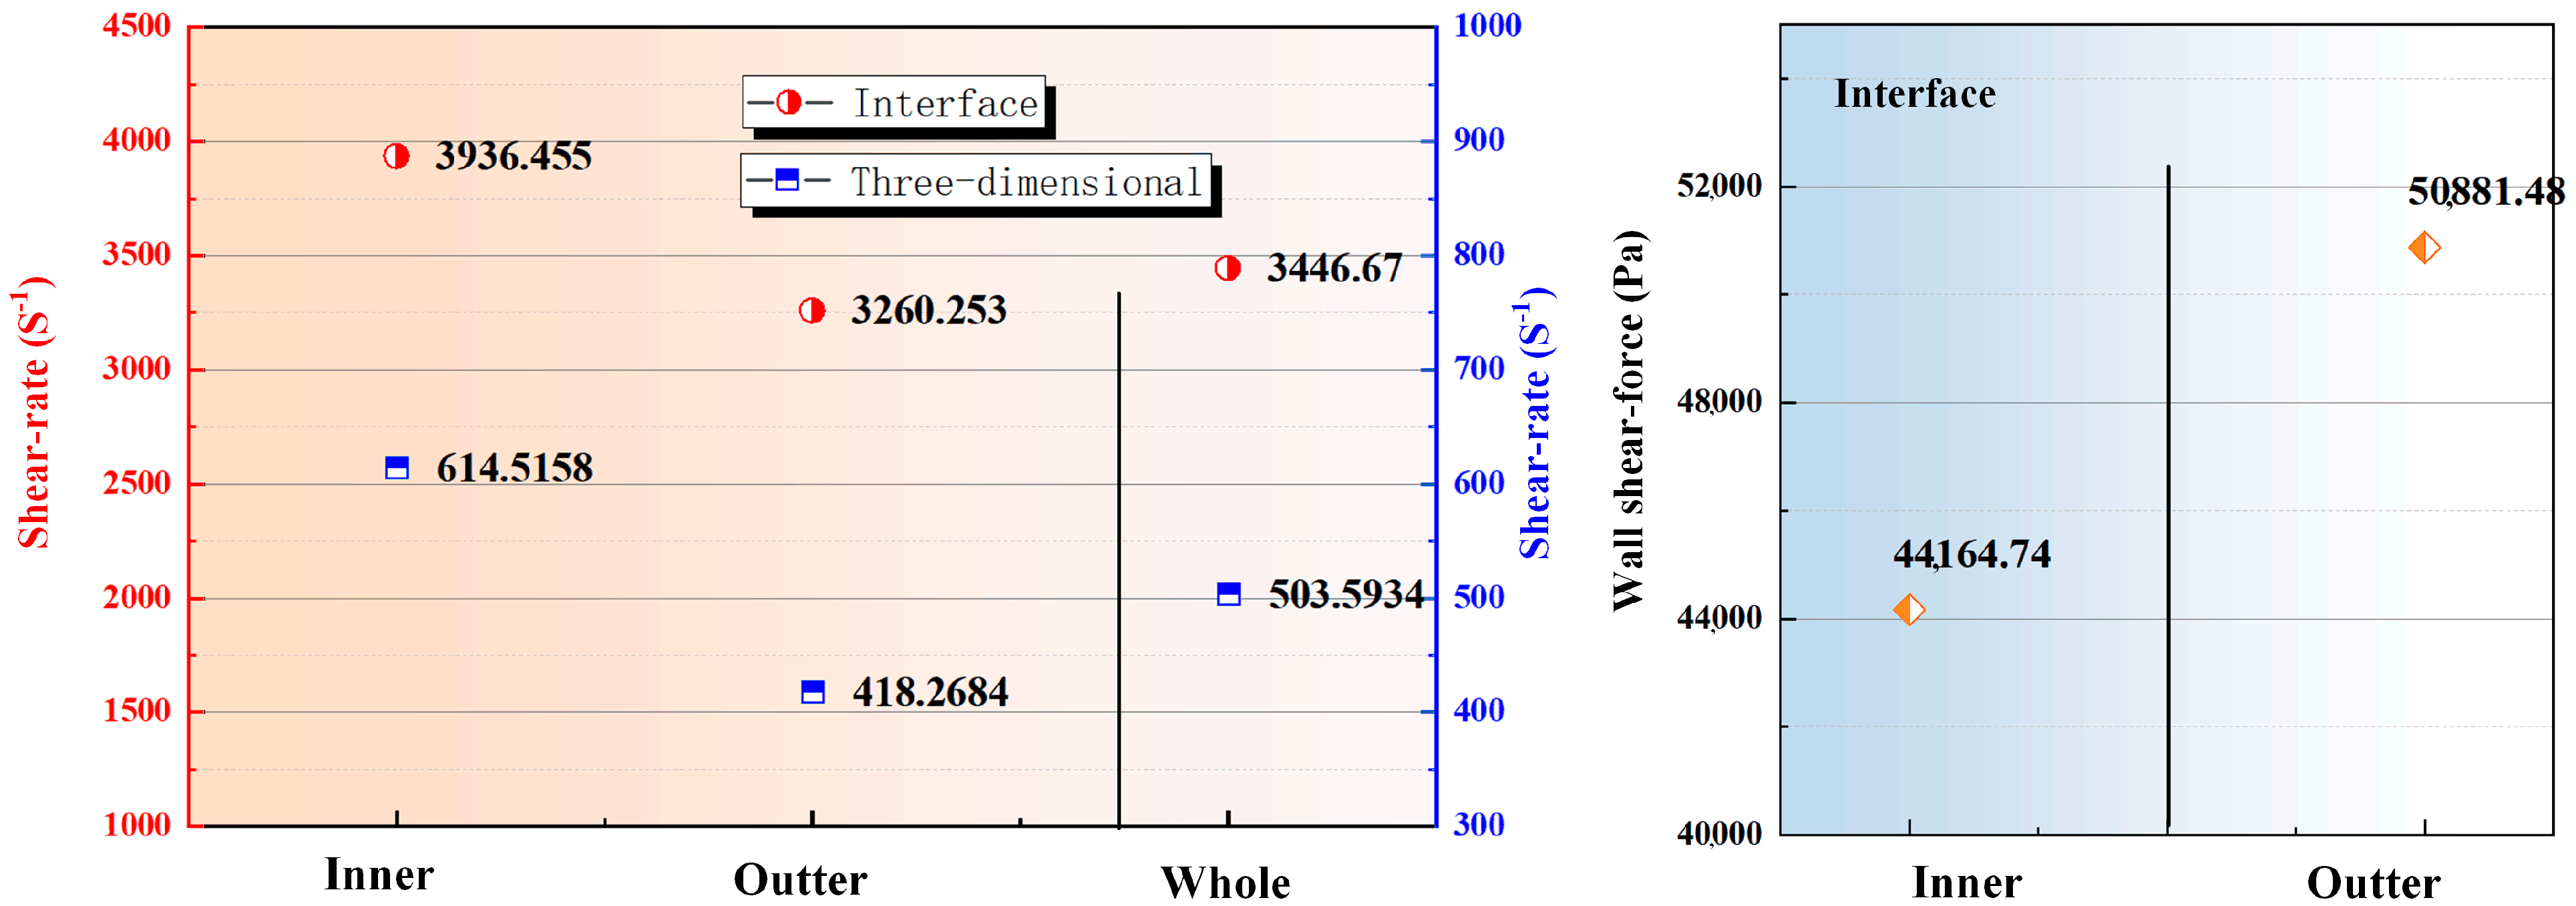
Figure 24 summarizes the shear rate and wall shear stress distribution across the entire flow domain in the shear tool. In the rotor–stator system, the shear rate reaches 40,000 s−1 near the rotor surface, with wall shear stress in the rotating domain at 44,164.7 Pa. In the fixed domain, the wall shear stress is slightly higher, reaching 50,881.48 Pa. These elevated values indicate that the most intense shear forces occur at the interface regions, where the polymer solution experiences the highest shear rates and stresses. This is vital for polymer degradation, viscosity reduction, and improved fluid flow properties.
In the rotating domain, the average shear rate is 613.5 s−1, indicating moderate shear forces within the rotor region. At the interface between the rotating and fixed domains, the shear rate sharply increases to 3936.5 s−1, highlighting the intensity of shear at the contact interface, which is crucial for polymer degradation. In the fixed domain, the average shear rate is 418.3 s−1, but it rises to 3260.3 s−1 at the interface, showing that significant shear forces are concentrated at the boundary layer, essential for polymer breakdown.
For the entire flow field, the average shear rate is 503.6 s−1, with a shear rate of 3446.7 s−1 at the interface, reflecting significant shear at the rotor–stator interface. The wall shear stress in the rotating domain is 44,164.7 Pa, while in the fixed domain, it is slightly higher at 50,881.48 Pa, indicating that the stator exerts slightly more shear force on the polymer solution at the interface.
Three-Dimensional Flow Field Characteristics at 60-Degree and 90-Degree Twisted Contacts

3.3.2. Rotating Flow Domain with 60° and 90° Torsion

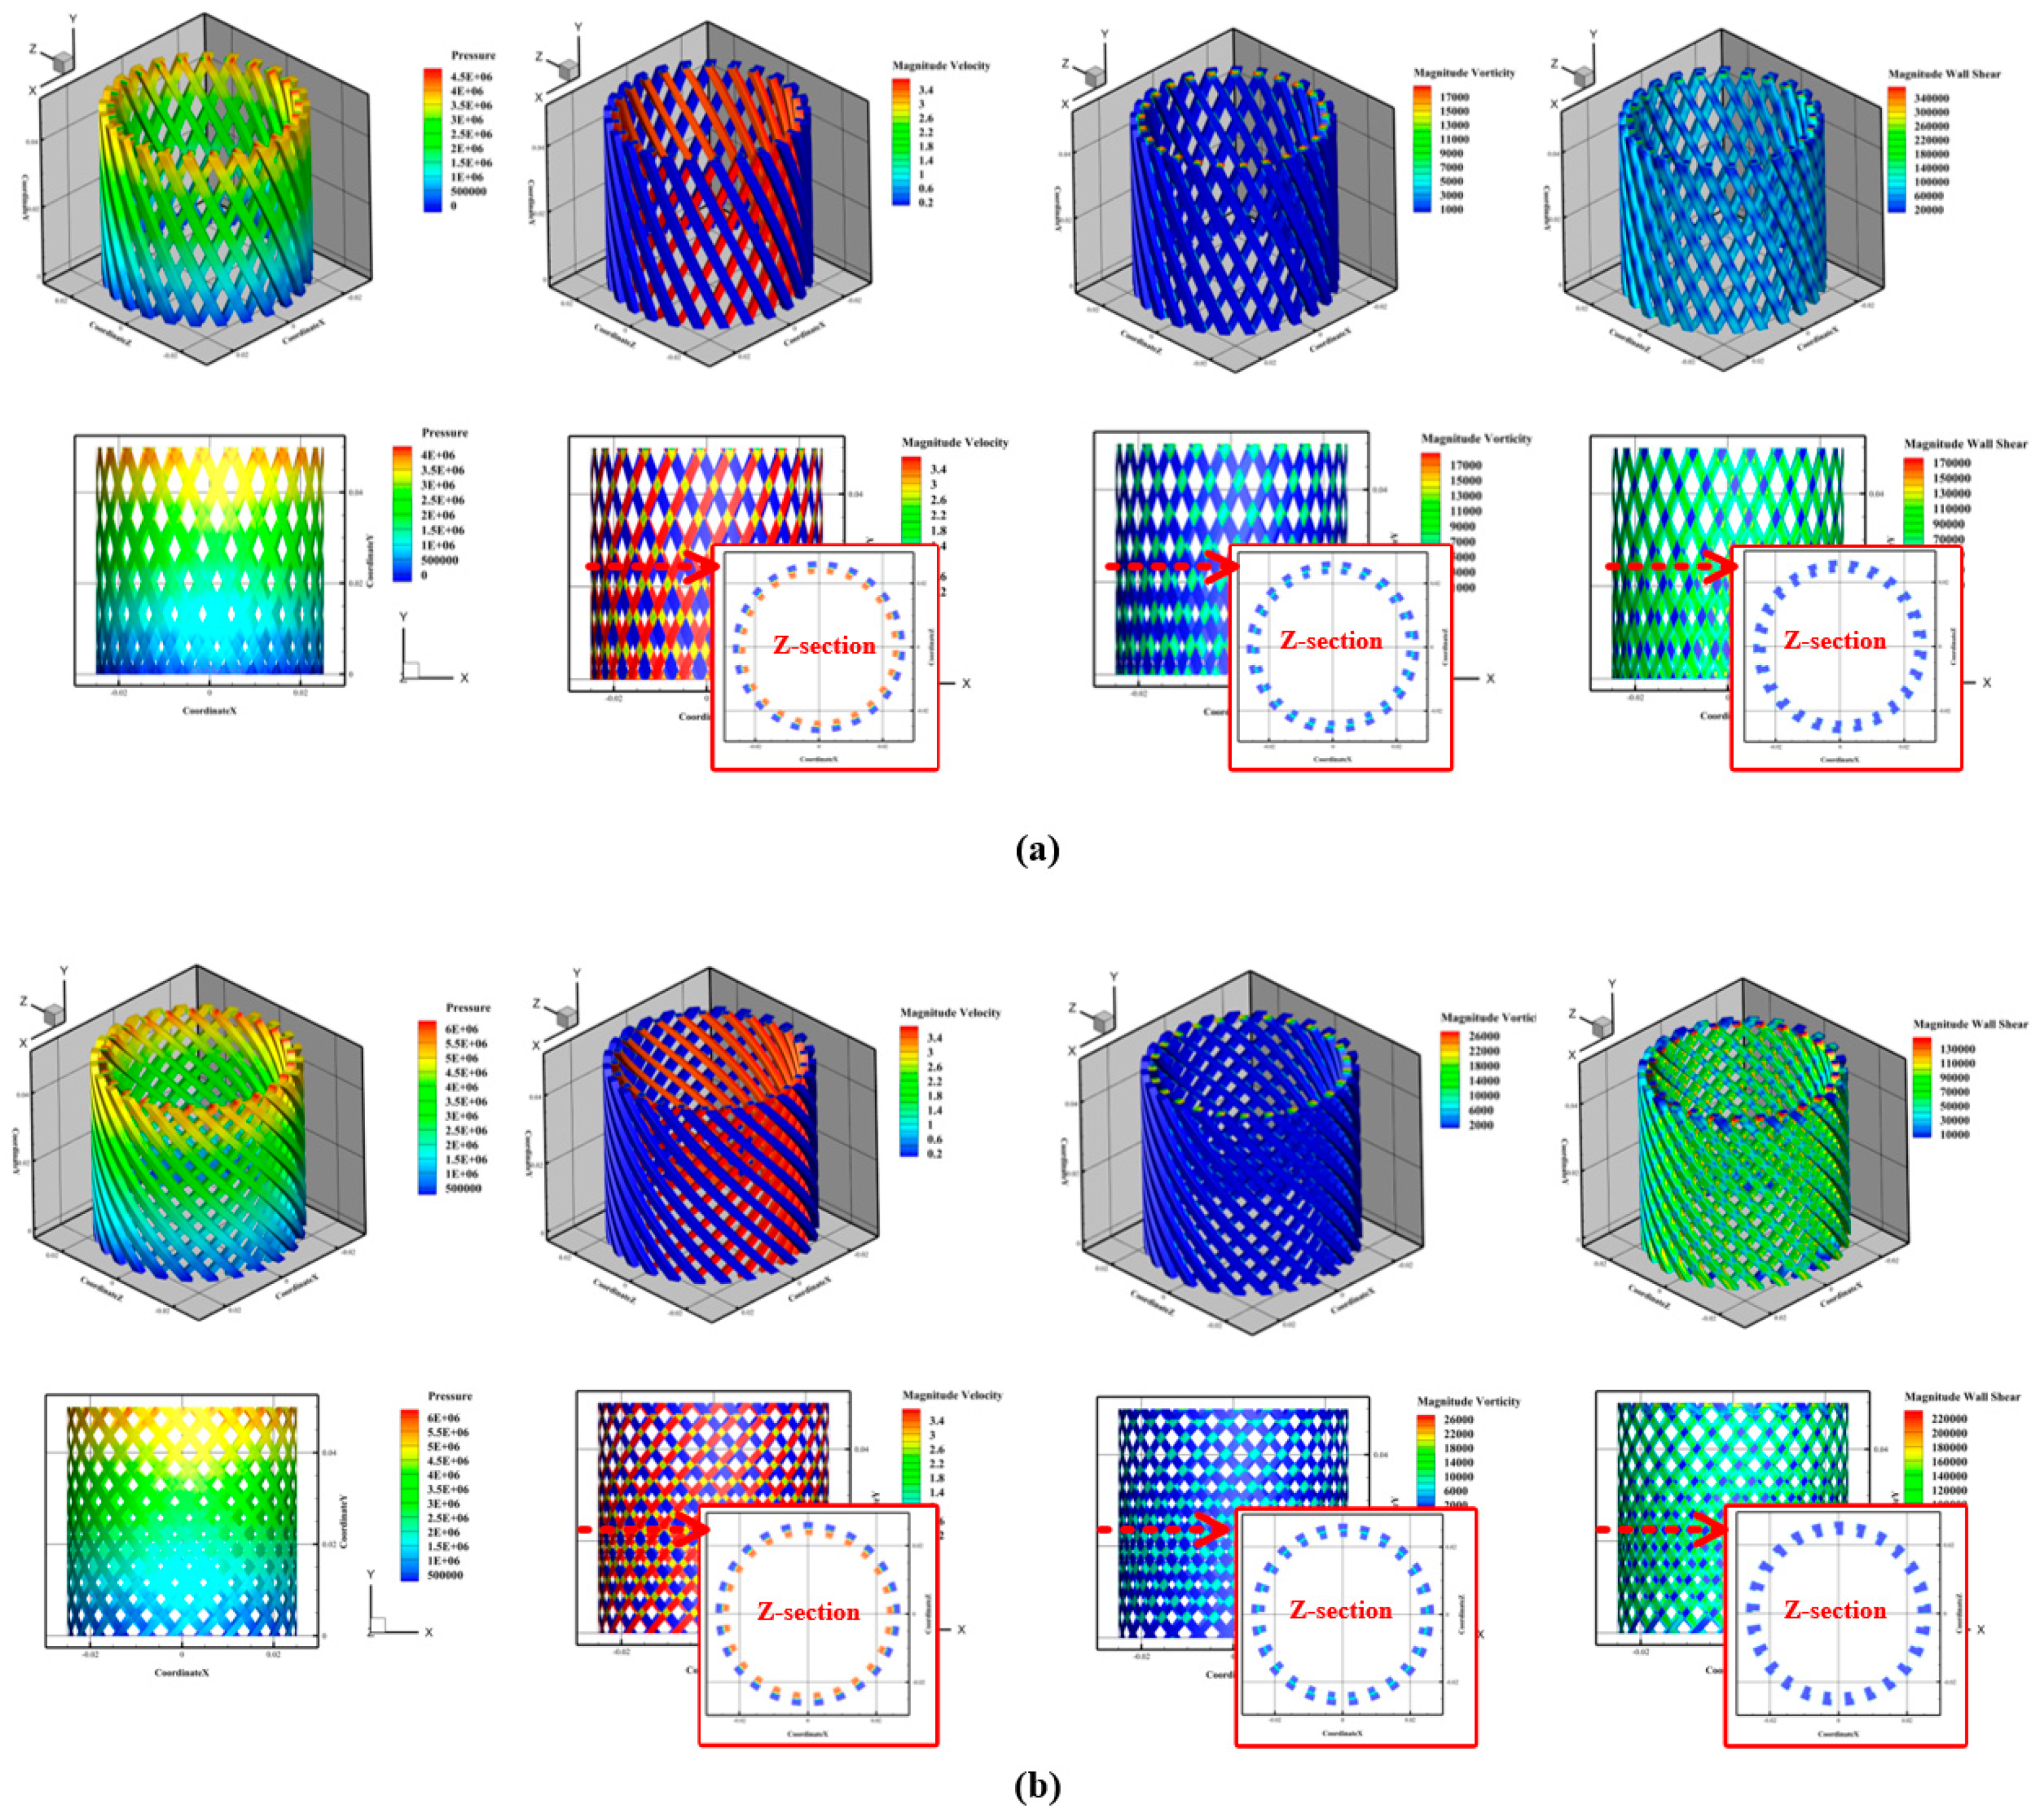
Figure 25 presents the three-dimensional flow field characteristics for the rotor–stator system at 60-degree and 90-degree twisted contact configurations. As the twist angle increases, the velocity difference between the rotor and stator becomes more pronounced, enhancing the shear forces at the interface.
At the 60-degree twisted contact, the rotor surface velocity reaches approximately 3.9 m/s, while the fixed stator velocity is around 2.5 m/s. This results in a significant velocity difference and higher shear forces at the interface. The maximum shear rates are observed at 4285.36 s−1 in the rotating domain and 3505.21 s−1 in the fixed domain, while the wall shear stress increases to 44,164.74 Pa at the inner wall and 50,881.48 Pa at the outer wall.
In the 90-degree twisted contact, the rotor surface velocity increases further to 4.1 m/s, and the stator surface velocity reaches 2.6 m/s. The shear rates at the interface are maximized, with the rotating domain experiencing 4285.36 s−1 and the fixed domain 3483.45 s−1. The wall shear forces are also at their highest, reaching 54,947.58 Pa at the inner wall and 55,285.50 Pa at the outer wall. These increases in shear forces and velocity gradients suggest a more effective polymer degradation and viscosity reduction compared to the 30-degree and 60-degree configurations.
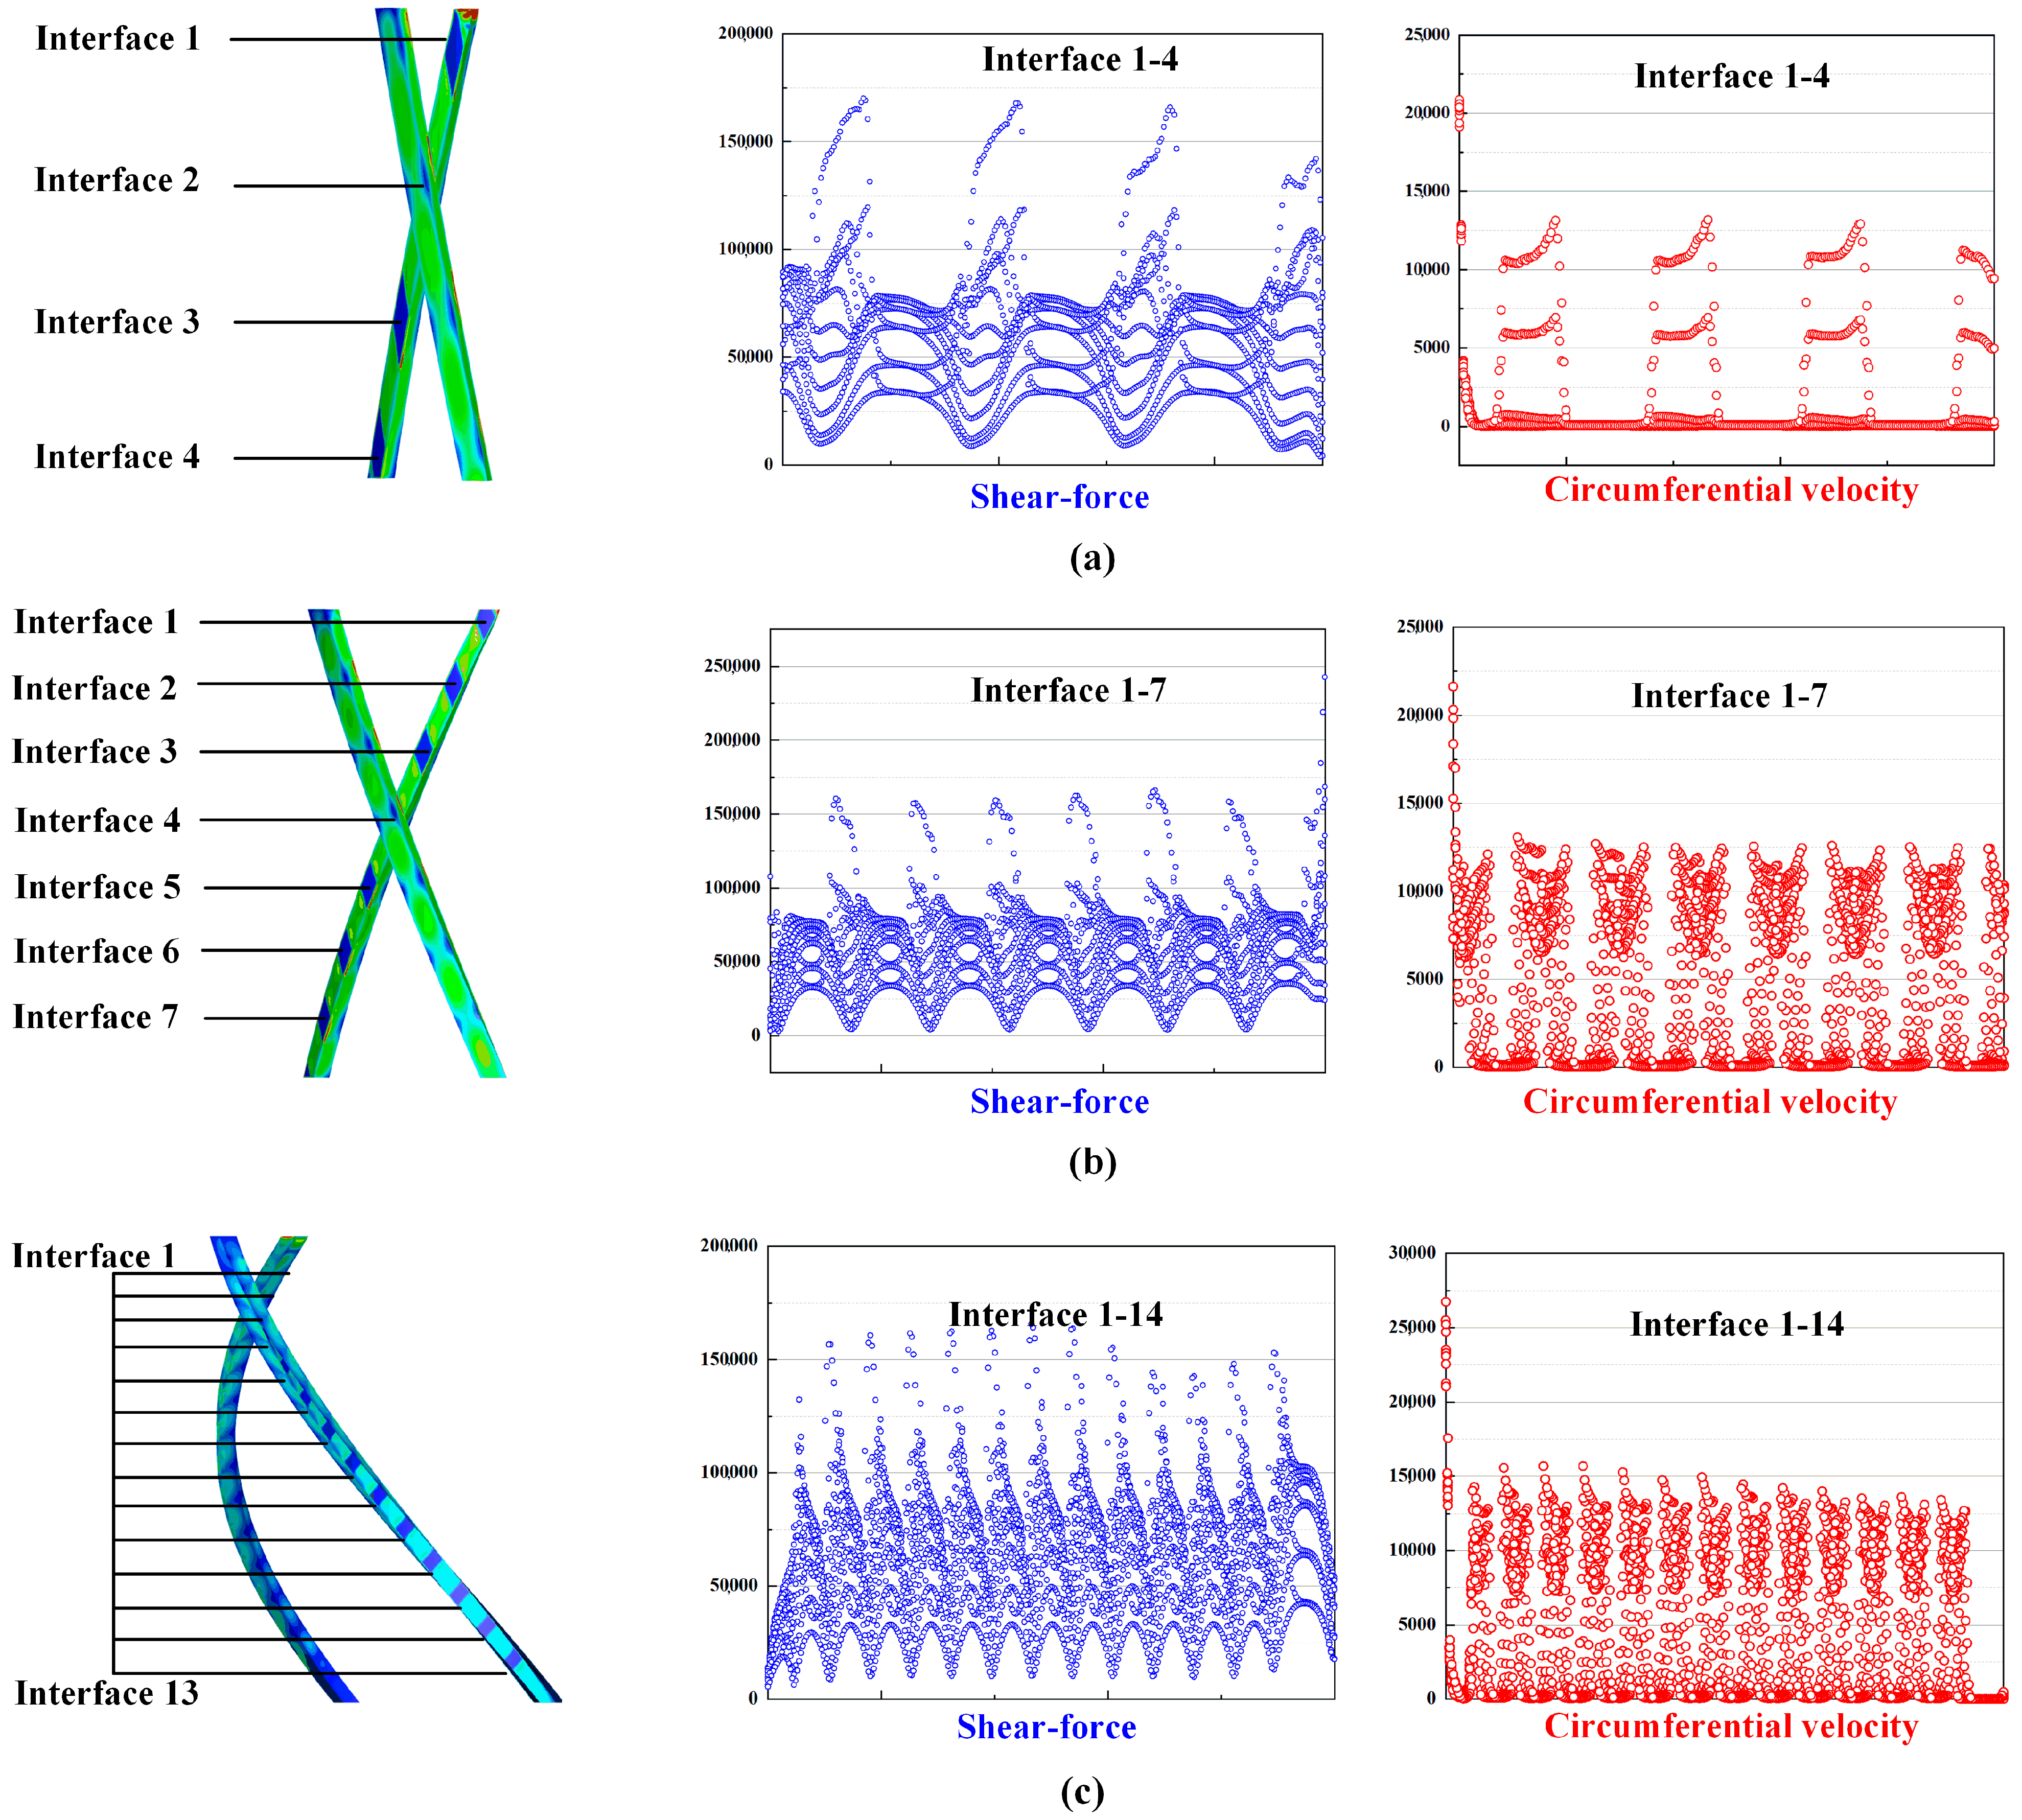
Figure 26 provides a detailed view of the longitudinal flow field characteristics for 30-degree, 60-degree, and 90-degree twisted contacts. This figure demonstrates how shear forces and velocity distributions change along the longitudinal axis (y-axis) at the rotor–stator interface. In the 30-degree twisted contact, as shown in Figure 26a, the shear force and velocity exhibit periodic variation, with the maximum shear force at the contact interface, gradually decreasing along the y-axis. The velocity drops from 3.6 m/s at the rotor surface to 2.4 m/s at the stator surface, creating a shear gradient that is essential for polymer degradation.
For the 60-degree twisted contact (Figure 26b), the shear force variation remains periodic but with a higher peak at the interface due to the increased twist angle. The shear rate at the rotor–stator interface increases to 4285.36 s−1, and the wall shear stress also rises, reflecting the stronger shear forces at the interface. The velocity gradient across the flow field becomes steeper, further enhancing the shear action on the polymer solution. In the 90-degree twisted contact (Figure 26c), the shear variation is most significant, with the highest shear rates at the interface (4285.36 s−1 in the rotating domain and 3483.45 s−1 in the fixed domain). The shear forces at the interface are the highest among the three configurations, with wall shear stresses reaching up to 54,947.58 Pa on the inner wall and 55,285.50 Pa on the outer wall. The periodic shear force variation along the longitudinal axis emphasizes the effective distribution of shear in this configuration.
Shear Rate and Wall Shear Stress in Flow Fields with Three Twisted Angles
Table 4 summarizes the shear rate and wall shear stress values for three twisted angles: 30°, 60°, and 90°. The data reveals how changes in the twist angle impact shear forces and the polymer degradation process. As the twist angle increases, the average shear rate in the rotating domain decreases: 659.16 s−1 for the 30-degree twisted contact, 614.52 s−1 for the 60-degree twisted contact, and 596.76 s−1 for the 90-degree twisted contact. Similarly, the average shear rate in the fixed domain decreases with increasing twist angle: 443.62 s−1 for the 30-degree contact, 418.27 s−1 for the 60-degree contact, and 396.50 s−1 for the 90-degree contact.
The shear rate at the flow field interface remains high at 4285.36 s−1 for all twist angles, reflecting the increased shear intensity with the twist geometry. Regarding wall shear stress, both the inner and outer wall shear stress increase as the twist angle increases. The inner wall shear stress is 37,880.35 Pa for the 30-degree contact, 44,164.74 Pa for the 60-degree contact, and 54,947.58 Pa for the 90-degree contact. Similarly, the outer wall shear stress increases from 44,332.21 Pa at 30 degrees to 50,881.48 Pa at 60 degrees, and 55,285.50 Pa at 90 degrees.
Analysis and Implications for Polymer Degradation
The findings from Figure 24 and Figure 25, along with the data in Table 5, show that increasing the twist angle in the rotor–stator configuration significantly enhances shear forces. Higher shear rates and wall shear stresses at the interface result in more effective polymer degradation. The shear forces are most concentrated at the interface between the rotating and fixed domains, where the highest shear rates and wall shear stresses are observed. The 90-degree twisted contact produces the highest shear forces, with maximum wall shear stresses of 54,947.58 Pa on the inner wall and 55,285.50 Pa on the outer wall. These higher shear forces lead to better polymer degradation and viscosity reduction, improving fluid flow properties. The 60-degree twisted contact offers a balanced approach, with moderately high shear forces, suitable for achieving efficient polymer breakdown while maintaining controlled fluid behavior. The 30-degree twisted contact provides effective shear rates and wall shear stresses, suitable for applications where moderate shear forces are needed.
Predicted viscosity reduction for different rotor–stator configurations
To quantitatively link the simulated shear field to the macroscopic polymer degradation, the viscosity-reduction ratio ( R η ) is correlated with shear rate ( γ ˙ ) through the exponential saturation model established from the 0.5 wt% experimental dataset (Table 4):
R η % = 61.86 1 e 1.75 γ ˙ / 1000 , R 2 = 0.963
Using the simulated shear rates of the whole domain (Table 5), the predicted viscosity reductions for the three twisted flow domains are calculated, as shown in Figure 27. For the 30° structure, with an average shear rate of 537.3 s−1, the predicted viscosity reduction reaches 37.7%. For the 60° structure (γ γ ˙ = 503.6 s−1), the reduction is 36.2%, while for the 90° structure (γ γ ˙ = 483.6 s−1), it is slightly lower at 15.5%. These results demonstrate that all three twisted flow domains induce substantial viscosity reduction in the polymer solution, with the 30° configuration achieving the highest degradation efficiency. The difference between the three designs, however, is not very large (within ~1.3%), suggesting that once the shear rate exceeds approximately 450 s−1, the degradation effect begins to approach a plateau, as predicted by the exponential model.

3.4. Methodological Limitations and Scope of Interpretation

Although this study combines experimental techniques and numerical simulations to analyze the shear-induced degradation of polymer flooding waste liquids (PFWL), certain methodological limitations must be acknowledged to clarify the scope of interpretation.
First, the use of dynamic light scattering (DLS) in semi-dilute polyacrylamide solutions does not directly resolve the absolute chain length of macromolecules, because polymer entanglement and intermolecular interactions lead to non-diffusive modes in the correlation spectra. Nevertheless, DLS remains a widely applied technique for assessing the relative changes in hydrodynamic size or aggregate distribution before and after shear treatment, particularly when interpreted as a comparative rather than absolute measure [34]. In this context, our DLS results are cautiously used to describe relative shifts in polymer aggregate size instead of reporting molecular chain dimensions.
Second, scanning electron microscopy (SEM) observations are performed on freeze-dried samples, which inevitably alters the in-solution conformation of macromolecules. SEM images are, therefore, not intended to represent the real-time orientation of polymer chains in aqueous environments. Instead, they are used to provide complementary insights into morphological changes such as surface roughness, fragmentation, and porosity between untreated and sheared solutions. While the qualitative nature of SEM imposes subjectivity, we have supplemented this with quantitative image analysis (e.g., pore size distributions), which enhances the reliability of structural comparisons [35,36].
Third, in terms of simulation, the computational fluid dynamics (CFD) approach relies on assumptions regarding turbulence modeling and constitutive rheological laws. Although the power-law model effectively reproduces shear-thinning behavior, it does not capture all viscoelastic effects of semi-dilute polymer solutions. This simplification limits the direct transferability of numerical predictions to all field conditions. Nonetheless, previous studies confirm that coupling CFD with degradation models provides valuable guidance for shear tool design and operational optimization in polymer flooding [37].
In summary, while DLS and SEM are subject to methodological constraints, and CFD relies on rheological approximations, their combined application enables a coherent multi-angle analysis of shear-induced degradation. These methods, when interpreted within their proper scope, provide meaningful insights into both the microstructural evolution of PFWL and the engineering implications for tool design and field application.

4. Conclusions

This study establishes a comprehensive framework for understanding shear-induced degradation of polymer flooding waste liquids (PFWL) through integrated experimental characterization and numerical simulation. The experimental results demonstrate that controlled shear treatment effectively reduces solution viscosity by 57–74% across concentrations (0.25–0.75%), with the most pronounced effects observed in lower concentration solutions. Microstructural analysis through quantitative SEM imaging reveals systematic changes post-shearing, including a 50–100% increase in porosity and 15–25% reduction in fractal dimension, which correlate strongly with rheological measurements (R2 = 0.91). These morphological transformations confirm that shear forces preferentially disrupt polymer aggregates and simplify network structures.
Numerical simulations employing the power-law fluid model provide critical insights into the hydrodynamic origins of degradation. This study investigates different contact configurations of rotor–stator flow domains, examines the influence of flow domain structures on the shear behavior of flow fields, and obtains the viscosity reduction effects of shear tools with various structures on polymer solutions. The simulation results clearly identify interfacial shear stress as the primary driver of degradation. The synergy between numerical simulations and experiments confirms that degradation efficiency is determined by local shear intensity rather than bulk flow parameters.
Several important limitations contextualize these findings. While simulated solutions provide controlled rheological behavior, field-collected PFWL contains oils and solids that may modify absolute degradation rates, though prior studies suggest the fundamental shear-driven mechanisms remain valid. The laboratory-scale apparatus, though carefully designed, may not fully capture industrial-scale flow complexities. Furthermore, the persistence of degradation effects—particularly potential viscosity recovery through polymer re-entanglement—requires extended temporal studies beyond the current experimental scope.
These findings carry significant implications for oilfield waste treatment systems. The demonstrated relationship between rotor–stator geometry and degradation efficiency directly inform tool design, revealing that while 90° configurations maximize shear intensity, they incur higher torque demands—a critical trade-off for field deployment. Future work should prioritize field validation of optimized geometries, investigate hybrid chemical–mechanical treatment synergies, and assess the environmental benefits of sheared polymer reuse. By bridging fundamental rheology with practical engineering design, this study advances the development of sustainable PFWL management strategies.

Author Contributions

Conceptualization, B.S., Y.L., and H.W.; methodology, B.S. and H.C.; software, B.S.; validation, B.S. and W.L.; formal analysis, Y.L. (Yubao Li); investigation, S.M.; resources, X.W.; data curation, W.L.; writing—original draft preparation, B.S.; writing—review and editing, Y.L. (Yanxin Liu); visualization, B.S.; supervision, Y.L. (Yanxin Liu) and H.W.; project administration, Y.L. (Yubao Li); funding acquisition, Y.L. (Yanxin Liu). All authors have read and agreed to the published version of the manuscript.

Funding

This research was funded by Science and Technology Research Project of China Petrochemical Corporation: Research on High—Efficiency Completion Technology for Thermal Recovery of Heavy Oil, grant number P23045.

Data Availability Statement

The original contributions presented in the study are included in the article; further inquiries can be directed to the corresponding author.

Conflicts of Interest

Authors Wei Lv and Yubao Li are affiliated with Research Institute of Petroleum Engineering Technology, Shengli Oilfield. The author Han Cao is affiliated with CNOOC Research Institute. The remaining authors declare that the research was conducted in the absence of any commercial or financial relationships that could be construed as a potential conflict of interest.

Abbreviations

The following abbreviations are used in this manuscript:
PFWLPolymer flooding waste liquids
EORPolymer flooding is an enhanced oil recovery

References

  1. Andrews, W.; Bradley, S.; Reed, P.; Salehi, M.; Chappell, D. Enhanced Polymer Flooding—Reservoir Triggering Improves Injectivity and Eliminates Shear Degradation. In Proceedings of the IOR 2017–19th European Symposium on Improved Oil Recovery, Strasbourg, France, 24–27 April 2017; European Association of Geoscientists & Engineers: Bunnik, The Netherlands, 24–27 April 2017; pp. 1–18. [Google Scholar] [CrossRef]
  2. Chu, L.; Wang, J. Pretreatment of alkali/surfactant/polymer (ASP)-flooding produced wastewater by electron beam radiation to improve oil-water separation. Chemosphere 2024, 351, 141252. [Google Scholar] [CrossRef]
  3. Husveg, T.; Stokka, M.; Husveg, R.; Jouenne, S. The Development of a Low-Shear Valve Suitable for Polymer Flooding. SPE J. 2020, 25, 2632–2647. [Google Scholar] [CrossRef]
  4. Malkin, A.Y. Shear-induced transitions in colloidal and polymeric liquids. Adv. Colloid Interface Sci. 2021, 290, 102381. [Google Scholar] [CrossRef] [PubMed]
  5. Herrera, J.J.; Prada, L.C.; Maya, G.A.; Gomez-Vergel, J.L.; Castro, R.H.; Quintero, H.I.; Jimenez, R.; Perez, E.E. CFD simulation of HPAM EOR solutions mechanical degradation by restrictions in turbulent Flow. CT&F-Cienc. Tecnol. Futuro 2020, 10, 115–129. [Google Scholar]
  6. Xin, X.; Yu, G.; Ma, R.; Wu, K.; Chen, Z. Effect of Polymer Degradation on Polymer Flooding in Homogeneous Reservoirs. In Proceedings of the 2018 3rd International Conference on Materials Engineering, Manufacturing Technology and Control (ICMEMTC 2018), MATEC Web of Conferences. Bangkok, Thailand, 6 August 2018; EDP Sciences: Les Ulis, France, 2018; Volume 187, p. 01006. [Google Scholar] [CrossRef]
  7. Dupas, A.; Hénaut, I.; Rousseau, D.; Poulain, P.; Tabary, R.; Argillier, J.; Aubry, T. Impact of Polymer Mechanical Degradation on Shear and Extensional Viscosities: Toward Better Injectivity Forecasts in Polymer Flooding Operations. In Proceedings of the SPE International Conference on Oilfield Chemistry, The Woodlands, TX, USA, 8–9 April 2013. Paper SPE-164083. [Google Scholar] [CrossRef]
  8. Sin, S.; Wang, W.; She, Y.; Patmonoaji, A.; Suekane, T. Enhanced oil recovery by using polymer flooding with shear-thinning property and in-situ chemical reaction. In Proceedings of the THERMOFLUID XII: The 12th International Conference on Thermofluids, Yogyakarta, Indonesia, 10–11 November 2021; AIP Publishing: Melville, NY, USA, 2023; p. 020001. [Google Scholar] [CrossRef]
  9. Stavland, A.; Åsen, S.; Mebratu, A.; Gathier, F. Scaling of Mechanical Degradation of EOR Polymers: From Field-Scale Chokes to Capillary Tubes. SPE Prod. Oper. 2020, 36, 43–56. [Google Scholar] [CrossRef]
  10. Ghosh, P.; Mohanty, K. Laboratory treatment of HPAM polymers for injection in low permeability carbonate reservoirs. J. Pet. Sci. Eng. 2020, 185, 106574. [Google Scholar] [CrossRef]
  11. Scott, A.; Romero-Zerón, L.; Penlidis, A. Evaluation of Polymeric Materials for Chemical Enhanced Oil Recovery. Processes 2020, 8, 361. [Google Scholar] [CrossRef]
  12. Xin, X.; Yu, G.; Chen, Z.; Wu, K.; Dong, X.; Zhu, Z. Effect of Polymer Degradation on Polymer Flooding in Heterogeneous Reservoirs. Polymers 2018, 10, 857. [Google Scholar] [CrossRef]
  13. Xin, X.; Yu, G.; Wu, K.; Dong, X.; Chen, Z. Polymer Flooding in Heterogeneous Heavy Oil Reservoirs: Experimental and Simulation Studies. Polymers 2021, 13, 2636. [Google Scholar] [CrossRef]
  14. Yang, Y.; Shu, Z.; Ye, Z.; Wang, X.; Wang, Z.; Liang, S. An Improved Study of Near-well Zone Flooding for Polymer Solution through the Mechanical Shearing and Forchheimer Flow Simulation. Mater. Today Commun. 2024, 38, 107634. [Google Scholar] [CrossRef]
  15. Al-Shakry, B.; Skauge, T.; Shiran, S.; Skauge, A. Impact of Mechanical Degradation on Polymer Injectivity in Porous Media. Polymers 2018, 10, 742. [Google Scholar] [CrossRef] [PubMed]
  16. Al-Shakry, B.; Skauge, T.; Shaker Shiran, B.; Skauge, A. Polymer injectivity: Investigation of mechanical degradation of enhanced oil recovery polymers using in-situ rheology. Energies 2018, 12, 49. [Google Scholar] [CrossRef]
  17. Jiao, G.; Zhu, S.; Ye, Z.; Shu, Z.; Wang, X.; Wang, D. The Effect of Shear on the Properties of an Associated Polymer Solution for Oil Displacement. Polymers 2023, 15, 616. [Google Scholar] [CrossRef] [PubMed]
  18. Rambeau, O.; Alves, M.; Andreu, N.; Loriau, M.; Passade-Boupat, N. Management of Viscosity of the Back Produced Viscosified Water. In Proceedings of the SPE EOR Conference at Oil and Gas West Asia, Muscat, Oman, 21–23 March 2016. Paper SPE-179776-MS. [Google Scholar] [CrossRef]
  19. Chen, R.; Qi, M.; Zhang, G.; Yi, C. Comparative experiments on polymer degradation technique of produced water of polymer flooding oilfield. In Proceedings of the 2017 7th International Conference on Energy, Environment and Sustainable Development (ICEESD 2017), Shenzhen, China, 30–31 December 2017; IOP Conference Series: Earth and Environmental Science. IOP Publishing: Bristol, England, 2018; Volume 113, p. 012208. [Google Scholar] [CrossRef]
  20. Chen, B.; Zhao, L.; Duan, M.; Yao, M.; Fang, S.; Wang, C.; Chen, S. The chemical degradation of the oil sludge produced from polymer flooding in offshore oilfield. Energy Sci. Eng. 2018, 6, 484–489. [Google Scholar] [CrossRef]
  21. Cao, D.; Han, M.; Leng, Z.; Wang, J. Study on polymer mechanical degradation in core plugs versus in capillary tubes. J. Pet. Explor. Prod. Technol. 2022, 13, 111–121. [Google Scholar] [CrossRef]
  22. Peng, P.; Wang, G.; Li, L.; Ge, H.; Jin, H.; Guo, L. Experimental investigation on the degradation of polymer-containing oily sludge in sub-/supercritical water. Energy Sources Part A Recovery Util. Environ. Eff. 2023, 45, 1983–1993. [Google Scholar] [CrossRef]
  23. Sun, B.; Wang, H.; Shen, F.; Ren, J.; Yi, Y.; Wang, Y. Effect of Solid Particles in Polymer Waste Liquid on Grinding Tool Wall Erosion. J. Phys. Conf. Ser. 2024, 2834, 012016. [Google Scholar] [CrossRef]
  24. Díaz, F.; Torne, J.; Prada, A.; Perez, G. Shear degradation model of HPAM solutions for the design of regulator valves in polymer flooding EOR. J. Pet. Explor. Prod. Technol. 2020, 10, 2587–2599. [Google Scholar] [CrossRef]
  25. Ghosh, P.; Wilton, R.; Bowers, A.; O’brien, T.; Cao, Y.; Wilson, C.; Metidji, O.; Dupuis, G.; Ravikiran, R. Reinjection of Produced (Sheared) Polymer in a Canadian Viscous Oil Reservoir: Considerations to Improve Economics and Reduce Carbon Footprint. SPE J. 2022, 28, 251–267. [Google Scholar] [CrossRef]
  26. Kumar, S.; Tiwari, R.; Husein, M.; Yadav, U. Enhancing the Performance of HPAM Polymer Flooding Using Nano CuO/Nanoclay Blend. Processes 2020, 8, 907. [Google Scholar] [CrossRef]
  27. Liu, Y.; Hou, J.; Cao, X.; Wei, B.; Ji, Y.; Wang, H. Laboratory studies of the feasibility for microencapsulated polymer flooding. Fuel 2023, 354, 129378. [Google Scholar] [CrossRef]
  28. Alfazazi, U.; Mushtaq, M.; Thomas, N.; Al-Shalabi, E.; Alameri, W.; Masalmeh, S.; AlSumaiti, A. Polymer Injectivity in Low Permeability Carbonate Cores: Impacts of Polymer Filtration, Mechanical Shearing, and Oil Presence. In Proceedings of the SPE Improved Oil Recovery Conference, Tulsa, OK, USA, 21–23 April 2024; Paper SPE-218233-MS. [Google Scholar] [CrossRef]
  29. Li, B.; Guo, Y.; Steeman, P.; Bulters, M.; Yu, W. Shear-induced breakdown and agglomeration in nanoparticles filled polymer: The shift of phase boundary and kinetics. J. Rheol. 2021, 65, 291–309. [Google Scholar] [CrossRef]
  30. Shi, L.; Zhu, S.; Ye, Z.; Xue, X.; Liu, C.; Lan, X. Effect of microscopic aggregation behavior on polymer shear resistance. J. Appl. Polym. Sci. 2020, 137, 48670. [Google Scholar] [CrossRef]
  31. Rousseau, D.; Hénaut, I.; Dupas, A.; Poulain, P.; Tabary, R.; Argillier, J.; Aubry, T. Impact of Polymer Mechanical Degradation on Shear and Extensional Viscosities. In Proceedings of the IOR 2013-17th European Symposium on Improved Oil Recovery, St. Petersburg, Russia, 16–18 April 2013; European Association of Geoscientists & Engineers: Utrecht, The Netherlands, 2013; p. cp-342. [Google Scholar] [CrossRef]
  32. Shankar, V.; Sharma, G. Decoding the Impact of Injection-Induced Fractures on the Sweep Efficiency of a Mature Polymer Flood through Pressure Falloff Analysis. SPE Reserv. Eval. Eng. 2022, 26, 348–364. [Google Scholar] [CrossRef]
  33. Jouenne, S.; Klimenko, A.; Levitt, D. Polymer Flooding: Establishing Specifications for Dissolved Oxygen and Iron in Injection Water. SPE J. 2016, 22, 438–446. [Google Scholar] [CrossRef]
  34. Ghosh, P.; Johns, M.L.; Barentin, C.; Gaillard, N. Rheological properties of partially hydrolyzed polyacrylamide (HPAM) solutions in the presence of surfactants and salts. J. Pet. Sci. Eng. 2020, 184, 106464. [Google Scholar] [CrossRef]
  35. Hou, Y.; Kovács, N.; Xu, H.; Pletcher, D.; Russell, A.E. Limitations of identical location SEM as a method of degradation studies on surfactant capped nanoparticle electrocatalysts. J. Catal. 2021, 395, 1–10. [Google Scholar] [CrossRef]
  36. Arnoult, C.; Di Martino, J.; Ruch, D. Prediction and limitation of polymer degradation in Environmental SEM. Ultramicroscopy 2012, 123, 1–7. [Google Scholar] [CrossRef]
  37. Wang, J.; Wang, T.-T.; Luo, Z.-H.; Zhou, Y.-N. Simulation of irreversible and reversible degradation kinetics of linear polymers using sectional moment method. Chem. Eng. Sci. 2023, 275, 118704. [Google Scholar] [CrossRef]
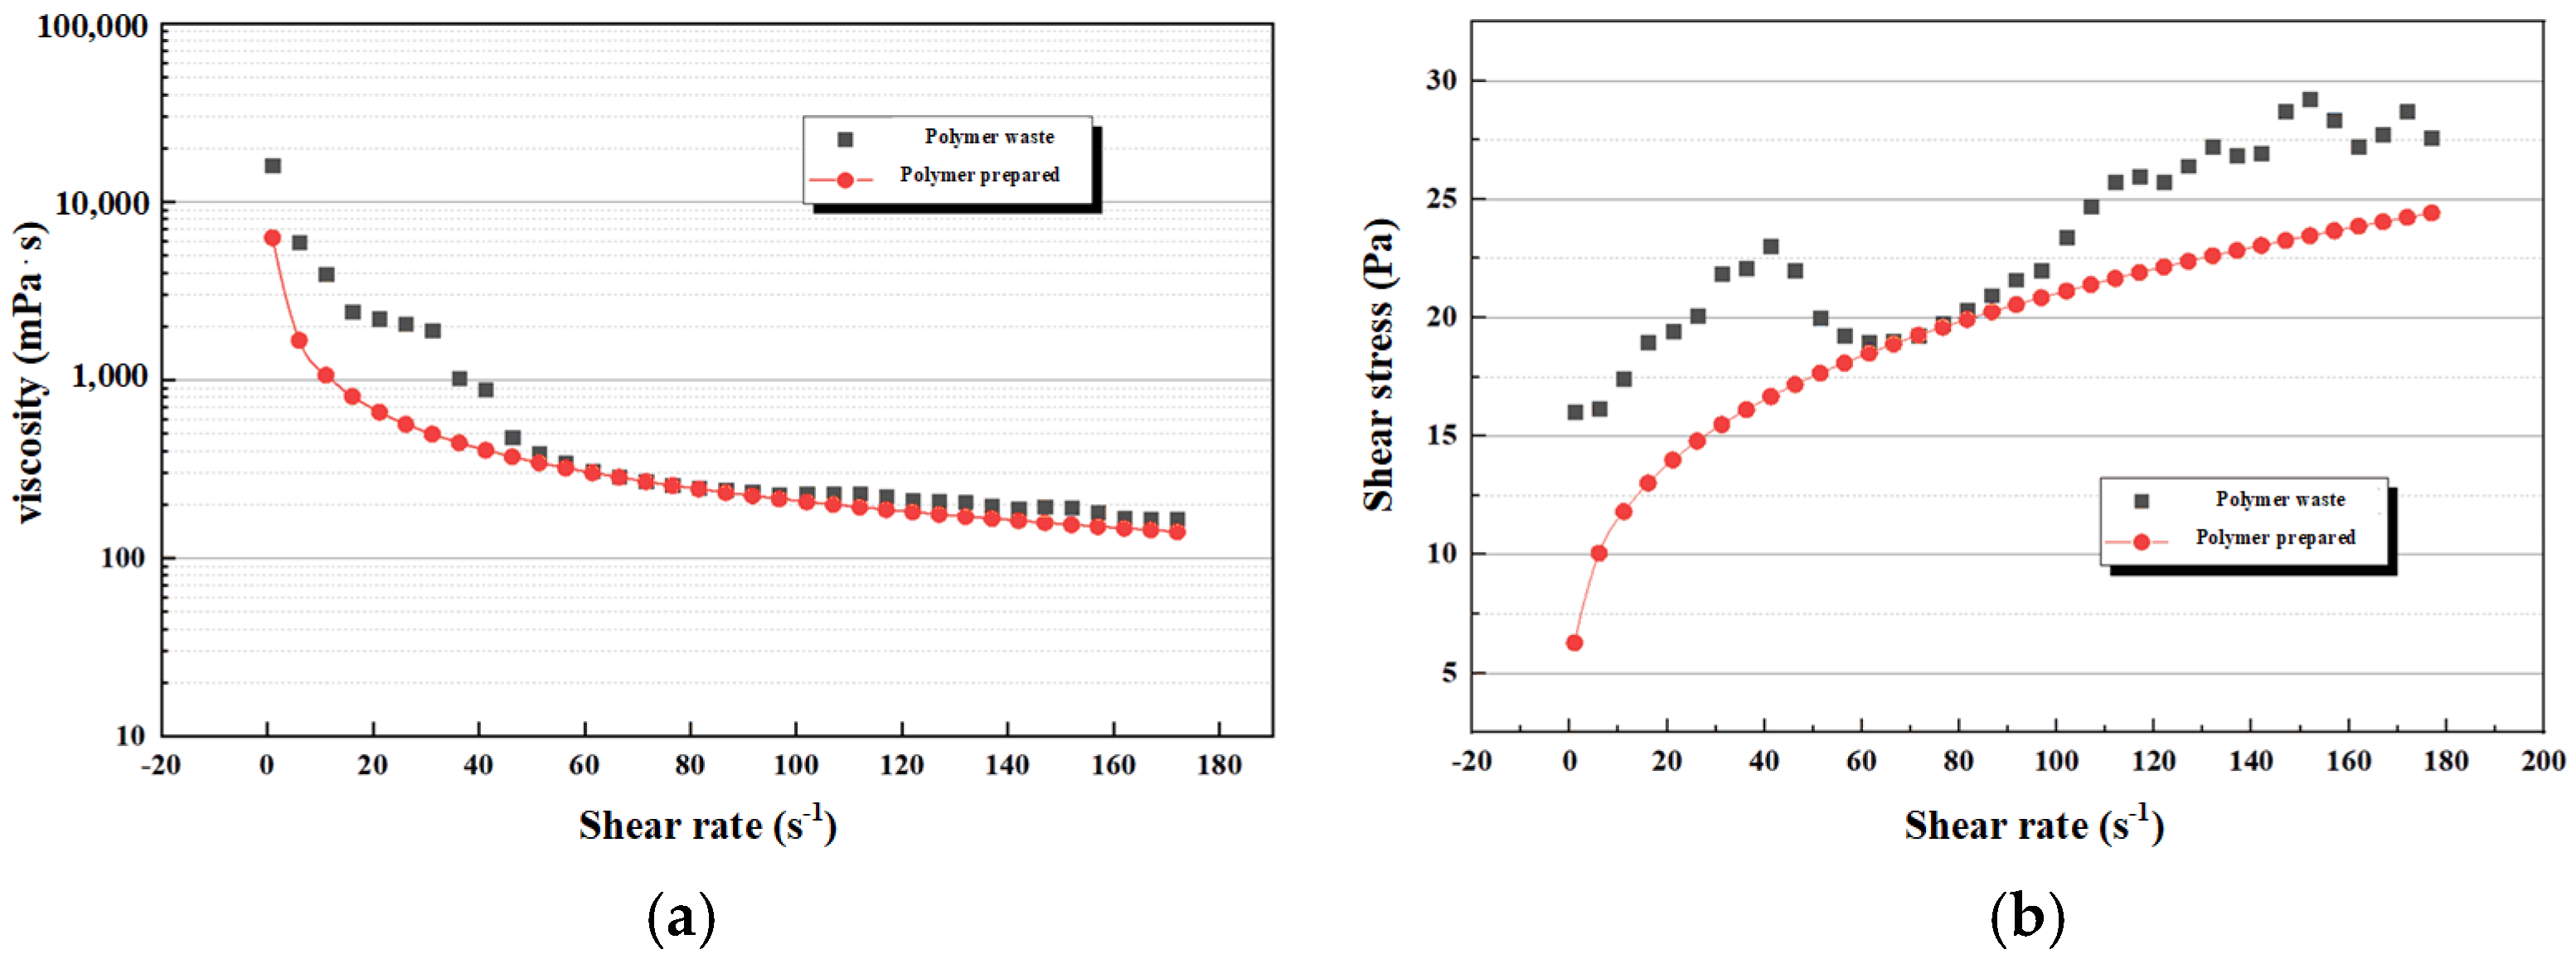
Figure 1. Sample rheological parameters: (a) Viscosity and shear-rate; and (b) Shear-stress and shear-rate.
Processes 13 02677 g001
Figure 2. Schematic Diagram of Shearing Tool Shearing Polymer Solution Experiment.
Processes 13 02677 g002
Figure 3. Shearing Tool Rotor Flow Domain.
Processes 13 02677 g003
Figure 4. Mesh quantity and model accuracy verification: (a) Grid independence verification; and (b) Model validation.
Processes 13 02677 g004
Figure 5. Shear rate−viscosity curves at different temperatures: (a) 0.25%, (b) 0.5%, and (c) 0.75%.
Processes 13 02677 g005
Figure 6. Particle size−Scattering intensity curve of solutions with different concentrations: (a) 0.25%, (b) 0.5%, (c) 0.75%.
Processes 13 02677 g006
Figure 7. Particle size−Volume distribution curve of solutions with different concentrations: (a) 0.25%, (b) 0.5%, (c) 0.75%.
Processes 13 02677 g007
Figure 8. Particle size−Number distribution curve of solutions with different concentrations: (a) 0.25%, (b) 0.5%, (c) 0.75%.
Processes 13 02677 g008
Figure 9. SEM−images of 0.25% polymer simulation solution after shearing (a) magnified 100×, and (b) magnified 200×.
Processes 13 02677 g009
Figure 10. SEM−images of 0.50% polymer simulation solution after shearing (a) magnified 100×, and (b) magnified 200×.
Processes 13 02677 g010
Figure 11. SEM−images of 0.75% polymer simulation solution after shearing (a) magnified 50×, and (b) magnified 200×.
Processes 13 02677 g011
Figure 12. Contour plot of flow field characteristics in the rotating domain of the rotor: (a) pressure, (b) shear force, (c) tangential velocity, (d) vorticity, (e) 0.5% and (f) shear force.
Processes 13 02677 g012
Figure 13. The flow field characteristics of different contact forms (T1–T5) within a single flow field exchange cycle, as well as the flow field velocity and shear stress distributions in the main regions.
Processes 13 02677 g013
Figure 14. Vorticity distribution in flow domains with different contact forms.
Processes 13 02677 g014
Figure 15. Mechanism of flow field shear action on polymer molecules during a single flow field exchange cycle.
Processes 13 02677 g015
Figure 16. Flow field of single rotating domain interacting with double fixed domains of single flow field exchange cycle.
Processes 13 02677 g016
Figure 17. Flow field characteristics: (a) shear rate distribution, (b) shear stress distribution.
Processes 13 02677 g017
Figure 18. Flow field of dual rotating domains interacting with the same fixed domain of single flow field exchange cycle.
Processes 13 02677 g018
Figure 19. Flow field characteristics, shear rate distribution, and shear stress distribution: (a) shear rate distribution, (b) shear stress distribution.
Processes 13 02677 g019
Figure 20. Vorticity and shear rate of flow fields under two contact forms: (a) single rotating domain−two fixed domains, (b) double rotating domains−single fixed domain.
Processes 13 02677 g020
Figure 21. Three-dimensional flow field characteristics of rotor and stator—30−degree twisted contact: (a) pressure, (b) magnitude velocity, (c) magnitude vorticity, (d) magnitude wall shear.
Processes 13 02677 g021
Figure 22. Flow field characteristics of Z cross−section at rotor−stator flow field interface−30 degree twisted contact: (a) magnitude wall shear, (b) magnitude vorticity, (c) magnitude velocity, (d) pressure.
Processes 13 02677 g022
Figure 23. Velocity, wall shear, shear rate distribution in the flow domain, and Y−section: (a) magnitude wall shear, (b) magnitude velocity, (c) velocity.
Processes 13 02677 g023
Figure 24. Shear rate and wall shear stress value of the flow domain in shearing tool.
Processes 13 02677 g024
Figure 25. Three-dimensional flow field characteristics of rotor and stator: (a) 60-degree twisted contact; and (b) 90-degree twisted contact.
Processes 13 02677 g025
Figure 26. Longitudinal flow field characteristics of rotor–stator contact: (a) 30-degree twisted contact, (b) 60-degree twisted contact, and (c) 90-degree twisted contact.
Processes 13 02677 g026
Figure 27. Comparison of viscosity reduction effects of polymer solutions in different twisted flow domains.
Processes 13 02677 g027
Table 1. Comparison between PFWL and configured polymer solution.
ParametersPFWL0.5% Simulated SolutionRelative Error
μ (Pa·s)12.712.14.7%
Power-law index (n)0.280.267.1%
γ ˙ c (s−1)8.59.28.2%
Table 2. Experimental and Numerical Simulation Parameter Settings.
ParametersDimension, mm
Single-shear solution volume1 L
Shearing time, Ts10 min
Motor speed, ω m 1450 rpm
Flow rate inlet, Q p 1.667 × 10⁻⁴ kg/s
Rotate domain, ω d 151.8 rad/s
Density, ρ p 1031 kg/m3
Consistency coefficient, K16,386 Pa s
Flow behavior index, n0.276
Table 3. Apparent viscosity of polymer simulation solution before and after shearing.
Concentration of Polymer Flooding Simulation Fluid/%Viscosity Before Shearing/mPa·sViscosity After Shearing/mPa·sViscosity Reduction Rate/%
0.2599325774.1
0.5164759763.8
0.752844122357
Table 4. Viscosity data of 0.5% concentration polymer solution under different shear rates.
Shear Rate γ ˙ (s−1) Viscosity   Before   Shearing   η 0 (mPa·s)Viscosity After Shearing η (mPa·s)Viscosity Reduction Rate/%
10048.040.515.6
30046.234.824.6
60044.828.037.5
90043.522.049.4
120042.018.855.2
Table 5. Shear rate and shear stress inside flow fields with three torsion angles.
30°60°90°
Shear-rate (s−1)Rotating flow domain (rotor)659.1554614.5158596.7599
Fixed flow domain (stator)443.6194418.2684396.5019
Whole domain537.3301503.5934483.5736
Flow field interface of rotating domain4285.3583936.4553526.047
Flow field interface of fixed domain3505.2143260.2533483.451
Wall shear force (Pa)Inner wall shear force37,880.3544,164.7454,947.58
Outter wall shear force44,332.2150,881.4855,285.5
Disclaimer/Publisher’s Note: The statements, opinions and data contained in all publications are solely those of the individual author(s) and contributor(s) and not of MDPI and/or the editor(s). MDPI and/or the editor(s) disclaim responsibility for any injury to people or property resulting from any ideas, methods, instructions or products referred to in the content.