Abstract
The faults in the post-rift period have an important controlling effect on the migration and accumulation of oil and gas in the shallow strata of Bohai Bay Basin. Based on the seismic interpretation data of Bozhong 19-6 Structural Belt, this paper analyzes the geometric characteristics and growth history of the faults in the post-rift period and inverts the tectonic paleostress that caused the fault activities in the post-rift period. Finally, the developmental characteristics of the faults in the post-rift period are deeply understood from three aspects: fault geometry, kinematics, and dynamics. In the study area, the trend of post-rift faults are mainly east–west, followed by NEE. According to the fault activity, it can be divided into three types: newly formed faults, long-term active faults, and deep-linked faults. The latter two types are faults that existed before and then reactivated during post-rifted period. The inversion result of the Neogene is the strike-slip stress field, showing that the intermediate principal stress axis (σ2) is oriented vertically, the minimum principal stress (σ3) is oriented N170°, the maximum principal stress axis (σ1) is oriented N80°, and σ3/σ1 = 0.24, σ2/σ1 = 0.62. The data used in this inversion method is easily obtained in the oil and gas industry, and the inversion results can provide an important reference for analyzing the regional tectonic evolution and clarifying the fault activity at the key moment of oil and gas accumulation.
1. Introduction
The BZ19-6 Structural Belt is a key target area for oil and gas exploration in the Bohai Bay Basin. Vertically, this region displays characteristics of oil accumulation above and gas below. In recent years, deep buried hills have revealed large gas fields with reserves on the order of hundreds of billions of cubic meters. Influenced by recent tectonic movements, there has been intense fault activity in the later stages, primarily manifesting as crude oil accumulation in the shallow Neogene layers [1]. The main period of hydrocarbon accumulation in this area corresponds to the late Minghuazhen Formation [2], where fault activity during the post-rift tectonic phase aligns with the peak hydrocarbon generation period of the source rocks. This synchronization facilitates the migration and accumulation of hydrocarbons into shallow traps, playing a crucial role in the formation of Neogene reservoirs. Therefore, clarifying the fault development features and mechanisms during the post-rift period is significant for guiding oil and gas exploration and development.
Previous studies on the structural evolution of the BZ19-6 buried hill have been extensive [3,4], but few focus on fault development at key hydrocarbon accumulation stages in the BZ19-6 Structural Belt. Additionally, traditional methods of paleostress inversion often rely on data constraints from field outcrops and oriented cores [5,6], which has led to evaluations of fault structural evolution in the oil and gas industry often focusing mainly on geometrical and kinematic aspects. Consequently, there is a lack of quantitative analysis of dynamic stress states causing fault deformation.
This study uses seismic interpretation data to describe the geometry and growth of faults during the post-rift period. We apply the slip tendency method, defined as the shear-to-normal stress ratio (τ/σn), to invert tectonic paleostress. This method aligns with recent slip-tendency approaches for analyzing fault slip and mining-induced seismicity [7]. The results provide insights into fault activity during key hydrocarbon accumulation and support oil and gas exploration. The paleostress inversion method has broad applicability in the industry.
2. Regional Tectonic Background
The BZ19-6 Structural Belt is in the southwestern part of the Bozhong Depression (Figure 1a), forming a nearly north–south-oriented structural ridge, flanked by the Bozhong Southern Sag and the Bozhong Southwest Sag, exhibiting the structural characteristics of a depression ridge [4]. The buried hill strata of BZ19-6 consist of Archean metamorphic rocks, overlain by sedimentary layers, including the Paleogene Kongdian Formation (Ek), Shahejie Formation (E2s), Dongying Formation (E3d), Neogene Guantao Formation (Ng), Minghuazhen Formation (N2m) (Figure 2), and the Quaternary system (Figure 1b).
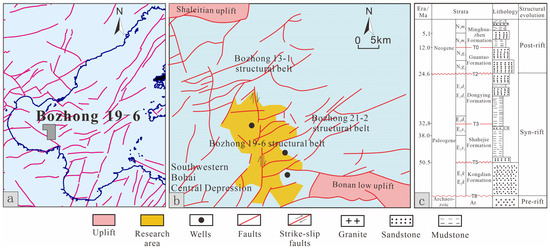
Figure 1.
Geological map of the study area: (a) Location of the Bozhong 19-6 Structural Belt in the Bohai Bay Basin, purple lines in panel (a) denote fault traces, data source: The China Active Faults Database (CAFD).; (b) distribution of uplifts and faults in the study area; (c) stratigraphic framework and chronological subdivision of the strata.
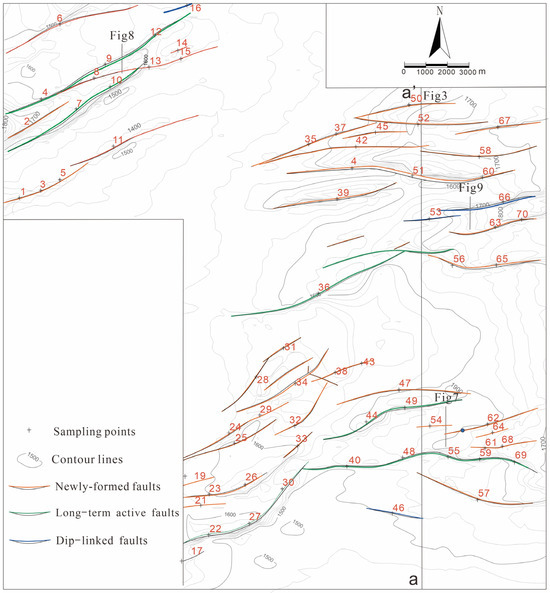
Figure 2.
Structure map (T02) of top surface of lower Minghuazhen Member and distribution of different types of faults.
The tectonic evolution of the Cenozoic sedimentary cover in the BZ19-6 structural belt generally mirrors that of the Bohai Bay Basin. It has undergone two main tectonic cycles: from the Paleocene to the early Oligocene and from the mid-Oligocene to the Miocene, along with neotectonic reactivation since the Pliocene [8]. Stratigraphically, the layers are divided vertically into the pre-rift basement structure, the Paleogene syn-rift structure, and the Neogene post-rift structure (Figure 3).
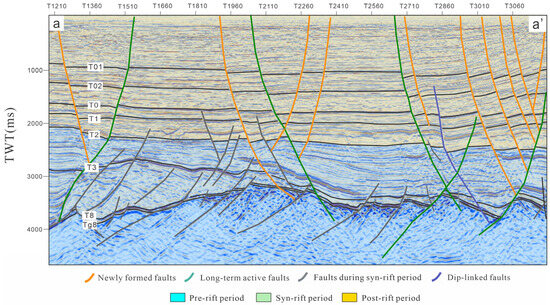
Figure 3.
The profile of BZ19-6 structural belt (see Figure 2 for the location of the survey line).
The Guantao Formation marks the beginning of the post-rift evolutionary stage of the basin, during which the Bohai Bay Basin entered a thermal subsidence phase following the cessation of Paleogene rifting activities. Tectonic movements weakened, and the basin tended towards stability. After 5.3 Ma, around the late depositional period of the Minghuazhen Formation, numerous new faults were generated under the influence of neotectonic movements, and pre-existing faults were reactivated. These faults play a significant role in the transport and preservation of regional oil and gas.
3. Method
3.1. The Growth Index
The growth index (Gi) is defined as the ratio of the thickness of the hanging wall strata to that of the footwall strata during the same geological period:
where Hi represents the thickness of the strata in the hanging wall, and hi represents the thickness of the strata in the footwall during the same geological period.
Gi = hi/Hi
When its value is greater than 1, it indicates that fault activity has occurred, and the larger the growth index, the stronger the fault activity. When the value equals 1, the fault is considered inactive. Based on this, the growth index can be used to determine the intensity of fault activity [9]. Since the growth index is a ratio of hanging wall to footwall thickness, the method becomes inapplicable when strata on either side are missing. Moreover, when strata have undergone severe erosion, even if the eroded thickness is similar on both sides, the accuracy of this method may be affected.
3.2. Inversion of Paleostress in Post-Rift Period
Current methods for paleostress inversion widely used include fault-slip data inversion [10,11,12,13,14,15,16,17,18] and calcite e-twin inversion [19,20,21,22,23,24,25,26]. These methods are challenging to apply in the oil and gas industry. Fault-slip data inversion requires knowledge of the fault’s slip direction, and data collection primarily relies on field outcrop data such as scratch marks and steps on fault planes, which are often unavailable in the oil and gas industry. The calcite e-twin method requires the crystallographic orientation of the main crystal and the twin plane, necessitating oriented core samples [27], but the industry mainly analyzes underground geological structures through seismic data interpretation, typically lacking oriented core data. Therefore, conventional methods of paleostress inversion are difficult to apply in the oil and gas industry.
Although seismic interpretation data can provide geometric information about faults such as their attitude and throw, they do not directly observe the slip direction. Ref. [28] proposed a method using slip tendency to invert paleostress, which only requires knowledge of the fault’s attitude and throw without needing to know the slip direction. This method has been applied in the Jizhong depression of the Bohai Bay Basin [29].
Slip tendency is a parameter used to characterize fault activity [30,31], defined as the ratio of shear stress to normal stress on a fault plane. Specifically, the magnitude of the slip tendency is controlled by the stress tensor and the fault’s attitude. Once the fault’s attitude in a region is established, changes in the stress tensor directly affect the distribution of slip tendency. Therefore, slip tendency analysis can serve as a basis for inverting the stress tensor. Another premise of this method is that fault throw is closely related to slip tendency. In a stable stress environment, a higher slip tendency value on a fault face indicates a greater likelihood of fault activity. Over time, faults with high slip tendencies in certain orientations will frequently slip, thus accumulating greater throws than faults with low slip tendencies. However, there are exceptions, such as faults with high slip tendencies that only slipped in the late stages of deformation or were affected by surrounding fault stresses, which might suppress their activity. Therefore, faults with high slip tendencies could exhibit a range of throw values from high to low, whereas faults with low slip tendencies will only have low throw values.
By interpreting seismic data, fault attitudes and throw data can be obtained. In the inversion process, an initial stress regime is arbitrarily assigned, and the slip tendencies of the faults under this stress state are calculated. Then, through iterative searching, when the calculated slip tendencies under a particular stress state best match the distribution of fault throws, the stress tensor at that moment represents the active stress regime of these faults.
The theoretical algorithms involved in the paleostress inversion discussed in this article are detailed in the literature by Ping et al. [29]. This paper, drawing on the method of slip tendency inversion of paleostress, for the first time uses seismic interpretation data to invert the Neogene paleostress regime of the BZ19-6 block. The inversion results provide important references for analyzing regional structural evolution and clarifying the nature of fracture opening and closing.
3.3. Data Collection and Processing
The fault activity in the BZ19-6 depression structural layer is the result of neotectonic movements, thus assuming that the fault activity during this period is controlled by a uniform stress field. This paper, based on seismic interpretation data, for the first time, inverted the Neogene paleostress state of the BZ19-6 block. The inversion results can provide important references for analyzing regional structural evolution and clarifying the activity of faults during key moments of oil and gas accumulation.
Based on the detailed interpretation of three-dimensional seismic data, statistical analysis of geometric parameters of target layer faults was conducted, including fault strike, dip angle, and throw, with data collection points, as shown in Figure 4. For segments where there are changes in fault distribution throughout the strike, these parameters were segmented for statistical analysis (Figure 4), while being away from the intersection of faults.
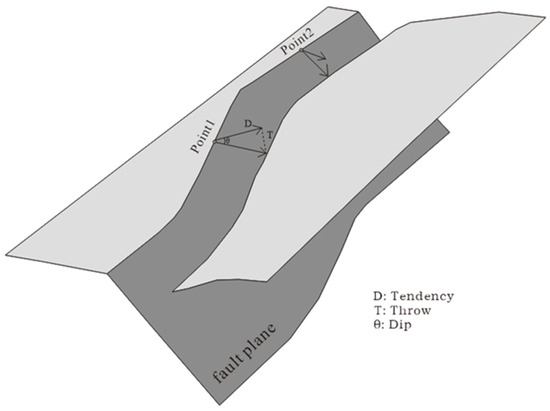
Figure 4.
Schematic diagram of fault attitude statistics.
4. Results
4.1. Geometric Features
Post-rift faults are categorized into three types based on different growth characteristics: newly formed faults, long-term active faults, and dip-linked faults (Figure 2). Geometric characteristics of different types of faults have been classified and statistically analyzed (Figure 5).
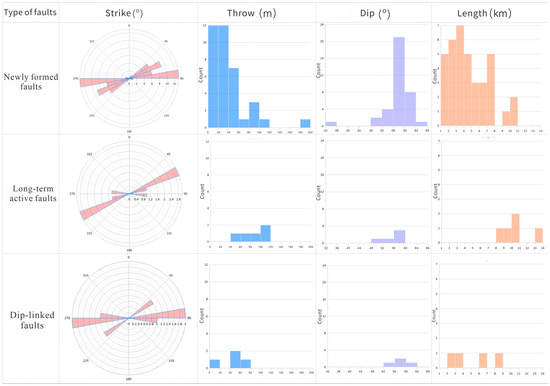
Figure 5.
Statistics of post-rifting fault geometry of Bozhong 19-6 Structural Belt.
Faults newly formed during the post-rift period primarily exhibit east–west and northeast orientations, with maximum throws ranging from 0 to 200 m, typically less than 100 m, dip angles between 45 and 70 degrees, and extension lengths generally less than 8 km. Long-term active faults predominantly follow northeast to east–northeast directions, with maximum throws typically between 100 and 300 m, variable dip angles generally ranging from 40 to 55 degrees, and extension lengths typically between 6 and 15 km. Dip-linked faults are primarily oriented east–west, followed by northeast and northwest directions, with maximum throws less than 100 m, dip angles between 40 and 60 degrees, and extension lengths usually ranging from 2 to 9 km.
Both long-term active and dip-linked faults are pre-existing faults reactivated during the post-rift period (Figure 2). Due to earlier rift activities, their orientations are similar to those of lower rift-period faults, with long-term active faults being slightly larger in scale. From the perspective of sectional composite morphology, “Y”- and “V”-shapedfault combination modes are commonly developed between post-rift period faults (Figure 2). Separated by thick mudstone layers of the Dongying Formation, the connectivity between post-rift and syn-rift-period faults is poor. Only long-term active and dip-linked faults enable communication between the Shahejie Formation source rocks of the rift layer and the post-rift reservoirs.
The BZ19-6 block, covering an area of approximately 165 km2, has been fully covered by three-dimensional seismic data. Based on detailed interpretations of the top of the Ming section (T02 reflection layer) and associated faults, depth structural maps were generated through time–depth conversion. The structure map of the top surface of the lower Minghuazhen Member (T02) (Figure 2) clearly illustrates the spatial distribution of different fault types, providing a foundation for analyzing the structural framework and fault activity in the study area.
4.2. Kinematics Features
Based on the faults observed in the T02 layer, post-rift faults can be classified into three types (Figure 6): (1) newly formed faults, (2) long-term active faults, and (3) dip-linked faults.
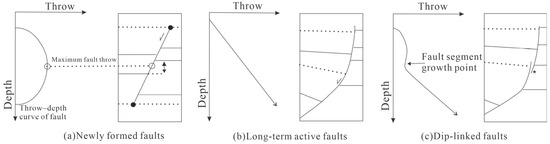
Figure 6.
Fault throw–depth curve of three fault types.
The throw–depth curve (T-z) represents the vertical variation of fault throw [32,33,34] and, in conjunction with the fault growth index, can be used to constrain the timing of fault activity and growth linkage characteristics. The throw–depth curve patterns for the three types of faults are as follows:
- (1)
- Newly formed faults
Newly formed faults are faults that were newly formed during the post-rift period. Vertically, these faults have the largest throws in the middle, gradually decreasing towards the end. The location with the maximum throw indicates the nucleation point of the fault.
As shown in the throw–depth and growth index chart of fault F1 (Figure 7), the fault nucleated and became active during the Minghuazhen Formation period and then extended upwards and downwards into the strata, penetrating down to the Dongying Formation. The throw is largest in the middle of the fault, gradually decreasing from the nucleation point both upwards and downwards, with the throw–depth curve overall exhibiting a C-shaped geometric form.
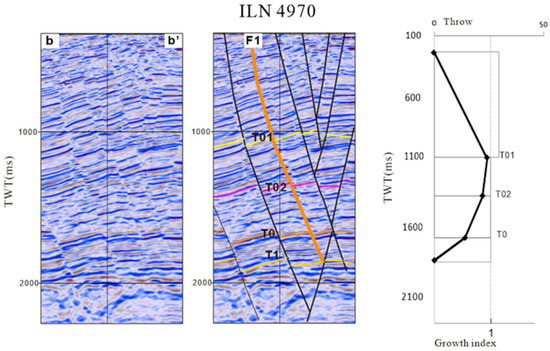
Figure 7.
Seismic profile and throw–depth curve of fault F1 in Bozhong 19-6 block (see Figure 2 for the profile position). The orange line represents a long-term active fault, while black lines represent other faults.
- (2)
- Long-term active faults
Long-term active faults are pre-existing faults from the rift period that continued to be active through to the post-rift strata, with the fault throw increasing deeper into the formation.
As shown in the throw–depth curve and growth index chart of fault F2 (Figure 8), the maximum throw is located at the Shahejie Formation third member, indicating that the fault nucleated in this segment and expanded both upwards and downwards during the Shahejie Formation second member period. The throw decreases gradually upwards and increases linearly downwards. From the upper sub-member of Shahejie third member to the Guantao Formation, the growth index of the fault is greater than 1 throughout, indicating continuous activity of the fault during these periods.
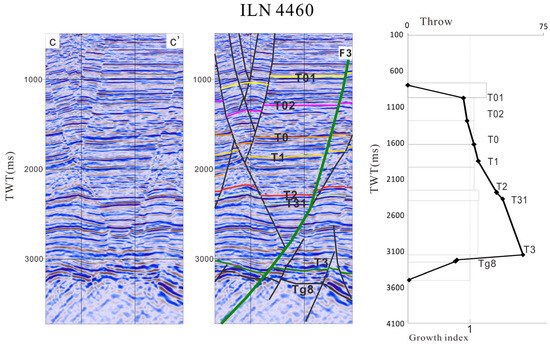
Figure 8.
Seismic profile and throw–depth curve of fault F2 in Bozhong 19-6 block (see Figure 2 for the profile position). The green line represents a long-term active fault, while black lines represent other faults.
- (3)
- Dip-linked faults
Dip-linked faults are newly formed faults that connect in dip with pre-existing faults, causing the reactivation of these older faults. The throw–depth curve exhibits two peaks with a saddle in the middle, forming an M-shaped curve.
From the throw–depth curve and growth index chart of fault F3 (Figure 9), the fault has two vertical peaks, showing clear segmented growth characteristics. The upper peak indicates the maximum throw at the base of the Shahejie Formation, suggesting that the fault was already present during the rift period. The peak in the upper section is in the Guantao Formation, indicating that the fault nucleated in this formation. During the deposition period of the Minghuazhen Formation, the growth index of the fault was greater than 1, indicating continuous activity. Thus, a new fault with the same dip direction formed above the pre-existing fault during the post-rift period. The fault activity extended upwards and downwards. When the newly formed fault breached the underlying strata and connected with the pre-existing fault, a low throw area appeared at the fault connection, resulting in an M-shaped geometry on the throw–depth curve.
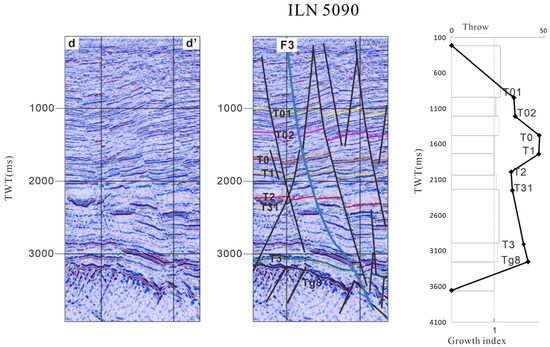
Figure 9.
Seismic profile and throw–depth curve of fault F3 in Bozhong 19-6 block (see Figure 2 for the profile position). The blue line represents a dip-linked fault, while black lines represent other faults.
Based on the statistically obtained fault throw, the faults were classified and graded, and the maximum throw value in the fault data was recorded. The graded faults were then projected onto a stereographic projection map based on the fault attitudes (Figure 10). The fault orientations are primarily oriented in the northeast and east–west directions. Fault segments with high throws (>40 m) are distributed in three zones with strike orientations of approximately N140°–155°, N165°–190°, and N335°–345°, while fault segments with smaller throws are oriented approximately N355°–N5° and N155°–N165°.
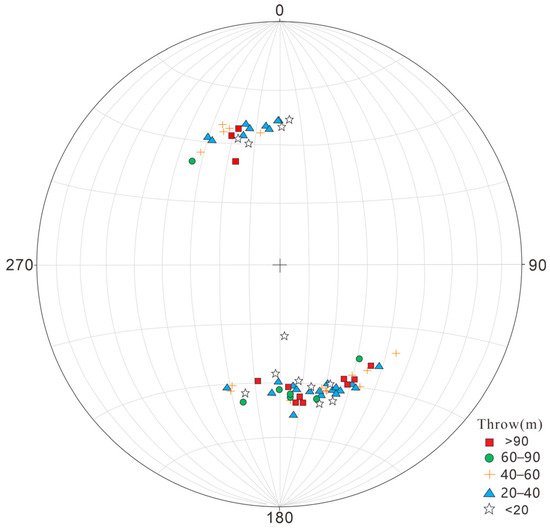
Figure 10.
The stereographic projection of poles to measured fault surfaces with different throw.
4.3. Paleostress Inversion Results
During the inversion process, an initial stress regime is assumed, including the orientation and relative magnitudes of stresses (minimum horizontal principal stress orientation (k1 = σ3/σ1, k2 = σ2/σ1), which allows for the calculation of the slip tendency values for each fault within the region. The slip tendency values are then normalized and compared with the corresponding fault throws, calculating the deviation (ψ) of the match. Subsequently, through a cyclic search of stress states, the orientation of the minimum horizontal principal stress is cyclically varied from 0 to 360 degrees in 2-degree increments, while k1 and k2 are varied from 0 to 1 in 0.1 increments. Deviation calculations are repeated, ultimately identifying the stress state corresponding to the minimum deviation.
The objective of the paleostress inversion algorithm is to find the slip tendency that best matches the actual distribution of fault throws, thereby determining the corresponding stress state. In other words, the goal is to find the stress state with the smallest ψ value. This algorithm is significant in geological structural research and oil and gas exploration, aiding in the understanding of fault activity and crustal stress distribution.
Using seismic interpretation data to obtain geometric parameters of faults, stress inversion is conducted to determine the stress state under the most matching slip tendency and throw distribution (Figure 11). The final inversion result for the Neogene stress state indicates a strike-slip stress regime, with the intermediate principal stress (σ2) vertical, the orientation of the minimum principal stress (σ3) at N170°, and the maximum principal stress (σ1) oriented at N80°. Additionally, k1 = 0.24 and k2 = 0.62.
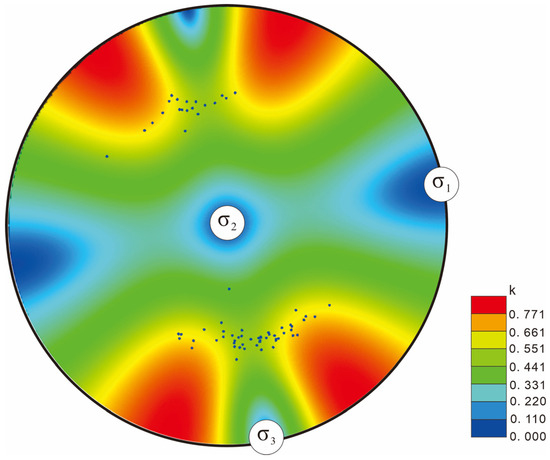
Figure 11.
Principal stress orientations and slip tendency plots of the best-fit stress states. All points plotted in the figure correspond to the stereographic projection of poles.
This inversion result indicates that the stress state associated with the recent tectonic movements is characterized by a strike-slip stress regime. Zhou et al. [35], based on stress measurements obtained from rock core fracturing experiments, have shown that the present-day stress state is also characterized by a strike-slip stress regime. Additionally, the orientation of the maximum horizontal principal stress is inferred to be predominantly east–west based on the orientation of induced fractures from drilling. The consistency between the previous experimental results and the stress state inferred from this inversion suggests that the regional principal stress orientation exhibits a degree of continuity both temporally and spatially during recent tectonic movements.
5. Conclusions
- (1)
- In the study area, the predominant orientation of faults during the post-rift phase is east–west, followed by northeast–southwest. These faults are classified into three types based on their activity nature: newly formed faults, long-term active faults, and trend-connected faults. The latter two types represent faults that were active during the rifting phase and became reactivated during the post-rift phase.
- (2)
- This paper presents a paleostress inversion method based on seismic interpretation data and the slip tendency algorithm. The method utilizes seismic interpretation data to obtain geometric parameters of faults. By iteratively searching for the best match between slip tendency and fault throw distribution, it inverts the Neogene paleostress regime of the BZ19-6 block. This method overcomes the challenges of traditional paleostress inversion methods, such as difficulties in acquiring field outcrop data, complexity in operation, and limited applicability in oilfield settings.
- (3)
- The paleostress inversion results for the BZ19-6 block indicate a strike-slip stress regime, with the intermediate principal stress (σ2) vertical. The orientation of the minimum principal stress (σ3) is approximately N170°, while the orientation of the maximum principal stress (σ1) is approximately N80°. The ratios of σ3 to σ1 and σ2 to σ1 are 0.24 and 0.62, respectively. The inverted stress regime associated with recent tectonic movements is consistent with results obtained from rock fracturing experiments. This method demonstrates widespread applicability and scalability in the oil and gas industry, providing a basis for reservoir fracture prediction and petroleum exploration assessment.
Author Contributions
Conceptualization, methodology, resources, and writing—review and editing, G.P.; software, K.W.; validation, X.L.; writing—original draft preparation, S.Y.; project administration and writing. All authors have read and agreed to the published version of the manuscript.
Funding
This research was funded by the Basic Prospective Project of CNOOC Tianjin Company Optimization of stress research methods in key areas of Bohai Sea, grant number KJQZ-2022-2001.
Data Availability Statement
The original contributions presented in this study are included in the article. Further inquiries can be directed to the corresponding author.
Acknowledgments
During the preparation of this manuscript/study, the author(s) used CorelDRAW 2023 for the purposes of graphics drawing and used Move 2018 for the paleostress inversion. The authors have reviewed and edited the output and take full responsibility for the content of this publication.
Conflicts of Interest
Authors Shuchun Yang and Ke Wang are employees of CNOOC Ltd. which provided financial support for this study. Author Xinran Li is affiliated with Ocean University of China, and author Guidong Ping is affiliated with Northeast Petroleum University and conducted the research independently. The authors declare that the funder had no role in the study design, data analysis, or manuscript preparation.
References
- Xu, C.; Yu, H.; Wang, J.; Liu, X. Formation conditions and accumulation characteristics of Bozhong 19-6 large condensate gas field in offshore Bohai Bay Basin. Pet. Explor. Dev. 2019, 46, 25–38. [Google Scholar] [CrossRef]
- Li, W.; Deng, Y. Influence of Magmatic Activity on Hydrocarbon Accumulation in Bozhong 19-6 Buried-hill in Bohai Bay Basin. J. Tongji Univ. Nat. Sci. 2022, 50, 1052–1061. [Google Scholar] [CrossRef]
- Zhou, Q.; Liu, Y.; Wang, D.; Guan, Q.; Wang, G.; Wang, Y.; Li, Z.; Li, S. Mesozoic-Cenozoic tectonic evolution and buried hill formation in central Bohai Bay. Earth Sci. Front. 2022, 29, 147–160. [Google Scholar] [CrossRef]
- Wang, D.; Liu, X.; Deng, H.; Liu, Y.; Li, D. Characteristics of the Meso-Cenozoic tectonic transformation and its control on the formation of large-scale reservoirs in the Archean buried hills in Bozhong 19-6 area, Bohai Bay Basin. Oil Gas Geol. 2022, 43, 1334–1346. [Google Scholar]
- Zhang, Z.; Lin, W.; Guo, H.; Song, W.; Wang, Q. Tertiary fault-slip analysis and paleostress reconstruction of the kuqa depression, North Tarim Basin. Chin. J. Geol. 2004, 39, 496–506. [Google Scholar]
- Yan, S.; Zhang, B.; Zhang, J.; Wu, J.; Zhao, Z. Calcite twins as a tool for the estimation of paleostress orientation on the basis of Electron Backscatter Diffraction (EBSD) Technique. Geol. Sci. Technol. Inf. 2016, 35, 50–54. [Google Scholar]
- Li, Y.; Fukuyama, E.; Yoshimitsu, N. Mining-induced fault failure and coseismic slip based on numerical investigation. Bull. Eng. Geol. Environ. 2024, 83, 386. [Google Scholar] [CrossRef]
- Zhuang, X.; Zou, H.; Teng, C. Controlling of Hydrocarbons by Neotectonics and Tectonic Fault Activities: A Case Study of Bozhong Area. J. China Univ. Min. Technol. 2012, 41, 452–459. [Google Scholar]
- Liu, B.; He, S.; Meng, L.; Fu, X.; Gong, L.; Wang, H. Sealing Mechanisms in Volcanic Faulted Reservoirs in Xujiaweizi Extension, Northern Songliao Basin, Northeastern China. AAPG Bull. 2021, 105, 1721–1743. [Google Scholar] [CrossRef]
- Angelier, J. Determination of the mean principal directions of stresses for a given fault population. Tectonophysics 1979, 56, 17–26. [Google Scholar] [CrossRef]
- Etchecopar, A.; Vasseur, G.; Daignieres, M. An inverse problem in microtectonics for the determination of stress tensors from fault striation analysis. J. Struct. Geol. 1981, 3, 51–65. [Google Scholar] [CrossRef]
- Celerier, B. How much does slip on a reactivated fault plane constrain the stress tensor? Tectonics 1988, 7, 1257–1278. [Google Scholar] [CrossRef]
- Lisle, R.J. Simple graphical constructions for the direction of shear. J. Struct. Geol. 1998, 20, 969–973. [Google Scholar] [CrossRef]
- Yamaji, A. The multiple inverse method: A new technique to separate stresses from heterogeneous fault-slip data. J. Struct. Geol. 2000, 22, 441–452. [Google Scholar] [CrossRef]
- Hansen, J.A. Direct inversion of stress, strain or strain rate including vorticity: A linear method of homogenous fault–slip data inversion independent of adopted hypothesis. J. Struct. Geol. 2013, 51, 3–13. [Google Scholar] [CrossRef]
- Zhang, Z.; Wang, Y.; Li, J.; Liu, S.; Yun, J.; Li, J. Dynamic Evolution assessment of the Paleozoic hydrocarbon cap rocks in Bachu-Magati area, Tarim Basin. Oil Gas Geol. 2014, 35, 839–852. [Google Scholar]
- Fleischmann, K.H.; Nemcok, M. Paleostress inversion of fault/slip data using the shear stress solution of Means (1989). Tectonophysics 1991, 196, 195–202. [Google Scholar] [CrossRef]
- Fry, N. Striated faults: Visual appreciation of their constraint on possible palaeostress tensors. J. Struct. Geol. 1999, 21, 7–22. [Google Scholar] [CrossRef]
- Nemcok, M.; Kovac, D.; Lisle, R.J. A Stress inversion procedure for polyphase calcite twin and fault/slip data sets. J. Struct. Geol. 1999, 21, 597–611. [Google Scholar] [CrossRef]
- Lacombe, O. Paleostress magnitudes associated with development of mountain belts: Insights from tectonic analyses of calcite twins in the Taiwan Foothills. Tectonics 2001, 20, 834–849. [Google Scholar] [CrossRef]
- Lacombe, O. Calcite twins, a tool for tectonic studies in thrust belts and stable orogenic forelands. Oil Gas Sci. Technol. Rev. IFP Energ. Nouv. 2010, 65, 809–838. [Google Scholar] [CrossRef]
- Tourneret, C.; Laurent, P. Paleo-stress orientations from calcite twins in the North Pyrenean foreland, determined by the Etchecopar inverse method. Tectonophysics 1990, 180, 287–302. [Google Scholar] [CrossRef]
- Arboit, F.; Amrouch, K.; Collins, A.S.; King, R.; Morley, C. Determination of the tectonic evolution from fractures, faults, and calcite twins on the southwestern margin of the Indochina Block. Tectonics 2015, 34, 1576–1599. [Google Scholar] [CrossRef]
- Han, X.; Wang, C.; Liang, J.; Zhang, G.; Feng, Z.; Chen, M.; Liu, Z. The calcite e-twin as an application of analysis and determination of the orientation and magnitude of palaeostress in Guilin. In Proceedings of the Earth Sci. Resour. Environ. Proc. South China Youth Geoscience Symposium, Guilin, China, November 2003; pp. 39–42. [Google Scholar]
- Song, H. A graphic method for calculatingt the direction of the principal compressive stress from e twinning in calcite. Earth Sci. 1982, 3, 179–187. [Google Scholar]
- Köpping, J.; Peternell, M.; Prelević, D.; Rutte, D. Cretaceous tectonic evolution of the Sava-Klepa Massif, Republic of North Macedonia–Results from calcite twin based automated paleostress analysis. Tectonophysics 2019, 758, 44–54. [Google Scholar] [CrossRef]
- Zheng, J.; Shan, Y. Paleostress Analyses of Calcite e-twins: Theory and Prospect. Geotecton. Metallogen. 2020, 44, 47–56. [Google Scholar]
- Mcfarland, J.M.; Morris, A.P.; Ferrill, D.A. Stress inversion using slip tendency. Comput. Geosci. 2012, 41, 40–46. [Google Scholar] [CrossRef]
- Ping, G.; Liu, X.; Li, M.; Zhang, X.; Gao, Y.; Wang, S.; Liu, X. Using Seismic Data and Slip Tendency to Estimate Paleostress: A Case Study From Xicaogu Area of Bohai Bay Basin, China. Front. Earth Sci. 2022, 10, 812874. [Google Scholar] [CrossRef]
- Morris, A.P.; Ferrill, D.A.; McGinnis, R.N. Using fault displacement and slip tendency to estimate stress states. J. Struct. Geol. 2016, 83, 60–72. [Google Scholar] [CrossRef]
- Morris, A.; Ferrill, D.A.; Henderson, D.B. Slip-tendency analysis and fault reactivation. Geology 1996, 24, 275–278. [Google Scholar] [CrossRef]
- Baudon, C.; Cartwright, J. The kinematics of reactivation of normal faults using high resolution throw mapping. J. Struct. Geol. 2008, 30, 1072–1084. [Google Scholar] [CrossRef]
- Pochat, S.; Castelltort, S.; Choblet, G.; Van Den Driessche, J. High-resolution record of tectonic and sedimentary processes in growth strata. Mar. Pet. Geol. 2009, 26, 1350–1364. [Google Scholar] [CrossRef]
- Wang, H.; Fu, X.; Wang, H.; Chen, M.; Meng, L.; Ping, G. Research on the controlling effect of quantitative analysis and evaluation of fault activity on oil and gas accumulation in Qikou sag of Bohai Bay Basin. Acta Geol. Sin. 2020, 94, 3062–3073. [Google Scholar] [CrossRef]
- Zhou, C.; Geng, Y.; Lei, Y.; He, Y. Experimental research on distribution of in-situ stress of Bozhong 19-6 complex fault block structure. Petrochem. Ind. Appl. 2020, 39, 84–89. [Google Scholar]


Disclaimer/Publisher’s Note: The statements, opinions and data contained in all publications are solely those of the individual author(s) and contributor(s) and not of MDPI and/or the editor(s). MDPI and/or the editor(s) disclaim responsibility for any injury to people or property resulting from any ideas, methods, instructions or products referred to in the content. |
© 2025 by the authors. Licensee MDPI, Basel, Switzerland. This article is an open access article distributed under the terms and conditions of the Creative Commons Attribution (CC BY) license (https://creativecommons.org/licenses/by/4.0/).