Article

Phase Evolution History of Deep-Seated Hydrocarbon Fluids in the Western Junggar Basin: Insights from Geochemistry, PVT, and Basin Modeling

1
Wuxi Petroleum Geology Institute, Research Institute of Petroleum Exploration and Development, SINOPEC, Wuxi 214126, China
2
Key Laboratory of Petroleum Accumulation Mechanisms, SINOPEC, Wuxi 214126, China
3
State Key Laboratory of Shale Oil and Gas Enrichment Mechanisms and Effective Development, Wuxi 214126, China
4
School of Geosciences, China University of Petroleum (East China), Qingdao 266580, China
5
Research Institute of Exploration and Development, Xinjiang Petroleum Administration Bureau, Karamay 834000, China
6
Chengdu Exploration and Development Research Institute of PetroChina Daqing Oilfield, Chengdu 610051, China
*
Authors to whom correspondence should be addressed.
Processes 2025, 13(8), 2667; https://doi.org/10.3390/pr13082667
Submission received: 16 July 2025 / Revised: 13 August 2025 / Accepted: 20 August 2025 / Published: 21 August 2025
(This article belongs to the Section Energy Systems)

Abstract

Clarifying the phase evolution history of hydrocarbon fluids helps formulate exploration and development strategies. The discovery of the Xinguang Gas Field marks a significant breakthrough in the Western Junggar Basin. However, the phase evolution history of this gas field remains unclear, which hinders the formulation of subsequent exploration strategies. This study employs a comprehensive approach, combining organic geochemistry, fluid inclusions, basin modeling, and PVT testing and simulation, to investigate the characteristics and phase behavior of deep-seated hydrocarbon fluids in this gas field. It also examines the charging history, compositional evolution, and temperature and pressure histories of the reservoir, thereby clarifying the phase transition process of hydrocarbon fluids in the Xinguang Gas Field. This study finds that the deep-seated reservoir fluids in the Jiamuhe Formation (Fm.) of the Xinguang Gas Field exhibit low densities of 0.77 to 0.83 g/cm3, high gas-to-oil ratios (GORs) of 1014.41 to 13,054.77 m3/m3, high methane contents of 91.16% to 92.74%, and retrograde condensation characteristics. Additionally, the reservoir temperature and pressure exceed the critical point and the saturation pressure at reservoir temperature, indicating a supercritical condensate gas phase. The present condensate gas in the Xinguang Gas Field is a mixed hydrocarbon from two charging events. Initially, during the Middle–Late Triassic period, both Block 1 and the Xinguang Gas Field were charged with mature oil. Later, from the Late Cretaceous to Early Neogene periods, a secondary charging of highly mature oil and gas occurred in the Xinguang Gas Field, while the reservoir in Block 1 remained largely unchanged. In the co-evolution of reservoir fluid composition, temperature, and pressure, the phase transitions of the hydrocarbon fluids in the Xinguang Gas Field passed through several stages, including liquid black oil (231.9–80.3 Ma), liquid volatile oil (80.3–79.1 Ma), vapor–liquid two-phase volatile oil (79.1–78.3 Ma), vapor–liquid two-phase condensate gas (78.3–69.1 Ma), and supercritical condensate gas (69.1 Ma–present).

1. Introduction

Deep-seated regions (depths > 4500 m) are emerging as promising alternatives to conventional oil and gas exploration [1]. In the past decade, significant advancements have been made in global deep-seated oil and gas exploration, for example. Notable examples include Iran’s South Pars Gas Field [2]; the US Gulf of Mexico’s deep-water accumulations [3]; Tanzania’s Mamba, Coral, and Agulha Gas Fields [4]; and China’s Shunbei ultra-deep field [5]. Compared with hydrocarbons in the middle-shallow layers, deep-seated oil and gas exhibit more diverse phase states. Multistage hydrocarbon generation from high-maturity source rocks [5,6], multi-period hydrocarbon charging [7], and secondary alteration processes (e.g., biodegradation, water washing, thermal cracking, thermochemical sulfate reduction, and evaporation fractionation) [8,9,10] all modify hydrocarbon compositions, leading to various phase types in deep reservoirs, such as heavy oil, black oil, volatile oil, condensate, wet gas, and dry gas [6,11,12]. Formation subsidence and uplift induced by multiphase tectonic movements alter formation temperature–pressure conditions across different geological periods, resulting in phase states of oil and gas reservoirs including liquid, vapor, vapor–liquid coexistence, and supercritical states [13,14]. The coupled evolution of hydrocarbon compositions and formation temperature–pressure significantly influences the phase evolutions of deep oil and gas. Clarifying the phase evolution histories of oil and gas under multiple factors facilitates the formulation of exploration and development strategies.
In recent years, major breakthroughs in deep-seated gas exploration have been made in the western part of the Junggar Basin, with the discovery of the Xinguang Gas Field being one of the key achievements [15,16]. Statistical data indicate that the Xinguang Gas Field contains a geological gas reserve of approximately 71 × 108 m3, greatly boosting explorers’ confidence to further investigate deep-seated gas resources in the Western Junggar Basin. Previous studies have been conducted on the genesis and source of gas [17,18,19], the geological accumulation conditions [20], and hydrocarbon charging stages [21] in the Xinguang Gas Field. Xu et al. (2023) [22] revealed the Permian Wuerhe reservoir in the adjacent area as secondary condensate gas, formed by gas invasion altering liquid hydrocarbons, through studying its hydrocarbon phase state evolution and accumulation process. However, the following critical knowledge gaps remain: (1) the coupling relationships between fluid composition, temperature–pressure histories, and phase transitions have not been systematically addressed; and (2) the role of multi-stage charging in driving phase evolution lacks quantitative constraints. This study addresses these gaps by integrating geochemistry, fluid inclusion analysis, basin modeling, and PVT simulation. Our specific contributions include the following: (1) establishing a coupled framework to reconstruct phase evolution history; (2) identifying supercritical condensate gas as the present phase and quantifying its formation mechanism; and (3) revealing a two-stage charging-controlled phase transition sequence. These findings enhance understanding of deep hydrocarbon phase behavior and support exploration strategies in similar high-temperature and high-pressure (HTHP) settings.

2. Geological Setting

The Junggar Basin, situated in the northwestern region of China (Figure 1A), is the second largest sedimentary basin, and one of the most petroliferous basins, in China. Based on the classification scheme of structural units, the Junggar Basin is divided into six primary structural units: the Wulungu Depression, the Luliang Uplifts, the Western Uplifts, the Central Depression, the Eastern Uplifts, and the Northern Tianshan Overthrust Belt (Figure 1B). The study area is located on the western part of the Central Depression (Figure 1B), containing four second-order structural units: the Zhongguai Uplift, the Hongche Fault Zone, the Shawan Sag, and the Penyijingxi Sag (Figure 1C).
The study area is characterized by sedimentary strata that span from the Permian to Quaternary systems, underlain by a Carboniferous volcanic basement (Figure 1D,E). During most of geological time, the strata in the study area subsided for sedimentation. Only during the Hercynian and Yanshanian periods did tectonic movements occur, causing the strata to uplift and be eroded [7,23]. The Hercynian Uplift led to the erosion of multiple strata such as the Permian Fengcheng Fm., Permian Xiazijie Fm., and Permian Xiawuerhe Fm. in most parts of the study area, forming an unconformity between the Permian Jiamuhe Fm. and Permian Shangwuerhe Fm. The Yanshanian Uplift resulted in the erosion of the Jurassic Xishanyao Fm., Jurassic Toutunhe Fm., and Jurassic Qigu Fm., creating an unconformity between the Jurassic Sangonghe Fm. and Cretaceous System (Figure 1D). These tectonic movements also generated NE- and SE-trending faults, which, together with these unconformities, act as key pathways for hydrocarbon migration from the Shawan Sag to the Zhongguai Uplift [17,24].
The study target is the Jiamuhe gas reservoir of the Xinguang Gas Field (Figure 1C). In the key study area around the Xinguang Gas Field, the burial depth of the Jiamuhe Formation ranges from 4800 to 5400 m. The Jiamuhe Fm. is predominantly composed of clastic rocks, such as conglomerate, sandstone, and mudstone, as well as volcanic rocks including basalt, andesite, and tuff, which is a set of potential source rocks in the study area (Figure 1E). The Fengcheng and Xiawuerhe are two other significant sets of source rocks. The Fengcheng source rock, with its high organic matter abundance and sapropelic organic matter composition, is identified as the key petroleum source rock in the Western Junggar Basin [25,26]. The Shangwuerhe serves as the significant cap rock for the Jiamuhe reservoir, providing effective sealing (Figure 1E).

3. Samples and Methods

3.1. Samples

A total of 8 crude oil samples, 10 fluid samples, 10 desorbed gas samples, 77 mudstone samples, and 32 oil sand samples were collected for measurement. Eight crude oil samples from seven wells were chosen for oil density. Eight fluid samples from seven wells were used for fluid composition testing. Two fluid samples from wells ZJ2 and XG1 were used for constant mass expansion experiments. Ten gas samples from four wells were used for gas chromatographic analysis. In total, 47 Fengcheng source rock samples, 14 Jiamuhe source rock samples, 16 Xiawuerhe source rock samples, 16 Jiamuhe oil sand samples from Block 1, and 14 Jiamuhe oil sand samples from Xinguang Gas Field, were used for gas chromatography–mass spectrometry (GC-MS) and carbon isotopes. Two oil sand samples from wells ZJ2 and XG1 were chosen for the fluid inclusion test.

3.2. Analytical Methods

3.2.1. Oil Density

Using an AntonPaar DMA4500 (Graz, Austria) density meter and the Standard Test Method ASTM D 5002-2013 [27], the density of crude oil was measured at a temperature of 20 °C.

3.2.2. Fluid Composition Testing and Constant Mass Expansion Experiment

The reservoir fluid composition testing procedures adhered to the Standard SY/T5542-2009 [28]. Separator oil and gas samples were sampled in accordance with the reservoir oil and gas production testing process, and the resulting oil and gas samples were subjected to phase equilibrium quality checks. The formulation of the reservoir fluid sample was conducted according to the production’s GOR. Following the produced samples’ attainment of thermal equilibrium under reservoir conditions, measurements of oil volume and gas flow rate were made, and tests with flash distillation were conducted. Following a compositional analysis of the obtained oil and gas samples, the density, molecular weight, and heavy fraction (C11+) of the flashed oil were ascertained. As a result, the composition of the reservoir fluid in the samples generated by the wellstream representative could be determined.
The constant mass expansion experiment was carried out on the formulated reservoir fluid samples in accordance with the Test Method GB/T 26981-2011 [29]. First, the dew point pressure of the sample was measured. When the pressure difference between the appearance and disappearance of liquid droplets was less than 0.1, the average of these two pressure values was taken as the first dew point pressure. After determining the dew point pressure, a stepwise pressure–volume relationship measurement was conducted using a pressure reduction method. Above the dew point pressure, each level of pressure was set at 1.0 MPa, and the sample volume at equilibrium was obtained after 0.5 h. Below the dew point pressure, each level of pressure was stirred for 0.5 h and allowed to stand for 0.5 h to obtain the pressure, sample volume, and condensate amount. The experiment continued until the sample volume expanded to more than three times the original sample volume.

3.2.3. GC and GC-MS

Gas composition was analyzed using a modified Agilent Technologies 6890N GC equipped with a three-channel system. The organic hydrocarbons were analyzed using channel A, with helium as the carrier gas and FID detection, employing a Varian 2378 column (KC5 50 m × 0.53 mm). The GC conditions included an initial temperature of 60 °C, held for 3 min, followed by an increase to 190 °C at a rate of 25 °C/min, and then held for 3 min. Channel B was utilized for CO2, H2S, O2, N2, CO, and CH4 analysis with TCD detection, utilizing a stainless steel molecular sieve-packed column at a constant temperature of 90 °C. Similarly, channel C was employed for H2 analysis using TCD detection and a stainless steel molecular sieve-packed column at a constant temperature of 90 °C. An external standard method was applied in all three channels, and results were normalized to obtain the relative contents of each component.
The rock core samples were initially crushed to a mesh size of 100, after which the bitumen was extracted from the rock powders, using a Soxhlet extractor with a mixture of CH2Cl2 and CH3OH in an 8:2 volume ratio for a duration of 48 h. Subsequently, the polar, saturated, and aromatic hydrocarbon fractions of the bitumen were separated using dry-packed silica gel column chromatography. Gas chromatography–mass spectrometry (GC-MS) of the saturated hydrocarbons was performed using an Agilent 7890GC/5975iMS system (Agilent Technologies Inc., Santa Clara, California, USA) equipped with an HP-5MS (30 m × 0.25 mm × 0.25 µm) column. The GC-MS system was set to operate in EI mode with a 70 eV current, and the carrier gas (99.999% helium) flowed at a rate of 1 mL/min. The temperature protocol involved an initial setting of 50 °C for 1 min, followed by an increase to 120 °C at a rate of 20 °C per minute, and then to 310 °C at a rate of 3 °C per minute, maintaining this temperature for 30 min. To mitigate potential background signals, crushed pre-combusted sand (heated at 750 °C for 12 h) was subjected to the same analytical procedures as the sample powders. The biomarker signals in the samples were found to be at least four orders of magnitude higher than those in the procedural blanks.

3.2.4. Carbon Isotope Analysis

To analyze the source rock and oil-bearing sandstone samples, they were first crushed to 80 mesh. Then, 30 g of the crushed samples were subjected to Soxhlet extraction using chloroform for 72 h. The resulting extracts were analyzed for carbon isotope composition using a FLASH HT EA-MAT 253 IRMS. The test conditions included using helium (99.999%) as the carrier gas, with a flow rate of 100 mL/min, and oxygen (99.995%) as the combustion gas, with a flow rate of 250 mL/min. The reactor temperature was set at 980 °C, and the reactor was filled with Cr2O3, reduced copper, and Ag/CoO. The results were reported in standard per mil δ notation, relative to the V-PDB standard.

3.2.5. Fluid Inclusion Test

To observe fluid inclusions, polished thin sections were prepared following the Standard SY/T6010-2011 [30]. These sections were then examined under a Leica DMRXP optical microscope. Microthermometry was performed using a Linkham THMSG600 heating–cooling stage (Linkam Scientific Instruments, Tadworth, UK). The fluid inclusion test consisted of two steps. Firstly, the diagenetic process of hydrocarbon-bearing inclusions in the thin sections was observed. Secondly, the homogenization temperature of the brine inclusions associated with the hydrocarbon-bearing inclusions was measured. Homogenization temperatures were only measured on the primary homogeneous phase brine inclusions that are paragenetic with oil or gas inclusions, as oil or gas inclusions tend to provide unreliable estimates of trapping temperature. For two-phase aqueous inclusions (liquid and vapor) in oil-bearing sandstone samples, homogenization temperatures were determined on double-sided polished wafers. The heating and cooling rates were set at 5 °C/min, providing an accuracy of approximately 0.1 °C for homogenization temperature measurements.

3.2.6. Basin Modeling

Basin modeling is a widely used technique with successful applications in reconstructing burial and thermal histories in petroliferous basins [7]. In this study, we used Petromod 2016.2 software to reconstruct the burial and thermal histories of Well XG1 through one-dimensional modeling. The input geological data included time, depth, present-day thickness, erosion thickness, and lithologies of the strata, which are listed in Table 1. In the lithology configuration, the proportional distribution of lithologies within each stratigraphic unit was calculated and subsequently assigned to a new lithological group using the lithology editor in Petromod software. The result of the lithological proportion is listed in Table 2.
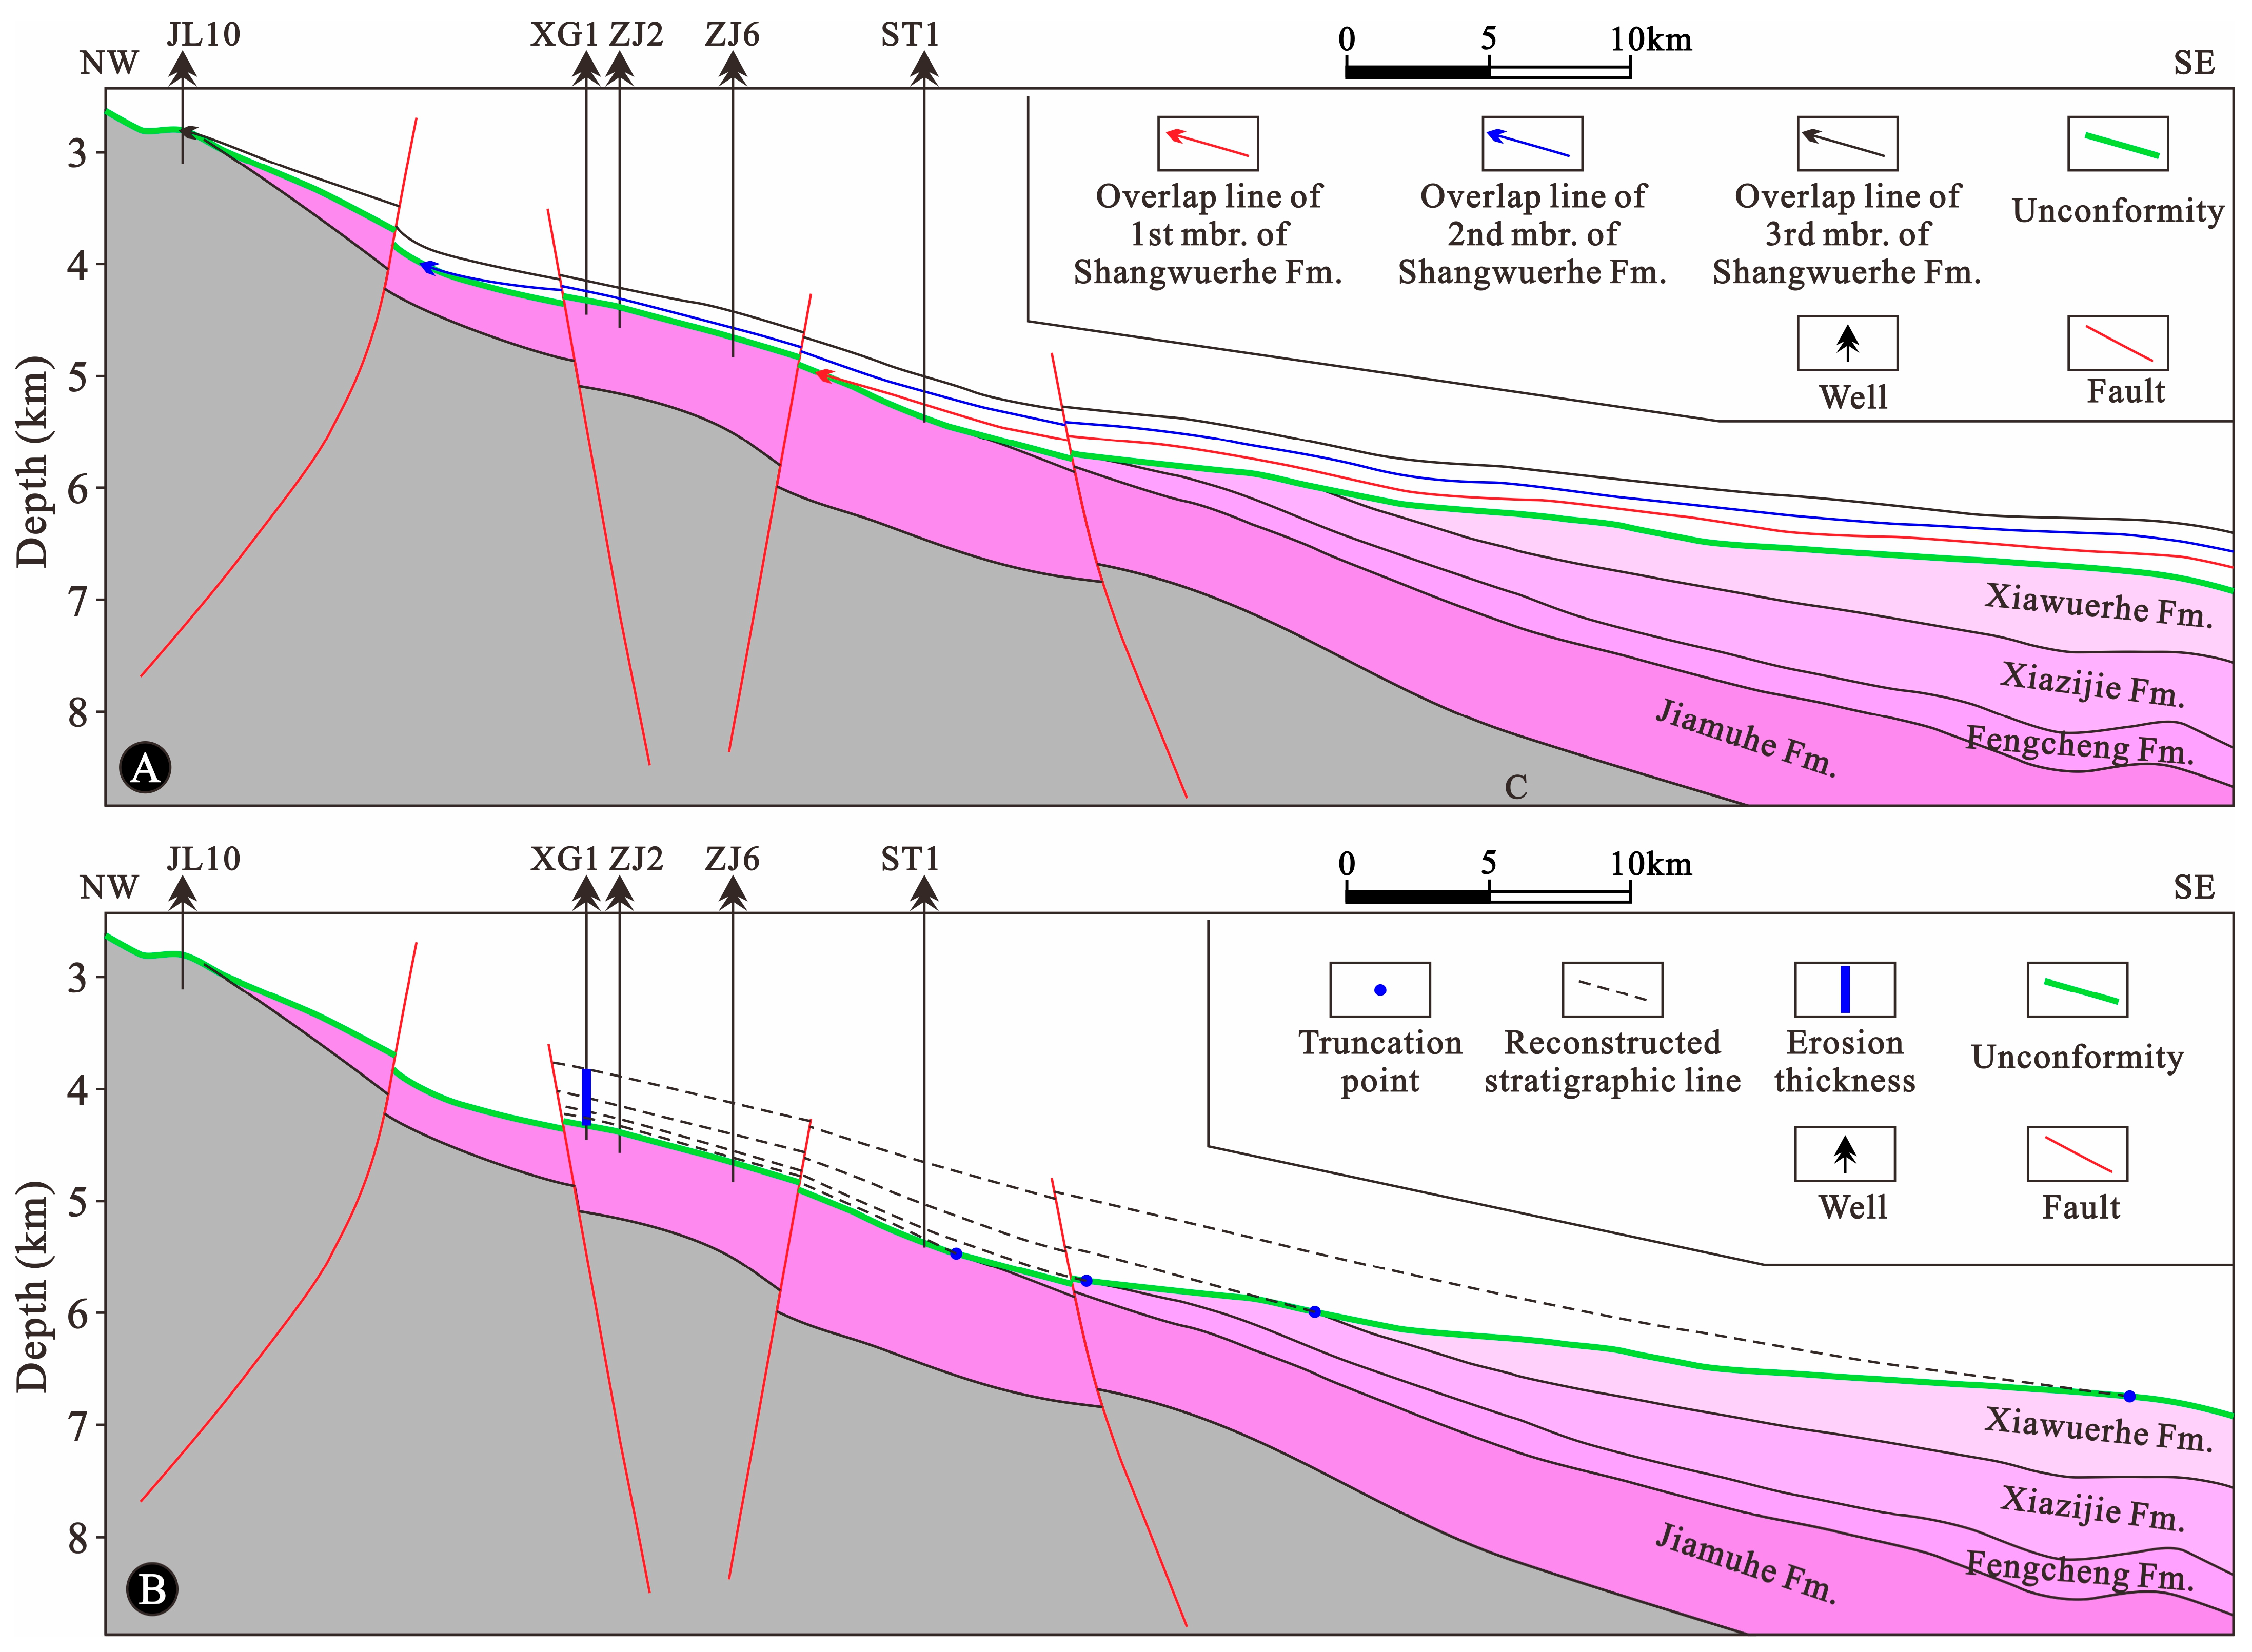
Erosion thickness plays a crucial role in reconstructing the burial histories of sedimentary layers. The location of stratigraphic erosion is determined based on unconformities and regional tectonic features. The results indicate that there has been stratigraphic erosion between Jiamuhe and Shangwuerhe, as well as at the top of the Jurassic strata. The erosion thickness of strata between Jiamuhe and Shangwuerhe was estimated using a stratigraphic extension-tracking approach. From the perspective of the stratigraphic profile, the first, second, and third members of Shangwuerhe exhibit a gradually upward overlying feature from the sag to the uplift, while the Jiamuhe, Fengcheng, Xiazijie, and Xiawuerhe formations in Well XG1 appear to be truncated. Consequently, the complete Fengcheng, Xiazijie, and Xiawuerhe formations and the top of Jiamuhe have been eroded away (Figure 2A). Based on the trend of strata extension, these missing strata were extrapolated upwards to the location of Well XG1. Subsequently, the stratigraphic erosion thickness was calculated based on the vertical depth scale ratio, and the results indicate that the stratigraphic thickness is approximately 505 m (Figure 2B). The erosion thickness of the Jurassic top strata of Well XG1 is cited from the investigations of [31]. The results show that the J2t and J2x formations have undergone erosions of 125 m and 80 m, respectively.
Heat flow (HF) and sediment water interface temperature (SWIT) are crucial temperature boundary conditions used to reconstruct the thermal history of the stratigraphy in the Petromod simulation process. In this study, the setting of HF data is based on the research by [32] and adjusted using Ro and formation temperature as calibration indicators to improve the agreement between simulated and measured values. The SWIT data is obtained by inputting the geographic latitude information (45 degrees north latitude in East Asia) into the Automatic SWIT Tool provided by Petromod software for Well XG1. The measured parameters, including Ro, formation temperature, and formation pressure, were utilized for the calibration of reconstructing the thermal and pressure histories of the reservoir.

3.2.7. PVT Simulation

All P-T phase diagrams were plotted using tNavigator 19.1 software. The composition of hydrocarbon fluids was reconstructed using the “recombine” tool in PVTsim 2.0 software. In the reconstruction process of the reservoir fluid composition, the current fluid composition of Block 1 reservoir was used as the initial composition for the Xinguang Gas Field reservoir fluid. Over the gas fluid period, the gas volume was gradually increased, resulting in an increase in the GOR of the Xinguang Gas Field reservoir fluid from 57.38 m3/m3 (the current GOR of Block 1 reservoir) to 13,504.78 m3/m3 (the current GOR of Xinguang Gas Field reservoir). The reservoir fluid composition was simulated for 168 different geological time points. According to the research in [24], the hydrocarbon gas generation rate of the Fengcheng source rocks showed minimal variation during the gas injection period in the reservoir. Therefore, the rate of increasing gas volume was set to be constant in the simulation process of the reservoir fluid composition. The compositional results of the reservoir fluid at 13 key time points when phase changes occurred are listed in Table 3. The fluid phase states of black oil, volatile oil, and condensate are differentiated by the classification scheme from the China industry standard for oil and gas (SY/T5542-2009), which is relatively applicable in this case study. Reservoir fluids with GOR being <250 m3/m3, 250–550 m3/m3, 550–18,000 m3/m3, and >18,000 m3/m3 are classified as black oil, volatile oil, condensate, and gas, respectively.

4. Results

4.1. Physical Properties and Bulk Composition

The oil density, gas–oil ratio (GOR = production gas volume/ production oil volume in m3/m3), and bulk composition are fundamental parameters that reflect the properties of reservoir fluids. Significant variations in crude oil density and GOR are observed between two blocks within the study area (Figure 3). In Block 1, the oil is relatively dense, ranging from 0.83 to 0.86 g/cm3 at 20 °C, with an average of 0.84 g/cm3 and a median of 0.85 g/cm3. In contrast, the crude oil in the Xinguang Gas Field is much lighter, with densities ranging from 0.77 to 0.83 g/cm3, an average of 0.80 g/cm3, and a median of 0.79 g/cm3 (Figure 3A). The GOR of hydrocarbon fluids in Block 1 varies between 57.38 and 102 m3/m3, with an average of 72.84 m3/m3 and a median of 67.50 m3/m3. In comparison, the GOR of hydrocarbon fluids in the Xinguang Gas Field is significantly higher, ranging from 1014.41 to 13,054.77 m3/m3, with an average and median of 9095.25 m3/m3 and 10,706.29 m3/m3, respectively (Figure 3B).
The chemical composition of hydrocarbon fluids also shows both similarities and differences between Blocks 1 and 2. In both blocks, the molar fractions of non-hydrocarbon components, such as N2 and CO2, are relatively low. For Block 1, the molar fraction of non-hydrocarbon components ranges from 1.62% to 3.92%, while, in the Xinguang Gas Field, the range is from 1.69% to 2.51%, with averages and medians close to 2.5% in both cases. However, substantial differences are evident in the hydrocarbon components between the two blocks. The methane content in Block 1 hydrocarbon fluids is relatively low, ranging from 35.15% to 36.45%, with an average of 35.88% and a median of 35.95%. In contrast, methane content in the Xinguang Gas Field hydrocarbon fluids is significantly higher, ranging from 91.16% to 92.74%, with an average of 91.93% and a median of 92.10%. Differences in the C2–C6 fraction are also notable, though less pronounced than those for methane. In Block 1, the molar fraction of C2–C6 hydrocarbons ranges from 6.40% to 12.31%, with an average of 8.63% and a median of 7.90%. In the Xinguang Gas Field, the C2–C6 fraction ranges from 3.05% to 5.03%, with averages and medians close to 4.50%. For C7+ heavy hydrocarbons, Block 1 exhibits a molar fraction ranging from 47.33% to 56.82%, with an average of 52.93% and a median of 53.78%. In contrast, the Xinguang Gas Field shows significantly lower values, ranging from 1.17% to 2.34%, with an average of 1.60% and a median of 1.52% (Figure 3C–F).
Natural gas samples from Block 1 and the Xinguang Gas Field are characterized by organic gas properties, displaying minimal concentrations of non-hydrocarbon components, such as N2 and CO2, while hydrocarbon components ranging from C1 to C6 predominate. However, there is a significant difference in hydrocarbon component content between the two blocks. The natural gas of Block 1 possesses a methane content of 71.56% and a dryness coefficient (C1/C1−C5) of 0.82 (Table 4). In contrast, the natural gas of the Xinguang Gas Field exhibits significantly higher methane content, ranging from 92.55% to 95.58%, with a dryness coefficient range of 0.95 to 0.97 (Table 4), which indicates typical dry gas characteristics.

4.2. Constant Mass Expansion

The constant composition expansion (CCE) experiment measures the relationship between the volume and pressure of a constant-mass condensate gas reservoir fluid sample under reservoir temperature conditions. CCE experiments were conducted on reservoir fluids from the Jiameihe Fm. in two wells of the Xinguang Gas Field, testing the condensate yield at various pressures and three different temperatures. The results show that, at an experimental temperature of 109.9 °C and pressures above 51.80 MPa, the hydrocarbon fluid in Well ZJ2 exhibits a single-phase gas state. When the pressure falls below 51.80 MPa, the hydrocarbon sample begins to condense into liquid oil. As the pressure decreases to 12.97 MPa, the condensate yield reaches a maximum of 5.22%. Thereafter, the condensate yield shows a slight decline as the pressure continues to drop. At higher experimental temperatures of 120 °C and 130 °C, the phase behavior of the reservoir fluids follows a similar trend. However, as the temperature increases, the pressure at which liquid hydrocarbons begin to condense decreases accordingly (Figure 4A). The result of the CCE experiment on the reservoir fluids in Well XG1 is similar to that of Well ZJ2. At the reservoir temperature of 108.2 °C and pressures exceeding 49.06 MPa, the reservoir fluid remains in the gas phase. As the pressure decreases from 49.06 MPa to 2.69 MPa, the condensate liquid volume yields from 0% to 2.69%, reaching a maximum of 4.08% at approximately 13.69 MPa (Figure 4B).

4.3. GC-MS and Carbon Isotopes

4.3.1. Alkanes

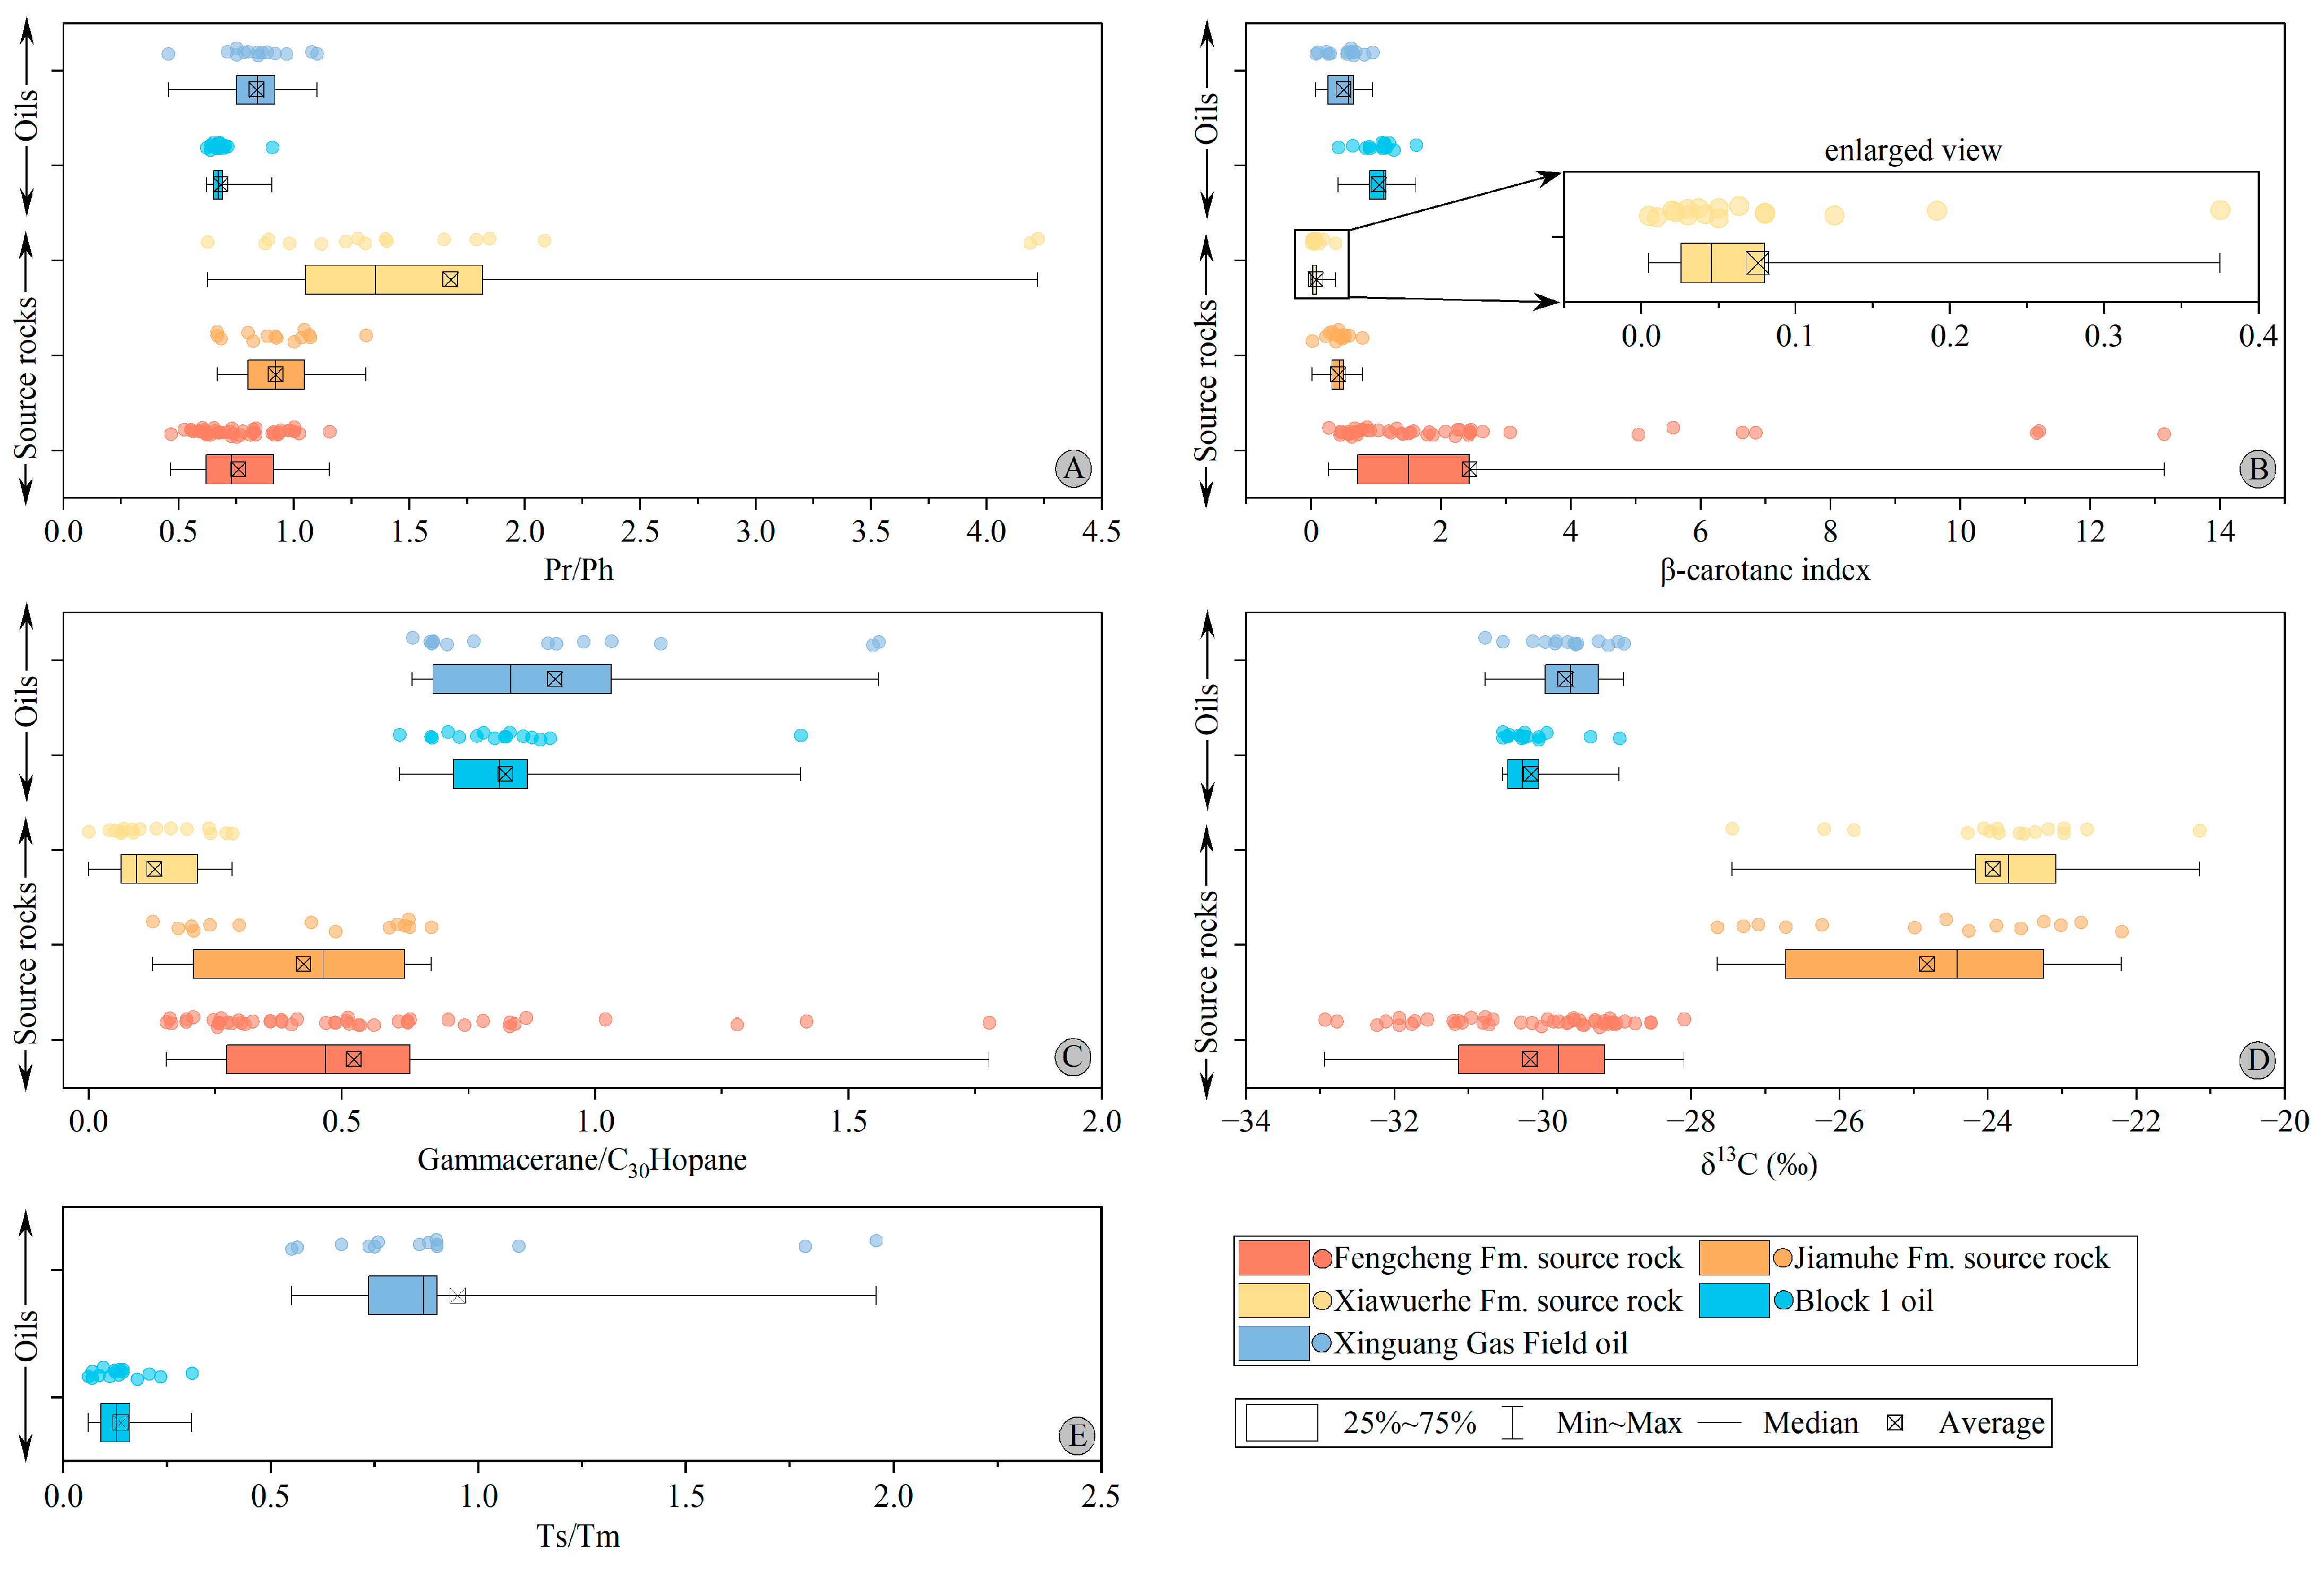
The Pristane/phytane (Pr/Ph) ratio is an effective indicator of redox conditions in depositional environments, with values < 1 suggesting reducing conditions and >1 indicating oxidizing conditions, as phytane preferentially forms under reducing conditions and pristane under oxidizing conditions [26,33]. The Fengcheng source rocks and oils from Blocks 1 and 2 show a significant predominance of phytane over pristane, with Pr/Ph ratios mostly below 1 (Figure 5A), indicating formation under strongly reducing conditions. In comparison, the Jiamuhe and Xiawuerhe source rocks possess Pr/Ph ratio ranges of 0.67−1.31 and 0.63−4.22, with averages of 0.92 and 1.68, respectively. This suggests that those two source rocks were deposited in reducing and oxidizing conditions, respectively.
The β-carotane index, which represents the ratio of β-carotane to the prevalent normal alkane (Cmax) in TIC, is routinely employed to assess the abundance of β-carotane in sediments and oils. The Fengcheng source rocks exhibit a high abundance of β-carotane, which serves as an identifying biomarker for this formation. The β-carotane index in the Fengcheng source rocks possesses a minimum of 0.27, a maximum of 13.14, a median of 1.50, and an average of 2.45. The β-carotane index of the Jiamuhe source rocks ranges from 0.02 to 0.79, with an average and median of 0.42 and 0.44, respectively. The Xiawuerhe source rocks exhibit the lowest abundance of β-carotane, with a β-carotane index range of 0.005−0.38, and an average and median of 0.08 and 0.05, respectively. The Block 1 oils possess a β-carotane index of 0.42−1.62, with an average of 1.05, whereas the Xinguang Gas Field oils exhibit a β-carotane index range of 0.08−0.95, averaging 0.50 (Figure 5B).

4.3.2. Hopanes

The gammacerane index (gammacerane/C30Hopane), a reliable indicator of water column stratification, is commonly associated with deep-seated hypersalinity [33]. Significant differences are observed in the gammacerane indices among the Fengcheng, Jiamuhe, and Xiawuerhe source rocks (Figure 5C). The Fengcheng source rock exhibits abundant gammacerane content, with a minimum gammacerane index of 0.15, a maximum of 1.78, and an average of 0.52. In contrast, the Jiamuhe source rocks display a slightly smaller gammacerane index, ranging from 0.13 to 0.68, with an average value of 0.42. The Xiawuerhe source rocks have the lowest gammacerane index, with a minimum value of 0, a maximum of only 0.28, and an average of 0.13. The oils from Block 1 and the Xinguang Gas Field exhibit a gammacerane abundance comparable to that of the Fengcheng source rock. The gammacerane indices for these oils range from 0.61 to 1.41 in Block 1, and from 0.64 to 1.56 in the Xinguang Gas Field, with average values of 0.82 and 0.92, respectively (Figure 5C).
Ts/Tm is commonly used to indicate the thermal maturity of sediments and oils [26]. The Ts/Tm ratio of Block 1 oil exhibits a significant contrast with that of the Xinguang Gas Field oil. Specifically, the former displays a minimum ratio of 0.06, a maximum ratio of only 0.31, and average and median ratios of 0.14 and 0.13, respectively. In contrast, the latter demonstrates a range of 0.55−1.96, with elevated average and median ratios of 0.95 and 0.87, respectively (Figure 5E). This suggests that oils from Xinguang Gas Field possess significantly higher maturity compared to those from Block 1.

4.3.3. Carbon Isotope

The Fengcheng source rocks, as well as the crude oils from Block 1 and the Xinguang Gas Field, exhibit light carbon isotopes, with values ranging from −32.94‰ to −28.10‰, −30.54‰ to −28.97‰, and −30.78‰ to −28.91‰, with average values of −30.17‰, −30.16‰, and −29.69‰, respectively. In contrast, the Jiamuhe and Xiawuerhe source rocks demonstrate heavier carbon isotope ratios, with ranges of −27.65‰ to −22.20‰ and −27.45‰ to −22.20‰, and average values of −24.82‰ and −23.94‰, respectively (Figure 5D).

4.4. Fluid Inclusion Analysis

4.4.1. Organic Micropetrological Characteristics

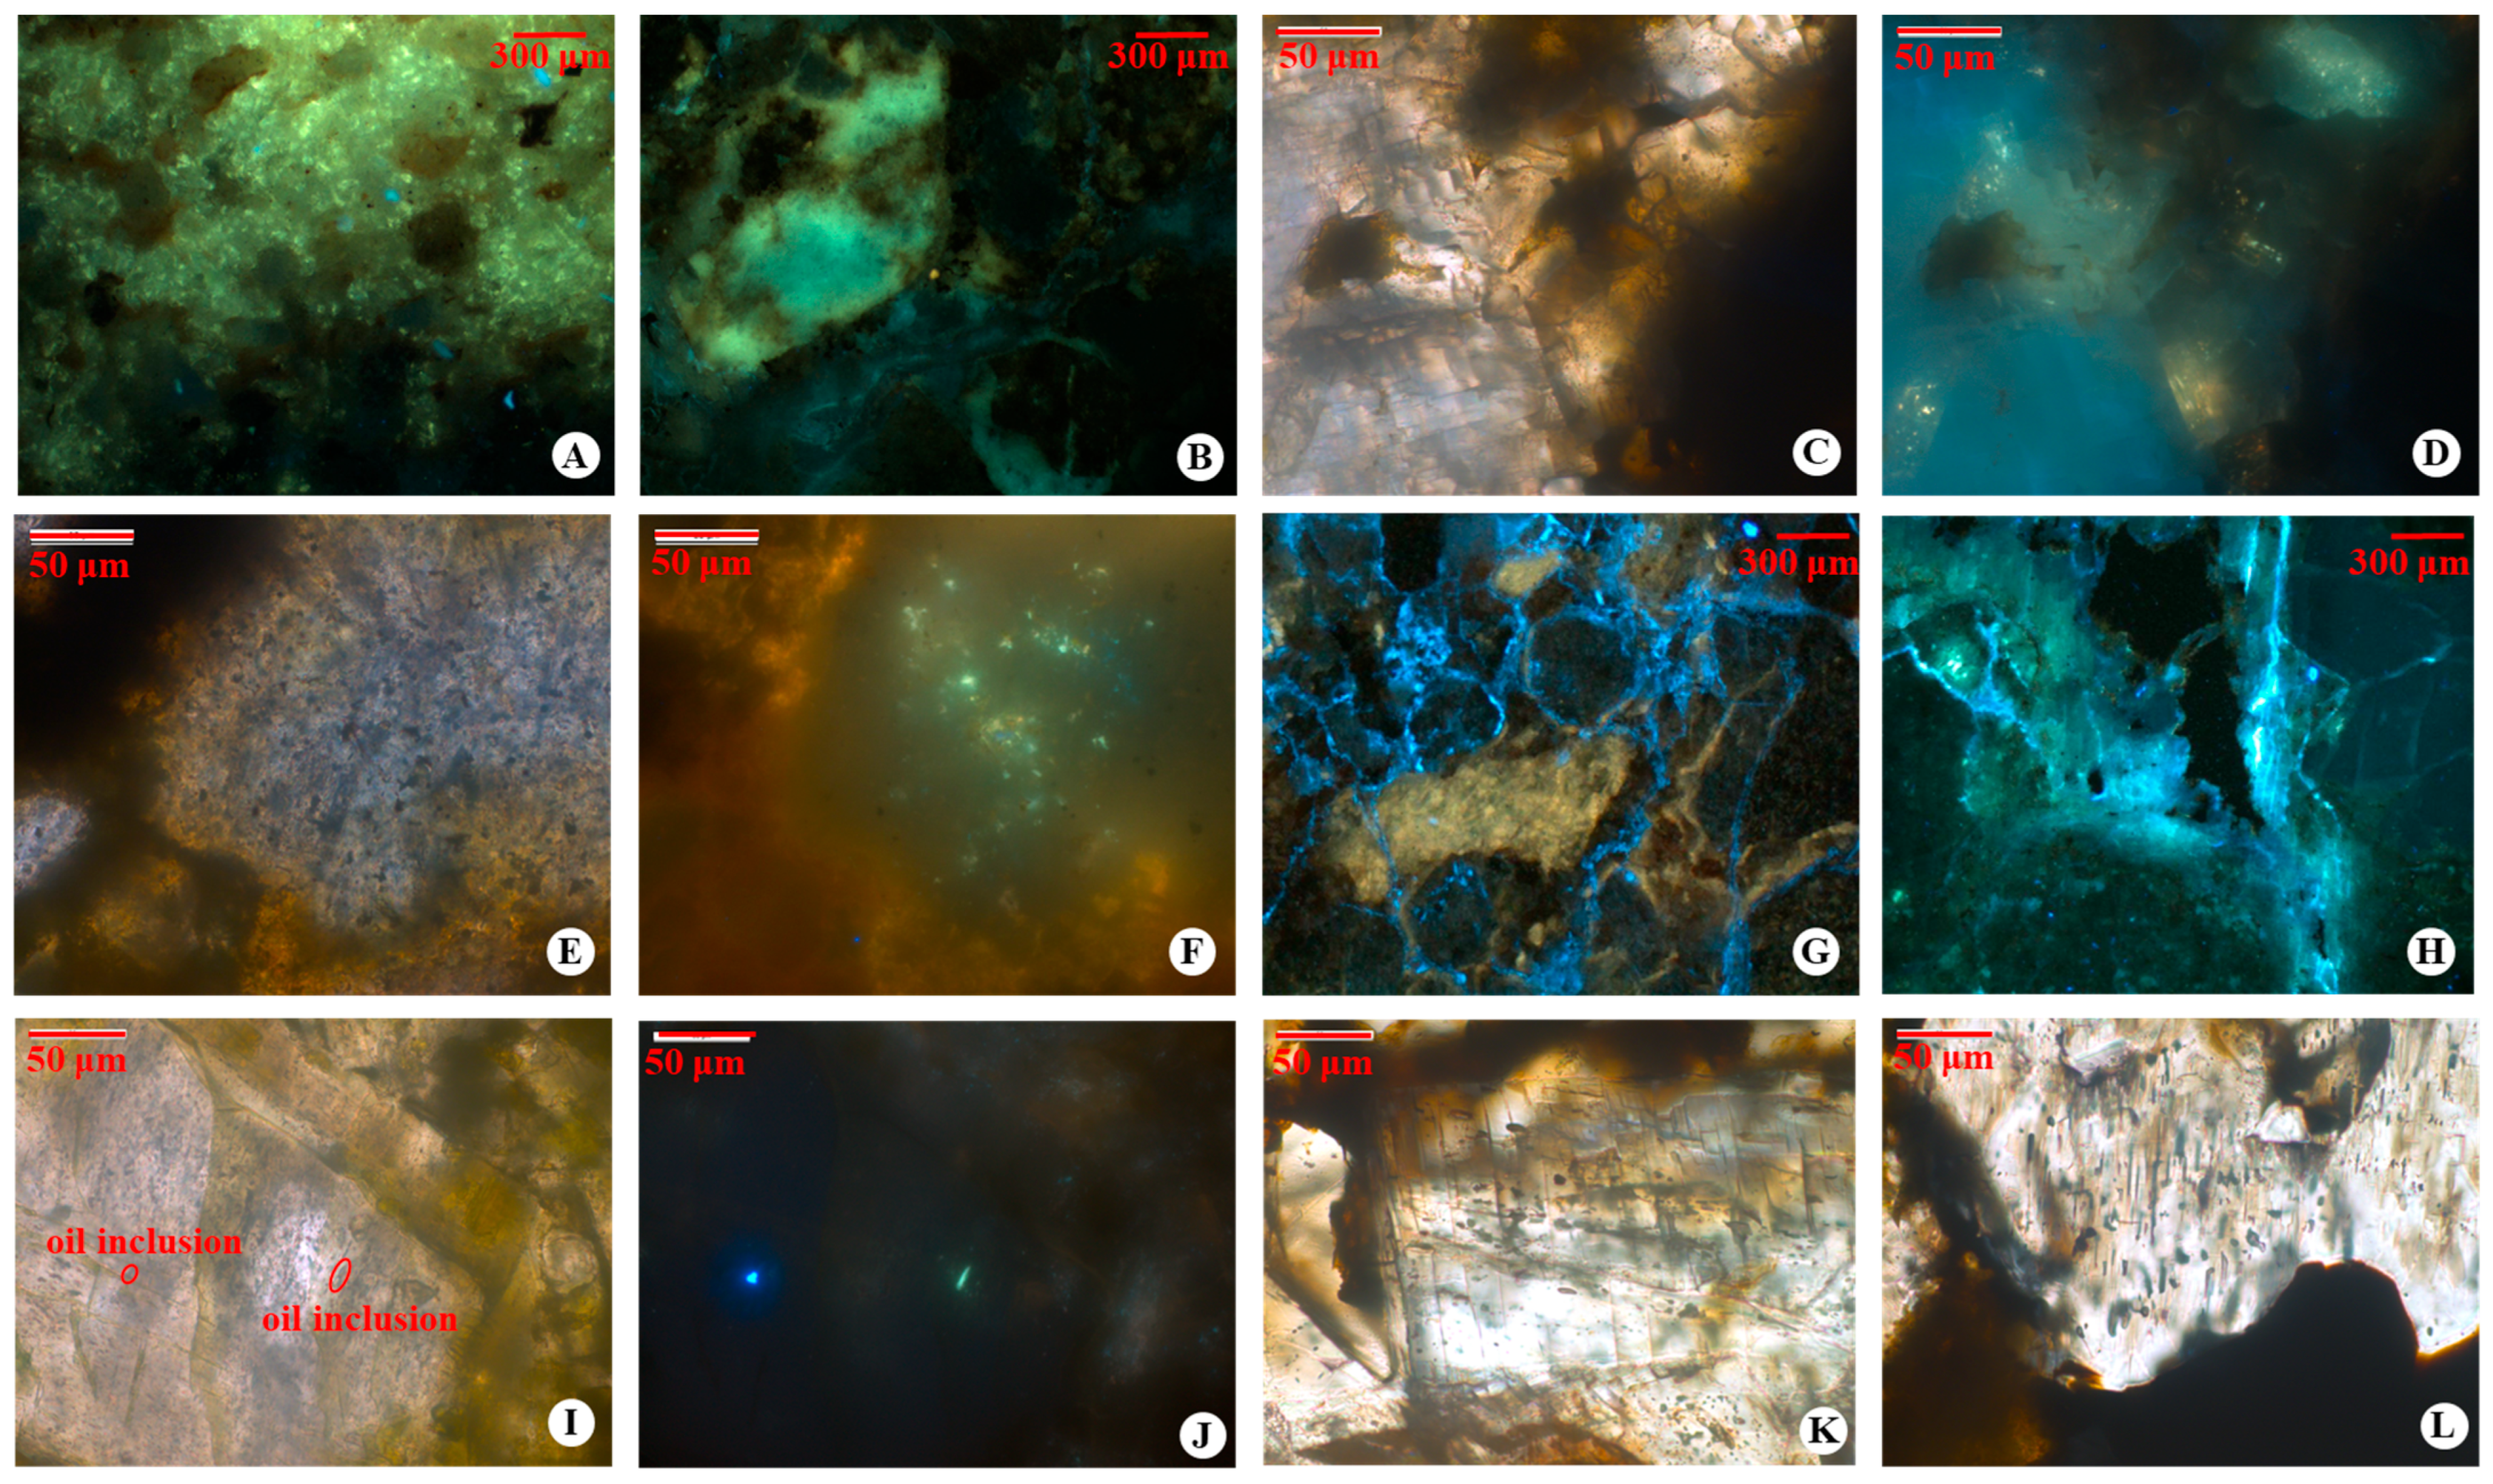
The fluorescence of liquid hydrocarbons can reflect the degree of organic matter evolution, where the fluorescence color changes from brown, orange–yellow, and light yellow, to blue as the organic matter evolves from low to high maturity [34]. Based on the microscopic fluorescence characteristics, the hydrocarbon fluids in the Jiamuhe reservoir of Block 1 primarily exhibit yellow–green or brown fluorescence under ultraviolet excitation (Figure 6A,B). Brown or dark-brown oil inclusions can be observed in the pores or fractures of zeolite minerals under transmitted light (Figure 6C,E), while, under ultraviolet excitation, the enclosed oil appears to have yellow or yellow–green fluorescence (Figure 6D,F). The hydrocarbon fluids in the reservoir of the Xinguang Gas Field exhibit multiple fluorescence colors, including yellow, yellow–green, and blue, under ultraviolet excitation (Figure 6G,H). The oil with yellow and yellow–green fluorescence is mainly distributed within intra-crystalline pores, while the oil exhibiting blue fluorescence is predominantly found in inter-crystalline pores and microfractures, with blue fluorescence bands cutting across the yellow or yellow–green mineral crystals. Their contact relationships suggest that the oil with yellow and yellow–green fluorescence was initially charged into the reservoir, while the oil displaying blue fluorescence was charged during a later stage. Moreover, numerous oil and gas inclusions were observed under a microscope. Oil inclusions (OIs) appeared light brown under transmitted light (Figure 6I), while exhibiting yellow–green and blue fluorescence under ultraviolet excitation (Figure 6J). Gas inclusions (GIs) appeared gray under transmitted light (Figure 6K,L), and did not exhibit any fluorescence color under ultraviolet excitation.

4.4.2. Microthermometry Analysis

The homogenization temperatures of brine inclusions associated with hydrocarbon inclusions, combined with burial and geothermal histories, are commonly used to determine the timing of hydrocarbon accumulation. In reservoir samples from two blocks of the study area, numerous oil and gas inclusions with varying fluorescence colors were observed. The homogenization temperatures of brine inclusions associated with these oil or gas inclusions were measured. The results show that AIs associated with OIs in the reservoir of Block 1 possess a primary homogenization temperature range of 45−100 °C, with a peak temperature of 75−85 °C (Figure 7A). The temperature distribution of the Xinguang Gas Field reservoirs exhibits two distinct normal distribution intervals. The first temperature interval is for AIs associated with yellow or yellow–green OIs, ranging from 40 °C to 90 °C, with a prominent peak observed between 70 °C and 80 °C. The second temperature interval is for AIs associated with blue OIs or GIs, ranging from 90 °C to 130 °C, with a main peak observed between 105 °C and 115 °C (Figure 7B).

4.5. Burial, Thermal, and Pressure Histories of Reservoir

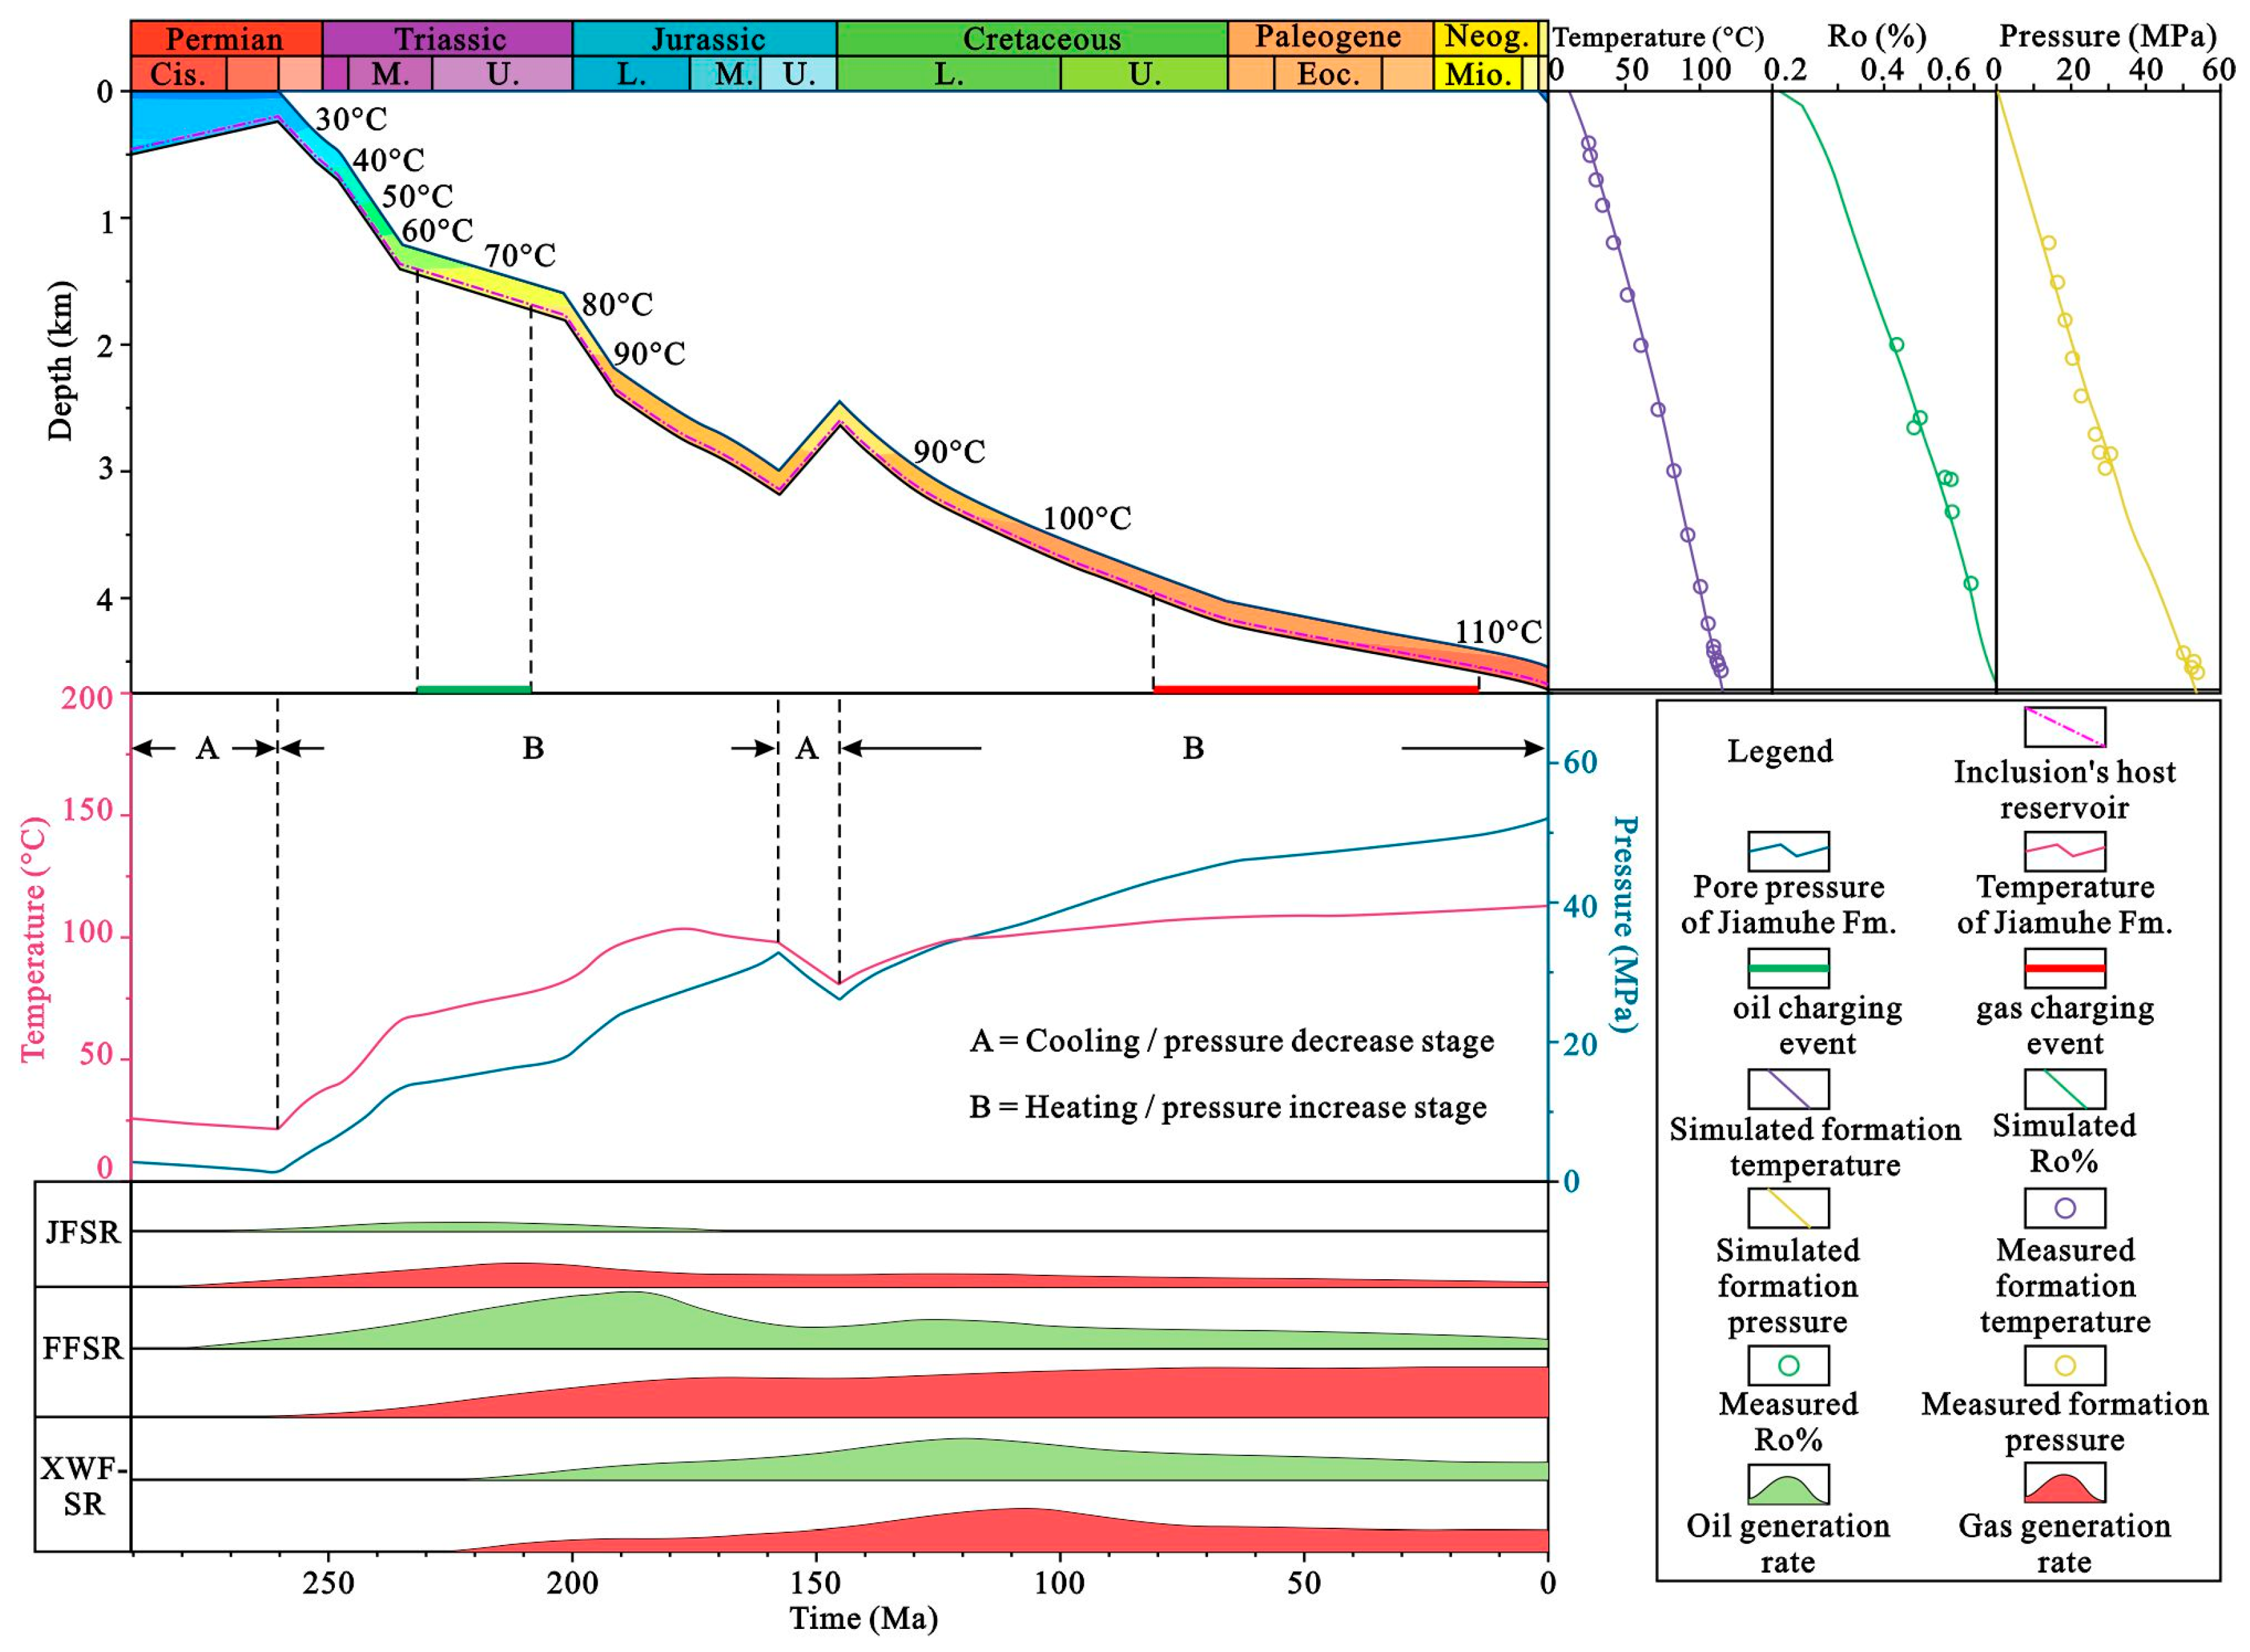
The results show that the simulated formation temperature, Ro, and formation pressure fit well with the measured values, indicating the reliability of the simulation results (Figure 8). During the Early–Middle Permian and Late Jurassic, the study area experienced two notable uplift events. During the Early–Middle Permian, significant uplift caused erosion of the Xiawuerhe, Xiazihe, Fengcheng, and parts of the Jiamuhe formations, partially or completely removing these strata. As a result, reduced overlying strata thickness led to drops in temperature from 26 °C to 23 °C and pressure from 2.85 MPa to 1.28 MPa. From the Late Permian to the Middle Jurassic, continuous subsidence caused an increase in burial depth, accompanied by steady rises in temperature and pressure. The temperature shifted from 23 °C to 104 °C, while the pressure increased from 1.28 MPa to 32.68 MPa. By the Late Jurassic, uplift caused erosion of the overlying strata, reducing temperature to 81.4 °C and pressure to 26.2 MPa, from 98 °C and 32.68 MPa. From the Late Jurassic to the present, the area has been in a state of continuous subsidence, with increasing burial depth. This has resulted in steady rises in reservoir temperature and pressure, which have reached their current values of 113 °C and 52.24 MPa, respectively (Figure 8).

5. Discussion

5.1. Phase State of Reservoir Fluid

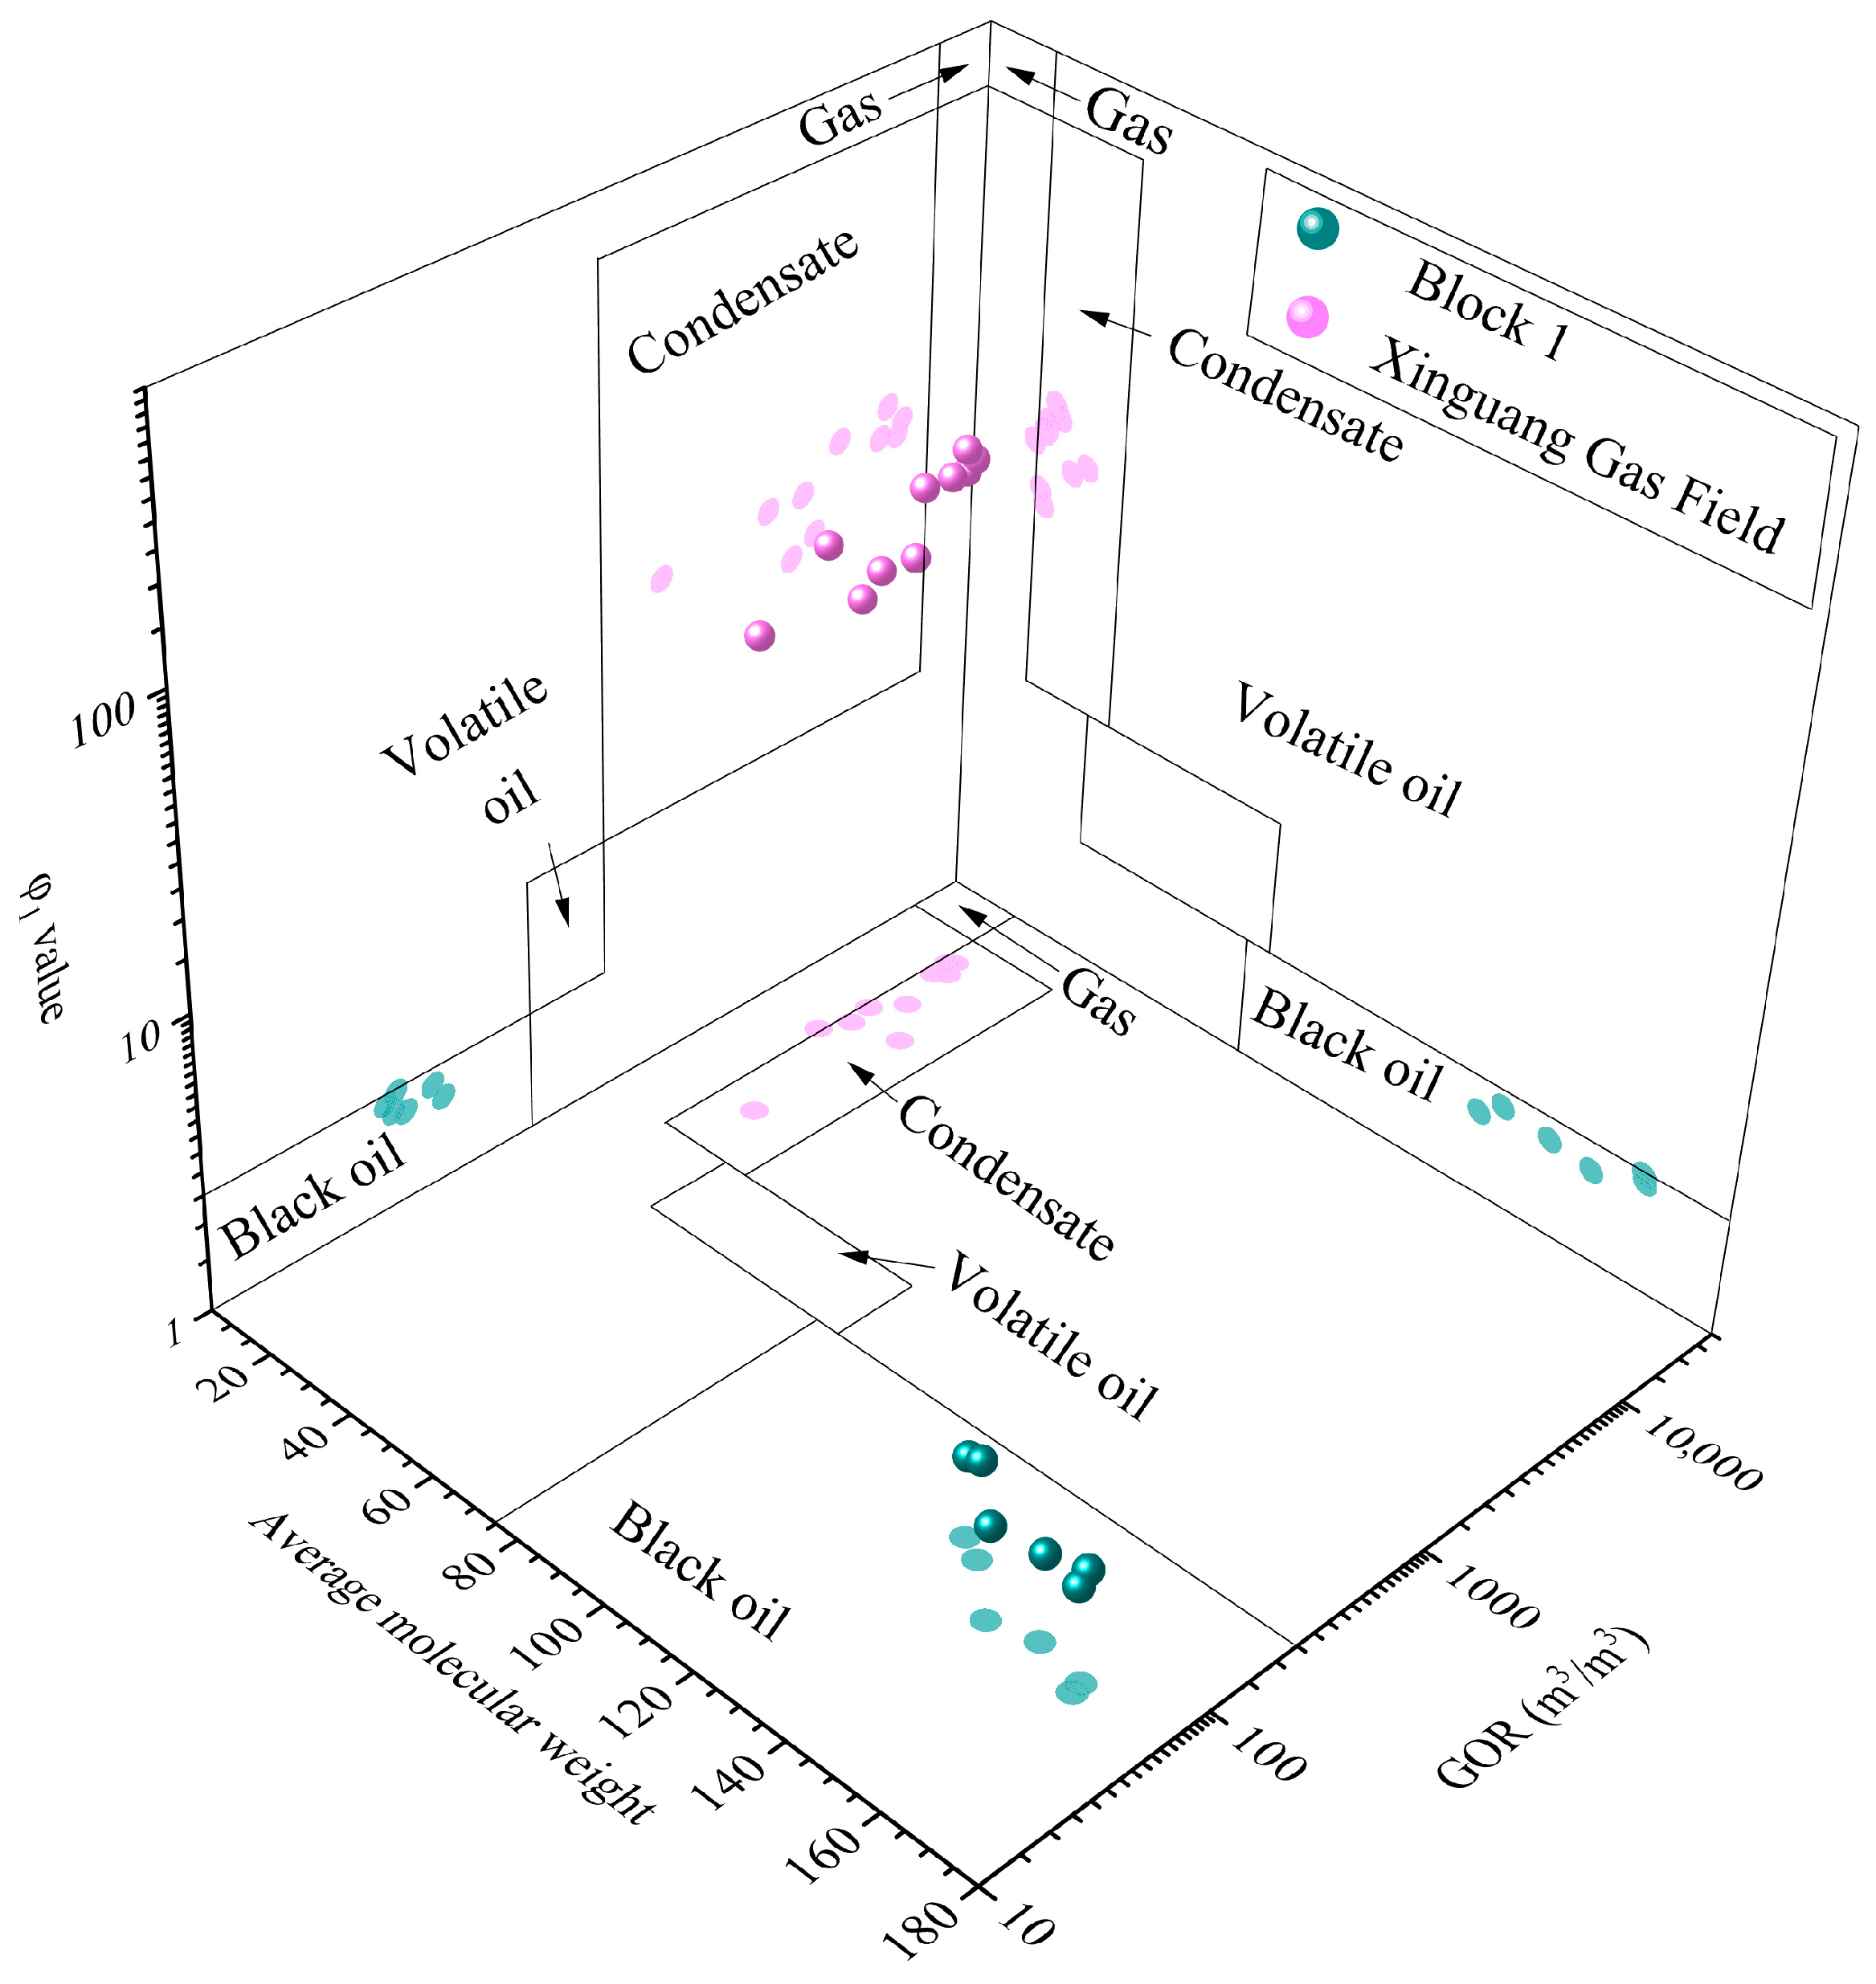
The determination of reservoir fluid phase state is crucial for estimating hydrocarbon reserves, optimizing development strategies, and assessing production dynamics. Key parameters such as GOR, average molecular weight M ¯ ( M ¯ = i = 1 n M i Z i , Mi = molecular weight of component i; Zi = mole fraction of component i; n = number of components), and φ11 = C2/C3 + (C1 + C2 + C3 + C4)/C5+) value are commonly used to identify the phase state of reservoir hydrocarbon fluids [35].
The reservoir fluid properties in Block 1 differ significantly from those in the Xinguang Gas Field. Block 1 has lower GOR, higher M ¯ , and lower φ1 values, with GOR ranging from 57.38 to 102 m3/m3, M ¯ between 128 and 163, and φ1 values between 1.9 and 2.3. These characteristics classify it as typical black oil (Figure 9). In contrast, the Xinguang Gas Field has higher GOR, lower M ¯ , and higher φ1 values, with GOR exceeding 1000 m3/m3, M ¯ ranging from 21 to 28, and φ1 between 40 and 62, classifying it as condensate (Figure 9). The CCE of reservoir fluid reveals that the fluid is a single-phase gas at high pressure, which condenses into liquid hydrocarbons as pressure decreases, exhibiting typical condensate gas behavior. This result aligns with the classification conclusions mentioned above. Its hydrocarbon phase behavior, characterized by a condensate-dominated system, exhibits strong similarities to that of the South Pars Gas Field, which is marked by high methane content (>90%) and high GOR values [36].
Temperature and pressure conditions significantly influence the phase behavior of hydrocarbon fluids. As illustrated in the P-T diagram, when the reservoir temperature is below the critical temperature, and the pressure exceeds the bubble point pressure at each corresponding temperature, the fluid remains in the liquid phase. Conversely, when the reservoir pressure falls below the critical pressure and the temperature surpasses the dew point temperature at each corresponding pressure, the fluid exists in the gas phase. If the reservoir temperature and pressure lie within the envelope formed by the dew point and bubble point lines, the fluid displays a gas–liquid two-phase state. When both the reservoir temperature and pressure exceed the critical values, and the pressure surpasses the saturation pressure at the reservoir temperature, the fluid enters a supercritical state (Figure 10A,B).
The hydrocarbon fluid in Block 1 exhibits large critical temperatures (>400 °C) and cricondentherms (>450 °C), along with small critical pressures (<10 MPa) and cricondenbars (<20 MPa). Its flattened phase envelope is characteristic of typical black oil. Under current reservoir conditions, the fluid exists as liquid-phase black oil (Figure 10A). In contrast, the hydrocarbon fluid in the Xinguang Gas Field has smaller cricondentherms (<350 °C), smaller critical temperatures (<100 °C), and larger cricondenbar pressures (>30 MPa). Its tall, narrow phase envelope reflects condensate gas characteristics. Given the reservoir conditions, where the temperature is well above the critical temperature and the pressure exceeds both the critical and saturation pressures, the fluid exists in a supercritical state (Figure 10B).

5.2. Charging Period and Time of Hydrocarbon Fluids

To better understand the deep hydrocarbon accumulation processes, a systematic study on the charging phases of deep reservoirs in different zones of the study area was conducted. Fluid inclusion fluorescence characteristics and homogenization temperature measurements indicate two distinct phases of hydrocarbon charging. The early phase involved the injection of low- to moderate-maturity oil, characterized by yellow to yellow–green fluorescence. In contrast, the later phase involved highly mature oil and natural gas, with the former displaying blue fluorescence, while the latter lacked fluorescence.
In Block 1, most hydrocarbons display yellow or yellow–green fluorescence under UV light (Figure 6A–F), with blue-fluorescent oil and non-fluorescent natural gas occurring infrequently. The crude oil in this reservoir shows relatively low maturity (Figure 5E), and the natural gas has a low dryness coefficient (Table 4). Therefore, Block 1 primarily underwent the first phase of hydrocarbon charging, characterized by low- to moderate-maturity oil, with minimal subsequent input from highly mature oil and natural gas. In the Xinguang Gas Field, substantial amounts of yellow- to yellow–green-fluorescent oil, blue-fluorescent oil, and non-fluorescent gas were observed. The crude oil in this reservoir exhibits higher maturity (Figure 5E), and the natural gas is notably drier (Table 4). This suggests that the Xinguang Gas Field experienced two distinct hydrocarbon charging phases. The yellow–green-fluorescent hydrocarbons represent the initial phase, involving low-maturity to mature oil, similar to the charging in Block 1. Based on burial history, thermal evolution, and fluid inclusion homogenization temperatures, the first phase occurred during the Middle to Late Triassic (approximately 231.9–208.6 Ma). The second phase, dominated by highly mature oil and natural gas, occurred between the Late Cretaceous and Early Neogene (approximately 81.1–14.3 Ma) (Figure 8).

5.3. Oil and Gas Source

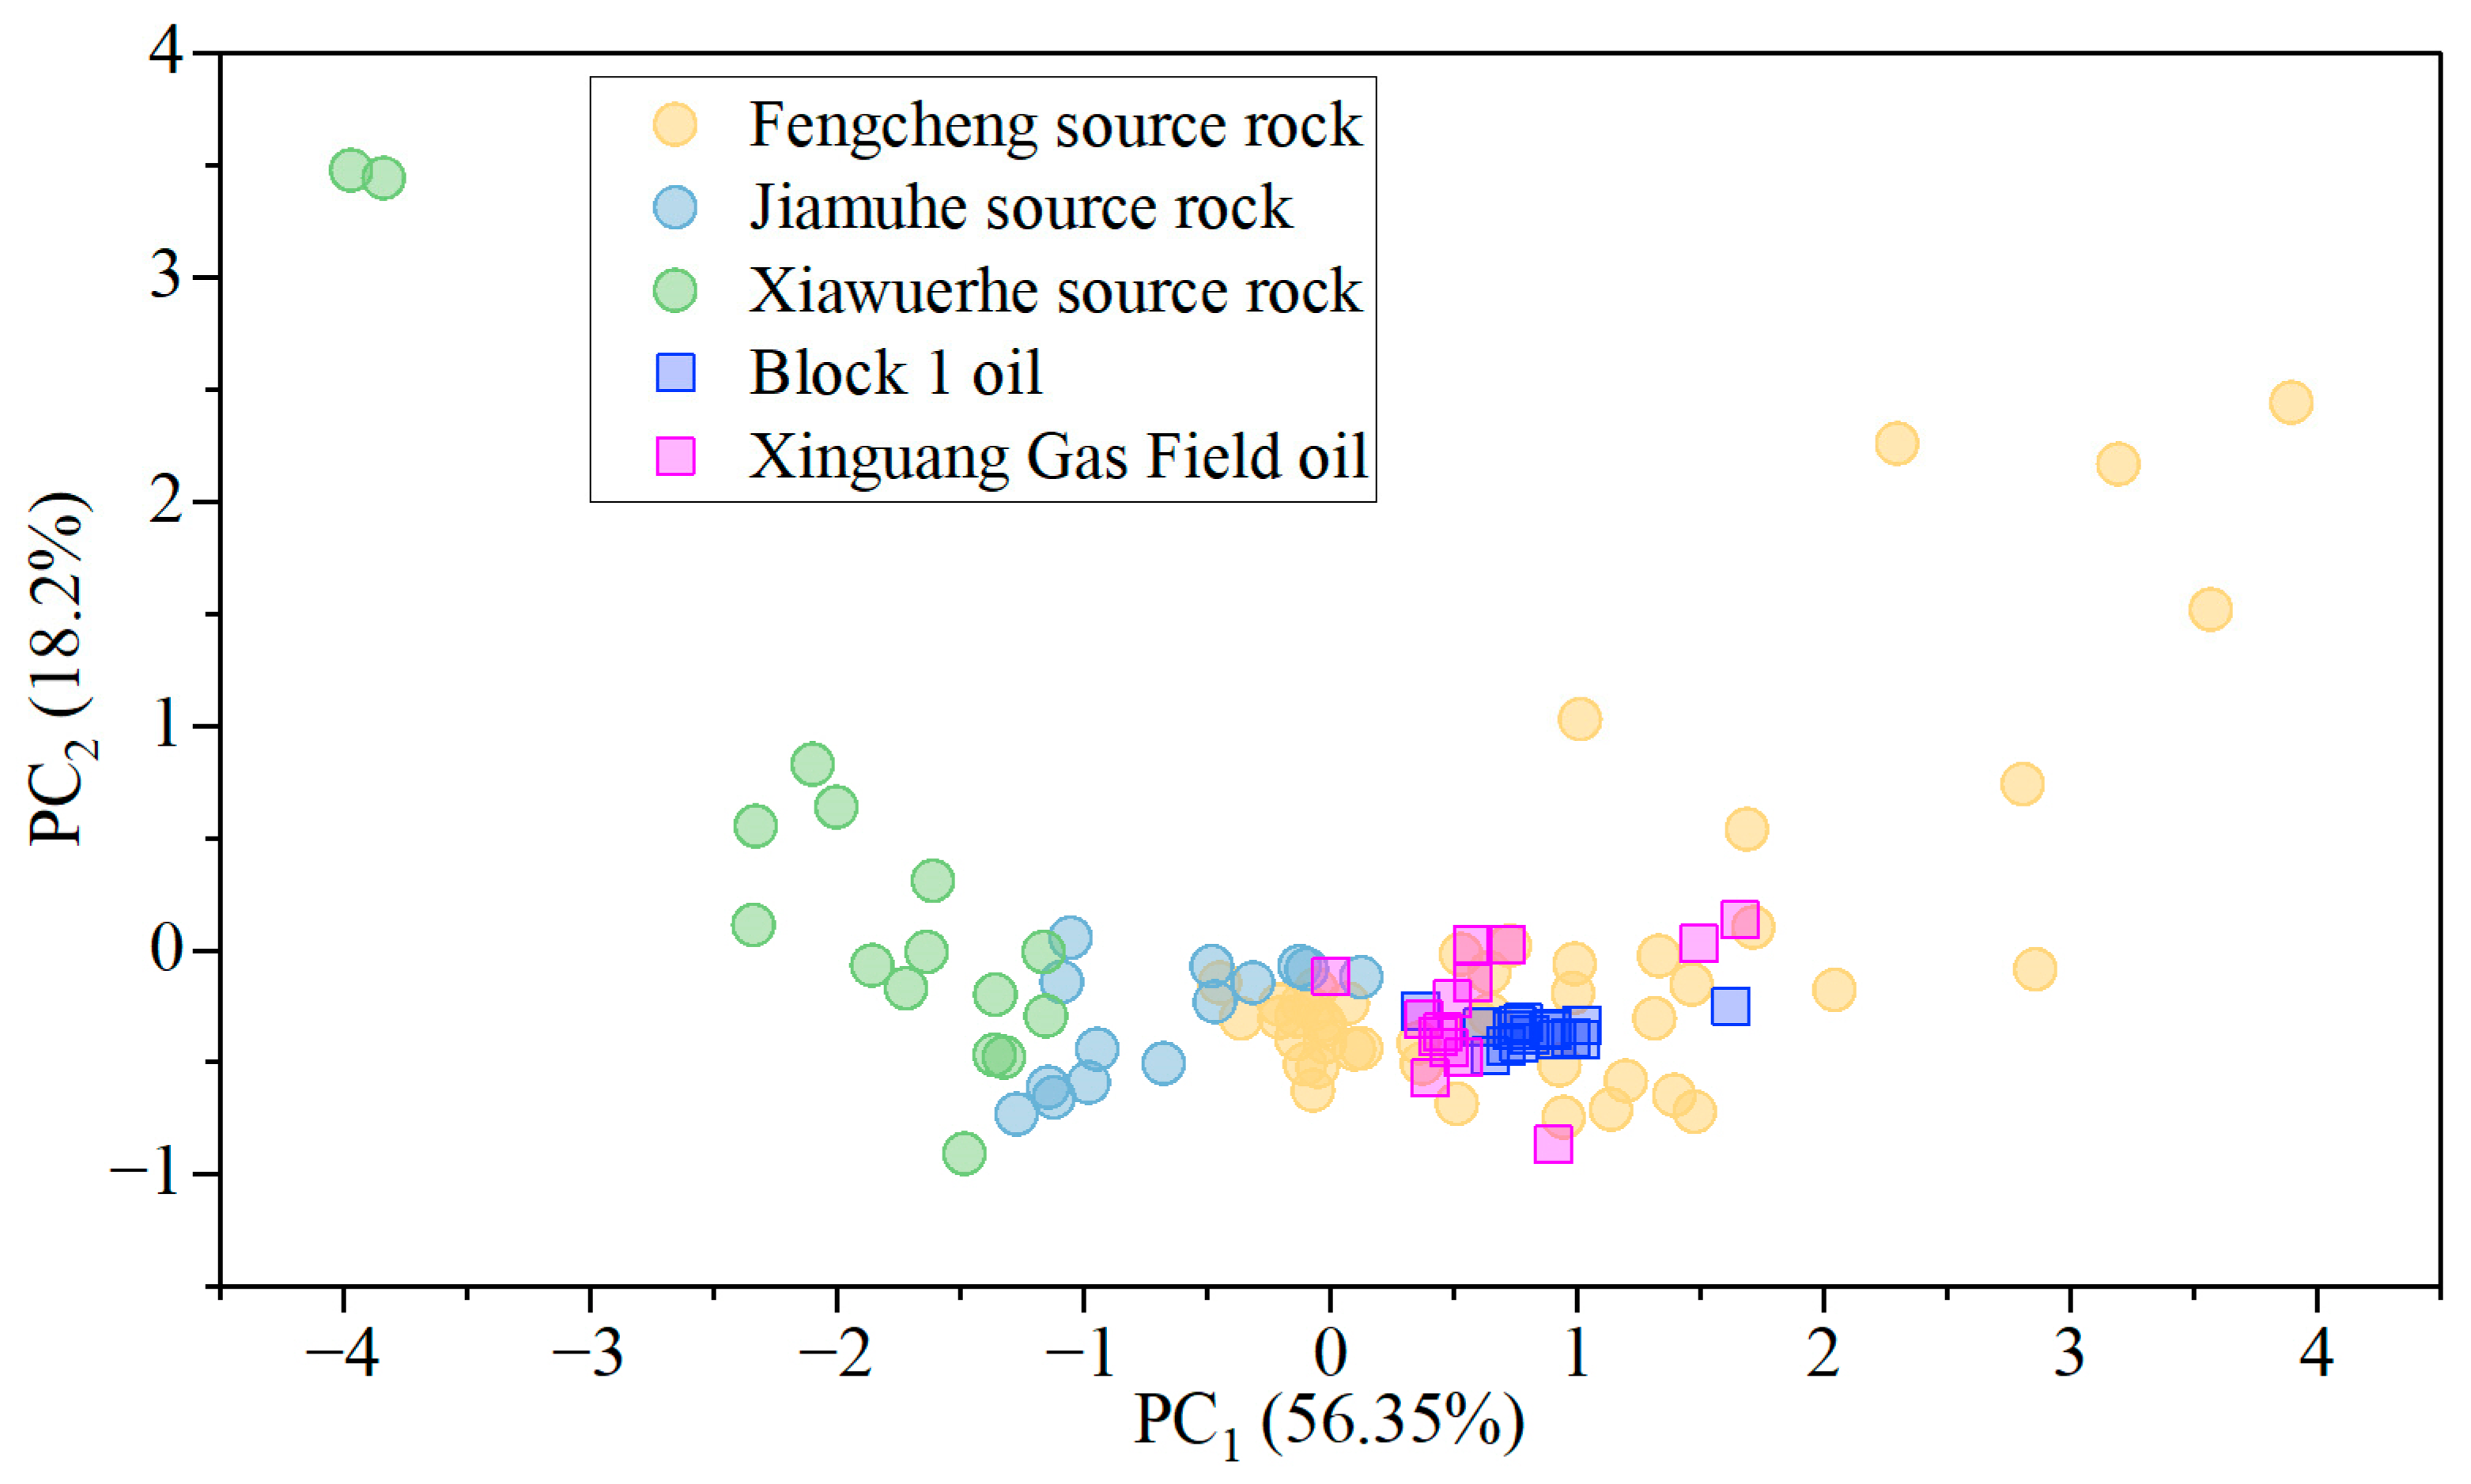
A comprehensive investigation of geochemical and geological evidence was conducted to identify the source of oils from Blocks 1 and 2. Geochemical evidence derived from oil-source correlation based on principal component analysis (PCA) using Pr/Ph, Gam/C30H, β-carotene/Cmax, and extracted carbon isotopes. The results showed clear differentiation among the Fengcheng, Jiamuhe, and Xiawuerhe source rocks. This differentiation is characterized by higher PC1 and PC2 values for Fengcheng, moderate PC1 and lower PC2 values for Jiamuhe, and lower PC1 and higher PC2 values for Xiawuerhe. Oil-source correlation indicates a strong affinity between the oils from Block 1, the Xinguang Gas Field, and the Fengcheng source rocks, suggesting that both the mature oil in Block 1 and the highly mature oil and gas in Xinguang Gas Field originate from the Fengcheng source rock (Figure 11). A more precise method for tracing oil and gas sources should not only analyze biomarker affinity, but also incorporate geological reality to achieve a reasonable historical match with hydrocarbon generation and charging [7]. From a geological perspective, the first hydrocarbon charging was an oil charging event that occurred during the Middle–Late Triassic period (approximately 231.9−208.6 Ma). The oil generation peak of the Xiawuerhe Fm. postdated this charging event (Figure 8), indicating that this source rock could not have contributed to this oil charging. In contrast, the hydrocarbon generation peaks of the Jiamuhe Fm. and the Fengcheng Fm. align well with this charging period. However, the Jiamuhe Fm. source rocks are prone to gas generation with low oil yields, whereas the Fengcheng Fm. source rocks are capable of generating significant quantities of oil during this period, making it more likely to have been the source of this oil charging. The second hydrocarbon charging was a primarily gas charging event and occurred during the Late Cretaceous to Early Neogene period (approximately 81.1−14.3 Ma). Both the Jiamuhe Fm. and Xiawuerhe Fm. generated large amounts of gas prior to this charging period, whereas the Fengcheng Fm. was experiencing a peak in gas generation during this timeframe (Figure 8). Therefore, the Fengcheng Fm. is identified as the source rock responsible for this gas charging event. In summary, the hydrocarbons from two charging stages originate from the Fengcheng Fm. source rocks, consistent with conclusions drawn from geochemical evidence.

5.4. Evolution of Reservoir Hydrocarbon Fluid Composition and Temperature–Pressure Conditions

In hydrocarbon reservoirs, both fluid composition and temperature–pressure conditions play a critical role in determining phase behavior [13,37].

5.4.1. Composition Evolution of Reservoir Hydrocarbon Fluid

The composition of hydrocarbon fluids determines their chemical properties, with different compositions resulting in phase states such as black oil, volatile oil, condensate gas, or natural gas [1,37]. The composition evolution of reservoir hydrocarbon fluid is typically influenced by multiple factors, including multiphase hydrocarbon charging, biodegradation, and crude oil cracking [1,38]. Fluorescence and charge sequencing analysis of inclusions suggests that the hydrocarbon fluids in the Xinguang Gas Field reservoir are a mixture of early-stage low-maturity to mature oil and later-stage high-maturity oil and gas, with their compositional evolution clearly influenced by multi-phase charging.
Based on the reservoir’s charge and burial histories, the temperature in the study area has remained between 70 and 120 °C since the initial oil and gas charging. Experimental studies and field exploration indicate that the optimal temperature range for microbial oil degradation is near-surface or shallow subsurface temperatures, with an upper limit around 60–80 °C [7,33]. Therefore, after hydrocarbon charging, the reservoir temperature has always been above the threshold for biodegradation, making conditions unsuitable for microbial degradation. Previous investigations suggest that the temperature range for the onset of oil cracking is typically 160–170 °C [39,40], while the maximum temperature in the study area is only 120 °C, well below the threshold required for oil cracking. Previous studies indicate that the natural gas in the study area is derived from kerogen pyrolysis, with no evidence of oil cracking gas [17]. In conclusion, it can be determined that no thermal cracking of oil has occurred in the study area. Therefore, the evolution of hydrocarbon fluid compositions in the reservoir is primarily influenced by multi-phase hydrocarbon charging.
To clarify the evolution of hydrocarbon fluid compositions in the Block 1 reservoir, it is essential to distinguish the hydrocarbon components from different charging stages. The current hydrocarbon composition in the Xinguang Gas Field can be considered a mixture resulting from two hydrocarbon charging events. To determine whether the hydrocarbons in Block 1 reflect the hydrocarbon state after the first charging event in the Xinguang Gas Field, further investigations on the source of the oils from both blocks were conducted. Based on biomarkers, carbon isotopes, and source rock analysis, both oil samples originate from the Fengcheng Fm., a source rock characterized by a strong reducing environment, distinct water stratification, and high inputs of lower organisms, indicating an affinity in depositional setting and biological source (Figure 5 and Figure 11). Although the maturity of Block 1 oil is significantly lower than that of the Xinguang Gas Field, this is due to the early-stage hydrocarbon charge in Block 1 and the later-stage high-maturity hydrocarbons in the Xinguang Gas Field. Therefore, the hydrocarbons in Block 1 can represent those charged during the first stage in the Xinguang Gas Field.
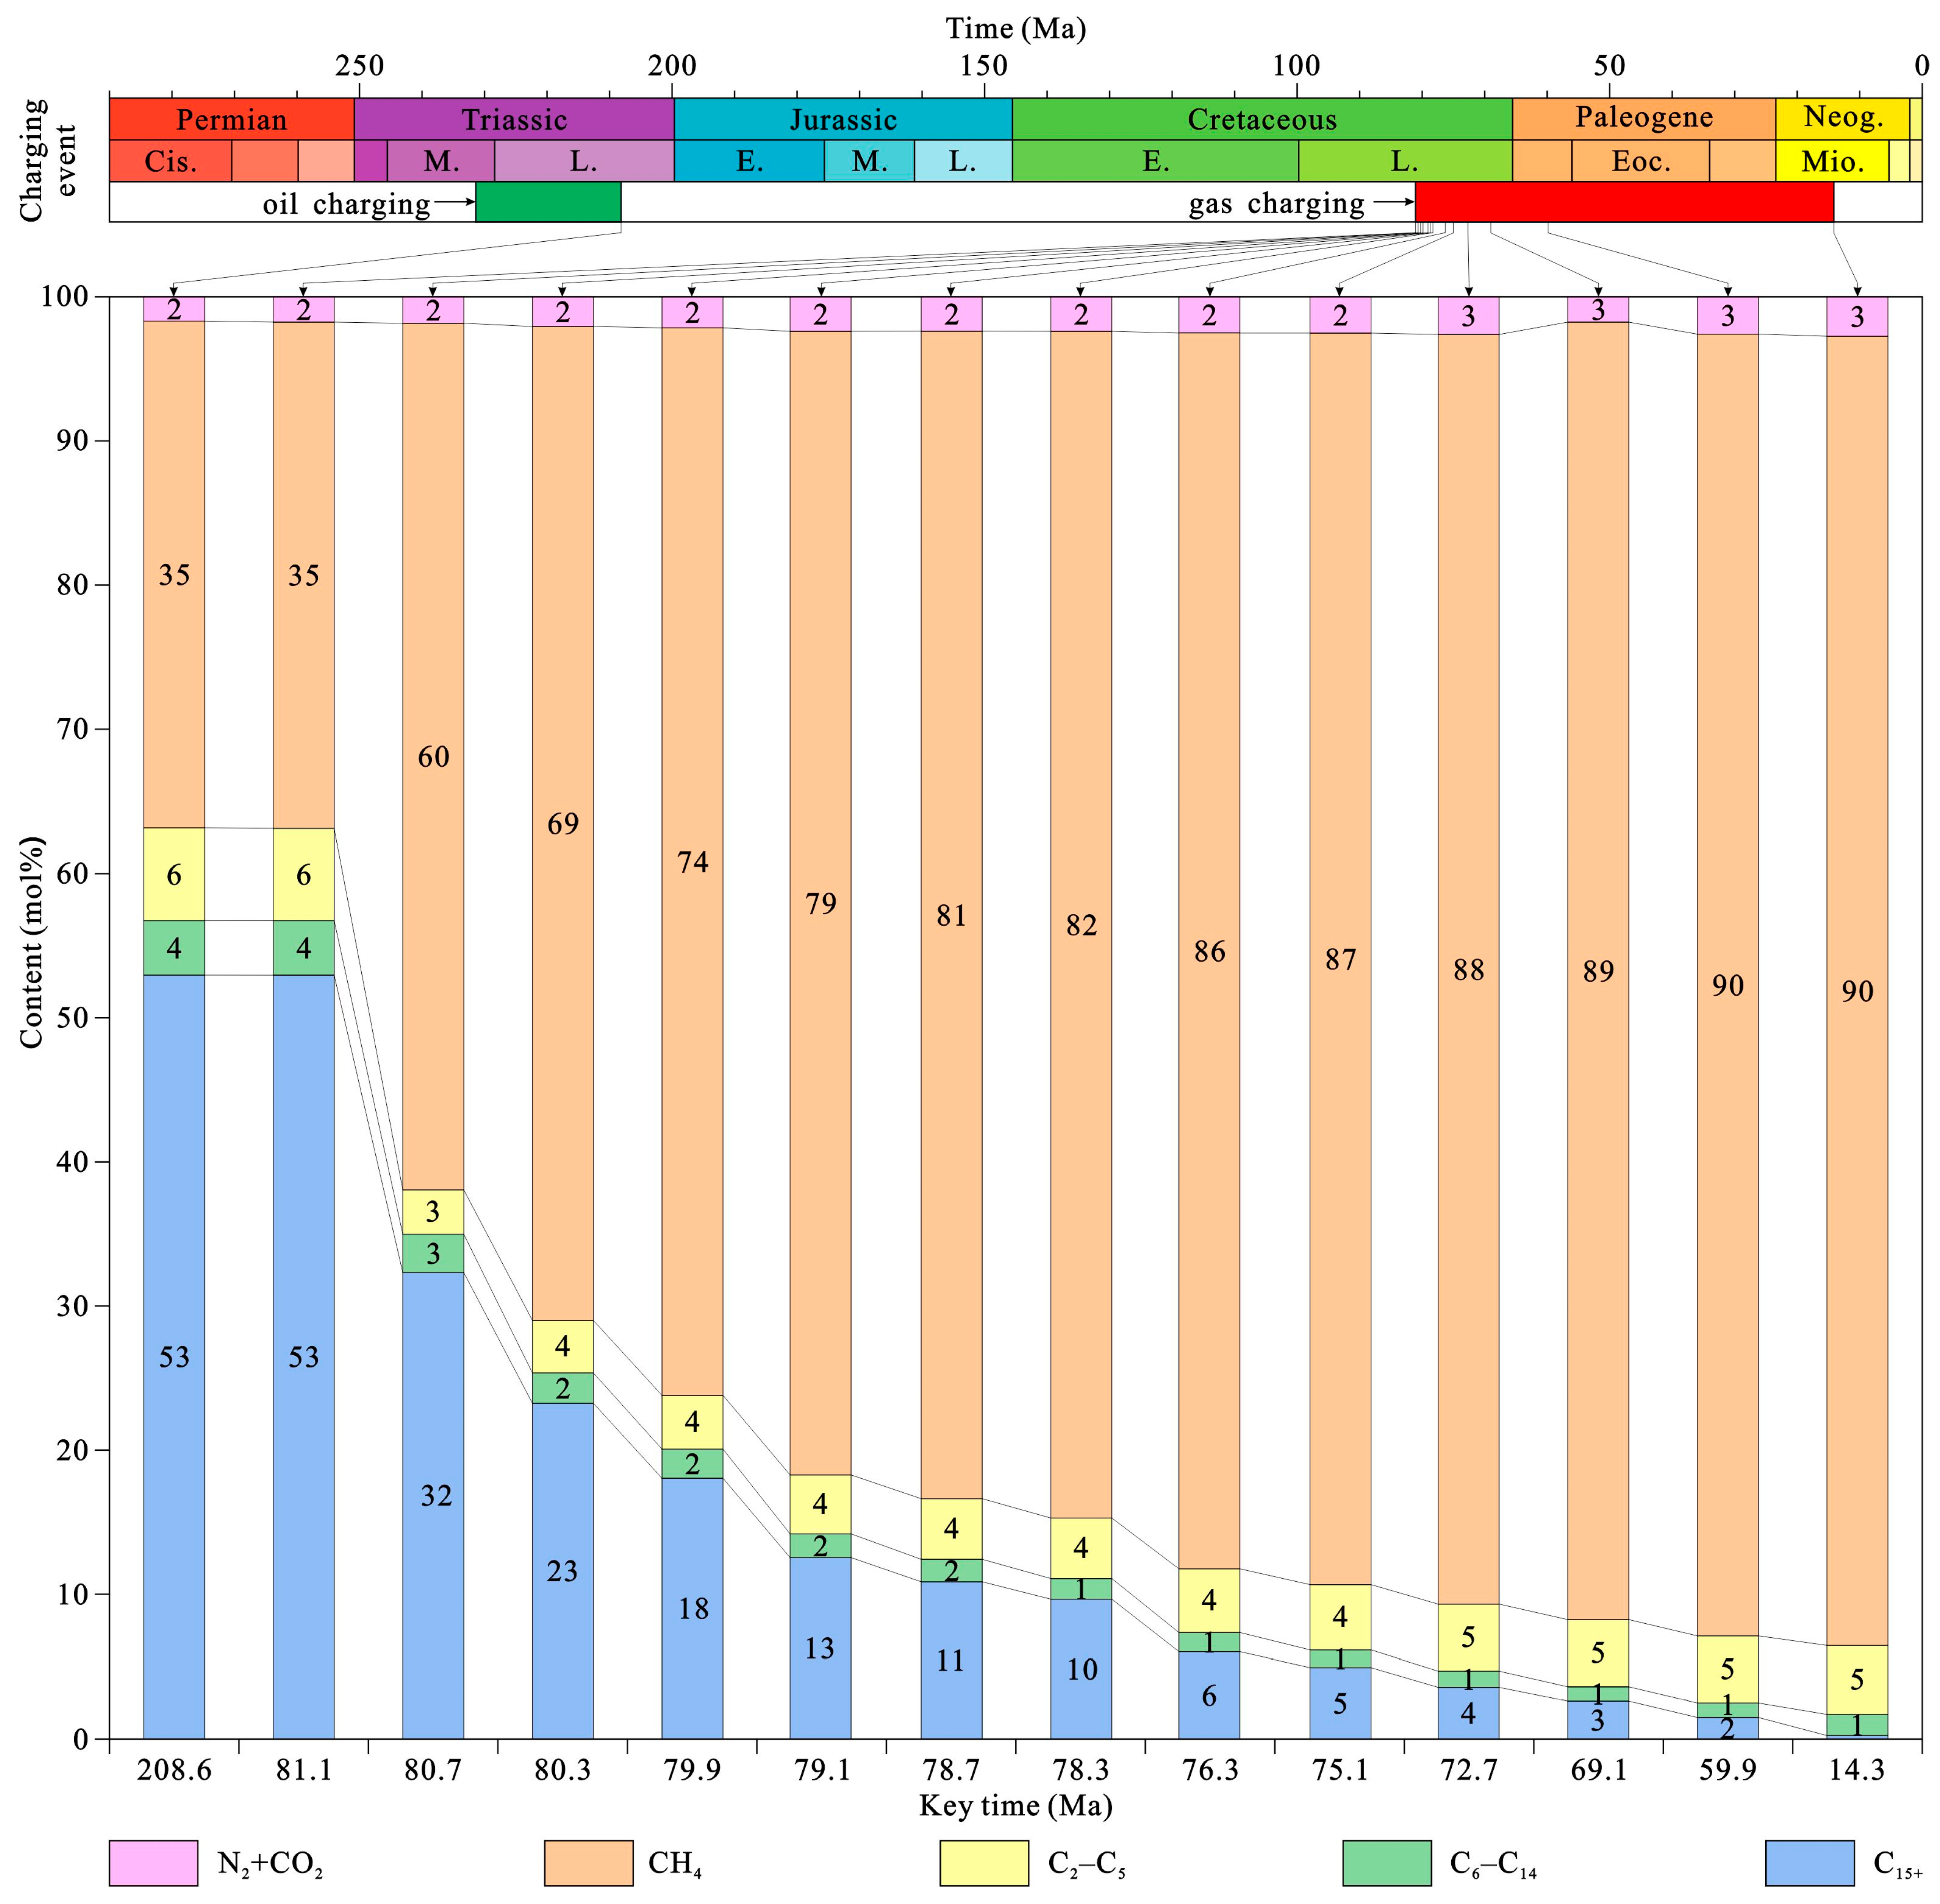
PVTsim software was used to reconstruct the evolution history of hydrocarbon fluid compositions in the study area. The results show that the non-hydrocarbon components (N2 + CO2) and C1 content increase with the rising GOR. The non-hydrocarbon content shows a slow increase, ranging from 2% to 3%. The C1 molar content remains at 35% between the first and second hydrocarbon charges, with no substantial change in fluid composition. After the second charge, as gas charging continues, the C1 molar content rapidly rises, reaching a maximum of 90% by the end of the second charge. The C2–C5 and C6–C14 components show relatively small variation ranges, fluctuating within 3–6 and 1–4, respectively. The C15+ component decreases sharply with the increase in gas charging degree, dropping from the initial 53% to less than 1% (Figure 12).

5.4.2. Evolution of Reservoir Temperature, Pressure, and Fluid Property Parameters

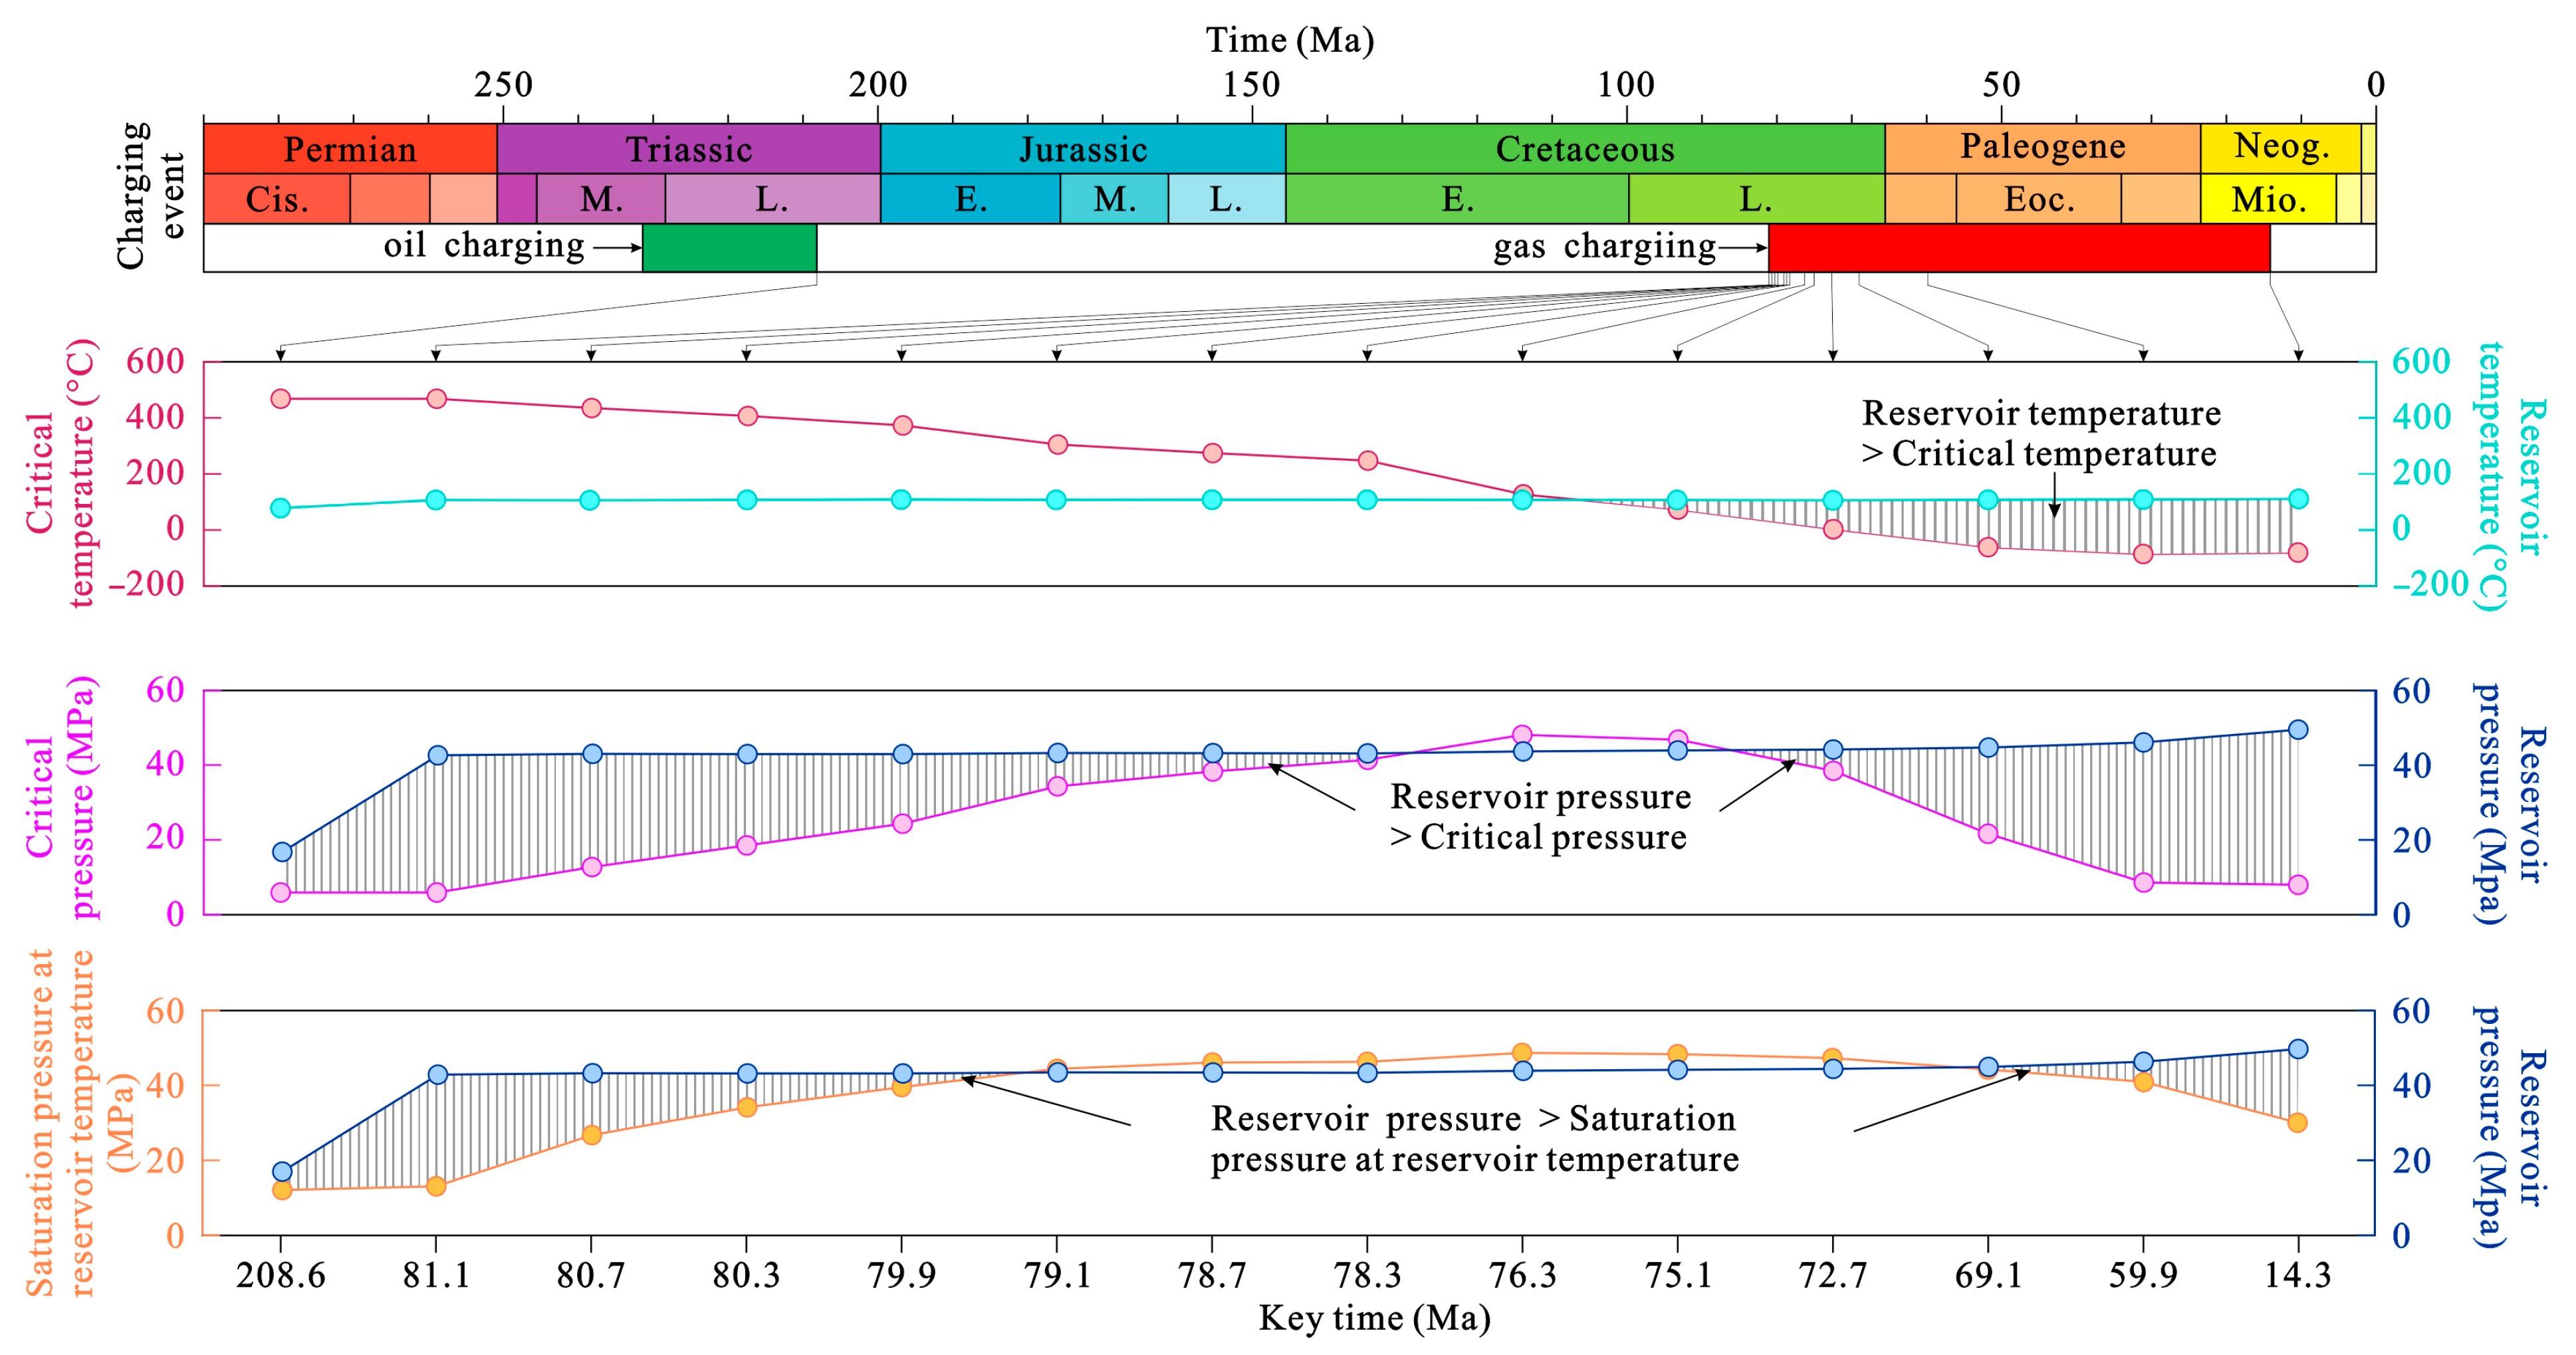
Changes in the composition of reservoir fluids lead to variations in key physical properties, such as critical temperature, critical pressure, cricondentherm, and cricondenbar. As the reservoir undergoes subsidence and uplift, its temperature and pressure also evolve. The co-evolution of reservoir fluid properties and reservoir temperature–pressure conditions drives phase transitions, including gas, liquid, gas–liquid two-phase, and supercritical states [13]. Throughout geological history, reservoir temperature exhibited a gradual upward trend, with a slight decline during sedimentation (Figure 8). The critical temperature of hydrocarbon fluids continuously declined, remaining higher than the reservoir temperature until the GOR reached 2430.74 m3/m3, after which it fell below the reservoir temperature. Reservoir pressure exhibited a trend similar to that of temperature, with both showing an overall increase. The critical pressure and the saturation pressure of reservoir fluids at reservoir temperature showed a “rise-then-fall” pattern. When GOR < 620.01 m3/m3 or approximately GOR > 1500 m3/m3, reservoir pressure exceeded the critical pressure of the fluids. Similarly, when GOR < 450 m3/m3 or GOR > 2430.74 m3/m3, reservoir pressure surpassed the saturation pressure at reservoir temperature (Figure 13).

5.5. Evolution Process of Hydrocarbon Fluid Phase Behavior

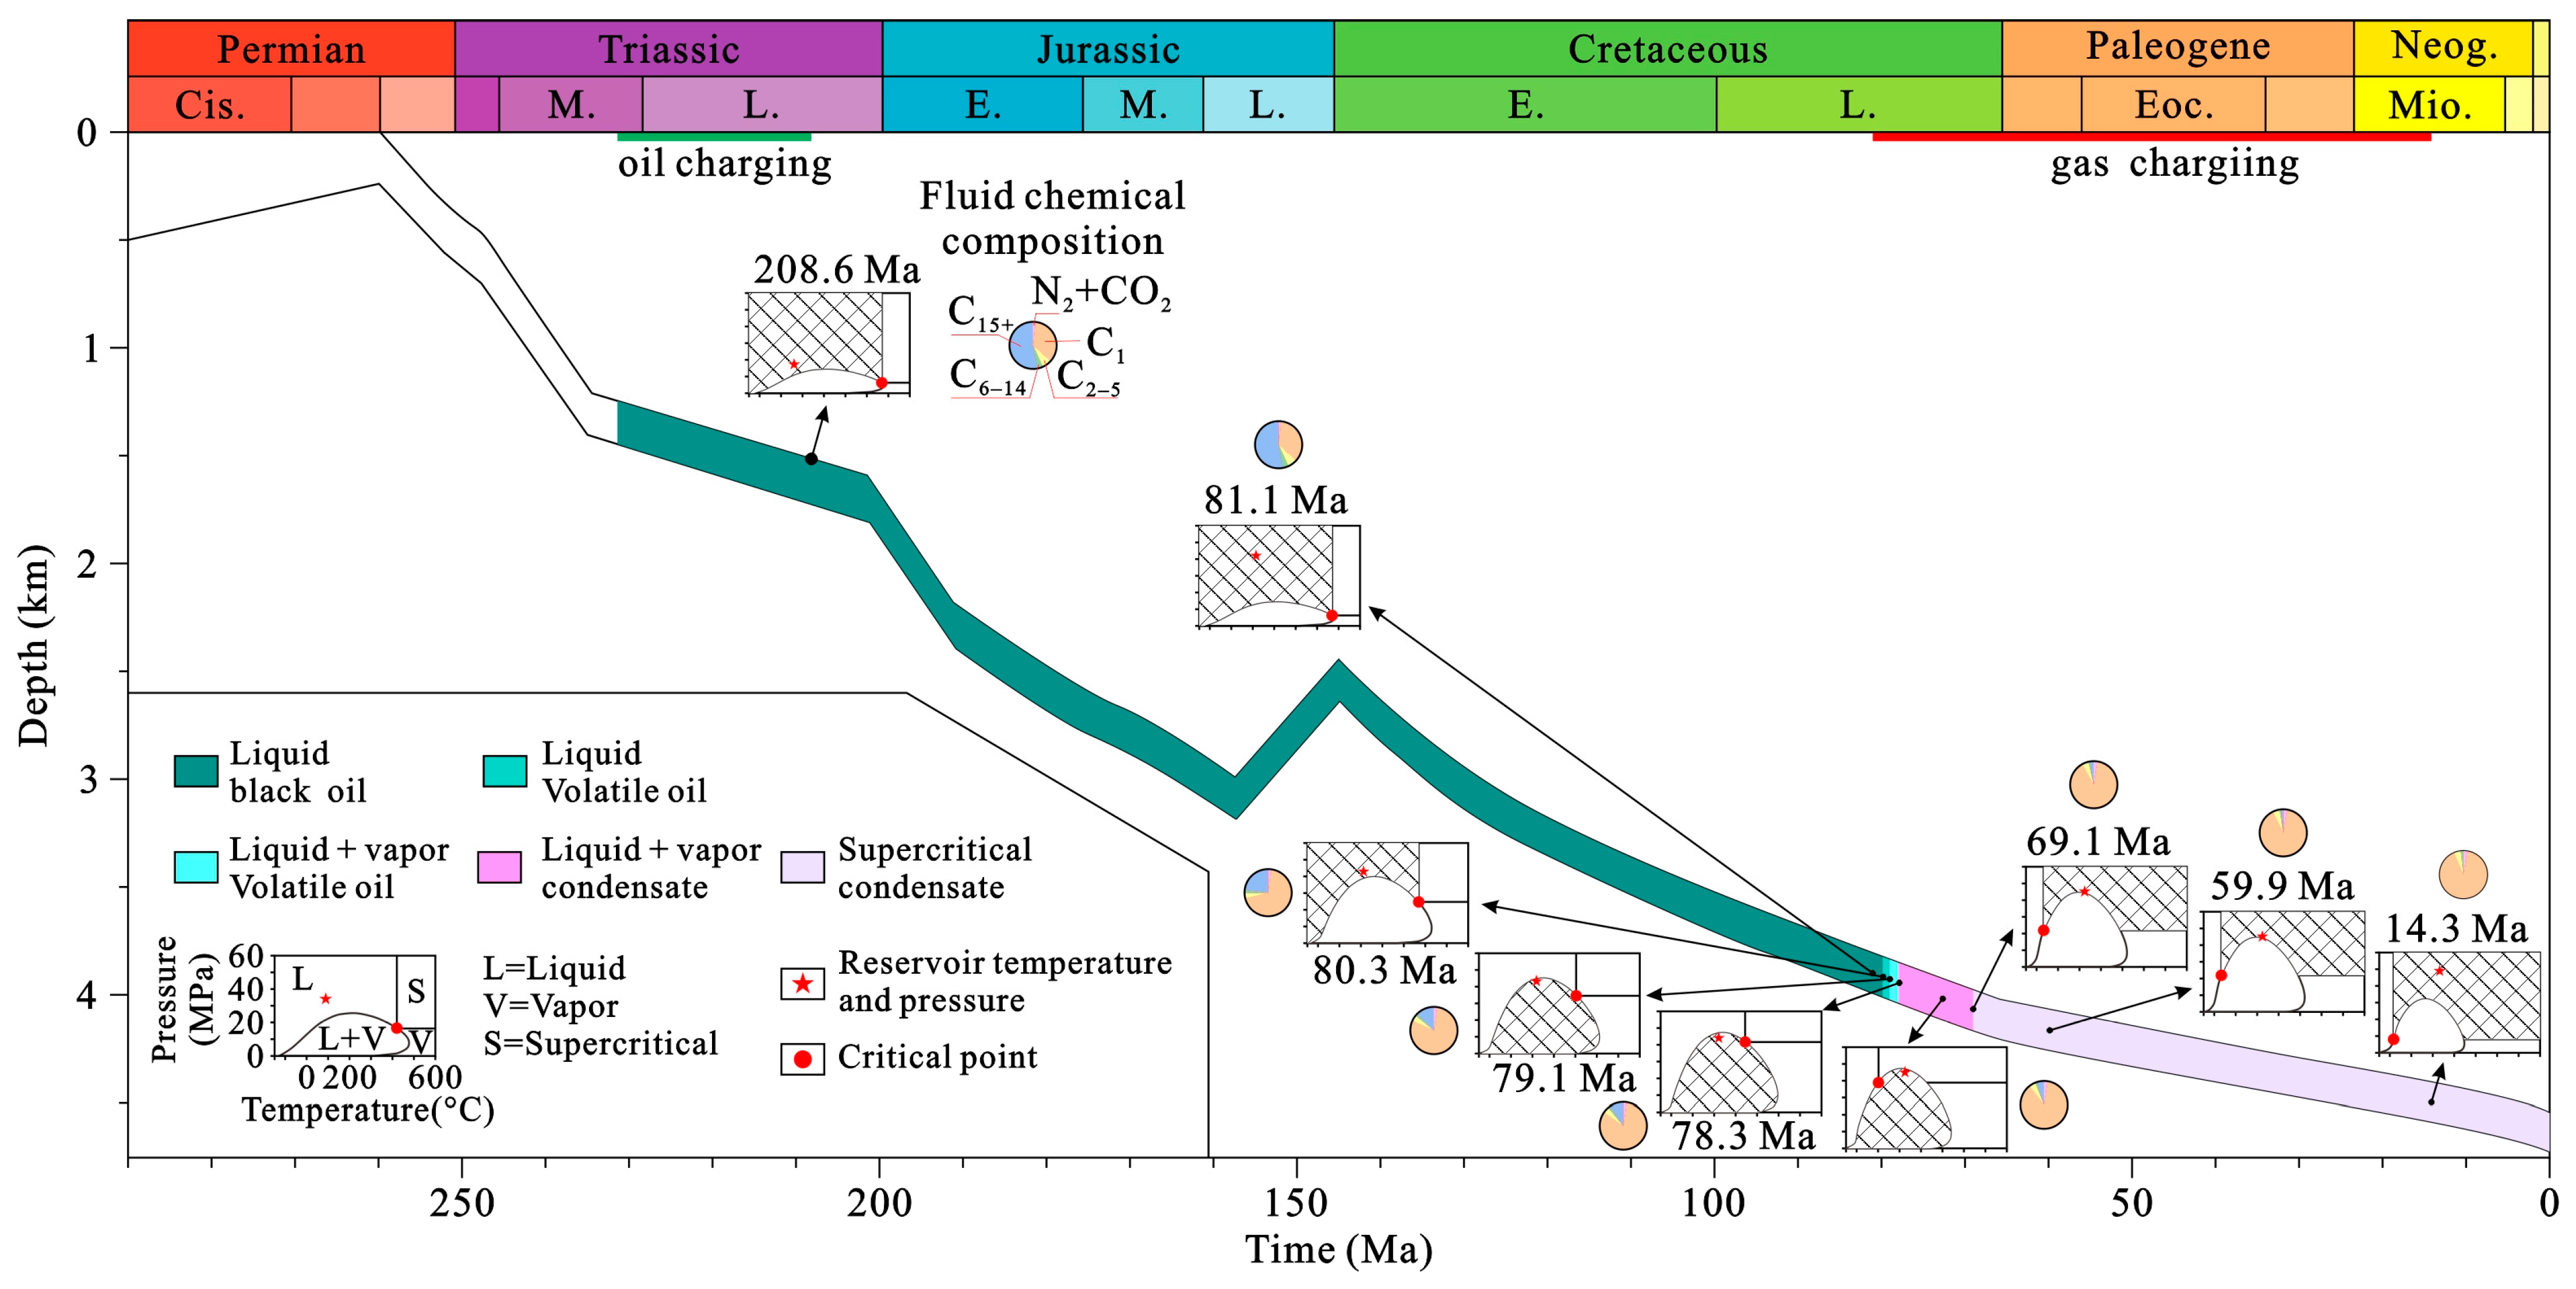
The evolution of hydrocarbon fluid phase behavior in the Xinguang Gas Field was reconstructed based on a comprehensive analysis of changes in hydrocarbon composition, fluid physical properties, and reservoir temperature and pressure. During the Middle to Late Triassic (approximately 231.9–208.6 Ma), the Jiamuhe Fm. reservoir experienced its first hydrocarbon charge, characterized by black oil properties. At this stage, the reservoir temperature was significantly lower than the critical temperature, while the reservoir pressure exceeded the saturation pressure at the corresponding temperature (Figure 13), resulting in a liquid black oil phase (Figure 14). From 208.6 Ma to 81.1 Ma, no hydrocarbon charge or geological events occurred that could alter fluid composition. Consequently, the hydrocarbon composition in the Jiamuhe Fm. reservoir remained stable. Although reservoir temperature and pressure increased during this period, the hydrocarbon fluids retained their liquid black oil phase (Figure 14).
Between the Late Cretaceous and Early Neogene (approximately 81.1–14.3 Ma), the reservoir experienced a second hydrocarbon charge as natural gas gradually migrated into the reservoir, altering the chemical properties of the hydrocarbon fluids. During the initial stage of gas invasion (approximately 81.1–80.3 Ma), the GOR gradually increased, but remained below 250 m3/m3. At this stage, reservoir temperature was below the critical temperature, and pressure exceeded the saturation pressure at the corresponding temperature, maintaining a liquid black oil phase (Figure 14). As gas invasion intensified, the GOR continued to rise, increasing the light components in the hydrocarbon fluids and shifting the phase to volatile oil. However, reservoir temperature remained below the critical temperature, and pressure exceeded the saturation pressure (Figure 13), resulting in a liquid volatile oil phase. Between 79.1 and 78.3 Ma, the fluid maintained a volatile oil phase, but reservoir pressure dropped below the saturation pressure at the corresponding temperature, resulting in a vapor–liquid coexistence under reservoir conditions (Figure 14). Further gas invasion increased the GOR, transitioning the fluid to a condensate phase. From 78.3 to 69.1 Ma, reservoir temperature and pressure exceeded the critical temperature and pressure of the fluid. However, reservoir pressure remained below the saturation pressure at the corresponding temperature (Figure 13), resulting in hydrocarbon fluids exhibiting typical vapor–liquid two-phase condensate characteristics. As the GOR increased further, the critical temperature and pressure of the hydrocarbon fluids declined, while reservoir temperature and pressure rose. After approximately 69.1 Ma, reservoir temperature exceeded the critical temperature, and reservoir pressure surpassed both the critical pressure and saturation pressure at the corresponding temperature (Figure 13), transitioning the condensate into a supercritical state (Figure 14). Since then, the reservoir fluids have remained in this supercritical phase. In summary, the hydrocarbons in the Xinguang Gas Field reservoir underwent a phase evolution from liquid black oil to liquid volatile oil, followed by gas–liquid volatile oil, gas–liquid condensate, and ultimately, supercritical condensate gas.
The phase evolution characteristics observed in the Xinguang Gas Field share similarities with other supercritical or high-GOR reservoirs globally. For instance, the Gulf of Mexico’s Lower Tertiary trend exhibits multi-stage charging and retrograde condensate behavior under HTHP conditions [41]. Similarly, the South Pars Gas Field in the Persian Gulf contains condensate-rich gas, formed by multiple hydrocarbon charging events, including early oil and late gas charging [36]. North Sea HTHP reservoirs also show phase transitioning from black oil to supercritical fluids depending on burial and uplift histories [42]. Such parallels reinforce the broader applicability of the two-stage charging model proposed for the Junggar Basin.

6. Conclusions

(1) The hydrocarbon fluids in the Xinguang Gas Field exhibit a supercritical condensate gas phase. These fluids are characterized by a GOR ranging from 1014.41 to 13,054.77 m3/m3, an average molecular weight ranging from 21 to 28, and φ1 values between 40 and 62. They display typical retrograde condensation behavior, with reservoir temperature and pressure exceeding both the critical conditions and the saturation pressure at the reservoir temperature.
(2) The deep condensate gas in the Jiamuhe reservoir is a hydrocarbon mixture formed in two stages. The first stage occurred in the Middle–Late Triassic, when both Block 1 and the Xinguang Gas Field received the initial charge of mature oil. From the Late Cretaceous to Early Neogene, only the Xinguang Gas Field experienced a secondary charge of highly mature oil and gas, while Block 1 was less affected. The crude oils in both blocks share a common biological source and depositional environment, derived from the Fengcheng Fm. source rocks. The black oil in Block 1 represents the fluid before transitioning to condensate gas in the Xinguang Gas Field, while the current condensate fluid in the Xinguang Gas Field results from two hydrocarbon charging events.
(3) The evolution of reservoir hydrocarbon fluid phases in the Xinguang Gas Field is controlled by the co-evolution of fluid composition, reservoir temperature, and pressure. The current hydrocarbon fluids in the reservoir have undergone a phase transformation sequence, from liquid black oil, liquid volatile oil, vapor–liquid two-phase volatile oil, and vapor–liquid two-phase condensate gas, to supercritical condensate gas.
(4) These findings have significant implications for reservoir management and exploration. Understanding the phase behavior and charging history of hydrocarbon fluids is crucial for optimizing production strategies, predicting fluid behavior under different reservoir conditions, and identifying potential exploration targets. The distinct phase evolution and charging history observed in the Xinguang Gas Field highlight the importance of detailed reservoir characterization and monitoring to inform effective field development and management practices.

7. Limitations and Suggestions

This study has limitations, including reliance on 1D basin modeling, which may oversimplify 3D geological heterogeneities, and limited fluid inclusion data restricting detailed phase transition timing. Additionally, the lack of direct measurements of supercritical fluid properties under reservoir conditions introduces uncertainties in phase behavior simulations.
To address these, future work should integrate 3D basin modeling with high-resolution seismic data to capture lateral variations. Expanding fluid inclusion analyses and conducting in situ PVT experiments under HTHP conditions would enhance phase evolution accuracy, supporting more robust exploration strategies.

Author Contributions

Conceptualization, M.H. and C.C.; methodology, J.H.; investigation, J.W. and G.Y.; resources, H.L. and W.J.; data curation, X.D.; writing—original draft preparation, M.H.; writing—review and editing, K.L.; project administration, X.D. and M.Z.; funding acquisition, C.C. and J.W. All authors have read and agreed to the published version of the manuscript.

Funding

This study was financed by the National Natural Science Foundation of China (Grant Nos. U24B6001 and 42302156), the major science and technology project of Sinopec (P23230), and the Science and Technology Project of Petroleum Exploration and Development Research Institute of Sinopec (YK-2024039).

Data Availability Statement

Data available on request due to restrictions on privacy.

Acknowledgments

We are appreciative of the core sample donations from the Xinjiang Petroleum Administration Bureau of CNPC.

Conflicts of Interest

Authors Maoguo Hou, Chenglin Chu, Jie Wang, Jiwen Huang and Gang Yue were employed by SINOPEC. Hailei Liu and Wenlong Jiang were employed by the Xinjiang Petroleum Administration Bureau. Keshun Liu was employed by PetroChina Daqing Oilfield. The remaining authors declare that the research was conducted in the absence of any commercial or financial relationships that could be construed as a potential conflict of interest. These companies had no role in the design of the study, the collection, analysis, or interpretation of data, the writing of the manuscript, or the decision to publish the results..

References

  1. Ren, Z.L.; Cui, J.P.; Qi, K.; Yang, G.L.; Chen, Z.J.; Yang, P.; Wang, K. Control effects of temperature and thermal evolution history of deep and ultra-deep layers on hydrocarbon phase state and hydrocarbon generation history. Nat. Gas Ind. B 2020, 7, 453–461. [Google Scholar] [CrossRef]
  2. Hatampour, A.; Schaffie, M.; Jafari, S. Hydraulic flow units, depositional facies and pore type of Kangan and Dalan Formations, South Pars Gas Field, Iran. J. Nat. Gas Sci. Eng. 2015, 23, 171–183. [Google Scholar] [CrossRef]
  3. Wang, C.; Zeng, J.; Yu, Y.; Cai, W.; Li, D.; Yang, G.; Liu, Y.; Wang, Z. Origin, migration, and characterization of petroleum in the Perdido Fold Belt, Gulf of Mexico basin. J. Pet. Sci. Eng. 2020, 195, 107843. [Google Scholar] [CrossRef]
  4. Sabuni, R.A. Petroleum systems and hydrocarbon potential of the Ruvuma Basin, Tanzania. Geoenergy Sci. Eng. 2023, 223, 211588. [Google Scholar] [CrossRef]
  5. Ma, Y.S.; Cai, X.Y.; Yun, L.; Li, Z.J.; Li, H.L.; Deng, S.; Zhao, P.R. Practice and theoretical and technical progress in exploration and development of Shunbei ultra-deep carbonate oil and gas field, Tarim Basin, NW China. Pet. Explor. Dev. 2022, 49, 1–20. [Google Scholar] [CrossRef]
  6. Baur, F. Predicting petroleum gravity with basin modeling: New kinetic models. AAPG Bull. 2019, 103, 1811–1837. [Google Scholar] [CrossRef]
  7. Hou, M.G.; Zha, M.; Ding, X.J.; Yin, H.; Bian, B.L.; Liu, H.L.; Jiang, Z.F. Source and accumulation process of Jurassic biodegraded oil in the Eastern Junggar Basin, NW China. Pet. Sci. 2021, 18, 1033–1046. [Google Scholar] [CrossRef]
  8. Van Graas, G.W.; Elin Gilje, A.; Isom, T.P.; Aase Tau, L. The effects of phase fractionation on the composition of oils, condensates and gases. Org. Geochem. 2000, 31, 1419–1439. [Google Scholar] [CrossRef]
  9. Losh, S.; Cathles, L.; Meulbroek, P. Gas washing of oil along a regional transect, offshore Louisiana. Org. Geochem. 2002, 33, 655–663. [Google Scholar] [CrossRef]
  10. Cheng, B.; Liu, H.; Cao, Z.C.; Wu, X.; Chen, Z.H. Origin of deep oil accumulations in carbonate reservoirs within the north Tarim Basin: Insights from molecular and isotopic compositions. Org. Geochem. 2020, 139, 1–15. [Google Scholar] [CrossRef]
  11. Tissot, B.P.; Welte, D.H. Petroleum Formation and Occurrence, 2nd ed.; Springer: Basel, Switzerland, 1984. [Google Scholar]
  12. Dandekar, A.Y. Petroleum Reservoir Rock and Fluid Properties, 2nd ed.; CRC Press: Boca Raton, FL, USA, 2013. [Google Scholar]
  13. Chen, C.S.; Wang, Y.P.; Beagle, J.R.; Liao, L.L.; Shi, S.Y.; Deng, R. Reconstruction of the evolution of deep fluids in light oil reservoirs in the Central Tarim Basin by using PVT simulation and basin modeling. Mar. Pet. Geol. 2019, 107, 116–126. [Google Scholar] [CrossRef]
  14. Mahjabin, N.; Banik, S.C. An integrated study of phase behavior in natural gas reservoirs through experimental and simulation approach: A case study. Energy Rep. 2025, 13, 6631–6650. [Google Scholar] [CrossRef]
  15. Zhang, Z.Y.; Zhu, G.Y.; Chi, L.X.; Wang, P.J.; Zhou, L.; Li, J.F.; Wu, Z.H. Discovery of the high-yield well GT1 in the deep strata of the southern margin of the Junggar Basin, China: Implications for liquid petroleum potential in deep assemblage. J. Pet. Sci. Eng. 2020, 191, 107178. [Google Scholar] [CrossRef]
  16. Lu, J.G.; Luo, Z.Y.; Zou, H.L.; Li, Y.P.; Hu, Z.Z.; Zhou, Z.Y.; Zhu, J.; Han, M.M.; Zhao, L.P.; Lin, Z.H. Geochemical characteristics, origin, and mechanism of differential accumulation of natural gas in the carboniferous kelameili gas field in Junggar basin, China. J. Pet. Sci. Eng. 2021, 203, 108658. [Google Scholar] [CrossRef]
  17. Chen, Z.H.; Cao, Y.C.; Ma, Z.J.; Zhen, Y.S. Geochemistry and origins of natural gases in the Zhongguai area of Junggar Basin, China. J. Pet. Sci. Eng. 2014, 119, 17–27. [Google Scholar] [CrossRef]
  18. Yang, Y.; Chen, Q.; Chen, L. Tight sandstone gas genetic type and gas source in the Jiamuhe Formation of Zhongguai Area, Junggar Basin. Xinjiang OilGas 2017, 13, 6–10, (In Chinese with English abstract). [Google Scholar]
  19. Li, E.; Jin, J.; Cao, J.; Ma, W.Y.; Mi, J.L.; Ren, J.L. Geochemical characteristics and genesis of natural gas in Jiamuhe Formation in Xinguang area, Junggar Basin. Nat. Gas Geosci. 2019, 30, 1362–1369. [Google Scholar]
  20. He, W.; Yang, H.; Fei, L.; Wang, X.; Yang, T.; Yang, Y.; Bao, H. Comprehensive analysis of tight sandstone gas resource potential in the favorable area of Jiamuhe Formation in Xinguang area, Junggar Basin. Nat. Gas Geosci. 2018, 29, 370–381. [Google Scholar]
  21. Li, Z.; Qiu, L.; Sun, B.; Tang, Y.; Kong, Y.; Zhu, S. Characteristics of Fluid Inclusion and Charging Events of NaturalGas in Permian Jiamuhe Formation of Zhongguai Area, Junggar Basin. Nat. Gas Geosci. 2013, 24, 931–939. [Google Scholar]
  22. Xu, B.; Lei, Y.; Zhang, L.; Li, C.; Wang, J.; Zeng, Z.; Li, S.; Cheng, M.; Zhang, Z.; Xie, J. Hydrocarbon Phase State Evolution and Accumulation Process of Ultradeep Permian Reservoirs in Shawan Sag, Junggar Basin, NW China. Energy Fuels 2023, 37, 12762–12775. [Google Scholar] [CrossRef]
  23. He, D.F.; Chen, X.F.; Kuang, J.; Zhou, L.; Tang, Y.; Liu, D.G. Development and Genetic Mechanism of Chepaizi-Mosuowan Uplift in Junggar Basin, China. Earth Sci. Front. 2008, 15, 42–55. [Google Scholar] [CrossRef]
  24. Li, Y.; Lu, J.G.; Liu, X.J.; Wang, J.; Chen, S.J.; He, Q.B. Geochemical characteristics of source rocks and gas exploration direction in Shawan Sag, Junggar Basin, China. J. Nat. Gas Geosci. 2023, 8, 95–107. [Google Scholar] [CrossRef]
  25. Zhi, D.M.; Song, Y.; Zheng, M.L.; Qin, Z.J.; Gong, D.Y. Genetic types, origins, and accumulation process of natural gas from the southwestern Junggar Basin: New implications for natural gas exploration potential. Mar. Pet. Geol. 2021, 123, 104727. [Google Scholar] [CrossRef]
  26. Hou, M.G.; Qu, J.X.; Zha, M.; Swennen, R.; Ding, X.J.; Imin, A.; Liu, H.L.; Bian, B.L. Significant contribution of haloalkaliphilic cyanobacteria to organic matter in an ancient alkaline lacustrine source rock: A case study from the Permian Fengcheng Formation, Junggar Basin, China. Mar. Pet. Geol. 2022, 138, 105546. [Google Scholar] [CrossRef]
  27. ASTM D5002-13; Standard Test Method for Density and Relative Density of Crude Oils by Digital Density Analyzer. ASTM International: West Conshohocken, PA, USA, 2013.
  28. SY/T5542-2009; Test Methods for Reservoir Fluid Physical Properties. National Energy Administration: Beijing, China, 2009.
  29. GB/T 26981-2011; Test Method for Reservoir Fluid Physical Properties. General Administration of Quality Supervision, Inspection and Quarantine of the People’s Republic of China: Beijing, China, 2011.
  30. SY/T6010-2011; Test Method for Fluid Inclusion in Sedimentary Basins by Microthermometry. National Energy Administration: Beijing, China, 2011.
  31. Zhou, L.; Zheng, J.; Lei, D.; He, D.F.; Tang, Y.; Shi, X.P.; Pang, L.; Yang, Z. Recovery of eroded thickness of the Jurassic of Chemo palaeouplift in Junggar Basin. J. Palaeogeogr. 2007, 9, 243–252. [Google Scholar]
  32. Qiu, N.S.; Zha, M.; Wang, X.L.; Yang, H.B. Tectono-thermal evolution of the Junggar Basin, NW China: Constraints from Ro and apatite fission track modelling. Pet. Geosci. 2005, 11, 361–372. [Google Scholar]
  33. Peters, K.E.; Walters, C.C.; Moldowan, J.M. The biomarker guide. In Biomarkers & Isotopes in Petroleum Systems & Earth History; Cambridge University Press: Cambridge, UK, 2005. [Google Scholar]
  34. Stasiuk, L.; Snowdon, L. Fluorescence micro-spectrometry of synthetic and natural hydrocarbon fluid inclusions: Crude oil chemistry, density and application to petroleum migration. Appl. Geochem. 1997, 12, 229–241. [Google Scholar] [CrossRef]
  35. Sun, Z.D. Methods for determining the type of different oil and gas reservoirs fluid. Pertroleum Explor. Dev. 1996, 1, 69–75+106, (In Chinese with English Abstract). [Google Scholar]
  36. Aali, J.; Rahimpour-Bonab, H.; Kamali, M.R. Geochemistry and origin of the world’s largest gas field from Persian Gulf, Iran. J. Pet. Sci. Eng. 2006, 50, 161–175. [Google Scholar] [CrossRef]
  37. Qiao, R.Z.; Chen, Z.H. Petroleum phase evolution at high temperature: A combined study of oil cracking experiment and deep oil in Dongying Depression, eastern China. Fuel 2022, 326, 124978. [Google Scholar] [CrossRef]
  38. Hou, M.G.; Zha, M.; Liu, H.; Liu, H.L.; Ding, X.J. Significant Control of Gas Invasion to the Phase Behavior of Deep-Seated Hydrocarbon Fluids in Western Junggar Basin, NW China. ACS Omega 2024, 9, 22285–22295. [Google Scholar] [CrossRef] [PubMed]
  39. Tian, H.; Wang, Z.M.; Xiao, Z.Y.; Li, X.Q.; Xiao, X.M. Kinetic Simulation of Crude Oil Cracking into Gas and Its Significance. Chin. Sci. Bull. 2006, 51, 1821–1827. [Google Scholar] [CrossRef]
  40. Zhang, S.C.; Su, J.; Wang, X.M.; Zhu, G.Y.; Yang, H.J.; Liu, K.Y.; Li, Z.X. Geochemistry of Palaeozoic marine petroleum from the Tarim Basin, NW China: Part 3. Thermal cracking of liquid hydrocarbons and gas washing as the major mechanisms for deep gas condensate accumulations. Org. Geochem. 2011, 42, 1394–1410. [Google Scholar] [CrossRef]
  41. Rains, D.B.; Zarra, L.; Meyer, D. The Lower Tertiary Wilcox Trend in the Deepwater Gulf of Mexico. In Proceedings of the AAPG 2007 Annual Convention, Long Beach, CA, USA, 1–4 April 2007. [Google Scholar]
  42. Di Primio, R.; Neumann, V. HPHT reservoir evolution: A case study from Jade and Judy fields, Central Graben, UK North Sea. Int. J. Earth Sci. 2008, 97, 1101–1114. [Google Scholar] [CrossRef]
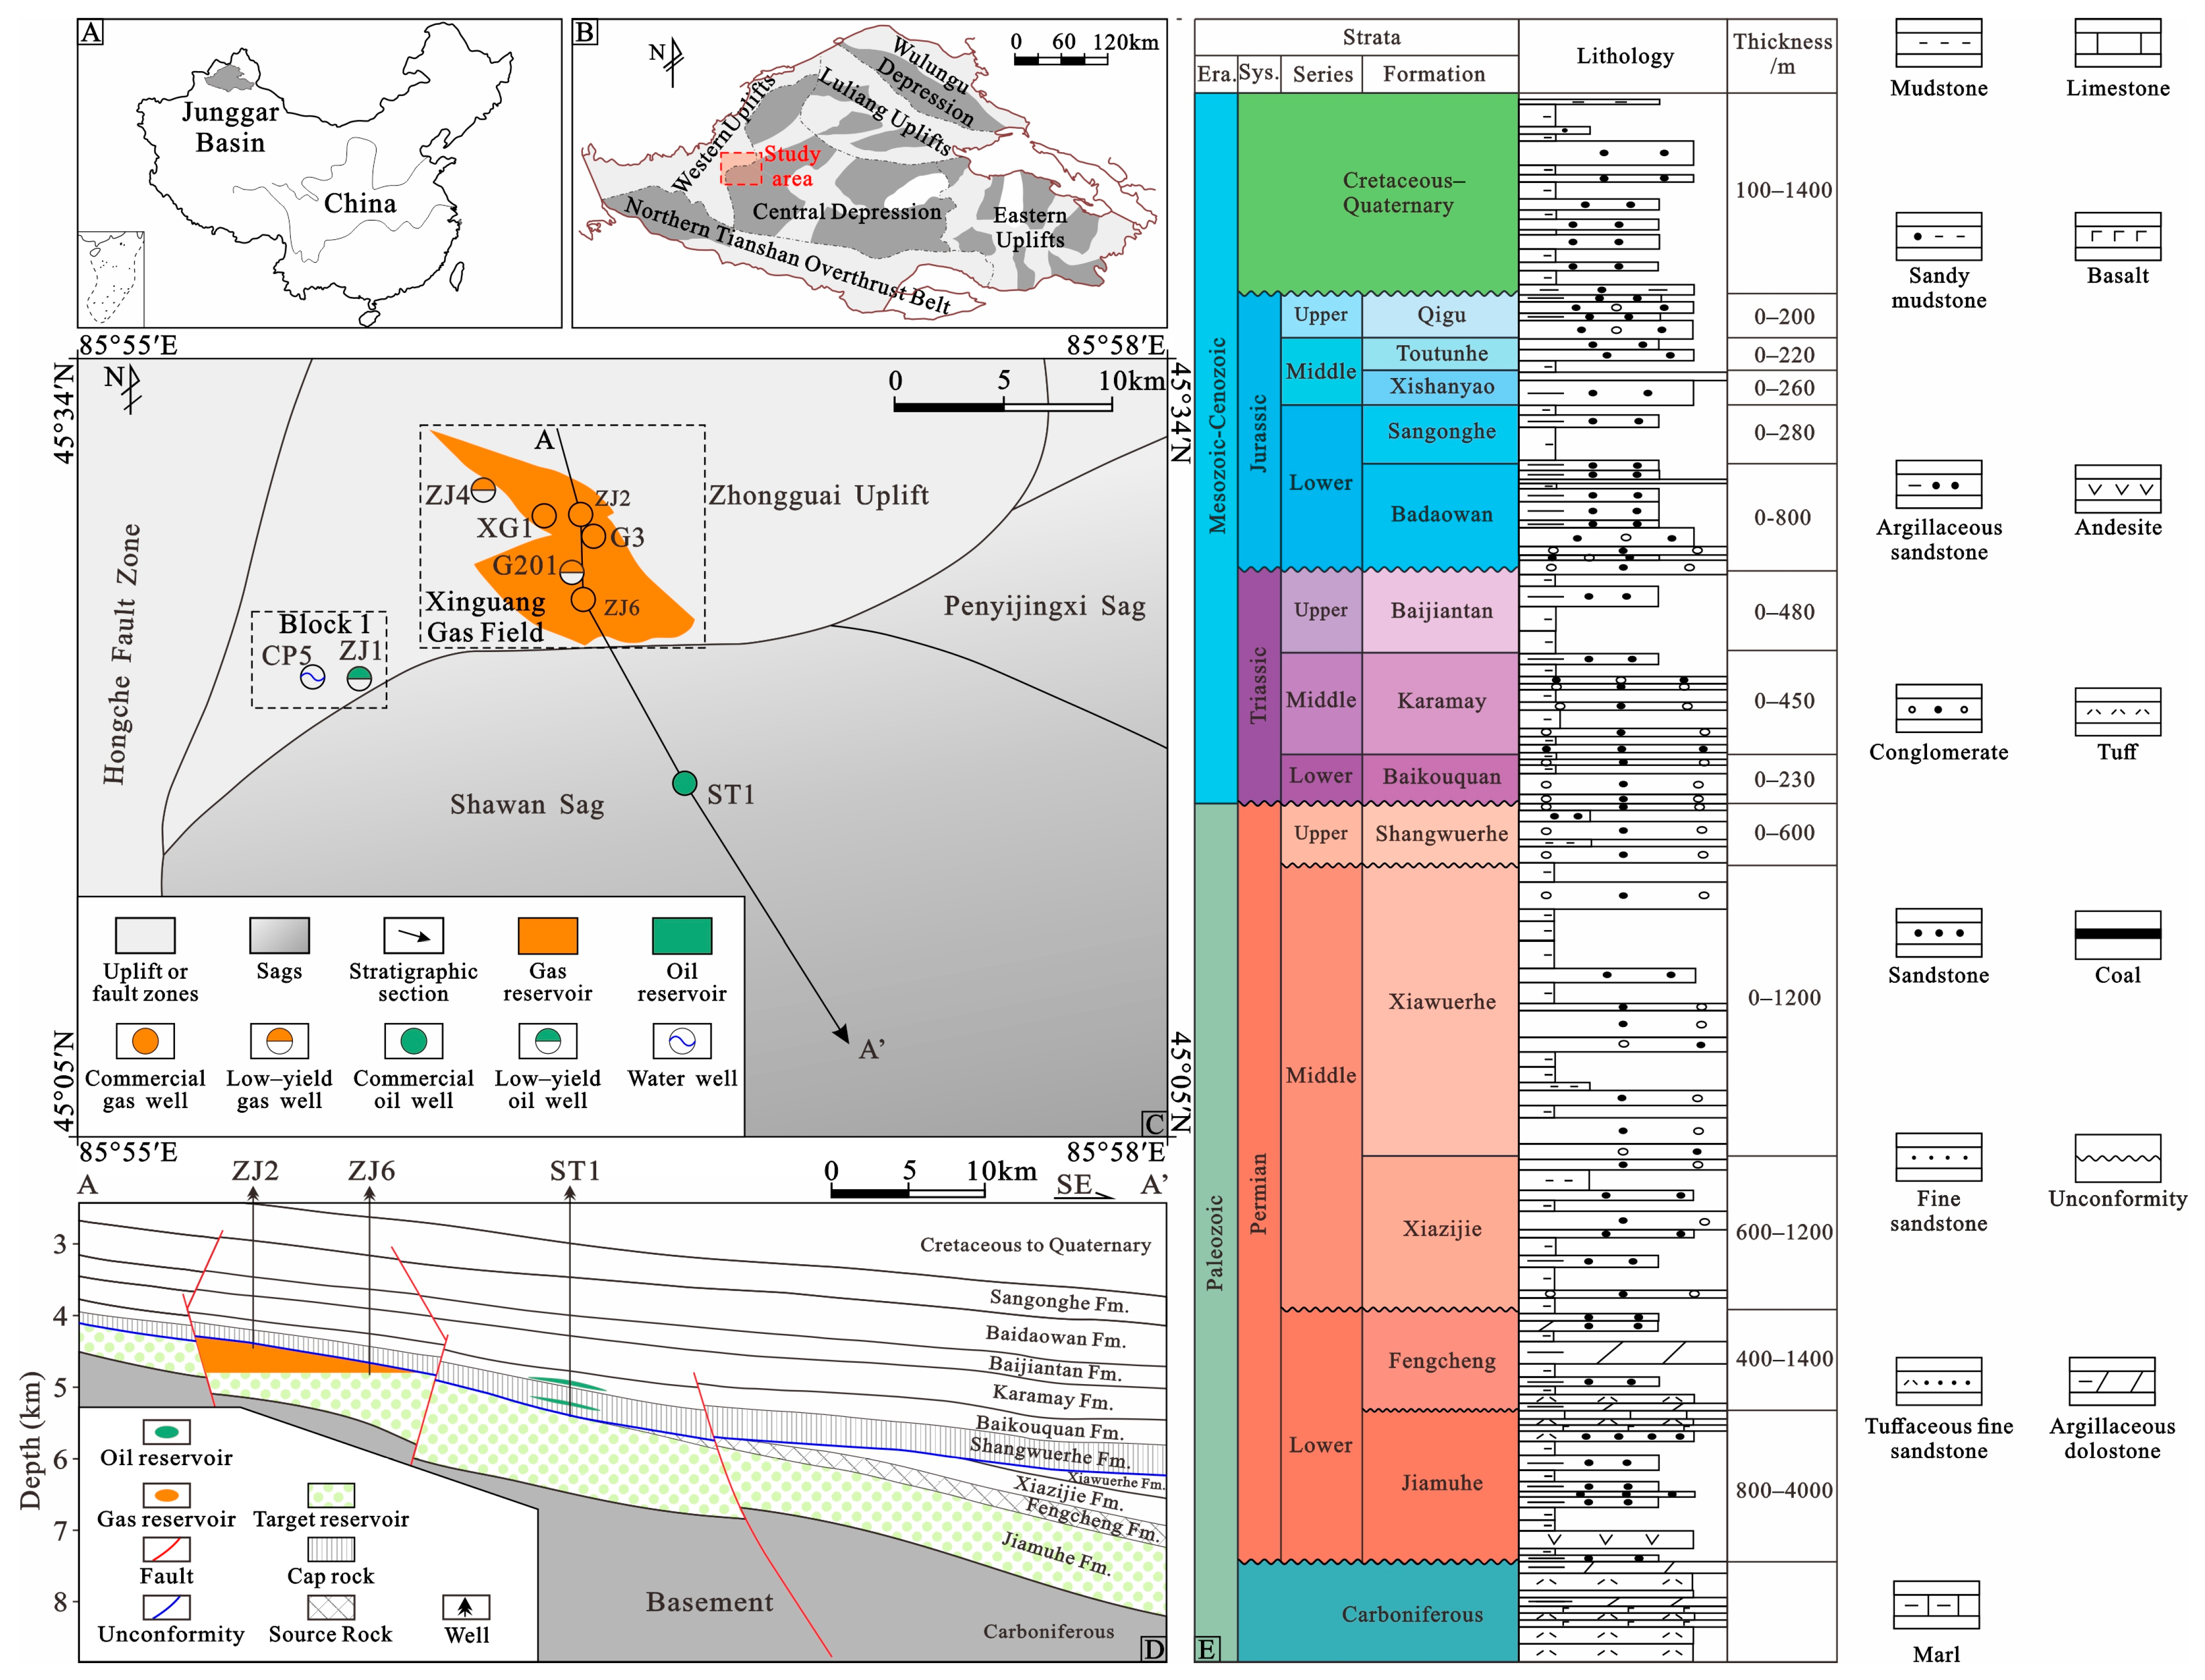
Figure 1. Comprehensive geological maps showing the location of the Junggar Basin (A), structural units of the Junggar Basin and location of the study area (B), structural units, oil and gas resource distribution in the study area (C), the stratigraphic cross section of the study area (D), and the strata and lithology of the volcanic rock basement and sedimentary units of the Western Junggar Basin (E).
Processes 13 02667 g001
Figure 2. Stratigraphic contact relationship of Permian system (A) and reconstruction of erosion thickness (B) in Well XG1.
Processes 13 02667 g002
Figure 3. Oil density (A), GOR (B), and mole component contents (CF) of reservoir hydrocarbon fluids in two blocks.
Processes 13 02667 g003
Figure 4. Relationship between pressure and condensate liquid volume of fluid from the Jiamuhe Formation of Well ZJ2 (A) and Well XG1 (B) at different temperatures.
Processes 13 02667 g004
Figure 5. Pr/Ph (A), β-carotane index (B), Gammacerane/C30Hopane (C), carbon isotopes (D), and Ts/Tm (E) of extracts of source rocks and oil sands.
Processes 13 02667 g005
Figure 6. Organic micropetrological characteristics of the Jiamuhe reservoir fluids (A,B,G,H) and fluid inclusions (CF,IL). Abbreviations: transmitted light microphotograph (TLM), ultraviolet light microphotograph (ULM). (A) Brown or yellow–green hydrocarbon fluids, Well ZJ1, 5067 m, fine sandstone, ULM; (B) Brown or yellow–green hydrocarbon fluids, Well CP5, 4730.55 m, tuffaceous conglomerate, ULM; (C,E) Oil fluid inclusions, Well ZJ1, 4860.34 m, conglomerate, TLM; (D,F) Brown or yellow–green oil fluid inclusions, Well ZJ1, 4860.34 m, conglomerate, ULM; (G) Yellow and blue hydrocarbon fluids, Well ZJ6, 5012.44 m, conglomerate, TLM; (H) Yellow–green and blue hydrocarbon fluids, Well ZJ4, 4538.35 m, conglomerate, ULM; (I) Oil fluid inclusions, Well XG1, 4591.81m, conglomerate, TLM; (J) Yellow–green and blue oil fluid inclusions, Well XG1, 4591.81m, conglomerate, ULM; (K,L) Gas inclusions, Well XG1, 4591.81m, conglomerate, TLM.
Processes 13 02667 g006
Figure 7. The homogenization temperatures of aqueous inclusions (AIs) associated with oil inclusions (OIs) or gas inclusions (GIs) in Jiamuhe reservoirs of Block 1 (A) and Xinguang Gas Field (B).
Processes 13 02667 g007
Figure 8. Burial history, thermal history, and hydrocarbon accumulation period of the Jiamuhe reservoir of Well XG1 and hydrocarbon generation history of potential source rocks in the Shawan Sag (from [24]). JFSR = Jiamuhe Fm. source rock; FFSR = Fengcheng Fm. source rock; XWFSR = Xiawuerhe Fm. source rock.
Processes 13 02667 g008
Figure 9. Identification of hydrocarbon fluid phase states in the reservoirs of the Jiamuhe Fm. in Block 1 and the Xinguang Gas Field.
Processes 13 02667 g009
Figure 10. The P-T phase diagram of hydrocarbon fluids from Block 1 (A) and the Xinguang Gas Field (B).
Processes 13 02667 g010
Figure 11. The oil–source correlation using principal component analysis. PC1 and PC2 = principal components 1 and 2.
Processes 13 02667 g011
Figure 12. Component evolution history of reservoir hydrocarbon fluids in the Xinguang Gas Field.
Processes 13 02667 g012
Figure 13. Evolution process of reservoir temperature, pressure, and fluid properties.
Processes 13 02667 g013
Figure 14. Phase evolution of reservoir hydrocarbon fluids for the Jiamuhe Fm. in the Xinguang Gas Field.
Processes 13 02667 g014
Table 1. The input geological data of Well XG1 in basin modeling.
Strata/
Erosion
Top Depth (m)Bottom Depth (m)Strata/Erosion Thickness (m)Event TypeDeposited/Eroded from (Ma)Deposited/Eroded to (Ma)
Quaternary-Paleogene0913913Deposition660
Cretaceous91324131500Deposition14566
Erosion 2//205Erosion157.3145
Xishanyao24132530117Deposition174.1157.3
Sangonghe25302900370Deposition190.8174.1
Badaowan29003484584Deposition201.3190.8
Baokouquan3483.53799315.5Deposition235201.3
Karamay37994250451Deposition247.2235
Baijiantan42504390140Deposition251.9247.2
Shangwuerhe43904548158Deposition259.9251.9
Erosion 1//505Erosion290.1259.9
Jiamuhe45484730182Deposition298.9290.1
Table 2. The lithological proportion of each stratigraphic unit of Well XG1.
StrataLithological Proportion (%)
Mud
Stone
Silty MudstoneSandy
Mudstone
Argillaceous SiltstoneSiltstoneFine SandstoneConglomerateCoal
Quaternary-Cretaceous53.4817.042.6115.210.845.854.97/
Xishanyao8.55////91.45//
Sangonghe64.3813.04/8.60/12.371.61/
Badaowan38.358.60/11.343.4425.549.633.10
Baokouquan45.9426.07/24.171.911.91//
Karamay34.1531.93/17.967.543.992.661.77
Baijiantan/7.22/20.94//71.84/
Shangwuerhe50.4633.54/3.69//12.31/
Jiamuhe//6.67///93.33/
Table 3. Reservoir fluid compositions at different geological times.
Time (Ma)GOR
(m3/m3)
TypeSourceNon-Hydrocarbon Gas Content (%)Hydrocarbon Content (%)
N2CO2CH4C2H6C3H8i-C4H10n-C4H10i-C5H12n-C5H12C6+
0/GasMSWX2.510.1391.692.560.980.360.450.190.220.91
81.157.38FluidSP1.600.0235.152.991.600.570.660.310.2756.83
80.7139.11FluidSP1.650.0860.151.680.640.230.300.120.1435.01
80.3220.63FluidSP1.890.1069.011.930.730.270.340.140.1725.42
79.9301.16FluidSP2.030.1073.992.070.790.290.360.150.1820.04
79.1460.95FluidSP2.170.1179.392.220.850.310.390.160.1914.21
78.7541.46FluidSP2.220.1181.012.260.860.310.400.170.1912.47
78.3621.01FluidSP2.250.1282.262.300.880.320.400.170.2011.10
76.31016.59FluidSP2.350.1285.742.390.910.330.420.180.217.35
75.11252.49FluidSP2.380.1286.822.420.920.340.430.180.216.18
72.71725.36FluidSP2.410.1288.122.460.940.340.430.180.214.79
69.12430.74FluidSP2.440.1389.142.490.950.350.440.180.213.67
59.94215.46FluidSP2.470.1390.222.520.960.350.440.190.222.50
14.313504.78FluidSP2.490.1390.922.540.970.350.450.190.221.75
Note: GOR = gas–oil ratio, MSWX = measured sample of Well XG1, SP = simulated by PVTsim.
Table 4. Compositions of natural gases in the two blocks of the Western Junggar Basin.
BlockWellDepth
(m)
Non-Hydrocarbon Gas Content (%)Hydrocarbon Gas Content (%)Dryness Coefficient
N2CO2CH4C2H6C3H8i-C4H10n-C4H10i-C5H12n-C5H12C6+
1ZJ1487510.990.171.565.244.592.31.9710.771.480.82
Xinguang Gas FieldZJ24840.71.910.4894.031.940.70.230.30.120.120.170.97
ZJ248553.110.6992.551.930.770.220.280.180.130.140.96
ZJ248723.240.4592.891.930.660.250.230.120.070.160.97
ZJ249362.050.2294.241.960.690.230.290.090.10.130.97
ZJ25300.52.170.1194.621.880.520.20.250.080.080.090.97
ZJ648752.260.1992.612.130.870.30.410.220.240.770.96
ZJ649901.520.1993.392.30.930.320.430.210.250.460.95
G346102.210.0793.821.930.720.270.390.120.150.320.96
G346151.710.0995.581.710.480.120.150.040.050.070.97
Disclaimer/Publisher’s Note: The statements, opinions and data contained in all publications are solely those of the individual author(s) and contributor(s) and not of MDPI and/or the editor(s). MDPI and/or the editor(s) disclaim responsibility for any injury to people or property resulting from any ideas, methods, instructions or products referred to in the content.