Article

Relationship Between the Strength Parameters of Tectonic Soft Coal and the Fractal Dimension Number Based on Particle Size Grading

1
School of Energy Science and Engineering, Henan Polytechnic University, Jiaozuo 454003, China
2
Collaborative Innovation Center of Coalbed Methane and Shale Gas for Central Plains Economic Region (Henan Province), Jiaozuo 454003, China
3
Science and Technology R&D Platform of Emergency Management Ministry for Deep Well Ground Control and Gas Extraction Technology, Jiaozuo 454003, China
4
College of Safety Science and Engineering, Henan Polytechnic University, Jiaozuo 454003, China
5
Collaborative Innovation Center of Coal Work Safety and Clean High Efficiency Utilization, Jiaozuo 454003, China
*
Author to whom correspondence should be addressed.
Processes 2025, 13(8), 2663; https://doi.org/10.3390/pr13082663
Submission received: 20 July 2025 / Revised: 13 August 2025 / Accepted: 20 August 2025 / Published: 21 August 2025

Abstract

Based on mechanical experiments conducted on bulk raw coal and coal of different types in order to explore the correlations between the fractal dimension and the grain size gradation and strength parameters of coal samples, the fractal statistics method was used to statistically analyze the grain size distribution characteristics of tectonic soft coal, while fractal theory was applied to study the grain size fractal characteristics of tectonic soft coals of categories III–V. The results of this study show that coal types III–V have increasing fractal dimension numbers, and the content of coarse particles decreases with an increasing fractal dimension number. Within this sampling range, the Class V coal is better graded, and the fractal dimension number decreases as the distance of the sampling point from the fault zone increases. In the direct shear experiments, the internal friction angle of the bulk raw coal decreased linearly with an increasing fractal dimension number, and the regularity of the cohesive force and the fractal dimension number was not strong, but the adhesion cohesion of the types of coal exhibited a positive exponential relationship with the fractal dimension, and the relationship between the internal friction angle and the fractal dimension was not strong. There was a positive exponential relationship, and the internal friction angle was relatively stable. The uniaxial compressive strength of the types of coal exhibited a good correlation with the coefficient of firmness of the coal samples and the fractal dimension, and the coefficient of firmness of the coal samples was the main factor influencing the uniaxial compressive strength of the types of coal compared with the particle size gradation.

1. Introduction

Based on the prevention and control of coal and gas protrusion rule [1], coal damage types are classified into categories I–V. Among these, coals of categories III–V are outburst-prone coals and are also called tectonically deformed soft coal. This soft coal exhibits distinct strain hardening, a high fragmentation degree, low porosity, and reduced permeability [2]. The specific characteristics are detailed in Table 1. As a product of tectonic movement in hard coal, soft coal represents a tectonic evolutionary process with sorting characteristics. Numerous studies [3,4,5,6] have demonstrated that the fractal characteristics of tectonically deformed coal—in terms of both the structural type and particle size distribution—display self-similarity within tectonic zones. In geotechnical engineering, processes such as cutting, blasting, and weathering exhibit fractal distributions, reflecting an intrinsic fragmentation mechanism [7]. The formation of tectonically deformed coal itself constitutes an irregular fragmentation process that is inherently fractal in nature. Fractal geometry, a tool for quantitatively describing irregular geometries, yields a metric known as the fractal dimension, which quantitatively characterizes such fractal processes. As a unique rock type, coal undergoes complex physicochemical changes over extended geological periods. However, soft coal has a low strength, intermediate between those of rock and soil-like granular materials, and it lacks a strict definition. Previous studies on the mechanical properties of soft coal predominantly relied on rock mechanics experiments [8,9]; however, some scholars have proposed analyzing soft coal mechanics from a granular mechanics perspective [10,11,12,13]. Consequently, in this study, we employed fractal theory to conduct fractal statistics on the particle size distribution of tectonically deformed coal and established the relationships between the fractal dimension and mechanical parameters of the coal.

2. Coal Sample Collection

The tectonically deformed soft coal specimens examined herein correspond to Classes III (granulated coal) and IV (mylonitic coal) under the four-category classification and to Classes III (intensely damaged coal), IV (pulverized coal), and V (fully powdered coal) under the five-category scheme—both of which are widely adopted designations for soft coal in Chinese mining practice [14].
The coal samples were collected from the vicinity of a central fault within the #3 coal seam in the Huoerxinhe Coal Mine, operated by the Shanxi Coking Coal Group. The coal structure in this area exhibits loose and highly fragmented characteristics. Representative sampling was conducted at three distinct locations near the fault, corresponding to coal structure Classes III, IV, and V. Two sample sets were collected from each class and were labeled III 1, III 2, IV 1, IV 2, V 1, and V 2.

3. Particle Size Gradation and Fractal Quantification of Tectonically Deformed Soft Coal

This section provides a concise and precise description of the experimental results, their interpretation, and the experimental conclusions drawn.

3.1. Particle Size Gradation Analysis of Tectonically Deformed Soft Coal

To quantify the size distribution and composition of the tectonically deformed soft coal particles, granulometric analysis was conducted following soil mechanics principles. In geotechnical engineering, particle size gradation refers to the percentage (relative proportion) of each particle fraction relative to the total mass of solid particles. This analysis typically employs sieve testing for particles > 0.1 mm (or 0.074 mm, depending on the sieve specifications). The standardized procedure involves drying and weighing the coal samples, sieving through nested sieves with progressively smaller apertures, weighing the mass retained on each sieve, and calculating the percentages of the fractal dimension [5].
In this study, the coal samples were sieved using a series of American Society for Testing Materials (ASTM)-certified sieves with apertures of 0.075, 0.1, 0.2, 0.4, 0.5, 0.6, 1, 2, 5, and 10 mm. The resulting size distribution data are presented in Table 1, and the corresponding gradation curve is shown in Figure 1.
The index for examining the degree of superiority of the particle size grading of the soil [15] can be expressed as follows:
C u = d 60 / d 10 ,
C c = d 30 2 d 60 × d 10 ,
where Cu is the coefficient of inhomogeneity, reflecting the degree of uniformity of the particle size gradation; Cc is the curvature coefficient, reflecting whether the slope of the cumulative curve of the particle size gradation is continuous; and d60, d30, and d10 are the particle sizes corresponding to 60%, 30%, and 10% of the total mass (mm), respectively, on the particle size distribution curve.
From the engineering point of view, the soil with an uneven grading (Cu ≥ 5) and continuous grading curve (Cc = 1–3) is called soil with good grading [15]. The calculation results of the indexes used to examine the grain size gradation of the structural soft coal are presented in Table 2, and coal sample V 2 has good gradation.

3.2. Fractal Measurement of Particle Size of Tectonic Soft Coal

This paper draws on the fractal particle size distribution method [16] for determining the fractal dimension of rock fragmentation for fractal measurement of the particle size of tectonic soft coal.
The idea underlying this method is to sieve the rock fragments using a sample sieve with aperture r. The total number of rock fragments under the sieve is recorded as N1(r), the total number of rock fragments on top of the sieve is recorded as N2(r), and the total number of rocks is N(r). Thus, N(r) = N1(r) + N2(r).
The correlation function C(r) is as follows:
C ( r ) = N 1 ( r ) N ( r ) = 1 N 2 ( r ) N ( r ) .
The size of the screen aperture r is appropriately adjusted if the following relationship exists within a certain particle size interval:
C r r D .
The index D is the association dimension, which is strictly defined as follows:
D = lim r 0 ln C r ln r .
For Equation (5), for the double logarithmic curve graph of lnC(r)-ln(r), the slope of the straight part of the line is the correlation dimension D.
Because the tectonic soft coal was more fragmented, and the size of the tested sample was large, it was very difficult to calculate the number of coal pieces directly. Thus, in this study, we utilized an improved method [16,17]. If M(r) is the cumulative mass of the coal samples with a particle size of less than r, and M is the total mass of the coal samples, then M(r)/M is the cumulative percentage of the mass of the coal samples with a particle size less than r (the mass that passes through the sieve). The graph of M(r)/M-r in the double logarithmic coordinate system is created, and the slope b of the straight part of the line is calculated. The following formula is utilized to determine the number of subdimensions D of the particle size distribution of the constructed soft coal [17]:
D = 3 b .
Following Turcotte’s [18] classical derivation, the cumulative-mass power law is statistically equivalent to the particle-counting power law when particle density is uniform and the distribution exhibits strict self-similarity. Accordingly, the D = 3 − b model is adopted in this study. The tectonic soft coal fractal curve is shown in Figure 2, and the results of the fractal dimension number calculation are shown in Table 3.
As can be seen from Figure 2 and Table 3, the original gradation of the Type III, IV, and V coal has better fractal characteristics, and the fitted correlation coefficients, R, are all greater than 0.9. Studies have shown that the macroscopic crushing of rocks occurs via the concentration of small rupture groups, and small ruptures are evolved and clustered by even smaller fractures. This self-similarity behavior inevitably causes the mass of the crushed fragments to also exhibit self-similarity characteristics [19]. Similarly, the macroscopic crushing of the tectonic soft coal extracted from the vicinity of the fault is the final result of the continuous sprouting, development, expansion, aggregation, and penetration of its internal microfractures under tectonic stress. The crushing process has a fractal nature, and the grain size of the coal samples has a good statistical self-similarity.
As can be seen from Table 1 and Table 3, with increasing degree of metamorphism (from Class III to Class V), the mass percentage of the coarse particles in the particle size gradation of the coal samples gradually decreases, the mass percentage of the fine particles gradually increases, and the fractal dimension gradually increases. That is, the fractal dimension can reflect the particle size composition of the coal samples, and the more fine particles there are, the larger the fractal dimension.

4. The Influence of Moisture Content on the Strength Characteristics of Class III–V Raw Coal

4.1. Determination of Moisture Content

The moisture content of the coal samples taken in this study was measured twice for each type of coal sample, and the average value was calculated. The results are shown in Table 4.
Due to the limitations of experimental instruments and the evaporation of sample moisture during the preparation process, the results may have significant variability. Therefore, each experiment was conducted three times to study the regularity. Through direct shear experiments on Class III, IV, and V coal under different moisture content conditions, the experimental results are shown in Table 5, Table 6 and Table 7.

4.2. Analysis of the Strength of Raw Coal with Different Moisture Content

(1)
The influence of moisture content on the cohesion of III–V type raw coal
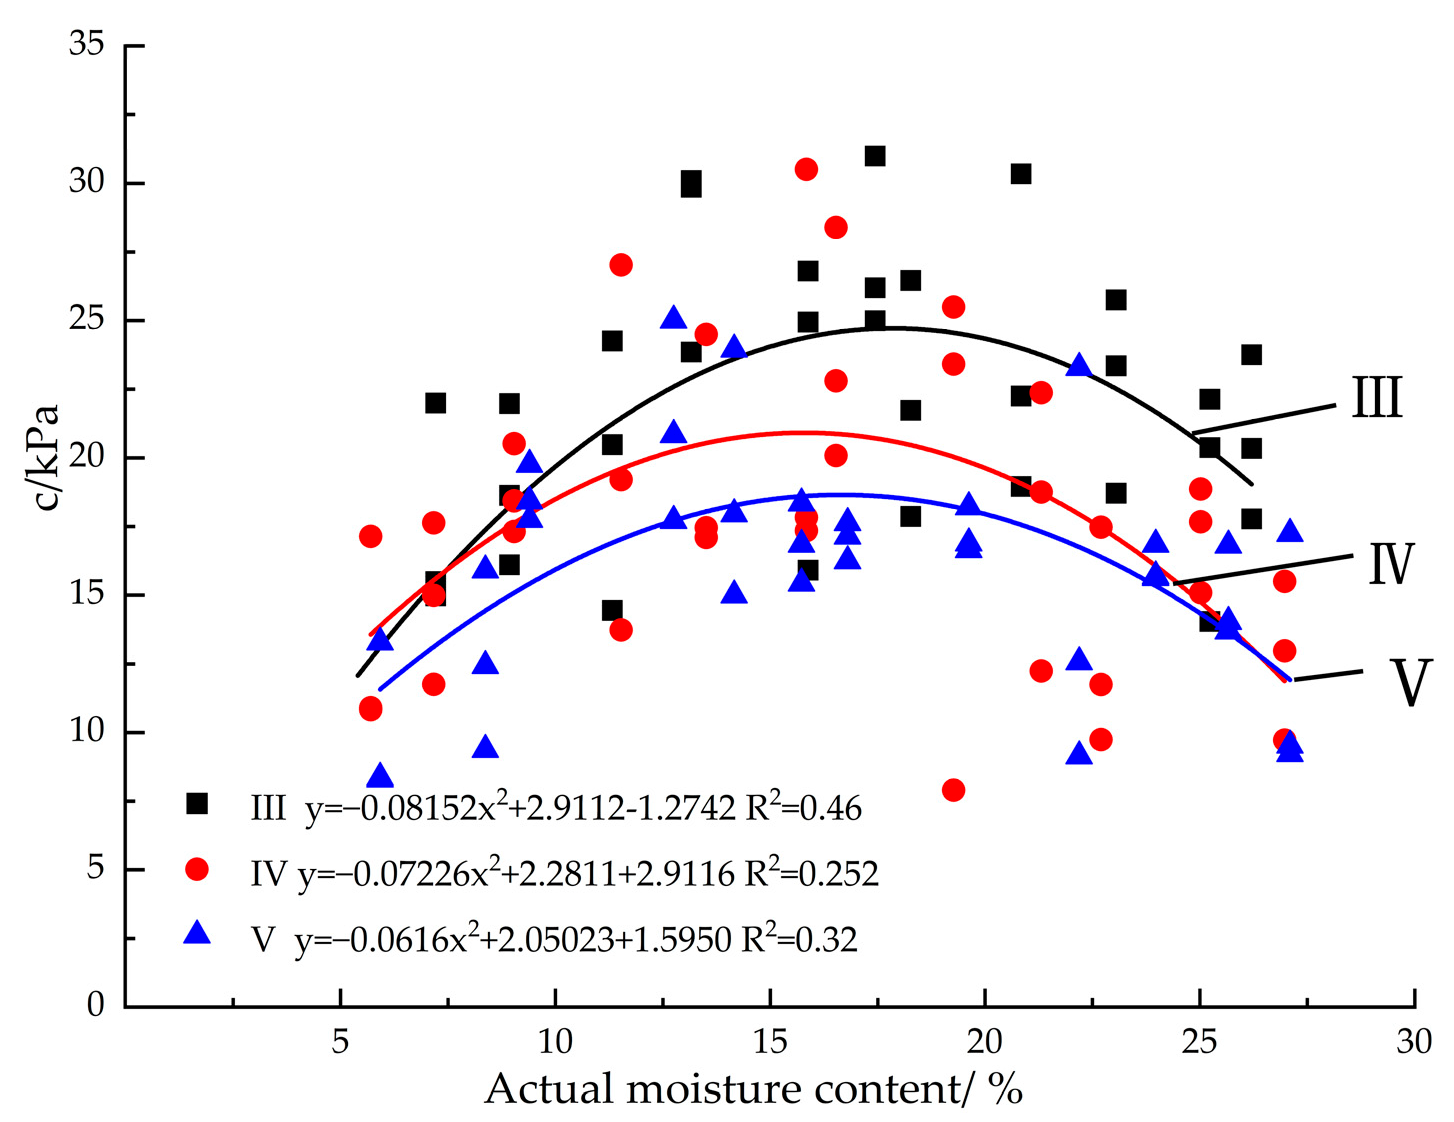
The variation curve of the cohesive force of III–V loose coal with respect to moisture content is shown in Figure 3. The cohesive force of the three coal samples shows an initial increase followed by a decrease with the increase of moisture content. The cohesive force of the Class III coal sample changes more significantly with the increase of moisture content than that of the Class IV and V coal samples. The optimal moisture content of Class III coal samples is approximately 17%, while the optimal moisture content of Class IV and V coal is approximately 15%. The agglomeration of Class III coal is more sensitive to changes in moisture content.
(2)
The influence of moisture content on the internal friction angle of III–V type raw coal
The relationship curve between the internal friction angle and moisture content of III–V loose coal samples is shown in Figure 4, which decreases overall with the increase of moisture content, with low-fitting degree and unclear overall correlation. The fitting curves of the internal friction angle and moisture content of Class III and Class IV coal almost coincide, while the internal friction angle of Class V coal varies greatly with moisture content. The internal friction angle mainly reflects the frictional performance of coal samples, mainly overcoming the frictional force caused by rough surfaces between particles. As the moisture content increases, the bound water film between particles continues to thicken, weakening the bonding effect between particles, while the free water continuously increases the lubrication effect between particles. Therefore, the internal friction angle continuously decreases with the increase of moisture content.

5. Relationships Between the Intensity Parameters of Bulk Raw Coal and the Fractal Dimension Number

For the Class III–V coals, because of their severe deformation and low strength, it was impossible to prepare raw coal samples, so molded coal samples were mostly utilized for the mechanical characterization tests. Zhang Feiyan et al. [12] introduced bulk mechanics into the field of coal mining and used direct shear experiments to determine the uniaxial compressive strength, cohesive force, and internal friction angle of Class III–V raw coal samples. Based on this, in this study, we investigated the relationships between the strength parameters of bulk raw coal samples and the fractal dimension.

5.1. Direct Shear Experiment

Each group of experiments was conducted on four specimens of the same type of coal. The sample dimensions were ϕ 61.8 mm × 20 mm, and a ZJ-2 equal strain straight shear instrument was utilized (Figure 5). The specimen was loaded into the rigid shear box of the straight shear instrument. Different vertical compressive stresses σ were applied step by step to apply horizontal thrust, causing displacement of the upper and lower parts of the shear box until the specimen experienced shear damage. The under shear strength τ of the specimen was measured under different compressive stresses and then was calculated using the shear strength index c and φ value.
τ = σ tan φ + c ,
where τ is the specimen’s shear strength (kPa); σ is the vertical compressive stress (kPa); φ is the internal friction angle of the specimen (°); and c is the specimen’s cohesive force (kPa).

5.2. Sample Preparation

The particle size distribution range of structural soft coal is wide. Due to the limitation of experimental equipment regarding the specimen size, it is necessary to scale down the coal samples of the original particle size grading before direct shear experiments can be carried out [20]. In this study, a similar grading method was used to conduct the downsizing. The idea underlying this method is described in what follows. Based on the ratio of the maximum particle size of the original grading to the maximum particle size allowed by the experimental equipment, the corresponding particle size groups of the bulk coal samples are downsized step by step, and the mass percentage of each group before and after the downsizing is unchanged. The gradation of the downsized grades is consistent with the filling relationship of the original grades, the fractal curves overlap with the original curves, and the linear relationship is good [21].
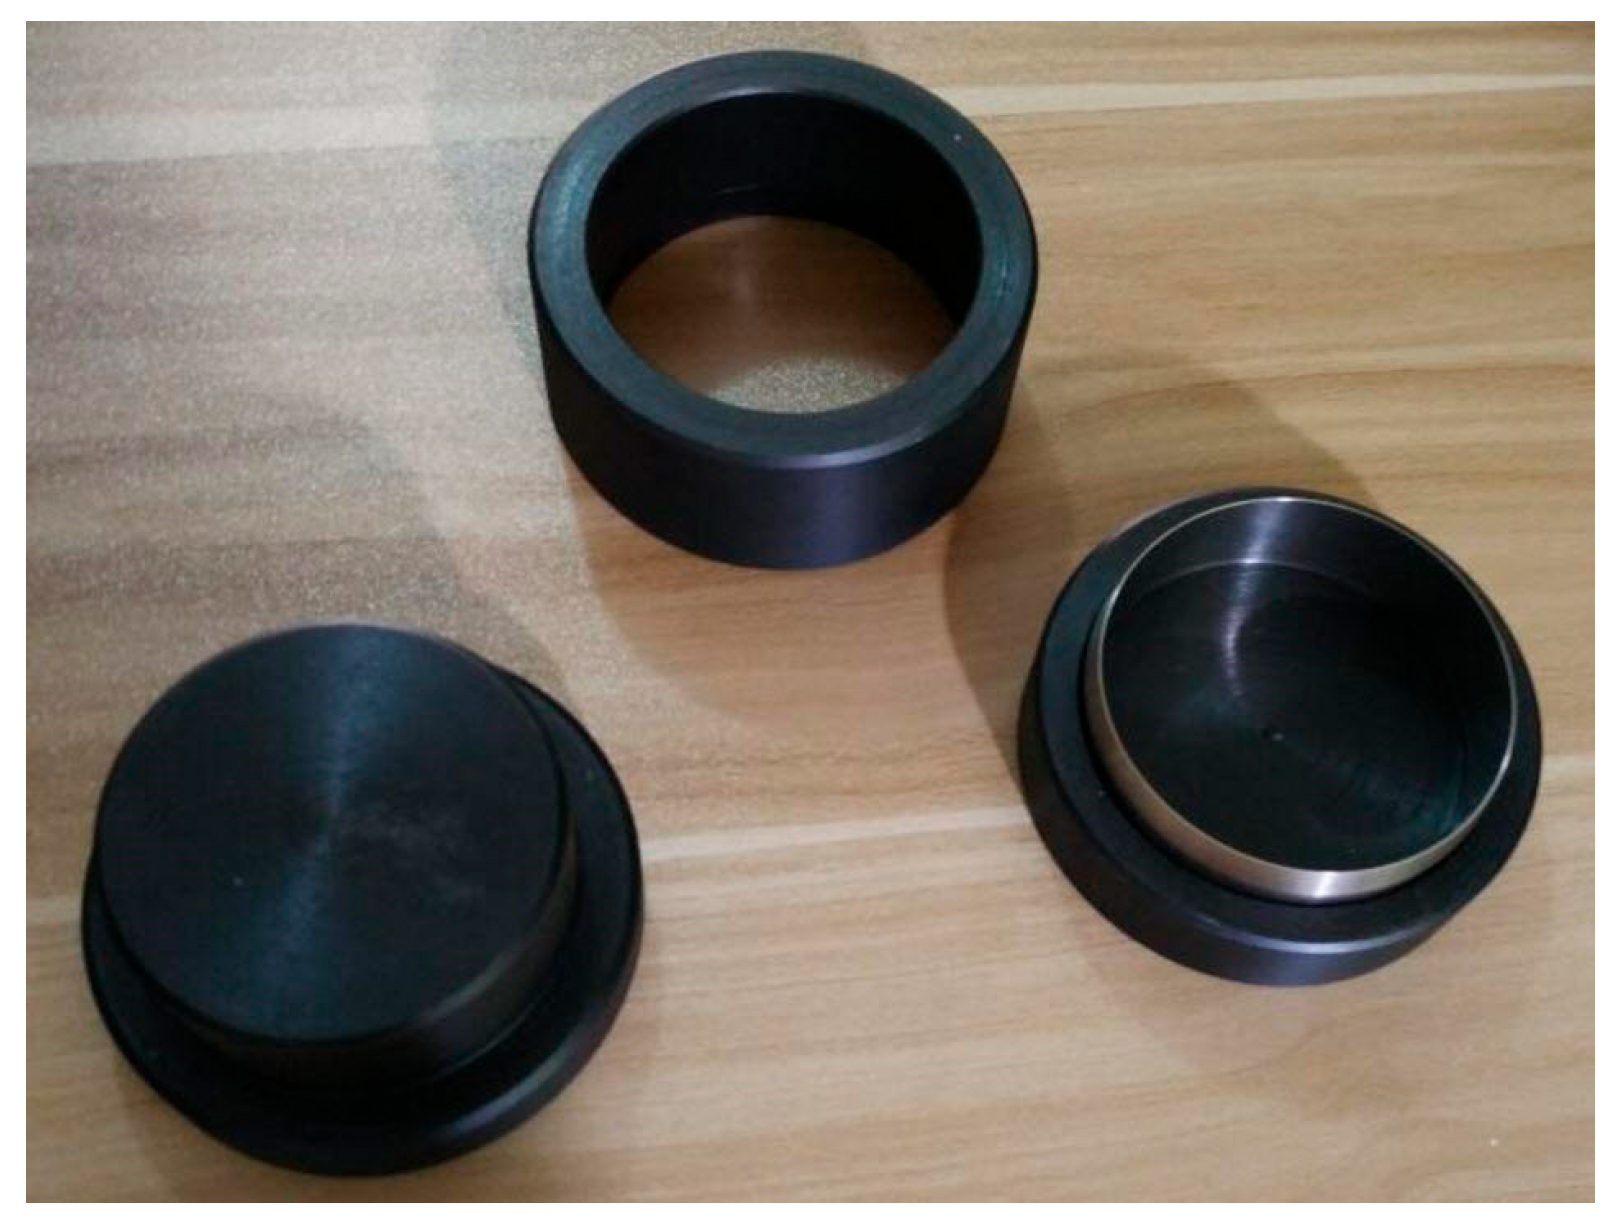
The reduced coal samples were poured into the sample hammer (Figure 6), which was equipped with a ring knife, and were cut into cylindrical specimens to produce backup samples.

5.3. Experimental Results and Analysis

Direct shear experiments were conducted on the reduced-size coal samples. The results are presented in Table 8.
The curve of the relationship between the fractal dimension and the internal friction angle is shown in Figure 7. It can be seen from Figure 7 that the correlation regression coefficient of the curve obtained by fitting the parameters to the curve is 0.8757, and the fitted regression equation is
φ = 38.85 3.61 D .
As can be seen from Table 8, there is no obvious correlation between the cohesion C and the fractal dimension D. It can be seen from Figure 5 that the internal friction angle φ and the fractal dimension D exhibit a better correlation. There is a negative linear correlation between the internal friction angle and the fractal dimension. As D increases, fine particle content grows, reducing the average particle size and contact area. This weakens interlocking and enhances rearrangement under stress, leading to lower internal friction angles φ. It can be seen that compared with the other two types of coal, the Class V coal has a lower cohesion and the largest fractal dimension. These results are similar to those of a previous study [16]. The correlation between the cohesion and sub-dimensional number is poor.
In direct shear tests, the coal samples exhibited a loose structure with indeterminate interlocking patterns among particles. Their particle size distribution resembled that of sandy soil, resulting in weak and highly variable interparticle bonding forces [22]. During shearing, the apparent cohesion was primarily the result of particle breakage. Due to the heterogeneous particle sizes and random arrangement within the bulk coal samples, their cohesion demonstrated no discernible regularity. The shear resistance was predominantly attributed to overcoming interparticle friction and particle breakage.

6. Relationship Between the Strength Parameters of the Coal Specimens and the Fractal Dimension

6.1. Uniaxial Compression Test

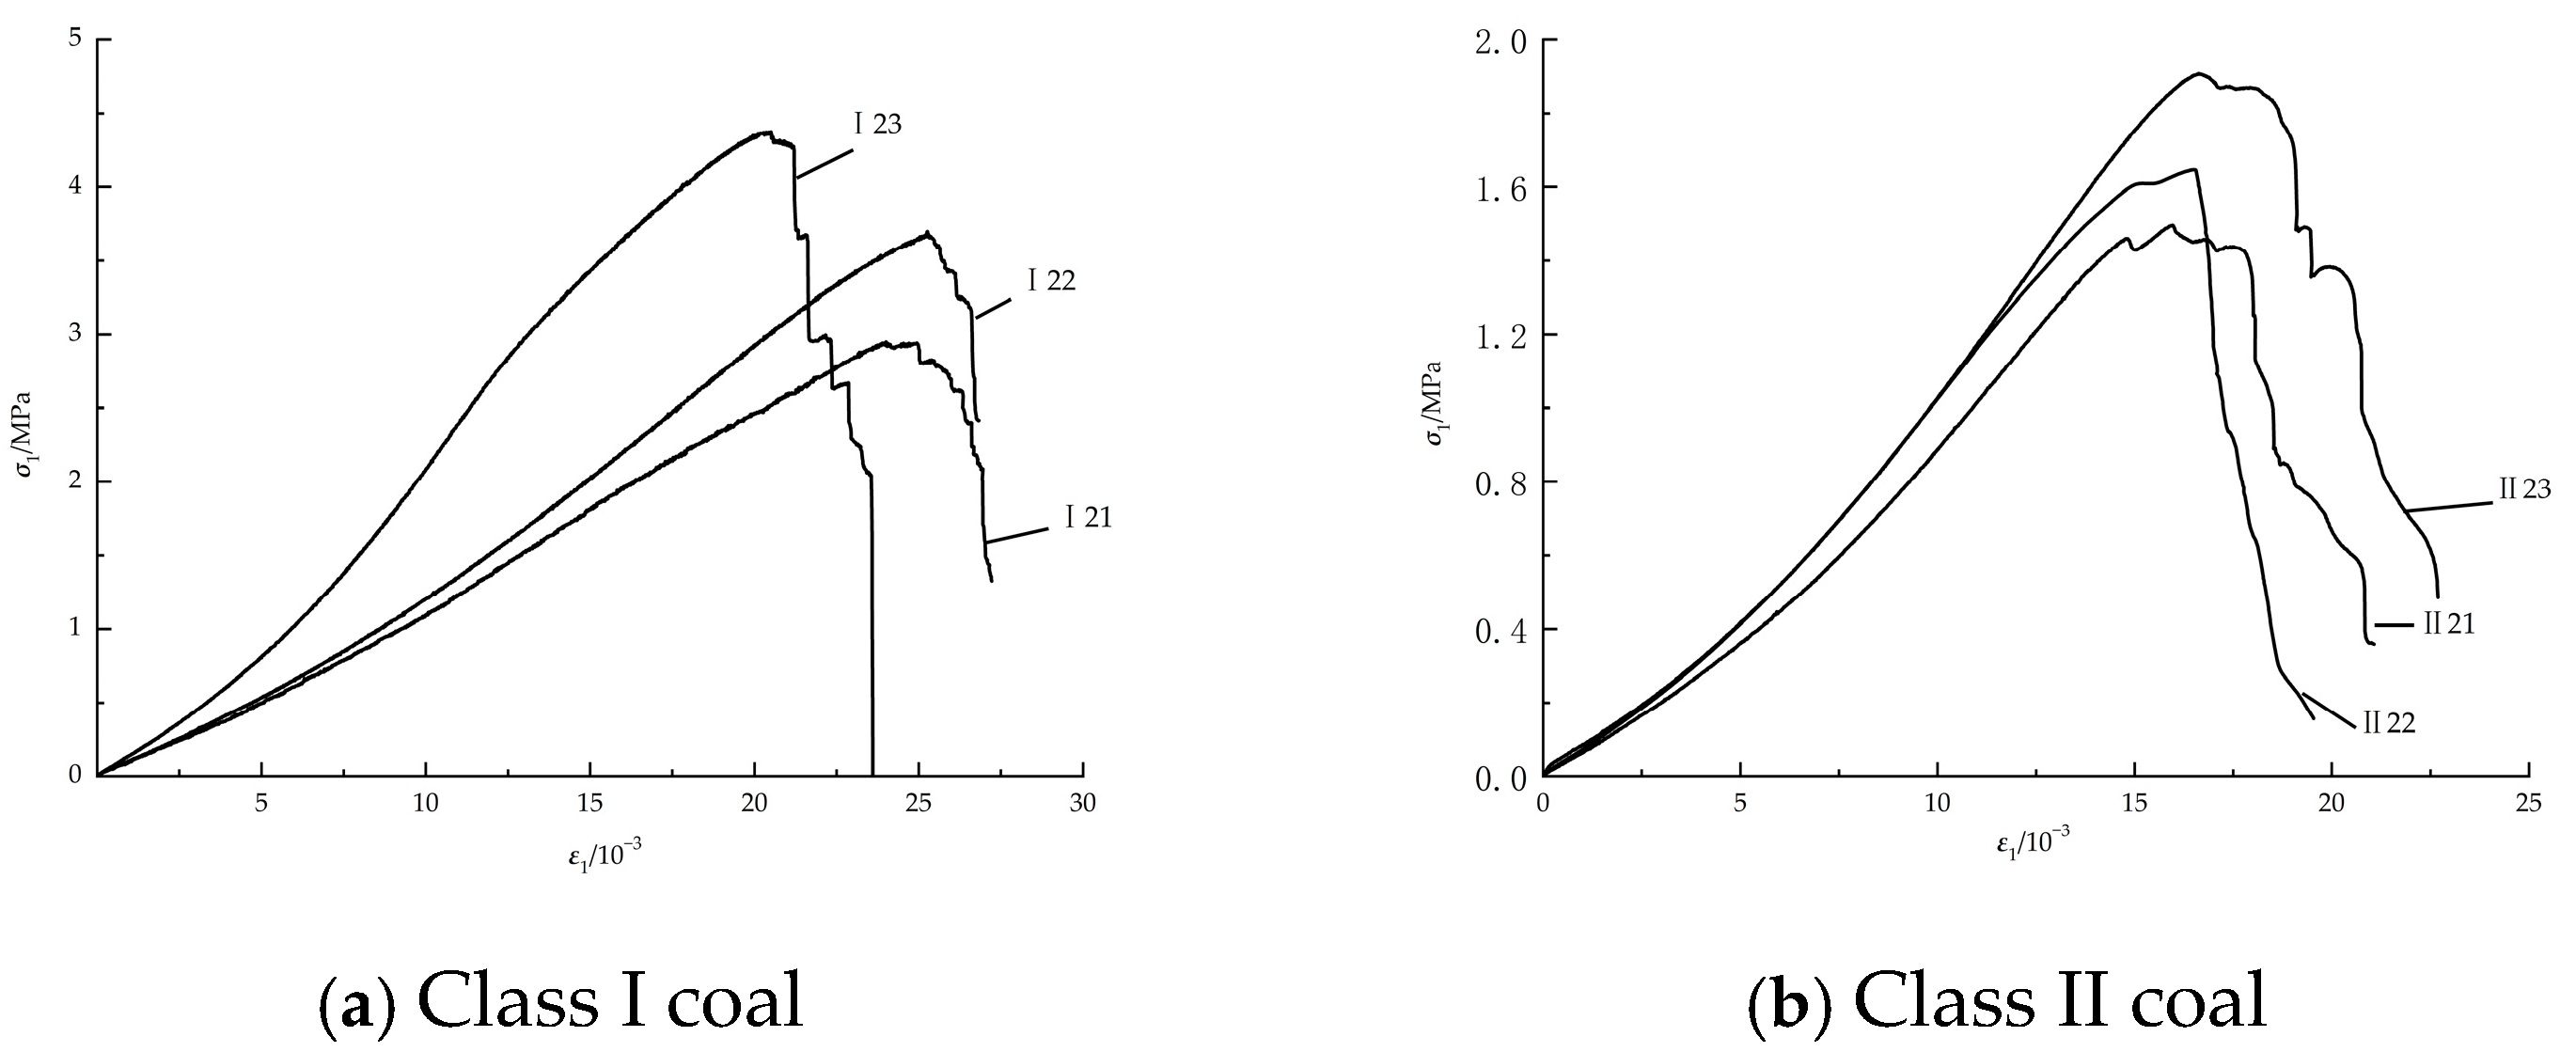
In this study, we selected representative samples (III 1, IV 1, and V 2) of three types of coal samples. The appropriate amount of coal sample was placed in a standard mold, a small amount of water was added, and a molding pressure of 200 kN was applied for 30 min. The dimensions of the produced samples were Φ50 mm × 100 mm. The uniaxial compression stress–strain curves of the coal specimens are shown in Figure 8. The results of the uniaxial compression experiment are presented in Table 9.
As shown in Table 9, the strengths of the Class III–V coal were lower. In order to explore whether the strength characteristics of the type of coal specimen were related to the firmness coefficient f, samples of raw Class I and II coal were collected from the same coal seam. The samples were ground, and samples III 1, IV 1, and V 2 were prepared using the same type of compression process used to prepare the molded coal specimens. It is best to regard the homogeneity of the coal specimen as isotropic. Therefore, specimens of the Class I and II coal for each level of coal were prepared and numbered I 21, I 22, I 23, II 21, II 22, II 23, III 21, III 22, III 23, IV 21, IV 22, IV 23, V 21, and V 22. The experimental results are presented in Table 5, and the stress–strain curve is shown in Figure 8.
As can be seen from Figure 8, the lower the strength of the coal type is, the slower the stress–strain curve decreases after the peak. For the stress–strain curve of the Class I coal, after the peak, there is a more obvious cliff-type stress reduction. It can also be seen that the types of coal specimens also reflect the elasticity of the original coal specimens. Class III coal has the lowest strength, and the decrease after the peak of the curve is the gentlest. It can be seen that its plasticity is larger, reflecting the characteristics of soft coal. Table 1 and Table 9 can be used to obtain the uniaxial compressive strength σ1 of the coal specimens and the six grades of the Class III–V coal samples by utilizing the firmness coefficient f and the relationship between the fractal dimension D. The corresponding curve is shown in Figure 9.
Figure 9 shows that compared with the Class I and II coals, the Class III–V coal specimens have better correlations between the uniaxial compressive strength σ1, firmness coefficient f, and fractal dimension D. With increasing fractal dimension D, the coefficient of firmness f decreases, and the proportion of the coal sample composed of fine particles gradually increases. The specific gravity of the fine particles in the coal samples gradually increases. The strengths of the coal samples with the same particle size gradation differ greatly, and the uniaxial strength σ1 of the coal samples increases with increasing fractal dimension D. The larger the specific gravity of the fine particles, the greater the strength.
As can be seen from Table 5, the uniaxial compressive strength of the coal samples is not only related to the particle size gradation but also to the firmness coefficient f, and compared with the fractal dimension D, the firmness coefficient is the main factor affecting the strength of the type of coal. Although it can be seen from Figure 9a that for the Class III–V coal, the uniaxial compressive strength σ1 increases with increasing fractal dimension D, while its firmness coefficient f gradually decreases. The decrease in the coefficient of firmness f with increasing D value is due to an increase in the degree of tectonic fragmentation: the higher the D value, the higher the degree of fragmentation, the more microcracks are produced, and the fewer intact coal bridges there are. This reduces the overall compressive strength and hence f. According to Table 9, compared with the Class I and II coal, the firmness coefficients f of the Class III–V coal are lower, more similar in value, exhibit smaller amplitude, and have a limited impact on the uniaxial compressive strength. Thus, the effect of the fractal dimension D on the uniaxial compressive strength σ1 plays a major role.
By comparing the Class I and II coals in Figure 9a, it was concluded that the uniaxial compressive strengths σ1 of coal samples I 21, II 21, and III (the Class I and II coals were also extracted from anthracite in the same seam as the Class III–V coals, so the influences of the coefficient of cohesion and internal friction were not taken into account), which had the same sub-dimensions as that of 1.781, were larger than that of the Class II coal under the condition of different sub-dimensions D, and the sub-dimension D increased under different conditions. The increase in the uniaxial compressive strength σ1 with increasing firmness coefficient f is greater than that of the uniaxial compressive strength σ1 under different fractal dimension numbers (D), and the uniaxial compressive strength of the Class I coal with dimension number 1.781 is higher than that of the Class II coal with dimension number 2.238. Therefore, it is believed that when the coefficient of adhesion and internal friction are not considered, the primary factor affecting the uniaxial compressive strength of the types of coal is the firmness coefficient, followed by the particle size grading.

6.2. Triaxial Compression Test

The triaxial compression experiments were conducted on the same selected representative coal specimens (III 1, IV 1, and V 2), and the same preparation process was utilized to produce 15 standard coal samples with dimensions of Φ50 mm × 100 mm. These samples were numbered III 24, III 25, III 26, III 27, III 28, IV 24, IV 25, IV 26, IV 27, IV 28, V 23, V 24, V 25, V 26, and V 27. The triaxial compression test was conducted to determine the mechanical parameters. The experimental results are presented in Table 10, and the triaxial compression stress–strain curves of the coal specimens are shown in Figure 10.
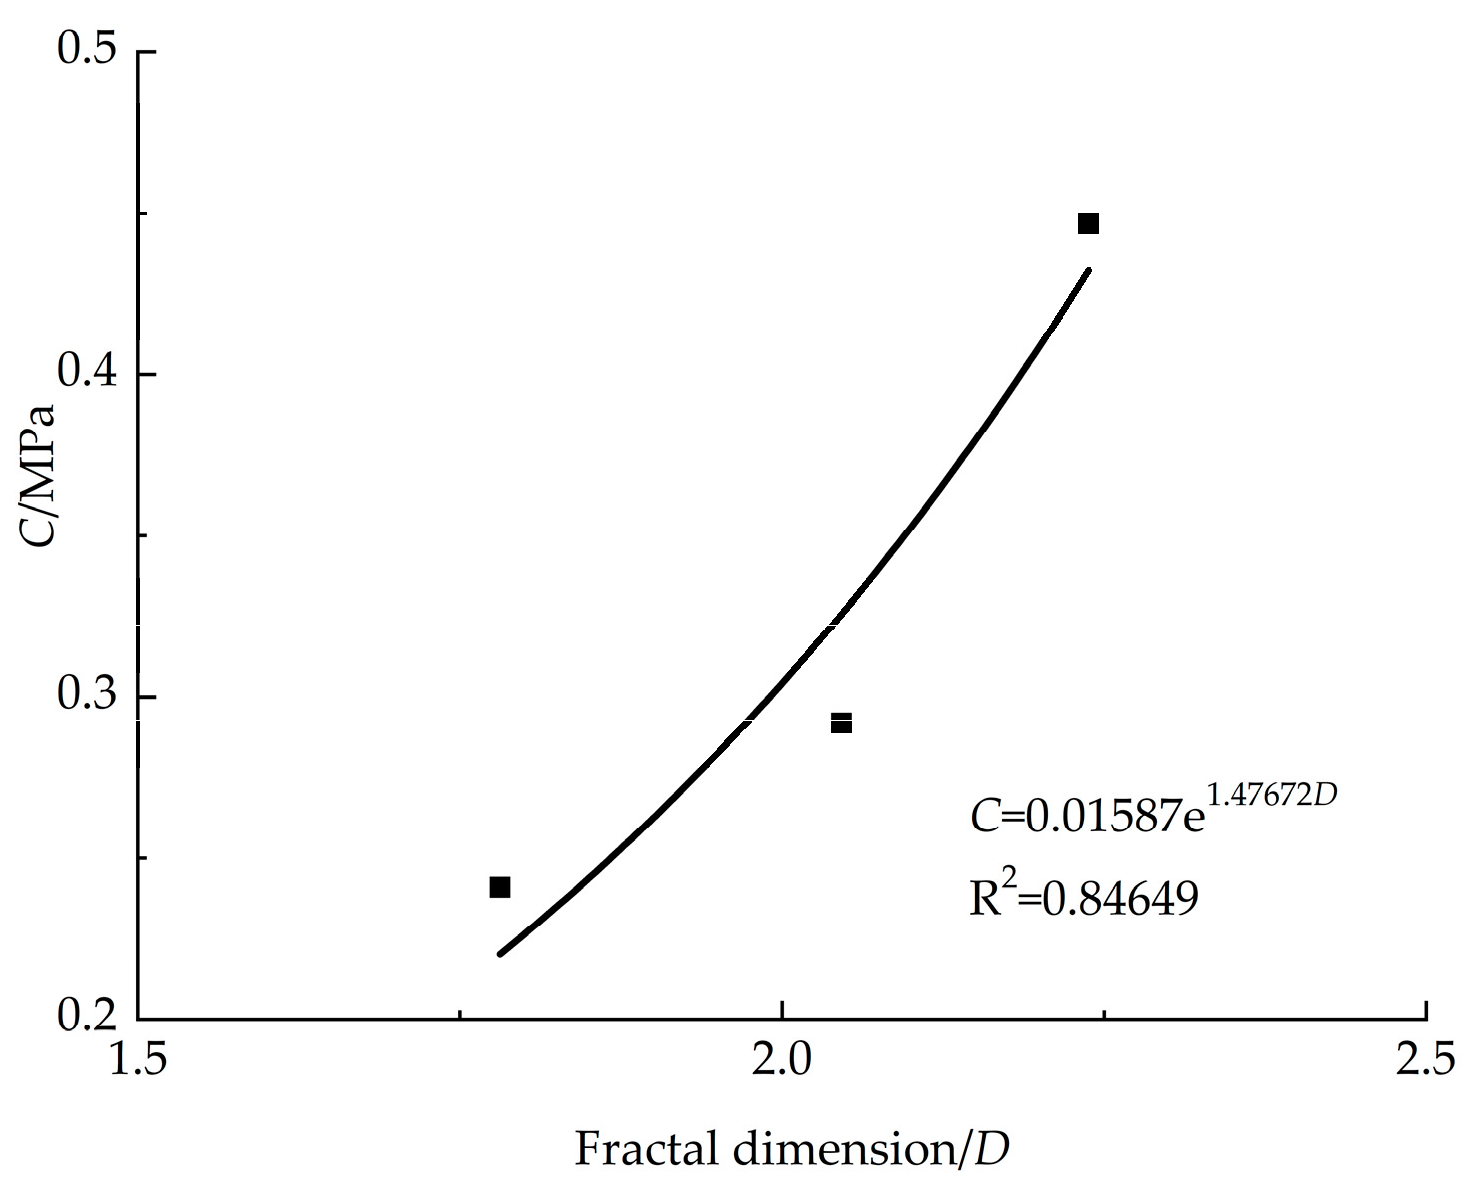
Due to the low uniaxial compressive strength of the types of coal, we selected five peripheral pressure conditions (0.2, 0.4, 0.6, 0.8, and 1 MPa) for use in the experiment. Under all of the peripheral pressure conditions, the Class III–V coal specimens’ strengths increased sequentially. The final specimen did not exhibit a significant stress drop on the soil triaxial compression curve, which was similar to the triaxial compression experiments conducted to obtain the cohesion C and the fractal dimension of the types of coal specimens. The relationship between D and C is shown in Figure 11.
As can be seen from Figure 11, the cohesive forces of the types of coal specimens exhibit a certain correlation with the number of sub-dimensions, and the cohesive force C is positively exponentially correlated with the fractal dimension D, with a correlation regression coefficient of 0.8465. The regression equation is as follows:
C = 0.01587 e 1.47672 D .
The correlation between the cohesion C and the fractal dimension D of the types of coal samples is better, while the correlation between the cohesion C and the fractal dimension D of the bulk of the original coal samples is poorer for two reasons. The cohesion is mainly related to the inter-particle adhesion and gradation; the three types of coals were collected from the same seam, and the degree of metamorphism of the anthracite was the same. Thus, depending on the consistency of the adhesion of the coal samples, under the larger molding pressure, the particles bonded together, resulting in better homogeneity and greater compactness compared with the bulk particles under reasonable moisture conditions, which helped increase the bonding between the particles. For the coal samples with more fine particles in the pulverized coal prepared from the types of coal samples with the smallest porosity [23], the total number of pores was the greatest, the pores between the coarse particles were filled with fine particles, and the sample was more tightly compacted. According to Table 3, it was concluded that the V 2 samples had good grading, and therefore, their cohesion was the greatest.
As can be seen from Table 6, the correlation between the internal friction angle φ of the coal specimen and the fractal dimension D is poor. We believe that the internal friction angle of the coal specimen is mainly related to the friction coefficient between the particles and the contact area. (1) The f-values of the Class III–V coals are relatively low. During the compression process, the internal particles are under the peripheral pressure and the action of friction [24]. The Protodyakonov’s coefficients for the investigated Class III–V coal samples were all below 0.4. Notably, Class III and IV coals contained a higher proportion of coarse particles than Class V coal. During the compaction process, more pronounced particle breakage occurred; this altered the internal particle size distribution and modified the interparticle contact areas. (2) The Class III–V coal samples are high metamorphic anthracite, so when the friction coefficient is the same, according to Table 3, the gradation of the Class V coal is the best. In the molding process, the internal structures of the Class III and IV coal are denser, and the greater the content of fine particles is, the smaller the inter-particle contact area is [25], so the angle of friction of the Class V coal is smaller. As can be seen from Table 6, the dispersion coefficient of the value of the internal friction angle of the coal type is 0.018. It can be concluded that the correlation between the fractal dimension and the internal friction angle is not obvious; the internal friction angle is the embodiment of the friction performance of the particles [26], which is mainly related to their inter-particle contact area and the coefficient of friction. During the high-pressure molding of the coal samples, some of the particles experienced secondary fragmentation; therefore, the correlation between the internal friction angle of the coal-type specimens φ and the fractal dimension D is not strong.

7. Conclusions

(1)
Through statistical analysis, in this study, we found that the studied tectonic soft coal samples had fractal characteristics and self-similarity in terms of the particle size grading. Based on statistical analysis of the grading characteristics of the three types of coals sampled in this study, the grading of the Class V coal is found to be relatively good. The fractal dimension of the Class III–V coals gradually increases, the fractal dimension of the coal samples decreases as the distance of the sampling point from the tectonic zone increases, and the content of coarse particles increases.
(2)
The cohesive force of Class III–V raw coal shows a trend of first increasing and then decreasing with the increase of coal sample moisture content, while the internal friction angle decreases with the increase of moisture content. The cohesion of Class III coal is more sensitive to changes in moisture content, while the internal friction angle of Class V coal varies the most with changes in moisture content.
(3)
Through direct shear experiments on bulk raw coal, we found that the internal friction angle φ of the shear strength parameter of the bulk raw coal decreased linearly with increasing fractal dimension D, and the cohesion C was not strongly correlated with the fractal dimension D. In the triaxial compression experiments on the types of coal, the value of the internal friction angle φ was relatively stable, and it almost did not change with the fractal dimension D. However, the cohesion C had a positive exponential relationship with the fractal dimension D.
(4)
The uniaxial compressive strength σ1 and firmness coefficient of the types of coal exhibited good correlations with the fractal dimension D. By comparing the experimental results of the uniaxial compression tests on the Class I and II coals prepared with the same gradation as the Class III–V coals, we found that the effect of the firmness coefficient f on the uniaxial compressive strength σ1 of the types of coal specimens was greater than that of the particle size gradation when the friction and bonding conditions were not considered.
(5)
This study can be used for on-site use to quickly obtain D and predict φ through portable screening. By controlling f (grouting reinforcement or hydraulic fracturing), the strength of coal pillars can be improved; Provide a theoretical basis for highlighting new quantitative indicators for risk assessment (areas with D ≥ 2.2 and f ≤ 0.4 are classified as high-risk). In the future, the plan is to expand to soft rocks such as shale and mylonite that are also affected by structures or introduce X-ray CT three-dimensional fracture networks to establish a D-fracture density permeability coupling model.

Author Contributions

Formal analysis, investigation, writing—original draft preparation, F.Z. and Y.H.; resources, data curation, supervision, project administration, funding acquisition, F.Z., F.S. and Q.L.; writing—review and editing, F.Z. and Y.H. All authors have read and agreed to the published version of the manuscript.

Funding

This research was supported by the National Natural Science Foundation of China (Nos. 51974108 and 51404093), the Natural Science Foundation of Henan Province (No. 232300420077), the Scientific and Technological Project of Henan Province (No. 242102320213), the Fundamental Research Funds for the Universities of Henan Province (No. NSFRF240638), and the Post-doctoral Research Project of Henan Province (No. 001701014).

Data Availability Statement

The data that support the findings of this study are available from the corresponding author upon reasonable request.

Conflicts of Interest

The authors declare that there are no competing interests.

References

  1. State Administration of Coal Mine Safety. Prevention and Control of Coal and Gas Protrusion Rule; Coal Industry Press: Beijing, China, 2019. [Google Scholar]
  2. Li, W.; Zhong, Y.; Guo, J.J.; Cai, H.; Li, H.; Hua, C. Experimental study on confined compression deformation and crushing characteristics of different types of coal particles. Coal Sci. Technol. 2023, 6, 72–80. [Google Scholar]
  3. Guo, B.; Li, Y.; Jiao, F.; Luo, T.; Ma, Q. Experimental study on coal and gas outburst and the variation characteristics of gas pressure. Geomech. Geophys. Geo-Energ. Geo-Resour. 2018, 4, 355–368. [Google Scholar] [CrossRef]
  4. Li, Q.C.; Wu, J.J.; Li, Q.; Wang, F.L.; Cheng, Y. Sediment Instability Caused by Gas Production from Hydrate-bearing Sediment in Northern South China Sea by Horizontal Wellbore: Sensitivity Analysis. Nat. Resour. Res. 2025, 34, 1667–1699. [Google Scholar] [CrossRef]
  5. Zhang, C.; Li, Y.; Wang, E.; Liu, X.; Geng, J.; Chen, J. Comminution Energy Based on Particle Size Distribution and Crushing Mechanism During Coal and Gas Outburst. Nat. Resour. Res. 2025, 34, 1147–1167. [Google Scholar] [CrossRef]
  6. Xie, Y.; Yang, X.; Dong, J.; Liu, G.; Li, B. Quantitative Study on Empirical Strength Parameters of Extremely Fractured Phyllite Based on Fractal Theory. Adv. Mater. Sci. Eng. 2021, 14, 2241351. [Google Scholar] [CrossRef]
  7. Xie, H.P. Fractal geometry and its application to rock and soil materials. Chin. J. Geotech. Eng. 1992, 14, 14–24. [Google Scholar]
  8. Jiang, C.; Wang, L.; Guo, J.; Wang, S. Deformation, fracture characteristics and damage constitutive model of soft coal under true triaxial complex stress paths. PLoS ONE 2025, 20, e0319706. [Google Scholar] [CrossRef]
  9. Zhao, H.B.; Zhang, H.B.; Yin, G.Z. Experiments on triaxial mechanical properties of soft coal containing gas. J. Chongqing Univ. 2013, 1, 103–109. [Google Scholar]
  10. Guo, J.; Li, W.; Jiao, Y.; Wang, Y. A discrete numerical simulation of micromechanics for dense coal granular systems: Implication for coal and gas outbursts. Powder Technol. 2021, 392, 448–458. [Google Scholar] [CrossRef]
  11. Zhang, K.; Xing, X.; Wang, L.; Yang, B.; Li, J.; Zhang, H. Micro-CT Image-Based Characterization of Microstructure Complexity in Coal: From the Perspective of Fractal Geometrical Theory. Nat. Resour. Res. 2025. [Google Scholar] [CrossRef]
  12. Zhang, F.Y.; Han, Y.; Yang, Z.L. An estimation method of mechanical parameters for soft coal. Saf. Coal Mines 2013, 1, 13–15. [Google Scholar]
  13. Li, Q.; Li, Q.C.; Wang, F.L.; Ning, X.; Wang, Y.L.; Bai, B.J. Settling behavior and mechanism analysis of kaolinite as a fracture proppant of hydrocarbon reservoirs in CO2 fracturing fluid. Colloids Surf. A Physicochem. Eng. Asp. 2025, 724, 137463. [Google Scholar] [CrossRef]
  14. Tang, Y.Y.; Tian, G.L.; Sun, S.Q.; Zhang, G.C. Improvement and perfect way for the classification of the shape and cause formation of coal body texture. J. Jiaozuo Inst. Technol. (Nat. Sci.) 2004, 1, 161–164. [Google Scholar]
  15. Chen, Z.Y.; Zhou, J.X.; Wang, H.J. Soil Mechanics; Tsinghua University Press: Beijing, China, 1994. [Google Scholar]
  16. Xie, X.B.; Pan, C.L. Fractal characteristics of size distribution and shear strength of bulky rock material in waste pile of mines. Rock Soil Mech. 2004, 2, 287–291. [Google Scholar]
  17. Yang, G.S. Fractal structure of rock powder distribution of rock drilling. J. Fuxin Min. Inst. (Nat. Sci.) 1994, 1, 118–120. [Google Scholar]
  18. Turcotte, D.L. Fractals and fragmentation. J. Geophys. Res. 1986, 91, 1921–1926. [Google Scholar] [CrossRef]
  19. Gao, F.; Xie, H.P.; Zhao, P. Fractal properties of size-frequency distribution of rock fragments and the influence of meso-structure. Chin. J. Rock Mech. Eng. 1994, 3, 240–246. [Google Scholar]
  20. Geng, J.; Cao, L.; Zhong, C.; Zhang, S. An Experimental Study on Preparation of Reconstituted Tectonic Coal Samples: Optimization of Preparation Conditions. Energies 2021, 14, 2846. [Google Scholar] [CrossRef]
  21. Chen, L.F.; Gao, Z.P.; Zhu, J.G.; Yin, J. Gradation of coarse grained soil and fractal geometry character of particle breakage. J. Cent. South Univ. (Sci. Technol.) 2015, 9, 3446–3453. [Google Scholar]
  22. Liang, W.; Li, K.G.; Hou, K.P.; Du, J. Fractal characteristics of granularity of loose micaschist and its relation to shear strength parameters. Rock Soil Mech. 2012, 3, 767–772. [Google Scholar]
  23. Wu, X. Research on Simulation Experiments on Coal and Gas Outburst in Various Particle Size. Master’s Thesis, Chongqing University, Chongqing, China, 2010. [Google Scholar]
  24. You, M.Q.; Su, C.D.; Zhou, Y. Strength and deformation of specimens for different coal blocks and regression method of strength criteria. Chin. J. Rock Mech. Eng. 2003, 12, 2081–2085. [Google Scholar]
  25. Gao, Z.N. Discussion of relationship between fractal feature and its physical mechanics characters of grain matter. J. Exp. Mech. 2011, 3, 285–290. [Google Scholar]
  26. Zan, Y.X.; Yao, H.L.; Zhang, J.B. Research on the relationship between mesoscopic and macroscopic mechanical parameters of cohesive coarse grained soil. J. Railw. Eng. Soc. 2016, 1, 12–16. [Google Scholar]
Figure 1. Tectonic soft coal particle size grading curve.
Processes 13 02663 g001
Figure 2. Tectonic soft coal fractal curve.
Processes 13 02663 g002
Figure 3. The curve of relationship between cohesion and moisture content.
Processes 13 02663 g003
Figure 4. The curve of relationship between internal friction angle and moisture content.
Processes 13 02663 g004
Figure 5. ZJ-2 equal strain straight shear instrument.
Processes 13 02663 g005
Figure 6. Ring knife compaction device.
Processes 13 02663 g006
Figure 7. Plot of the fractal dimension vs. the internal friction angle.
Processes 13 02663 g007
Figure 8. Uniaxial compression stress–strain curves of the modeled coal.
Processes 13 02663 g008aProcesses 13 02663 g008b
Figure 9. Plots of the fractal dimension versus the uniaxial strength parameters.
Processes 13 02663 g009
Figure 10. Triaxial compression stress–strain curves of the coal samples.
Processes 13 02663 g010
Figure 11. Relationship between fractal dimension and cohesion.
Processes 13 02663 g011
Table 1. Percentage of mass of each particle size fraction of tectonic soft coal.
Particle Size Range (mm)<0.0750.075–0.10.1–0.20.2–0.40.4–0.50.5–0.60.6–11–22–55–10
Percentage of Mass (%)
Coal Sample
III 10.350.320.920.463.934.327.5627.7434.6219.78
III 20.180.250.830.644.526.2911.3129.6023.5122.87
IV 10.960.813.445.524.566.0314.1122.0726.0416.46
IV 21.330.281.461.861.666.1712.6420.9140.7112.98
V 12.870.993.475.346.1611.1422.4427.0216.574.00
V 22.572.454.724.515.284.6931.3921.0717.385.94
Table 2. Calculation results of indices utilized to examine the particle size gradation of the tectonic soft coal.
Coal Sampled10 (mm)d30 (mm)d60 (mm)CuCc
III 10.591.432.924.951.18
III 20.551.152.564.650.93
IV 10.360.822.186.060.85
IV 20.551.162.724.940.89
V 10.280.591.214.321.03
V 20.200.561.306.501.21
Table 3. Tectonic soft coal fractal dimension calculation results.
Coal SampleDR
III 11.7810.947
III 21.6600.915
IV 12.0460.916
IV 22.0230.912
V 12.2070.911
V 22.2380.911
Table 4. Statistical results of the water content of coal samples.
Coal SampleMoisture Content/%Average Moisture Content/%
III 1 (1)3.874.22
III 1 (2)4.56
III 2 (1)4.764.59
III 2 (2)4.42
IV 1 (1)4.794.73
IV 1 (2)4.67
IV 2 (1)4.234.58
IV 2 (2)4.92
V 1 (1)4.985.13
V 1 (2)5.27
V 2 (1)4.494.81
V 2 (2)5.12
Table 5. The direct shear test results of the III coal sample type.
Coal SampleActual Moisture Content/%σn1/50 kPaσn2/100 kPaσn3/200 kPaσn4/400 kPaC/kPaφ
III 1 (1)7.2145.1279.88141.80278.411.7633.42
III 1 (2)52.7071.40124.30248.4217.6429.25
III 1 (3)47.4080.52136.30269.4214.9932.21
III 2 (1)11.3242.6668.1137.64245.5213.7430.34
III 2 (2)54.3279.08142.42271.5319.2132.10
III 2 (3)53.3084.56148.74256.9227.0230.11
III 3 (1)20.8453.5187.53137.82269.4822.3831.46
III 3 (2)47.6879.54137.18257.6318.7630.84
III 3 (3)41.6377.23139.76264.2412.2432.21
III 4 (1)25.2341.7269.28149.57249.5715.0930.54
III 4 (2)49.2472.58157.35266.8617.6732.21
III 4 (3)39.4870.58163.00244.2818.8730.11
Table 6. The direct shear test results of the IV coal sample type.
Coal SampleActual Moisture Content/%σn1/50 kPaσn2/100 kPaσn3/200 kPaσn4/400 kPaC/kPaφ
IV 1 (1)7.1745.1279.88141.8278.411.76333.42
IV 1 (2)52.771.4124.3248.4217.6429.25
IV 1 (3)47.480.52136.3269.4214.9932.21
IV 2 (1)11.5342.6668.1137.64245.5213.73530.34
IV 2 (2)54.3279.08142.42271.5319.20732.10
IV 2 (3)53.384.56148.74256.9227.02430.19
IV 3 (1)19.2739.3263.24141.6252.967.931.79
IV 3 (2)48.6376.94160.78249.2425.49529,68
IV 3 (3)49.9788.67146.73267.1323.42131.38
IV 4 (1)25.0241.7269.28149.57249.5715.08830.54
IV 4 (2)49.2472.58157.35266.8617.67332.21
IV 4 (3)39.4870.58163244.2818.8730.11
Table 7. The direct shear test results of the V coal sample type.
Coal SampleActual Moisture Content/%σn1/50 kPaσn2/100 kPaσn3/200 kPaσn4/400 kPaC/kPaφ
V 1 (1)8.3741.6278.39157.5258.418.4231.64
V 1 (2)46.772.54161.5264.417.75832.29
V 1 (3)46.274.37153.24253.819.7630.88
V 2 (1)12.7552.583.7139.5277.1417.96632.67
V 2 (2)43.5772.8147.23257.415.00631.57
V 2 (3)50.2482.6151.4259.723.95930.85
V 3 (1)19.6234.670.68128.34230.6412.5728.89
V 3 (5)38.3360.63141.28242.829.1430.76
V 3 (3)41.2781.46133.78229.5723.29327.65
V 4 (1)27.1039.8677.56148.23247.6818.230.42
V 4 (2)44.3285.67161.86253.2726.05530.45
V 4 (3)31.8469.77147.6236.912.73430.12
Table 8. Relationship between shear strength parameters of tectonic raw coal and fractal dimension of particle size distribution.
Coal Sampleσ (kPa)τ (kPa)Dc (kPa)φ (°)
III 15033.242.924.9531.18
10059.26
200128.40
400243.22
III 25036.521.6603.4732.08
10063.54
200129.80
400254.20
IV 15021.402.0464.8930.73
10069.00
200128.40
400227.60
IV 25030.542.02311.5130.15
10073.54
200142.48
400240.57
V 15046.362.20713.1730.11
10071.40
200124.30
400248.42
V 25035.002.2387.1329.68
10069.00
200116.20
400238.16
Table 9. Results of uniaxial compression experiment on coal samples.
Coal Sampleσ1 (MPa)f
I 212.941.20
I 223.69
I 234.37
II 211.4970.70
II 221.649
II 231.907
III 210.5600.35
III 220.637
III 230.618
IV 210.9240.20
IV 220.861
IV 230.924
V 211.0300.18
V 221.053
Table 10. Triaxial compression test results.
Coal Sampleσ3(MPa)σ1(MPa)E (GPa)c (MPa)φ (°)
III 240.21.9990.0990.24146.65
III 250.43.8790.153
III 260.65.1800.220
III 270.86.0080.263
III 281.07.2490.294
IV 240.22.9650.1120.29246.97
IV 250.44.1060.177
IV 260.64.6840.184
IV 270.86.6890.282
IV 281.07.7870.338
V 230.23.2850.16611.5145
V 240.44.3220.196
V 250.65.2780.212
V 260.86.8630.265
V 271.08.0780.295
Disclaimer/Publisher’s Note: The statements, opinions and data contained in all publications are solely those of the individual author(s) and contributor(s) and not of MDPI and/or the editor(s). MDPI and/or the editor(s) disclaim responsibility for any injury to people or property resulting from any ideas, methods, instructions or products referred to in the content.