Article

Gas Sources and Productivity-Influencing Factors of Matrix Reservoirs in Xujiahe Formation—A Case Study of Xin 8-5H Well and Xinsheng 204-1H Well

1
Petroleum Engineering Research Institute of Southwest Oil and Gas Company, SINOPEC, Deyang 610080, China
2
Key Laboratory of Oil & Gas Reservoir Geology and Exploitation, Southwest Petroleum University, Chengdu 610500, China
*
Authors to whom correspondence should be addressed.
Processes 2025, 13(8), 2644; https://doi.org/10.3390/pr13082644
Submission received: 9 June 2025 / Revised: 9 August 2025 / Accepted: 16 August 2025 / Published: 20 August 2025
(This article belongs to the Section Energy Systems)

Abstract

The tight sandstone gas reservoirs of the Xujiahe Formation are critical targets for tight gas exploration and development in the Sichuan Basin. While Class I reservoirs have been successfully developed using staged volume fracturing technology, efforts are being increasingly directed toward Class II and III matrix-type blocks. These reservoirs are characterized by a low permeability, high geo-stress differentials, strong heterogeneity, and limited fracture development. These properties result in several challenges, including ambiguous gas production sources, low reservoir utilization rates, significant variability in horizontal well performance, and rapid early-stage production decline—all of which hinder the effective development of matrix-type reservoirs. This study examines two representative fractured wells, Xin 8-5H and Xinsheng 204-1H, located in Class II and III blocks of the Xujiahe Formation gas reservoir. To identify gas production sources, we establish full-fracturing-section productivity models. Furthermore, accounting for variations in geological characteristics, we develop distinct productivity models for three key zones, the matrix area, fracture area, and fault area, to evaluate the productivity controls. The findings reveal that well Xin 8-5H primarily produces gas from the matrix and fault zones, whereas well Xinsheng 204-1H derives most of its production from the matrix and natural fractures. In matrix-dominated zones, generating complex fracture networks enhances productivity. An optimal cluster spacing of approximately 14 m ensures broad pressure sweep coverage while maintaining effective inter-cluster fracture connectivity. Additionally, natural fractures in the Xu-2 matrix reservoirs play a vital role in fluid communication. To maximize reservoir contact, well trajectories should be designed such that natural fractures are oriented either parallel or perpendicular to the wellbore, thereby improving lateral and vertical development. Near fault zones, adjusting cluster spacing to 14–25 m—while keeping the distance between faults and fracturing stages below 50 m—effectively connects faults and substantially increases production. This study introduces a systematic methodology for identifying gas sources in matrix reservoirs and optimizes key productivity-influencing parameters. The results provide both theoretical insights and practical strategies for the efficient development of Xu-2 matrix reservoirs.

1. Introduction

The Xujiahe Formation gas reservoir is a strategically vital tight gas target in the Sichuan Basin and plays a key role in Sichuan’s “Gas Mega Project.” Based on integrated geological-engineering evaluations, these reservoirs are categorized into three classes: Class I reservoirs exhibit well-developed natural fractures, favorable geological properties (gas saturation: >60%; porosity: >8%; permeability: >0.1 mD), and strong development potential (fracability index: >1.5); Class II reservoirs feature moderately developed fractures with either acceptable geological characteristics (gas saturation: 20–60%; porosity: 5–8%; permeability: 0.03–0.1 mD) or moderate development potential (fracability index: 1.2–1.5); and Class III reservoirs display poor fracture development, inferior petrophysical properties (gas saturation: <20%; porosity: <5%; permeability: <0.03 mD), and limited fracability (index: <1.2). Class II and III reservoirs, characterized by a low permeability and underdeveloped fractures, are collectively termed matrix-type reservoirs. Sinopec Southwest Branch has achieved notable success in Class I reservoirs using bridge plug staged volume fracturing, with average test production reaching 176,500 m3/d per well. However, as exploration progresses, attention has shifted to the more challenging Class II and III blocks in the Xu-2 gas reservoir of the Xinchang–Hexingchang field. These matrix-type reservoirs present significant development hurdles due to their ultra-low permeability, high geo-stress differentials, strong heterogeneity, and sparse natural fractures. Key challenges include inefficient stimulation, complex and variable gas sources, and wide disparities in well productivity. The early development revealed that gas production mechanisms in these reservoirs are more intricate than previously assumed. For instance, in the Xinchang–Hexingchang Xu-2 reservoir, two Class II and III wells—Xinsheng 204-1H (80,000 m3/d) and Xin 8-5H (190,000 m3/d)—exhibit markedly different dominant production characteristics: the former being primarily fracture-dominated while the latter mainly derives most of its production from the matrix. This divergence challenges the conventional view that natural fractures are the sole driver of high production in tight gas reservoirs and underscores the limitations of current evaluation methods in discerning complex gas sources. Accurately identifying production contributors in matrix-type reservoirs is thus critical for optimizing development strategies and enhancing recovery in Class II and III reservoirs.
Gas production source analysis employs two primary approaches: experimental research and numerical simulation. Experimental studies leverage various analytical techniques to determine gas origins. (1) Isotope Or Tracer Analysis: Chakhmakhchev [1] determined the source of hydrogen sulfide in Bakken oil-producing wells through sulfur isotope analysis. Almubarak [2] identified gas production sources in different conventional and unconventional reservoirs using carbon isotopes. Hume [3] discovered that the hydrocarbon distribution in Alberta, Canada, was closely related to source rocks, with Jurassic formations potentially being significant hydrocarbon sources. S. Drylie [4] introduced a method combining traditional production analysis with proppant tracer data to determine effective fracture counts in shale gas wells. (2) Core analysis and Logging Integration: Wang [5] combined core data, reservoir properties, and the isotopic composition to confirm that Shaximiao Formation gas derives from the Xujiahe and Da’anzhai source rocks. Similarly, Li [6] quantified productivity contributions from different reservoir types in the Sulige Gas Field using thin-section and mercury injection data. Hampton [7] integrated production-pressure data analysis and core analysis to reveal that gas production from Monterey Formation shale reservoirs originates from conventional sources, high-pressure reservoir leakage, and shale gas desorption. Tang [8] addressed the low-permeability gas layers in the Hechuan Xujiahe Formation of the Sichuan Basin, proposing evaluation experiments under different water saturation levels to study the gas sources. (3) Fracture Characterization: Mohsin [9] integrated acoustic and production logging to assess the stratified contributions in tight gas reservoirs, whereas Mei Dan [10] experimentally studied fracture impacts on productivity using artificially fractured cores. Wang Juan [11] argued that natural fractures have limited contributions. (4) Advanced Analytical Techniques: Alalawi [12] employed gas chromatography and the pyrolysis-derived Hydrogen Index (HI) to identify gas sources, while Su San [13] used isotopic fingerprinting and pressure profiling to distinguish shallow sweet gas from deep sour gas in southern Sichuan.
Numerical methods have provided further insights into production mechanisms. (1) Isotope-Based Modeling: Ni Xiaoming [14] combined isotope testing with a binary gas model to quantify the contributions in multi-seam coalbed methane wells. Vanessa Santiago [15,16] studied the contribution of individual coal seams to gas production in single-coalbed methane wells. (2) Fracture Network Simulation: Mi [17] applied an Enhanced Discrete Fracture Network (EDFN) model and revealed that fracture segment contributions in the Fuling shale gas field correlate with the cumulative fracture length and spacing. (3) Multi-Mechanism Flow Modeling: Abdelghani [18] developed a dual-porosity dynamic model incorporating multiple flow mechanisms to identify productive intervals. Bai [19] used a trilinear flow model to demonstrate that outer fracture-stimulated zones enhance productivity in Eagle Ford condensate wells. (4) Reservoir-Specific Simulations: Shen [20] constructed a gas hydrate-free gas accumulation model to explain production sources in the Shenhu area, while Li [21] developed a hydrocarbon generation–expulsion simulator to clarify gas origins under formation conditions. Moghaddam [22] presented numerical methods for simulating unconventional gas reservoir production considering non-Darcy flow, gas adsorption/desorption, and geo-mechanical effects. (5) other simulation methods: Yang [23] developed a method to determine the correlation between coal seam cleat volume and gas production rate using focused resistivity logging and borehole fluid resistivity. He [24] explored the impacts of reservoir physical properties, pressure, and gas well production allocation on multi-layer commingled production capacity, established interlayer interference charts, and enabled the evaluation of production contribution rates for each layer.
Recent advances in AI have enabled data-driven productivity predictions. (1) Statistical and Neural Network Models: Zhu [25] used ΔlogR-based neural networks for source rock prediction, while Deshmukh [26] applied quantitative seismic interpretation to identify shale gas sweet spots. (2) Hybrid Machine Learning Frameworks: Niu [27] integrated grey correlation analysis, clustering ensembles, and Kriging modeling (GCA-CE-MGPK) to predict sweet spots in the Songliao Basin. Chen [28] combined Random Forest with multi-head self-attention mechanisms to identify productive blocks. Leem [29,30] integrated data analysis with machine learning to identify the optimal gas production area of gas wells. Huang [31] constructed a grading system by integrating data from logging, nuclear magnetic resonance spectroscopy, geochemical analysis, etc., and generated an adversarial network model to quantitatively identify formation spots, with a fitting accuracy greater than 80%. (3) Physics-Informed AI: Yang [32] developed an NSGA-PINN model (non-dominated sorting genetic algorithm and physics-informed neural network) for fracturing sweet spot identification, which achieved 91.2% accuracy in gas source prediction. In addition, Zhao [33] constructed a quantitative evaluation model for gas well stratified productivity contribution in the Sulige Gas Field using the grey correlation analysis method. Deng [34] established an automatic identification method for lithology based on a self-trained semi-supervised clustering algorithm, and combined it with Kriging interpolation to establish a dessert evaluation method and identify the reservoir gas production areas.
The existing studies primarily evaluated reservoir contributions at either the block scale (which obscures microscale storage space heterogeneity) or the fracturing stage level (which is unable to distinguish between discrete gas systems). For Xujiahe Formation matrix reservoirs—where matrix pores, fractures, and faults all serve as storage and migration pathways—the current methods cannot guide optimal well placement or stimulation design. This study quantifies the individual and combined contributions of matrix pores, fractures, and faults from the perspective of storage space, thereby addressing these limitations. Using Wells Xin 8-5H and Xinsheng 204-1H as case studies, we established full-wellbore fracturing productivity models to delineate the gas sources and dominant production systems and developed single-stage fracturing models for distinct reservoir spaces, which enables parameter optimization and the formulation of differentiated strategies tailored to the matrix, fracture, and fault-dominated zones. By refining productivity assessments at the storage space level, this work reveals the contribution patterns in matrix-type reservoirs, bridges a critical research gap, and provides a theoretical foundation for optimizing fracturing design in Class II and III reservoirs. The findings enhance reserve utilization and well productivity, with broader applications for analogous tight gas reservoirs.

2. Geological Characteristics

The Xinchang–Hexingchang Xu-2 Gas Reservoir is structurally situated on the Xiaoquan–Fenggu north-trending uplift belt within the western Sichuan Depression of the Sichuan Basin, forming part of a normal-temperature, high-pressure system. The reservoir’s lithology primarily consists of lithic sandstone, lithic arkose, feldspathic lithic sandstone, and lithic quartz sandstone. These formations are characterized by fine-to-medium grained, well-sorted, subangular sandstones that exhibit strong compaction-dominated cementation (Figure 1). A petrophysical analysis revealed that the Xu-2 Member possesses an average porosity of 3.7% and matrix permeability of 0.08 mD, classifying it as an ultra-low porosity and permeability tight gas reservoir. Comprehensive petrographic studies employing cast thin sections and SEM imaging (Figure 2) identified two principal reservoir space types: pore and fractures. The pore system is dominated by intragranular and intergranular dissolved pores, with subordinate residual intergranular pores and microfractures, establishing the reservoir as a pore-type to fracture-pore-type system. Thin-section quantification showed a remarkably low filling material content (averaging 6.02%; Table 1), indicating well-developed void spaces that function effectively as both gas storage compartments and migration pathways. Gas-bearing properties are primarily observed in fault-fracture systems formed by large-scale source faults within reservoir sub-members. A preliminary fracture effectiveness evaluation confirmed that north–south trending faults serve as the primary production-controlling structures. These fault zones are enveloped by extensive natural fracture networks, with the highest density observed in the TX22, TX24, and TX25 sand groups, followed by the TX23, TX26, and TX27 intervals. The quantitative fracture aperture distribution is presented in Figure 3. The reservoir also exhibits localized water invasion phenomena, which is attributed to fault system influences and prolonged production in structurally high-position wells.

3. Analysis of Gas Production Sources for Well Xin 8-5H and Well Xin Sheng 204-1H

3.1. Methodology

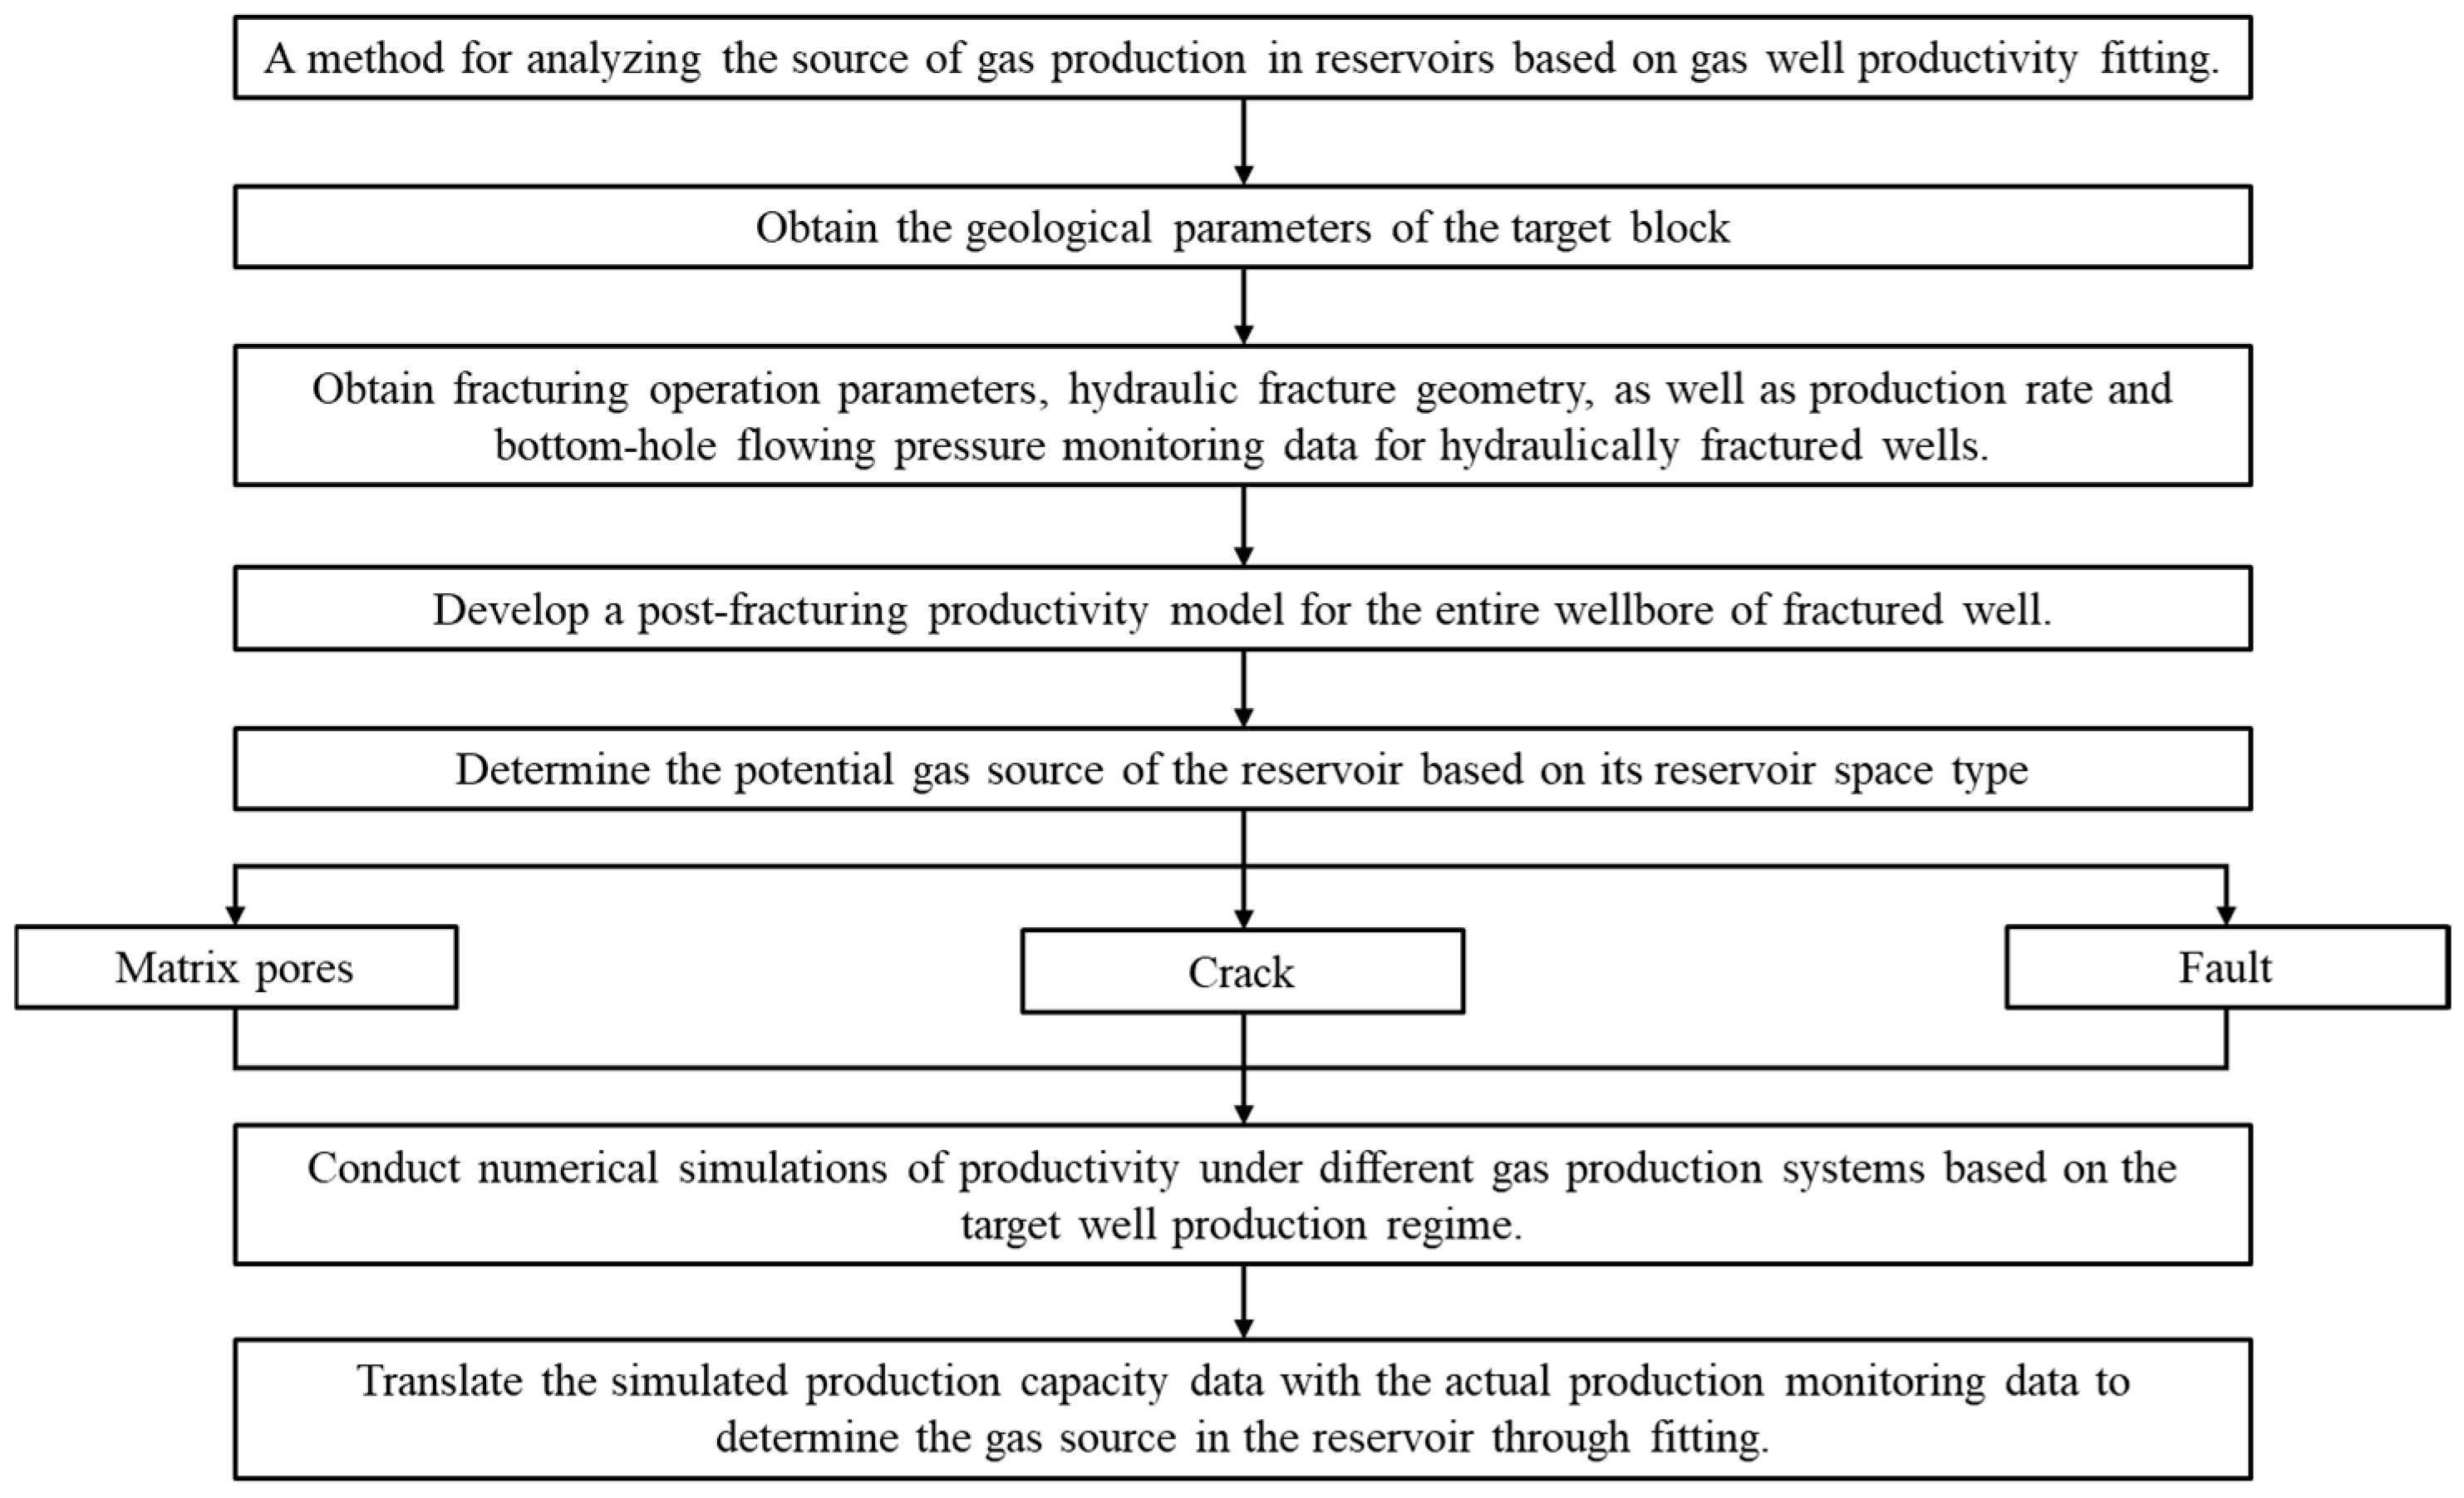
For Type II and III matrix-dominated reservoirs characterized by matrix pores and microfractures as primary storage spaces and by the presence of large-scale effective faults exhibiting favorable gas-bearing properties in reservoir sub-sections, this study developed an analytical methodology (Figure 4) to identify gas production sources through productivity matching analysis. The approach systematically evaluates the relative contributions of matrix pores, microfractures, and fault systems to overall production while assessing the connectivity potential of reservoir microfractures and faults—providing critical insights for optimizing development strategies in these challenging reservoirs.
The methodology involves establishing a post-fracturing productivity model for the complete well section, incorporating both geological parameters from the target reservoir block and operational parameters from the fracturing treatment. The initial identification of potential gas contributors (matrix pores, natural fractures, and fault systems) is based on comprehensive reservoir space characterization. Subsequent productivity simulations are conducted and rigorously matched against actual production monitoring data. The production matching accuracy, quantified as the ratio of simulated to observed production rates, serves as the key metric for determining dominant production mechanisms and their relative contributions.

3.2. Post-Pressure Productivity Model for the Entire Well Section

3.2.1. Mathematical Model of Two-Phase Seepage in Tight Sandstone Fracturing

The mathematical model for gas–water two-phase flow has the following assumptions: (1) three-dimensional gas-water two-phase flow occurs in both the reservoir matrix and fractures, ignoring temperature effects; (2) gas and water phases are real compressible fluids in compressible rock; and (3) finite-conductivity fractures obey Darcy’s law.
The fluid flow in the matrix system follows the mass conservation law. The seepage model includes continuity equations and flow equations for gas/water phases. The continuity equations are as follows [35]:
( ρ g v g ) + q g = ( ρ g Φ s g ) t
( ρ w v w ) + q w = ( ρ w Φ s w ) t
where is the Laplacian operator; ρg and ρw are the gas/liquid phase densities (kg/m3); v g and v w are the gas/liquid phase flow velocity components (m/s); qg and qw are the gas/liquid mass flow rates, (kg/(m3·s)); sg and sw are the gas/liquid saturation (dimensionless); and Φ is the fluid potential (MPa).
During production, reservoir fluids flow into fractures through fracture walls. The flow equations for gas/water phases are as follows:
v g = k mg μ g p mg γ g D
v w = k mw μ w p mw γ w D
where kmg and kmw are the gas/liquid phase permeability in the matrix (mD); μg and μw are the gas/liquid viscosity (mPa·s); pmg and pmw are the gas/liquid pressure in the matrix (MPa); γg and γw are the gravity conversion coefficients (MPa/m); and D is the depth (m).
By combining the continuity equation and motion equation of the gas phase and aqueous phase, respectively, the governing equations for the gas and aqueous phases are obtained:
k mg ρ g μ g ( p mg γ g D ) + q g = ( ρ g Φ s g ) t
k mw ρ w μ w ( p mw γ w D ) + q w = ( ρ w Φ s w ) t
Similarly, in the fracture system, fluid flows from the far-well region to the wellbore under the pressure differential, and the governing equations for the gas and aqueous phases are as follows:
k fg ρ g μ g ( p fg γ g D ) + q g = ( ρ g Φ s g ) t
k fw ρ w μ w ( p fw γ w D ) + q w = ( ρ w Φ s w ) t
where kfg and kfw are the permeability of gas phase and liquid phase in the fracture (mD) and pfg and pfw are the pressure of the gas phase and liquid phase in the fracture (MPa).
Within the reservoir, only the gas and water phases exist in the rock. Therefore, the saturation of the aqueous phase and gas phase satisfies the following relationship:
s w + s g = 1
The gas phase and aqueous phase coexist within the same gas reservoir system, and the influence of capillary forces is ignored. Therefore, the pressures of the gas and aqueous phases are equal, and their respective permeabilities are related to saturation:
p mw = p mg
k mw = k mw ( s w ) , k mg = k mg ( s g )
The production well operates under a constant-pressure production system. Therefore, taking the bottom well flow pressure Pwf as the inner boundary, it can be expressed as
p ( r w , t ) = p wf
The outer boundary of the gas reservoir is a closed boundary with no energy replenishment. Its expression is
p n Γ = 0
The initial formation pressure of the reservoir and the gas–water saturation are taken as the initial conditions of the model:
p ( x , y , z , t ) | t = 0 = p i ( x , y , z ) s w ( x , y , z , t ) | t = 0 = s wi ( x , y , z ) s g ( x , y , z , t ) | t = 0 = s gi ( x , y , z )

3.2.2. Physical Model

Model Establishment
1. Xin 8-5H well.
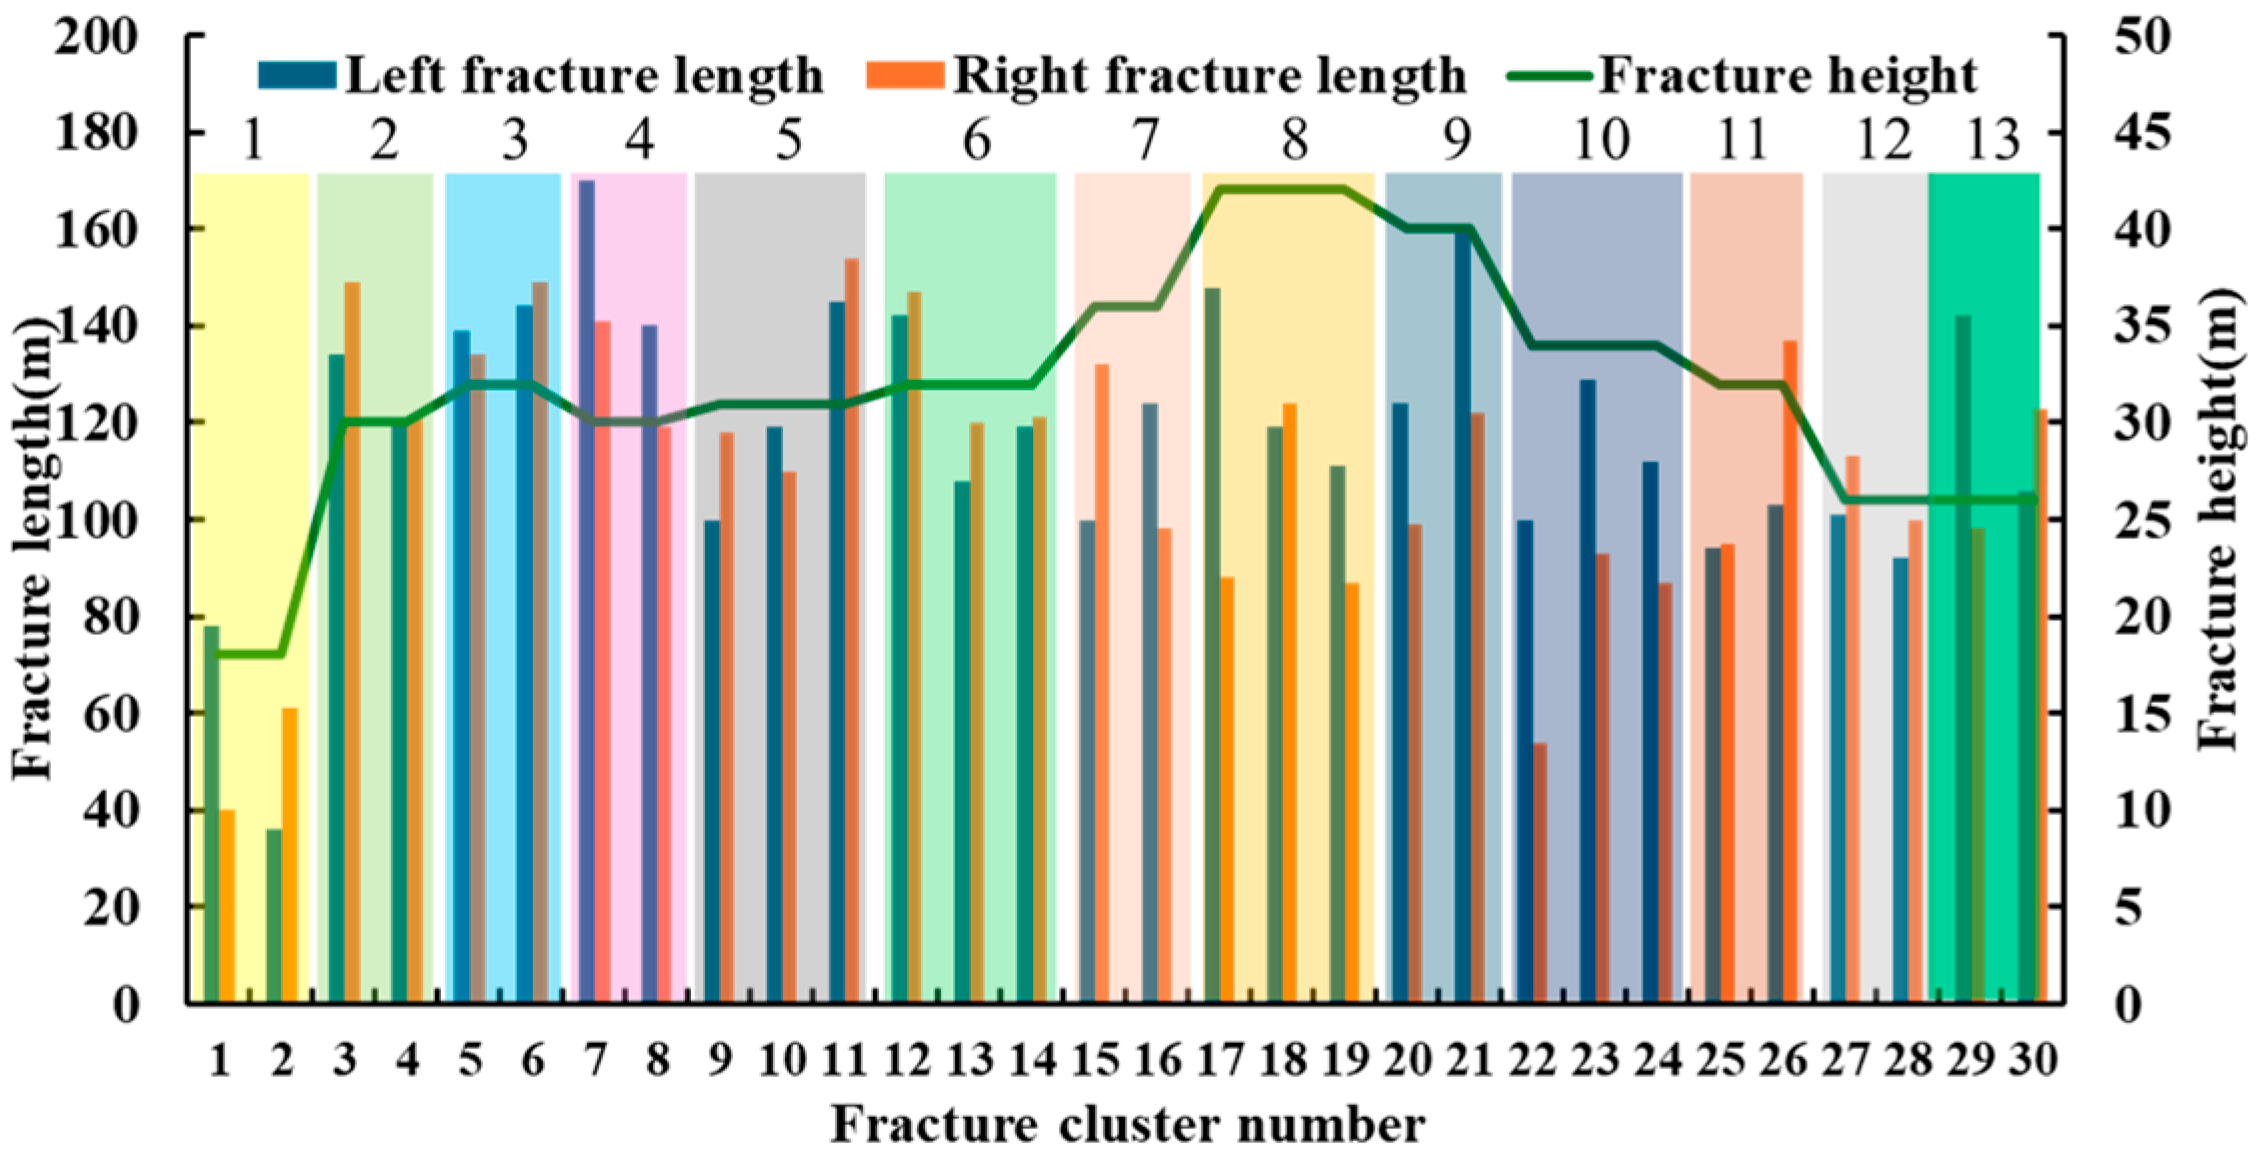
Well Xin 8-5H exhibits a reservoir temperature of 128.46 °C and a static pressure gradient of 0.00119 MPa/m. A petrophysical evaluation revealed a matrix permeability of 0.012 mD, porosity of 3.2%, and water saturation of 31%. During drilling operations, the well encountered the F102 fault at a depth of 5308 m, with significant drilling fluid losses (418.5 m3 total) occurring in the adjacent 5285–5327 m interval. Core analysis from this fault zone demonstrated enhanced permeability (15 mD), confirming the presence of an effective, permeable fault system (Figure 5a). A detailed petrographic analysis through cast thin sections identified localized microfracture development at multiple depths (5036 m, 5136 m, 5186 m, 5136 m, 5386 m, and 5486 m). These fractures predominantly consist of intragranular and trans-granular types (Figure 5b), with core permeability measurements in fracture-rich intervals averaging 3 mD. Due to their discontinuous distribution and complex geometries, natural fracture zones were delineated through integrated log interpretation to better characterize their spatial distribution patterns. The well was completed using horizontal multi-stage fracturing technology across a 765 m lateral section, comprising 13 stages and 30 clusters. Wide-area electromagnetic monitoring provided detailed hydraulic fracture characterization (Figure 6). Using these data, we constructed a comprehensive productivity model (1000 m × 1000 m × 60 m) that incorporates the matrix, fracture, and fault contributions to gas flow (Figure 7). Key reservoir fluid properties, including the gas compression coefficient and viscosity under high-pressure conditions, are presented in Figure 8, while other fundamental model parameters are summarized in Table 2.
2. Xinsheng 204-1H well.
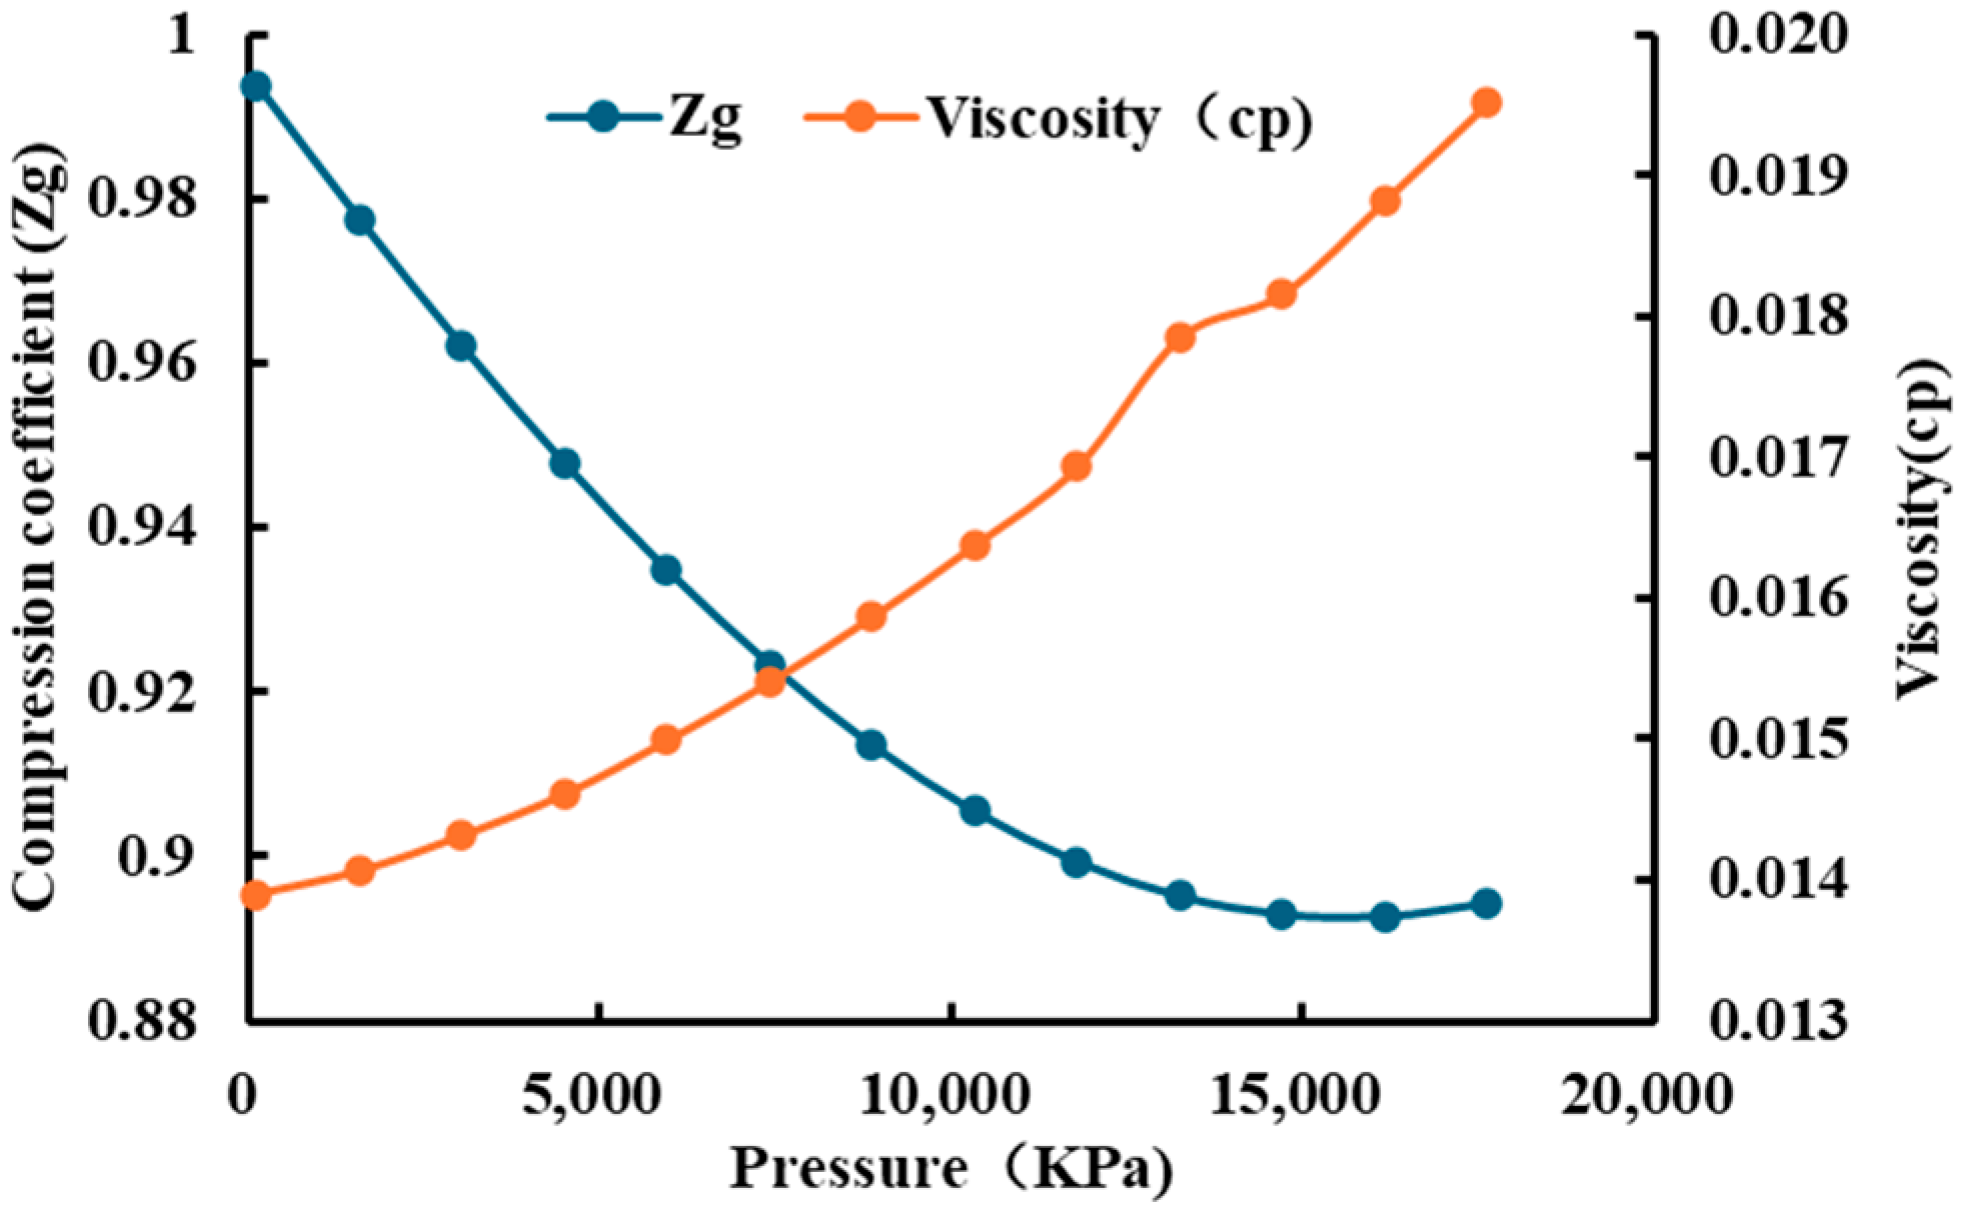
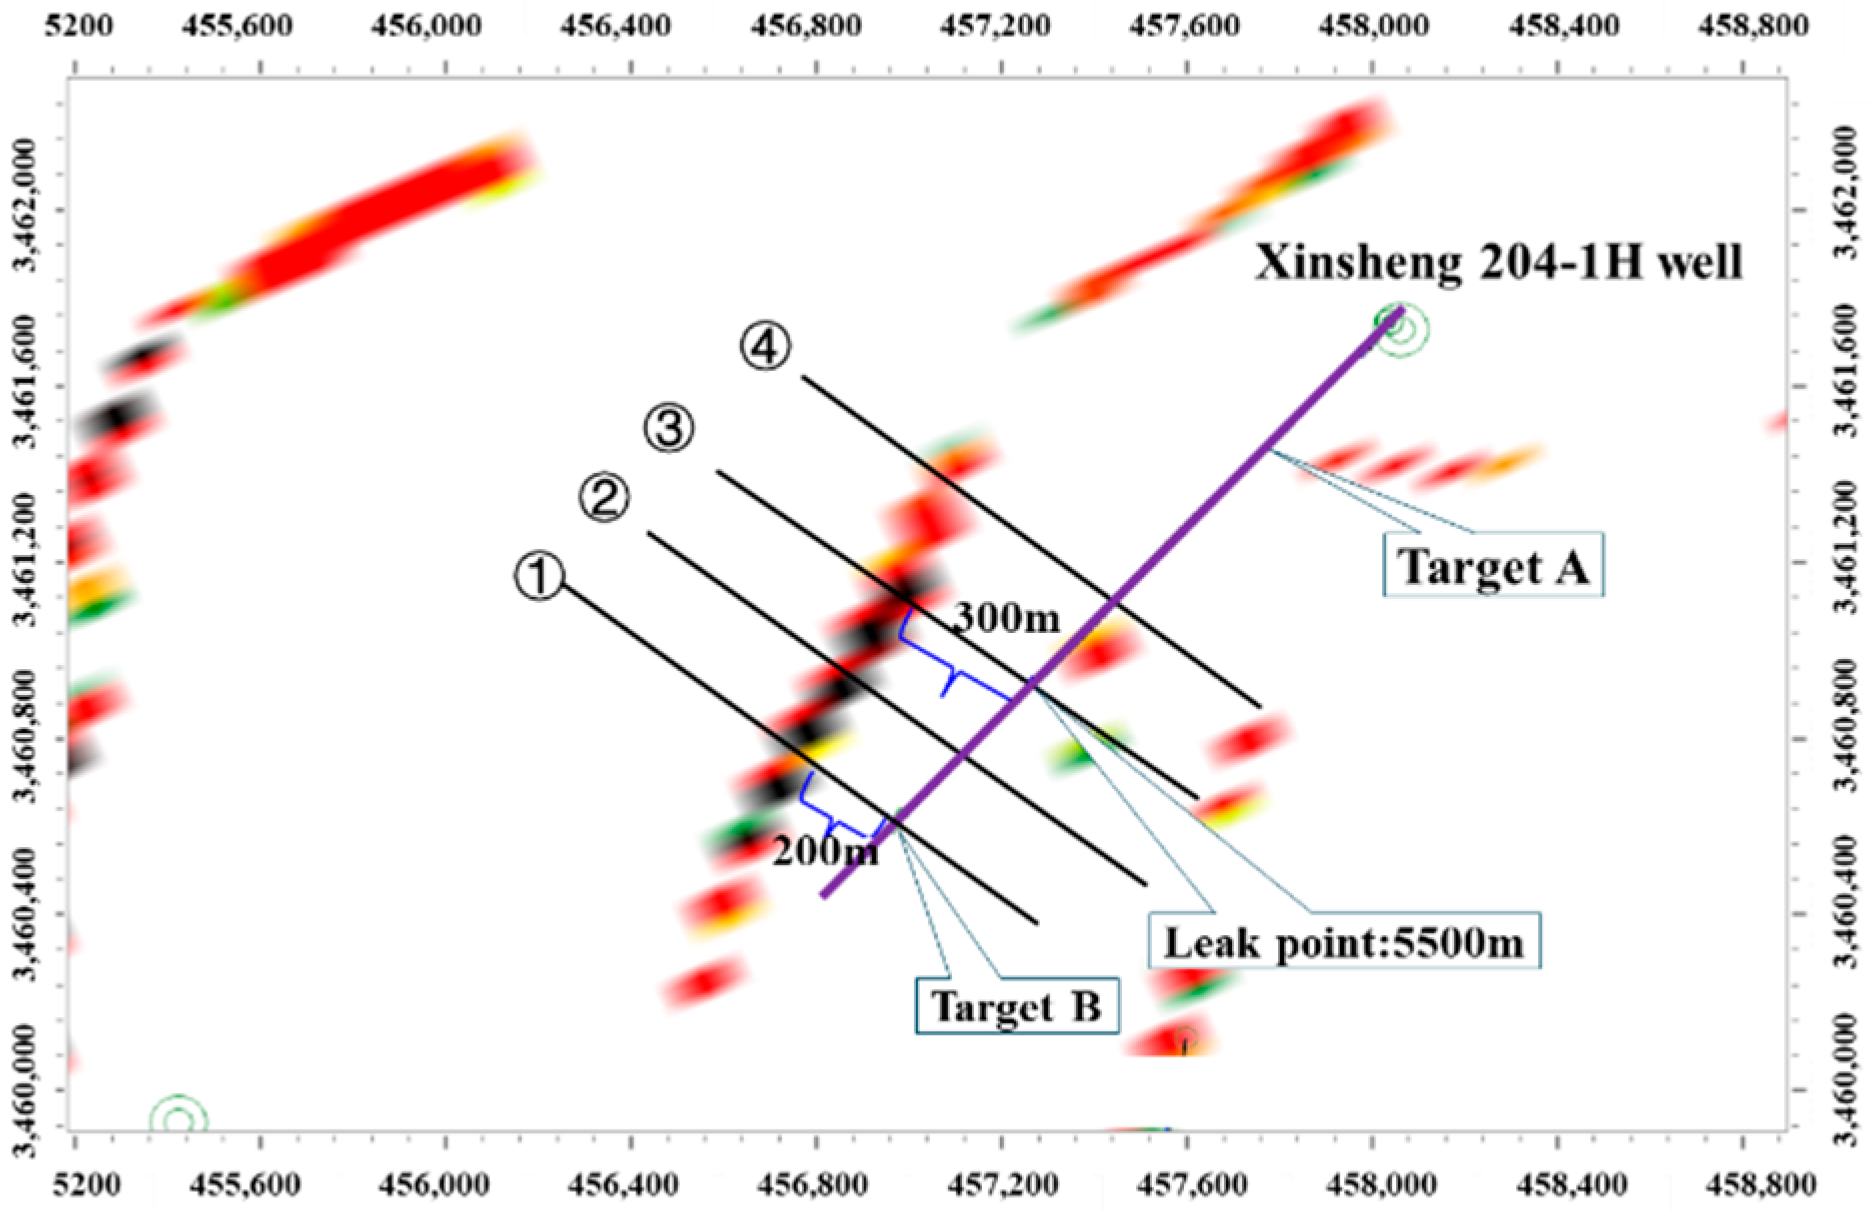
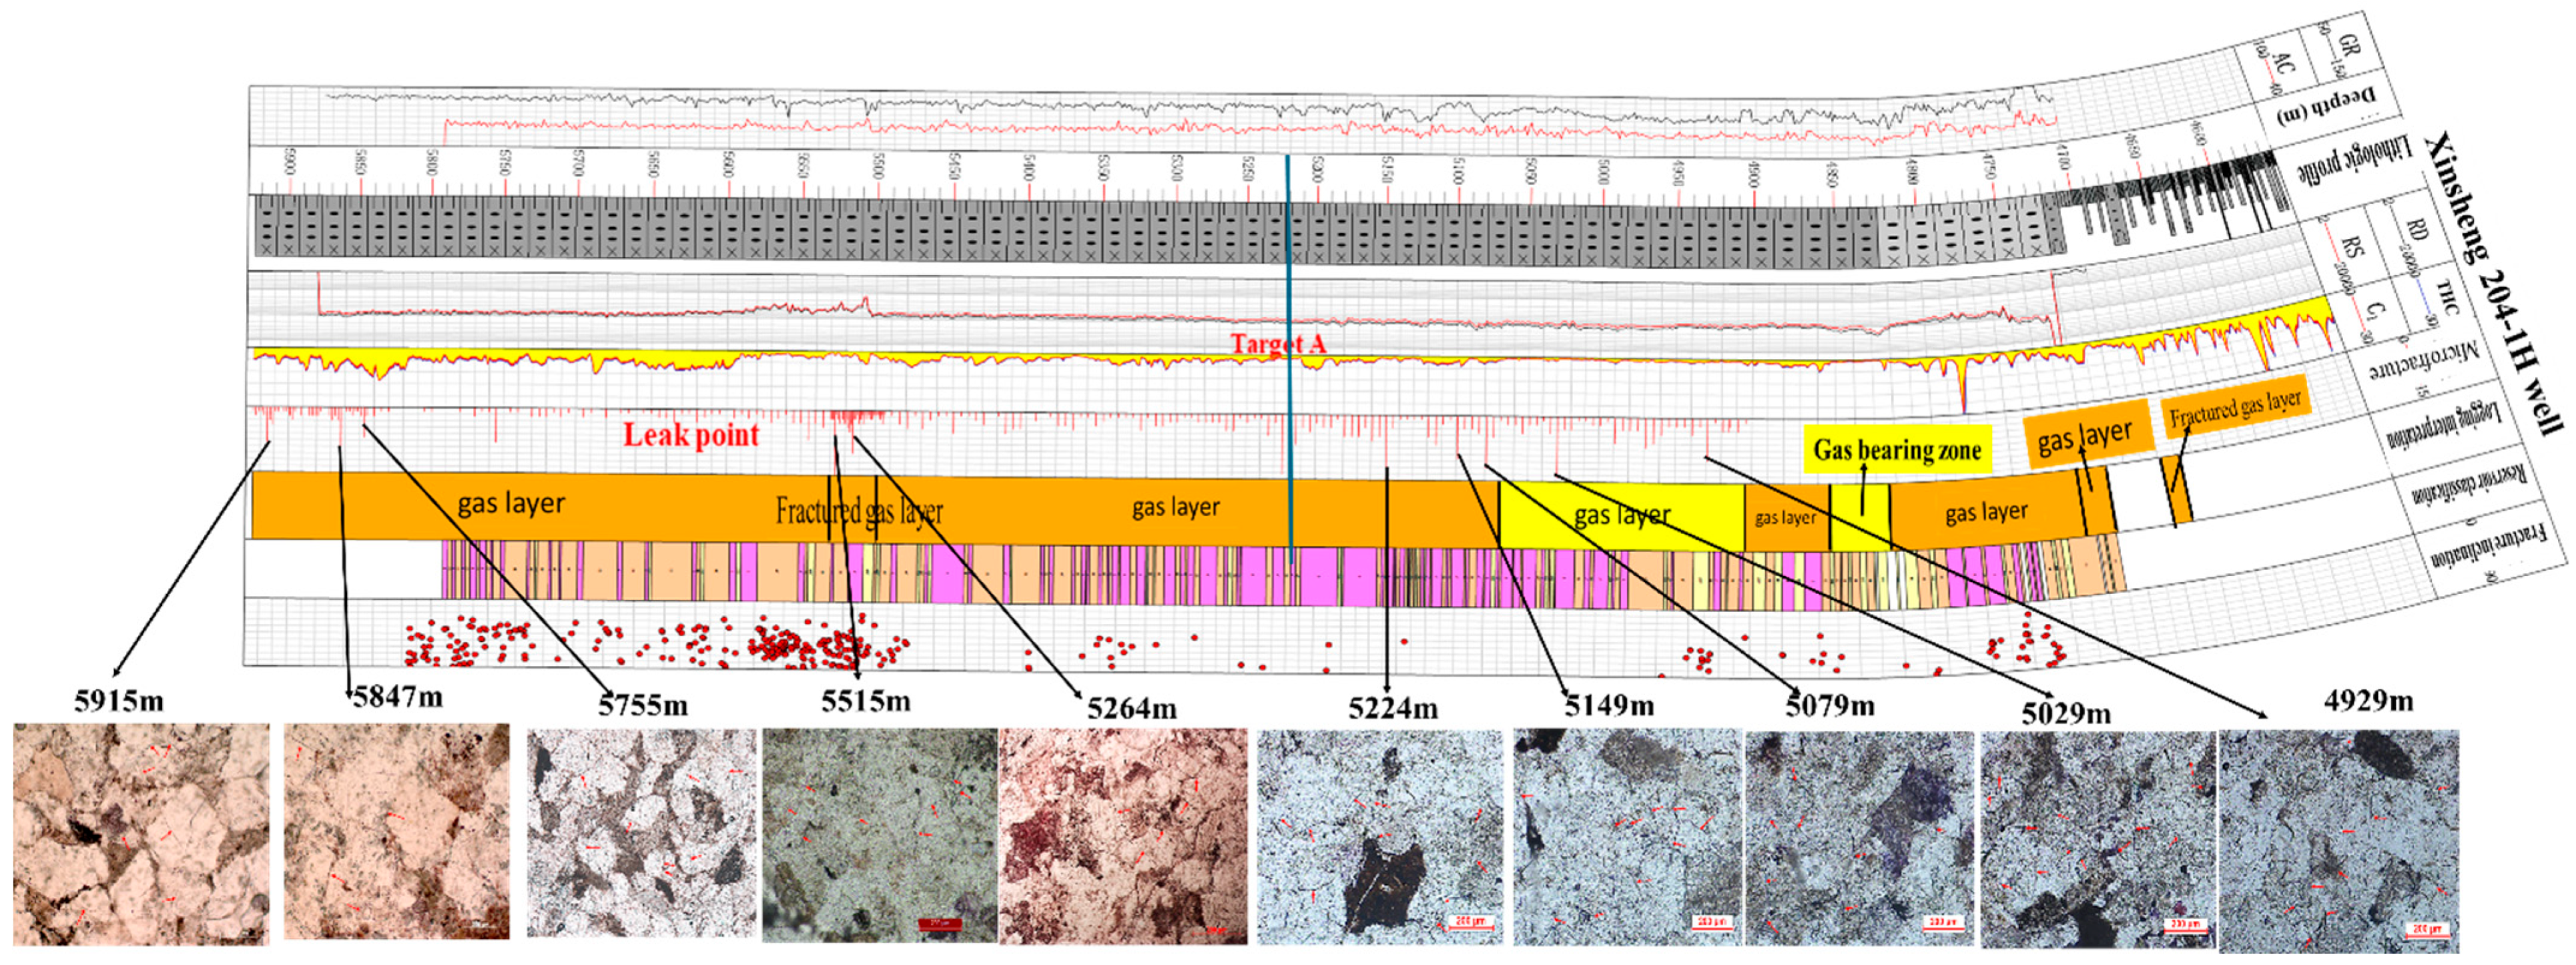
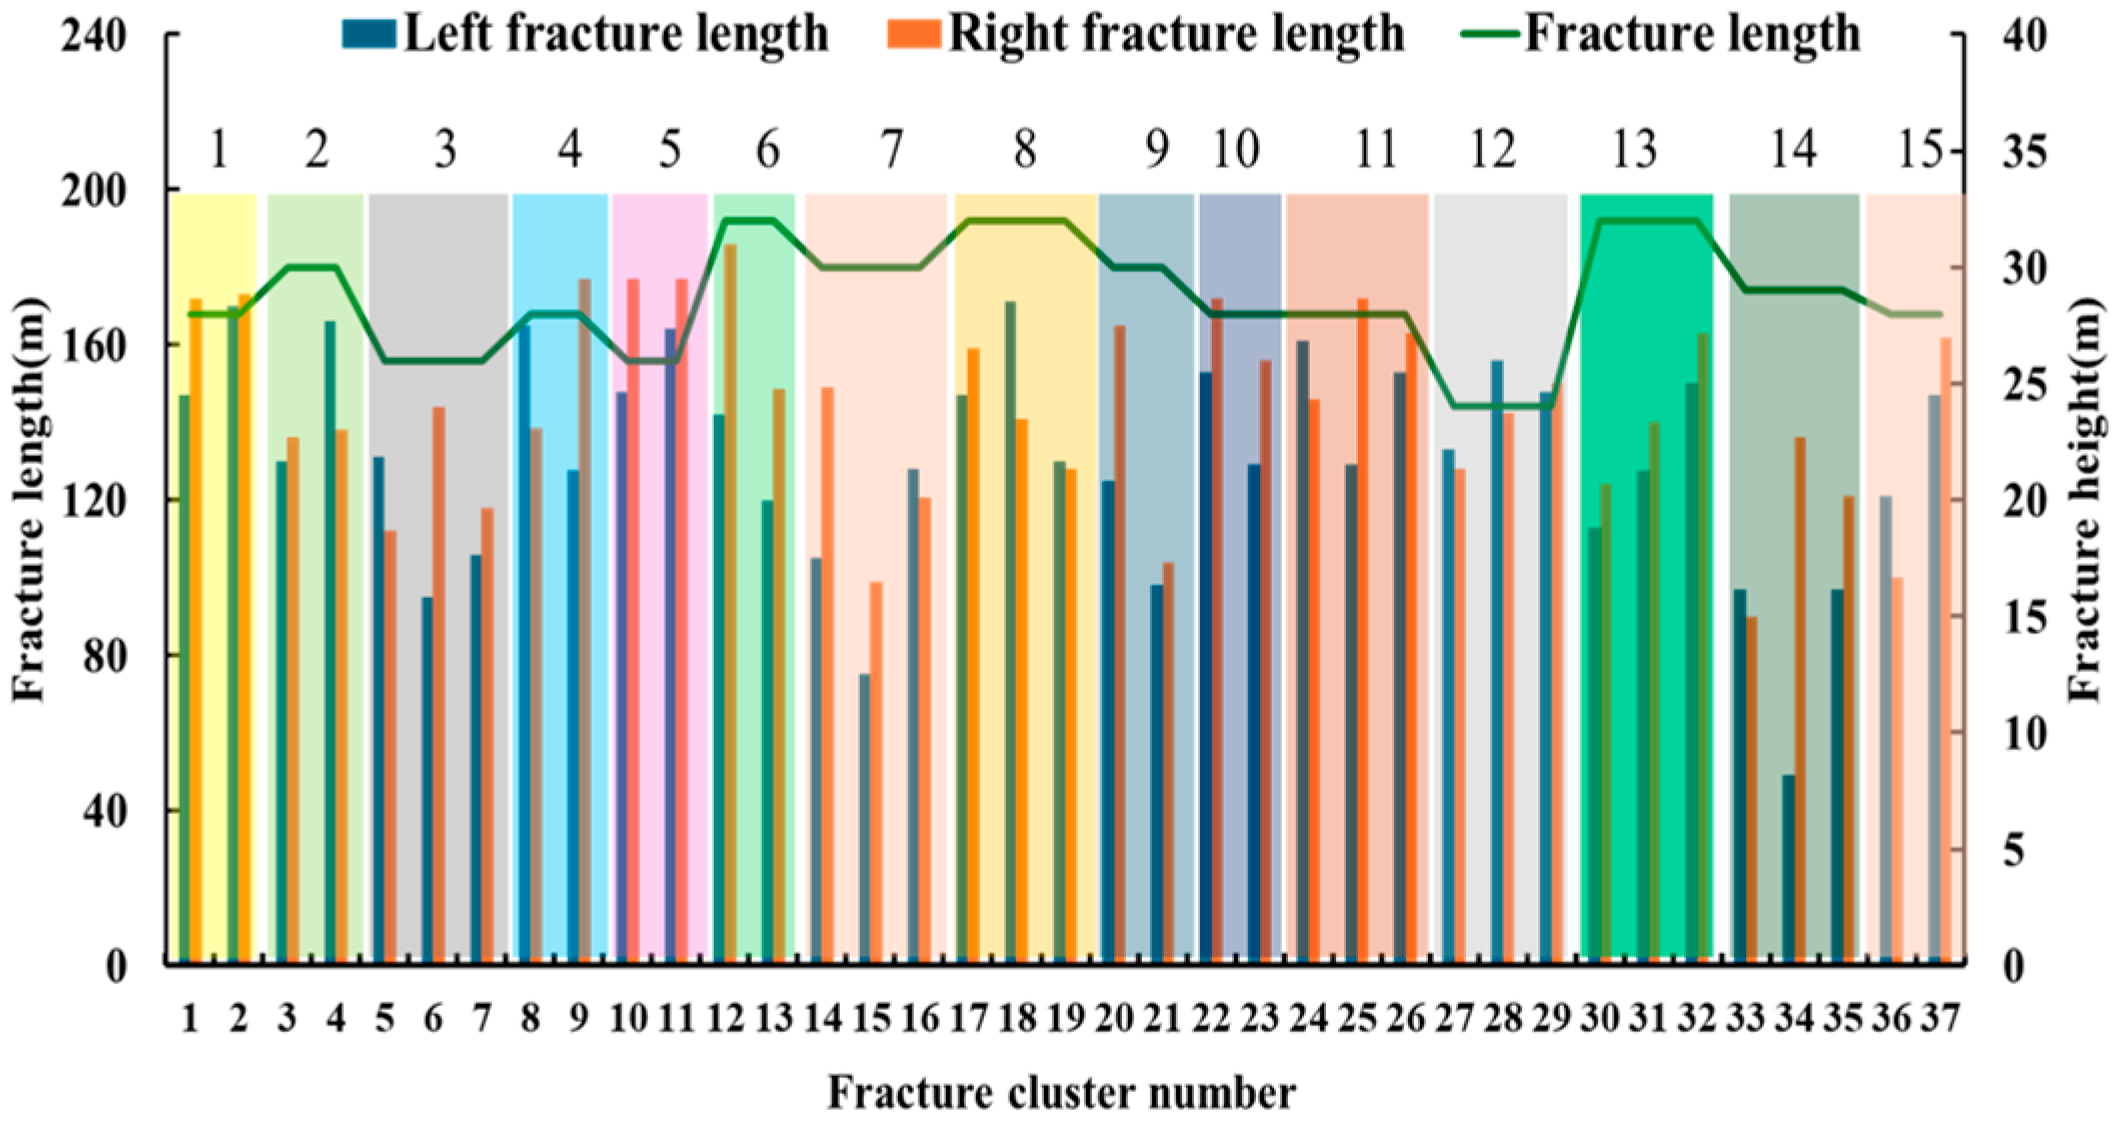
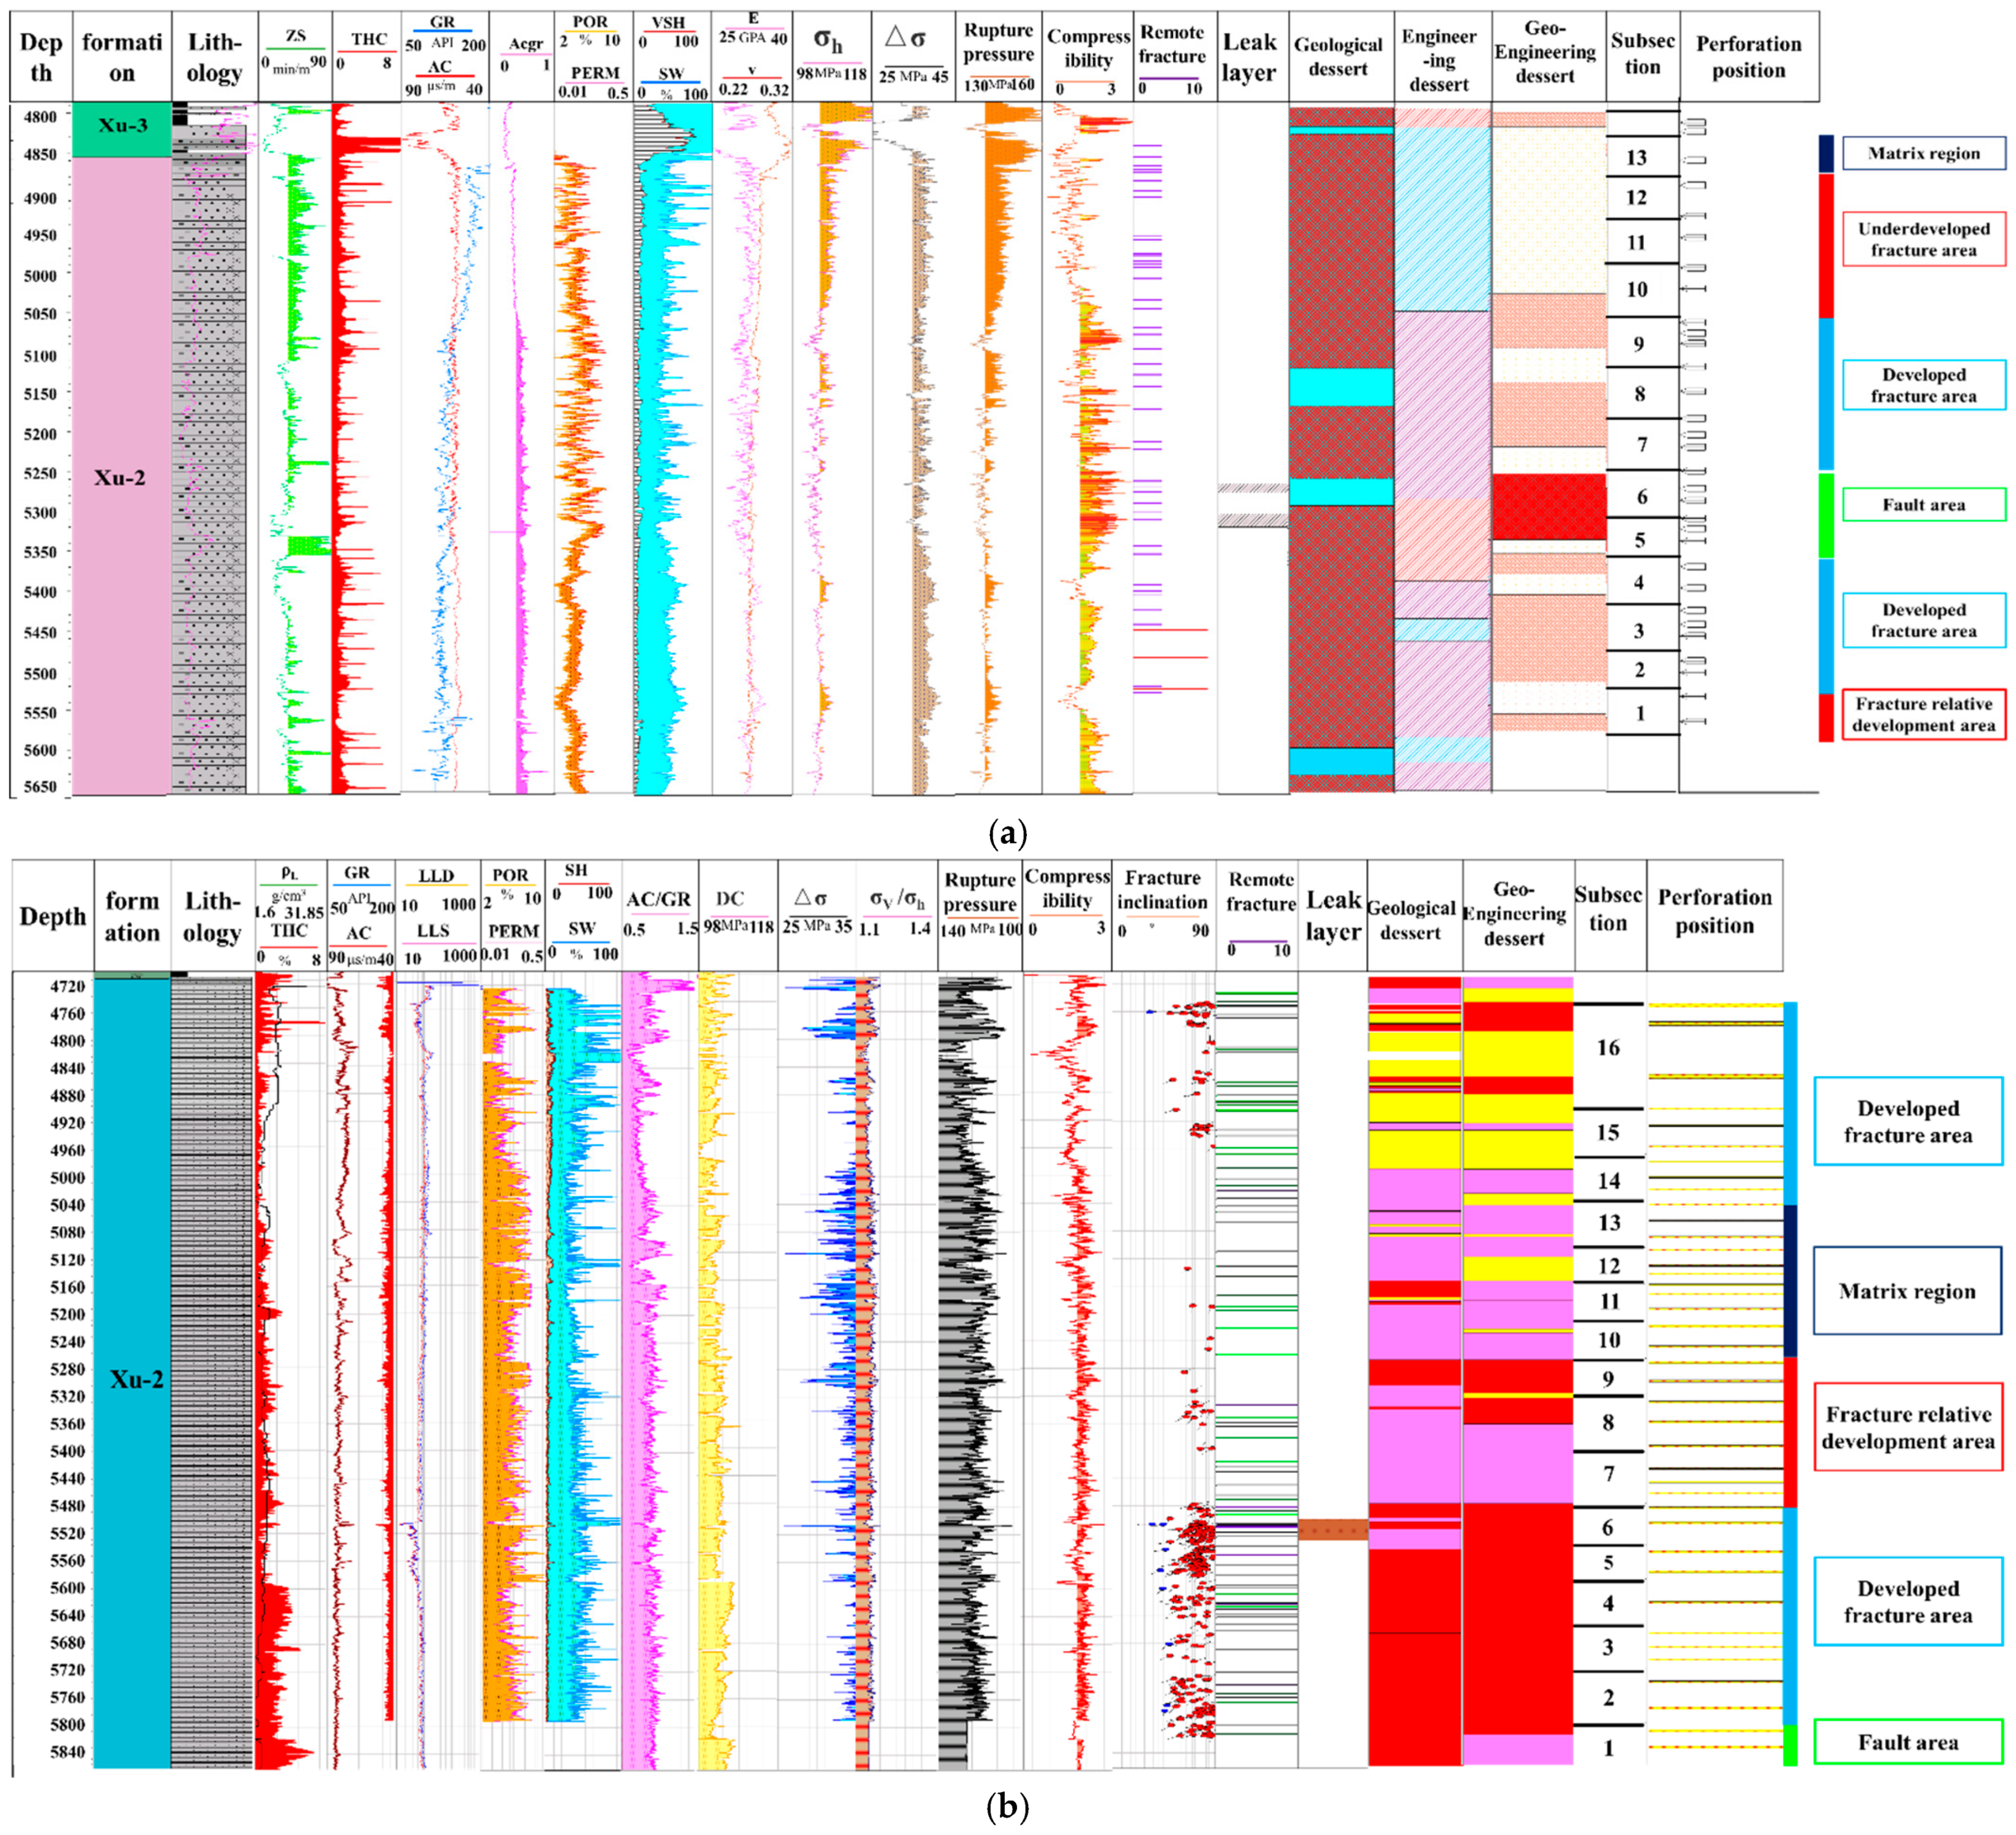
Well Xinsheng 204-1H exhibits a formation temperature of 123 °C and pressure of 75.56 MPa. A petrophysical analysis revealed a matrix permeability of 0.028 mD, porosity of 5.1%, and water saturation of 39%. While no faults were directly encountered in the horizontal section (Figure 9), drilling data indicate the presence of a fault (with a maximum fault distance of approximately 20 m) approximately 200 m from target B. Significant fluid losses (50.7 m3 at 1.2 m3/h) occurred at 5500 m, about 300 m from this fault, suggesting communication with nearby natural fractures or the fault system itself. A core analysis near the fault zone showed enhanced permeability (25 mD), confirming its conductive nature. Electrical imaging logs revealed well-developed fractures in the upper and lower sections, predominantly dipping 36–90° with a NW-SE strike (Figure 10). The integrated thin-section analysis identified extensive microfracture networks, including penetrating and intragranular fractures, which are concentrated in three intervals: 4900–5250 m, 5250–5600 m, and 5600–5925 m (Figure 11). Core permeability measurements in these fracture-rich zones averaged 2.8 mD. Following the approach used for well Xin 8-5H, we established natural fracture zones based on log-identified fracture intervals to characterize their spatial distribution. The 962 m stimulated section was completed with 15 stages and 37 clusters. Wide-area electromagnetic monitoring provided hydraulic fracture characterization (Figure 12). We developed a full-wellbore productivity model (1500 m × 600 m × 60 m) incorporating equivalent fracture zones to represent the concentrated microfracture networks (Figure 13). Key gas properties under the reservoir conditions (compression coefficient and viscosity) are presented in Figure 14, with additional model parameters provided in Table 3.
Grid Independence Verification
The selection of grid dimensions critically influences both the numerical stability of the simulation results and the computational performance. Therefore, we designed a sensitivity analysis on the grid size (as shown in Table 4) and generated the relationship between grid size, annual cumulative production accuracy, and computational time requirements (Figure 15). The results demonstrated an inherent trade-off: while finer grid resolutions (below 5 m × 5 m × 2 m) enhanced solution stability, they imposed disproportionately greater computational costs. Conversely, coarser grids improved the processing speed but compromised the reliability of the results. After comprehensive evaluation, we identified 5 m × 5 m × 2 m as the optimal grid configuration, achieving an effective balance between numerical precision (with stable production forecasts) and computational efficiency. These grid dimensions were consequently implemented as the standard for all subsequent simulations in our study.
Model Verification
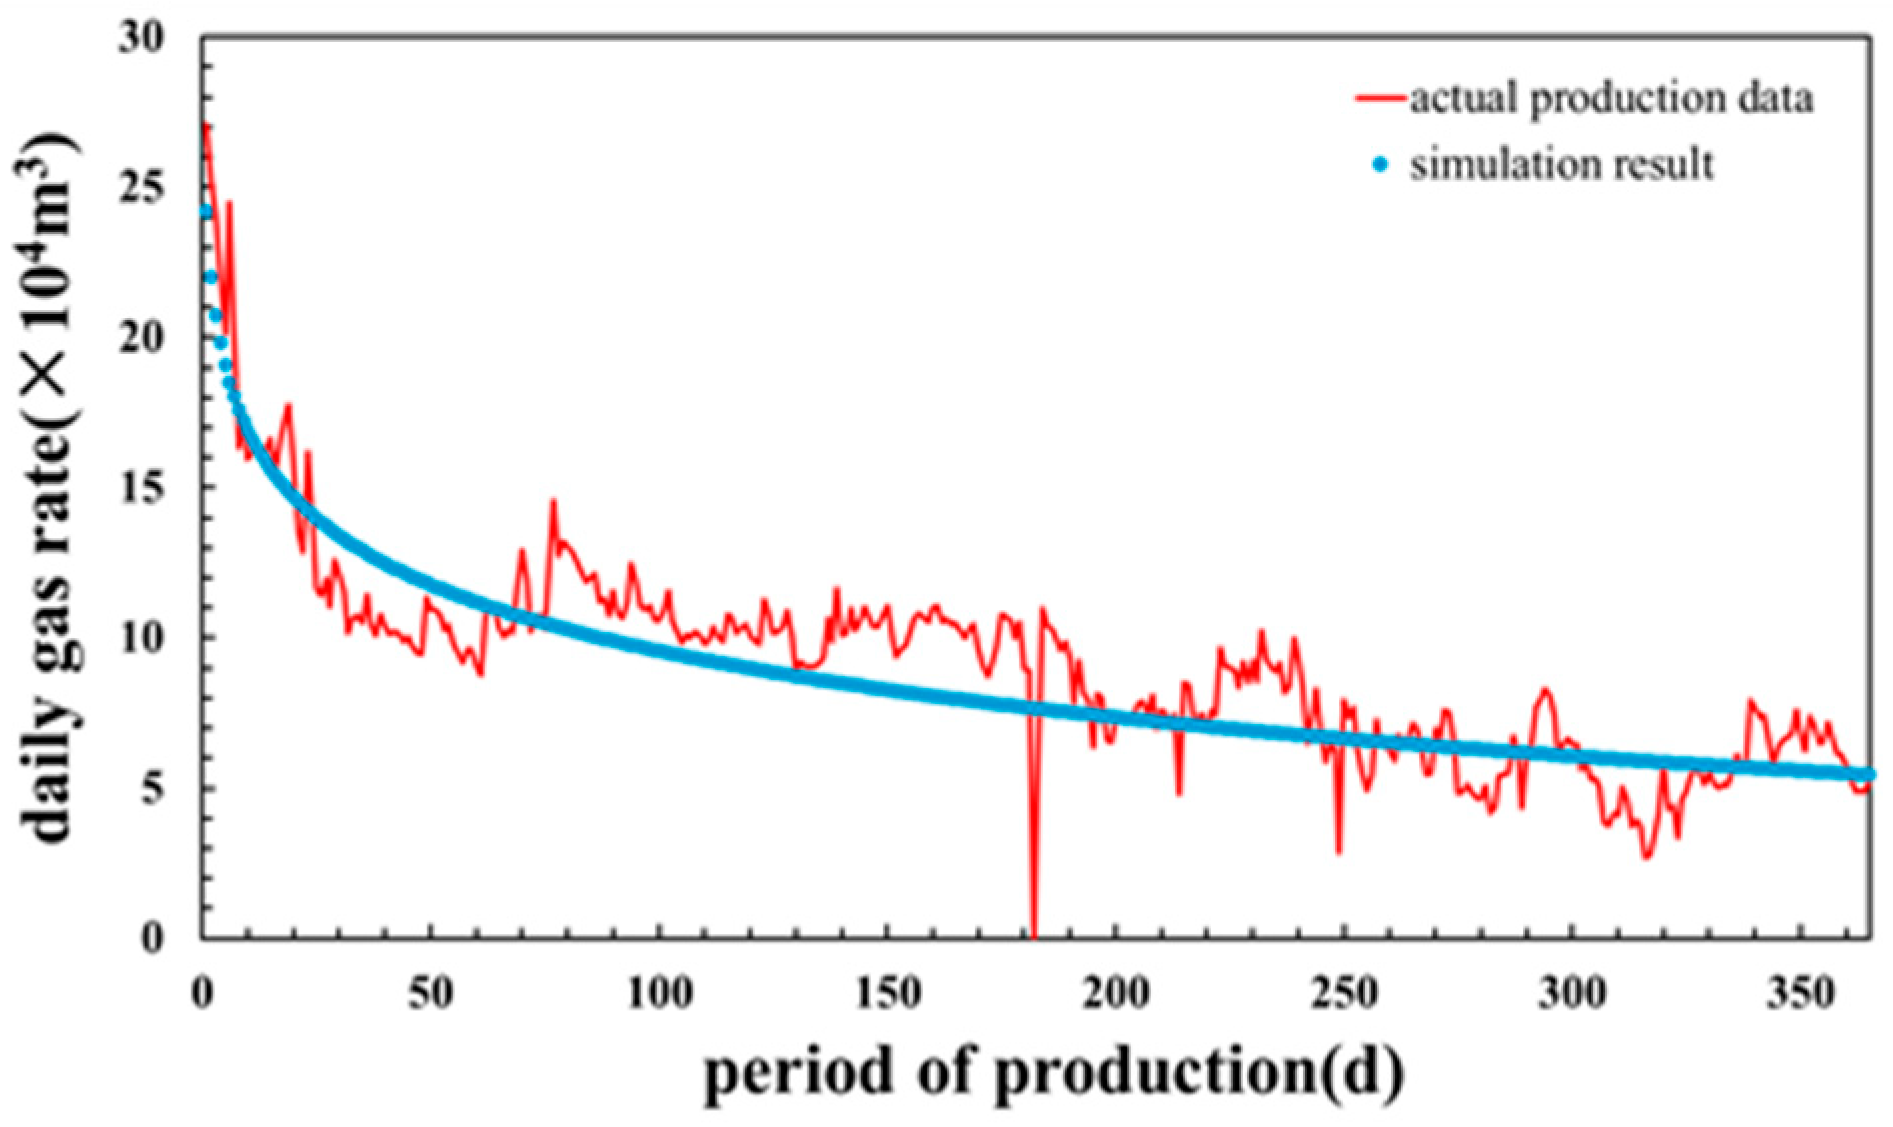
Model verification was conducted using Well J from tight gas Block W as a case study. This horizontal well features a 1360 m lateral section with 16 fracturing stages, each containing 3–4 clusters spaced at 20–25 m intervals. Micro-seismic monitoring data revealed created fracture networks extending 160–430 m laterally and 10-50 m vertically (Figure 16). Log interpretation confirmed the absence of fault intersections along the horizontal trajectory, with the analysis showing minimal natural fracture development in the target formation. Additional reservoir and completion parameters are provided in Table 5. We constructed a full-wellbore fracturing productivity model for Well J and validated its accuracy against actual production data. As demonstrated in Figure 17, the simulated daily production profile shows excellent agreement with field measurements, with only a 5.2% deviation between the modeled and observed values. This close match confirms the reliability and predictive capability of our modeling approach for tight gas reservoirs.

3.3. Production Matching Result

3.3.1. Xin 8-5H Well

Well X8-5H targets a low-porosity, low-permeability reservoir with localized fracture development. The drilling process intersected a large-scale fault, suggesting three potential gas sources: matrix pores, localized microfractures, and the fault. To quantify the contribution of each source to the well productivity, we conducted numerical simulations of various gas supply systems and compared the results with actual production data, as shown in Figure 18.
The simulation results revealed distinct productivity contributions for the different gas sources. When only considering the matrix pore contribution (Figure 18a), the production matching rate was low (26–47%), with pressure propagation primarily confined to hydraulic fracture regions. Notably, fractures 6~9 and 15~22 exhibited pronounced pressure interference due to their close cluster spacing (purple ellipse in Figure 18(a2)). Simulations of the natural fracture and fault contributions (Figure 18b–d) showed limited pressure propagation near perforation zones. The fault’s non-intersection with perforation zones resulted in minimal gas contribution (2–6% matching rate), while natural fractures intersecting perforations demonstrated slightly better performance (7–10% matching rate), with pressure propagation concentrated around these intersections (Figure 18(b2)).
The introduction of hydraulic fractures significantly altered the production dynamics (Figure 18e–g). Connecting fracture zones through hydraulic fracturing expanded the pressure propagation range and enhances inter-fracture communication (green area in Figure 18(e2)), improving the production matching rates to 39–81%. However, this remained insufficient to explain the actual production levels. Fault connection proved more impactful, achieving 85–102% matching rates (Figure 18f), indicating its substantial contribution during reservoir stimulation. The combined simulation of fracture and fault connections yielded the optimal results (98–105% matching rates, Figure 18g), confirming that the fault dominated the production mechanism.

3.3.2. Xinsheng 204-1H Well

The Xinsheng 204-1H well targets a reservoir with relatively developed fracture networks in its upper and lower sections. Although no faults were intersected during drilling operations, subsequent analysis identified a new fault proximal to target B. This geological setting suggests three potential gas sources: matrix pores, microfracture zones, and the newly identified fault system. To quantify their respective contributions to the well productivity, we conducted numerical simulations and compared the results with actual production data (Figure 19).
The simulation results demonstrated distinct production contributions for the different gas sources. When only considering the matrix pore contribution (Figure 19a), the model achieved a production matching rate of 60–75%, indicating reasonable agreement with actual production. The pressure distribution revealed interconnected flow between certain fracture networks. Simulation of the fracture zone contribution alone (Figure 19b) showed active production only from the lower fracture zone within the perforated interval, resulting in a 38–50% matching rate, with the upper fracture zone near target A remaining inactive. The fault contribution simulations (Figure 19c) yielded negligible production due to the fault’s 200 m offset from target B and a lack of direct wellbore intersection. The combined fracture–fault simulation (Figure 19d) produced results similar to the fracture-only scenarios, confirming the fault’s minimal contribution under the current conditions.
Further simulations evaluated production enhancement through hydraulic fracture stimulation. The matrix–fault combined simulation (Figure 19f) showed production characteristics similar to matrix-only scenarios, indicating unsuccessful fault connection during stimulation. However, matrix–fracture zone simulations (Figure 19e,g) demonstrated effective development of high-permeability zones near the wellbore, achieving several key outcomes: a significant pressure propagation increase in the lower well section; effective connection of upper natural fracture zones (purple areas in Figure 19e,g); and production matching rates of 97–103%, closely aligning with the actual performance. This analysis demonstrated that well Xinsheng 204-1H’s production is predominantly supplied through matrix pores and connected natural fracture networks, with minimal contribution from the nearby fault system. The findings highlight the importance of fracture zone connectivity in achieving optimal production from this reservoir type.

4. Analysis of Influencing Factors of Productivity

4.1. Physical Model of Post-Fracturing Productivity for a Single Fracturing Section

Wells Xin 8-5H and Xinsheng 204-1H share fundamental geological characteristics, including low porosity, low permeability, and generally underdeveloped fracture systems with localized micro-fractures and associated faults. However, there are distinct differences in their fracture distribution patterns. Well Xin 8-5H intersected scattered natural fractures while drilling through a fault zone, whereas well Xinsheng 204-1H, though not encountering any faults, exhibited concentrated micro-fracture development at both the upper and lower sections of the wellbore.
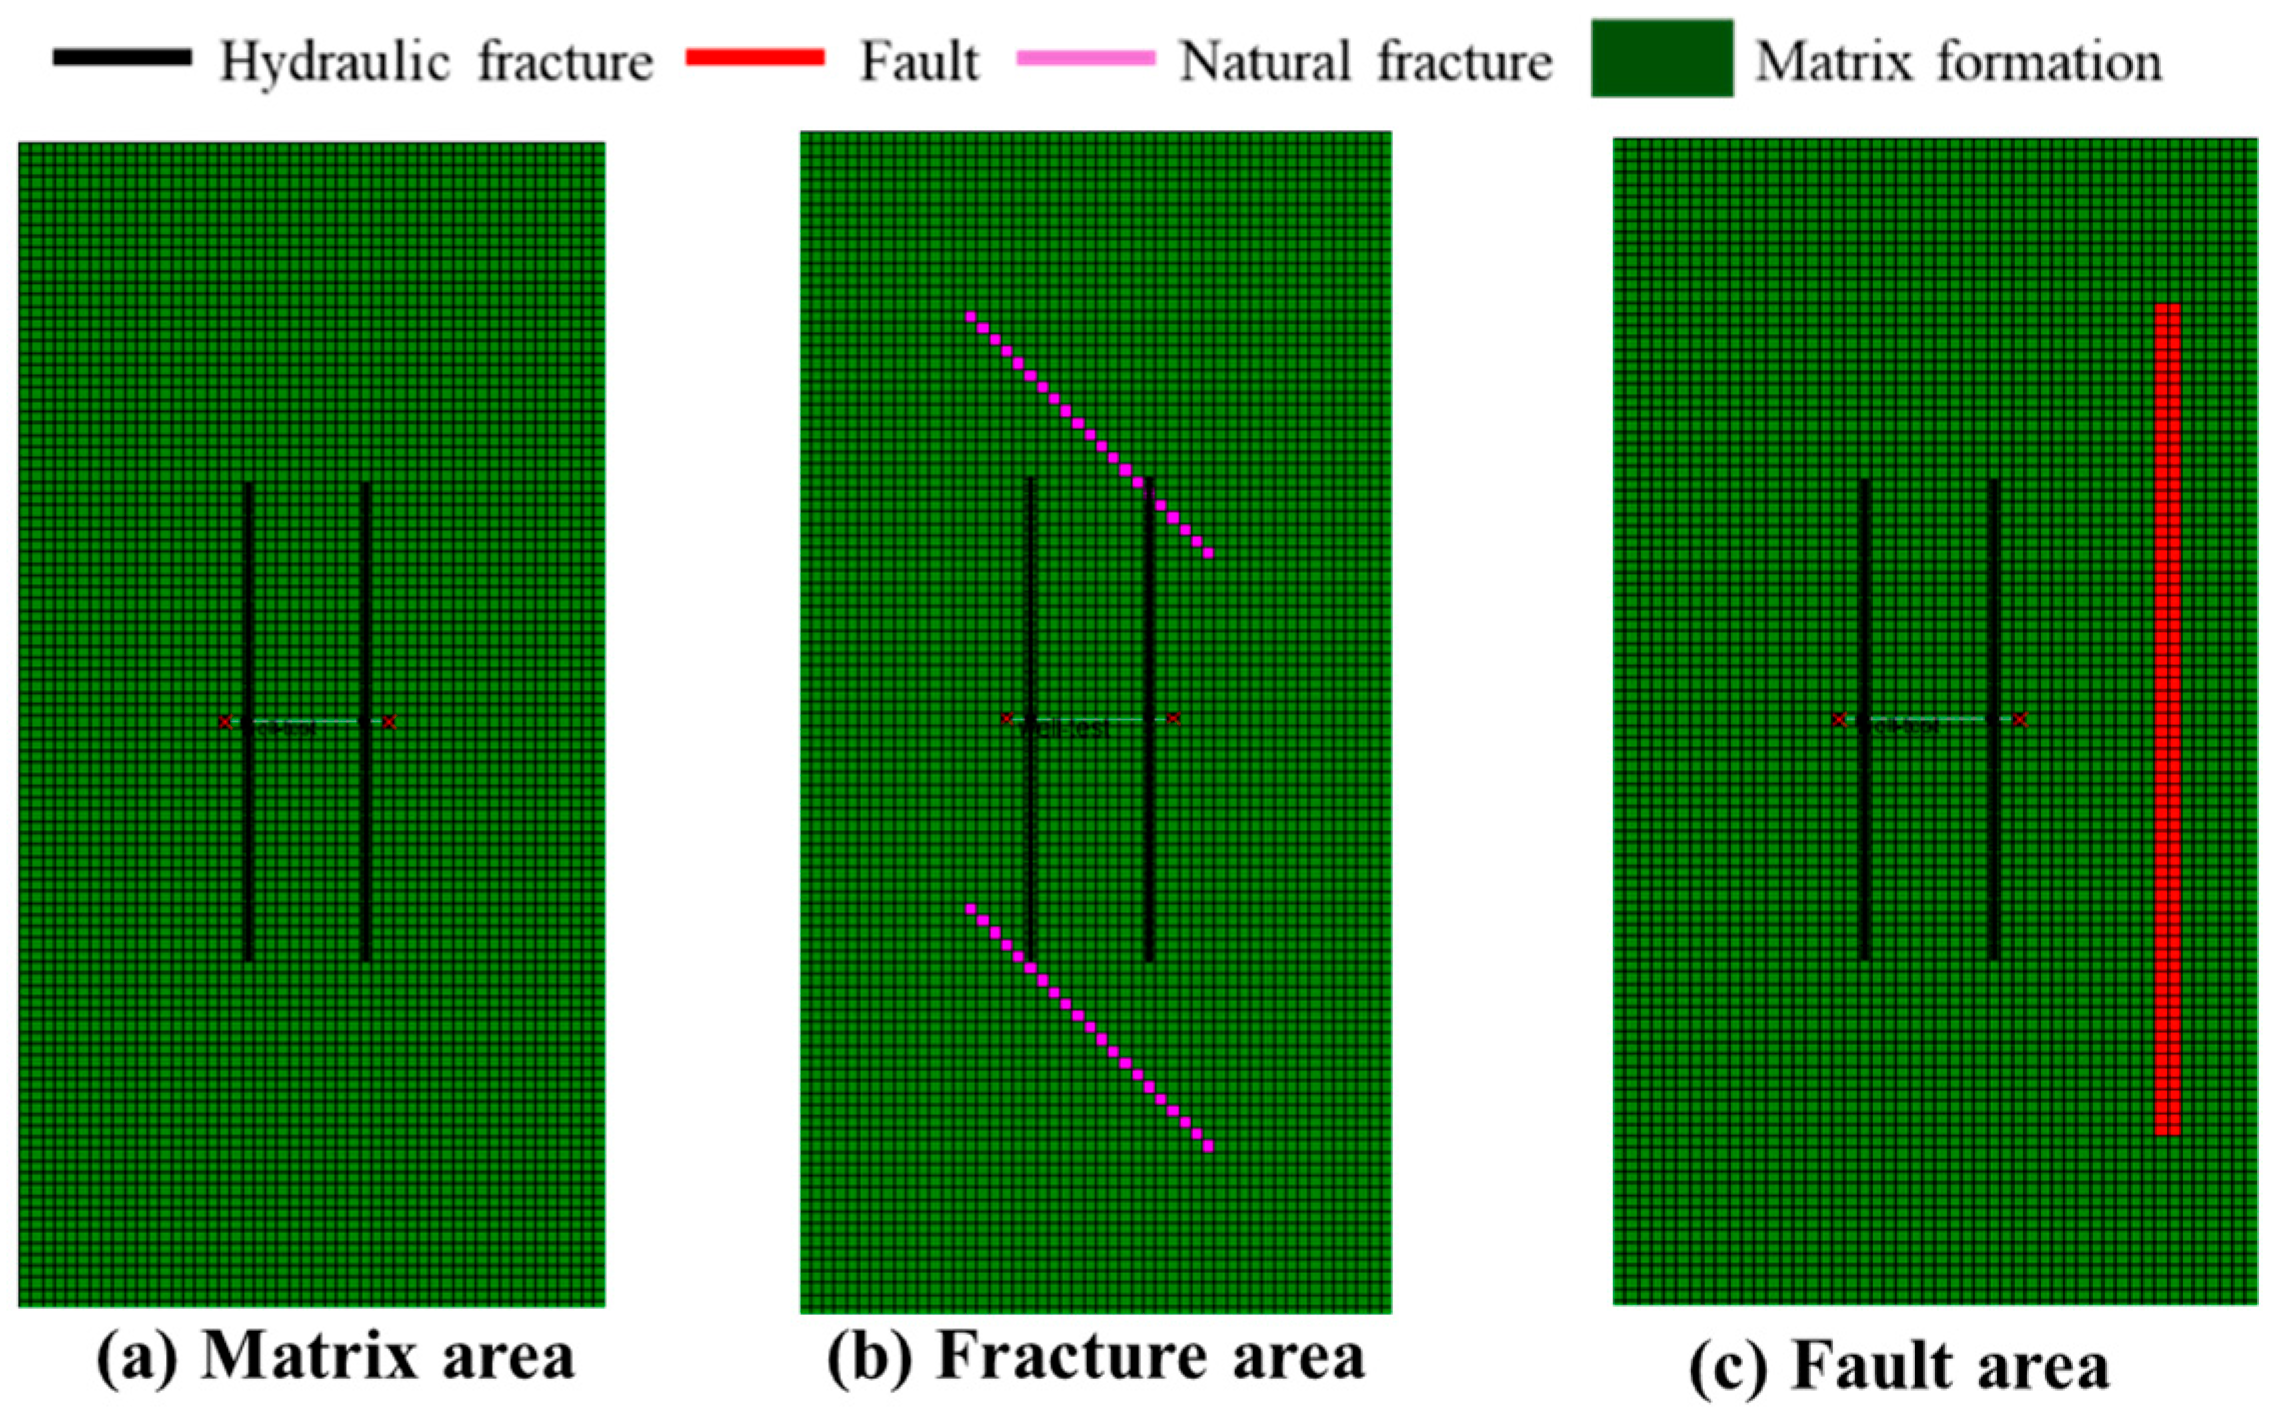
These geological variations necessitated customized fracturing designs for each well. We implemented a differentiated stimulation approach, categorizing fracturing stages into three distinct types (matrix area, micro-fracture area, and fault area) and further classified them into five levels of stimulation intensity for targeted reservoir stimulation (Figure 20). The previous analysis revealed differences in gas production sources between wells Xin 8-5H and Xinsheng 204-1H. To systematically evaluate the productivity-influencing factors across various fracturing stages and inform development strategies for matrix-type reservoirs, we constructed specialized single-stage productivity models. These models, illustrated in Figure 21, were developed according to the unique geological characteristics of the matrix zones, fracture zones, and fault zones, with the corresponding parameters detailed in Table 6. Building upon our earlier model validation work, we omitted redundant verification procedures for this specific analysis phase.

4.2. Simulation Result

4.2.1. Factors Influencing Productivity in the Matrix Area

Cluster Spacing
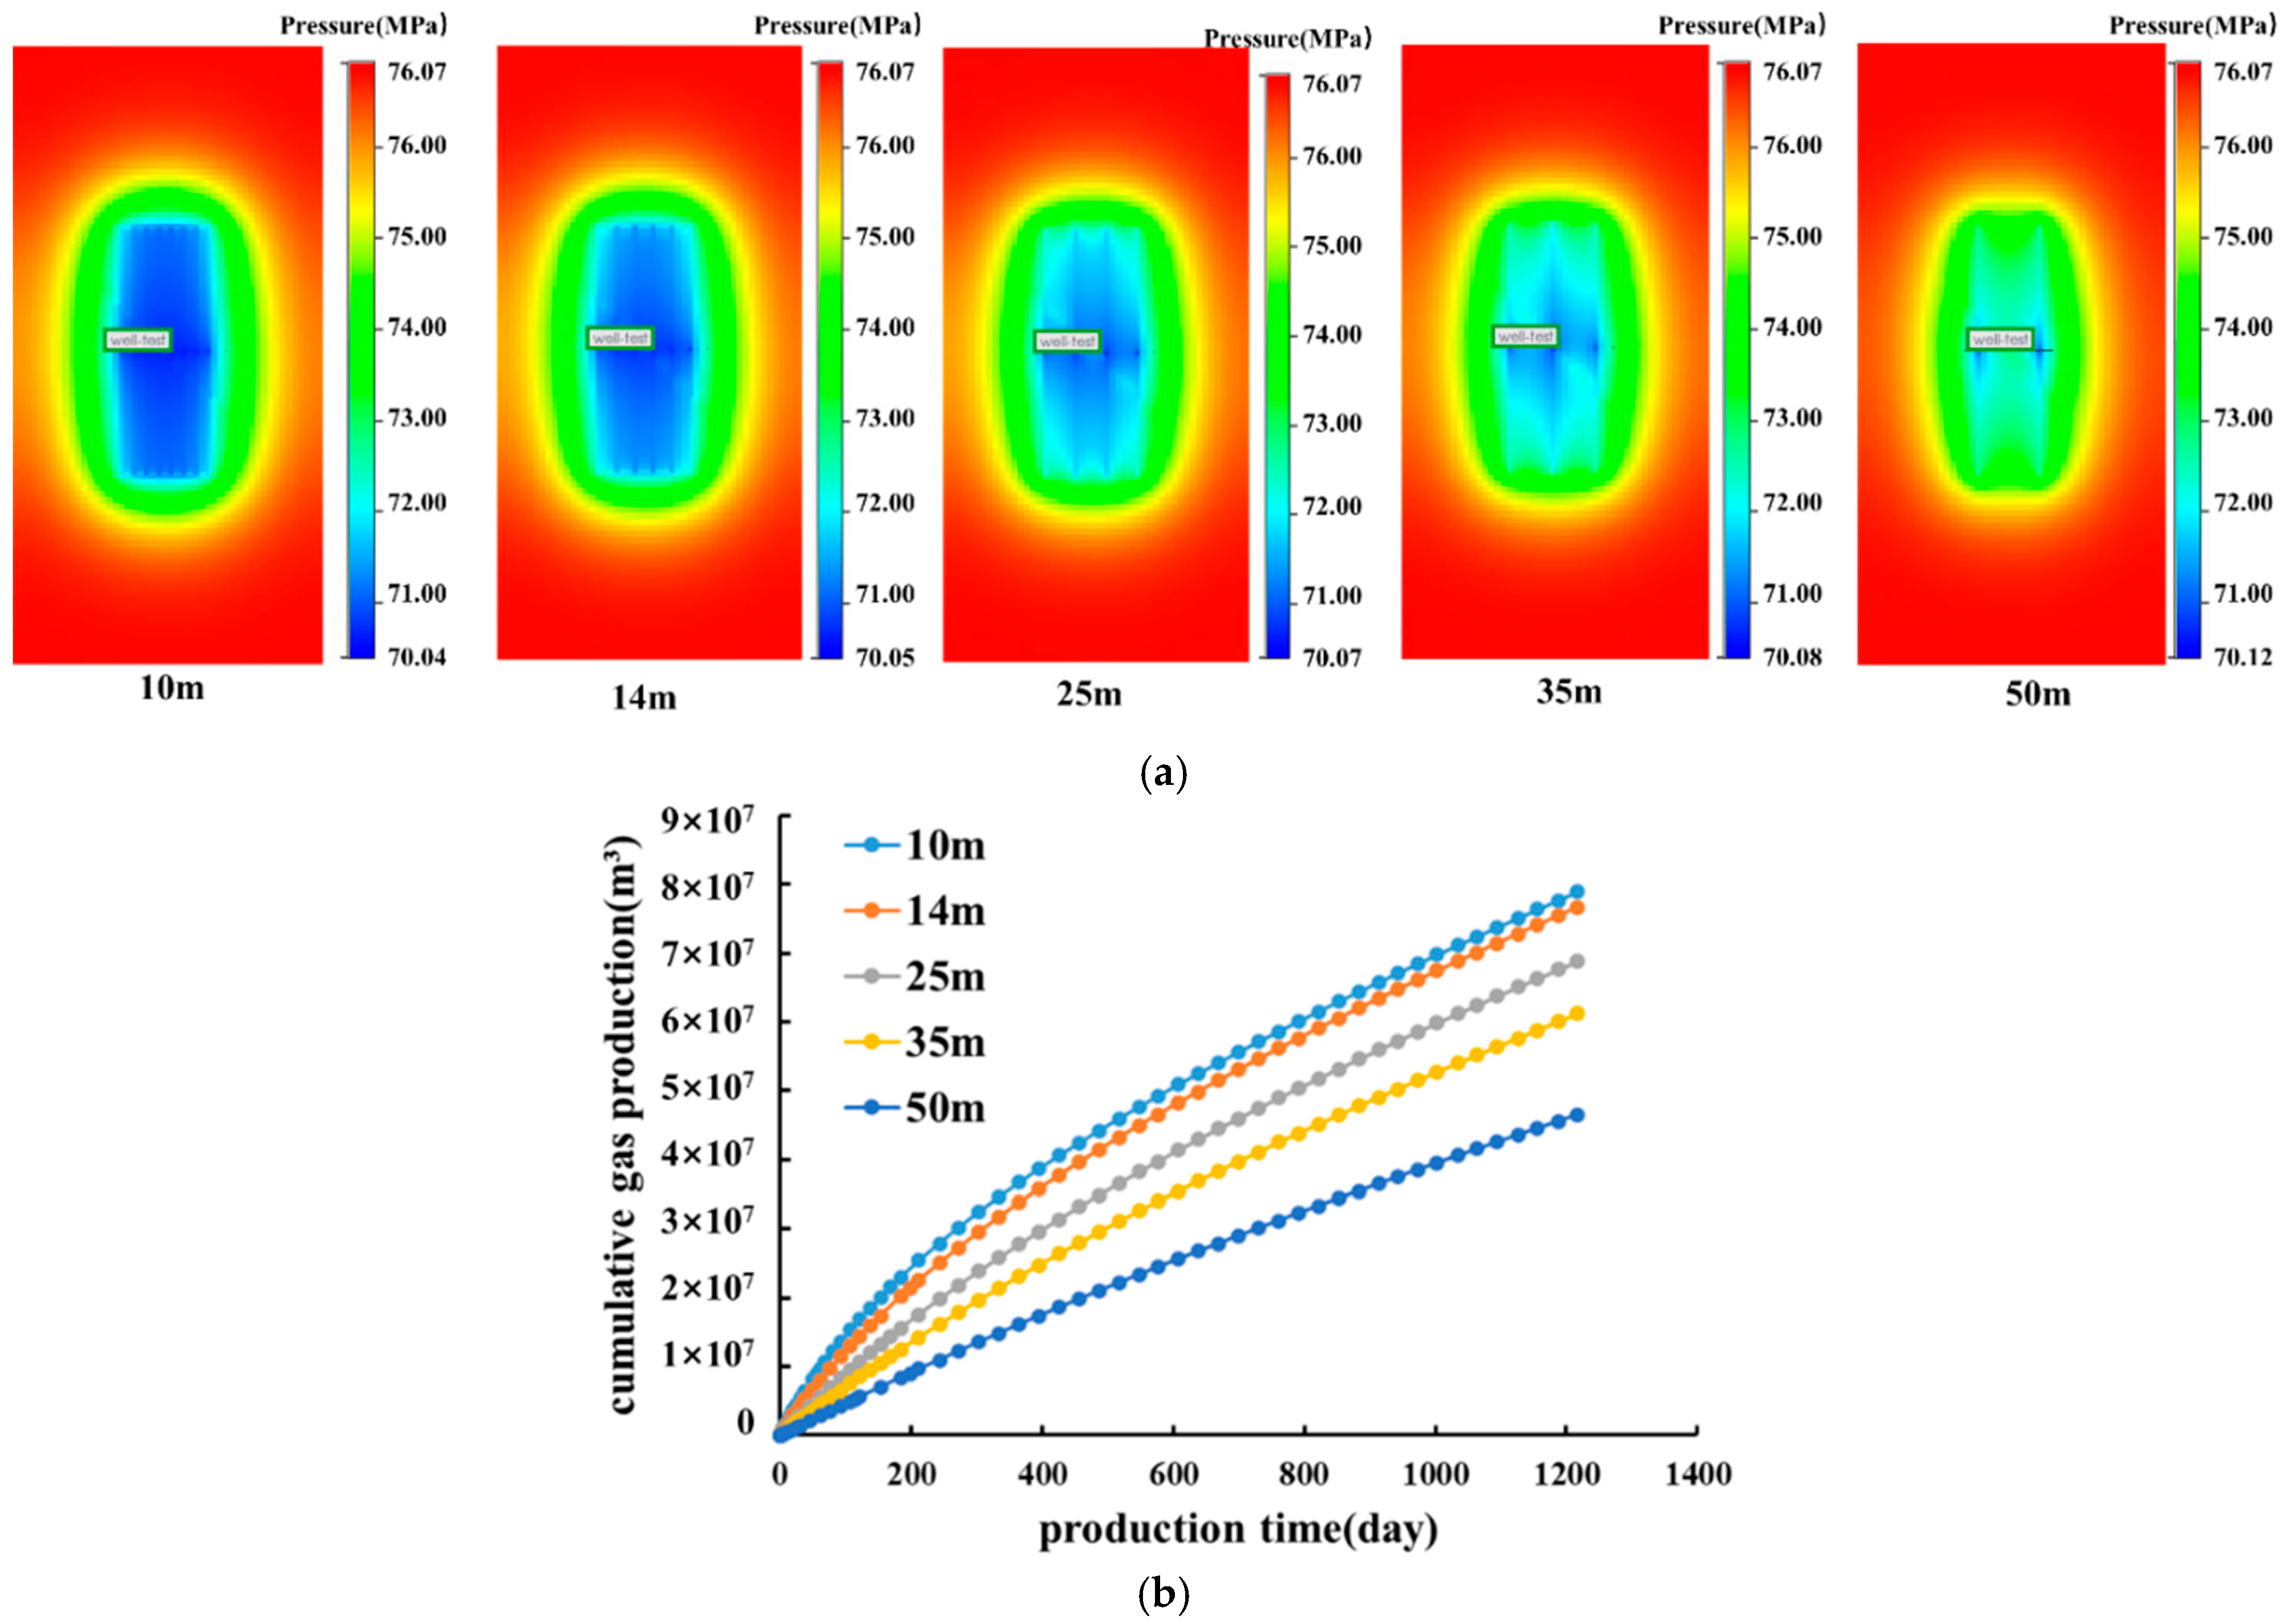
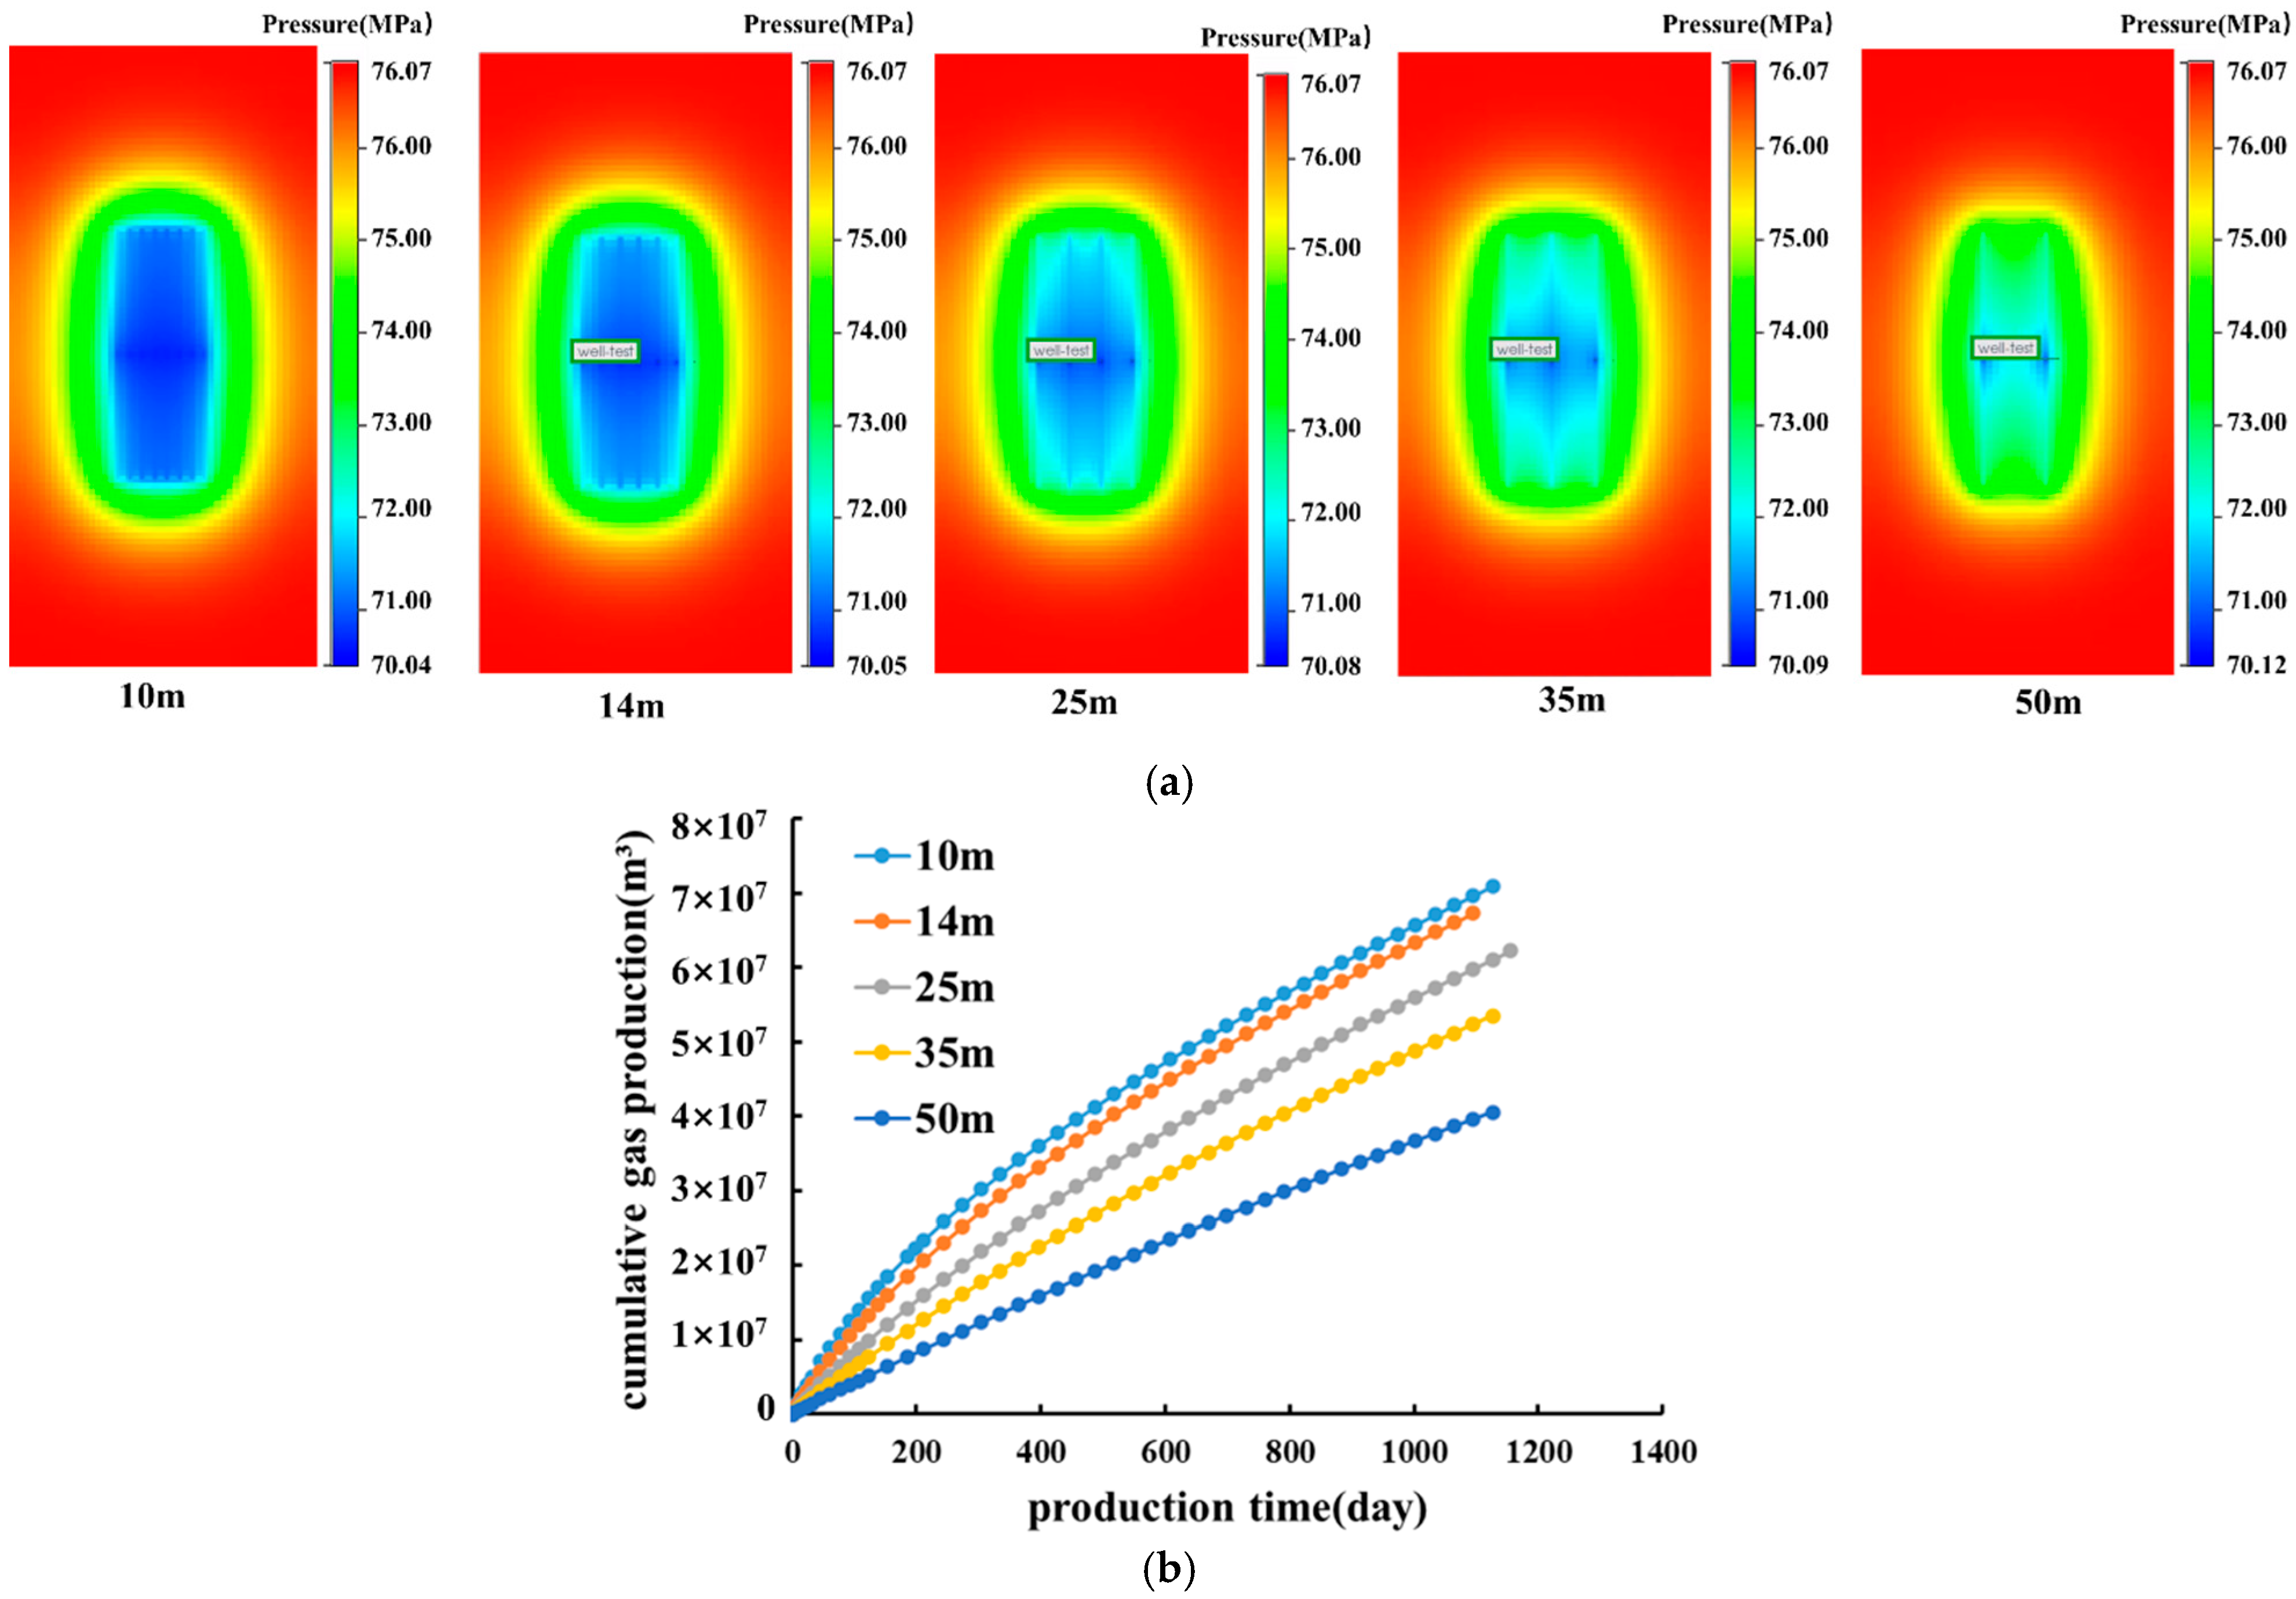
The defining characteristic of matrix zones is their exceptionally underdeveloped natural fracture system, making the creation of complex hydraulic fracture networks essential for establishing pathways for oil and gas flow to the wellbore. In wells Xin 8-5H and Xinsheng 204-1H, we implemented fracturing stages measuring 60–70 m in length, typically with 2–3 perforation clusters per stage. However, the production analysis revealed suboptimal pressure communication between certain fracture clusters within individual stages, adversely affecting the well productivity. This observation prompted a detailed investigation into cluster spacing optimization. Through numerical simulation of various perforation cluster configurations, we evaluated their impact on both cumulative gas production and pressure interference patterns over time (Figure 22). The results demonstrated a clear relationship between cluster spacing and the development of effective pressure communication zones, providing critical insights for optimizing stimulation designs in similar matrix-dominated reservoirs.
The relationship between cluster spacing and stimulation effectiveness is clearly demonstrated in Figure 22, showing that reducing the spacing from 50 m to 14 m yielded a 45.8% expansion in the pressure propagation area (from 33,600 m2 to 49,000 m2) and a significant 66.9% production increase. This improvement resulted from enhanced inter-cluster connectivity, expanded pressure interference across the fracture network, and reduced gas migration distances from the matrix to fractures. However, further reduction to 10 m provided diminishing returns, with only a 12.1% increase in the pressure propagation area (to 51,300 m2) and a marginal 3.1% production gain, indicating an optimal spacing range of 10–14 m for this reservoir type where the benefits of increasing the fracturing area must be balanced against the degree of pressure impact of inter-cluster fractures. These findings provide critical insights for optimizing stimulation designs for similar tight gas reservoirs to achieve maximum production enhancement.

4.2.2. Factors Influencing Productivity in the Fracture Area

Natural fractures constitute critical storage and migration pathways for hydrocarbons in tight formations. Their effective connection can significantly improve well productivity by enabling remote gas accumulation to flow toward the wellbore. In the Xu-2 matrix-type reservoirs, the natural fractures exhibit a predominant NW-SE orientation with moderate dip angles (36–60°), accompanied by a small number of high dip angle natural fractures. To evaluate the connectivity potential of these microfracture networks, we conducted a series of numerical simulations incorporating fractures with varying characteristics. The results, presented in Figure 23, Figure 24 and Figure 25, demonstrate the relationship between fracture properties and reservoir performance through both cumulative gas production profiles and pressure propagation patterns over time. This analysis provides critical insights into the value of natural fracture networks for production enhancement in these challenging reservoirs.
Cluster Spacing
Figure 23 demonstrates the significant impact of a reduced cluster spacing on reservoir stimulation effectiveness. As the spacing decreased from 50 m to 14 m, we observed a 50.7% expansion in the pressure propagation area (from 37,500 m2 to 56,500 m2), accompanied by improved pressure interference between fracture clusters that progressively extended throughout the stimulated reservoir volume. This enhanced pressure communication led to more efficient development of inter-cluster regions, resulting in a substantial 64.8% production increase. However, a further spacing reduction to 10 m yielded diminishing returns, with only marginal improvements in pressure propagation (1.8%) and production (2.9%). A comparative analysis with pure matrix zones revealed that natural fracture connectivity provided consistent performance benefits, increasing the pressure propagation areas by at least 10% and improving production by over 5% under equivalent stimulation conditions.
Figure 23. Fracture propagation range and cumulative gas production under different cluster spacings in the fracture area. (a) Pressure interference range under different cluster spacings; (b) cumulative gas well production under different cluster spacings.
Processes 13 02644 g023
Angle Between Natural Fracture and Wellbore
The relationship between natural fracture orientation and production efficiency is quantitatively demonstrated in Figure 24. Our analysis revealed a non-monotonic trend in cumulative gas production as the intersection angle between natural fractures and the wellbore increased, showing an initial decrease followed by a subsequent improvement. With a parallel alignment (0°), the pressure propagation exhibited balanced development with a lateral coverage of 205 m and vertical extension of 290 m. When the intersection angle increased to 45°, we observed a reduction in both lateral (180 m) and vertical (275 m) propagation, corresponding to an 18% decrease in the pressure-swept area and 10% production decline. However, at the perpendicular orientation (90°), the flow dynamics shifted significantly—while the lateral propagation slightly decreased to 175 m, the vertical extension substantially expanded to 365 m, resulting in a net 29% increase in the pressure-swept volume and 8% production enhancement compared to the 45° configuration.
Figure 24. Fracturing coverage area and cumulative gas production of the well under different angles between natural fractures and wellbore in the fracture area. (a) Pressure interference range under different angles between natural fractures and wellbore; (b) cumulative gas well production under different angles between natural fractures and wellbore.
Processes 13 02644 g024
Natural Fracture Inclination
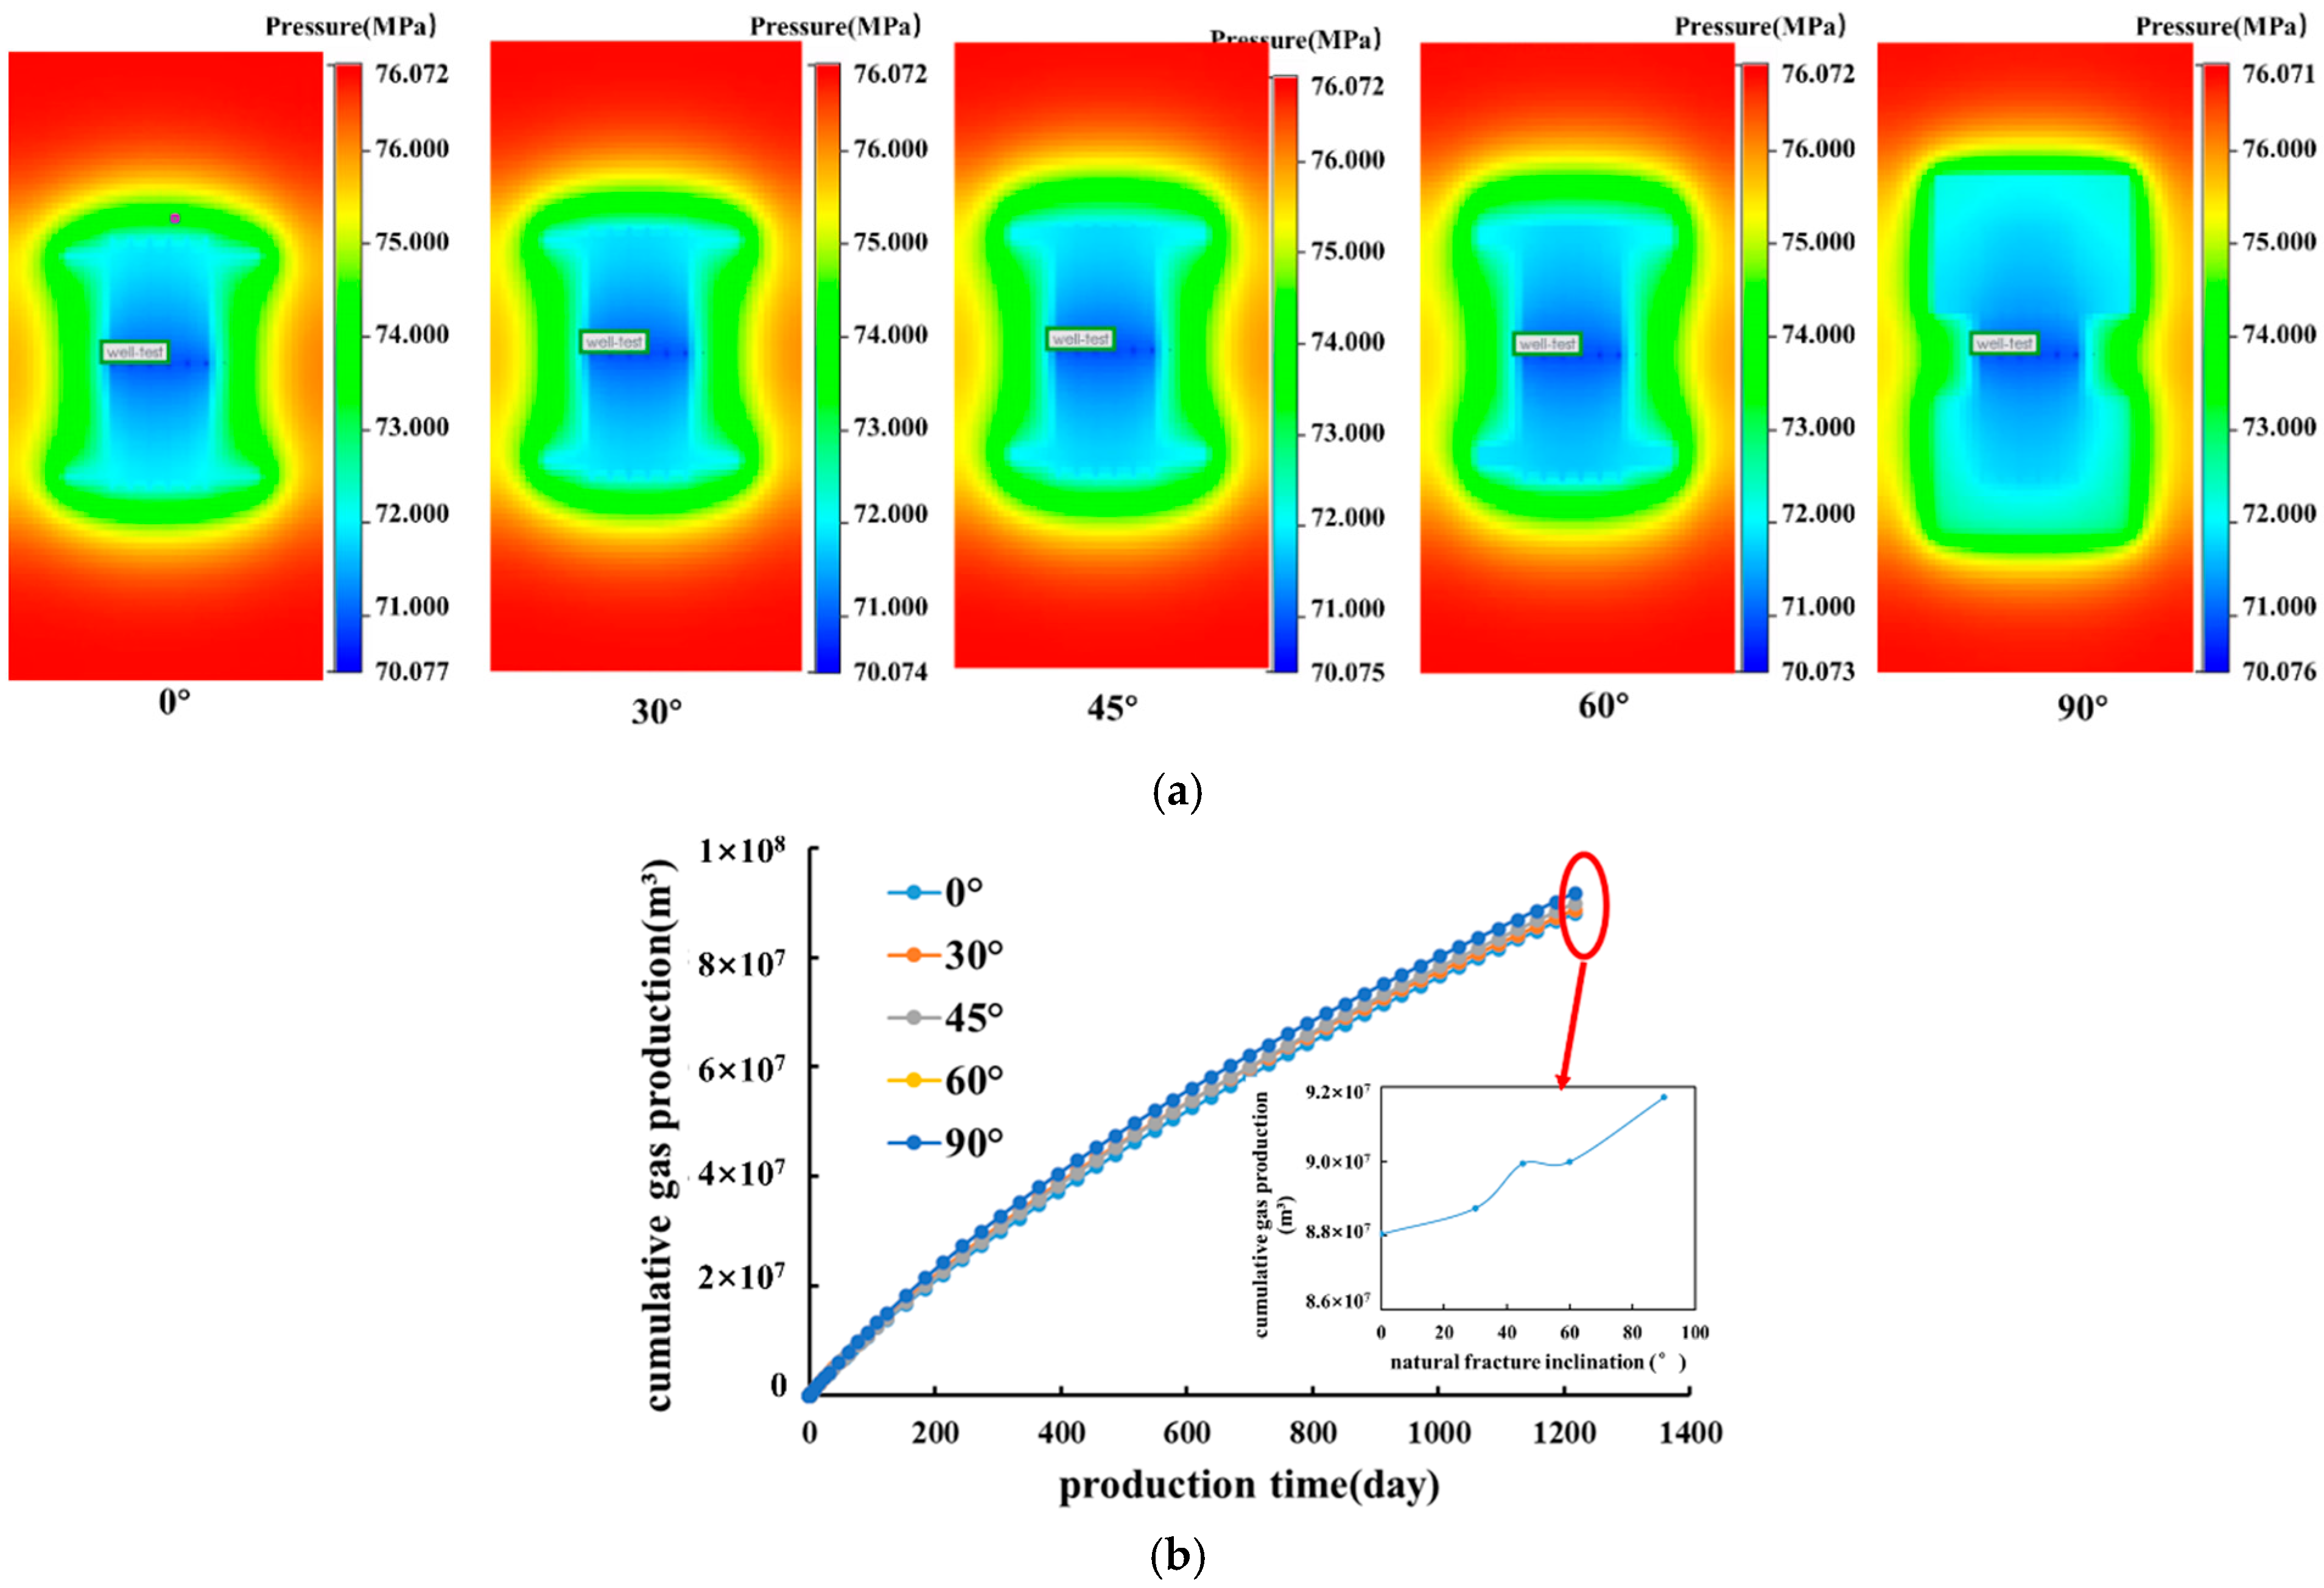
Figure 25 illustrates the significant influence of natural fracture inclination on reservoir stimulation performance. Our analysis demonstrated a positive correlation between fracture inclination and both pressure propagation extent and production enhancement. For horizontal fractures (0°), the vertical pressure propagation extended 280 m from the wellbore. As the dip angle increased to 45°, we observed a 17.7% expansion in vertical coverage (315 m), accompanied by a measurable production improvement. The most substantial enhancement occurred with vertically oriented fractures (90°), where the pressure propagated 355 m vertically—representing a 15.2% increase over the 45° configuration and a 26.8% improvement compared to horizontal fractures. This progressive expansion of the pressure-swept volume with increasing inclination angles directly translated to cumulative production gains, highlighting the importance of fracture geometry in optimizing drainage efficiency. The results suggest that steeply inclination natural fractures create more favorable conditions for effective reservoir stimulation and hydrocarbon recovery in this formation.
Figure 25. Fracturing coverage area and cumulative gas production under different natural fracture inclinations in the fracture area. (a) Pressure interference range under different natural fracture inclinations; (b) cumulative gas well production under different natural fracture inclinations.
Processes 13 02644 g025

4.2.3. Factors Influencing Productivity in the Fault Area

The study area contains several large-scale faults that significantly influence production performance, as evidenced by the comparative analysis of wells Xin 8-5H and Xinsheng 204-1H. Well Xin 8-5H, which successfully intersected a fault during drilling, achieved an exceptional production rate of 20 × 104 m3/d, while well Xinsheng 204-1H, despite the presence of a proximal fault (near target B), only yielded 8 × 10⁴ m3/d due to a lack of direct fault penetration. This stark contrast underscores the fundamental role of faults as primary conduits for gas accumulation and migration in matrix-type reservoirs, making their effective connection during stimulation operations essential for optimal production. However, the production analysis revealed that many fractured wells failed to establish hydraulic communication with nearby faults during stimulation and consequently were unable to access the significant gas reserves stored in these structural features. To address this challenge, we systematically investigated the optimal conditions for fault connectivity through numerical simulation. Our study varied two key parameters: (1) cluster spacing within fracturing stages and (2) distance between fault zones and fracturing stage. The resulting production characteristics, including cumulative gas output and pressure propagation patterns, are presented in Figure 26 and Figure 27, providing critical insights for optimizing fault connection strategies in similar reservoir settings.
Cluster Spacing
Figure 26 demonstrates the significant impact of cluster spacing on reservoir stimulation effectiveness. Our analysis revealed a clear correlation between reduced spacing and improved production performance. When the spacing decreased from 50 m to 35 m, we observed a 16% expansion in the pressure-swept area (from 30,000 m2 to 34,800 m2) accompanied by a 12.4% production increase, with pressure propagation primarily concentrated along the wellbore flanks. Further spacing reduction to 25 m yielded more substantial improvements, achieving complete fracture network connectivity with an additional 16% area expansion. This enhanced connectivity facilitated pressure propagation throughout the entire stimulated reservoir volume, reducing the flow resistance and enabling efficient gas migration from distal regions, ultimately resulting in a 34.9% production increase. The optimal performance window emerged at a spacing of 14–25 m, with the pressure-swept area expanding from 40,500 m2 to 43,400 m2 (7% increase) and an 11% production gain. However, ultra-close spacing (10 m) provided only marginal improvements (3% area growth, 7% production increase) due to excessive stress interference between clusters that counteracted the potential benefits. These findings establish 14~25 m as the optimal cluster spacing range for this reservoir type, effectively balancing fault connectivity with controlled pressure propagation intensity to maximize production while maintaining stimulation efficiency.
Figure 26. Fracture propagation range and cumulative gas production under different cluster spacings in the fault area. (a) Pressure interference range under different cluster spacings; (b) cumulative gas well production under different cluster spacings.
Processes 13 02644 g026
Distance Between Fault and Fracturing Section
Figure 27 demonstrates that there is a critical threshold in fault connectivity relative to stimulation placement. Our analysis revealed that when the fault-to-fracturing distance exceeded 70 m, hydraulic communication with the fault system became ineffective, severely limiting the production potential. However, when this distance was reduced below 50 m, we observed successful fault connection accompanied by substantial production enhancement. The data showed an interesting inverse relationship between pressure propagation and production performance in this context. As the distance decreased from 70 m to 50 m, the pressure-swept area contracted by 5.8% (from 47,600 m2 to 44,800 m2) while production showed a modest 0.5% increase. Further distance reduction to 30 m resulted in an additional 6.25% area reduction but yielded a more significant 2.5% production gain. This apparent paradox suggests that while a closer fault proximity may slightly reduce the total stimulated volume, it dramatically improves the connection efficiency with the high-permeability fault system, enabling more effective drainage of the reservoir’s gas potential.
Figure 27. Fracturing coverage area and cumulative gas well production under different fault distances in the fault area. (a) Pressure interference range under different fault distances; (b) cumulative gas well production under different fault distances.
Processes 13 02644 g027

5. Discussion

This study systematically investigated production characteristics through full-wellbore productivity modeling of wells Xin 8-5H and Xinsheng 204-1H, revealing fundamental effects of reservoir geology on gas sourcing. The distinct production profiles—deriving primarily from matrix and fault systems for well Xin 8-5H versus matrix and natural fracture contributions for well Xinsheng 204-1H—underscore the critical importance of geological characterization for production optimization. These findings, consistent with prior evaluations of the Xinchang Xu-2 reservoir [36], demonstrate that while matrix-only production yields limited output, strategic hydraulic fracturing to connect fracture/fault systems with wellbores can significantly enhance recovery.
Our single-stage fracturing modeling, which incorporates matrix, fracture, and fault zone characteristics, provides key insights into production enhancement strategies. The analysis of cluster spacing effects revealed a clear optimization window: while a reduced spacing (14–25 m) improves pressure propagation and production, excessive reductions trigger competitive fracture propagation [37,38], diminishing the returns through intensified stress interference. This balance between fracture connectivity and interference control represents a critical design consideration for effective reservoir stimulation.
In fracture-developed zones, as the intersection angle between natural fractures and the wellbore increases, cumulative gas production follows a distinct U-shaped trend—initially decreasing before rising again. This pattern results from fundamental changes in the pressure propagation dynamics: while larger angles diminish lateral reservoir contact, they simultaneously enhance vertical development, creating an initial reduction followed by expansion of the effective drainage area. Optimal production efficiency occurs at both extremes of fracture orientation—with near-parallel (0°) and perpendicular (90°) configurations—where the natural fracture network’s potential is maximally exploited. These findings [39,40] provide essential criteria for horizontal well placement strategies in fractured reservoirs. The production benefits of high-angle fractures [41] are particularly noteworthy, as their vertical extension creates superior flow pathways for gas migration, significantly improving the production when properly connected through stimulation. In the specific context of Xu-2 matrix reservoirs, where natural fractures predominantly exhibit moderate dip angles (36–60°) with occasional high-angle occurrences, understanding this relationship becomes particularly valuable. The documented communication potential of these fracture systems suggests significant opportunities for production enhancement through optimized well placement and completion design that properly accounts for the existing fracture geometry.
Regarding the critical issue of fault communication, the analysis demonstrated a well-defined inverse correlation between fault-to-fracturing distance and production performance, with a clearly established 50 m effective connection threshold. Optimal production occurs with a 30–50 m spacing between stimulation zones and fault systems—a finding that reconciles the tension between maximizing stimulated volume and ensuring fault connectivity [42]. The observed trade-off reveals an important compensation mechanism: while a closer fault proximity may modestly reduce the total stimulated volume, this is more than offset by the fault system’s dual advantages of a substantial gas storage capacity and superior flow conductivity. This balance provides operators with reference for completion design of fault-proximal wells.
While the existing studies primarily focused on analyzing dominant production zones at either the block scale or individual fracturing stage level [3,5,13,14,33], making it difficult to identify the specific gas source systems, this research achieved quantitative evaluation of productivity contributions from matrix pores, fractures, and faults from the perspective of storage spaces, thereby addressing critical gaps in the current research. It should be noted that the applicability of our method relies on substantial high-quality geological and engineering data support. For areas with incomplete data, we recommend supplementing with seismic attribute analysis and machine learning approaches [31,32,34]. Future work should prioritize simplifying the parameter requirements to enhance the method’s generalizability.

6. Conclusions

This study established full-wellbore productivity models for typical fractured wells X8-5H and Xinsheng 204-1H in the Xujiahe matrix-type reservoirs to analyze gas production sources. Single-fracturing stage productivity models of the “matrix zone”, “fracture zone”, and “fault” were established based on the characteristics of fractured stages in typical wells to study productivity influencing factors. Yielding the following conclusions:
(1) The main gas production sources for Well X8-5H are matrix pores and faults, while Well Xinsheng 204-1H are matrix pores and natural fractures.
(2) Matrix zone productivity mainly relies on establishing complex fracture networks to enhance hydrocarbon flow towards the wellbore. Appropriately reducing the cluster spacing can increase the pressure swept area and enhance the development degree of fracture inter-cluster area, thereby increasing production. However, but excessive reduction of cluster spacing intensifies stress interference between fractures, which is detrimental to increase well productivity.
(3) Natural fractures in Xu-2 matrix reservoirs have significant communication value. Well trajectory design should maintain natural fractures parallel or perpendicular to the wellbore to enhance lateral or vertical reservoir development after connecting natural fractures.
(4) Encountering effective faults during drilling can significantly enhance productivity. It is recommended to set the cluster spacing in fracturing stages within fault zones to 14~25 m, and control the distance between the fault and fracturing stages to less than 50 m to communicate the faults effectively.

Author Contributions

Conceptualization, X.W.; methodology, W.M. and Q.L.; writing—original draft, X.G.; investigation, L.Q. and W.Z.; writing—review and editing, X.G. and W.Z.; validation, W.M.; formal analysis, X.G. and Q.L.; data curation, L.Q.; supervision, X.W. and Q.L. All authors have read and agreed to the published version of the manuscript.

Funding

This research received no external funding.

Data Availability Statement

The data that support the findings of this study are available from the corresponding author upon reasonable request.

Conflicts of Interest

The authors Weijie Miao, Xingwen Wang, Wen Zhang, and Lin Qiu are employed at the Southwest Oil and Gas Field Engineering Research Institute of Sinopec. Authors Qianli Lu and Xinwei Gong were both employed at Southwest Petroleum University. The authors declare that the research was conducted in the absence of any commercial or financial relationships that could be construed as a potential conflict of interest.

References

  1. Chakhmakhchev, A.; Kurz, M.D.; McRae, T.A.; Yu, X.; Abarghani, A.; Schmidt, D.D.; Azzolina, N.A.; Kurz, B.A.; Sorensen, J.A. Investigating H2S Occurrence in Bakken Oil-Producing Wells Using Sulfur Isotopes in Gas, Water, and Rock Samples. In Proceedings of the SPE/AAPG/SEG Unconventional Resources Technology Conference, Houston, TX, USA, 17–19 June 2024; p. D021S036R002. [Google Scholar]
  2. Almubarak, Z.; Alrowaie, M.; Lu, F.; Algeer, R. Gas Chemical and Carbon Isotope Composition as a Diagnostic Tool for Energy. In Proceedings of the SPE Annual Technical Conference and Exhibition, Houston, TX, USA, 3–5 October 2022; p. D011S011R003. [Google Scholar]
  3. Hume, G.S. Distribution of Probable Source Rocks in Relation to Natural Gas and Petroleum Production in Alberta, Canada. In Proceedings of the 1st World Petroleum Congress, London, UK, 18–24 July 1933; p. WPC-1015. [Google Scholar]
  4. Drylie, S.; Pechiney, J.; Villaseñor, R.; Woodroof, R. Determining the Number of Contributing Fractures in Shale Gas Wells with Production Analysis and Proppant Tracer Diagnostics. In Proceedings of the SPE Production and Operations Symposium, Oklahoma City, OK, USA, 1–5 March 2015; p. SPE-173620-MS. [Google Scholar]
  5. Wang, M.; Zeng, J.; Wang, X.; Chen, D.; Wu, C.; Pan, K.; Zhang, H.; Cui, H. Controlling factors of gas-water distribution in source-reservoir separated tight sandstone gas reservoirs:a case study of Shaximiao Formation tight sandstone gas in central Sichuan Basin. Acta Pet. Sin. 2024, 45, 1187–1201+1218. [Google Scholar]
  6. Li, J.; Luo, J.; Zhang, X.; Liu, P. Microcosmic factor analysis of yielding difference of major pay in east area of Sulige Gas Field. Fault-Block Oil Gas Field 2012, 19, 756–759. [Google Scholar]
  7. Hampton, T.J.; Reid, S.A.; McIntyre, J.L.; Querin, E.M. Possible Sources of Gas from the 31S C/D Shale Reservoirs, Monterey Formation, Elk Hills Field, California. In Proceedings of the SPE Western Regional Meeting, Anchorage, AK, USA, 22–24 May 1996; p. SPE-35742-MS. [Google Scholar]
  8. Tang, H.; Feng, Y.; He, P.; Zhang, L.; Zhao, F. Experimental Methods for Evaluating Productivity Contribution ofDifferent Types of Low Permeability Gas Reservoir. J. Southwest Pet. Univ. (Sci. Technol. Ed.) 2014, 36, 182–188. [Google Scholar]
  9. Mohsin, L.; Marmin, N.; Mukha, A. Acoustic-based Methodology of Assessing Zonal Production Contribution, Hydraulic Fracture Productive Height, and Reservoir Fluid Type in Tight Gas Condensate and Oil Reservoirs. In Proceedings of the SPE Asia Pacific Unconventional Resources Conference and Exhibition, Brisbane, Australia, 9–11 November 2015; p. SPE-176863-MS. [Google Scholar]
  10. Mei, D.; Hu, Y.; Wang, Q. Experimental study on fracture contribution to gas reservoir permeability and well capacity. Pet. Geol. Exp. 2019, 41, 769–772. [Google Scholar]
  11. Wang, J. Natural fractures do not contribute much to shale gas reservoir productivity. Nat. Gas Explor. Dev. 2017, 40, 119. [Google Scholar]
  12. Alalawi, W.Z.; Alrowaie, M.A.; AlQathami, S.M. Gas geochemical characteristics and thermal maturity of the Type-IIS source rock. In Proceedings of the SEG/AAPG International Meeting for Applied Geoscience & Energy, Houston, TX, USA, 28 August–1 September 2022; p. D011S055R003. [Google Scholar]
  13. Su, S.; Vo, M.; Jia, C.; Yuan, J.; Zhang, J.; Zhang, Q. Integrated Gas Source Analysis for Wells with Sustained Casing Pressure: A Case Study from Sour Gas Fields in Sichuan Basin, China. In Proceedings of the International Petroleum Technology Conference, Virtual, 23 March–1 April 2021; p. D041S020R003. [Google Scholar]
  14. Ni, X.; Feng, D.; Hao, S.; Wang, K.; Su, E. Gas source and contribution identification for coal measure gas commingled production in Wulihou mining area. Pet. Reserv. Eval. Dev. 2024, 14, 952–958. [Google Scholar]
  15. Santiago, V.; Ribeiro, A.; Hurter, S. Modelling the Contribution of Individual Seams to Coal Seam Gas Production. In Proceedings of the SPE/AAPG/SEG Asia Pacific Unconventional Resources Technology Conference, Brisbane, Australia, 18–19 November 2019; p. D022S027R002. [Google Scholar]
  16. Santiago, V.; Ribeiro, A.; Hurter, S. Modeling the Contribution of Individual Coal Seams on Commingled Gas Production. SPE Prod. Oper. 2021, 36, 245–261. [Google Scholar] [CrossRef]
  17. Mi, L.; Yan, B.; Liu, Q.; Ren, Z. The Fracture Network Inversion Based on Gas Production Profile. In Proceedings of the International Petroleum Technology Conference, Beijing, China, 26–28 March 2019; p. D011S013R005. [Google Scholar]
  18. Gueddoud, A.; Al Hanaee, A.; Khan, R.; Abdelaal, A.; Kurniawan, R.; Al Ameri, A. Dynamic Modeling Workflow for an Unconventional Biogenic Gas Reservoir with Multistage Hydraulic Fracture. A Case Study of Miocene Gachsaran Formation, Abu Dhabi, United Arab Emirates. In Proceedings of the SPE Middle East Oil & Gas Show and Conference, Sanabis, Bahrain, 28 November–1 December 2021; p. D041S047R001. [Google Scholar]
  19. Bai, Y.; Wang, S.; Xu, B. Production Contribution Analyse on Outer Region of Stimulated Reservoir Volume in Condensate Shale Gas Well:Taking Typical Condensate Shale Gas Well in Eagle Ford as an Example. Sci. Technol. Ind. 2024, 24, 251–257. [Google Scholar]
  20. Zhichong, S.; Dong, W.; Yonggang, J. Analysis on gas hydrate exploitation response between the horizontal and vertical wells at SH2 site in the Shenhu area of the South China Sea. Ocean Eng. 2019, 37, 107–116. [Google Scholar]
  21. Li, J.; Wang, Y.; Ma, W.; Wang, D.; Ma, C.; Li, Z. Evaluation on Occluded Hydrocarbon in Deep-ultra Deep Ancient Source Rocks and Its Cracked Gas Resources. In Proceedings of the SPE/AAPG/SEG Unconventional Resources Technology Conference, San Antonio, TX, USA, 1–3 August 2016; p. URTEC-2460417-MS. [Google Scholar]
  22. Moghaddam, R.N.; Aghabozorgi, S.; Foroozesh, J. Numerical Simulation of Gas Production From Tight, Ultratight and Shale Gas Reservoirs: Flow Regimes and Geomechanical Effects. In Proceedings of the EUROPEC 2015, Madrid, Spain, 1–4 June 2015; p. SPE-174323-MS. [Google Scholar]
  23. Yang, Y.; Peeters, M.; Van Kirk, C.W.; Cloud, T.A. Gas Productivity Related to Cleat Volumes Derived from Focused Resistivity Tools in Coalbed Methane (CBM) Fields. Petrophysics-SPWLA J. 2006, 47, SPWLA-2006-v47n3a5. [Google Scholar]
  24. He, X.; Guo, X.; Cui, H.; Lei, K.; Lei, Y.; Zhou, L.; Liu, Q.; Zhu, Y.; Liu, L. Research on Production Distribution Law of Multi-layer Gas Wells in Yan’an Gas Field. Liaoning Chem. Ind. 2021, 50, 904–906+928. [Google Scholar]
  25. Zhenyu, Z.; Hong, L.; Youming, L. Logging Identification And Evaluation of Cambrian-ordovician Source Rock In Tarim Basin. In Proceedings of the 2003 SEG Annual Meeting, Dallas, TX, USA, 26–31 October 2003; p. SEG-2003-0098. [Google Scholar]
  26. Deshmukh, S.; Omer, S.; Tomor, P.S.; Harilal. Shale Gas Sweet Spot Identification Using Quantitative Seismic Interpretation (QSI) and Neural Network in Krishna-Godavari Basin, India. In Proceedings of the SPE/AAPG/SEG Unconventional Resources Technology Conference, Virtual, 20–22 July 2020; p. D023S052R001. [Google Scholar]
  27. Niu, D.M.; Li, Y.L.; Zhang, Y.F.; Sun, P.C.; Wu, H.G.; Fu, H.; Wang, Z.Q. Multi-scale classification and evaluation of shale reservoirs and ‘sweet spot’ prediction of the second and third members of the Qingshankou Formation in the Songliao Basin based on machine learning. J. Pet. Sci. Eng. 2022, 216, 110678. [Google Scholar] [CrossRef]
  28. Chen, K.; Zhao, M.; Feng, Y.; Fu, X.; Wang, Y.; Guo, H.; Ding, J.; Chen, Q. Intelligent recognition of “geological-engineering” sweet spots in tight sandstone reservoirs—An application to a tight gas reservoir in Ordos Basin, China. Front. Earth Sci. 2025, 13, 1535883. [Google Scholar] [CrossRef]
  29. Leem, J.; Musa, I.H.; Mazeli, A.H.; Che Yusoff, M.F.; Jowett, D.; Redpath, D.; Saltman, P. Machine Learning Sweet Spot Identification and Performance Validation Utilising Reservoir and Completion Data from Unconventional Reservoir in British Columbia, Canada. In Proceedings of the SPE/IATMI Asia Pacific Oil & Gas Conference and Exhibition, Jakarta, Indonesia, 10–12 October 2023; p. D021S011R001. [Google Scholar]
  30. Leem, J.; Mazeli, A.H.; Musa, I.H.; Che Yusoff, M.F. Data Analytics and Machine Learning Predictive Modeling for Unconventional Reservoir Performance Utilizing Geoengineering and Completion Data: Sweet Spot Identification and Completion Design Optimization. In Proceedings of the ADIPEC, Abu Dhabi, United Arab Emirates, 31 October–3 November 2022; p. D021S062R002. [Google Scholar]
  31. Huang, R.; Li, Y.; Gao, Z.; Fan, C.; You, J.; Li, R.; Deng, C.; Li, G. Machine learning-based sweet spot prediction for lacuscrine shale oil in the Weixinan Sag, Beibu Gulf Basin, China. Mar. Pet. Geol. 2025, 179, 107436. [Google Scholar] [CrossRef]
  32. Yang, H.; Li, F.; Wang, W.; Fu, Y.; Tang, Q.; Yang, J.; Xie, B. A novel approach for identifying sweet spots in tight reservoir fracturing engineering based on physical-data dual drive. J. Appl. Geophys. 2025, 238, 105735. [Google Scholar] [CrossRef]
  33. Zhao, Q.; Sun, H.; Qiu, B.; Li, J.; Li, G.; Fang, J. Gray evaluation of layered productivity contribution of gas wells in Sulige Gas Field. Mud Logging Eng. 2022, 33, 126–131. [Google Scholar]
  34. Deng, Y.; Wang, W.; Du, X.; Su, Y.; Sun, S.; Zhang, Y.; Teng, J. Machine Learning Based Stereoscopic Triple Sweet Spot Evaluation Method for Shale Reservoirs. In Proceedings of the SPE/AAPG/SEG Unconventional Resources Technology Conference, Denver, CO, USA, 13–15 June 2023; p. D031S073R003. [Google Scholar]
  35. Wang, X. Calculation method for productivity of fractured horizontal Wells in tight gas reservoirs. Lithol. Reserv. 2018, 30, 161–168. [Google Scholar]
  36. Zhan, Z. The Key Technologies for Quantitative Evaluation for the Complex Deep Tight Gas Reservoirs—Taking TX2 Gas Reservoir of the West Sichuan Depression as an Example. Ph.D. Thesis, Chengdu University of Technology, Chengdu, China, 2022. [Google Scholar]
  37. Shi, P.; Yan, H.; Zhang, J.; Chen, C.; Jin, L. Fracture competition propagation patterns and induced stress field evolution mechanisms during staged fracturing with mining-induced stress disturbance. J. Min. Saf. Eng. 2025, 1–16. [Google Scholar] [CrossRef]
  38. Yu, Y.; Zhu, W.; Li, L.; Wei, C.; Dai, F.; Liu, S.; Wang, W. Analysis on stress shadow of mutual interference of fractures in hydraulic fracturing engineering. Rock Mech. Eng. J. 2017, 36, 2926–2939. [Google Scholar]
  39. Xiao, Z.; Zhao, Y.; Zhang, L.; Ge, F.; Yang, Z.; Liu, X.; Zhang, D.; Tian, Y. Capacity of Compact Reservoir Based on Dual Medium Embedded Discrete Crack Model. Sci. Technol. Eng. 2023, 23, 10780–10790. [Google Scholar]
  40. Mi, H.; Zhang, J.; Li, H. Productivity analysis of low-permeability gas reservoirs considering the influence of natural fractures. J. Chengdu Univ. Technol. (Sci. Technol. Ed.) 2020, 47, 178–184. [Google Scholar]
  41. Du, Y.; Cui, H.; Yuan, Y.; Huang, X.; Shi, Y. Influence of natural fractures on the productivity of shale gas wells. Nat. Gas Ind. 2021, 41, 118–123. [Google Scholar]
  42. Zhou, J.; Liu, W. Fault distribution characteristics and their impacts on the yield of the Ledong Gas 15-1 Field, Yinggehai Basin. Nat. Gas Ind. 2013, 33, 56–61. [Google Scholar]
Figure 1. Statistical histogram of lithology analysis for each sand formation in the Xinchang Xu-2 Formation. (a) Reservoir lithology distribution histogram; (b) particle size distribution histogram; (c) sorting statistical histogram.
Processes 13 02644 g001
Figure 2. The microscopic characteristics of the intragranular dissolution pores, intergranular dissolved pores, and microfractures in the Xu-2 Formation.
Processes 13 02644 g002
Figure 3. Bar chart of effective fracture open degree statistics for different sand groups in Xu-2 Formation.
Processes 13 02644 g003
Figure 4. Method for determining gas production sources in reservoirs based on gas well productivity fitting analysis.
Processes 13 02644 g004
Figure 5. Distribution of fault and fractures in well Xin 8-5H. (a) Fault distribution in well Xin 8-5H; (b) fracture distribution in well Xin 8-5H. The green box represents the location of faults, the yellow box represents the positions of target points A and B in the horizontal section, the blue box represents the location of leakage points during the drilling process, and the red arrow represents microfractures.
Processes 13 02644 g005
Figure 6. Wide-area electromagnetic emission monitoring of hydraulic fracture data in well Xin 8-5H. And the color boxes corresponding to the numbers 1 to 13 represent the fracturing stages 1 to 13.
Processes 13 02644 g006
Figure 7. Full-section fracturing productivity model for Xin 8-5H well.
Processes 13 02644 g007
Figure 8. Gas compression coefficient and viscosity parameters for the Xin 8-5H well.
Processes 13 02644 g008
Figure 9. Fault distribution in well Xinsheng 204-1H.
Processes 13 02644 g009
Figure 10. Electrical imaging logging explaining the distribution characteristics of natural fractures. In the histogram on the right, red represents conductive fracture dip angle and blue represents resistive fracture dip angle.
Processes 13 02644 g010
Figure 11. Micro-fracture zone distribution in well Xinsheng 204-1H. The red arrow indicates the location of the observed microfractures.
Processes 13 02644 g011
Figure 12. Wide-area electromagnetic monitoring data of hydraulic fractures in well Xinsheng 204-1H. The color boxes corresponding to the numbers 1 to 15 represent the fracturing stages 1 to 15.
Processes 13 02644 g012
Figure 13. Fracturing productivity model for full well section of well Xinsheng 204-1H.
Processes 13 02644 g013
Figure 14. Gas compression coefficient and viscosity parameters of the Xinsheng 204-1H well.
Processes 13 02644 g014
Figure 15. Annual cumulative production of gas wells and simulation time under different grid sizes (assuming simultaneous gas supply from matrix, natural fractures, and faults). (a) Well Xin 8-5H; (b) Well Xinsheng 204-1H.
Processes 13 02644 g015
Figure 16. Micro-seismic monitoring results for Well J in Block W.
Processes 13 02644 g016
Figure 17. Comparison of simulated daily production curve and actual daily production data.
Processes 13 02644 g017
Figure 18. Production matching results for well Xin 8-5H and pressure propagation ranges under different gas supply systems. The purple elliptical area indicates the stress interference caused by the small cluster space of the 6th to 9th clusters of fractures and the 15th to 22nd clusters of fractures. The green box indicates that hydraulic fracturing has connected the fracture area, expanded the range of pressure propagation, and enhanced the connectivity of inter-cluster fractures.
Processes 13 02644 g018
Figure 19. Production capacity fitting results and pressure sweep ranges under different gas supply systems for Xinsheng 204-1H well. The purple elliptical area indicates that hydraulic fracturing effectively communicates the natural fractures in the upper area.
Processes 13 02644 g019
Figure 20. Fracturing stimulation zone division for well Xin 8-5H (a) and well Xinsheng 204-1H (b).
Processes 13 02644 g020
Figure 21. Single-fracturing stage productivity model in typical areas.
Processes 13 02644 g021
Figure 22. Fracture propagation range and cumulative gas well production under different cluster spacings in the matrix area. (a) Pressure interference range under different cluster spacings; (b) cumulative gas well production under different cluster spacings.
Processes 13 02644 g022
Table 1. Composition of sandstone interstitial materials in the Xu-2 Gas Reservoir.
LayerNumber of SamplesFiller Content /%Cementing MaterialMiscellaneous Base
Calcite /%Quartz /%Dolomite /%Siliceous /%Chlorite /%Muddy /%Water Mica /%Kaolinite /%
TX225786.651.441.243.270.190.020.140.340.01
TX232586.881.621.342.70.60.050.220.310.04
TX247964.870.61.81.410.290.130.290.350
TX253115.140.81.811.560.360.330.110.170
TX262305.121.821.311.020.180.460.150.170.01
TX272227.123.330.492.460.080.10.390.190.08
TX28744.212.420.391.010.050.090.010.240
Table 2. Basic parameter settings for full-section fracturing model of Xin 8-5H well.
Input ParameterValueInput ParameterValueInput ParameterValue
Reservoir model dimensions, m31000 × 1000 × 60Reservoir temperature, °C128.46Fracture zone area length, m200
Matrix permeability, mD1.2 × 10−2Hydraulic fracture height, m18~42Fracture zone area height, m80
Matrix porosity0.032Fracturing stage length, m765Natural fracture permeability, mD3
Initial water saturation0.31Hydraulic fracture length, m139-311Fault location, m5308
Fracture width, m0.00204Hydraulic fracture conductivity, D·cm25Fault zone permeability, mD15
Fracture zone area location 5036 m, 5136 m, 5186 m, 5236 m, 5386 m, 5486 mFault extension length, m600
Fault throw, m10Fault height, m100Formation pressure, MPa56.75
Water compressibility, 1/MPa5.38 × 10−4Rock compressibility, 1/MPa2.2 × 10−4
Table 3. Basic parameter settings of full well section fracturing model for well Xinsheng 204-1H.
Input ParameterValueInput ParameterValueInput ParameterValue
Reservoir model dimensions, m31500 × 600 × 60Reservoir temperature, °C123Natural fracture area length, m31–333 m
Matrix permeability, mD2.8 × 10−2Hydraulic fracture height, m24–32Natural fracture area height, m200
Matrix porosity0.051Fracture stage length, m962Natural fracture zone width, m100
Initial water saturation0.39Hydraulic fracture length, m233~345Natural fracture permeability, mD2.8
Fault length, m475 mFault permeability, mD25Fracture zone location, m4747–4941 m, 5329–5360 m, 5483–5816 m
Fault height, m100Fracture conductivity, D·cm15
Fault width, m10Hydraulic fracture conductivity, D·cm22.5
Formation pressure, MPa75.56Water compressibility, 1/MPa5.38 × 10−4Rock compressibility, 1/MPa2.2 × 10−4
Table 4. Design of grid independence verification scheme.
Well Xin 8-5HWell Xinsheng 204-1H
Grid Size
(m3)
Number of Grids Simulated Cumulative Production (104 m3)Calculation Time (s)Grid Size
(m3)
Number of Grids Simulated Cumulative Production (104 m3)Calculation Time (s)
1 × 1 × 1113,204,5007071.3252346.81 × 1 × 1160,688,2505197.353825.65
2 × 2 × 214,151,8137091.2562156.82 × 2 × 220,086,0315192.563325.25
3 × 3 × 26,289,6957083.4522035.43 × 3 × 28,927,1255187.653025.69
5 × 5 × 14,528,5807085.2561656.25 × 5 × 16,427,5305173.52845.65
5 × 5 × 22,264,2907078.5381344.55 × 5 × 23,213,7655193.4832468.9
7 × 7 × 21,155,2507343.2591065.38 × 8 × 21,255,3775346.582135.8
10 × 10 × 2566,0737826.45884.210 × 10 × 2803,4425432.581975.68
20 × 20 × 1283,0377958.26576220 × 20 × 1401,7215523.261654.2
Table 5. Basic parameter settings of full-wellbore fracturing model for Well J.
Input ParameterValueInput ParameterValueInput ParameterValue
Reservoir model dimensions, m31600 × 600 × 80Reservoir temperature, K337Initial formation pressure, MPa64
Matrix permeability, mD0.13Fracture stage length, m1360Bottomhole flowing pressure, MPa58
Matrix porosity0.11Fracture length, m160~430Fracture width, m0.003
Initial water saturation0.6Fracture conductivity, D·cm25
Table 6. Basic parameters of single-stage fracturing model.
Input ParameterValueInput ParameterValue
Reservoir temperature, °C123Original water saturation0.35
Matrix permeability, mD2.6 × 10−2Formation pressure, MPa76
Matrix porosity0.04Fracture height, m28
Fracture conductivity, D·cm25Fracture width, m0.00204
Formation pressure, MPa66Water compressibility, 1/MPa5.45 × 10−4
Rock compressibility, 1/MPa2.2 × 10−4
Disclaimer/Publisher’s Note: The statements, opinions and data contained in all publications are solely those of the individual author(s) and contributor(s) and not of MDPI and/or the editor(s). MDPI and/or the editor(s) disclaim responsibility for any injury to people or property resulting from any ideas, methods, instructions or products referred to in the content.