Article

Effect of Back Wear-Ring Clearance on the Internal Flow Noise in a Centrifugal Pump

1
Research Center of Fluid Machinery Engineering and Technology, Jiangsu University, Zhenjiang 212013, China
2
School of Energy and Power Engineering, Jiangsu University, Zhenjiang 212013, China
3
School of Metrology and Testing Engineering, China Jiliang University, Hangzhou 310018, China
*
Author to whom correspondence should be addressed.
Processes 2025, 13(8), 2641; https://doi.org/10.3390/pr13082641
Submission received: 18 July 2025 / Revised: 4 August 2025 / Accepted: 15 August 2025 / Published: 20 August 2025
(This article belongs to the Section Process Control and Monitoring)

Abstract

To investigate the effects of clearance variations induced by back wear ring wear on internal flow and noise within centrifugal pumps at the design flow rate (Qo = 25 m3/h), a combined Computational Fluid Dynamics (CFD) and Acoustic Finite Element Method (FEM) approach was employed. The SST-SAS turbulence model and Lighthill’s acoustic analogy, were applied to simulate the internal flow and acoustic fields, respectively, across four different clearance values. The impact laws of various back wear-ring clearances on flow-induced noise were analyzed. The results indicate that the head and efficiency of the centrifugal pump gradually decrease with the increase in the back wear-ring clearance. When the clearance reaches 1.05 mm, the head drops by 4.35% and the efficiency decreases by 14.86%. The radial force on the impeller decreases, while the axial force increases and its direction reverses by 180 degrees. The acoustic source strength at the rotor–stator interface, near the volute tongue, and at the outlet of the back wear ring increases with larger clearance; furthermore, high-sound-source regions expand around the balance holes and near the impeller suction side. The dominant SPL frequency for all clearance cases was the blade passing frequency (BPF). As clearance increases, the overall SPL curve shifts upwards; however, the variation gradient decreases noticeably when the clearance exceeds 0.75 mm. The overall internal SPL increases, with the total SPL under 1.05 mm being 1.8% higher than that under 0.15 mm. In total, the optimal back ring clearance is 0.45 mm, which achieves a 38% noise reduction while maintaining a 97.9% head capacity.

1. Introduction

As an important fluid machinery, centrifugal pumps are indispensable due to their widespread application and performance advantages of high efficiency and compactness [1]. They feature characteristics such as a wide high-efficiency range, small size, light weight, and minimal space requirement [2,3]. Moreover, pump noise significantly impacts the system’s economic viability and the operational safety/reliability of the entire unit. Crucially, it often serves as an early indicator of equipment malfunction. Therefore, researching the effect of faults on noise and investigating the mechanisms behind internal noise generation in centrifugal pumps provides a vital diagnostic basis for timely intervention and maintenance when pump failures occur [4].
Wear rings are critical sealing components in centrifugal pumps. Their primary function is to effectively minimize internal leakage through the clearance between the impeller and the pump casing while protecting both the casing and impeller from damage [5]. Centrifugal pump wear rings are typically classified as front wear rings and back wear rings. The front wear ring, located between the impeller inlet shroud and the pump casing, primarily prevents high-pressure fluid from recirculating back to the low-pressure suction side. This enhances pump efficiency and safeguards the suction-side structures. The back wear ring, situated between the impeller hub and the pump casing, mainly prevents high-pressure fluid from leaking into the shaft seal chamber or bearing housing, thereby protecting the shaft seal and lubricating oil. It also utilizes the pressure differential across it to help balance the axial force generated by the impeller. Together, both rings establish an effective sealing barrier through precise clearance control, reducing leakage and wear to ensure safe and efficient pump operation [6,7].
The wear-ring clearance has obvious effect on pump performance. Zhao et al. [8] found that appropriately reducing the front wear-ring clearance enhances the pump’s self-priming capability. Fu et al. [9] investigated the impact of front wear-ring clearance on normal centrifugal pump operation and internal flow characteristics. Results demonstrated that increasing the front wear-ring clearance leads to increased recirculation, chaotic flow within the impeller, and, consequently, reduced head and efficiency. Ayad [10] studied the effect of varying front wear-ring clearances on the external performance characteristics of a semi-open centrifugal pump, concluding that pump performance (head and efficiency) is negatively correlated with radial wear-ring clearance. Zhu et al. [11] discovered that as the back wear-ring clearance width increases, pump hydraulic performance deteriorates, while the axial force progressively increases, shifting from negative to positive.
Back wear ring deterioration directly alters the sealing clearance, causing flow instabilities within the pump. This not only compromises overall operational efficiency and performance stability, but also significantly impacts the pump’s dynamic characteristics [12]. Isaev [13] found that increasing the wear-ring clearance raises internal flow velocity, induces asymmetric impeller loading, and, consequently, increases axial force. Will et al. [14] studied the radial pressure distribution on the impeller and the associated internal flow characteristics both with and without wear-ring clearance. Cai et al. [15] investigated the impact of groove diameters in sealing rings on centrifugal pump performance. Their study demonstrated that a groove diameter of 0.2 mm in the surface geometry yielded the lowest leakage rate, maximum volumetric efficiency, and thereby optimal sealing performance. Liu [16] computed the unsteady pressure distribution within the front wear ring gap, revealing that pressure fluctuations weaken and average pressure decreases as the clearance enlarges.
In summary, current research on wear-ring clearance variations in centrifugal pumps remains predominantly focused on operational characteristics and internal flow changes, with investigations into its impact on pump noise being scarce. Furthermore, most existing studies concentrate on the front wear ring, while research concerning the back wear ring is virtually non-existent. Therefore, this study employs Computational Fluid Dynamics (CFD) coupled with the Acoustic Finite Element Method (FEM) to investigate the single-stage centrifugal pump. It aims to systematically explore the effect of back wear-ring clearance variations on pump performance, pressure pulsation, flow field distribution, and noise characteristics. The findings are intended to provide a theoretical foundation for the design optimization of centrifugal pumps.

2. Research Model and Methods

2.1. Research Model

The research model was based on a vertical single-stage centrifugal pump whose design flow rate, head, speed, and number of blades were Qopt = 25 m3/h, H = 34 m, n = 2950 r/min, and 6, respectively. To ensure the stability of the internal flow field of the centrifugal pump, an inlet extension section with four times the diameter is added. The assembly diagram of the full-flow field calculation model is shown in Figure 1, which includes six parts: Suction chamber, leakage flow path, impeller, volute, inlet pipe, and outlet pipe.
With the back wear ring as the research subject, this study investigates variations in internal flow characteristics and noise within the centrifugal pump across four clearance schemes (b = 0.15 mm, 0.45 mm, 0.75 mm, and 1.05 mm). Local details of the schemes are shown in Figure 2. This coverage captures wear progression from new (0.15 mm) to end-of-life (1.05 mm) states according to the practical application.

2.2. Grid Generation

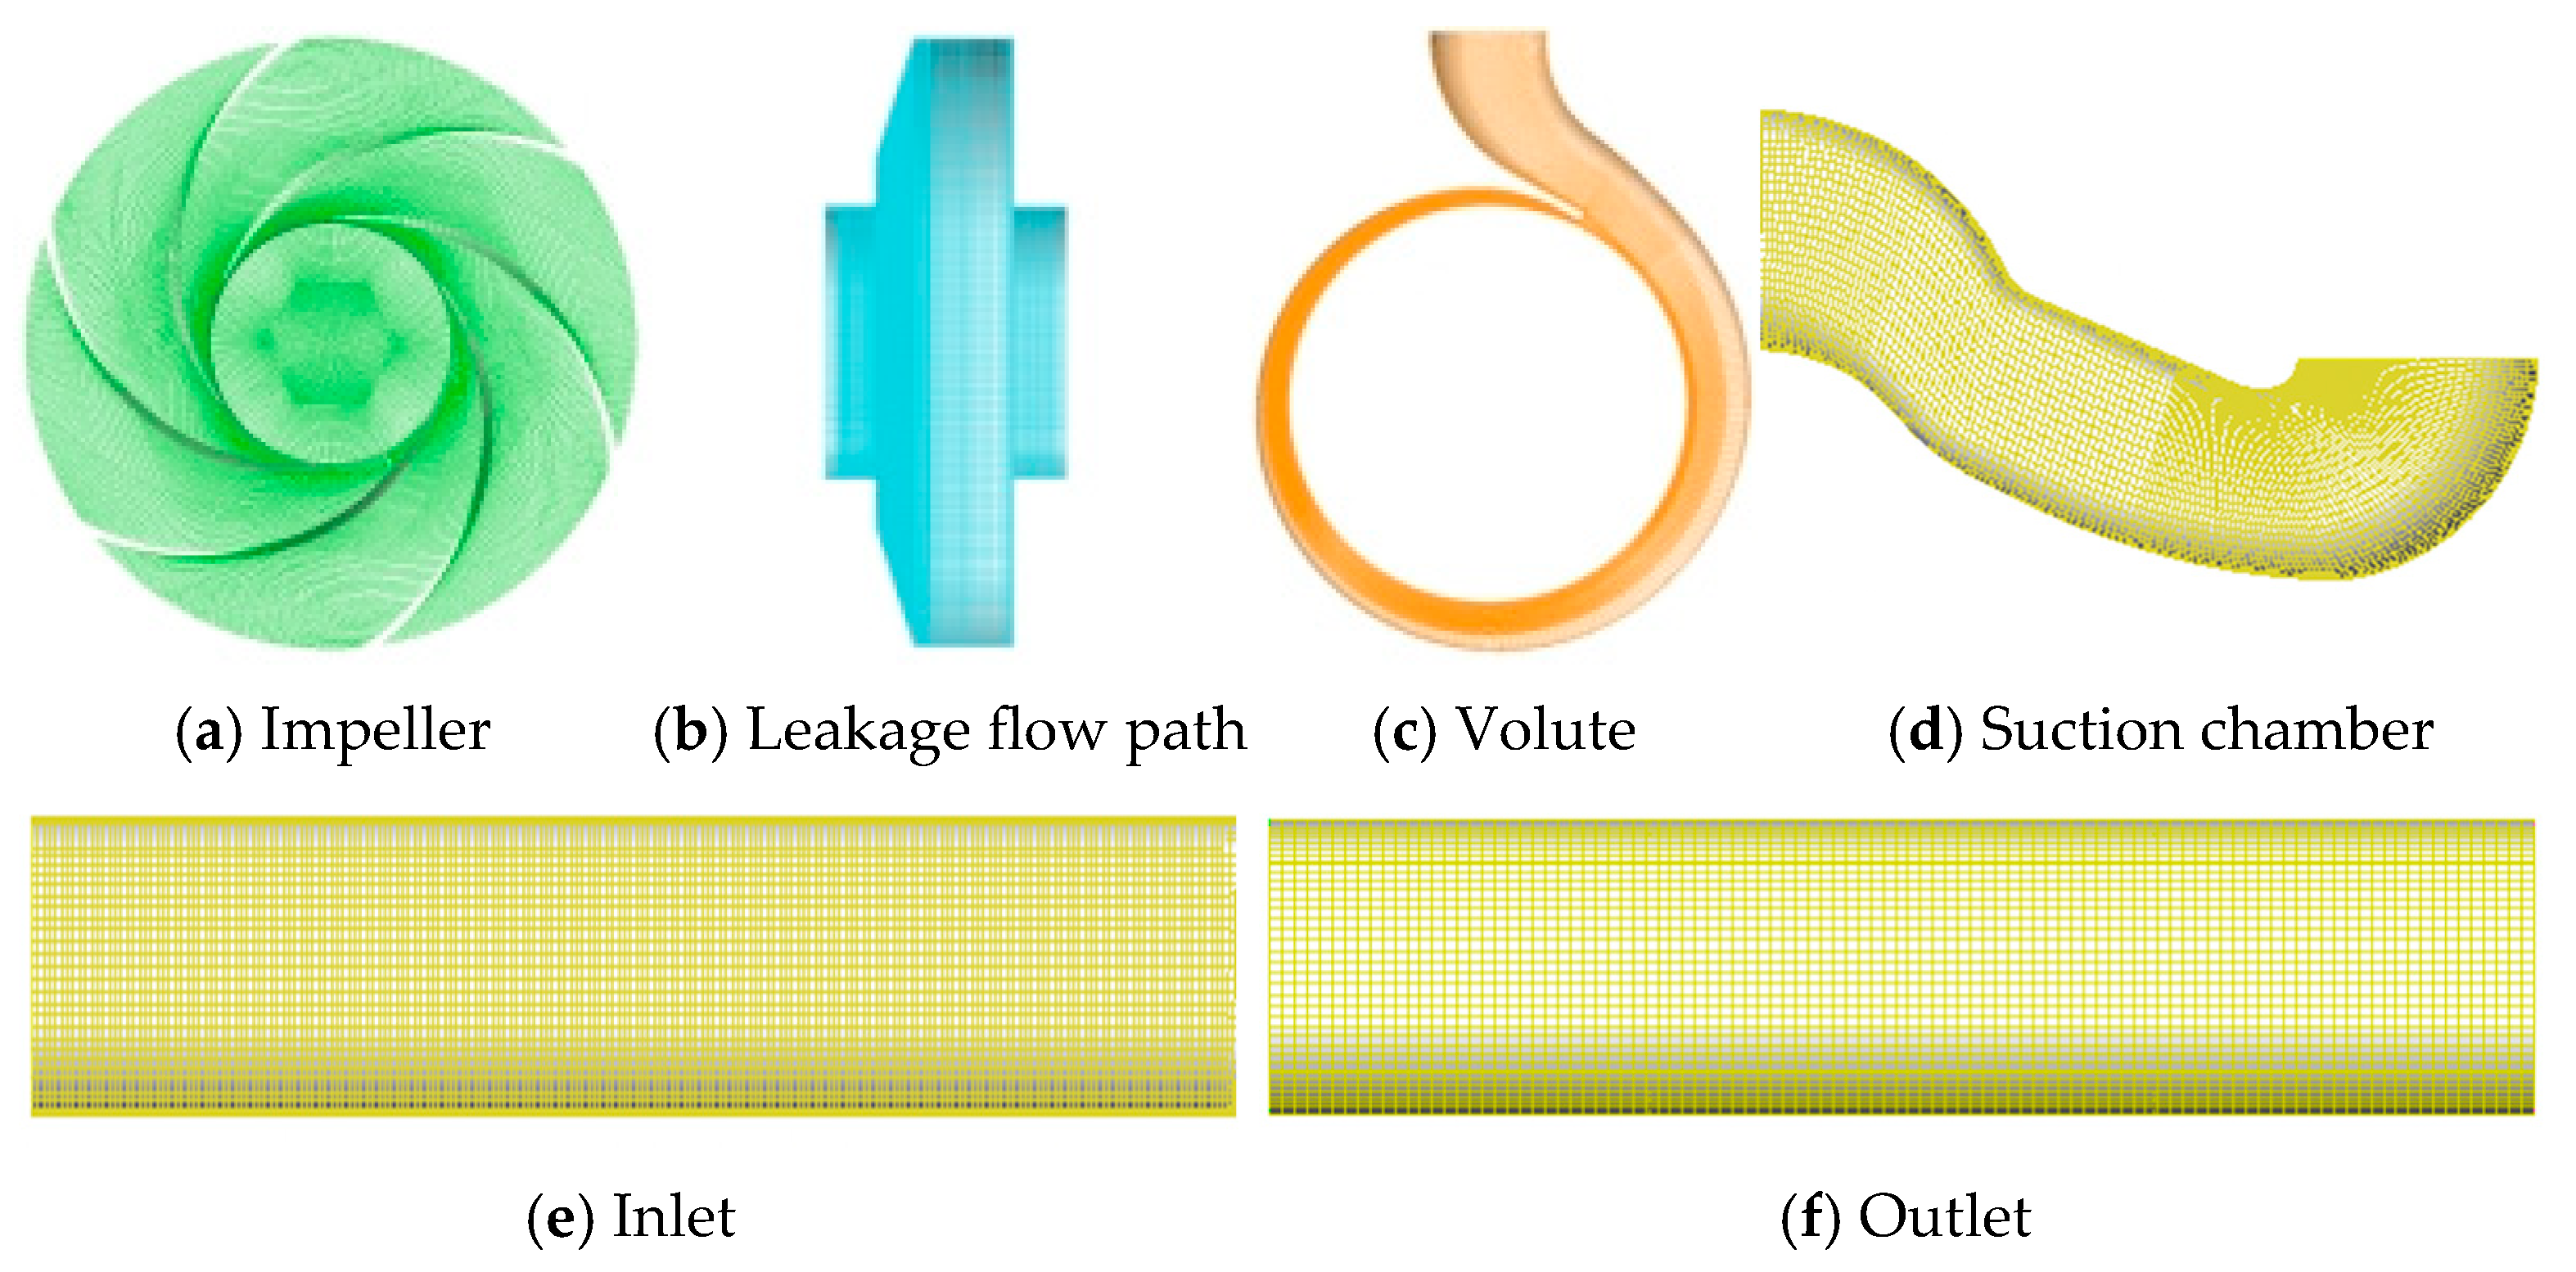
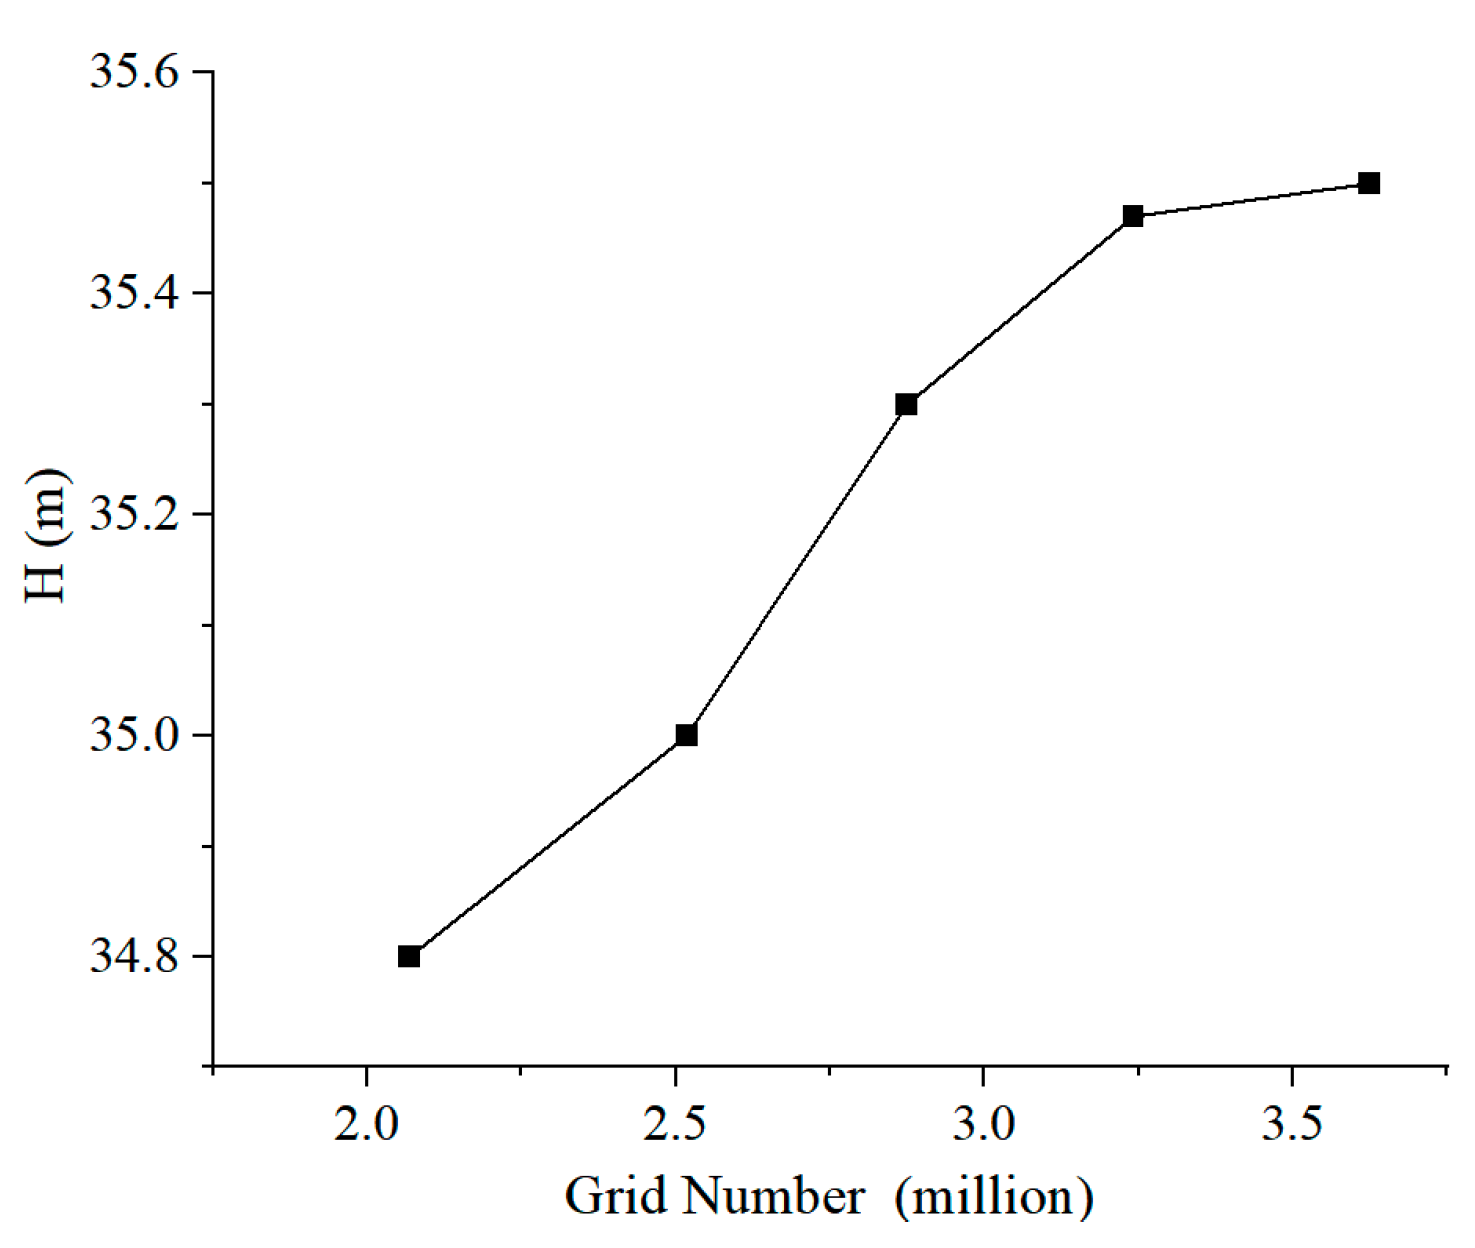
To improve the grid quality at narrow clearances, the hexahedral block mesh technique with higher computational accuracy was used to mesh the model pump. Grids of various parts of the entire flow field are shown in Figure 3. To avoid the impact of the grid number on calculation results, the grid dependence was checked, and the criterion is that the change in head prediction is less than 1%. The results were shown in Figure 4. Considering both computational accuracy and efficiency, a total of 3,241,448 grids and 3,037,928 nodes were ultimately selected.

2.3. Methods for Flow Field Simulation

2.3.1. Turbulence Model

The SST-SAS turbulence model, a scale-adaptive extension of RANS, resolves transient flow structures while reducing grid sensitivity. This model can not only calculate the sound source information in the flow field but also reduce the dependence of the calculation results on grids [17,18]. It adds the QSAS term including the turbulent vortex frequency ω to the SST k- ω equation, shown as follows:
ρ k t + x j ρ U j k = P k ρ c μ k ω + x j μ + μ t σ k k x j
ρ ω t + x j ρ U j ω = α ω k P k ρ β ω 2 + Q S A S + x j μ + μ t σ ω ω x j + 1 F 1 2 ρ σ ω 2 1 ω K x j ω x j
Q S A S = max ρ ξ 2 κ S 2 L L v K 2 C 2 ρ k σ ϕ max 1 ω 2 ω x j ω x j , 1 k 2 k x j k x j , 0
where ρ is the fluid density, kg/m3; k is the turbulent kinetic energy, m2/s2; Pk is the turbulent kinetic energy production term, kg/(m·s3). ω is the turbulent vortex frequency, rad/s; μ is the dynamic viscosity, Pa·s; μt is the turbulent viscosity, Pa·s. QSAS is the scale-adaptive simulation source term, kg/(m·s4); S is the strain rate tensor magnitude, s−1; and L is the turbulence length scale, m.

2.3.2. Boundary Conditions

The inlet boundary condition is pressure inlet, and the outlet boundary condition is flowrate outlet. The wall surface is non-slip with 50 μm roughness. Except for the rotating domain of the impeller water body, the rest are stationary domains. In steady-state calculations, the interface between the dynamic and static components is set as the frozen rotor interface, while the interface type is the transient rotor in unsteady calculations. In the unsteady numerical calculation, the time step is set to ∆t = 0.000113 s, which means that the flow field calculation results are obtained for every 2° rotation of the impeller. To ensure the accuracy of the simulation results, a total of ten revolutions were calculated, and the results of the last two revolutions were extracted for analysis.

2.3.3. RMS of Pressure Pulsations

The root mean square (RMS) of pressure pulsations serves as a key indicator for assessing the overall intensity or energy of a signal. In fluid dynamics, it directly reflects the fluctuation intensity at monitoring points. By calculating the RMS value of pressure pulsation signals, the instability level of flow fields under varying operating conditions can be quantitatively compared [19]. The RMS pressure pulsation is computed as follows:
R M S = i = 1 N ( P i P ¯ ) 2 1 2 ρ u 2
where Pi = instantaneous pressure at the grid node at time step I, Pa; P ¯ = mean pressure at the grid node over the analyzed period, Pa; N = number of computational steps per cycle; and ρ = fluid density, kg/m3.

2.3.4. Pressure Pulsation Coefficient

To clarify the relationship between frequency distribution and characteristic frequencies, the abscissa is expressed as multiples of the blade passing frequency f/fp, where f is the frequency from Fourier analysis and fp denotes the blade passing frequency (295 Hz). And the ordinate represents the dimensionless pressure pulsation coefficient Cp, calculated as follows [20]:
C P = P P ¯ 1 2 ρ u 2
where P = Instantaneous pressure at the monitoring point, Pa; P = Mean pressure at the monitoring point over the sampling period, Pa; ρ = Fluid density, kg/m3; and u = Circumferential speed at the impeller outer diameter, m/s.

2.4. Methods for Flow Noise Simulation

2.4.1. Acoustic Grid Division

To accurately map the flow field data to the acoustic grid, the size of the acoustic grid needs to meet the following relationship:
L c 6 f m a x
where fmax is the maximum calculated frequency, Hz; c is the propagation speed of sound in the medium, m/s; and L is the unit length of the grid, m.
The maximum frequency range for acoustic calculation in this article is 1000 Hz, and the sound speed in water is 1500 m/s. Therefore, the maximum acoustic grid size that can be calculated should be less than 0.25 m. Considering both model size and computational efficiency, the maximum acoustic grid size is 7 mm and the grid number is approximately 450 thousand.

2.4.2. Acoustic Simulation Theory

The Lighthill acoustic analogy method is the theoretical basis for solving the sound field; Lighthill rewrote the Navier–Stokes equation in the form of the wave equation, and separated the sound source term and the sound propagation term. The most common expression of Lighthill analogy equations is shown below [21,22]:
2 t 2 ρ ρ 0 c 0 2 2 ρ ρ 0 = 2 T i j x i x j
T i j = ρ v i v j + p p 0 c 0 2 ρ ρ 0 δ i j σ i j
where Tij is Lighthill stress tensor; δij is Kronecker function; ρ is fluid density; ρ0 is fluid density when undisturbed; p is the pressure of the fluid; p0 is the pressure of the fluid when undisturbed; and c0 is the sound speed.
The Finite Element Method (FEM) has certain advantages in calculating the sound field inside complex-shaped cavities and simulating low-frequency pulsations, making it more suitable for calculating hydraulic noise in narrow clearance in centrifugal pumps [23]. Therefore, the acoustic finite element method was employed to solve the Helmholtz wave equation describing sound propagation. The specific equation is as follows:
2 P x , y , z + k 2 P x , y , z = 0
where 2 denotes the Laplace operator; P represents the total sound pressure at a given point; and k = ω/c is the wavenumber, with ω being the angular frequency and c the speed of sound.

2.4.3. Sound Power Level

Proudman [24] derived the acoustic energy formula generated by isotropic turbulence based on the Lighthill acoustic analogy method, which is used to evaluate the strength distribution of spatial sound sources. Lilly [25] solved the problem of the delay time difference neglected in the derivation of Proudman and derived the sound power generated in unit volume from isotropic turbulence. The sound power equation is provided as follows:
P A = α ρ 0 u 3 l u 5 c 5
The equation can be rewritten to include k (the turbulent kinetic energy) and ε (the turbulent energy dissipation rate), as follows:
P A = α ε ρ 0 ε M t 5
M t = 2 k c
where α is a constant related to the shape of the longitudinal velocity correlation, and αε is taken as 0.1; ρ is the fluid density; c is the speed of sound; l is the turbulence scale; and u is the turbulent velocity.
Sound power level (SWL) is a relative measure of sound power and reference sound power, which is used to describe the intensity of the sound source and is an important indicator for measuring the level of noise inside a pump, defined as follows:
S W L = 10 log 10 W A W r e f
where WA is the measured sound power; and Wref = 10−12 W is the reference sound power.

2.4.4. Sound Pressure Level

In underwater acoustic measurements, sound pressure is commonly converted to Sound Pressure Level (SPL) for analysis. The calculation formula is as follows:
S P L = 20 lg P P 0
where P is the root-mean-square (RMS) value of sound pressure in Pa; and P 0 is the reference sound pressure, taken as 1 × 10⁻⁶ Pa in water.
The Overall Sound Pressure Level (OSPL) reflects the total noise intensity, calculated as follows:
O S P L = 10 lg f f 0 f m a x 10 0.1 L p
where f is the frequency resolution (minimum bin width) in Hz; f 0 and f m a x denote the lower and upper frequency limits of the analysis band; and L p represents the sound pressure level in dB at frequency f.

2.5. Experimental Verification

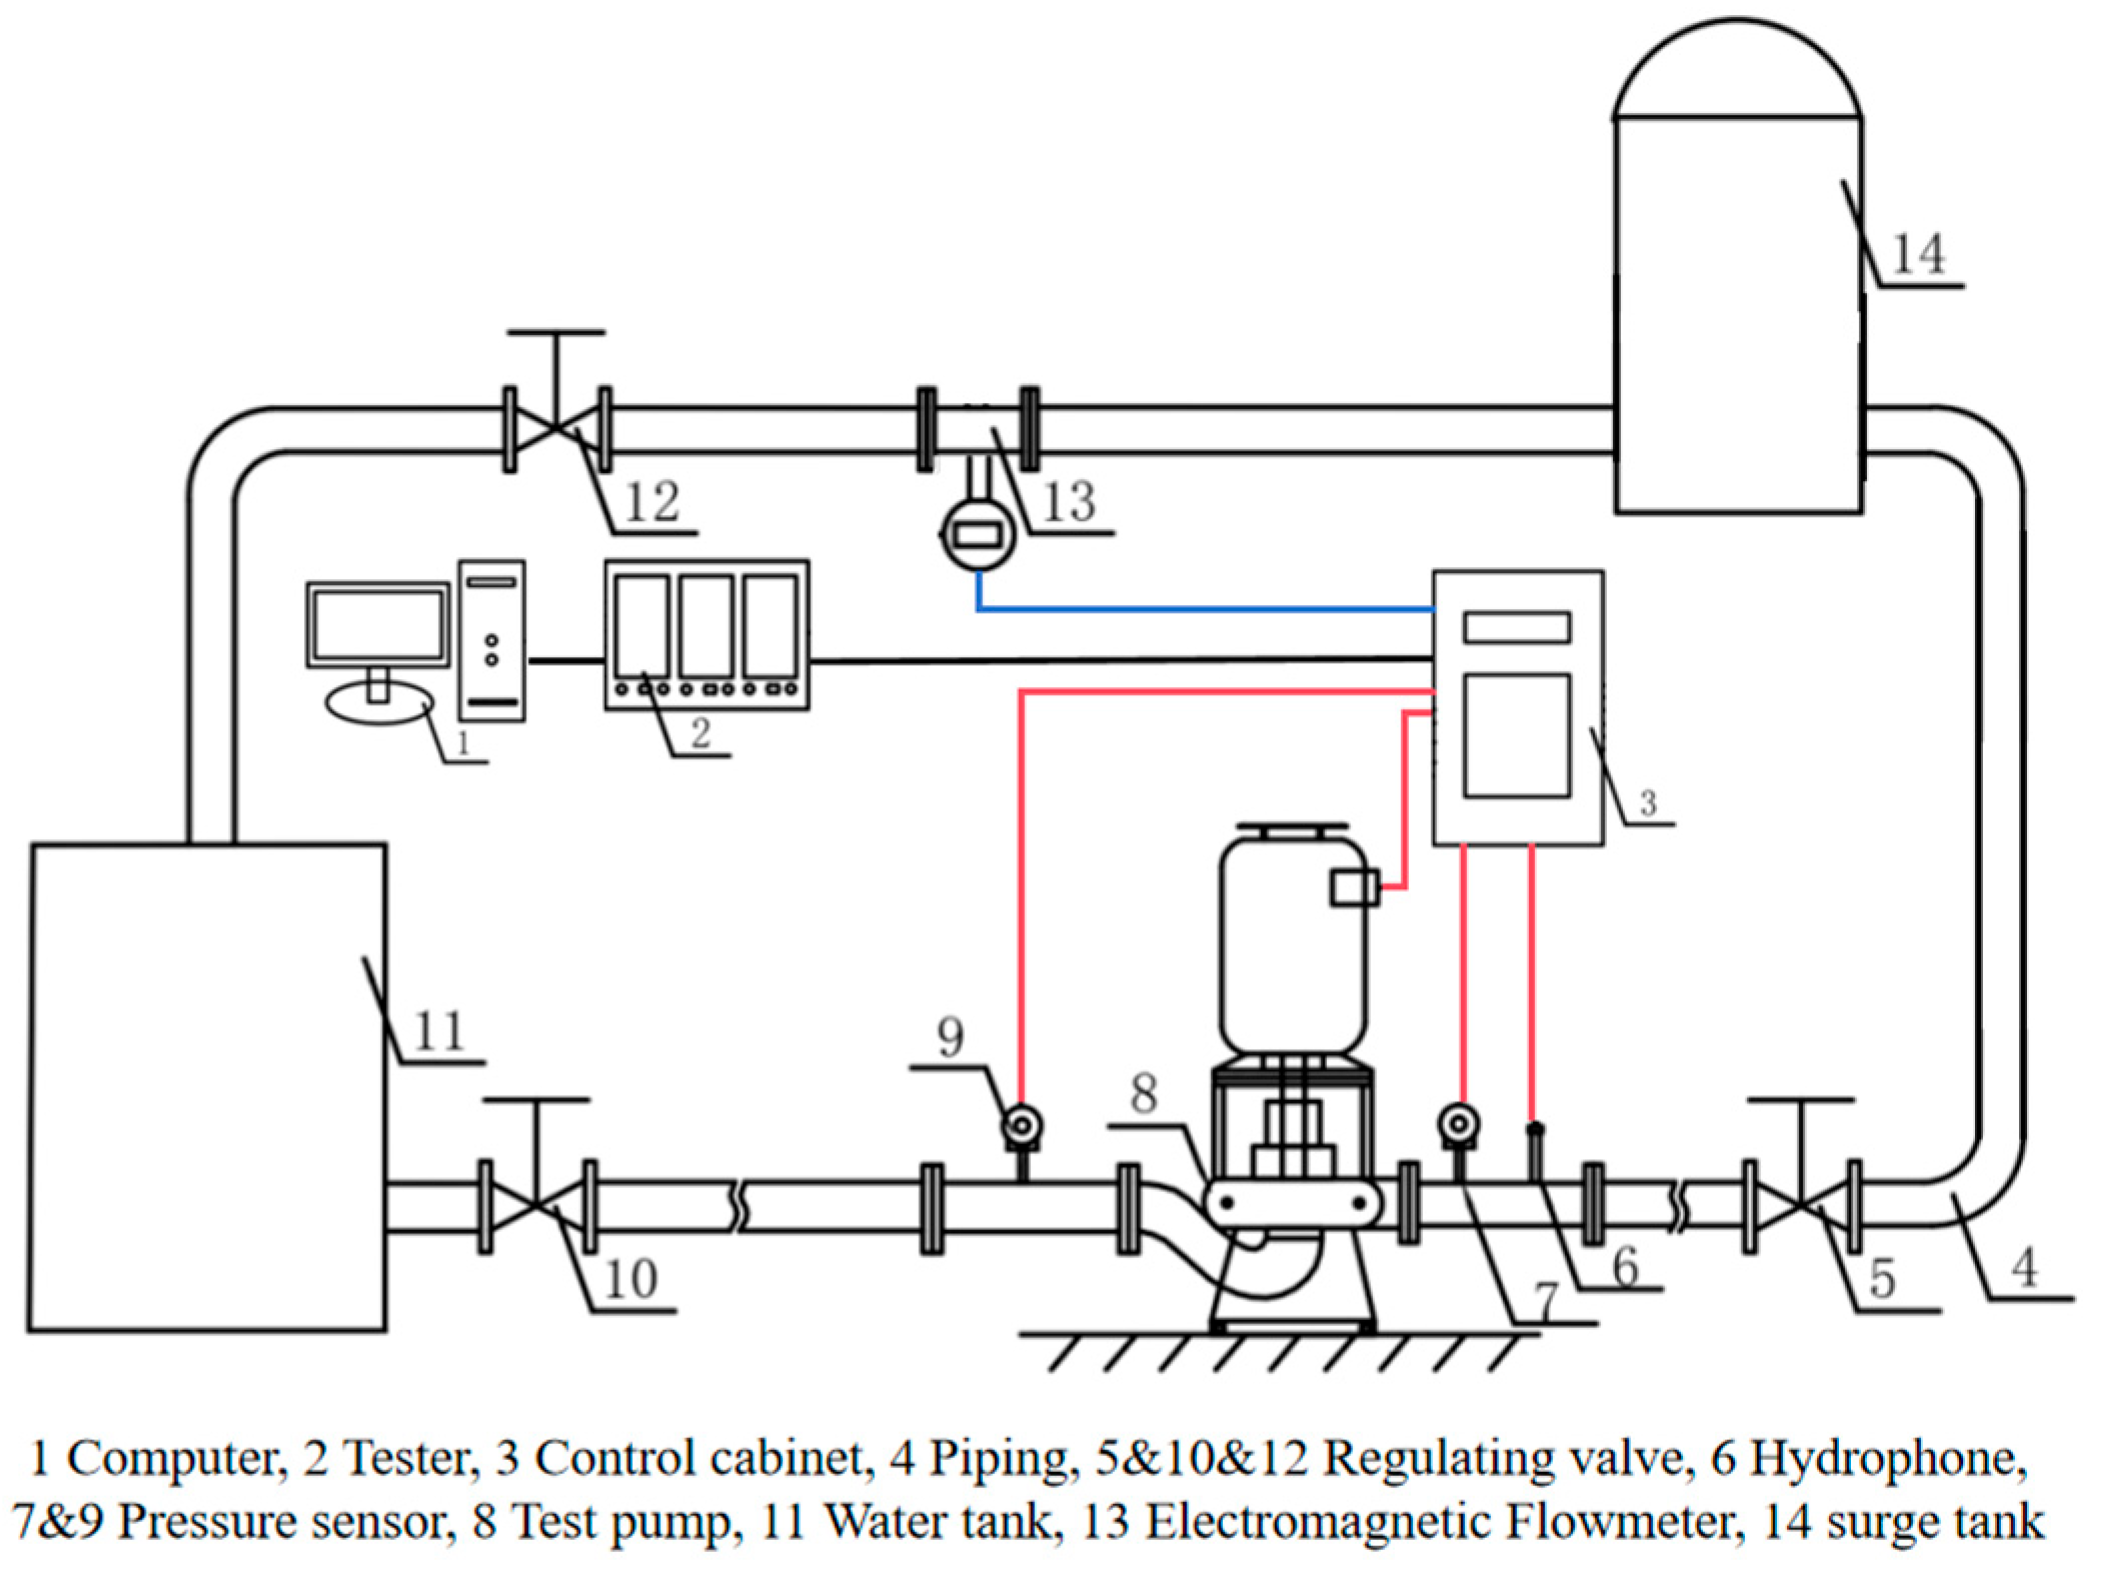
To validate the reliability of the simulation results, performance tests and internal flow-induced noise experiments were conducted for the case with a back wear-ring clearance of 0.15 mm. The test rig consisted of a model pump, piping system, computer system, measurement system, and water tank, as detailed in Figure 5.
Flow rate was controlled by a regulating valve installed downstream of the outlet pipe and measured using a flow meter. A DXLD-50 electromagnetic flow meter was selected for measurement in the test pipeline. MEA3000 pressure transducers were employed to acquire pressure data at both the pump inlet and outlet. Flow-induced noise at the pump discharge was measured using an RHSA-10 hydrophone, which was flush-mounted to the pipe wall at a location four pipe diameters downstream of the pump outlet. The relevant instrument parameters are shown in Table 1.

3. Flow Field Results and Discussion

3.1. CFD Method Validation

In the global analysis and comparison of the energy performance curves of the numerical simulation and test results, head coefficient KH was used. The calculation formula is as follows:
K H = g H / ( n 2 D 2 )
where H is the head of the pump device; n is the rated speed of the impeller; D is the nominal diameter of the impeller; and g is the acceleration of gravity.
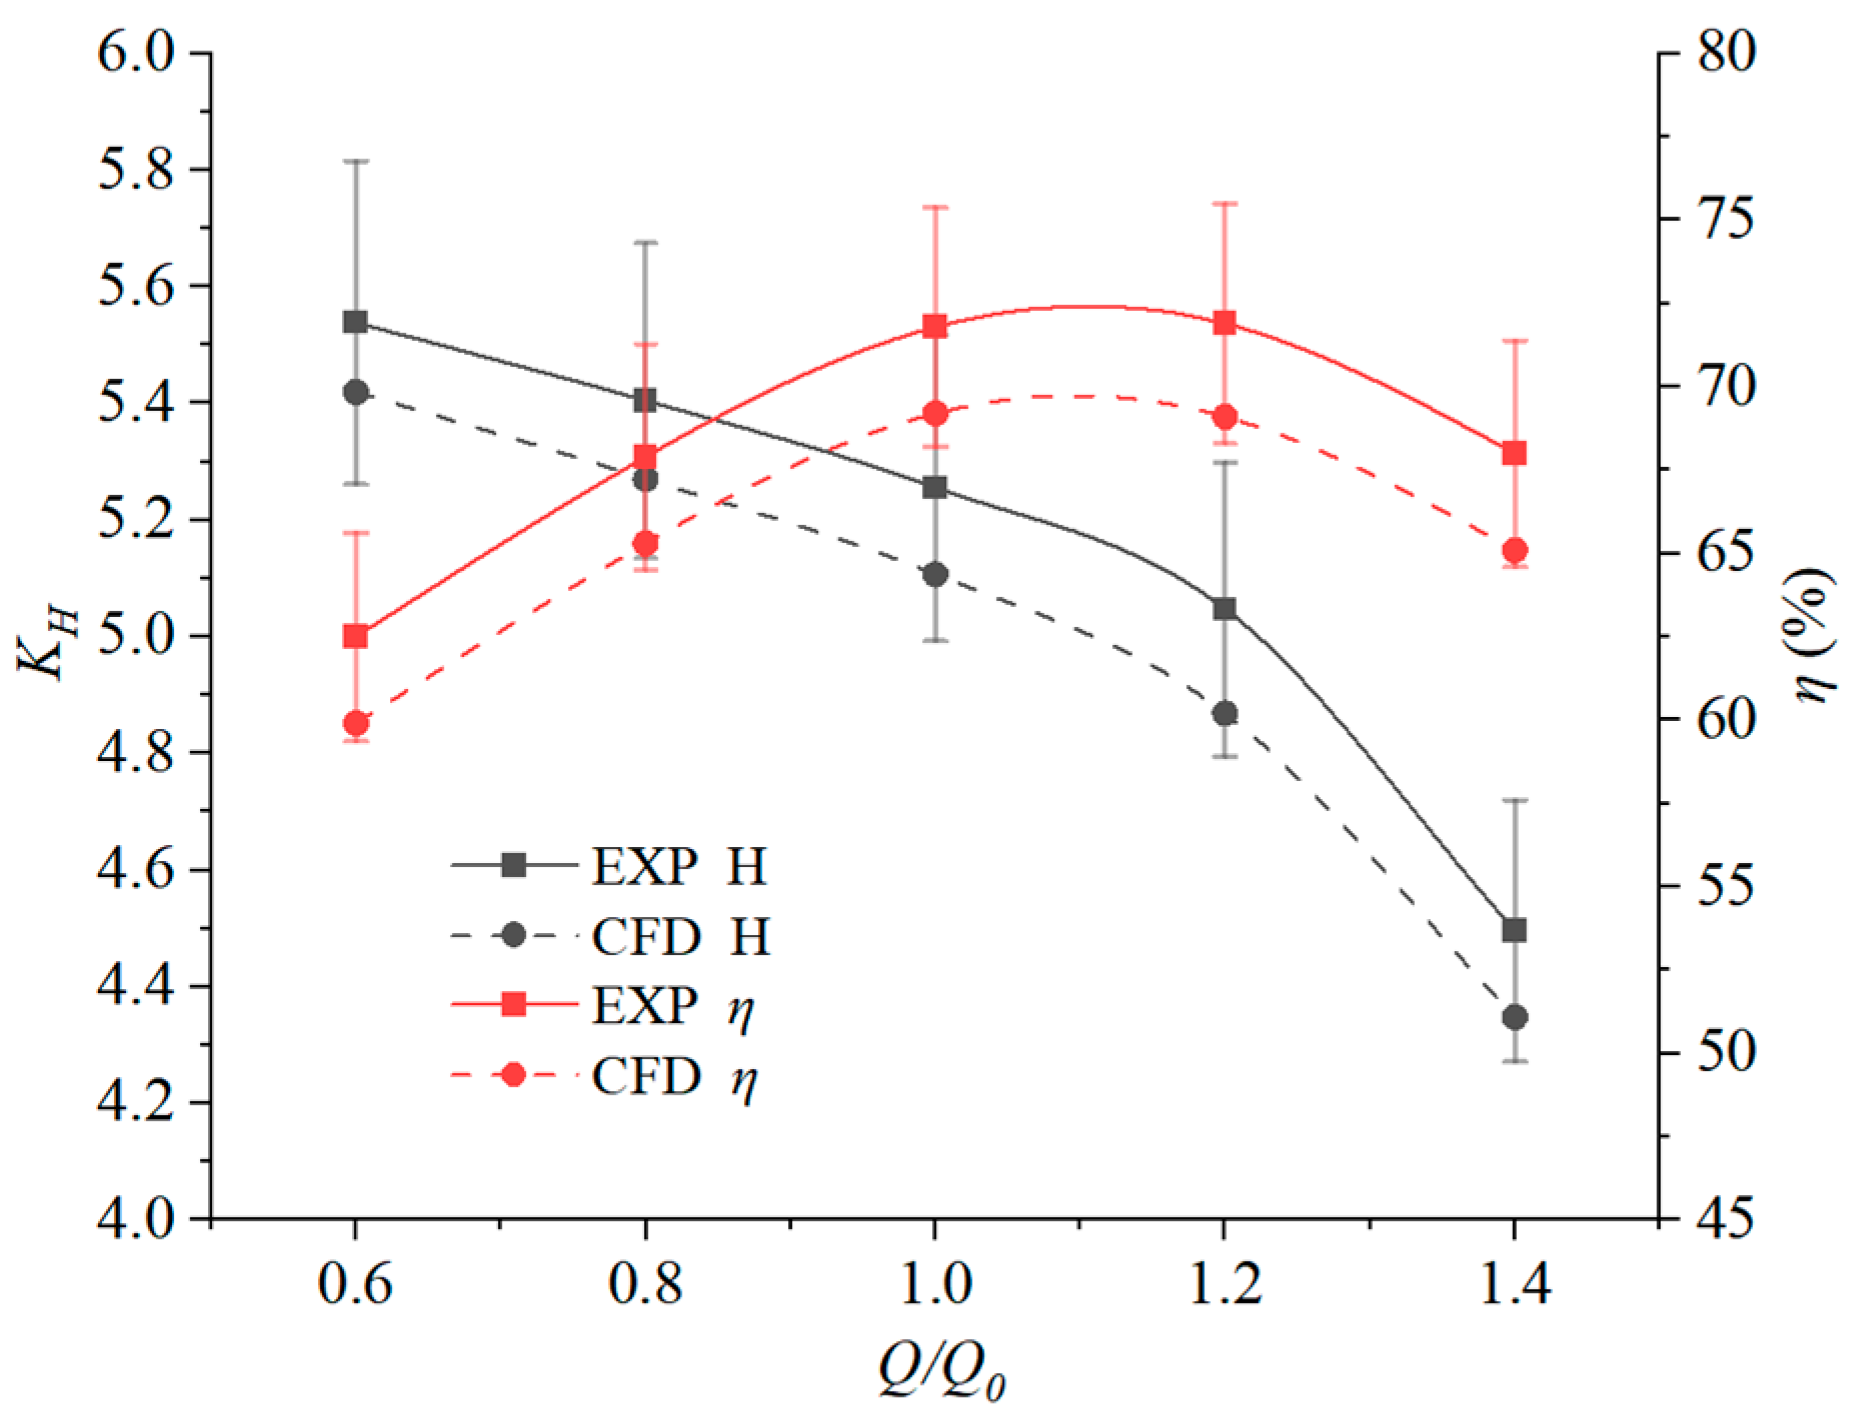
The accuracy of the numerical simulation results of the flow field inside the experimental pump is the basis of sound field calculation. External characteristic tests were conducted on the scheme with a back wear-ring clearance of 0.15 mm to verify the reliability of the simulation. Five operating conditions (0.6Q0, 0.8Q0, 1.0Q0, 1.2Q0, and 1.4Q0) were calculated and tested, and the external characteristic curves of head and efficiency were compared, as shown in Figure 6. As shown in the Figure, the calculated values of head and efficiency are in good agreement with the experimental values, with maximum errors not exceeding 5% [16,17]. This indicates that the numerical calculation model and method used in this article can accurately predict the external characteristics of the centrifugal pump.
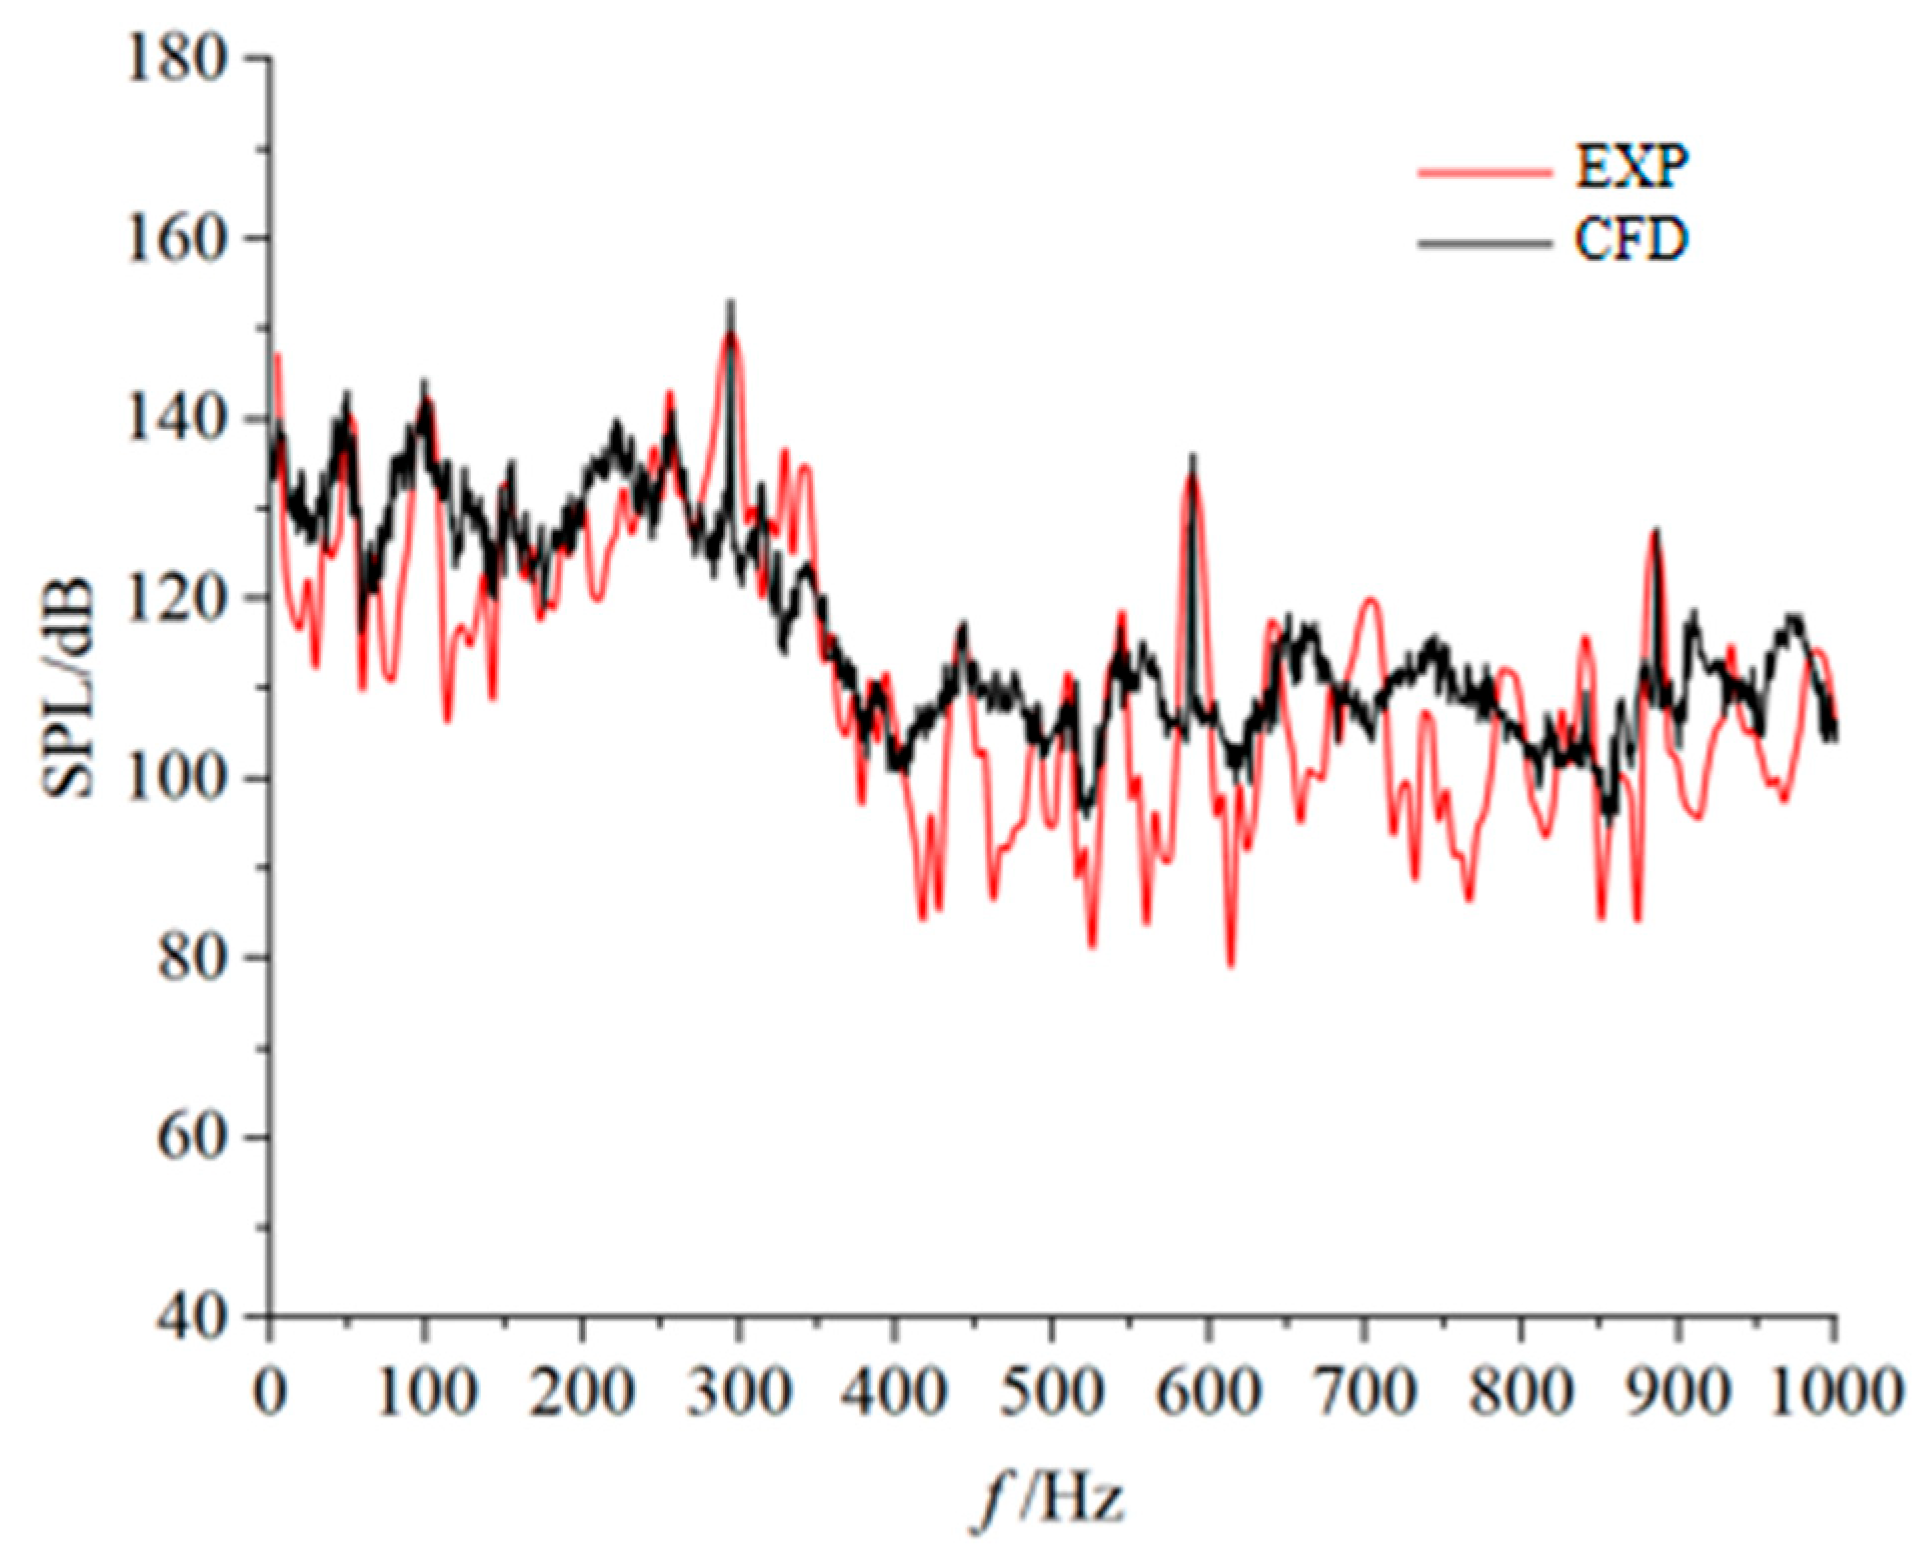
Figure 7 compares the broadband noise spectra from simulations and experimental measurements at the pump outlet. The graph demonstrates close agreement between simulated and experimental results across the entire frequency band, with characteristic frequencies aligning well. The measured and simulated Overall Sound Pressure Levels (OASPL) are 180.1 dB and 172.9 dB, respectively, yielding a 4% error, within a typical range [21,23]. This indicates that the Acoustic Finite Element Method provides accurate noise prediction.

3.2. Energy Performance Analysis

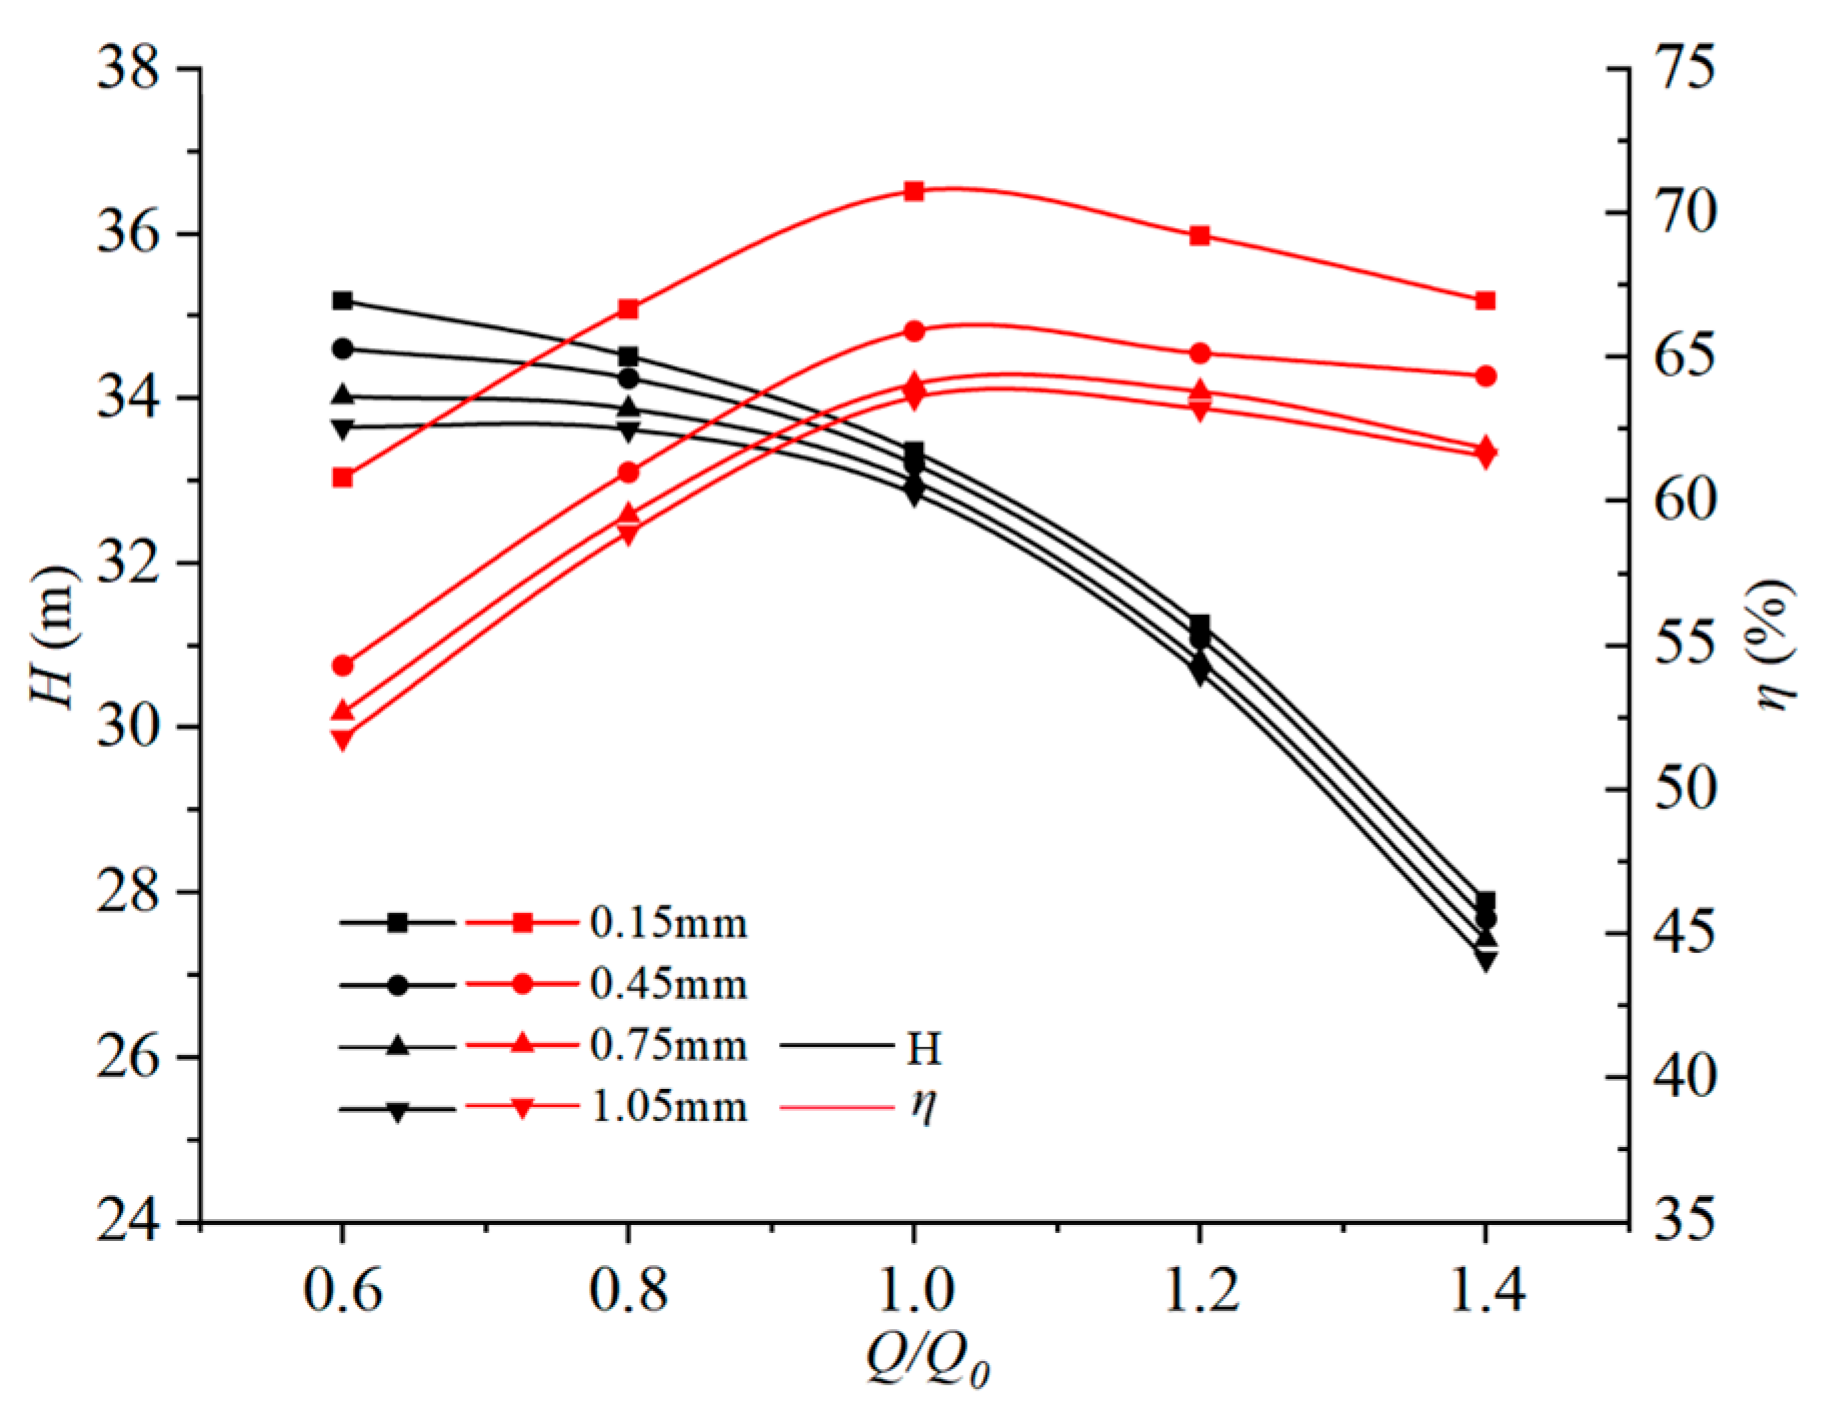
Figure 8 shows the head–efficiency curves as a function of flow rate for the four back wear-ring clearance schemes. The head of the centrifugal pump exhibits an overall decreasing trend with increasing flow rate, with the decline rate transitioning from gradual to accelerated. At the same flow rate, a comparison among different clearance values reveals a consistent decrease in head as clearance increases. The head difference is most pronounced at low flow rates, where a maximum reduction of 4.35% occurs when clearance increases from 0.15 mm to 1.05 mm. This head discrepancy diminishes as flow rate increases. The pump efficiency rises rapidly within the 60–100% BEP (Best Efficiency Point) flow range (0.6Q0–1.0Q0), then gradually declines at higher flows. Efficiency drops noticeably as back wear-ring clearance increases, mainly due to reduced volumetric efficiency resulting from increased leakage. Efficiency variation is substantial when clearance expands from 0.15 mm to 0.45 mm, moderates between 0.45 mm and 0.75 mm, and becomes negligible beyond 0.75 mm. This indicates that back wear-ring clearances exceeding 0.75 mm no longer exert a significant impact on pump efficiency. The relative degradation rate of efficiency accelerates with clearance expansion. Specifically, efficiency declines by 8.2% (0.15 → 0.45 mm), 4.3% (0.45 → 0.75 mm), and 2.3% (0.75 → 1.05 mm), indicating a nonlinear decay pattern where the relative loss per 0.3 mm clearance increment reduces by 47.6% beyond 0.45 mm, which is similar to the results in [9,10].

3.3. Internal Flow Field Analysis

At the design flow rate (Qo = 25 m3/h), Figure 9 displays pressure distribution contours within the model pump under varying back wear-ring clearances. Pressure gradually increases from the impeller inlet to the volute outlet. As clearance increases, the low-pressure region at the impeller inlet expands substantially; six distinct circular high-pressure zones form around the balance holes due to reflux of high-pressure fluid from the impeller outlet through the clearance and balance holes. The pressure gradient in the rear chamber markedly diminishes. When the clearance exceeds 0.75 mm, the low-pressure zone near the impeller hub expands substantially, and a new low-pressure region appears in the front chamber. Concurrently, pressure rises throughout the balancing chamber—enlarged clearance amplifies leakage reflux, causing pressure fluctuations in the rear chamber from flow interference and enhanced diffusion of high-pressure fluid into the balancing chamber.
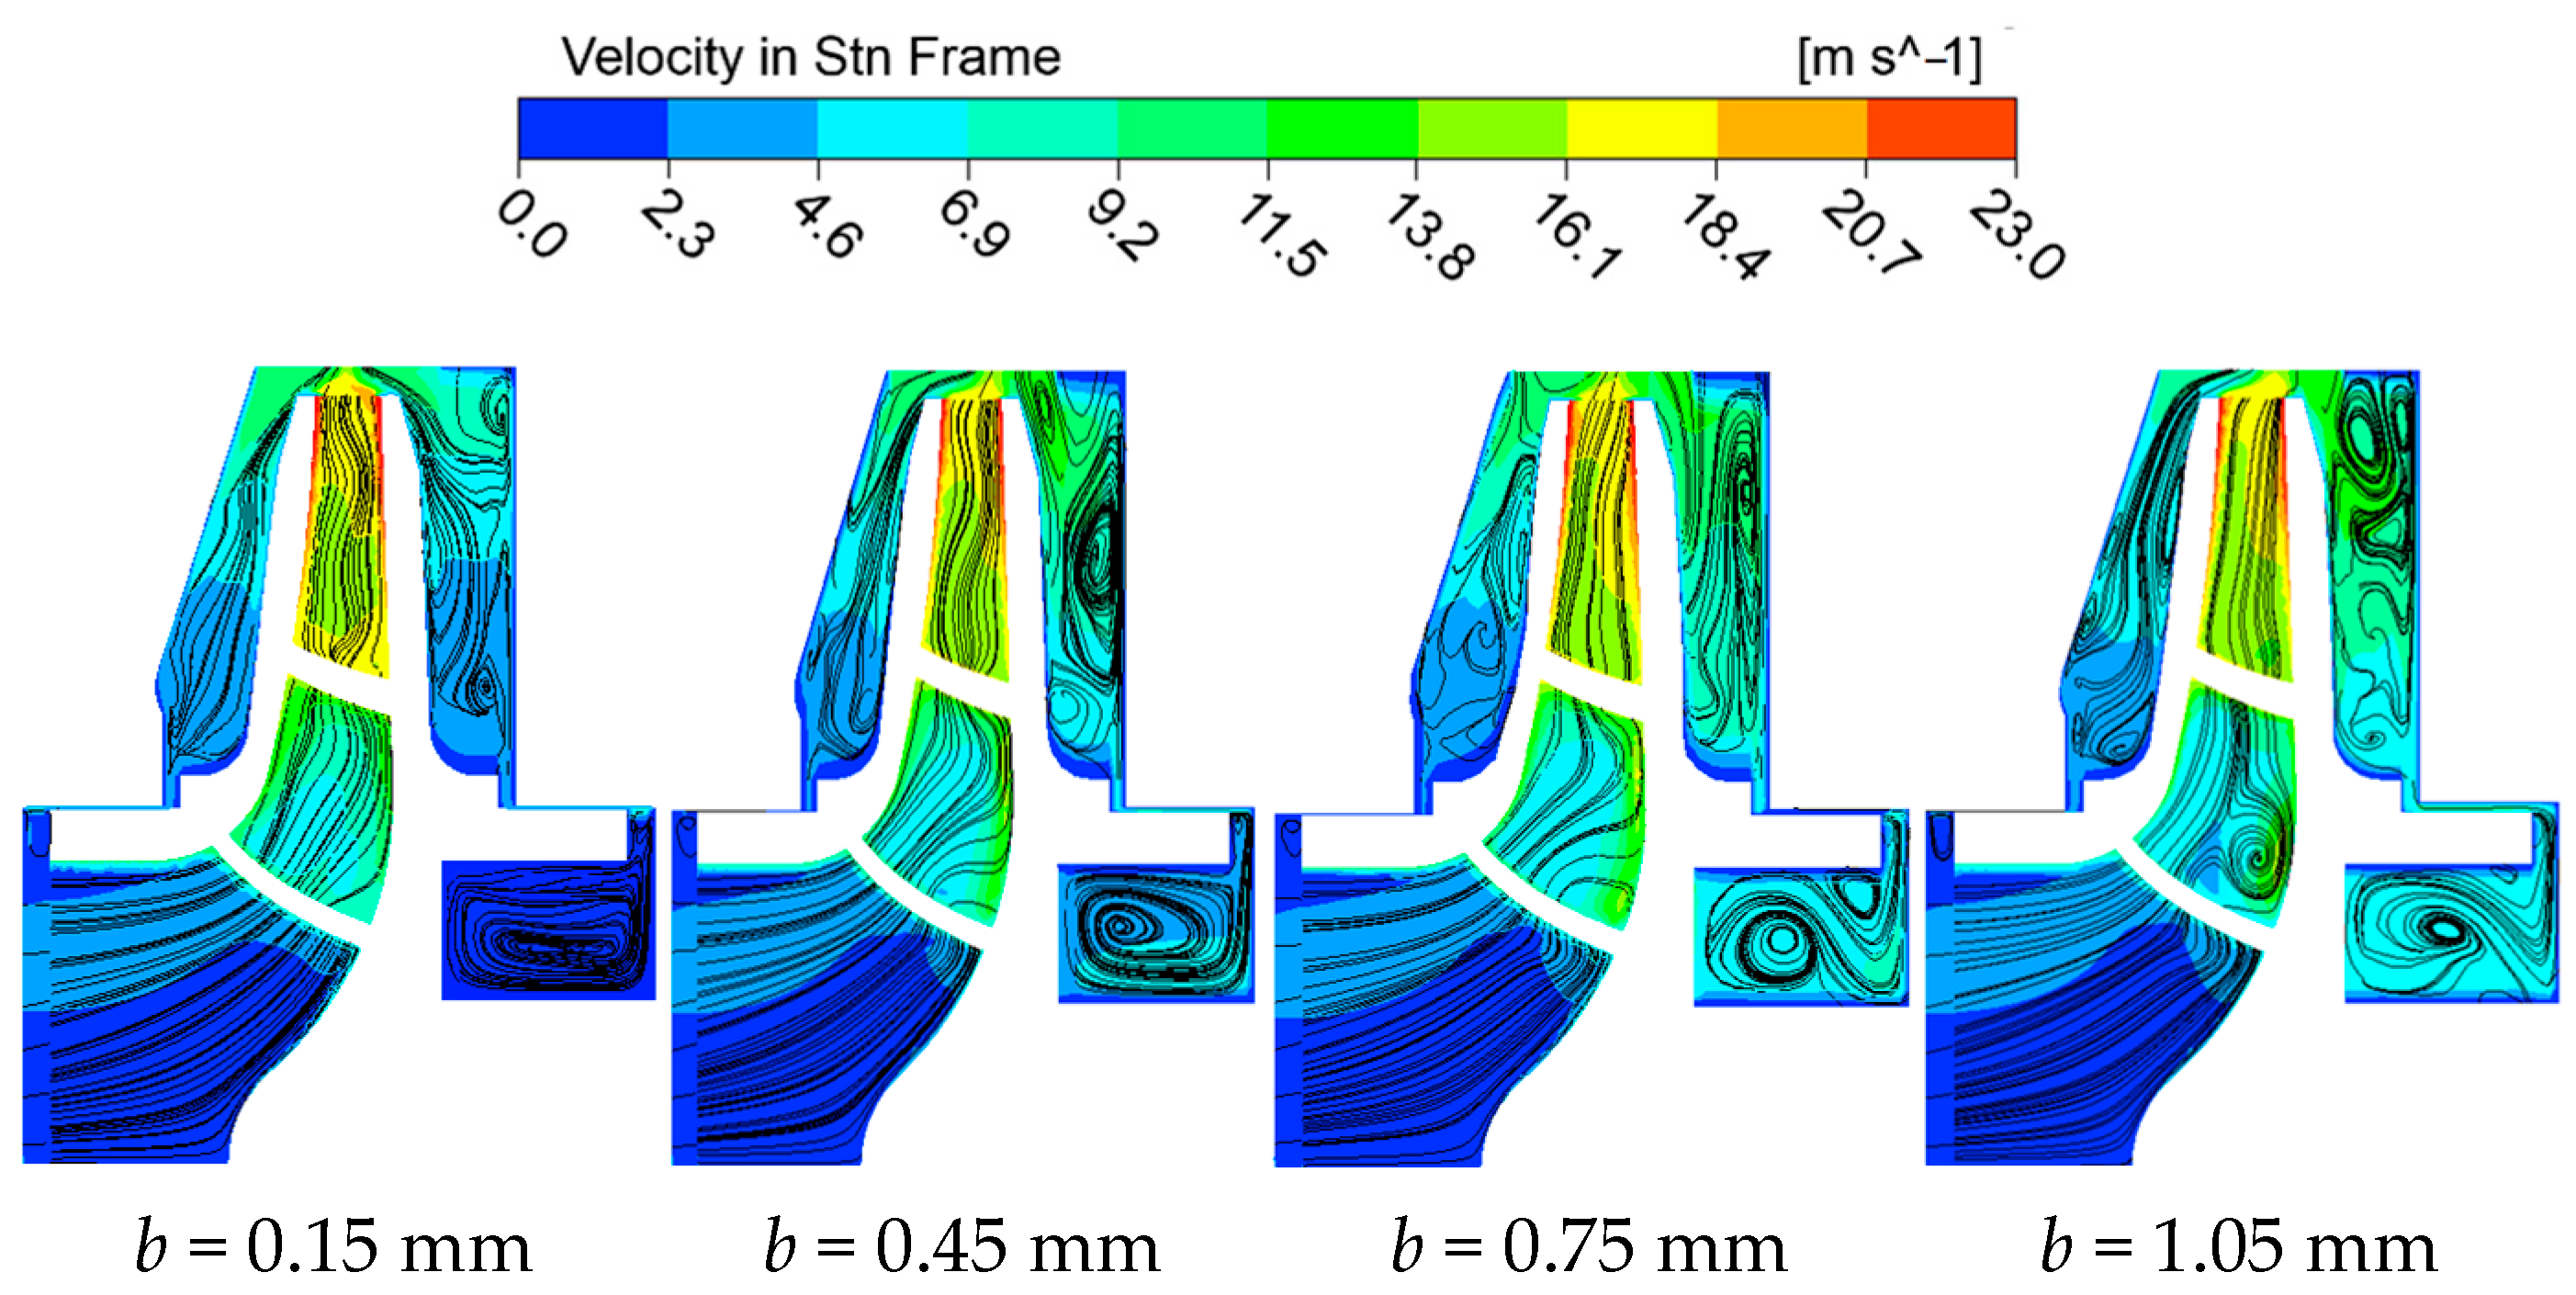
Figure 10 illustrates the velocity streamline distribution on the axial section of the model pump for each clearance scheme. It can be found that enlarged back wear-ring clearance amplifies leakage flow. This significantly elevates flow velocity throughout the rear chamber, particularly near the sealing gap in the rear pump cavity and balancing chamber, while velocities in the front chamber and impeller inlet remain largely unchanged. Meanwhile, although the front chamber flow remains stable, vortex formation becomes more pronounced in the back and balancing chambers, leading to increased flow disorder. Fluid distribution near the impeller hub becomes increasingly nonuniform. When clearance increases from 0.75 mm to 1.05 mm, extensive vortices emerge near the hub. This phenomenon likely stems from amplified recirculation agitation effects caused by increased leakage—part of the fluid passes through the enlarged clearance and balance holes into the impeller, disturbing the primary flow and triggering irregular velocity fluctuations.

3.4. Pressure Pulsation Analysis

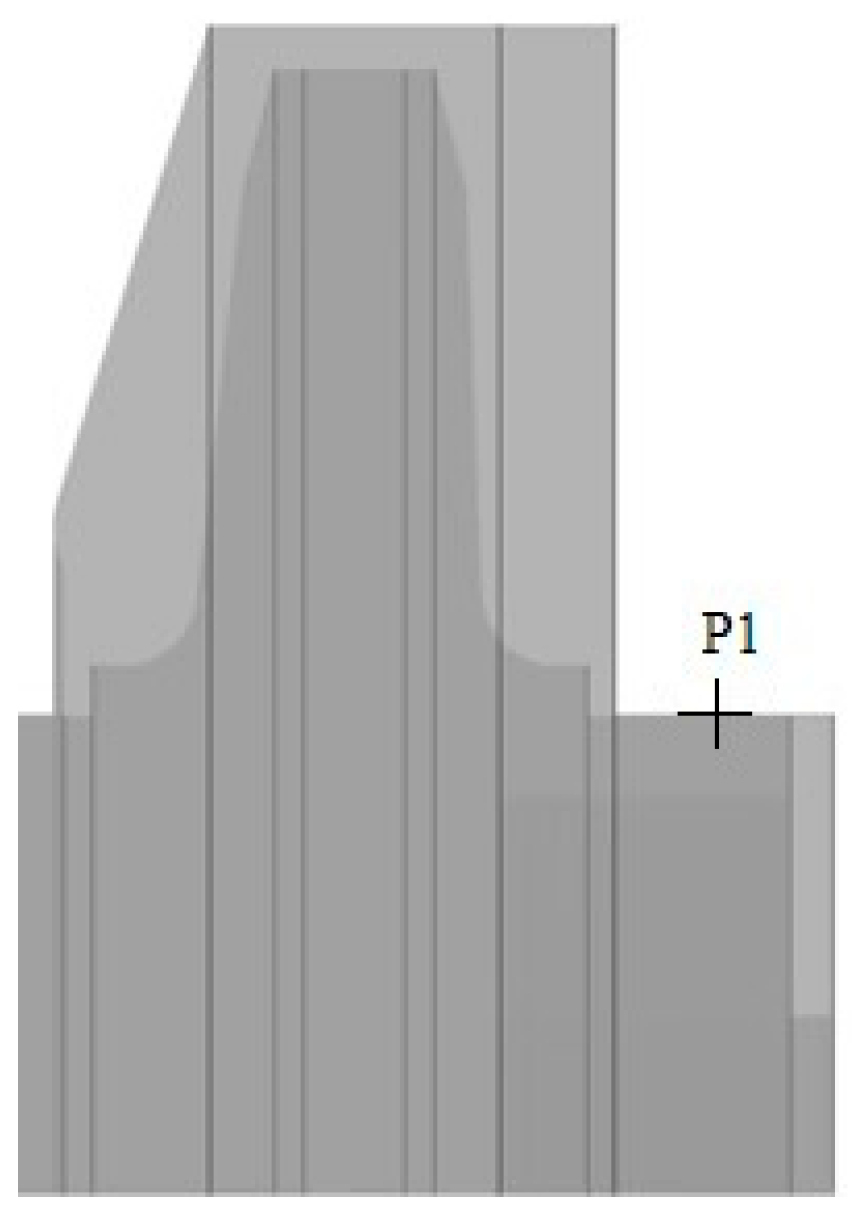
The pressure pulsation in unsteady calculations contains a lot of flow information, and time-domain and frequency-domain analysis of pressure pulsation can serve as a reference for sound field analysis. In order to analyze the unstable flow caused by changes in the back wear-ring clearance, the monitoring point was set up as shown in Figure 11 to monitor the fluid pressure changes.
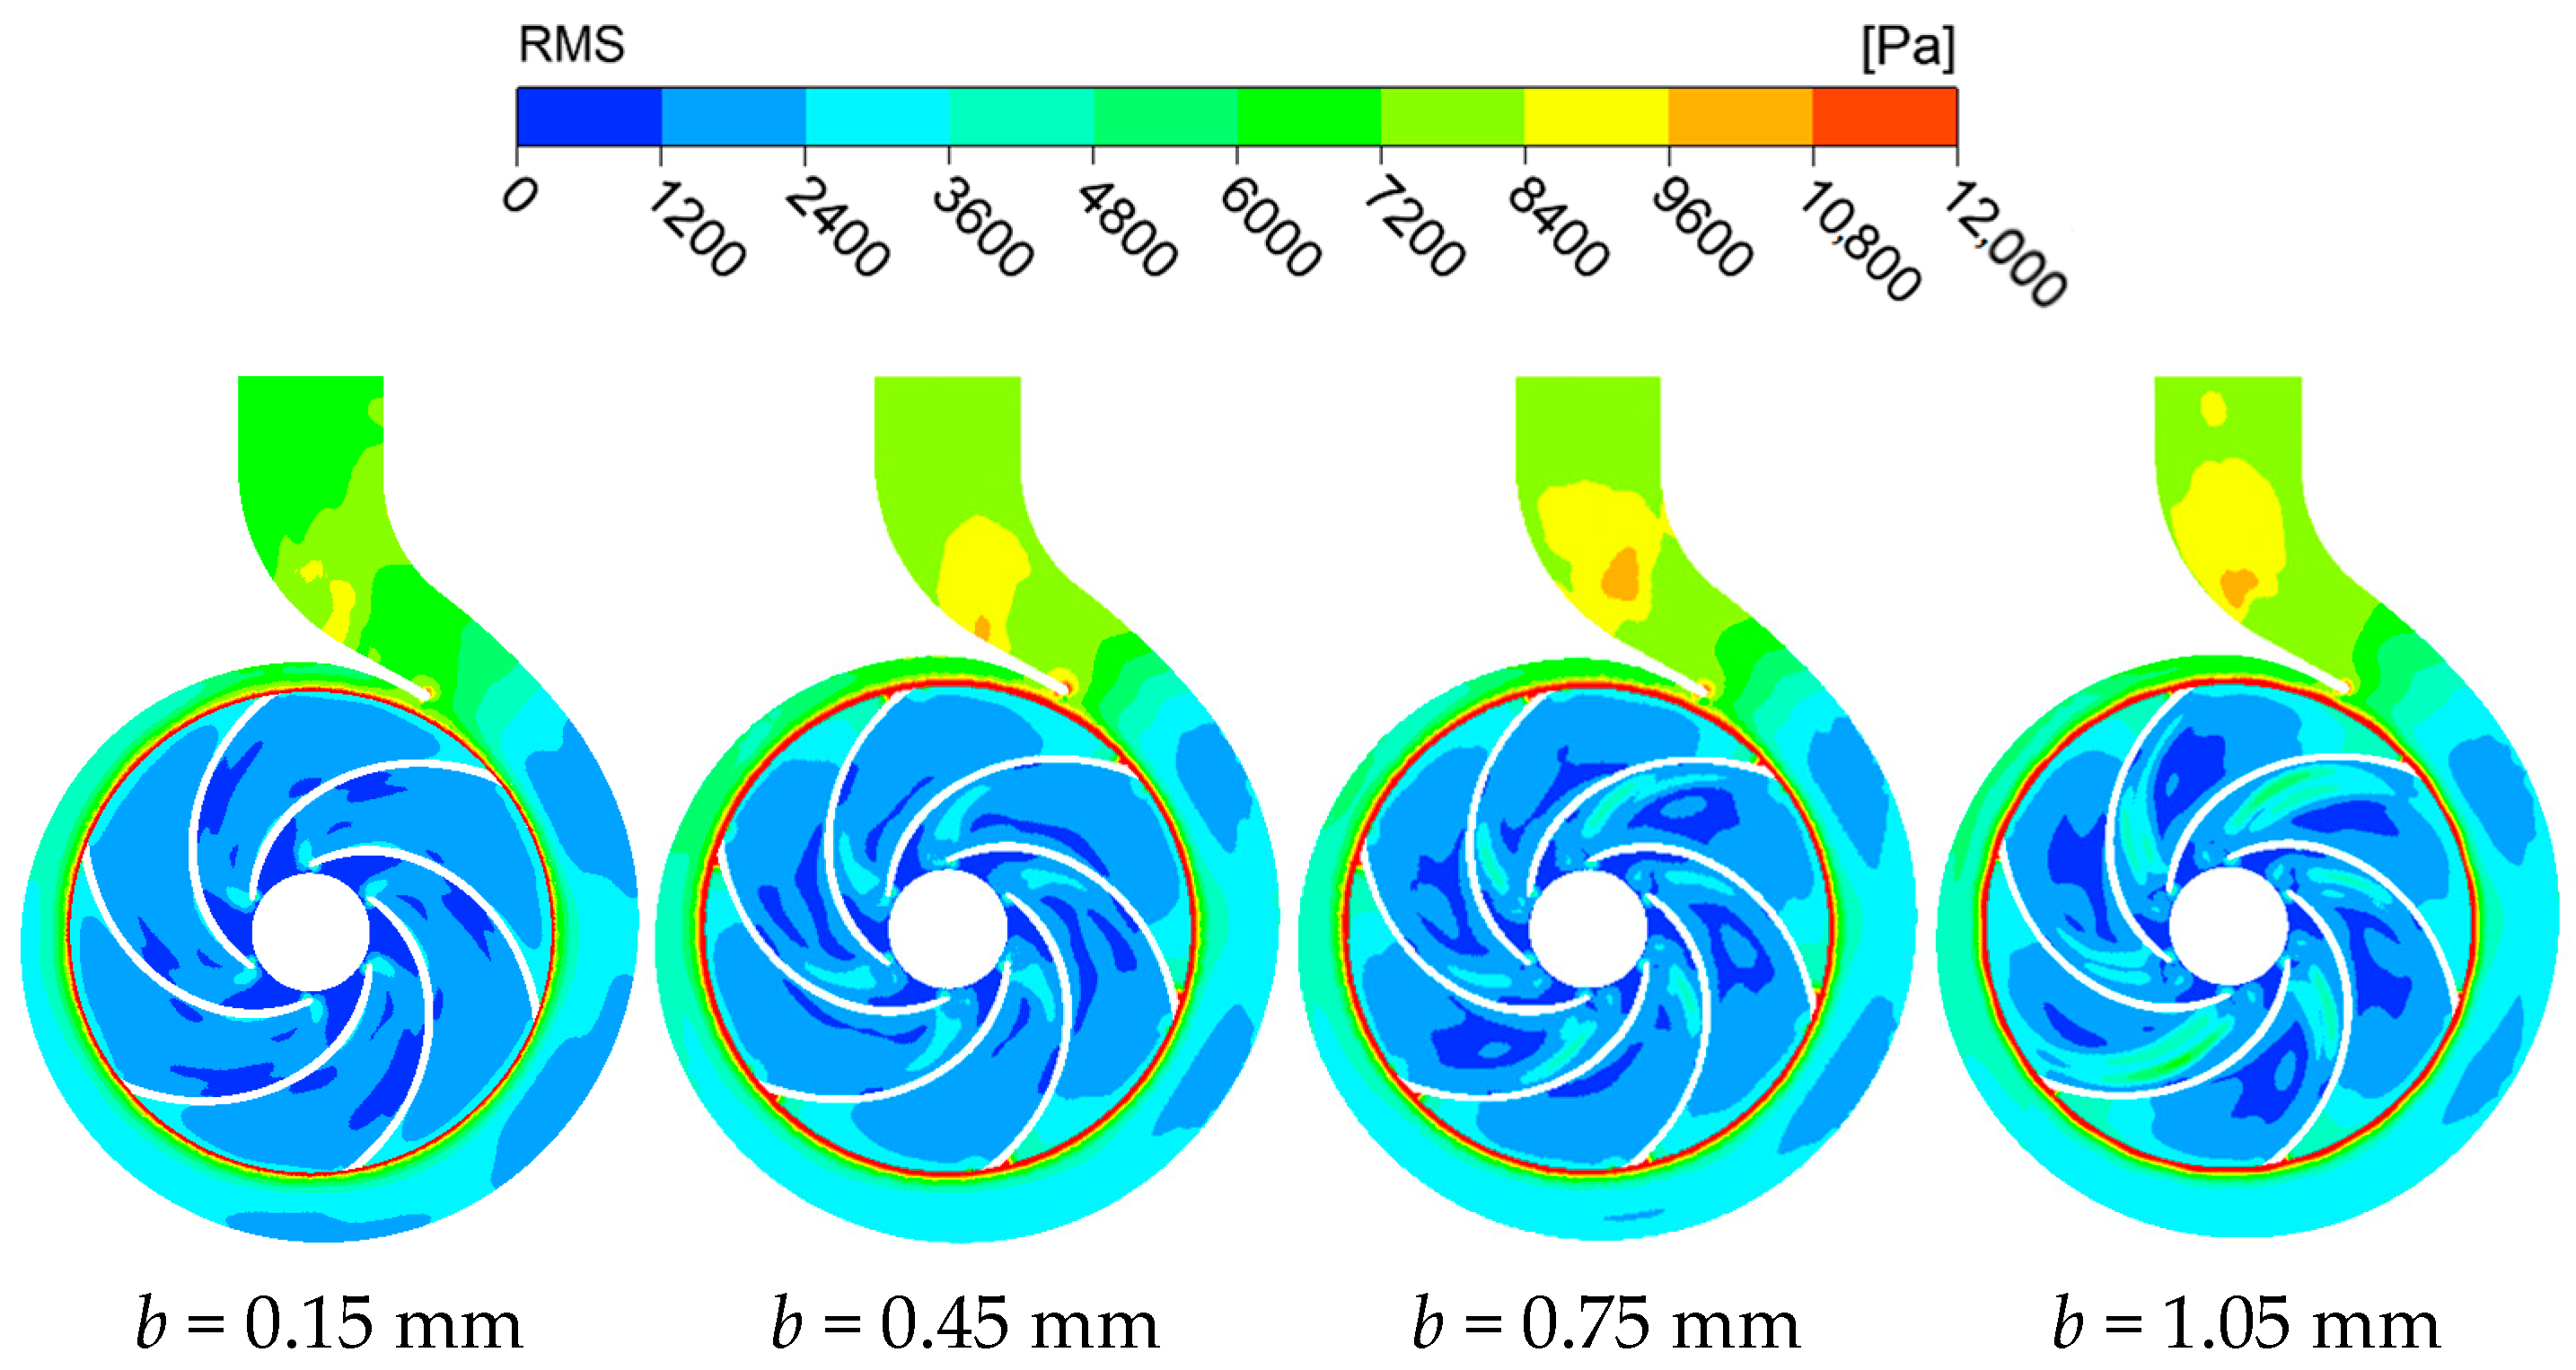
Under design conditions (Qo = 25 m3/h), Figure 12 shows the root-mean-square (RMS) distribution of pulsating pressure within the model pump under design operating conditions for different back wear-ring clearances. Figure 12 reveals that regions of high-pressure pulsation intensity are primarily concentrated at the rotor–stator interface and volute tongue. With increase in the clearance, the low-RMS zones within the impeller become more irregular and disordered. Meanwhile, high-RMS regions appear near the suction side and expand as the clearance grows. This behavior is caused by leakage flow entering the impeller passage from the hub side. Such intrusion disrupts the mainstream flow along the suction surface, triggering localized velocity discontinuities and amplified pressure fluctuations.
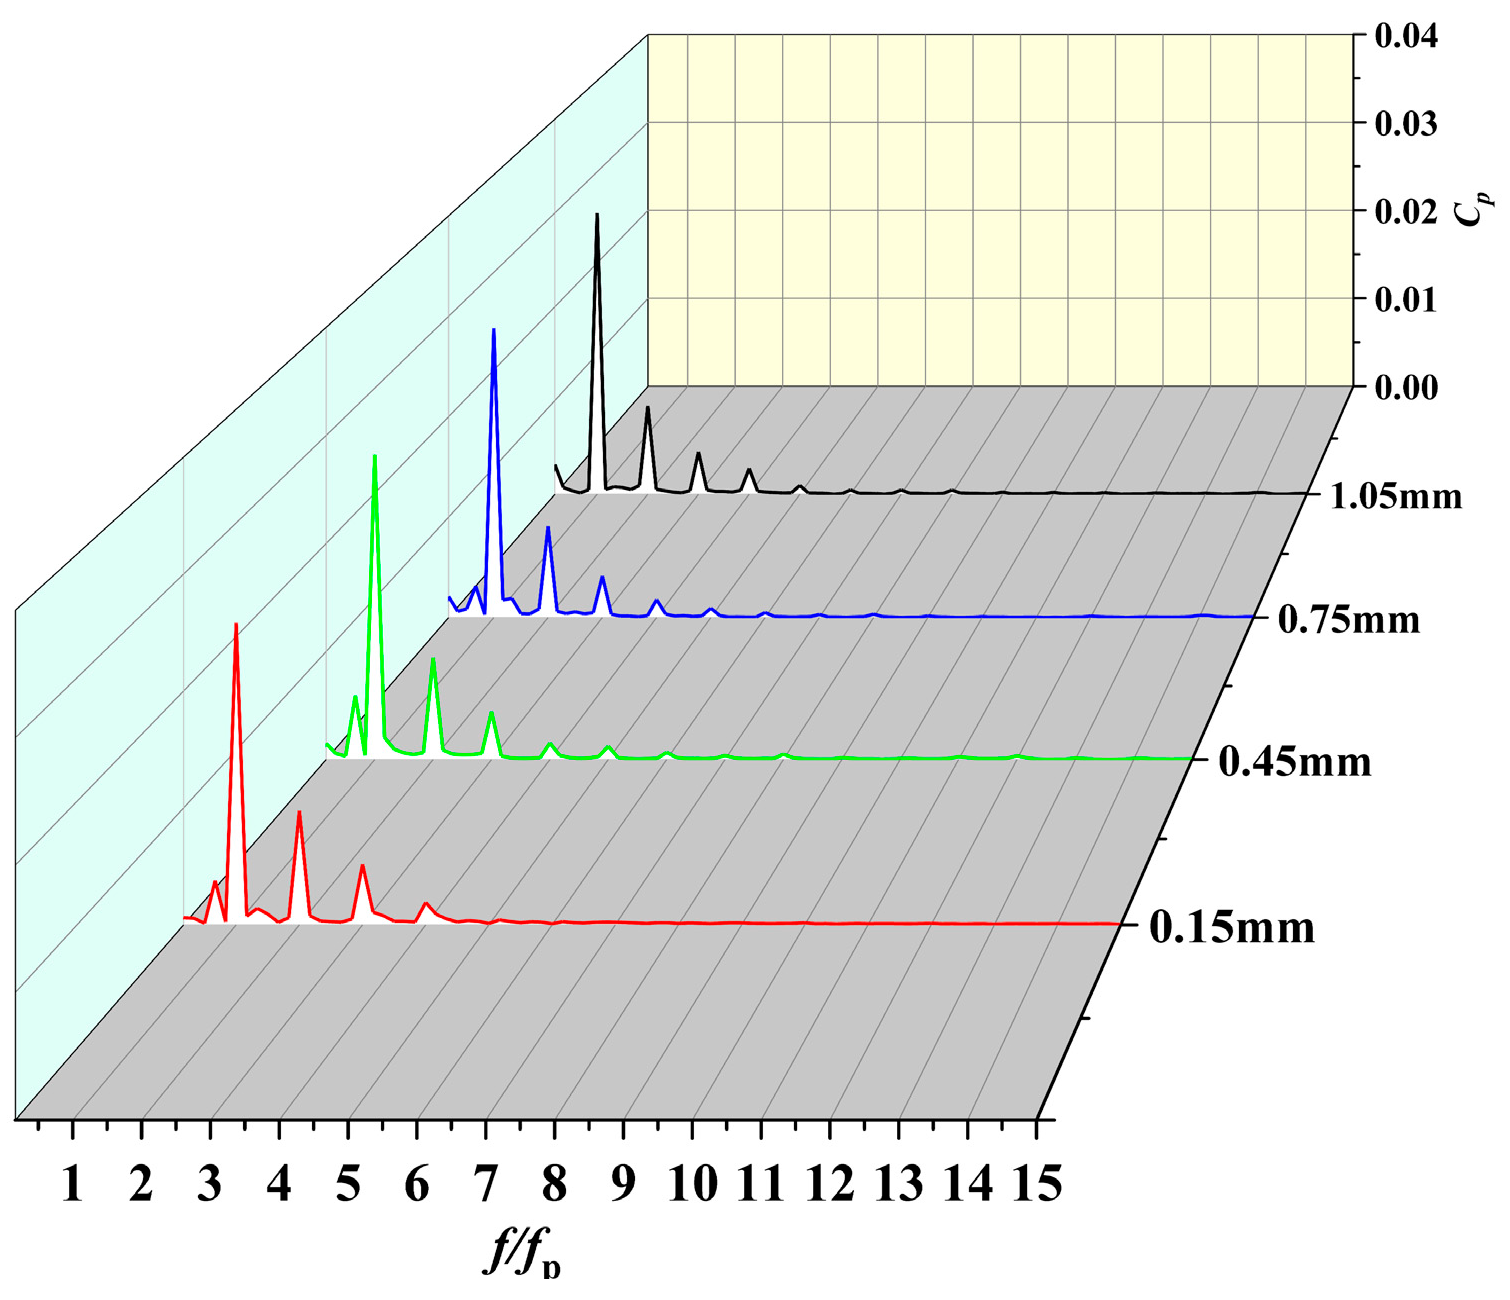
Figure 13 displays the frequency-domain pressure pulsation spectra at the wear-ring clearance. Figure 13 indicates that the pressure pulsation trends across all back wear-ring clearance schemes are broadly similar. The pulsation energy is mainly concentrated at the blade passing frequency (BPF) and components beyond 3 × BPF are negligible. As the clearance increases, pressure fluctuations intensify significantly, with amplitudes measuring 0.02583, 0.02868, 0.02908, and 0.02917, respectively. At 1.05 mm clearance, the BPF amplitude at the volute outlet increases by 12.9% compared to the 0.15 mm case. This amplification occurs because enlarged clearance intensifies leakage flow, which disrupts the flow patterns near the impeller hub and, consequently, elevates flow disorder at the volute outlet.

3.5. Dynamic Characteristic Analysis

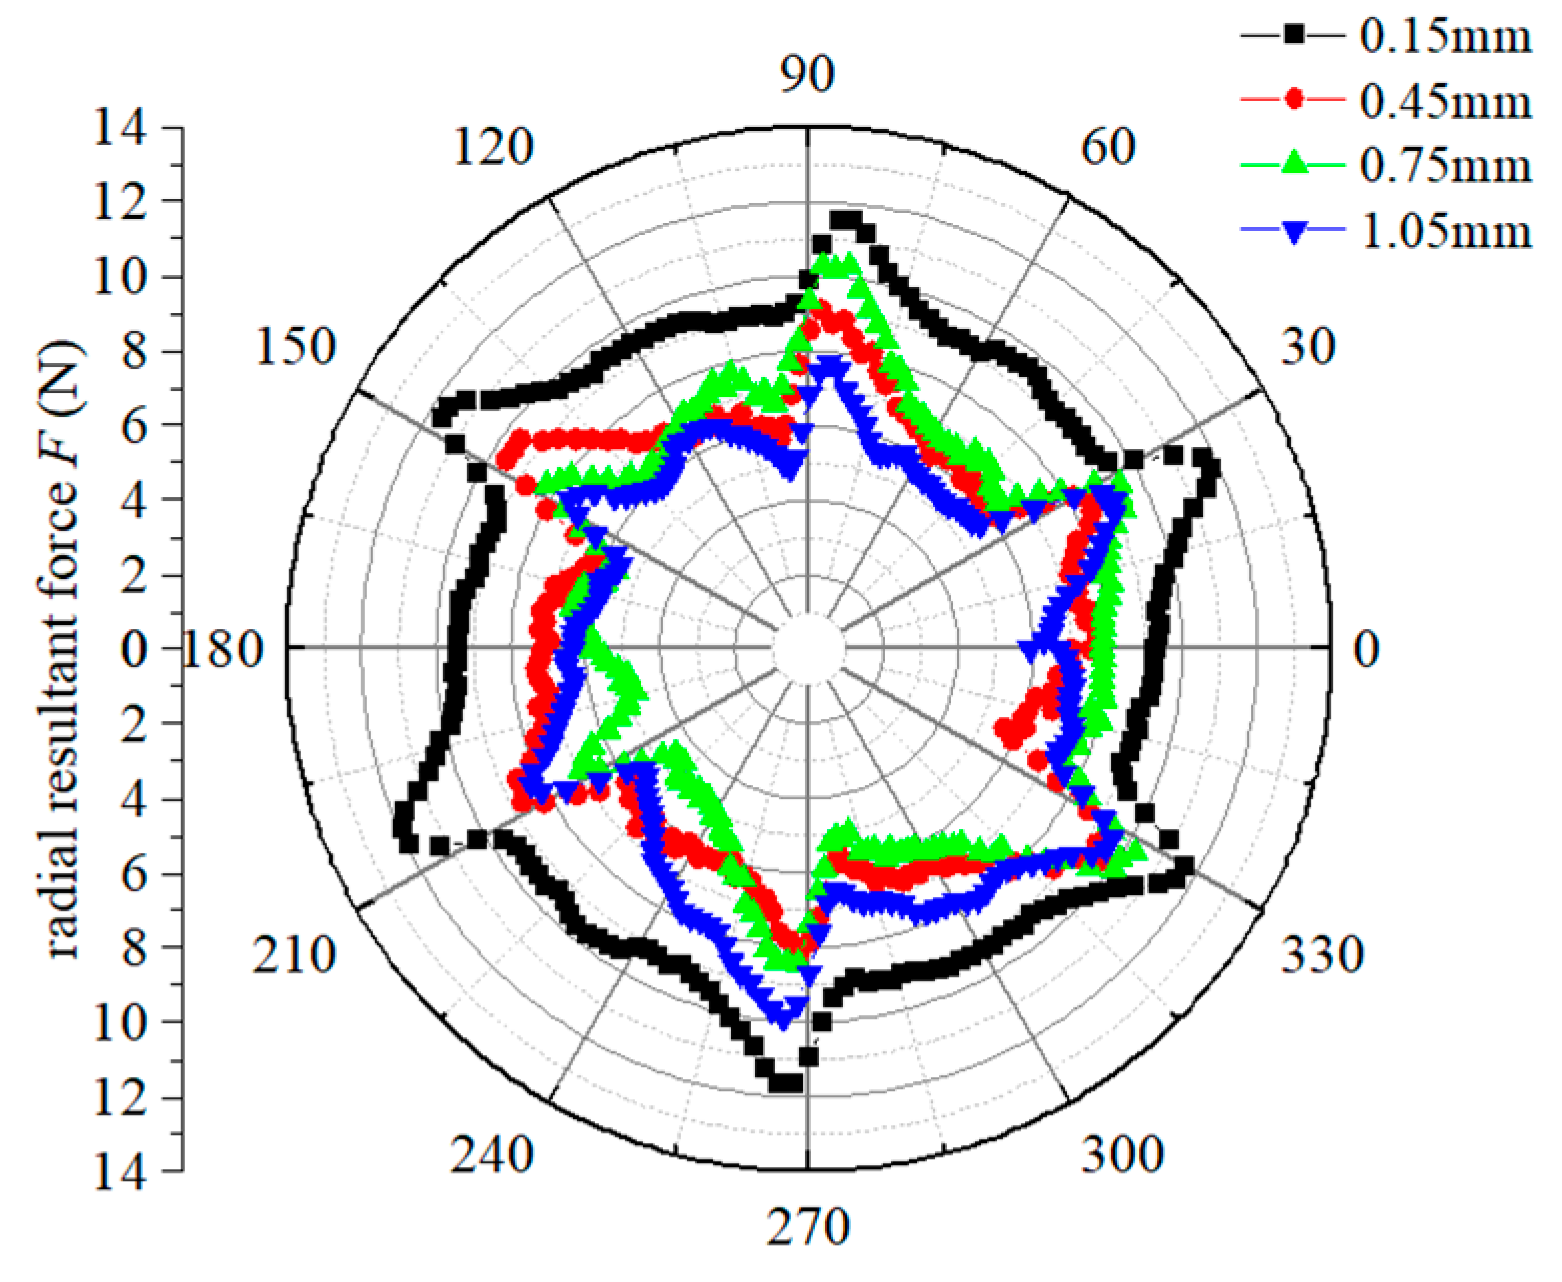
Figure 14 illustrates the radial resultant force distributions on the impeller for each clearance scheme. The data indicates that at back wear-ring clearances of 0.45 mm, 0.75 mm, and 1.05 mm, the mean radial force decreased by 2.65 N, 2.82 N, and 2.84 N, respectively, compared to the 0.15 mm baseline. When the clearance increases from 0.15 mm to 0.45 mm, radial force reduces significantly. However, a further increase to 1.05 mm introduces only minor changes, indicating that the influence of clearance on radial force diminishes as the clearance becomes larger. Concurrently, the radial force curves lose circumferential periodicity as clearance enlarges.
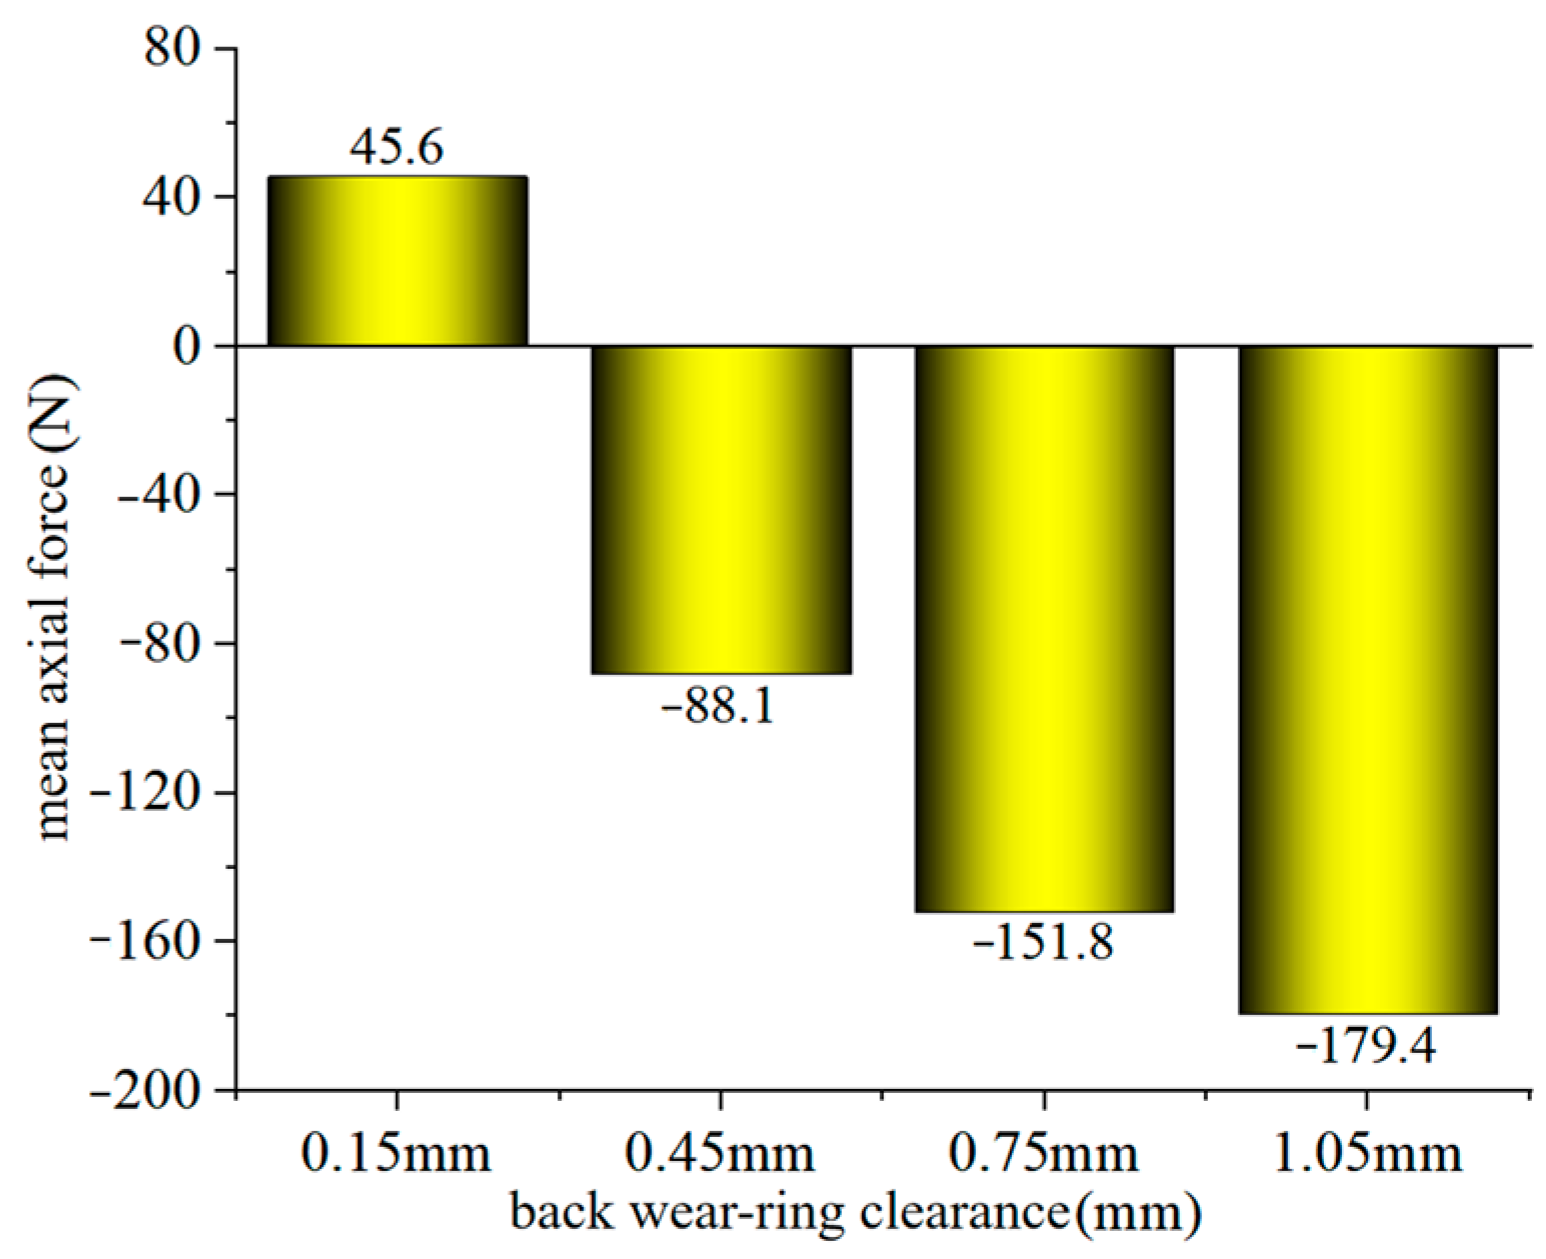
Figure 15 presents the mean axial force on the impeller across varying back wear-ring clearance schemes. At 0.15 mm clearance, the axial force acts forward (toward the impeller inlet) with a mean value of 45.6 N. When only increasing the back wear-ring clearance to 0.45 mm, a directional reversal occurs: the axial force shifts 180 degrees to act rearward (toward the hub), changing from +45.6 N to –88.1 N. This is due to the fact that the leakage flow in the impeller back chamber becomes larger with the increase in the back wear-ring clearance, which reduces pressure in the back chamber and causes axial force reversal toward the hub. Such reversal may jeopardize seal integrity or mechanical stability. As clearance further enlarges beyond 0.45 mm, the magnitude of this rearward force progressively increases, though its growth rate diminishes.

4. Sound Field Results and Discussion

4.1. Sound Source Intensity Analysis

For Qo = 25 m3/h, Figure 16 presents the sound power level (SWL) distribution contours in the suction chamber of the model pump under design operating conditions for each clearance scheme. The acoustic power level is significantly lower at the suction inlet and increases near the outlet region. With increasing back wear-ring clearance, the overall SWL distribution in the suction chamber remains generally stable; the high-intensity acoustic region expands across the mid-lower part of the outlet duct. At clearances > 0.75 mm, localized high-sound-power regions emerge on the upper portion of the outlet surface. This behavior arises because leakage flow from the back wear ring does not directly interact with the primary suction flow at the impeller inlet, resulting in indirect perturbation effects on the suction chamber flow field. However, as clearance further enlarges, the recirculated leakage flow intensifies turbulence in the impeller, subsequently exerting measurable influence on the flow dynamics at the suction chamber outlet.
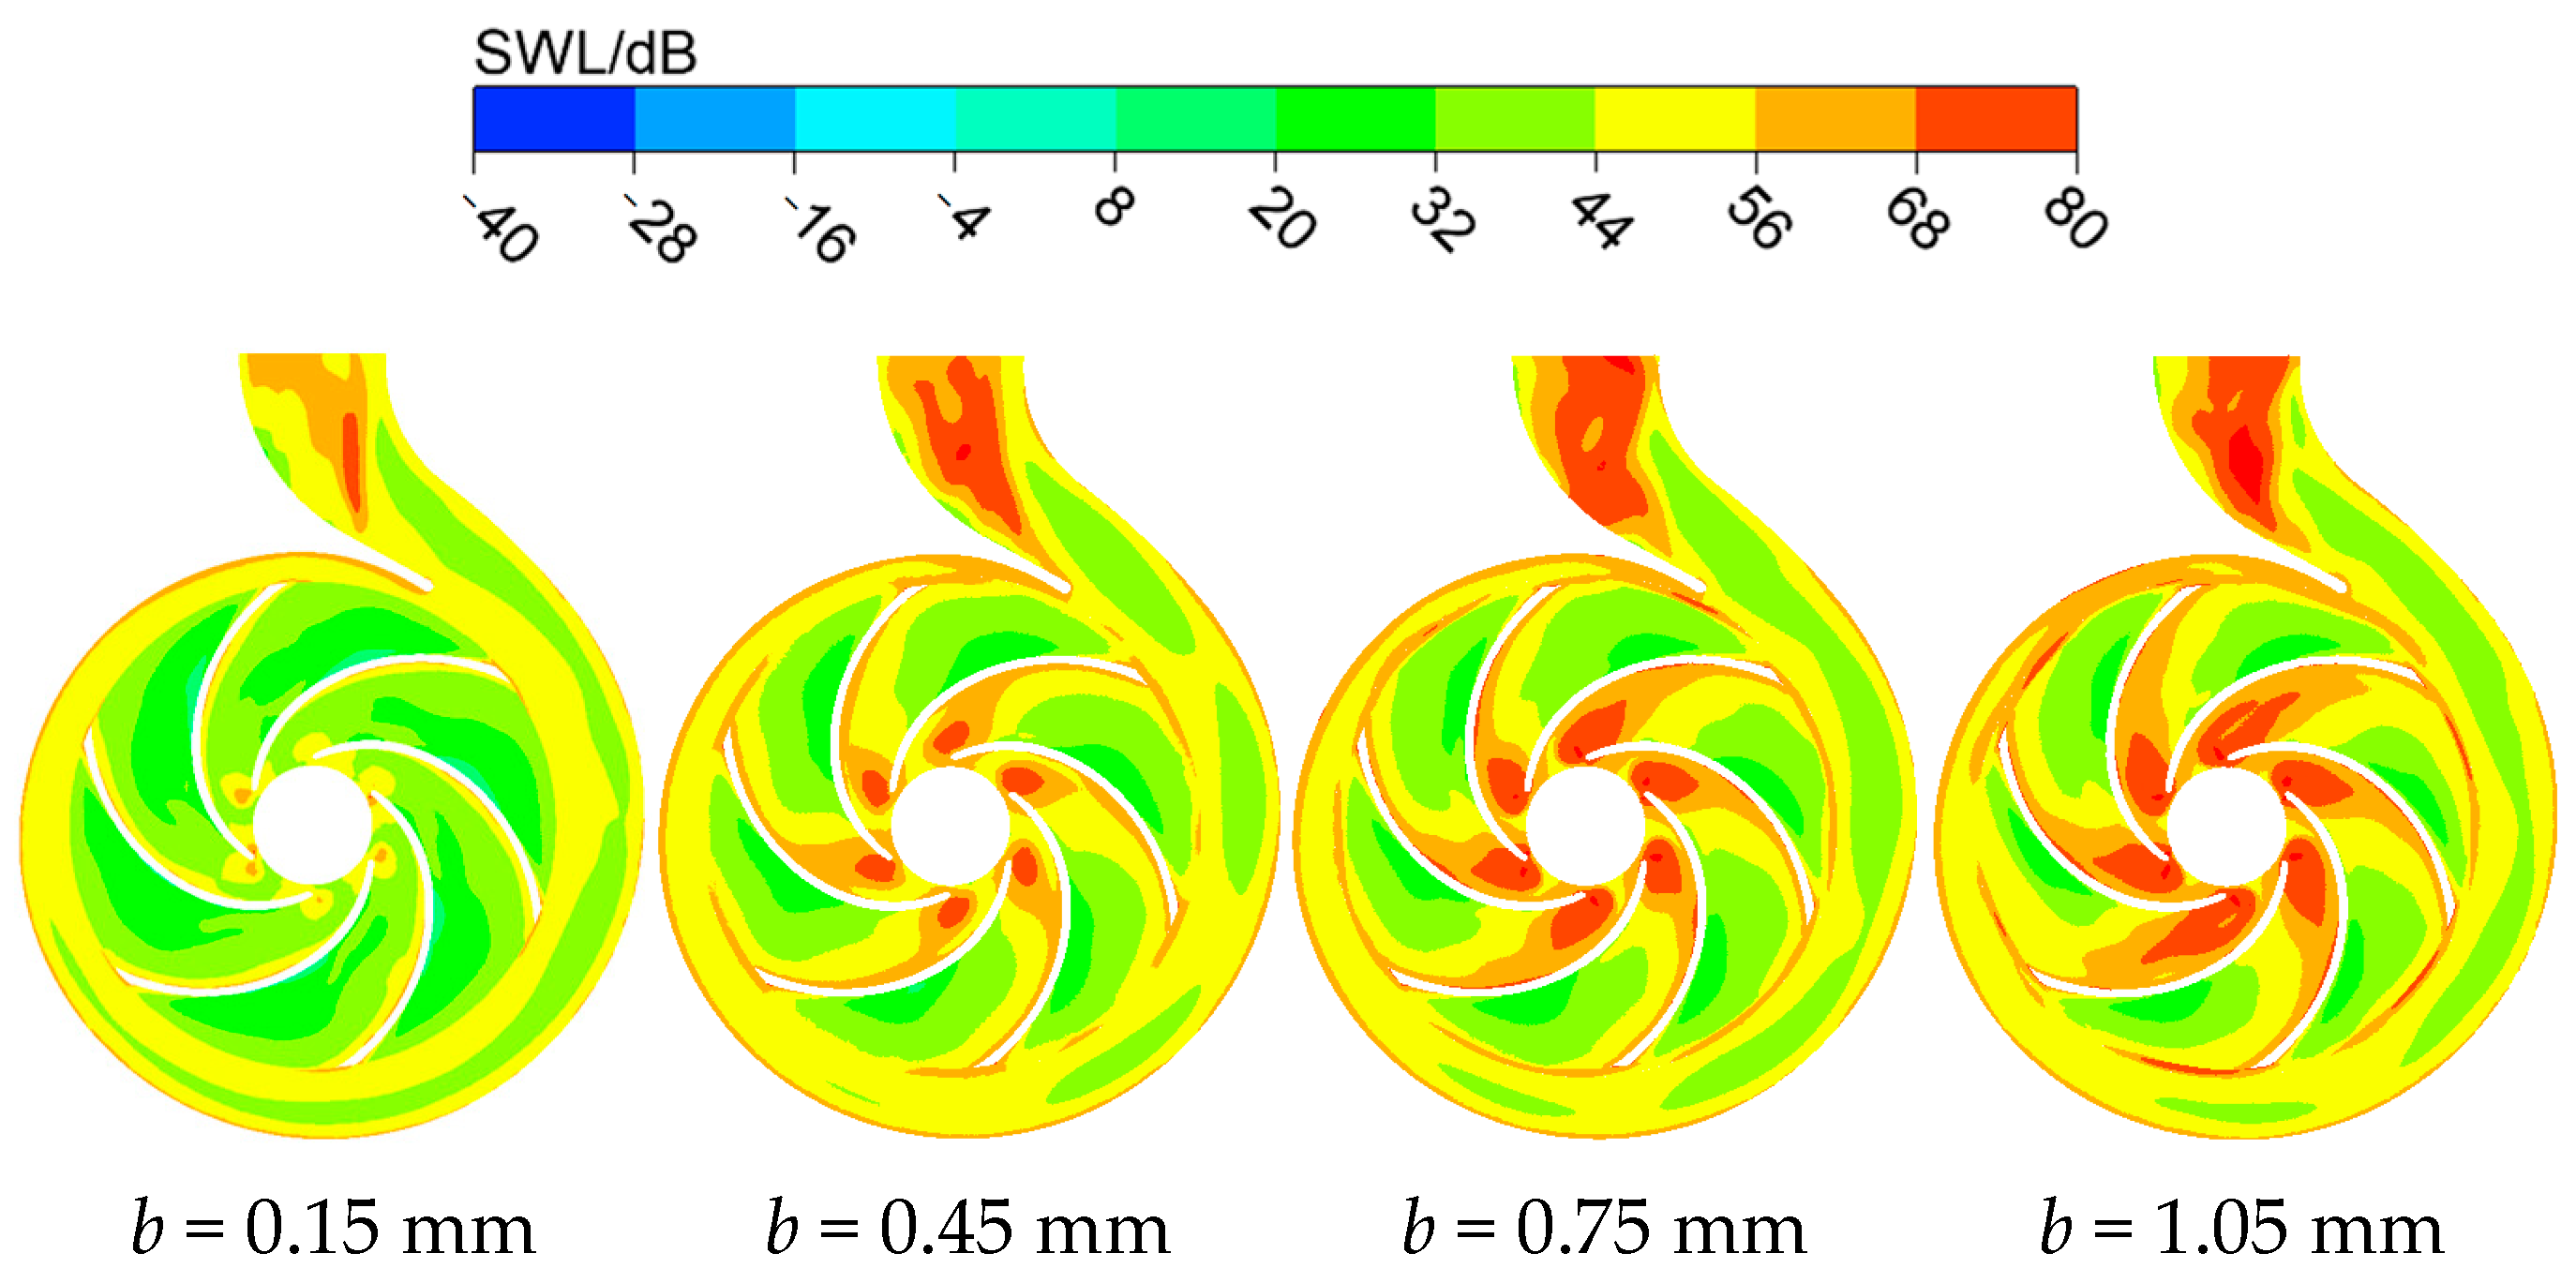
Figure 17 depicts sound power level contours at the volute outlet of the model pump across clearance schemes. High-SWL zones are mainly located near the volute tongue and the volute discharge section, while new high-noise regions appear around all six balance holes. As clearance progressively enlarges, high-sound-power regions expand at the balance holes and along the impeller suction surface. This evolution stems from amplified leakage flow through the back wear ring, driving more fluid to reflux into the impeller via the balance holes. Such reflux disrupts internal impeller flow, intensifying flow losses on the suction surface. High-SWL area expands by 112% at volute tongue when b = 1.05 mm vs. 0.15 mm. Concurrently, larger clearances elevate acoustic source strength in the volute spiral section. Stronger reflux interacts with impeller discharge flow, amplifying flow impingement on the volute walls and extending high-sound-power coverage.
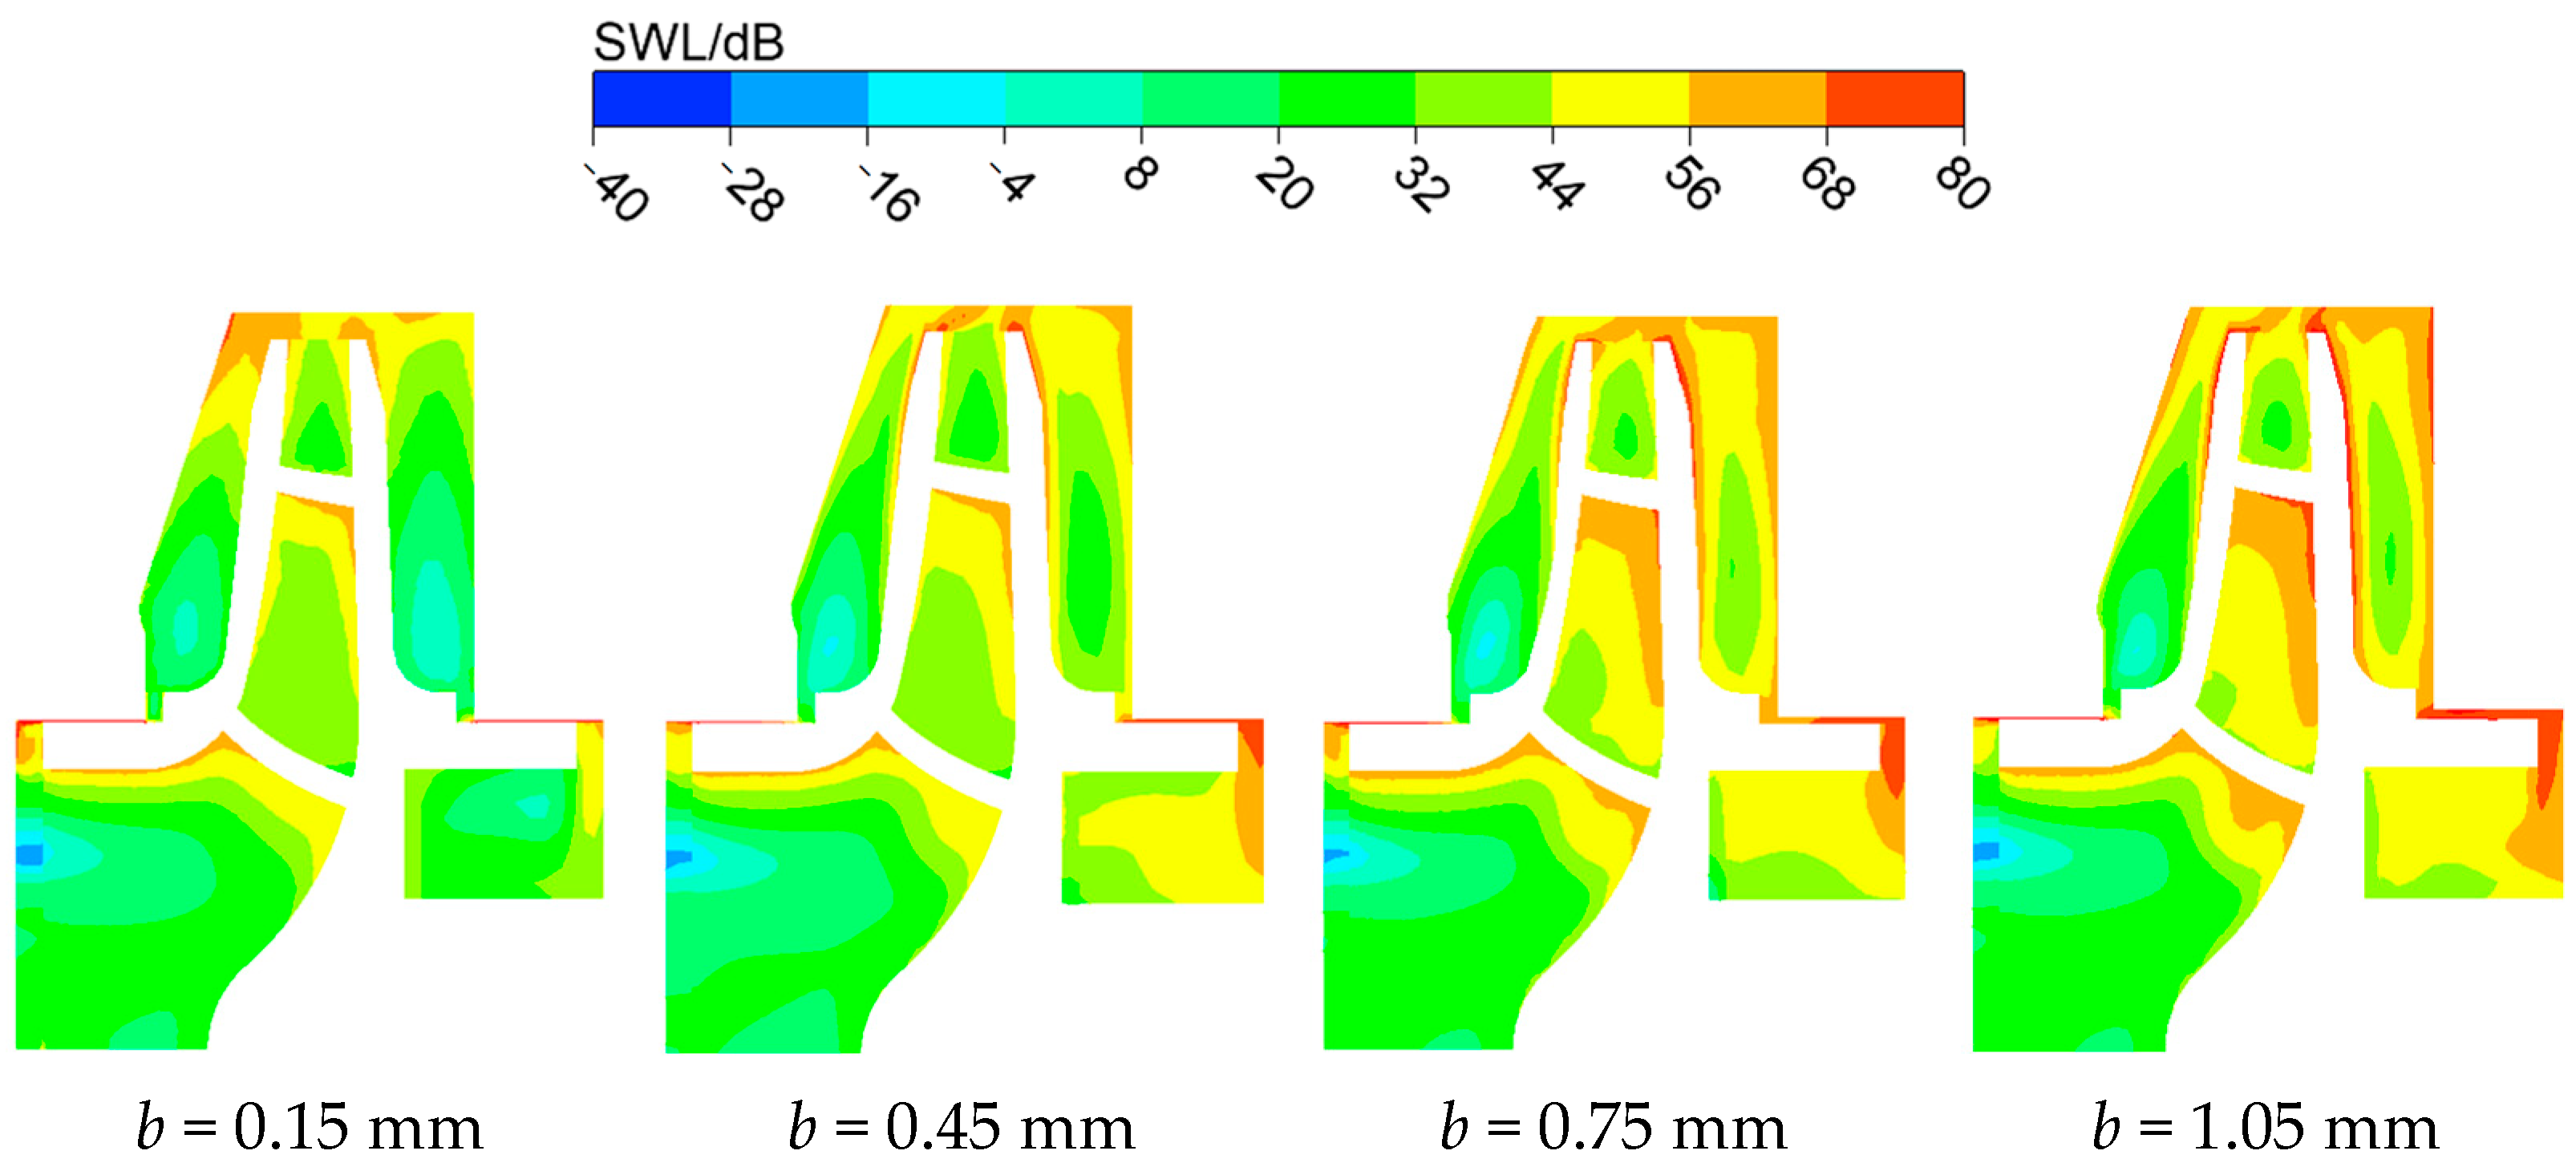
Figure 18 shows the sound power level contours on the axial section of the model pump across clearance schemes. As back wear-ring clearance increases, the acoustic source strength exhibits minimal change in the front chamber and impeller inlet but rises substantially in the rear chamber and wear ring gap region. Flow streamlines reveal that enlarged clearance drives more high-pressure fluid to reflux through the wear ring into the balancing chamber and impeller shroud. This intensifies vortex shedding in the rear cavity, significantly amplifying the overall sound power level. Critically, high-sound-power focal zones emerge near the back wear-ring clearance—heightened high-velocity fluid outflow induces elevated local turbulence and pressure pulsations, directly escalating acoustic emissions. The relative growth rate of SWL in the rear chamber reaches 18.3%/0.3 mm for b < 0.75 mm, but drops to 6.7%/0.3 mm for b > 0.75 mm.

4.2. Sound Pressure Level Contour Analysis

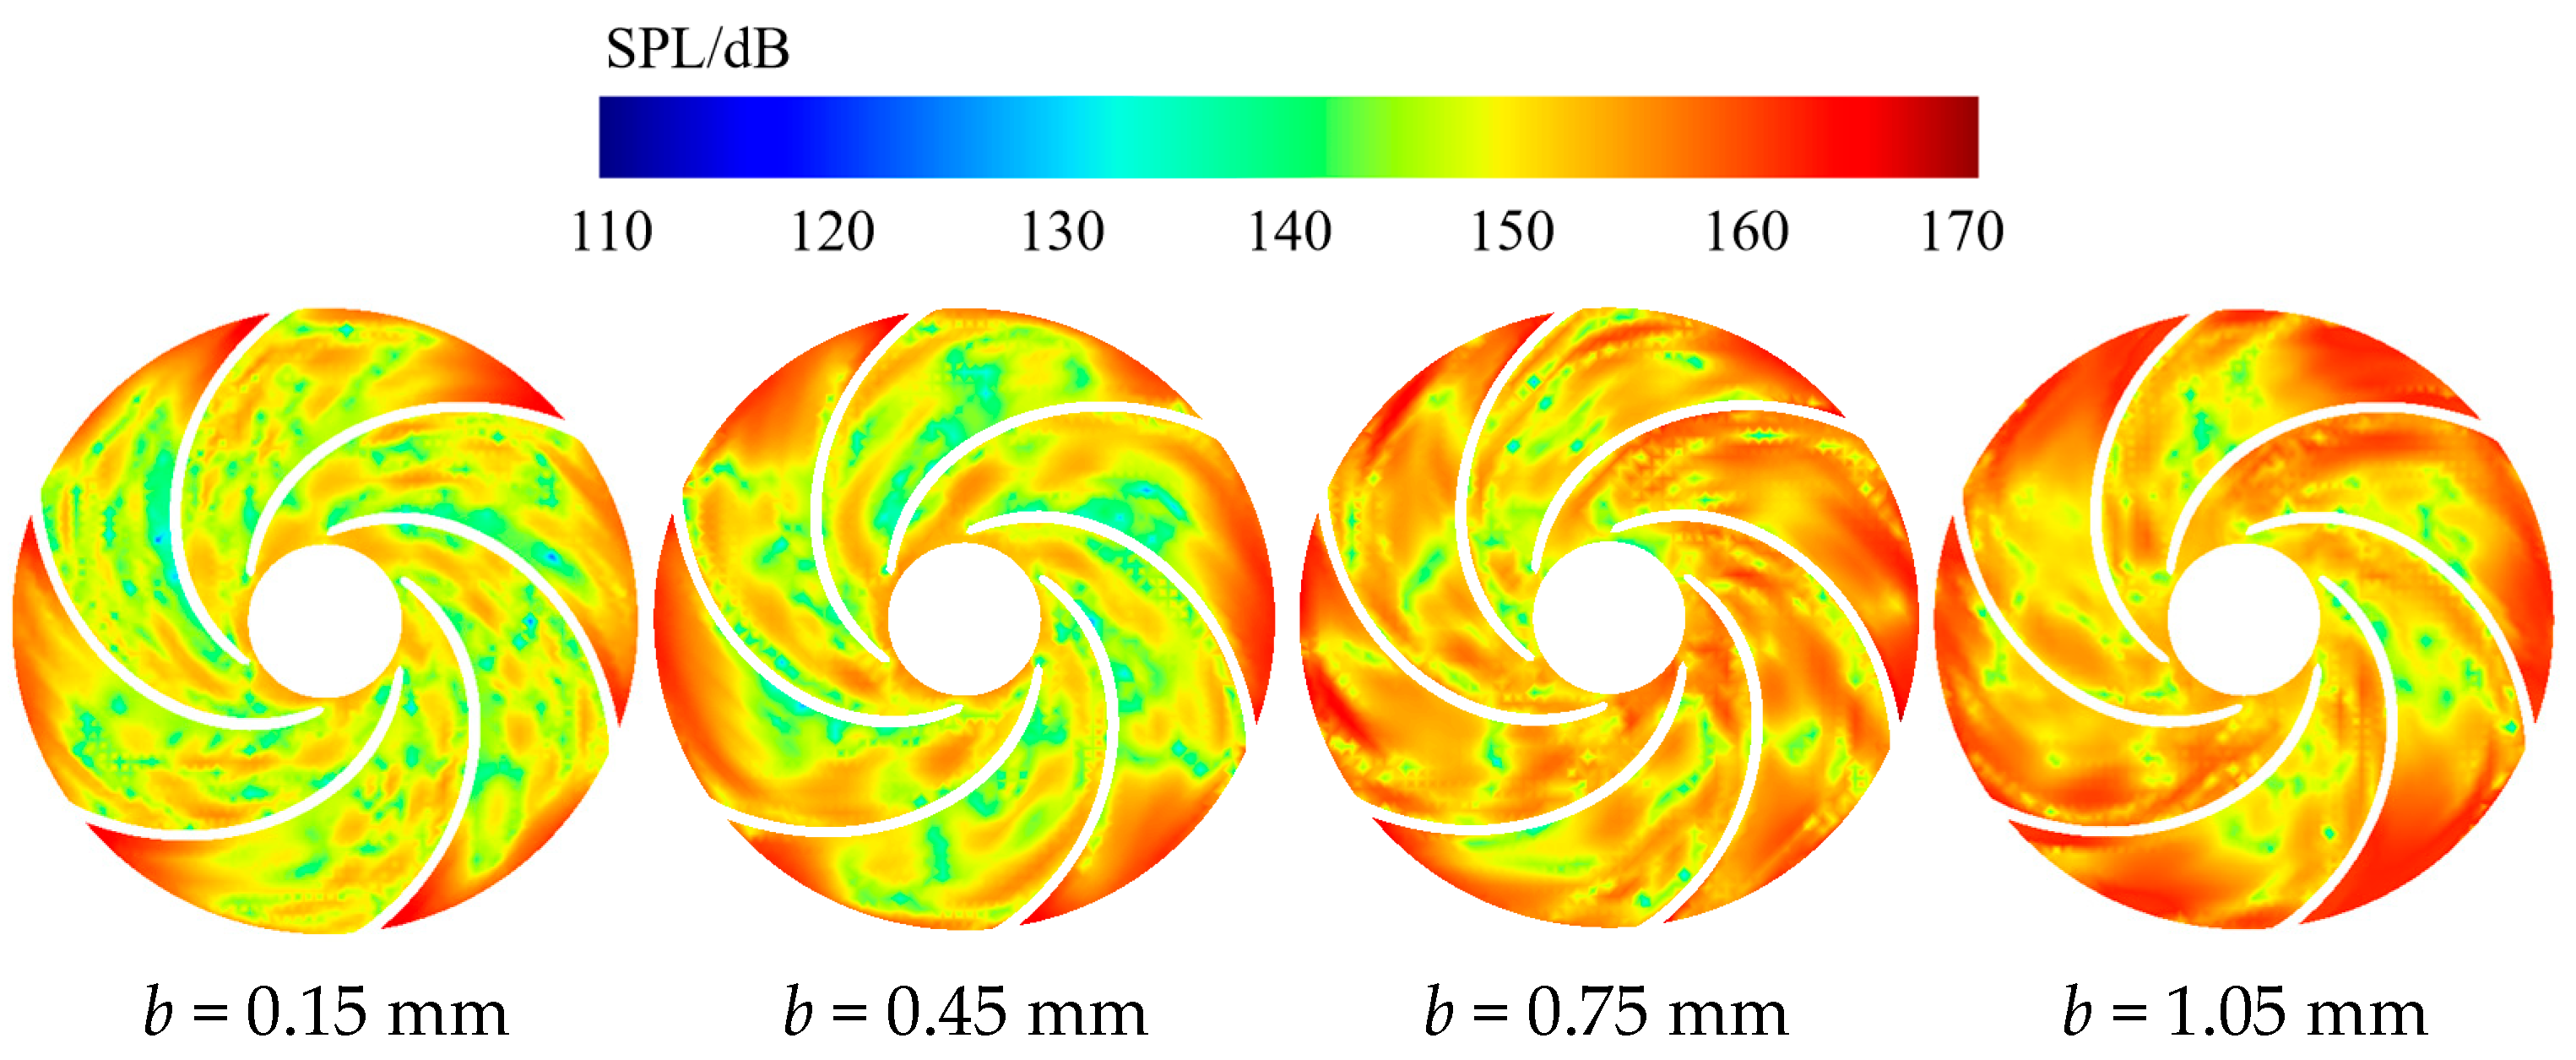
Figure 19 illustrates sound pressure level (SPL) contours at the blade passing frequency (295 Hz) within the impeller under design conditions across different back wear-ring clearances. As the clearance increases to 0.45 mm, the high-SPL region expands near the impeller passage outlet and along the pressure-side trailing edge, although a large low-SPL area remains from the passage inlet to the midsection. Further clearance enlargement raises the overall impeller SPL, yet the SPL increase at the impeller inlet remains significantly smaller compared to cases with only front wear-ring clearance modification. This occurs because back wear-ring clearance changes minimally affect inlet flow; instead, amplified rear-cavity reflux through balance holes disturbs internal impeller flow, thereby elevating SPL.
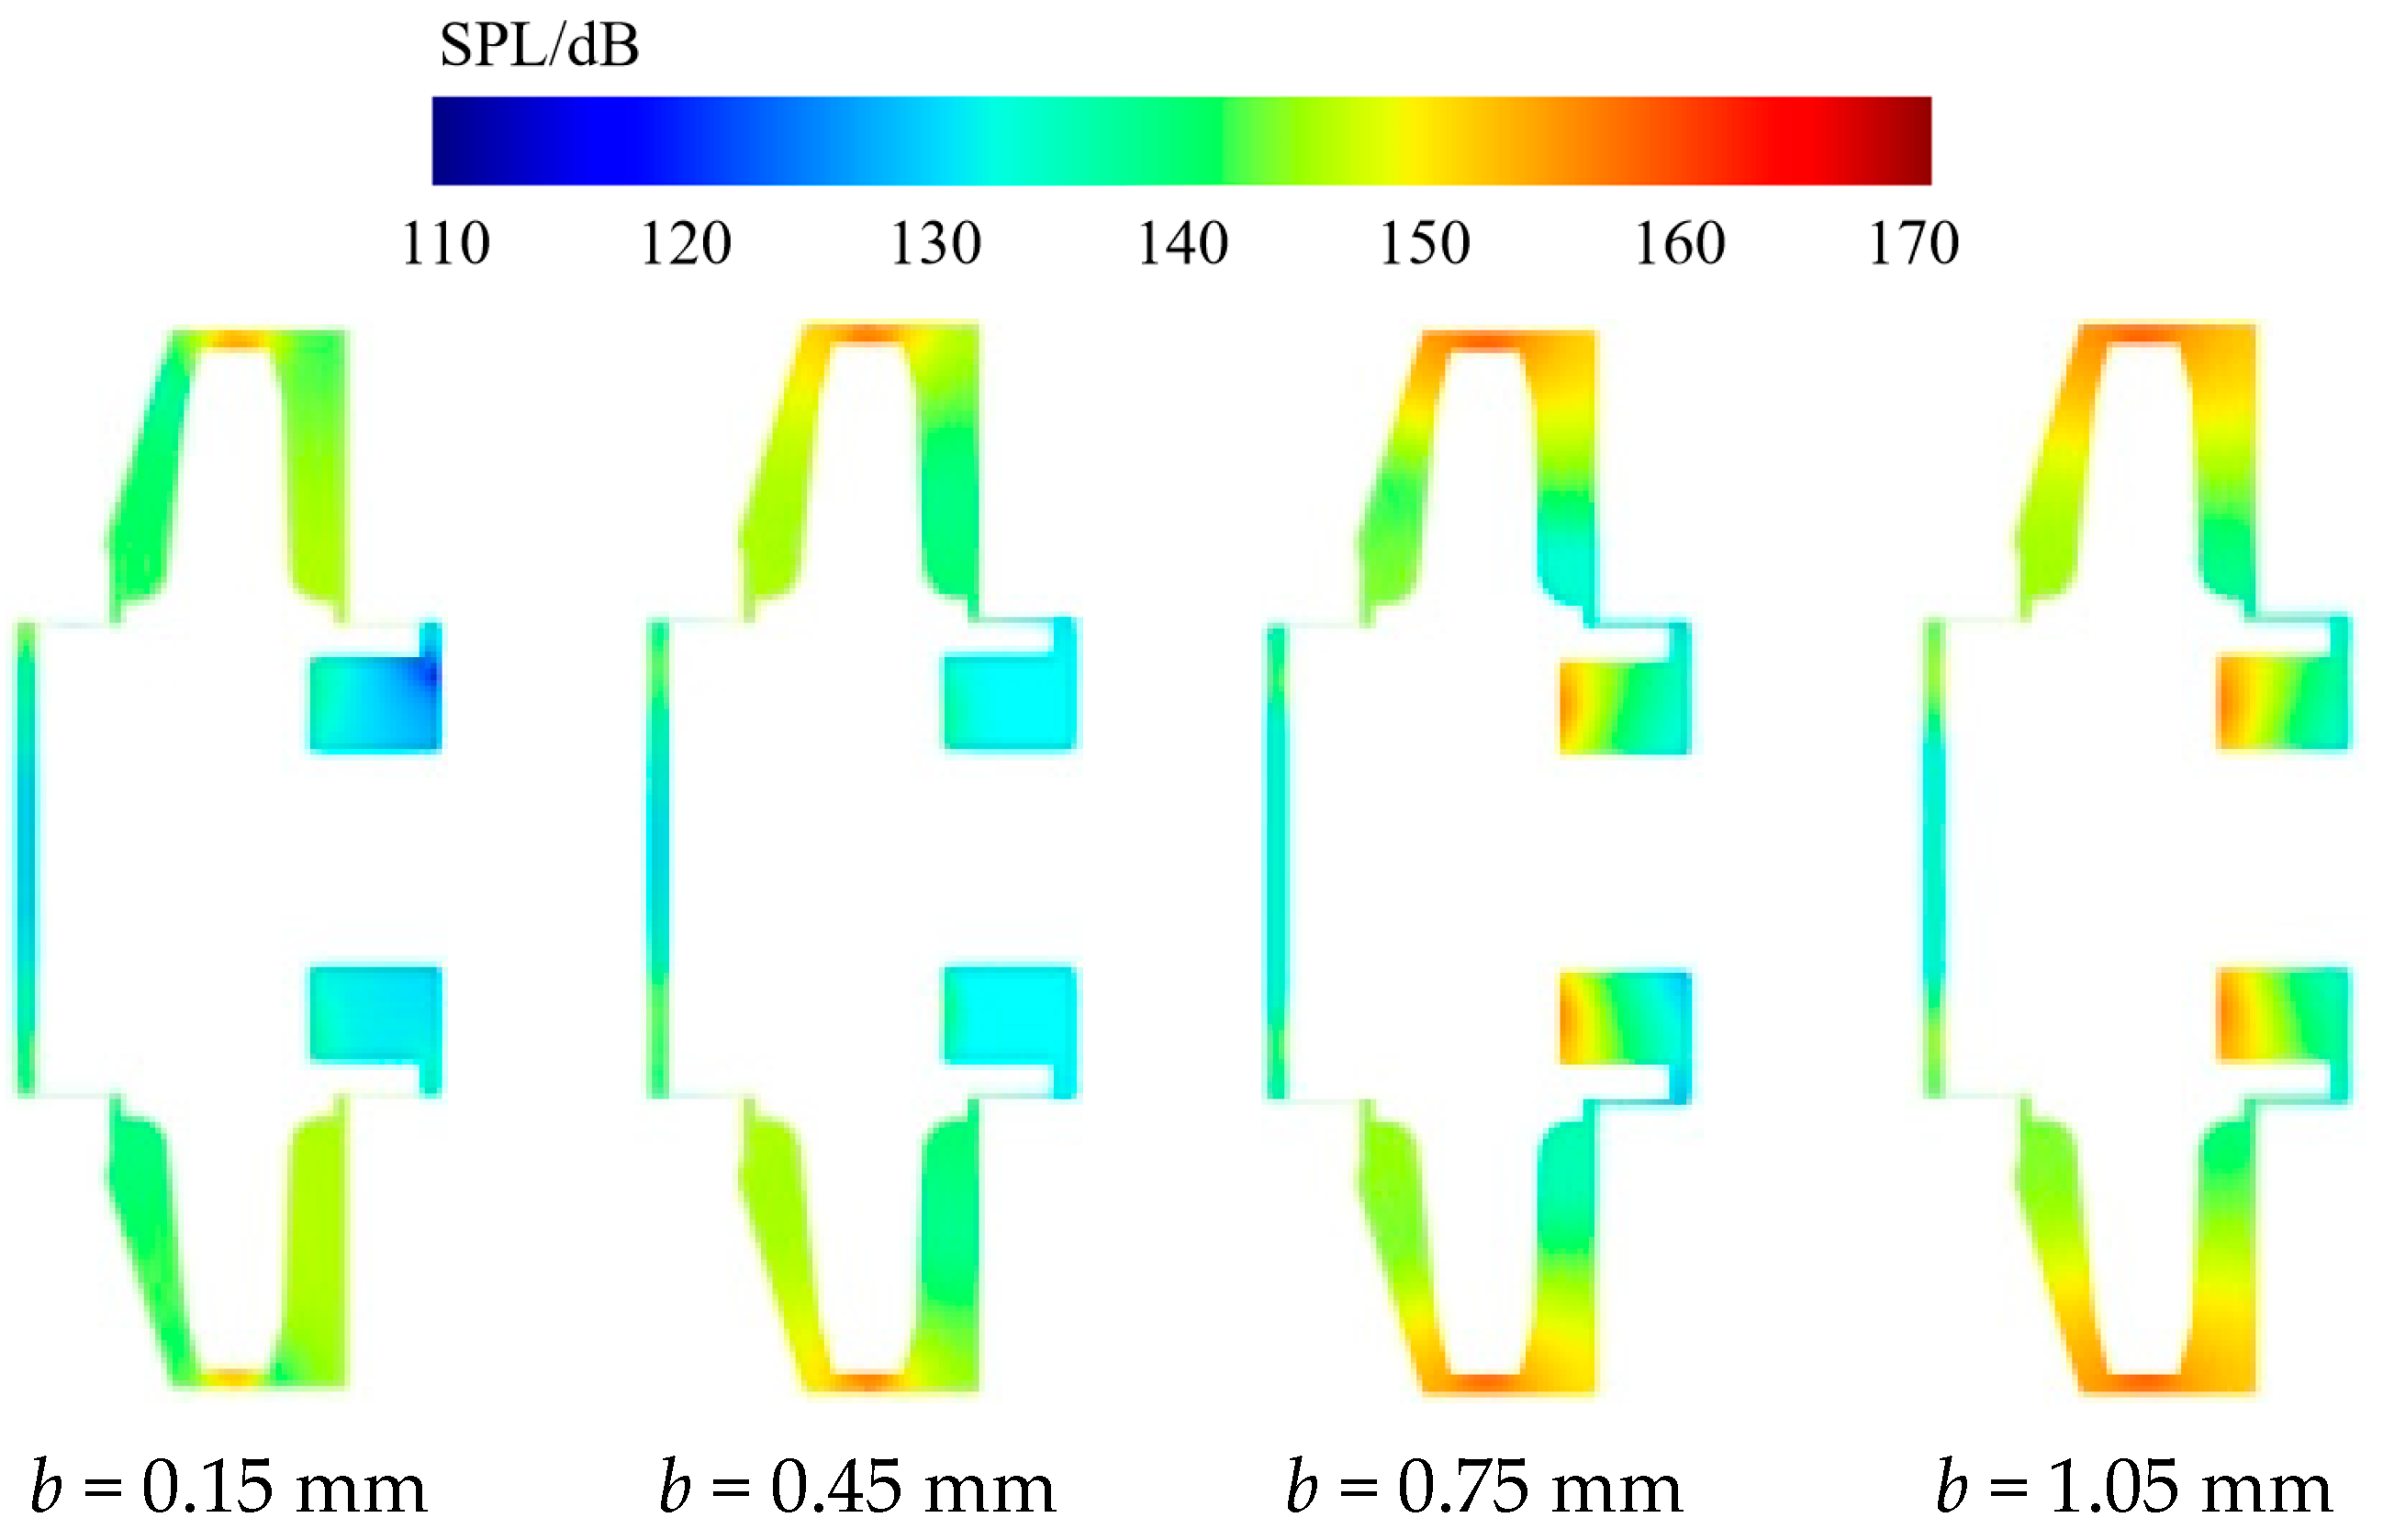
Figure 20 depicts sound pressure level (SPL) distribution contours at 295 Hz (blade passing frequency) within the leakage flow passage. The results clearly show that increasing back wear-ring clearance accomplishes the following: It amplifies leakage reflux, intensifying internal flow turbulence; it strengthens rotor-stator interaction at the impeller-leakage passage interface, elevating SPL near this boundary; and it causes minimal SPL changes in the front chamber, yet significant SPL variations in the rear and balancing chambers as clearance expands from 0.15 mm to 1.05 mm. This is because larger clearance induces high-velocity fluid reflux from the rear chamber into the balancing cavity. This reflux enters through the balance holes, disturbing the internal impeller flow and producing complex turbulence. Consequently, SPL substantially rises in the contact zone between the balancing chamber and balance holes.
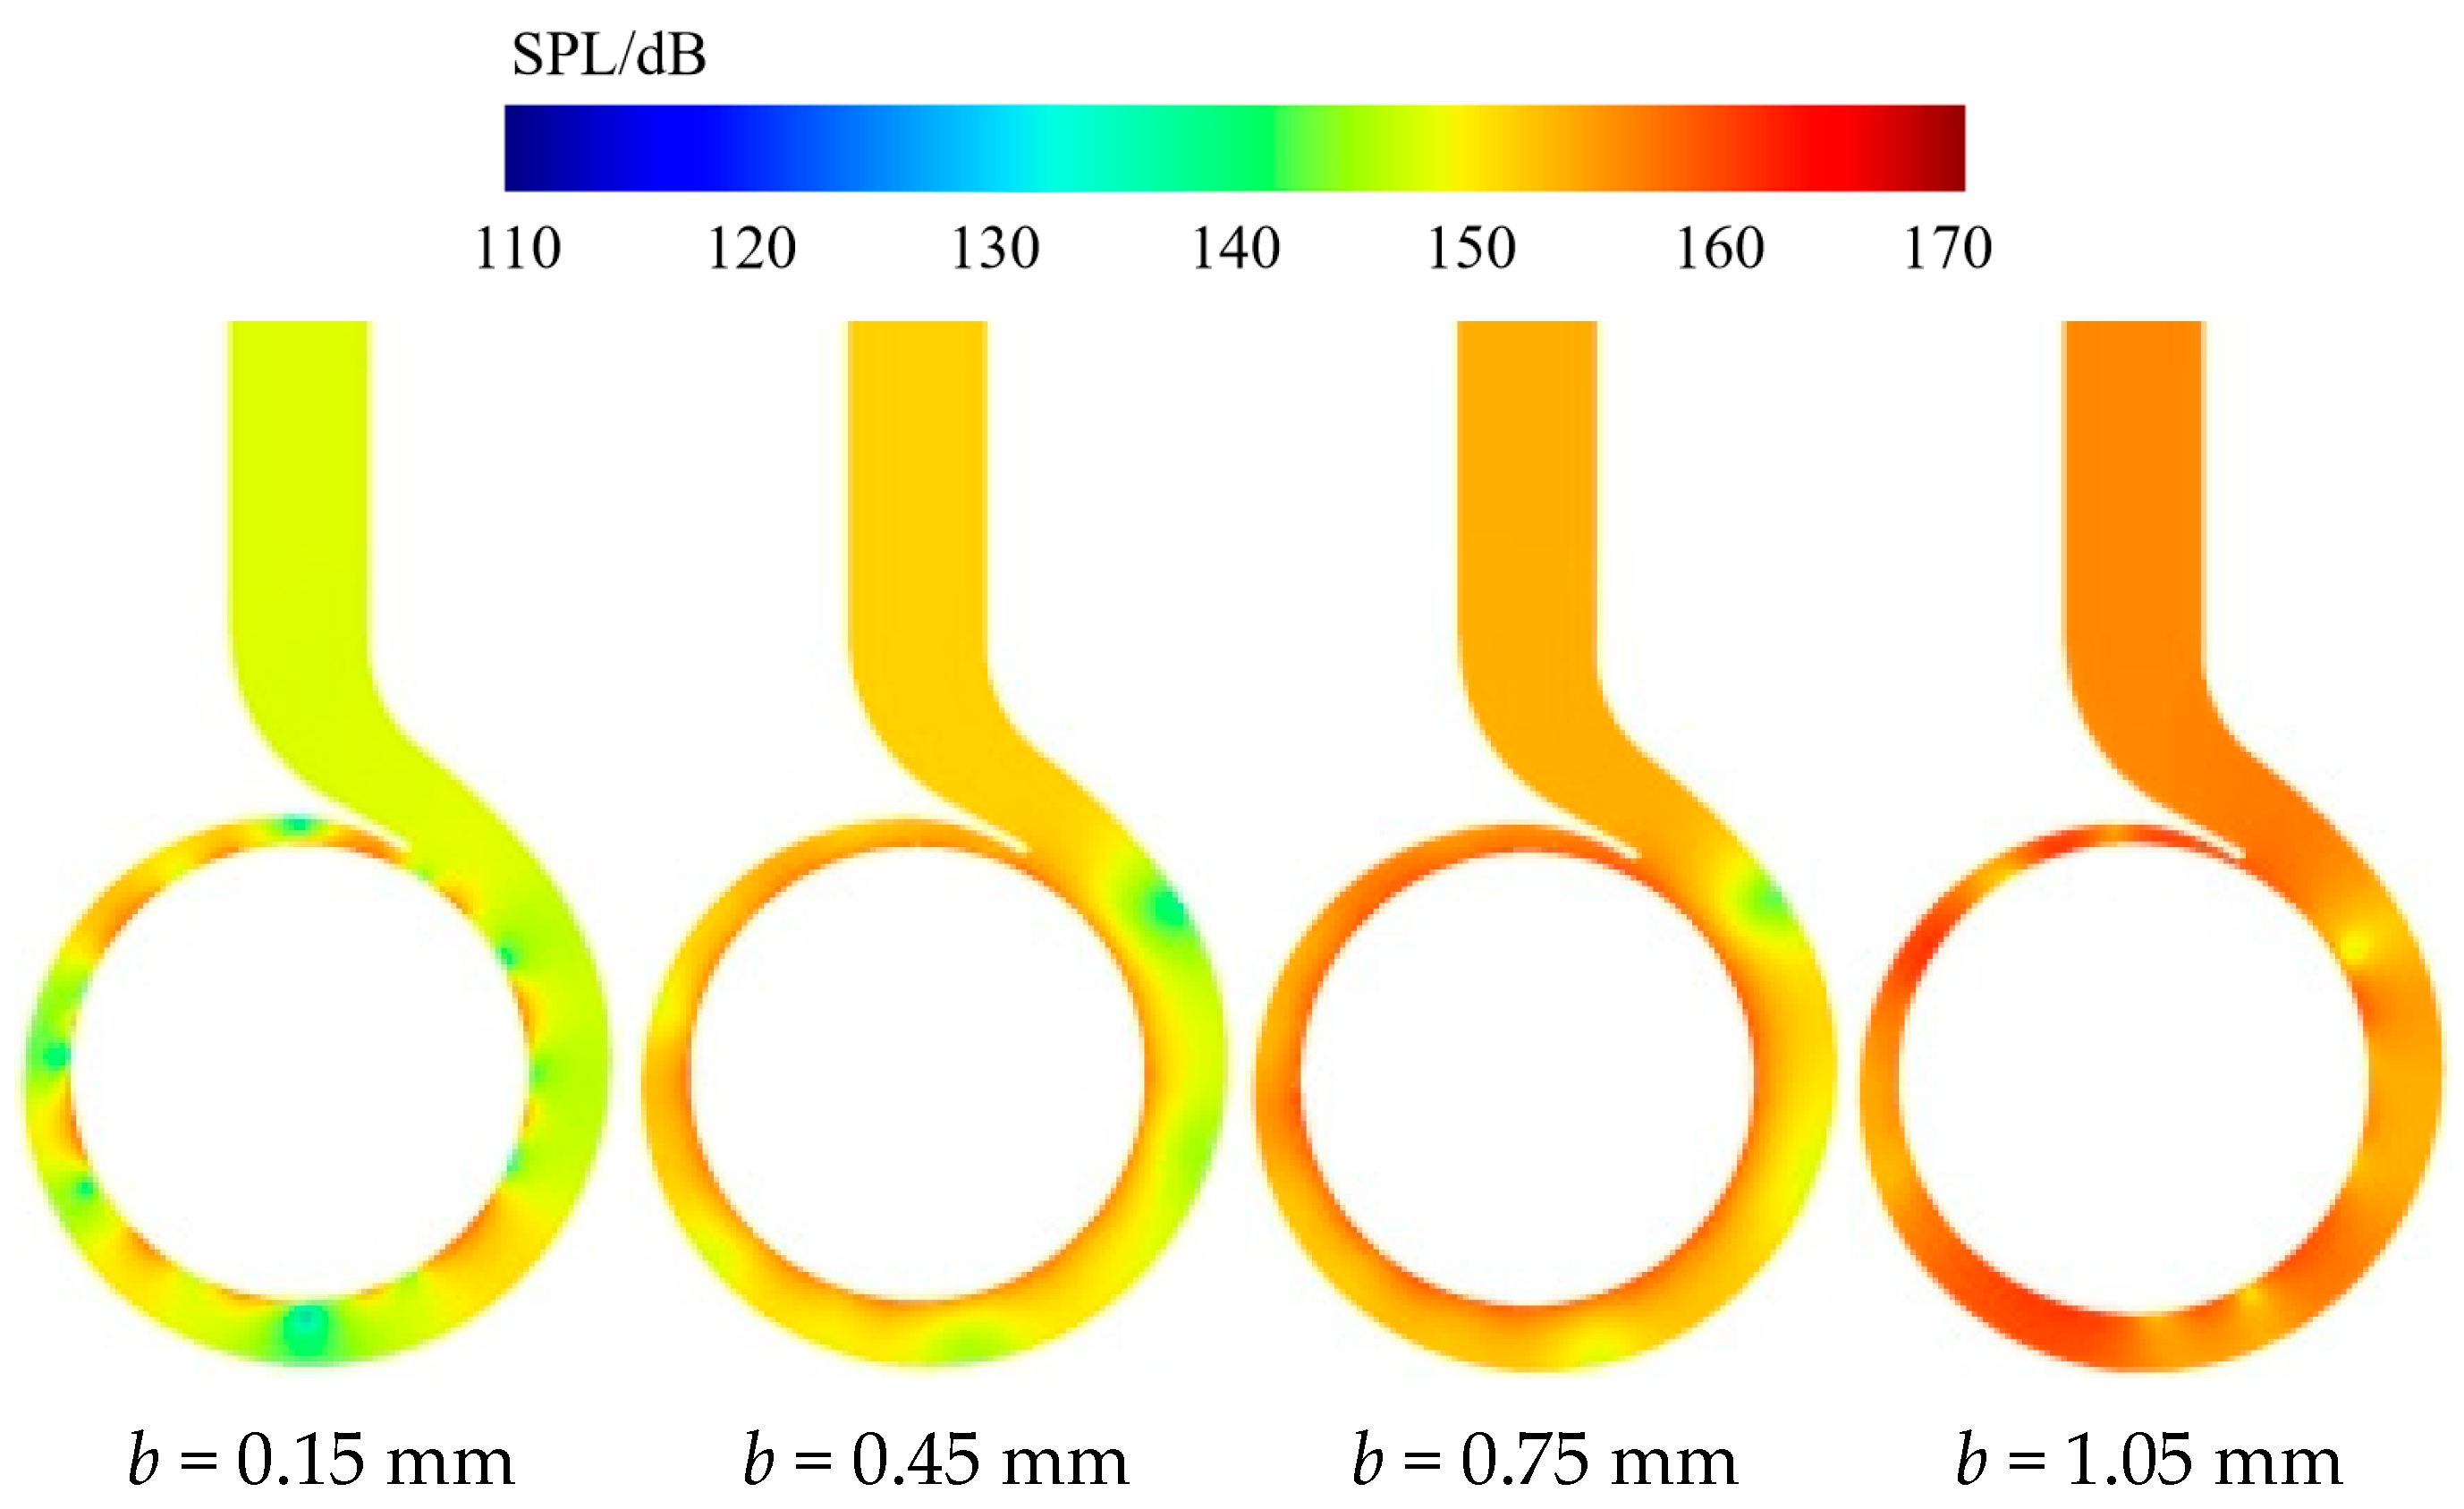
Figure 21 illustrates the sound pressure level (SPL) distribution contours at 295 Hz (blade passing frequency) within the volute. The results demonstrate that as the back wear-ring clearance increases, the overall SPL increases throughout the volute, with the largest rise occurring at the volute inlet surface. At b = 0.15 mm, SPL peaks at the volute inlet with a spatially uniform, point-like distribution primarily attributed to rotor-stator interaction induced by turbulent flow from the impeller outlet. When b = 0.45 mm, volute inlet SPL elevates significantly, transforming into a ring-shaped high-SPL pattern. This high-SPL zone expands radially with further clearance enlargement, ultimately increasing SPL at the discharge pipe. The volute tongue consistently maintains elevated SPL due to accelerated flow velocity in its narrowed passage, which intensifies flow-induced noise.

4.3. Sound Pressure Level Frequency Spectrum Curve Analysis

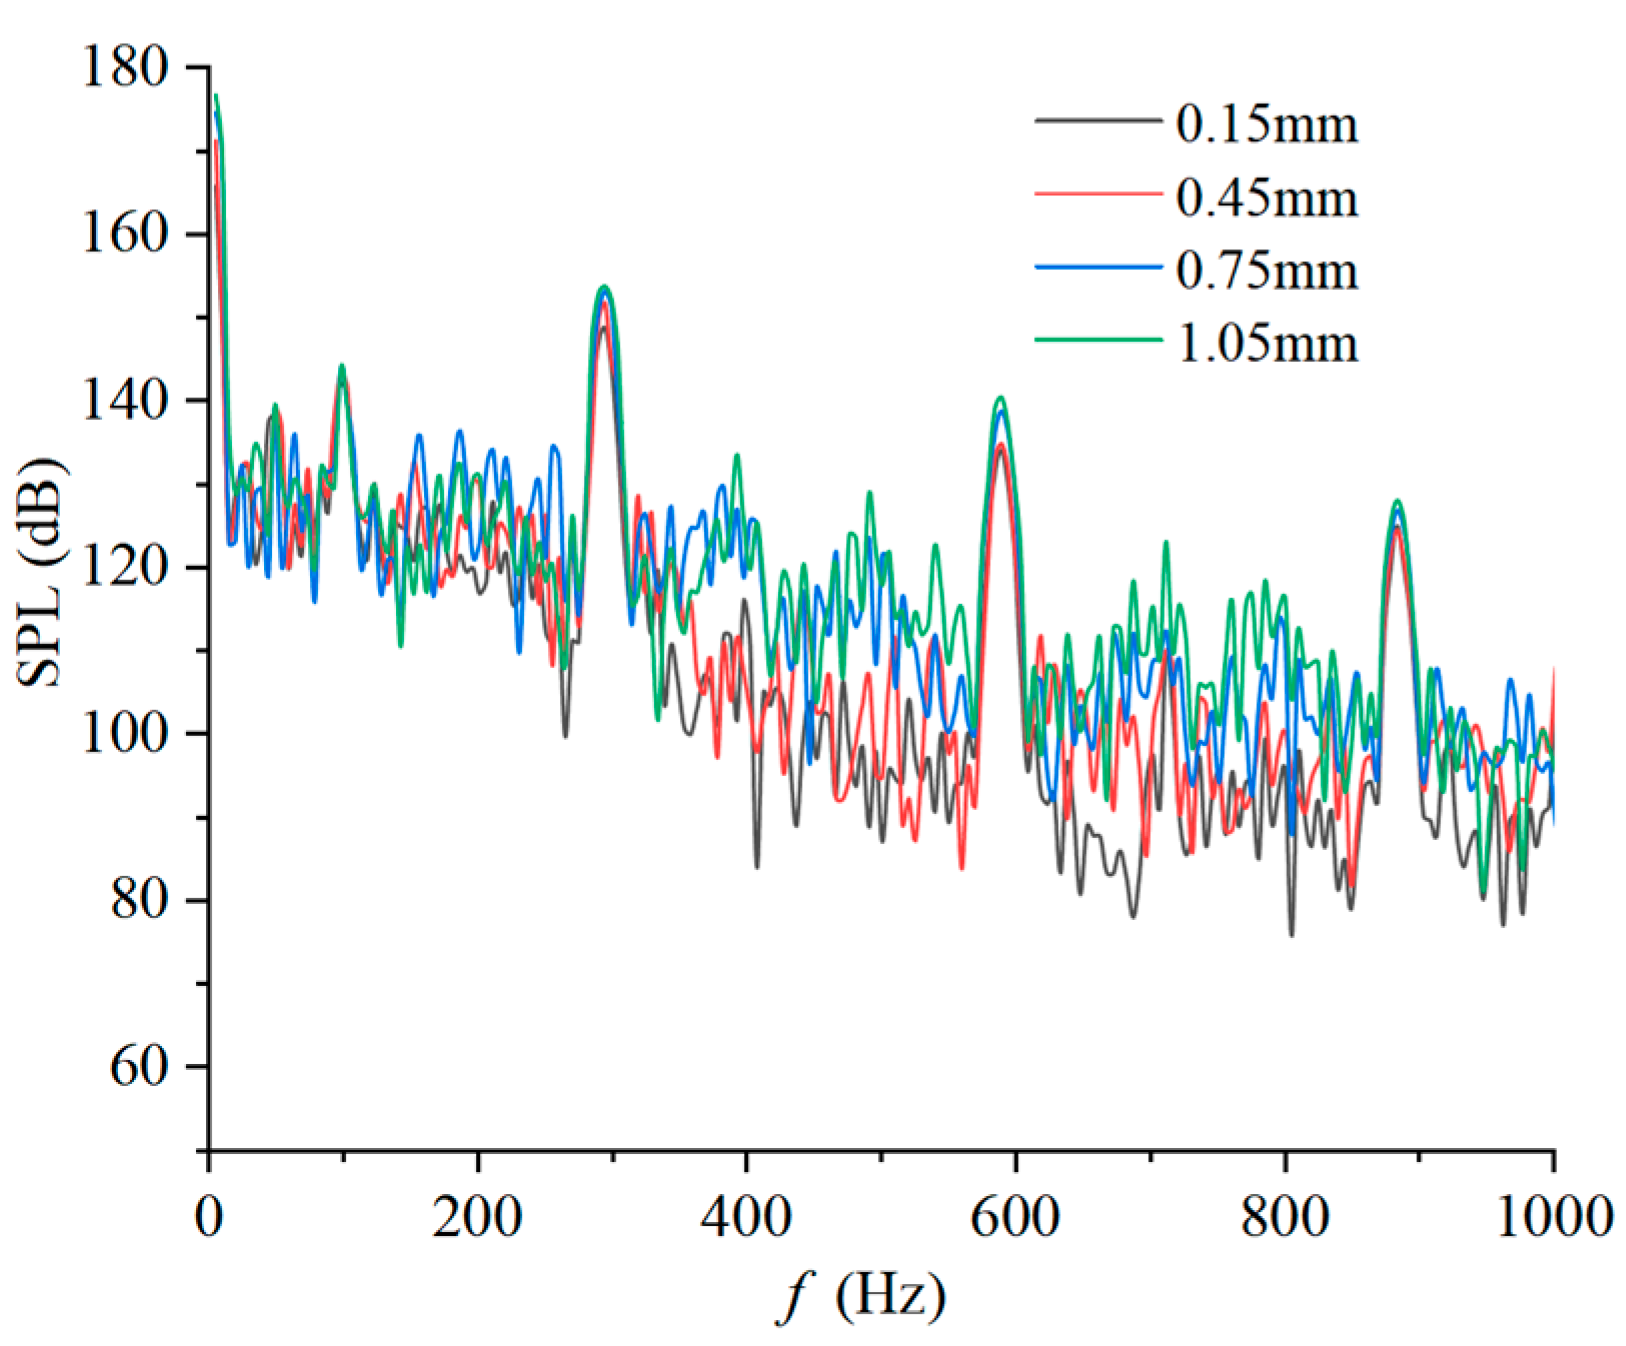
The SPL frequency spectrum curves were derived through frequency response function calculations. Figure 22 presents these curves for all four clearance schemes within the 0–1000 Hz range. Key observations include the following: All curves exhibit broadly similar evolutionary trends, with the blade passing frequency (BPF) consistently serving as the dominant peak; secondary peaks occur at the shaft frequency and its harmonics; SPL curves shift upward progressively with larger clearances; when clearance increases from 0.75 mm to 1.05 mm, the SPL growth gradient attenuates significantly compared to smaller-clearance increments; and the relative SPL increase at BPF (295 Hz) is 11.2% (b = 0.15 → 0.45 mm), 7.1% (0.45 → 0.75 mm), and 1.4% (0.75 → 1.05 mm), demonstrating diminishing acoustic sensitivity to clearance enlargement.

5. Conclusions

The characteristics of the internal flow and sound fields in centrifugal pumps were investigated using a combined approach of computational fluid dynamics and acoustic finite element methods under the design flow rate (Qo = 25 m3/h), and the influence laws of back wear-ring clearance on pump energy performance, flow field characteristics, and internal noise characteristics are analyzed. The conclusions are as follows:
1
With increasing back wear-ring clearance, both the head and efficiency of the centrifugal pump gradually decrease, though the head exhibits a relatively smaller reduction magnitude. For the 1.05 mm clearance scheme compared to 0.15 mm, the head decreases by 4.35% and efficiency reduces by 14.86%.
2
With increased clearance, the low-pressure region at the impeller inlet enlarges, high-pressure areas develop around the balance holes, and pressure in the rear pump chamber drops markedly. Flow velocity within the rear chamber increases with multiple vortices developing; the high-RMS zone near the suction surface widens, while pressure fluctuations at the volute outlet intensify. The dominant frequency of pressure pulsations at the wear-ring clearance is the blade passing frequency (295 Hz), with its pulsation coefficient amplitude increasing by 12.9% under larger clearances.
3
With enlarged back wear-ring clearance, radial force decreases by 38.6% (0.15→1.05 mm clearance) and loses 92% of its periodic component amplitude due to pressure field asymmetry. Axial force reverses 180° with magnitude increasing by 224% (from +45.6 N to −88.1 N at 0.45 mm clearance), while further clearance enlargement to 1.05 mm causes an additional 31% rise (to −115.3 N).
4
Increasing back wear-ring clearance from 0.15 mm to 1.05 mm causes minor suction chamber changes but critically amplifies rotor–stator interface SWL by 62%, volute tongue energy density by 38%, and back ring outlet pulsation by 41%. High-intensity zones expand 112% near balance holes, while suction surface SPL rises 18.3 dB. Overall OASPL increases by 1.8 dB with 38% spatial expansion of high-SPL regions at rotor–stator interfaces.
5
Across all clearances, the blade passing frequency (295 Hz) remains the dominant SPL frequency within the pump. As clearance increases from 0.15 mm to 1.05 mm, the overall internal SPL rises, with SPL at the blade frequency progressively increasing. Specifically, total SPL at 1.05 mm clearance is 1.8% higher than at 0.15 mm. For frequencies exceeding 350 Hz, SPL fluctuates between 80 and 140 dB.

Author Contributions

Conceptualization, H.L. and D.W.; methodology, M.T. and X.W.; validation, P.Z. and M.T.; formal analysis, P.Z. and M.T.; data curation, M.T. and H.L.; writing—original draft preparation, P.Z. and M.T.; writing—review and editing, P.Z. and M.T. All authors have read and agreed to the published version of the manuscript.

Funding

This research received no external funding.

Data Availability Statement

The original contributions presented in this study are included in the article. Further inquiries can be directed to the corresponding author.

Conflicts of Interest

The authors declare no conflicts of interest.

Nomenclature

bBack wear-ring clearance, mm
BPFBlade Passing Frequency, Hz
cSpeed of sound in fluid, m/s
coReference sound speed in undisturbed fluid, m/s
CpDimensionless pressure pulsation coefficient
CFDComputational Fluid Dynamics, Method
fFrequency, Hz
fmaxMaximum calculation frequency, Hz
FEMFinite Element Method, Method
HPump head, m
kTurbulent kinetic energy, m2/s2
LAcoustic grid size, m
LpSound power level, dB
nRotational speed, rpm
OASPLOverall Sound Pressure Level, dB
PInstantaneous pressure, Pa
PoReference sound pressure, Pa
PaSound power, W
PrefReference sound power, W
QoDesign flow rate (25 m3/h), m3/h
RMSRoot Mean Square of pressure pulsation
SASScale-Adaptive Simulation turbulence model, Model
SWLSound Power Level, dB
SPLSound Pressure Level, dB
SSTShear Stress Transport turbulence model, Model
TijLighthill stress tensor, N/m2
uCircumferential speed at impeller outer diameter, m/s
utTurbulent velocity, m/s
ωTurbulent vortex frequency, rad/s
ρFluid density, kg/m3
ρ0Fluid density in undisturbed medium, kg/m3
εTurbulent energy dissipation rate, m2/s3
ΔfFrequency resolution (bin width), Hz

References

  1. Yang, T.; Li, D.; Zhao, Y.-N.; Zhu, S.-C. Application of centrifugal pump and energy saving technical transformation. Chem. Manag. 2022, 12, 114–116. [Google Scholar]
  2. Luo, X.-Q.; Wu, D.-Z. The progress and development trend of pump technology. J. Hydroelectr. Power 2020, 39, 1–17. [Google Scholar] [CrossRef]
  3. Huo, Y.-W.; Yu, M.; Luo, X.-W.; Zhang, Y.; Ma, B.; Liu, D.-S.; Gao, J.-L. Research and technical development of centrifugal pump noise. Ship Sci. Technol. 2022, 44, 7–12. [Google Scholar]
  4. Luo, X.-W.; Ye, W.-X.; Song, X.-Y.; Geng, C. Future Fluid Machinery Technology Supporting the “Dual Carbon” Goal. J. Tsinghua Univ. (Nat. Sci. Ed.) 2022, 62, 678–692. [Google Scholar] [CrossRef]
  5. Yan, N.; Wang, X.; Wu, X.; Zhu, J. Study on the form of sealing ring and its sealing characteristics of centrifugal pump. J. Phys. Conf. Ser. 2024, 2752, 012117. [Google Scholar] [CrossRef]
  6. Mou, J.-G.; Chen, Z.-F.; Gu, Y.-Q.; Fan, T. Effect of sealing ring clearance on pump performance. World Pumps 2016, 2016, 38–41. [Google Scholar] [CrossRef]
  7. Wang, C.; Shi, W.-D.; Zhang, L.; Hu, Y.-C. Calculation formula optimization and effect of ring clearance on axial force of multistage pump. Math. Probl. Eng. 2013, 2023, 749375. [Google Scholar] [CrossRef]
  8. Zhao, W.-G.; Qiang, H.-H.; Xu, Q.; Liu, M. Influence of geometric parameters of front wear-ring of vertical self-priming pump on its self-priming performance. J. Irrig. Mech. Eng. 2024, 42, 333–341. [Google Scholar]
  9. Fu, Q.; Chen, Y.; Huang, Q.; Zhu, R.; Wang, X.; Lin, B. Influence of front ring clearance on internal flow characteristics of centrifugal pump. J. Chongqing Univ. Technol. (Nat. Sci.) 2022, 36, 203–209. [Google Scholar]
  10. Ayad, A.-F.; Abdalla, H.-M.; Aly, E.-A. Effect of semi-open impeller side clearance on the centrifugal pump performance using CFD. Aerosp. Sci. Technol. 2015, 47, 247–255. [Google Scholar] [CrossRef]
  11. Zhu, X.-Y.; Zhang, X.-Z.; Liu, J.-Y.; Zhang, Q. Numerical study on the influence of ring clearance on the performance of chemical canned motor pump. J. Shandong Jianzhu Univ. 2024, 39, 56–65. [Google Scholar]
  12. Luo, Y.; Zhang, W.; Fan, Y.; Han, Y.; Li, W.; Acheaw, E. Analysis of vibration characteristics of centrifugal pump mechanical seal under wear and damage degree. Shock. Vib. 2021, 2021, 1070–9622. [Google Scholar] [CrossRef]
  13. Isaev, N.; Budaev, G.; Danilovet, D.; Dobrokhodov, K. Investigation of the influence of wear in impeller seals on the axial force in double suction pumps. IOP Conf. Ser. Mater. Sci. Eng. 2020, 779, 012051. [Google Scholar] [CrossRef]
  14. Will, B.-C.; Benra, F.-K.; Dohmen, H.-J. Investigation of the flow in the impeller side clearances of a centrifugal pump with volute casing. J. Therm. Sci. 2012, 21, 197–208. [Google Scholar] [CrossRef]
  15. Cai, Y.; Xie, Z.; Yang, F.; Yan, M.; Mou, C.; Huang, Z.; Jin, Y.; Mou, J.; Gu, Y. Study on the Influence of Bionic Structure on the Sealing Performance of Centrifugal Pump Sealing Ring. Lubricants 2025, 13, 26. [Google Scholar] [CrossRef]
  16. Liu, H.-L.; Ding, J. Investigation into transient flow in a centrifugal pump with wear ring clearance variation. Adv. Mech. Eng. 2015, 6, 693097. [Google Scholar] [CrossRef]
  17. Zhang, N.; Gao, B.; Li, Z.; Ni, D.; Yang, M.; Jiang, Q. Experimental study on the effect of centrifugal pump mouth ring clearance on pressure pulsation characteristics. J. Eng. Thermophys. 2019, 40, 1520–1525. [Google Scholar]
  18. Mauro, G.; Pascal, B.; Sergio, A.; Mirasso, A.E. An application of the scale-adapted simulation to the unsteady flow across a tube bundle. Int. J. Heat Fluid Flow 2022, 96, 109007. [Google Scholar] [CrossRef]
  19. Song, Z.; Chen, Y.; Yu, T.; Wang, X.; Cao, H.; Li, Z.; Lang, X.; Xu, S.; Lu, S.; Jiang, C. Influence of the Trailing Edge Shape of Impeller Blades on Centrifugal Pumps with Unsteady Characteristics. Processes 2024, 12, 508. [Google Scholar] [CrossRef]
  20. Zhang, N.; Dong, H.; Zheng, F.; Gad, M.; Li, D.; Gao, B. Investigation of the Impact of Rotor-Stator Matching Modes on the Pressure Pulsations of the Guide Vane Centrifugal Pump. Ann. Nucl. Energy 2025, 214, 111189. [Google Scholar] [CrossRef]
  21. Li, N. On sound propagation characteristics of waterjet duct based on acoustic finite element method. Shipping 2023, 34, 50–55. [Google Scholar] [CrossRef]
  22. Lighthill, M.-J. On sound generated aerodynamically: Part I: General theory. Proc. R. Soc. Lond. 1952, 211, 564–587. [Google Scholar] [CrossRef]
  23. Ennouri, M.; Kanfoudi, H.; Bel Hadj Taher, A.; Zgolli, R. Numerical flow simulation and cavitation prediction in a centrifugal pump using an SST-SAS turbulence model. J. Appl. Fluid Mech. 2019, 12, 25–39. [Google Scholar] [CrossRef]
  24. Proudman, I. The generation of noise by isotropic turbulence. Proc. R. Soc. A 1952, 214, 119–132. [Google Scholar] [CrossRef]
  25. Lilley, G.-M. The radiated noise from isotropic turbulence. Theor. Comput. Fluid Dyn. 1994, 6, 281–301. [Google Scholar] [CrossRef]
Figure 1. Computational domain.
Processes 13 02641 g001
Figure 2. Different back ring clearance schemes.
Processes 13 02641 g002
Figure 3. Grids of various parts of the computational domain.
Processes 13 02641 g003
Figure 4. Grid dependence check.
Processes 13 02641 g004
Figure 5. Test rig.
Figure 5. Test rig.
Processes 13 02641 g005
Figure 6. Comparison of pump performance.
Processes 13 02641 g006
Figure 7. Comparison of internal flow noise.
Processes 13 02641 g007
Figure 8. H-η curve of different wear-ring schemes.
Processes 13 02641 g008
Figure 9. Pressure distribution at Qo = 25 m3/h.
Processes 13 02641 g009
Figure 10. Velocity and streamline distribution at Qo = 25 m3/h.
Processes 13 02641 g010
Figure 11. Monitoring points.
Processes 13 02641 g011
Figure 12. RMS distribution of pulsating pressure at Qo = 25 m3/h.
Processes 13 02641 g012
Figure 13. Frequency-domain pressure pulsation at Qo = 25 m3/h.
Processes 13 02641 g013
Figure 14. Radial resultant distribution of impeller under the back wear-ring scheme.
Processes 13 02641 g014
Figure 15. Axial force distribution of the impeller under back wear-ring scheme.
Processes 13 02641 g015
Figure 16. Sound power level (SWL) in the suction chamber at Qo = 25 m3/h.
Processes 13 02641 g016
Figure 17. Sound Power Level (SWL) Contours at Volute Outlet at Qo = 25 m3/h.
Processes 13 02641 g017
Figure 18. Sound Power Level (SWL) Contours of pump axial section at Qo = 25 m3/h.
Processes 13 02641 g018
Figure 19. Sound Pressure Level (SPL) Distribution on Mid-plane at 295 Hz.
Processes 13 02641 g019
Figure 20. Sound Pressure Level (SPL) Distribution in Leakage flow path at 295 Hz.
Processes 13 02641 g020
Figure 21. Sound pressure level (SPL) distribution in volute at 295 Hz.
Processes 13 02641 g021
Figure 22. Sound pressure level curve of different wear-ring clearances at Qo = 25 m3/h.
Processes 13 02641 g022
Table 1. Energy performance measurement parameters.
Instrument NameModelRangeAccuracy
Electromagnetic FlowmeterDXLD-500.1~85 m3/h±0.2%
Static pressure sensorMEA30000~1 MPa±0.1%
HydrophoneRHSA-1020 Hz~200 kHz±2 dB
Disclaimer/Publisher’s Note: The statements, opinions and data contained in all publications are solely those of the individual author(s) and contributor(s) and not of MDPI and/or the editor(s). MDPI and/or the editor(s) disclaim responsibility for any injury to people or property resulting from any ideas, methods, instructions or products referred to in the content.