Abstract
Butyric acid is one of the main volatile fatty acids (VFAs) in Maotai-flavor liquor wastewater (MFLW), and its degradation process exhibits a positive Gibbs free energy, making it prone to accumulation during high-load anaerobic digestion (AD), which can lead to system instability or even failure. In this study, hydrochar (HTC) was prepared from rice husk obtained from distiller’s grains, and butyrate-degrading microbiomes were selectively enriched under acidic conditions with butyric acid as the sole carbon source. Through co-incubation, the butyrate-degrading microbiomes were successfully pre-coupled with HTC, forming a “hydrochar–microbe” composite, which was then applied to the AD of MFLW. The experimental results demonstrated that this composite enhanced system performance. The hydrochar–butyrate pre-coupling group (HBA-C) showed a 15.48% increase in methane yield compared to the control group (CK), with a soluble chemical oxygen demand (sCOD) removal rate of 75.02%, effectively mitigating VFA accumulation. Microbial community analysis indicated higher bacterial and archaeal diversity indices in the HBA-C group. qPCR results showed that the bacterial and archaeal copy numbers in the HBA-C group were 22.06-times and 13.80-times higher than those in the CK group, respectively. Moreover, the relative abundance of the genes for the key enzymes methylmalonyl-CoA carboxyltransferase (EC: 2.1.3.1) and succinate dehydrogenase (EC: 1.3.5.1) was significantly increased, indicating that the “hydrochar–microbe” coupling enhanced carbon flow distribution efficiency and energy metabolism by optimizing metabolic pathways. This study provides an innovative strategy for MFLW treatment and offers practical value for anaerobic digestion optimization and high-strength wastewater management.
1. Introduction
During the production of Maotai-flavor liquor wastewater (MFLW), the ratio of alcohol yield to wastewater generated is approximately 1:8–15 [1]. With an annual Baijiu output of 4.145 million kiloliters in China, this leads to a large amount of high-strength wastewater that requires effective treatment. The wastewater from Baijiu production contains organic acids, alcohols, phenolic compounds, and other organic chemicals, resulting in high soluble chemical oxygen demand (sCOD) and low pH (3.0–5.0). Improper disposal of liquor wastewater can cause severe environmental pollution. Anaerobic digestion (AD) is an efficient method for treating high-concentration organic wastewater, as it reduces waste discharge while generating methane, and producing methane, making it a mainstream organic waste treatment process [2].
Instability in AD performance (such as pH fluctuations, VFA accumulation, or imbalances in microbial populations) is a major challenge for fermentation systems, as AD efficiency heavily depends on the coordinated activity of diverse microbial communities. Butyric acid is one of the main volatile fatty acids (VFAs) in MFLW. Unlike acetic acid, the degradation process of butyric acid has a positive Gibbs free energy. Under high-load AD, butyric acid easily accumulates, which can ultimately destabilize the reactor and lead to system failure [3]. Therefore, achieving rapid degradation of butyric acid is crucial for maintaining the stability of anaerobic reactors. The practice of feeding different substrates to enrich functional microorganisms has been proven to be an effective method for organic wastewater treatment [4]. Recent studies show that continuous acclimatization with various substrates (e.g., sodium acetate, glucose, and wood vinegar wastewater) promotes the enrichment of dominant functional microbial communities [5]. Thus, from a theoretical perspective, acclimating and enriching butyrate-degrading microorganisms can alleviate the inhibition caused by butyric acid accumulation. Optimizing both enzyme system and metabolic pathways of microbial communities for butyric acid degradation can ensure high degradation efficiency under high-load and complex environmental conditions.
To enhance the stability and stress resistance of the acclimated microbial communities, porous carbon-based materials are increasingly being used to support microbial functions. In addition, carbon-based materials also have the potential to induce direct interspecies electron transfer (DIET) pathways between microorganisms. Previous studies demonstrate that the addition of conductive materials like biochar and magnetite significantly enhances DIET in AD, thereby improving process efficiency [6]. Although carbon-based materials including biochar and hydrochar (HTC) exhibit potential for facilitating DIET and enhancing anaerobic digestion, their performance strongly depends on key physicochemical properties such as conductivity, pore structure, and surface functional groups. In contrast to interspecies electron transfer (IET) mediated by H2 and formate, DIET operates independently of material transfer, enabling higher electron transfer efficiency [7]. The incorporation of biochar allows specific electroactive microorganisms to adhere to and colonize its surface [8]. When compared with pyrochar and activated carbon, HTC demonstrates superior performance in enhancing the AD of glucose and waste anaerobic sludge owing to its more abundant surface oxygen-containing functional groups [9]. Recent evidence indicates that HTC boosts methane production from glucose through a surface-functional-group-mediated DIET process [10]. Consequently, HTC represents an ideal material for microbial support.
In this study, rice husks screened from distiller’s grains (a low-cost and readily available byproduct of liquor production) were used as the raw material for HTC preparation. Owing to their high lignocellulose and silica content, rice husks enable the formation of porous and surface-functionalized HTC, which provides a favorable matrix for microbial colonization in anaerobic systems. Under acidic conditions, butyrate-degrading microbiomes were selectively acclimated using butyric acid as the sole carbon source. Through co-incubation, the enriched microbial community was successfully pre-coupled with HTC, forming a “hydrochar–microbe” composite. This composite refers to the biofilm-like attachment of microbes onto the porous surface of HTC, facilitated by electrostatic interactions and hydrogen bonding with surface oxygen-containing functional groups (e.g., –OH, –COOH). In addition, the semiconductive nature of HTC potentially promotes DIET, enhancing metabolic cooperation between microbial species. This synergistic system was then applied to the treatment of MFLW. By integrating AD performance evaluation (sCOD, VFAs, methane production, etc.) with high-throughput sequencing technology, the impacts of “hydrochar–microbe” coupling in MFLW were comprehensively analyzed, and its potential mechanisms were explored. This study provides both theoretical support and technical solutions for the efficient AD of high-COD concentration MFLW.
2. Materials and Methods
2.1. Inoculum and Substrates
Anaerobic granular sludge was obtained from Zikun Environmental Protection Technology Co., Ltd., Zhengzhou, China. The total solids (TS) content was 13.62 ± 0.14%, and the volatile solids (VS) content was 9.32 ± 0.08% (based on fresh weight). The sludge was acidified by adjusting the pH to 6.24 with 1 mol/L HCl.
MFLW contains organic acids, alcohols, phenols, esters, aldehydes, and other substances. We analyzed actual MFLW samples, and the main organic components can be categorized into three major groups. The first group includes organic acids such as caproic acid, valeric acid, butyric acid, and acetic acid. The second group consists of alcohols like ethanol, propanol, butanol, pentanol, and furfuryl alcohol. The third group includes phenolic compounds like phenol, p-cresol, and guaiacol. Based on their contribution to the sCOD in wastewater, caproic acid, valeric acid, butyric acid, ethanol, phenol, and p-cresol were selected as the major components of the simulated wastewater. These compounds contribute 80% of the soluble sCOD in the wastewater, with specific concentrations of 1.38 g/L for caproic acid, 1.09 g/L for valeric acid, 1.17 g/L for butyric acid, 0.773 g/L for phenol, 0.51 g/L for p-cresol, and 0.61 g/L for ethanol.
2.2. Preparation of HTC
Rice husks were separated from distiller’s grains, washed three times with deionized water, and dried at 65 °C. The dried rice husks were then ground and sieved through a 150-mesh screen. The ground rice husks were mixed with deionized water at a 1:10 (w/w) ratio and were placed in a hydrothermal reactor. The reactor was flushed with high-purity nitrogen gas to replace the air in the upper space, and the hydrothermal reaction was conducted at 260 °C for 4 h. After the reaction, the product was cooled to room temperature, and HTC was filtered using a vacuum pump (SHZ-D(III), Yu Hua, Zhengzhou, China). To remove the bio-oil adhered to the HTC surface, the product was washed three times with 75% ethanol and deionized water. Finally, the HTC was dried at 105 °C. The obtained HTC was named CH-260.
2.3. Batch Experiment Design
Pre-coupling of sludge: Acidic sludge was divided into three 5 L blue-necked bottles, labeled as R1, R2, and R3. In group R2, 2 g/L butyric acid was added every 5 days, while group R3 was fed with 2 g/L butyric acid and 20 g/L HTC every 5 days. Group R1 served as the control group with no treatment. All samples were incubated at 35 ± 1 °C for 15 days.
A batch experiment was conducted to investigate the effect of the “hydrochar–microbe” coupling on the AD of MFLW. Four experimental groups and one control group were set up, as outlined in Table 1. The batch experiment used 500 mL blue-necked bottles as reactors, with a working volume of 300 mL. The inoculum-to-substrate ratio was 1:1 (v/v), and the HTC content in the system was 10 g/L, resulting in a final solid content of 6.81 g TS/L. To ensure anaerobic conditions, the reactors were purged with high-purity nitrogen gas for 30 s before sealing. The reactors were incubated at 35 ± 1 °C in an incubator, with manual agitation once per day. Pressure in the reactors was measured daily to calculate biogas production, and biogas was collected in aluminum foil gas collection bags for methane content analysis. Liquid samples were taken on days 0, 1, 2, 3, 4, 5, 7, 10, and 14 using a syringe for analysis of key indicators (sCOD, pH, and VFA concentration). Each treatment group had six replicates: three for gas measurements and three for liquid sample analysis to ensure data reliability and reproducibility.

Table 1.
Experimental design.
2.4. Determination of Key Physicochemical Properties
The pH was immediately measured using a pH meter (FE28, Mettler Toledo, Shanghai, China) after sampling the liquid. The liquid samples were centrifuged at 8000 rpm for 10 min using a centrifuge (5810R, Eppendorf, Hamburg, Germany), and the supernatant was collected for the analysis of sCOD and VFAs. sCOD was measured using the potassium dichromate method [11]. Sulfuric acid–silver sulfate solution, mercuric sulfate solution, and standard potassium dichromate solution were added to a clean digestion tube and mixed well. The water sample was added, homogenized well, and digested in the sealed tube at 165 °C for 15 min. The methane content in the gas samples and the VFA content in the liquid samples were determined using a gas chromatograph (8890, Agilent, Guangzhou, China) as described in previous studies [12]. For methane content measurement, an HP-PLOT/Q column was equipped. High-purity N2 was used as the carrier gas (40 mL/min). The column temperature was 60 °C. The inlet and FID temperature was 250 °C. Each time, 100 µL biogas sample was rapidly injected from the injection port. VFAs were measured using an HP-FFAP column with N2 as the carrier gas (40 mL/min). The temperature of the inlet was 220 °C and 280 °C, respectively. Quantification was performed by the external standard method. The pressure in the reactor was measured with a pressure gauge (82100, HengXin, Pingtung City, Taiwan), and the gas volume was calculated using the following Equation (1). Daily methane production was obtained by multiplying the biogas volume by the daily methane content:
where Vbiogas is the daily methane volume in mL; ΔP is the absolute pressure difference between the reactor pressure and atmospheric pressure in kPa; Vheadspace is the volume of the reactor’s headspace in mL; C is the molar volume at 273.15 K, 101.325 kPa (22.41 L/mol); R is the universal gas constant (8.314 L·kPa/(K·mol)); and T is the absolute temperature in K.
To quantitatively analyze methane production under different conditions, the modified Gompertz model was applied to simulate methane yield, as shown in Equation (2) [13]:
where Mt is the cumulative methane production at time t, Y0 is the maximum methane production, Rm is the maximum methane production rate, and λ is the lag phase.
2.5. Microbial Community Analysis
On day 2, 2 mL of sludge samples was collected for genomic DNA extraction and amplicon sequencing. The V3-V4 hypervariable region of bacterial 16S rRNA was amplified by PCR using the bacterial primers 338F (5′-ACTCCTACGGGAGGCAGCAG-3′) and 806R (5′-GGACTACHVGGGTWTCTAAT-3′). The archaeal primers 524F10extF (5′-TGYCAGCCGCCGCGGTAA-3′) and Arch958RmodR (5′-YCCGGCGTTGAVTCCAATT-3′) were used to amplify the V4–V5 region of archaea [12].
2.6. Quantitative PCR Analysis
For qPCR analysis, liquid samples from day 2 of AD were used to quantify bacteria and archaea. After centrifugation at 4000 rpm for 10 min, the supernatant was discarded. A 200 mg sample of sludge was extracted using the Rapid Soil DNA Isolation Kit (Sangon Biotech, Shanghai, China)to obtain total DNA. Using the DNA mixture as a template, PCR amplification was performed with bacterial primers 338F-1225 (5′-ATCTAAGTTTTAATTACAAAGGTACCACTCCTACGGGAGGCAGC-3′) and 806R-1225 (5′-AGCGTCTCACTTCAAACGCAGTCGACGGACTACHVGGGTWTCTAAT-3′) and archaeal primers 524F10extF-1225 (5′-ATCTAAGTTTTAATTACAAAGGTACCTGYCAGCCGCCGCGGTAA-3′) and Arch958RmodR-1225 (5′-AGCGTCTCACTTCAAACGCAGTCGACYCCGGCGTTGAVTCCAATT-3′). PCR conditions for bacterial primers were as follows: 95 °C pre-denaturation for 3 min, followed by 34 cycles of 95 °C for 15 s, 67.2 °C for 15 s, and 72 °C for 15 s, with a final extension at 72 °C for 5 min. PCR conditions for archaeal primers were 95 °C pre-denaturation for 3 min, followed by 34 cycles of 95 °C for 15 s, 70 °C for 15 s, and 72 °C for 15 s, with a final extension at 72 °C for 5 min. After amplification, PCR products were purified and recovered using a gel recovery kit. The purified PCR products were ligated into the pG418-TEF1p vector according to the manufacturer’s instructions, and positive clones were extracted and quantified to determine plasmid concentration (ng/μL). A standard curve was generated by performing a 10-fold dilution of the standard plasmid and using it as a template for real-time qPCR amplification to correlate Ct values with plasmid copy number. Sample DNA was also amplified on the real-time qPCR machine, and absolute quantification of total bacteria and archaea was performed [14]. The standard curves for bacterial and archaeal qPCR exhibited strong linearity, with R2 values of 0.9981 and 0.9946, respectively. The amplification efficiencies were 93.2% for bacterial primers and 91.6% for archaeal primers, both falling within the acceptable range (90–110%) for accurate quantification.
2.7. Data Analysis
Data processing and plotting were performed using Origin 2022 software (OriginPro 2022, OriginLab Corporation, Northampton, MA, USA). Three replicates were set for each treatment to ensure result reproducibility. One-way ANOVA was used to compare differences among groups, followed by Tukey’s post hoc test to assess pairwise significance. A significance level of p < 0.05 was considered statistically significant, and corrections for multiple comparisons were applied where appropriate.
3. Results and Discussion
3.1. Effects of Different Enhancement Methods on Biogas and Methane Production
The pH changes during the batch experiment are shown in Figure 1a. The pH of all treatment groups initially rapidly increased from 6.0 to 7.5 within the early stage of the experiment and remained stable thereafter. Methane content stabilized at approximately 65% starting from day 3 (Figure 1b). Biogas yield analysis showed that the HBA-C, HBA, and BA groups reached peak biogas production rapidly on day 2 (Figure 1c), indicating that butyrate acclimation and HTC addition promoted biogas production, with the HBA-C group showing the most pronounced effect. This suggests that the “hydrochar–microbe” coupling optimized AD performance more effectively than other treatments.
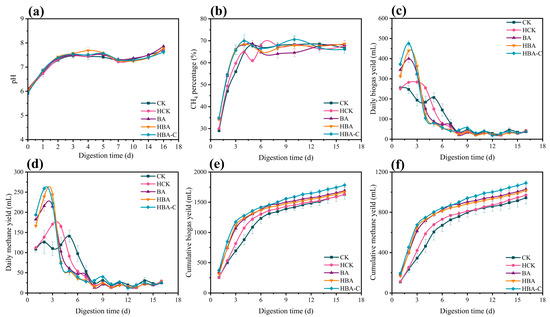
Figure 1.
Changes in (a) pH, (b) methane content, (c) daily biogas production, (d) daily methane production, (e) cumulative biogas, and (f) cumulative methane during anaerobic digestion for different treatment groups.
Changes in methane production are shown in Figure 1d. Peak methane production for the HBA-C, HBA, BA, and HCK groups occurred on days 2–3, with daily yields of 259.01, 243.81, 215.88, and 170.34 mL, respectively. The HBA-C group reached its peak methane production on day 2. The cumulative methane yields were 1090.75, 1017.09, 1030.08, and 970.45 mL, representing increases of 15.48%, 7.68%, 9.01%, and 2.7% compared to the CK group (944.55 mL). During the first three days, there were differences in the cumulative biogas yield across the experimental groups, with a range of 692.2 to 1276.90 mL (Figure 1e). At the end of the experiment, the cumulative biogas yield in the HBA-C group reached 1783.06 mL, higher than those in the HBA (1670.02 mL), BA (1692.12 mL), HCK (1633.50 mL), and CK (1629.15 mL) groups, indicating that the enhancement strategies in the HBA-C, HBA, BA, and HCK groups all contributed to increased biogas production, with the HBA-C group showing the most significant improvement.
Kinetic parameter analysis based on the Gompertz model (Table 2) revealed that the methane production lag phase for the CK group was 0.33 ± 0.08 days, while the lag phases for the HCK, BA, HBA, and HBA-C groups were reduced to 0.17 ± 0.05, 0.06 ± 0.02, 0.22 ± 0.04, and 0 days, respectively. The HBA-C group showed no lag phase (λ = 0), indicating the highest startup efficiency. It should be noted that although the model fitting yielded a lag phase (λ) value of zero for the HBA-C group, this result may reflect the limitations of the experimental resolution or model sensitivity. Biologically, some degree of microbial adaptation and system adjustment is still expected at the initial stage. Although the trends of methane production for the CK and experimental groups were similar in the first three days, the experimental groups exhibited significantly higher daily methane production compared to the CK group. In conclusion, the addition of HTC and butyrate-acclimated microbiomes proved effective in enhancing AD performance, with the “hydrochar–microbe” coupling demonstrating the best enhancement effect. Although existing studies have demonstrated that HTC as an additive can significantly enhance methane yield in the AD of substrates such as glucose and food waste, these approaches primarily rely on a passive enrichment strategy [3,15]. This strategy involves the direct addition of HTC, depending on the spontaneous enrichment of functional microbial communities within the system. In contrast, this study adopted an “active enrichment” strategy: The butyrate-degrading microbiome was pre-coupled with HTC to construct a “hydrochar–microbe” composite. This composite was then introduced into the AD system. This pre-coupling approach not only shortened the lag phase but also effectively mitigated the transient inhibition of functional microorganisms by high-load complex substrates. The resulting “carbon–microbe complex” possesses the dual functionality of a conductive support material and a carrier for acclimated microorganisms, thus rapidly establishing the functionality of the target microbial community at the onset of digestion and maintaining stable metabolic synergy.
Table 2.
Model fitting results of key indicators for different treatments.
3.2. Changes in Organic Matter in MFLW During AD
The sCOD removal efficiency directly reflects the microbial ability to degrade organic matter during AD. The experimental results showed that the addition of HTC increased the sCOD removal rate, primarily due to HTC’s porous structure providing attachment sites for microorganisms, thus enhancing microbial adaptability to the environment [16]. As shown in Figure 2a, at the end of the experiment, the sCOD removal rates for the CK, HCK, BA, HBA, and HBA-C groups were 61.80 ± 1.73%, 66.06 ± 2.03%, 69.52 ± 1.27%, 68.24% ± 2.47, and 75.02 ± 1.37%, respectively. The HCK group showed a higher sCOD removal rate than the CK group, indicating that HTC could enhance the organic matter degradation capacity of the system. The BA group also exhibited an improved sCOD removal rate, likely due to butyrate acclimation, which enhanced the microbial ability to degrade butyrate and its intermediates. The HCK group exhibited a higher sCOD removal rate than the CK group, indicating that HTC alone improved the organic degradation capacity of the system. Similarly, the BA group also showed enhanced sCOD removal, likely due to the improved metabolic activity of the butyrate-acclimated microbiome. Notably, the HBA-C group achieved the highest sCOD removal rate among all groups, confirming that the synergistic combination of HTC and acclimated microorganisms led to superior anaerobic digestion performance compared to either strategy alone. This mechanism may include the provision of a more suitable habitat for microorganisms by HTC, enhancing the stability of the microbial community and increasing its degradation activity, thus accelerating the breakdown of organic matter. Moreover, part of the sCOD removal may be attributed to the synthesis of microbial biomass and the accumulation of intermediate metabolites such as acetate and propionate, rather than complete mineralization. Previous studies have shown that in high-strength anaerobic systems, a substantial fraction of the soluble organic carbon is assimilated into microbial cells during growth phases, especially under sufficient substrate availability.
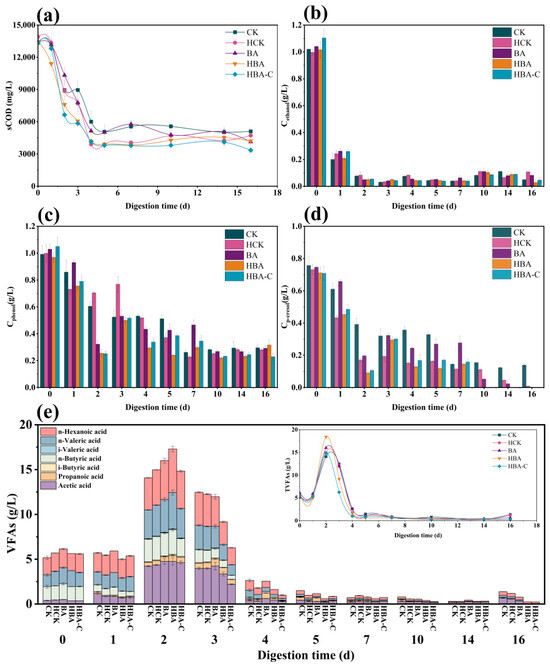
Figure 2.
Key physicochemical parameters of anaerobic digestion: (a) sCOD value, (b) ethanol concentration, (c) phenol concentration, (d) p-cresol concentration, and (e) changes in VFAs.
Ethanol concentrations decreased rapidly over time, with no significant differences (p > 0.05) between treatment groups, as it was almost completely degraded within 3 days (Figure 2b). Phenol and p-cresol, being refractory organic compounds, inhibit AD. As shown in Figure 1c,d, the concentrations of phenol and p-cresol decreased in all treatment groups. The addition of HTC significantly promoted phenol degradation, as its porous structure adsorbed phenol, reducing its concentration in the liquid phase and mitigating its inhibitory effect on microorganisms [17]. The phenol degradation rate was lowest in the CK group, while the HCK and HBA-C groups showed significantly improved degradation performance. Previous studies have shown that HTC can enhance phenol degradation to methane, and its rapid removal helps to maintain system stability [18]. High concentrations of p-cresol affect microbial activity during the acidogenesis phase and may inhibit methanogens. The anaerobic degradation of p-cresol is limited due to its aromatic structure and microbial toxicity. However, certain adapted microbial consortia can convert p-cresol into intermediates such as p-hydroxyphenyl acetate and acetate via reductive and syntrophic pathways. HTC may have reduced p-cresol toxicity through adsorption, while supporting the growth of tolerant degraders. This combination likely enhanced p-cresol removal efficiency in the HBA-C group. However, at high concentrations, p-cresol can damage microbial cell membranes, reducing AD efficiency [19]. The p-cresol degradation efficiency varied among the treatment groups. The CK group exhibited the lowest degradation efficiency, while the HCK group reduced p-cresol toxicity through HTC adsorption. The HBA-C group achieved the best degradation, likely due to the long-term coupling of “hydrochar–microbe,” which enhanced the microbial tolerance and degradation capacity for complex organic compounds, while HTC’s porous structure provided a more suitable environment for microbial growth.
VFAs, as key intermediates in the AD process, reflect the degradation rate of organic matter and the utilization efficiency of methanogens. Excessive VFA accumulation leads to pH reduction, which inhibits methanogen activity [12]. In this experiment, the peak VFA accumulation occurred in the early stages, followed by a gradual decrease. The HCK group showed higher VFA removal efficiency than the CK group, suggesting that HTC reduced the inhibitory effects of VFAs through adsorption and provided attachment sites for methanogens, stabilizing the system. The BA group also showed improved VFA removal, indicating that butyrate acclimation enhanced microbial utilization of VFAs. The HBA-C group exhibited the best VFA removal efficiency, attributed to the long-term coupling of “hydrochar–microbe,” which improved microbial adaptation to VFAs, while HTC’s porous structure further mitigated the inhibitory effects of VFAs, maintained system pH balance and promoting increased methane production.
In summary, the addition of HTC, butyrate acclimation, and their coupling strategy significantly improved the sCOD removal rate, phenol and p-cresol degradation efficiency, and VFA removal in the AD system. HTC enhanced microbial activity through its adsorption properties and attachment sites, while butyrate acclimation increased microbial adaptability to specific organic compounds and intermediates. The coupling of butyrate acclimation with HTC further demonstrated a synergistic effect, providing an effective approach to enhance the performance of AD systems.
3.3. Microbial Diversity and Quantitative Analysis
3.3.1. Microbial Diversity Indices and PCoA Analysis
Table 3 shows the microbial diversity indices for each experimental group. Based on the Chao1 index, the HBA-C group exhibited the highest species richness, surpassing the CK group and other experimental groups, indicating that the butyrate–HTC coupling promoted the growth of a greater variety of microorganisms, especially increasing the richness of archaeal communities. In contrast, the HCK group had the lowest Chao1 index, suggesting that the addition of HTC alone had limited effects on microbial diversity and may even have inhibited the growth of certain species. The Shannon and Simpson indices further revealed the evenness and diversity of the communities. In AD systems, community evenness is essential for maintaining functional stability. A well-balanced and diverse microbial community helps to sustain metabolic redundancy and enhances the system’s adaptability to environmental fluctuations. The HBA-C group showed the highest Shannon and Simpson indices, indicating a more balanced microbial community structure with evenly distributed functional species, which facilitates comprehensive degradation of substrates and the synergistic optimization of metabolic pathways. In contrast, the HCK group exhibited the lowest Shannon and Simpson indices, suggesting a simpler community structure and lower functional diversity, with the use of HTC alone failing to significantly improve the system’s microbial ecological function. From the bacterial community analysis shown in Figure 3a, the HBA-C group deviated significantly from the CK group, indicating that the HTC–butyric acid acclimation coupling altered the composition and function of the bacterial community, likely due to the enrichment of butyrate-degrading bacteria. The BA and HBA groups were relatively close to the HCK group, suggesting that the addition of HTC and butyrate acclimation exerted different selective pressures on the bacterial community. In terms of archaeal communities (Figure 3b), the HBA-C group was closer to the CK group, which may reflect the high stability of the archaeal community, particularly methane-producing archaea that typically exhibit strong environmental adaptability.
Table 3.
Diversity indices of bacteria and archaea for different treatment groups.
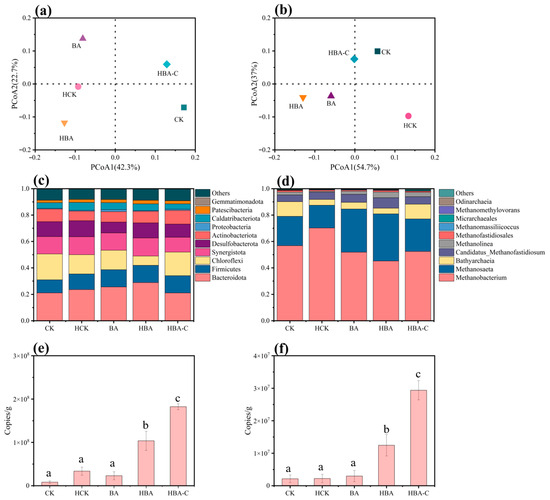
Figure 3.
Microbial analysis of different treatment groups. Phylogenetic distance-based Principal Coordinate Analysis (PCoA) of bacteria (a) and archaea (b), bacterial community composition at the phylum level (c), archaeal community composition at the genus level (d), and copy number of bacteria (e) and archaea (f) in different treatment groups. In panels (e,f), different lowercase letters (a–d) indicate statistically significant differences between groups (p < 0.05), while the same letter indicates no significant difference.
3.3.2. Microbial Community Composition of Bacteria and Archaea
The differences in microbial community structure across treatment groups directly influenced the degradation efficiency of VFAs and methane production. At the phylum level for bacteria, Bacteroidota exhibited high abundance across all groups, with 21.1% in the CK group, 23.6% in the HCK group, 25.6% in the BA group, 28.83% in the HBA group, and 21.08% in the HBA-C group. Bacteroidota is known for its efficient VFA degradation capacity, with its metabolic products (such as acetate) providing important substrates for methane-producing archaea [20]. In the HBA group, the increased abundance of Bacteroidota may be associated with HTC support, which accelerated organic matter degradation [21]. However, the lower abundance of Bacteroidota in the HBA-C group could be due to the long-term pre-coupling of “hydrochar–microbe,” which altered substrate allocation or metabolic pathways, thereby limiting its further growth. Firmicutes accounted for 9.83% in the CK group, while other groups had around 13%. Firmicutes are the main fermentation hydrolytic bacteria in AD, capable of degrading organic matter via extracellular enzymes to produce acetate, an important promoter of VFA conversion to methane [22]. With both HTC addition and butyrate acclimation, Firmicutes exhibited strong environmental adaptability. The abundance of Chloroflexi was similar in the HCK group (14.6%) and BA group (14.74%), but only 7.02% in the HBA group, and as high as 17.86% in the HBA-C group. Chloroflexi, as filamentous bacteria, often accumulate in biofilms or granular sludge, contributing to biofilm structure formation [23]. The lower abundance of Chloroflexi in the HBA group may be due to competitive inhibition by other microbial communities during butyrate acclimation, whereas the higher abundance in the HBA-C group could be related to the optimization of the electrochemical environment and substrate supply due to the “hydrochar–microbe” pre-coupling. Synergistota had an abundance of 13.17% in the CK group, reaching its highest value in the HBA group (13.7%), and was 11.25% in the HBA-C group. Synergistota promotes IET and co-metabolism with hydrogen-utilizing methanogens. In the AD process, the synergy between Bacteroidota and Synergistota mainly involves Bacteroidota breaking down organic matter into CO2 and VFAs, which serve as raw materials for IET by hydrogen-utilizing methanogens, while Synergistota plays a role in biosynthesis [24]. The decrease in Synergistota abundance in the HBA-C group may be due to the direct enhancement of methane generation pathways via “hydrochar–microbe” pre-coupling, reducing reliance on intermediate metabolic products.
At the genus level for archaea, Methanobacterium had an abundance of 56.77% in the CK group, rising to 70.19% in the HCK group, and was 51.86%, 45.18%, and 52.42% in the BA, HBA, and HBA-C groups, respectively. Methanobacterium is a hydrogenotrophic methanogen that utilizes H2 and CO2 to produce CH4. The increase in its abundance in the HCK group suggests that HTC promoted its enrichment, possibly by providing a conductive surface that facilitates DIET and by creating favorable microenvironments that support the growth and activity of hydrogenotrophic methanogens [25]. However, in the BA and HBA groups, butyrate acclimation led to stronger metabolic advantages for Methanosaeta and other genera, which competed with Methanobacterium. In the HBA-C group, the abundance of Methanobacterium may have been optimized due to the “hydrochar–microbe” pre-coupling improving the electron donor supply. The abundance of Methanosaeta was 22.26% in the CK group, 32.73% in the BA group, 35.73% in the HBA group, and 24.65% in the HBA-C group. Methanosaeta is an acetoclastic methanogen that efficiently utilizes acetate and participates in the IET process [26]. The substantial production of acetate from butyrate degradation in the BA, HBA, and HBA-C groups provided ample substrate for Methanosaeta, thus increasing its abundance. Although the abundance of Methanosaeta was lower in the HBA-C group, the direct electron transfer efficiency between Methanosaeta and electroactive bacteria may have increased, maintaining an efficient methane production pathway [27]. The abundance of Bathyarchaeia was lower in the HCK, BA, and HBA groups but reached 11.1% in the CK and HBA-C groups. Studies have shown that Bathyarchaeia is more likely to function in stable ecosystems, such as native sludge. The increase in its abundance in the HBA-C group may be due to the stable environment provided by the “hydrochar–microbe” pre-coupling. Candidatus_Methanofastidiosum reached its highest abundance in the HBA group (7.92%). This genus can utilize acetate and methyl compounds as carbon sources [28]. Its increased abundance may be attributed to the metabolic intermediates generated during butyrate degradation, which provided the necessary conditions for its growth.
However, it must be noted that the observed microbial enrichment could also stem from other beneficial effects of HTC. The porous structure of HTC provides a large specific surface area and protective microenvironments, effectively enhancing biomass retention. Simultaneously, its abundant surface oxygen-containing functional groups (e.g., –OH, –COOH) can promote microbial adhesion through electrostatic interactions and hydrogen bonding, thereby fostering the formation of more stable biofilm communities. Furthermore, these functional groups may also facilitate conventional IET mediated by hydrogen or formate. The porous structure and adsorptive surface of HTC can adsorb and mitigate inhibitory compounds (such as residual phenolics or excess VFAs), thereby enhancing hydrolysis and acidogenesis processes. Notably, studies indicate that HTC can enrich syntrophic bacteria (e.g., Syntrophorhabdus) and acetoclastic methanogens (e.g., Methanosaeta), and their synergistic role in promoting phenol degradation and methanogenesis extends beyond what can be explained solely by inhibitor adsorption mechanisms [25]. This suggests that HTC can act as an “electron shuttle” and support the formation of microbial aggregates, with its mechanism of action not relying exclusively on DIET. Therefore, in addition to the potential contribution of DIET, HTC is more likely to enhance the overall performance of the anaerobic digestion (AD) system through multiple synergistic pathways, including boosting microbial activity, facilitating organic matter transformation, and adsorbing inhibitors.
Overall, the excellent performance of the HBA-C group is likely due to the long-term pre-coupling of HTC and microorganisms, which allowed the microbial community to achieve a competitive balance on the attachment sites provided by HTC. This resulted in a high degree of synergy in metabolic functions between bacteria and archaea. At the bacterial phylum level, Bacteroidota and Firmicutes dominated the primary decomposition of VFAs, while Chloroflexi and Synergistota further facilitated the metabolism of refractory substances, providing abundant substrates for archaea. At the archaeal genus level, the synergistic action of Methanobacterium and Methanosaeta ensured efficient methane production.
3.3.3. Absolute Quantification of Bacteria and Archaea
Figure 3e,f shows that bacterial copy numbers were significantly higher than archaeal copy numbers in all experimental groups, consistent with their dominant role in organic matter degradation and intermediate metabolite production. The bacterial copy numbers in the HBA and HBA-C groups were significantly higher than in other groups, reaching 1.04 × 10⁸ and 1.82 × 10⁸ copies/g, respectively. In contrast, the bacterial copy numbers in the HCK and BA groups were relatively low at 2.36 × 10⁷ and 2.3 × 10⁷ copies/g, but still significantly higher than the CK group (8.25 × 10⁶ copies/g). The archaea copy numbers in the HBA and HBA-C groups were notably higher than those in other groups, reaching 1.24 × 10⁷ and 2.94 × 10⁷ copies/g, respectively. The archaea copy number in the HBA-C group was 2.37-times that in the HBA group. In contrast, the archaea copy numbers in the HCK and BA groups were lower at 2.21 × 10⁶ and 2.97 × 10⁶ copies/g, but still slightly higher than the CK group (2.13 × 10⁶ copies/g). The bacterial and archaea copy numbers in the HBA-C group were much higher than those in other groups. The significantly higher bacterial and archaeal copy numbers observed in the HBA-C group (22.06- and 13.80-times higher than CK, respectively) provide compelling evidence for the success of the pre-coupling strategy in establishing a denser and more active microbial consortium. This substantial biomass enrichment can be primarily attributed to the favorable physicochemical properties of HTC. Its porous structure offers extensive surface area and protective niches, significantly enhancing microbial colonization and retention. Furthermore, the abundant surface oxygen-containing functional groups (e.g., hydroxyl and carboxyl) likely facilitate strong microbial attachment through electrostatic interactions and hydrogen bonding, fostering the formation of stable biofilms. These mechanisms collectively create an optimized microenvironment that supports robust microbial growth and syntrophic interactions, directly contributing to the enhanced system performance. This observation may be due to the limited promoting effects of single enhancement methods (such as HTC addition or butyrate acclimation) on bacteria and archaea. The synergistic effect of HTC and butyrate optimized the growth environment for both bacteria and archaea, suggesting that the long-term coupling of “hydrochar–microbe” optimized the microbial community structure, improved the metabolic environment, and enhanced system stability, thereby promoting the growth of both bacteria and archaea.
3.3.4. Analysis of Microbial and Environmental Factor Correlations
Figure 4 reveals the correlation between microbial communities and environmental factors. Bacterial community analysis showed that Synergistota was positively correlated with acetate, suggesting that it may convert amino acids into short-chain fatty acids or acetate through co-metabolism with methane-producing archaea [29]. Chloroflexi was positively correlated with butyrate and valerate, indicating its role in promoting acidification processes by degrading complex organic matter such as polysaccharides [30]. Firmicutes and Bacteroidota were positively correlated with propionate, suggesting that both are more likely to be involved in propionate production metabolism.
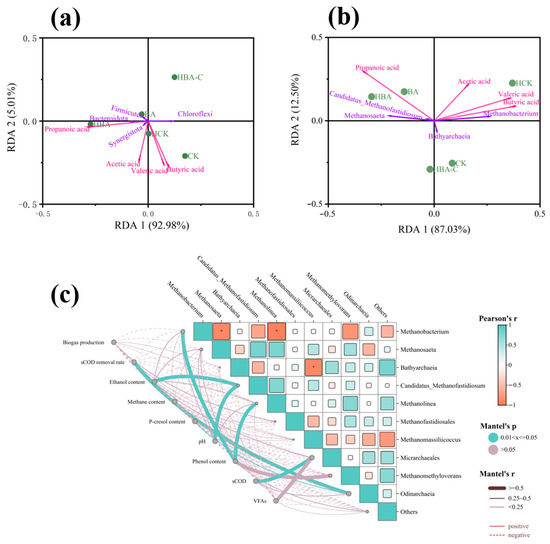
Figure 4.
Analysis of microorganisms and key physicochemical parameters in different treatment groups. RDA analysis of major bacteria (a) and major archaea (b) with key fatty acids; (c) correlation analysis between archaea and environmental factors.
Archaeal analysis showed that Methanosaeta was negatively correlated with butyrate and acetate, consistent with its characteristics as an acetate-dependent methanogen which prefers low-concentration acetate environments [31]. This genus may convert butyrate metabolites into acetate through acetogenesis, thereby driving the acetate-utilizing methanogenesis pathway.
Additionally, a significant negative correlation was observed between Methanobacterium and Methanosaeta (Figure 4c), reflecting the substrate competition between hydrogenotrophic methanogens and acetoclastic methanogens [32]. Notably, phenolic compounds were positively correlated with Methanolinea, indicating that these methane-producing archaea may have tolerance or degradation capabilities for phenolic compounds in wastewater. Recent studies have confirmed that moderate increases in phenol concentration can promote the enrichment of specific methanogens through selective pressure [33].
3.3.5. Acid Metabolic Pathways and Relative Abundance of Key Enzymes
During the AD of MFLW, differences were observed in the relative abundance of key enzyme genes in the HCK, BA, HBA, and HBA-C groups, particularly in the butyrate degradation, acetate metabolism, propionate metabolism, and methane production pathways (Figure 5). Butyrate metabolism is a critical starting point in AD, involving the degradation of butyrate and its conversion to acetate and acetyl-CoA. Short-chain acyl-CoA dehydrogenase (EC:1.3.8.1) is a key enzyme in this pathway, responsible for converting butyrate to butyryl-CoA and further generating acetyl-CoA. The relative abundance of the gene encoding EC:1.3.8.1 in the HCK, HBA, and HBA-C groups was significantly higher than in the CK group, indicating that the addition of HTC effectively enhanced the abundance of enzymes associated with butyrate degradation.
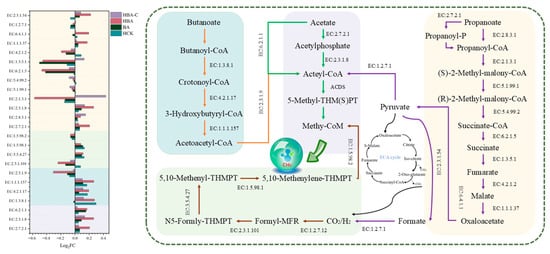
Figure 5.
Changes in the relative abundance of genes encoding acid degradation-related enzymes in different treatment groups.
In the acetate metabolism pathway, phosphate Acetyltransferase (EC:2.3.1.8) and Acetokinase (EC:2.7.2.1) are two important enzymes. Acetokinase catalyzes the reversible reaction CH3COO− + ATP ↔ CH3CO2PO32− + ADP, transferring a γ-phosphate group between acetate and ATP. This reaction is involved not only in acetate production but also plays a key role in the conversion of acetate to acetyl-CoA required for methane production [34]. Acetyl-CoA is a crucial precursor for methane generation and other metabolic pathways. Experimental results showed that the relative abundance of EC:2.3.1.8 and EC:2.7.2.1 increased in all experimental groups, suggesting that HCK, BA, HBA, and HBA-C all enhanced the conversion of acetate to acetyl-CoA. This may be due to the improved metabolic environment provided by HTC, while the degradation of butyrate increased the supply of acetate, further enhancing the activity of acetate-metabolizing bacteria. Furthermore, the upregulation of Pyruvate synthase (EC:1.2.7.1) in the HBA-C group might have enhanced pyruvate metabolism, providing more substrate support for acetate production. The increased acetate concentration promoted the relative abundance of the acetoclastic methanogen Methanosaeta, shifting methane production pathways from hydrogenotrophic methanogenesis to a combined hydrogenotrophic and acetoclastic pathway, reaching a dynamic balance between the two pathways [35].
Propionate metabolism plays a crucial role in carbon flow regulation during AD. The experimental results showed that the relative abundance of Propionyl-CoA transferase (EC:2.8.3.1) was upregulated in all experimental groups, with the most pronounced increase observed in the HBA-C group, suggesting that this treatment may enhance the conversion rate of propionyl-CoA to propionyl-phosphate, thus improving propionate metabolism [36]. Notably, the relative abundance of Methylmalonyl-CoA mutase (EC:5.4.99.2) did not show significant changes in any group, possibly because the existing levels were sufficient to meet the requirements of propionate metabolism. In the HBA-C group, the relative abundance of Methylmalonyl-CoA carboxyltransferase (EC:2.1.3.1) and succinate dehydrogenase (EC:1.3.5.1) increased significantly. The increase in EC:2.1.3.1 abundance promoted the conversion of methylmalonyl-CoA to succinyl-CoA, while EC:1.3.5.1 catalyzed the oxidation of succinate to fumarate, transferring electrons to coenzyme Q and into the electron transport chain, enhancing energy metabolism efficiency. The “hydrochar–microbe” pre-coupling reshaped the carbon flow distribution strategy, directing more carbon sources into the propionate metabolism branch. The generated succinyl-CoA, as a key intermediate in the Tricarboxylic acid (TCA) cycle, further achieved efficient coupling between propionate metabolism and energy metabolism through the TCA cycle and electron transport chain. The HBA-C group optimized the dynamic balance of the propionate metabolism network by regulating the relative abundance of the genes encoding key enzymes EC:2.8.3.1, EC:2.1.3.1, and EC:1.3.5.1.
Methane production is the core goal of AD, and its key enzymes include 5,10-methylenetetrahydromethanopterin reductase (EC:1.5.98.2) and Methanopterin cyclohydrolase (EC:3.5.4.27). EC:3.5.4.27 catalyzes the conversion of N5-formyl-tetrahydromethanopterin to N5, N10-methylene-tetrahydromethanopterin, which is the rate-limiting step in the methane production pathway. Experimental results showed that the relative abundance of EC:3.5.4.27 was upregulated in the BA, HBA, and HCK groups, while no significant changes were observed in the HBA-C group. In the BA and HBA groups, butyrate metabolism enhanced microbial activity, promoting the expression of this enzyme. In the HCK group, HTC indirectly enhanced enzyme activity by adsorbing organic acids and stabilizing the system’s pH.
Through long-term “hydrochar–microbe” pre-coupling, the HBA-C group prioritized propionate metabolism regulation. This is evidenced by significant upregulation of key enzyme genes (especially EC:2.8.3.1, EC:2.1.3.1, and EC:1.3.5.1), demonstrating how hydrochar–microbe coupling optimizes central metabolic pathways. The resulting carbon flow bias toward propionate metabolism reduced substrate entry into methane pathways. Importantly, this metabolic reprogramming enhanced TCA cycle/electron transport efficiency, which increased methane yield over CK despite no upregulation of methane-related enzymes. These coordinated changes in carbon distribution and energy metabolism underpin the system’s superior substrate degradation and methane production.
3.4. Practical Implications and Economic Considerations
A preliminary economic assessment indicates that incorporating HTC incurs additional material costs but delivers clear value. While large-scale HTC production entails a moderate per-unit cost, this is offset by a significant 15.48% increase in methane yield, meaning substantially more biogas available for monetization. Concurrently, achieving approximately 75.02% sCOD removal signifies significantly cleaner effluent, which can reduce downstream treatment or discharge costs. On balance, the extra expenditure on HTC could be justified by the additional revenue from enhanced methane production and the cost savings from improved wastewater treatment, rendering the trade-off economically attractive if HTC can be produced cost-effectively. However, this study has limitations: it is based on lab-scale, batch-mode evaluation under controlled conditions using a specific substrate. Consequently, the findings are subject to substrate-specific limitations, meaning HTC’s effectiveness may vary significantly depending on wastewater characteristics (e.g., composition, concentration), as well as the HTC’s own feedstock and preparation conditions (e.g., carbonization temperature, time). Furthermore, future research must address the dynamics of continuous-flow systems (which may differ due to factors like microbial washout and steady-state conditions, potentially affecting HTC performance), the long-term stability, reusability, and aging of HTC under anaerobic conditions, and the challenges of scaling the combined process to pilot or industrial levels (e.g., HTC energy and capital costs, reactor integration). Therefore, future work should include long-term performance assessment and pilot-scale validation across different wastewater matrices to comprehensively confirm the applicability and economic viability of this strategy in real-world wastewater treatment systems.
4. Conclusions
This study developed an AD enhancement strategy based on the synergistic interaction between HTC and butyrate-degrading microbial communities for the efficient treatment of MFLW. The experimental results demonstrated that the HBA-C group improved system performance. Methane yield increased by 15.48% compared to the control group, with an sCOD removal rate of 75.02%, effective control of VFAs accumulation, and stable pH within an optimal range, effectively avoiding acidification. Microbial community analysis revealed that the “hydrochar–microbe” coupling synergistically enriched butyrate-degrading bacteria (e.g., Bacteroidota, Firmicutes) and methane-producing archaea (e.g., Methanobacterium, Methanosaeta), with bacterial and archaeal copy numbers being 22.06- and 13.80-times higher than the CK group, respectively. In the VFA metabolism and methane production pathways, the relative abundance of related enzymes was significantly upregulated, indicating that the “hydrochar–microbe” coupling effectively promoted these metabolic processes. The successful application of this strategy in MFLW demonstrates its potential for broader application in the treatment of other complex organic wastewaters, offering technical support for wastewater resource utilization and the achievement of carbon neutrality goals.
Author Contributions
X.L.: Writing—review and editing, visualization, supervision, project administration. Z.W.: Writing—original draft, methodology, investigation, formal analysis. X.W.: Methodology, investigation, formal analysis. C.S.: Methodology, investigation, formal analysis. Y.H.: Methodology, investigation, formal analysis. S.L.: Methodology, investigation, formal analysis. J.C.: Visualization, supervision. S.W.: Validation, investigation. W.Z.: Methodology, investigation. X.M.: Visualization, supervision. J.X.: Visualization, supervision. H.Y.: Methodology, funding acquisition, conceptualization. Y.C.: Writing—review and editing, visualization, supervision, project administration, conceptualization. All authors have read and agreed to the published version of the manuscript.
Funding
This research was funded by the National Natural Science Foundation of China (52200178, U24A20364, and 223083388), National Engineering Research Center of Solid-state Brewing (2023HX16), Henan Province Science and Technology Research (12102310864 and 222102310142), Key Research Project of the Higher Education Institutions of Henan Province, China (22A530010), and Key Program for Collaborative and Innovation of Nanyang, Henan Province, China (21XTCX21001).
Data Availability Statement
The original contributions presented in this study are included in the article. Further inquiries can be directed to the corresponding author.
Acknowledgments
We extend our thanks to the laboratory members (Xueke Bai, Songlin Kong, and Nan Wang) for their assistance in this research.
Conflicts of Interest
Author Caihong Shen is employed by the company Luzhou LaoJiao Co., Ltd. The remaining authors declare that the research was conducted in the absence of any commercial or financial relationships that could be construed as a potential conflict of interest.
References
- Minnalkodi Senguttuvan, K.R.; Sellappa, K.; Kuppusamy, S. Performance Evaluation of the Electro-Fenton Process for Distillery Wastewater Treatment. Sustainability 2024, 16, 6512. [Google Scholar] [CrossRef]
- Shen, Y.; Zhang, X.; Ye, M.; Zha, X.; He, R. Effects of Fe-modified digestate hydrochar at different hydrothermal temperatures on anaerobic digestion of swine manure. Bioresour. Technol. 2024, 395, 130393. [Google Scholar] [CrossRef]
- Xu, Y.; Meng, X.; Song, Y.; Lv, X.; Sun, Y. Effects of different concentrations of butyrate on microbial community construction and metabolic pathways in anaerobic digestion. Bioresour. Technol. 2023, 377, 128845. [Google Scholar] [CrossRef]
- Bueno, B.E.; Soares, L.A.; Quispe-Arpasi, D.; Sakamoto, I.K.; Zhang, Y.; Varesche, M.B.; Ribeiro, R.; Tommaso, G. Anaerobic digestion of aqueous phase from hydrothermal liquefaction of Spirulina using biostimulated sludge. Bioresour. Technol. 2020, 312, 123552. [Google Scholar] [CrossRef]
- Fan, Q.; Fan, X.; Fu, P.; Li, Y.; Zhao, Y.; Hua, D. Anaerobic digestion of wood vinegar wastewater using domesticated sludge: Focusing on the relationship between organic degradation and microbial communities (archaea, bacteria, and fungi). Bioresour. Technol. 2022, 347, 126384. [Google Scholar] [CrossRef]
- Wang, T.; Zhang, D.; Dai, L.; Dong, B.; Dai, X. Magnetite triggering enhanced direct interspecies electron transfer: A scavenger for the blockage of electron transfer in anaerobic digestion of high-solids sewage sludge. Environ. Sci. Technol. 2018, 52, 7160–7169. [Google Scholar] [CrossRef]
- Shi, Z.; Campanaro, S.; Usman, M.; Treu, L.; Basile, A.; Angelidaki, I.; Zhang, S.; Luo, G. Genome-centric metatranscriptomics analysis reveals the role of hydrochar in anaerobic digestion of waste activated sludge. Environ. Sci. Technol. 2021, 55, 8351–8361. [Google Scholar] [CrossRef]
- Bu, J.; Wei, H.; Wang, Y.; Cheng, J.; Zhu, M. Biochar boosts dark fermentative H2 production from sugarcane bagasse by selective enrichment/colonization of functional bacteria and enhancing extracellular electron transfer. Water Res. 2021, 202, 117440. [Google Scholar] [CrossRef] [PubMed]
- Shi, Z.; Usman, M.; He, J.; Chen, H.; Zhang, S.; Luo, G. Combined microbial transcript and metabolic analysis reveals the different roles of hydrochar and biochar in promoting anaerobic digestion of waste activated sludge. Water Res. 2021, 205, 117679. [Google Scholar] [CrossRef]
- Ren, S.; Usman, M.; Tsang, D.C.W.; O-Thong, S.; Angelidaki, I.; Zhu, X.; Zhang, S.; Luo, G. Hydrochar-facilitated anaerobic digestion: Evidence for direct interspecies electron transfer mediated through surface oxygen-containing functional groups. Environ. Sci. Technol. 2020, 54, 5755–5766. [Google Scholar] [CrossRef] [PubMed]
- APHA. Standard Methods for the Examination of Water and Wastewater; American Public Health Association: Washington, DC, USA, 2012. [Google Scholar]
- He, Y.; Wang, S.; Shen, C.; Wang, Z.; Liu, Y.; Meng, X.; Li, X.; Zhao, X.; Chen, J.; Xu, J. Biochar accelerates methane production efficiency from Baijiu wastewater: Some viewpoints considering direct interspecies electron transfer. Chem. Eng. J. 2024, 497, 154527. [Google Scholar] [CrossRef]
- Cui, Y.; Mao, F.; Zhang, J.; He, Y.; Tong, Y.; Peng, Y. Biochar enhanced high-solid mesophilic anaerobic digestion of food waste: Cell viability and methanogenic pathways. Chemosphere 2021, 272, 129863. [Google Scholar] [CrossRef]
- He, Y.; Wang, Z.; Shen, C.; Wang, S.; Liu, Y.; Chen, S.; Li, X.; Zhao, X.; Chen, J.; Shi, J. Enhancing anaerobic digestion efficiency using biochars: Mechanisms and material perspectives. Renew. Energy 2026, 256, 124147. [Google Scholar] [CrossRef]
- Sun, J.; Zhang, S.; Luo, G. The Role of Hydrochar in Promoting Methane Production from Anaerobic Digestion with Different Inocula. Fermentation 2023, 9, 433. [Google Scholar] [CrossRef]
- Wang, R.; Peng, P.; Song, G.; Zhao, Z.; Yin, Q. Effect of corn stover hydrochar on anaerobic digestion performance of its associated wastewater. Environ. Pollut. 2022, 315, 120430. [Google Scholar] [CrossRef] [PubMed]
- Zhu, D.; Wang, Z.; Liu, K.; Si, B.; Yang, G.; Tian, C.; Zhang, Y. Multi-cycle anaerobic digestion of hydrothermal liquefaction aqueous phase: Role of carbon and iron based conductive materials in inhibitory compounds degradation, microbial structure shaping, and interspecies electron transfer regulation. Chem. Eng. J. 2023, 454, 140019. [Google Scholar] [CrossRef]
- Usman, M.; Shi, Z.; Cai, Y.; Zhang, S.; Luo, G. Microbial insights towards understanding the role of hydrochar in enhancing phenol degradation in anaerobic digestion. Environ. Pollut. 2023, 330, 121779. [Google Scholar] [CrossRef]
- Rea, V.G.; Bueno, B.E.; Cerqueda-García, D.; Sierra, J.D.M.; Spanjers, H.; van Lier, J.B. Degradation of p-cresol, resorcinol, and phenol in anaerobic membrane bioreactors under saline conditions. Chem. Eng. J. 2022, 430, 132672. [Google Scholar] [CrossRef]
- Liu, C.; Cao, Q.; Luo, X.; Yan, S.; Sun, Q.; Zheng, Y.; Zhen, G. In-depth exploration of microbial electrolysis cell coupled with anaerobic digestion (MEC-AD) for methanogenesis in treating protein wastewater at high organic loading rates. Energy Convers. Manag. 2025, 323, 119152. [Google Scholar] [CrossRef]
- Shi, Y.; Xue, H.; Yao, Y.; Jing, C.; Liu, R.; Niu, Q.; Lu, H. Overcoming methanogenesis barrier to acid inhibition and enhancing PAHs removal by granular biochar during anaerobic digestion. Chem. Eng. J. 2023, 477, 147229. [Google Scholar] [CrossRef]
- Zhou, G.; Huang, X.; Zhang, S.; Xiang, Z.; Wei, J.; Ma, S.; Teng, X.; Zheng, Z. Volatile fatty acids (VFAs) production from sludge and chicken manure anaerobic co-fermentation: Effects of mixing ratio and microbial mechanisms. J. Environ. Chem. Eng. 2024, 12, 114014. [Google Scholar] [CrossRef]
- Yan, S.; Wang, M.; Zhang, S.; Tong, Z.; Li, S.; Yong, X.; Zhang, X.; Zhou, J. Fe-doped hydrochar facilitating simultaneous methane production and pharmaceutical and personal care products (PPCPs) degradation in co-anaerobic digestion of municipal sludge and food waste. Chem. Eng. J. 2023, 474, 146001. [Google Scholar] [CrossRef]
- You, J.; Farghali, M.; Osman, A.I.; Yoshida, G.; Ihara, I. Mechanisms of biochar-mediated reduction of antibiotic-resistant bacteria and biogas production enhancement in anaerobic digesters. Biochem. Eng. J. 2024, 211, 109465. [Google Scholar] [CrossRef]
- Usman, M.; Shi, Z.; Ji, M.; Ren, S.; Luo, G.; Zhang, S. Microbial insights towards understanding the role of hydrochar in alleviating ammonia inhibition during anaerobic digestion. Chem. Eng. J. 2021, 419, 129541. [Google Scholar] [CrossRef]
- Guo, M.; Wei, S.; Guo, M.; Li, M.; Qi, X.; Wang, Y.; Jia, X. Potential mechanisms of propionate degradation and methanogenesis in anaerobic digestion coupled with microbial electrolysis cell system: Importance of biocathode. Bioresour. Technol. 2024, 400, 130695. [Google Scholar] [CrossRef] [PubMed]
- Lü, F.; Luo, C.; Shao, L.; He, P. Biochar alleviates combined stress of ammonium and acids by firstly enriching Methanosaeta and then Methanosarcina. Water Res. 2016, 90, 34–43. [Google Scholar] [CrossRef]
- Zhang, Y.; Yu, N.; Guo, B.; Mohammed, A.; Zhang, L.; Liu, Y. Conductive biofilms in up-flow anaerobic sludge blanket enhanced biomethane recovery from municipal sewage under ambient temperatures. Bioresour. Technol. 2022, 361, 127658. [Google Scholar] [CrossRef] [PubMed]
- Zhu, R.; Zhang, Y.; Zou, H.; Zheng, Y.; Guo, R.; Fu, S. Understanding the mechanisms behind enhanced anaerobic digestion of corn straw by humic acids. Bioresour. Technol. 2022, 359, 127454. [Google Scholar] [CrossRef]
- Wang, F.; He, Z.; Tang, C.; Zhou, A.; Liu, W.; Ren, Y.; Li, Z.; Wang, A. Aluminum chloride enhances the production of short-chain fatty acids from waste activated sludge: Insights to performance, mechanism, and implications. J. Water Process. Eng. 2024, 57, 104668. [Google Scholar] [CrossRef]
- Wang, M.; Wang, J.; Liu, K.; Li, Q.; Li, W.; Fan, J.; Wang, S.; Shi, F.; Zuo, X.; Li, P. Relationship between the effects of heat pre-treatment on anaerobic performance of pig manure and the microbial variation within reactors. Chem. Eng. J. 2023, 461, 141991. [Google Scholar] [CrossRef]
- Muñoz-Páez, K.M.; Ramos-Arechiga, K.Y.; Buitrón, G. Ex-situ biogas enrichment by hydrogenotrophic methanogens at low H2/CO2 ratios: Effect of empty bed residence time. Fuel 2025, 381, 133330. [Google Scholar] [CrossRef]
- Franchi, O.; Cabrol, L.; Chamy, R.; Rosenkranz, F. Correlations between microbial population dynamics, bamA gene abundance and performance of anaerobic sequencing batch reactor (ASBR) treating increasing concentrations of phenol. J. Biotechnol. 2020, 310, 40–48. [Google Scholar] [CrossRef]
- Guo, Y.; Askari, N.; Smets, I.; Appels, L. A review on co-metabolic degradation of organic micropollutants during anaerobic digestion: Linkages between functional groups and digestion stages. Water Res. 2024, 256, 121598. [Google Scholar] [CrossRef] [PubMed]
- Qiao, Z.; Chen, Z.; Gong, H.; Guo, X.; Yu, H.; Chen, L. Enhancement of anaerobic digestion by adding elemental sulfur. Bioresour. Technol. 2025, 416, 131820. [Google Scholar] [CrossRef] [PubMed]
- Han, Y.; Green, H.; Tao, W. Reversibility of propionic acid inhibition to anaerobic digestion: Inhibition kinetics and microbial mechanism. Chemosphere 2020, 255, 126840. [Google Scholar] [CrossRef] [PubMed]


Disclaimer/Publisher’s Note: The statements, opinions and data contained in all publications are solely those of the individual author(s) and contributor(s) and not of MDPI and/or the editor(s). MDPI and/or the editor(s) disclaim responsibility for any injury to people or property resulting from any ideas, methods, instructions or products referred to in the content. |
© 2025 by the authors. Licensee MDPI, Basel, Switzerland. This article is an open access article distributed under the terms and conditions of the Creative Commons Attribution (CC BY) license (https://creativecommons.org/licenses/by/4.0/).