Article

A Power-Law-Based Predictive Model for Proppant Settling Velocity in Non-Newtonian Fluid

State Key Laboratory of Petroleum Resources and Engineering, China University of Petroleum at Beijing, Beijing 102249, China
*
Author to whom correspondence should be addressed.
Processes 2025, 13(8), 2631; https://doi.org/10.3390/pr13082631
Submission received: 18 July 2025 / Revised: 13 August 2025 / Accepted: 18 August 2025 / Published: 20 August 2025
(This article belongs to the Special Issue Recent Advances in Hydrocarbon Production Processes from Geoenergy)

Abstract

Effective proppant transport is critical to the success of hydraulic fracturing, particularly when using a non-Newtonian fluid. However, accurately predicting the proppant settling behavior under complex rheological conditions is still a significant challenge. This study proposes a new method for estimating the velocity of proppant settling in the power-law non-Newtonian fluid by accounting for spatial variations in viscosity within the fracture domain. The local shear rate field is first obtained using an analytical expression derived from the velocity gradient, and then used to approximate spatially varying viscosity based on the power-law rheological model. This allows the modification of Stokes’ law, which was initially developed for Newtonian fluid, to be used for the power-law non-Newtonian fluid. The results indicate that the model achieved high accuracy in the fracture center region, with an average relative error of 8.2%. The proposed approach bridges the gap between traditional settling models and the non-Newtonian behavior of the fracturing fluid, offering a practical and physically grounded framework for predicting the velocity of proppant settling within a hydraulic fracture. By considering the distribution of the shear rate and viscosity of the fracturing fluid, this method enables an accurate prediction of proppant settling velocity, which further provides theoretical support to the optimization of pumping schedules and operation parameters for hydraulic fracturing.

1. Introduction

Unconventional resources, including tight sandstone and shale formations, have emerged as key targets for oil and gas extraction, as conventional oil reserves are being depleted [1,2,3]. Hydraulic fracturing is frequently used to stimulate these formations due to the low permeability and intricate geological features of tight rocks and shales [4,5,6]. In this process, a high-pressure fluid is injected to generate fractures, and proppants are introduced to keep these fractures open, thereby creating conductive channels for the hydrocarbon flow [7,8,9].
In order to maximize production and guarantee a long-term fracture conductivity, proppants must be placed within the fracture effectively [10,11,12]. According to a number of current experimental and numerical investigations, the proppant’s effective placement is influenced by its settling velocity [8,13,14,15,16,17,18]. Stokes’ law has been widely applied to predict the settling velocity of the proppant in Newtonian fluid for decades [19], and it is known that the settling velocity is inversely related to the fluid viscosity. However, most fracturing fluids used in field applications exhibit non-Newtonian behavior, particularly a shear-thinning characteristic [20,21,22,23]. Experimental results have shown that the proppant settling behavior in non-Newtonian fluid differs significantly from that in Newtonian fluid, especially under varying flow regimes and rheological conditions during hydraulic fracturing [24,25,26,27,28,29,30,31]. This renders Stokes’ law unsuitable to predict the particle settling velocity in non-Newtonian fluid.
The existing proppant settling models are mostly based on the modification of Stokes’ law or empirical correlations that are obtained use power-law parameters. To study proppant settling behavior, Shah [32] presents a new approach to analyze proppant settling data in power-law non-Newtonian fluid and develops a drag coefficient correlation as a function of rheological parameter n′ to investigate the proppant settling velocity. Roodhart [33] introduced a modified model based on Stokes’ law, incorporating the concepts of zero-shear viscosity and spatial viscosity anisotropy to enable more accurate calculation of particle settling velocities. In response to the complexity of particle settling in non-Newtonian fluid, researchers have proposed theoretical and empirical models. Ovarlez [34] demonstrated that, within non-Newtonian suspension systems, the velocity of particle settling increases with the applied shear rate, underscoring the critical impact of local shear conditions on the settling velocity. Amaratunga et al. [35] further confirmed that the shear-thinning fluid exhibits a pronounced spatial variation in the shear rate, particularly near boundaries, and these variations correlate with local changes in horizontal and settling velocities. Anyaoku [36] designed a new experimental apparatus capable of measuring localized shear rates; utilizing this measurement, they developed a semi-empirical settling model tailored to viscoelastic fluid to predict its settling velocity. Based on the power-law fluid model and incorporating the fiber volume concentration to modify fluid viscosity and drag coefficient, Bai and Li [37] established a predictive model for the settling velocity of the proppant in fiber-containing fracturing fluid. Despite substantial advances in theory and experiments, the existing models typically ignore the special distribution of the flow rate in the direction of the fracture thickness and are thus unable to calculate the particle settling velocity at different spatial locations within non-Newtonian fluid.
In this study, a predictive method is proposed by combining the spatial distribution of the shear rate with the rheological properties of the non-Newtonian fluid. Specifically, by applying the power-law model and evaluating the local shear conditions within the fracture, the variation in the fluid viscosity and its subsequent impact on the proppant settling velocity can be calculated. This method enables the prediction of proppant settling behavior at different locations within the fracture, thereby offering insights into the transport distance of proppants and facilitating the prediction of the effective length of the propped fracture. The results of this work offer valuable theoretical guidance for optimizing the pumping schedule of hydraulic fracturing and improving the treatment performance in field applications.

2. Materials and Methods

2.1. Rheology of Fluid Used in This Study

The power-law fluid is used as a non-Newtonian fluid in this study. Its apparent viscosity at different shear rates can be determined as follows.
η = τ γ = k γ n 1
where:
K: flow consistency index, Pa·Sn;
n: fluid fluidity index, unitless;
τ : shear stress, Pa;
γ : shear rate, s−1;
η : apparent viscosity, Pa·s.
In this study, the fracturing fluid is modeled as a shear-thinning and power-law fluid. Rheometer tests conducted at 25 °C on the fracturing fluid using a rheometer (HAAKE RheoStress 600, Thermo Electron Karlsruhe GmbH, Karlsruhe, Germany) are fitted to the power-law model, which yields a flow behavior index n of 0.46–0.53 and a consistency index K of 138–152 mPa·s. For the simulations, the median values K = 145 mPa·s and n = 0.50 are adopted, and these fall within the typical range for shear-thinning, polymer-based fracturing fluids (n = 0.4–0.9, K = 10–1000 mPa·s). The relationship between apparent viscosity and shear rate is illustrated in Figure 1.

2.2. Shear Rate of Non-Newtonian Fluid Within a Hydraulic Fracture

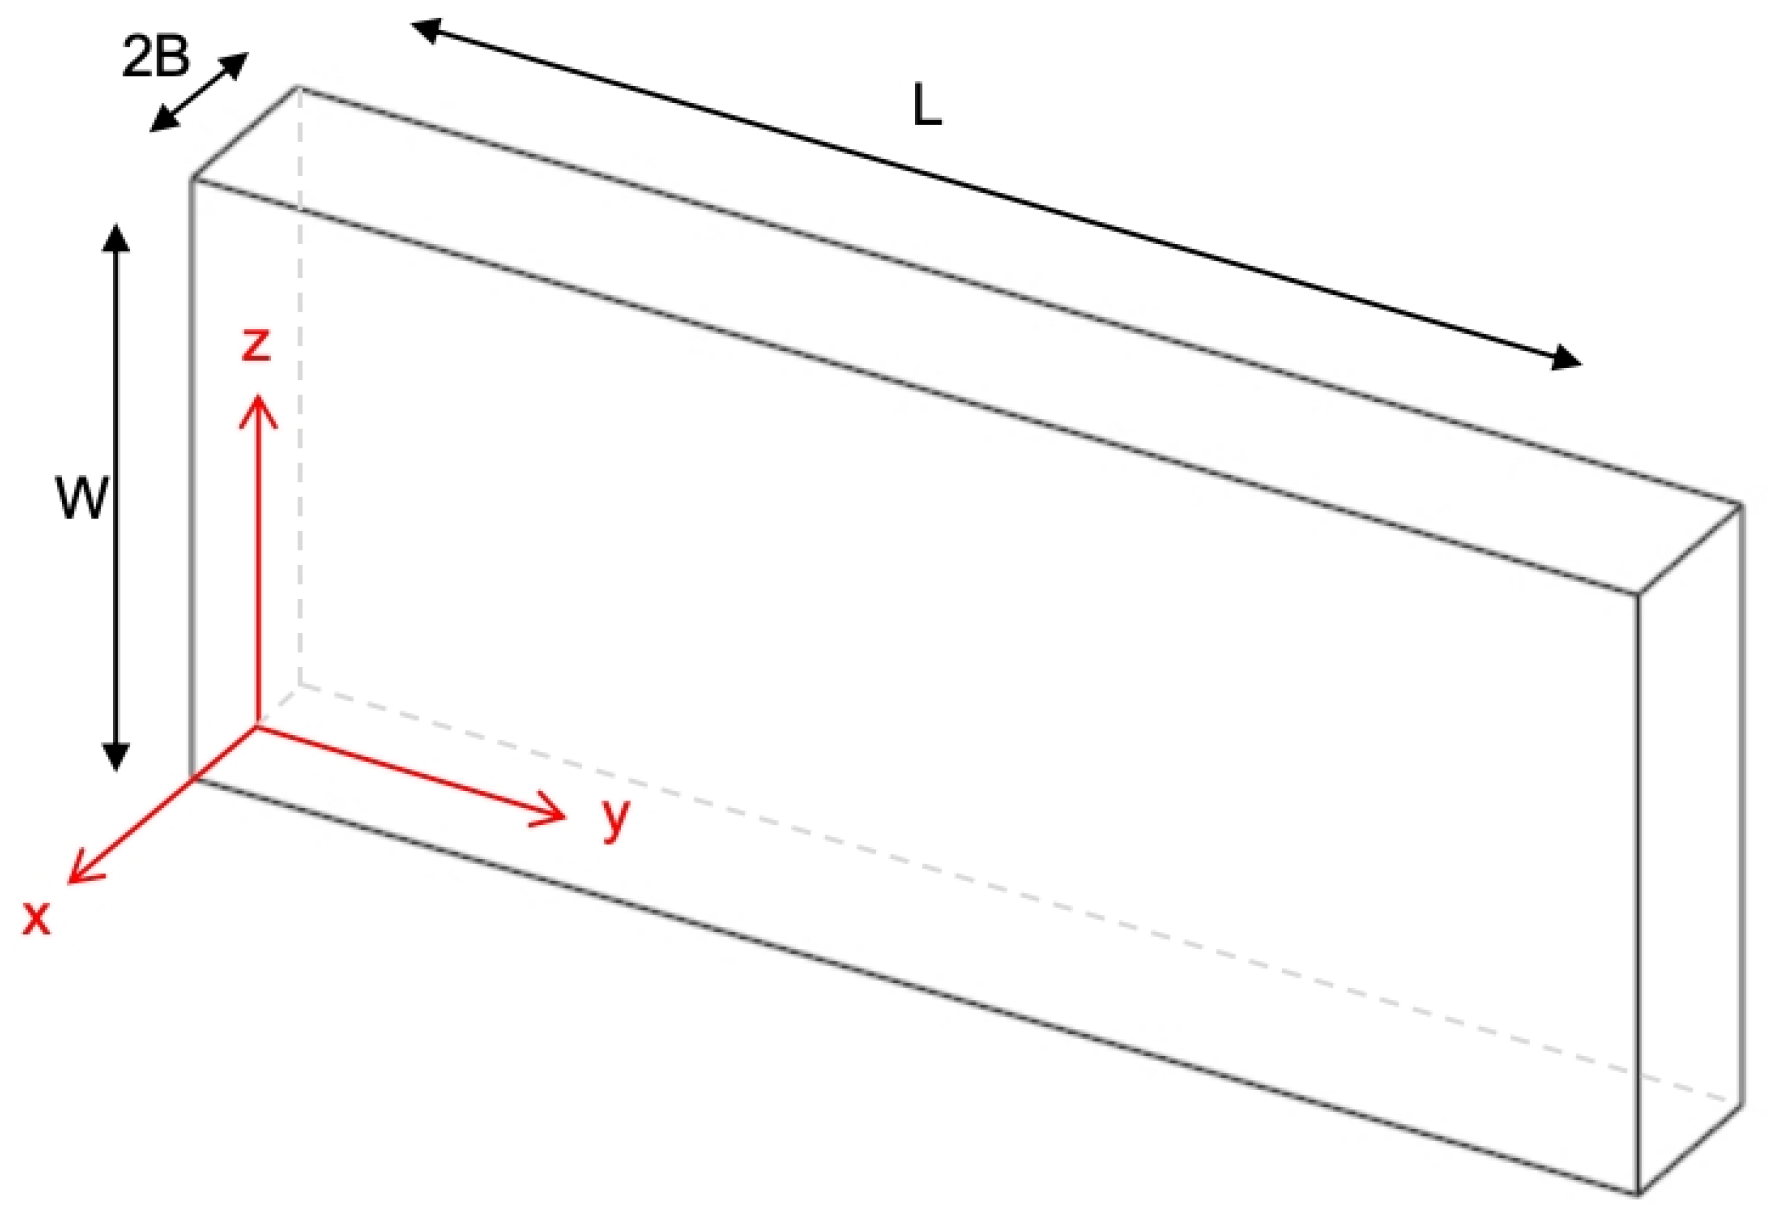
The shear rate of the power-law fluid at various positions within a fracture can be obtained by the formula for calculating the shear rate. Equation (2) is the narrow-fracture model proposed by Hagen and Poiseuille [38], and the fracture is idealized as a rectangular prism with length L, width 2B, and height W (as shown in Figure 2). However, this formulation does not incorporate shear rate effects. Therefore, this study first replaces the pressure P with the flow rate Q by integration, then differentiates to obtain an expression describing the shear rate (Equation (3)).
V Z = P o P L B m L 1 n B 1 n + 1 1 x B 1 n + 1  
d V Z d x = Q 2 W 1 B 1 1 2 + 1 n 1 B 1 + 1 n x B 1 n
where:
Q: flow rate, ml/s;
Po: inlet pressure, Pa;
PL: outlet pressure, Pa;
B: half fracture width, cm;
W: fracture height, cm;
x: position from the middle of the fracture, cm;
n: fluid fluidity index, dimensionless;
Vz: velocity in the z-direction, cm/s.

2.3. Model of Particle Settling in Newtonian Fluids (Stokes’ Law)

In this study, the proppant is treated as a rigid sphere, as in Stokes’ law. When the particle motion is at a low Reynolds number (Re < 1), the proppant settles at a constant settling velocity and the force reaches an equilibrium; the settling velocity can be solved by the following equation.
V t = 2 9 ( ρ p ρ f ) g R 2 μ
where:
R: particle radius, m;
ρ p : particle density, kg/m3;
ρ f : fluid density, kg/m3;
g: gravitational acceleration, 9.81 m/s2;
μ : fluid viscosity, Pa·s or N·s/m2.
The shear rate of the power-law fluid at different distances in the direction of the fracture width can be calculated using Equation (2), which then gives the apparent viscosity of the power-law fluid at that location to allow further calculation of the settling velocity of a proppant.

2.4. Description of the Simulation Model

We validate the proposed model, which estimates the apparent viscosity of a non-Newtonian fluid at different positions across the fracture width based on the local shear rate and uses it to predict the proppant settling behavior. A computational fluid dynamics-discrete element (CFD-DEM) method is used to simulate the migration and settling of proppants within a vertical fracture. The fluid phase is solved using a CFD approach based on the continuity and momentum conservation equations, while the particle motion is modeled using the DEM method in accordance with Newton’s second law. Momentum exchange between the fluid and solid phases is achieved through interphase coupling via pressure and velocity fields. The simulation iteratively updates the flow field and particle trajectories to realize the dynamic coupling between fluid and particle motion, thereby enabling the modeling of the proppant transport and settling processes. The geometry of the vertical fracture is built in the geometry module of ANSYS Fluent (2022R1). Based on field-scale observation, the actual width of the hydraulic fracture typically ranges from 2 mm to 6 mm; therefore, a representative width of 6 mm is selected for this study. The fracture model dimensions are set to 6 mm (width) × 900 mm (height) × 300 mm (depth). In the model, the inlet, outlet, and wall boundaries are defined, as shown in Figure 3.

2.5. Validation of the Predictive Model for Proppant Settling Velocity and Design of the Simulation Cases

In order to verify the accuracy of the predictive model for proppant settling velocity, simulations are first conducted in Newtonian fluid. The injection flow rate is selected based on the typical displacement range used in field-scale hydraulic fracturing operations, which generally falls between 2 m3/min and 23 m3/min; at the laboratory scale, this corresponds to flow velocities ranging from approximately 0.0637 m/s to 0.5537 m/s. To encompass the low-, medium-, and high-displacement-injection conditions that may occur in the actual operating conditions, the design range of the flow velocity is set to 0.06 m/s–0.6 m/s in the numerical simulation. This range not only covers the common displacement variation range in on-site fracturing, but also facilitates the analysis of the settlement behavior of proppants at different flow velocities.
In field applications, proppants with different particle sizes are usually selected according to formation conditions, fracture characteristics, and sand-carrying requirements to achieve effective filling and support for fracturing fractures, so proppants with different particle sizes that are commonly used in the field are selected as the research object, and the particle size settling range is set from 0.00021 m to 0.00084 m (20–70 meshes). Ceramic proppants with a density of 2500 kg/m3 are used in this study. Considering the variation in fracturing fluid viscosity under different reservoir conditions, the simulation scheme also covers a wide viscosity range from 0.005 Pa·s to 1 Pa·s. The numerical results are then compared with theoretical predictions based on Stokes’ law, and a high degree of agreement confirmed the validity of the model in the Newtonian fluid. For the non-Newtonian fluid, the simulation scheme included variations in injection location and flow rate along the fracture width (Z-direction). The simulation results are compared with values calculated using the proposed method for predicting the settling velocity of proppant in non-Newtonian fluid.

3. Results and Discussion

3.1. Influence of Particle Settling Velocity in the Newtonian Fluid

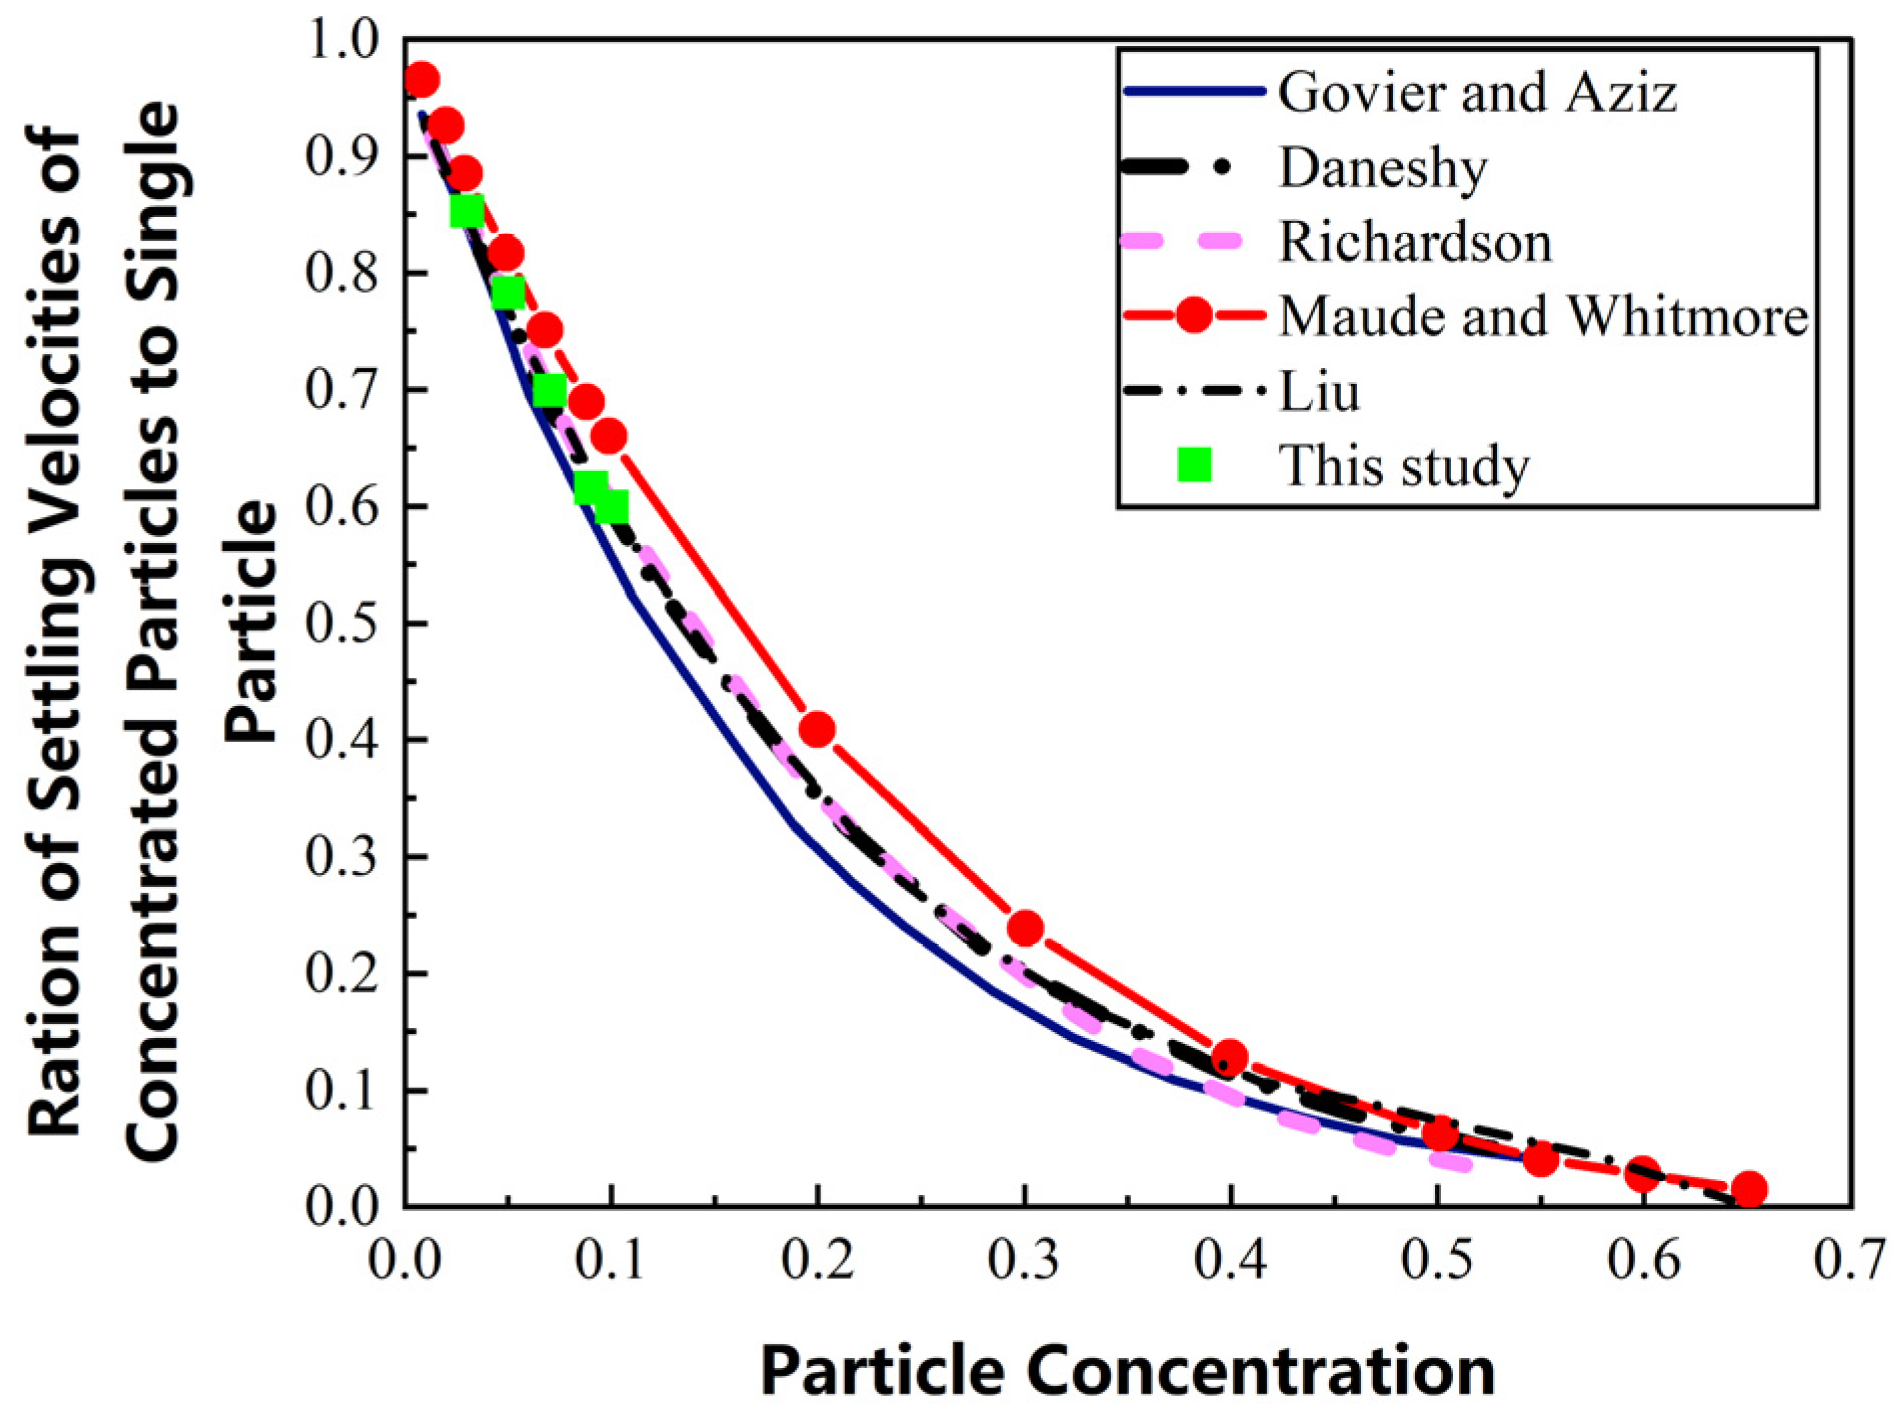
During the hydraulic fracturing operation, particles are typically injected into the fracture fluid at defined concentrations. To better understand the behavior of particles under such conditions, simulations of multi-particle settling at different particle concentrations are conducted in the Newtonian fluid. The same particle is used in the simulation with a diameter of 0.0006 m and a density of 2500 kg/m3; the fluid has a viscosity of 0.001 Pa·s with a horizontal injection velocity of 0.1 m/s.
The figure above presents a comparison of simulation results obtained with different models fitted with experimental data reported by Liu, Richardson, and Daneshy, Maude and Whitmore (Happel, 2012), and Govier and Aziz (Happel, 2012) [39,40,41,42]. A good match of simulation and experimental data indicates the accuracy of the model in predicting the particle settling in the Newtonian fluid.
As shown in Figure 4, the average settling velocity of particles decreases significantly with an increase in particle concentrations, which indicates that the settling velocity of multiple particles is slower than that of a single particle. It is likely that particles disturb the surrounding flow field, triggering the back flow of local fluid, which generates a reverse drag force and inhibits the particle settling. Therefore, it is reasonable to focus on a single particle’s behavior when evaluating particle settling, and the experimental scheme presented in this study is designed to investigate the settling velocity of a single particle under different experimental conditions.
The impact of different injection flow rates, fluid viscosities, and particle diameters on the settling velocity of particles is systematically investigated in a Newtonian fluid through 17 simulation cases. To investigate the effects of each parameter, a series of controlled simulations are conducted. In cases 1–5, the injection velocity is set at 0.1 m/s and the particle diameter is maintained at 0.0006 m, while the fluid viscosity is varied from 5 to 1000 mPa·s to evaluate its influence. In cases 6–10, with the viscosity fixed at 10 mPa·s and the injection velocity at 0.1 m/s, the particle diameter is varied from 0.00021 to 0.00084 m to examine the effect of the particle size. In cases 11–17, the viscosity and particle diameter are held constant at 10 mPa·s and 0.0006 m, respectively, and the injection velocity is incrementally increased from 0.06 to 0.6 m/s to understand the impact of the flow rate.
Cases 1–5 are used to simulate fracturing fluid systems with different viscosities commonly found in shale reservoirs and conventional reservoirs. This range can effectively represent the differences in fluid characteristics under different sand-carrying capacities in the fracturing process, which can then be used to analyze their influence on the settling rate of particles, providing a theoretical basis for optimizing the fracturing operation parameters. The simulated injection point is set at the midpoint along the width of the fracture inlet, and the injection flow rate is set at 0.1 m/s. The corresponding volumetric flow rate is comparable to that of small-displacement fracturing in the field, which ensures computational feasibility and physical realism, as shown in Figure 5.
Figure 5 illustrates the settling behavior of particles in Newtonian fluid with various viscosities, all subjected to the same injection velocity of 0.1 m/s. This figure is used to analyze the impact of fluid viscosity on particle settling. The viscosity ranges from 0.005 Pa·s to 1 Pa·s. As shown, the settling velocity is calculated based on the particle trajectory shown in Figure 5, and the vertical settling velocity of the particles significantly decreases as the viscosity increases.
For low-viscosity fluids, such as those with viscosities of μ = 0.005 Pa·s and μ = 0.01 Pa·s, the particles rapidly settle to the bottom of the fracture within a short period, which indicates that the fluid’s resistance to particle motion is minimal and does not effectively hinder settling under gravitational forces. As the fluid viscosity increases to medium (μ = 0.05 Pa·s) and high values (μ = 0.1 Pa·s), the settling velocity of the particles slows down, which suggests that the fluid’s resistance to the particles is becoming more significant. Under high viscosity conditions (μ = 1 Pa·s), the particles remain almost stationary, with negligible settling, which indicates that high-viscosity fracturing fluids exhibit excellent sand-carrying capabilities. These results demonstrate that the fluid viscosity plays a crucial role in determining the settling behavior of particles under a constant injection velocity. High-viscosity fluids significantly enhance the drag force exerted on the particles, prolonging their suspension time in the fracture and thus improving the sand-carrying capacity of the fracturing fluid. Therefore, when choosing the fracturing fluid, it is essential to select a fluid system with an appropriate viscosity based on reservoir conditions and operational parameters to effectively control the settling behavior of particles.
To further validate the accuracy of the simulated particle settling behavior and investigate the influence of key physical parameters on the settling velocity of the particle, cases 6–10 are designed by varying the particle diameter (from 0.00021 m to 0.00084 m) while maintaining a constant horizontal injection velocity of 0.1 m/s. Figure 5 illustrates a comparison between the simulated settling velocities and the theoretical Stokes’ settling velocities under these conditions.
The green triangle markers in Figure 6 represent the fitting relationship between the simulated settling velocities and the corresponding theoretical values calculated from Stokes’ law under various fluid viscosities, while keeping the particle properties constant. These data points correspond to cases 1–5. The blue star markers depict the fitting results obtained by varying the particle diameters from 0.00021 m to 0.00084 m, corresponding to the 70–20 mesh particles commonly used in field-scale fracturing operations. These data points correspond to cases 6–10. All points are distributed close to the diagonal line y = x, which indicates a strong correlation between the numerical simulation outcomes and theoretical expectations based on Stokes’ settling law. This excellent agreement validates the accuracy, reliability, and applicability of the simulation approach adopted in this study for predicting particle settling behavior in Newtonian fluid. As clearly shown in Figure 6, increasing the particle diameter significantly enhances the settling velocity. Larger particles experience stronger gravitational forces relative to the fluid drag, which accelerates their downward motions. Conversely, increasing the fluid viscosity progressively reduces the settling rate. This indicates that viscous drag imposed by the fluid plays a dominant role in resisting the motion of particles, especially under high-viscosity conditions. The observed trends are in excellent agreement with Stokes’ equation, which predicts that the settling velocity is directly proportional to the square of the particle diameter and inversely proportional to the fluid viscosity. These findings reinforce the theoretical understanding of settling dynamics and confirm the accuracy of the simulation framework.
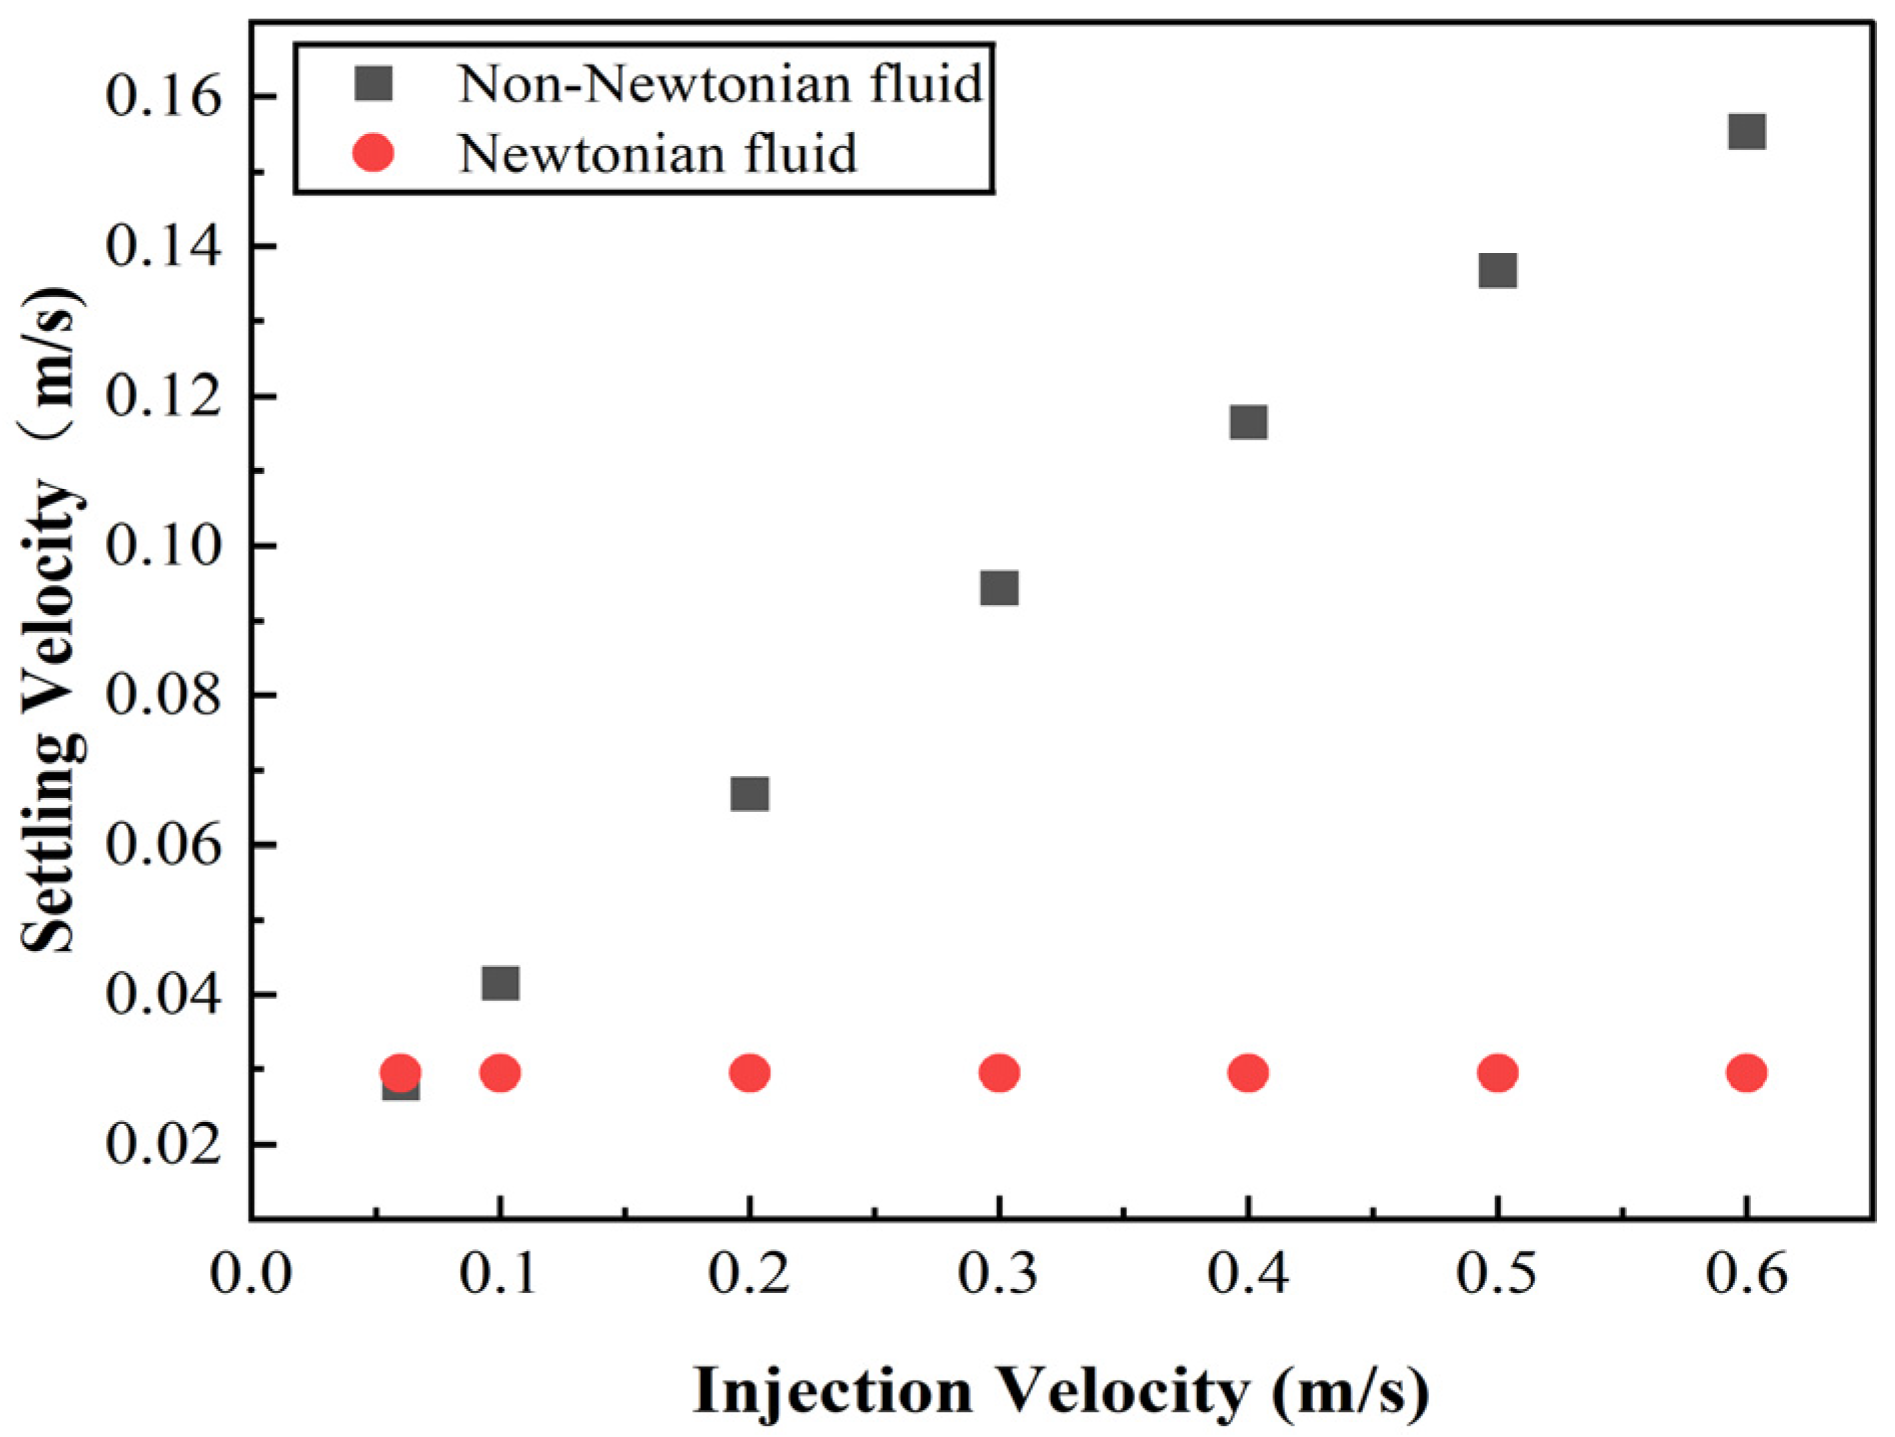
In summary, in the Newtonian fluid, the settling behavior of the particles is primarily governed by two key parameters: the particle size and fluid viscosity. Adjusting either factor can significantly influence the particle transport performance of the fracturing fluid. Therefore, in practical fracturing fluid design, it is essential to carefully select the particle size and match it with an appropriate fluid viscosity to achieve effective particle suspension and placement. The results of this study not only validate the proposed modeling approach but also provide a theoretical reference for analyzing more complex settling phenomena in non-Newtonian fluids. This contributes to the scientific optimization of proppant design and the enhancement of hydraulic fracturing performance in both conventional and unconventional reservoirs. To investigate the influence of the injection flow rate on particle settling behavior across different fluid types, simulations are performed using non-Newtonian fluids that exhibit the same viscosity as their Newtonian counterparts under low-shear-rate conditions. Figure 7 presents the vertical settling velocities of particles at various injection flow rates in both Newtonian and shear-thinned non-Newtonian fluids. The simulation conditions are kept consistent across both fluid types, with the power-law model being applied to characterize the shear-thinning behavior of the non-Newtonian fluid. Shear thinning refers to the phenomenon where the fluid viscosity gradually decreases with an increasing shear rate, which is a common characteristic of many fracturing fluids used in field operations.
The red dots in Figure 7 represent the settling velocity of particles at different injection rates. The simulation results indicate that, in the Newtonian fluid, the particle settling velocity remains nearly constant across the injection velocity range of 0.06 m/s to 0.6 m/s, with an average value of approximately 0.027 m/s. This is because the viscosity of the Newtonian fluid is constant and unaffected by the shear rate. As a result, variations in the injection velocity influence the fluid’s velocity field and horizontal transport path but have minimal impact on the vertical resistance to settling. Under gravity, the settling velocity remains stable and independent of the injection rate.
In contrast, the black dots in Figure 7 represent particle settling velocities in non-Newtonian fluids under identical simulation durations and conditions but with varying injection rates. The results clearly demonstrate that the injection rate significantly affects the particle settling behavior in shear-thinning non-Newtonian fluids, exhibiting a pattern that is distinctly different from that observed in the Newtonian fluid. At lower injection rates, the local shear rate remains low, and the non-Newtonian fluid maintains a high equivalent viscosity. This elevated viscosity generates strong viscous resistance that inhibits particle settling, resulting in a low settling rate and enhanced sand-carrying capacity. However, as the injection rate gradually increases, the local shear rate increases significantly, which leads to a pronounced shear-thinning effect. The resulting decrease in viscosity reduces the viscous drag on the particles, allowing gravitational settling to become more dominant. While higher flow rates may initially enhance particle transport, the rapid viscosity drop weakens the fluid’s resistance to settling. This results in a marked increase in settling velocity with an increasing injection rate, causing particles to lose stability and settle more easily within the fractures. Therefore, in the shear-thinning non-Newtonian fluid, higher injection speeds tend to reduce the fluid’s sand-carrying capacity, contrary to the behavior observed in the Newtonian fluid.
Shear-thinning non-Newtonian fluids are predominantly employed under actual field fracturing conditions. This phenomenon reveals the existence of a critical sand-carrying velocity in shear-thinning non-Newtonian fracturing fluids. Specifically, when the injection rate exceeds a certain threshold, the fluid’s equivalent viscosity decreases significantly, which causes a loss of its effective suspension capability for particles. Consequently, a substantial amount of particles settle prematurely, which adversely affects the effective support of fractures and reduces fracture conductivity. Therefore, during practical fracturing design, excessively high injection rates should be avoided. Instead, an optimal injection rate range must be selected by balancing the fracture propagation capacity with the non-Newtonian sand-carrying characteristics, which thereby ensures uniform particle distribution and stable maintenance of fracture conductivity.

3.2. Influence of Particle Settling Velocity in the Non-Newtonian Fluid

To further investigate the settling characteristics of particles in non-Newtonian fluids, this study examines the effects of different injection flow rates and injection positions on the particle settling velocity. The simulations use the non-Newtonian fluid that exhibits pronounced shear-thinning behavior, as detailed in Section 2.1. The same particle is used in the simulation, with a diameter of 0.0006 m and a density of 2500 kg/m3. To investigate the effects of flow parameters on the particle settling behavior in non-Newtonian fluids, 21 numerical simulation cases are designed, with the injection velocity and injection position being the primary control variables. The injection position is set at three levels in ascending order: 0.0006 m, 0.00075 m, and 0.0015 m. For each fixed injection position, the injection velocity is systematically varied across seven levels: 0.06 m/s, 0.1 m/s, 0.2 m/s, 0.3 m/s, 0.4 m/s, 0.5 m/s, and 0.6 m/s. These velocity ranges cover low to moderate flow regimes, allowing for the observation of diverse flow behaviors. In cases 1–7, fixed at an injection position of 0.0015 m, the injection velocities increase incrementally from 0.06 m/s to 0.6 m/s. Cases 8–14, fixed at 0.00075 m, have the same sequential variation in injection velocity as cases 1–7. Cases 15–21, fixed at 0.0006 m, maintain consistency in the injection velocity gradient.
Figure 8 depicts the vertical settling positions of particles over time at various injection rates in a shear-thinning non-Newtonian fluid, corresponding to cases 1–7. Once the particle reaches a steady settling stage, the simulated settling velocity is calculated based on the trajectory. This figure clearly illustrates how the injection rate affects particle settling dynamics in shear-thinning fluids under controlled simulation conditions.
As shown in Figure 8, the particles exhibit a rapid vertical displacement at the initial stage of injection, which is followed by a significant reduction in settling velocity, eventually approaching a stable rate. This behavior reflects a nonlinear settling trend characterized by an initial rapid descent that transitions into a slower, more stable phase. As the injection velocity increases from 0.06 m/s to 0.6 m/s, the total vertical displacement of the particles within 5 s also increases, which indicates that higher injection velocities facilitate particle settling. This phenomenon is primarily attributed to the shear-thinning behavior of the non-Newtonian fluid. At higher injection rates, the shear rate within the fluid increases substantially, which leads to a decrease in equivalent viscosity. This reduction in viscosity weakens the fluid’s viscous drag on the particles, reducing its ability to keep them suspended and allowing gravity to drive their settling more effectively. Additionally, at the early stage of injection, the settling curve exhibits a steep slope, which indicates that particles settle rapidly. This is mainly because the fluid velocity field has not yet fully developed, and the particles are initially in a free-settling state dominated by gravity. At this point, the fluid has not established sufficient drag force to suspend the particles effectively. As time progresses, the flow field gradually stabilizes, the drag force from the fluid increases, and the settling velocity decreases, entering a transitional equilibrium stage. The variation in injection time observed in the graph is caused by the finite length of the computational domain. At higher injection velocities, particles move through the domain more rapidly and reach the outlet boundary earlier, which results in shorter simulation times.
It is noteworthy that higher flow velocities result in significantly greater settling displacement within a short period, as it emphasizes the substantial enhancement of particle settling under high injection rates. Unlike the Newtonian fluid, in the shear-thinning non-Newtonian fracturing fluid, elevated injection rates may significantly increase the risk of particle settling. This is due to the pronounced shear-thinning behavior, which causes a sharp reduction in fluid viscosity and thereby diminishes the fluid’s ability to keep particles suspended. As a result, excessively high injection rates may lead to ineffective particle suspension, reduced transport efficiency, and compromised fracture support. In practical fracturing operations, simply increasing the injection rate to enhance fracture propagation should be avoided. Instead, the injection rate should be carefully optimized based on the rheological characteristics of the fracturing fluid to ensure an effective balance between promoting fracture extension and maintaining sufficient proppant-carrying performance. To further investigate the spatial distribution of the particle settling velocity and its relationship with the shear rate, Figure 9 illustrates the correlation between the settling velocity and local shear rate at varying distances from the fracture center, under an injection velocity of 0.1 m/s, in a shear-thinning non-Newtonian fluid.
As shown in Figure 9, the shear rate near the center of the fracture is nearly zero, corresponding to the lowest particle settling velocity. In contrast, the shear rate increases significantly near the fracture walls, which results in a marked increase in the particle settling velocity. These results indicate that particle settling in the shear-thinning non-Newtonian fracturing fluid exhibits substantial spatial inhomogeneity. The settling behavior is strongly governed by the local shear field; when the particle is located closer to the fracture wall, it experiences a lower local viscosity, which makes it easier to settle. In the shear-thinning fluid, the equivalent viscosity decreases significantly with an increasing shear rate. At the fracture center, the low shear rate maintains a high viscosity, which increases the drag and strongly suppresses the particle settling. Conversely, near the fracture wall, the high shear rate lowers the local viscosity, reduces fluid resistance, and facilitates particle descent. Therefore, different injection positions correspond to distinct local shear and viscosity conditions, which directly govern the settling dynamics of particles.
Subsequently, to validate the method for determining the settling velocity of particles in the non-Newtonian fluid, the simulated settling velocities obtained by varying the injection position and flow rate in the non-Newtonian fluid are compared with results derived from the settling velocity calculation formula outlined in Section 2.1. The comparison results are presented in Figure 10.
The Reynolds number of the particles in each simulation case ranges from 1.6787 × 10⁻⁷ to 4.29748 × 10⁻⁶, with all values remaining well below 0.1. This confirms that the Stokes settling formula is applicable under these conditions. The particle diameter is 0.0006 m, and the particle density is 2500 kg/m3. Figure 10 presents a comparison between the settling velocities predicted by the corrected formula and the simulated values at various positions along the fracture profile. The data points are evenly distributed around the line y = x, confirming the applicability and robustness of the proposed formula for predicting the settling velocity in shear-thinning fluids at low Reynolds numbers.
Although the overall trend shows a good fit, some data points deviate from the ideal line, mainly due to the boundary layer effect. The closer the particle injection location is to the fracture wall, the more susceptible the particles are to wall effects and enhanced shear gradients, which results in a non-uniform distribution of the local fluid viscosity and shear rate. This leads to deviations of the actual settling velocity from the ideal behavior. Quantitative analysis reveals that the average relative error increases from 8.2% near the fracture center to 30.9% close to the wall, as shown in Table 1. This discrepancy arises mainly from the no-slip boundary condition and the finite domain of the fracture, which create velocity gradients and viscous boundary layers that restrict particle motion compared to the infinite medium assumptions underlying the theoretical models. The current models for non-Newtonian power-law fluids are largely based on empirical or semi-empirical correlations derived from experimental data. In contrast, our study proposes an analytical solution that accounts for the spatial variation in shear rate and fluid rheology, thereby overcoming the limitations of traditional approaches. Despite these localized deviations, the proposed method demonstrates strong potential for rapid and accurate prediction of particle settling behavior and the estimation of key engineering parameters under realistic fracturing conditions.
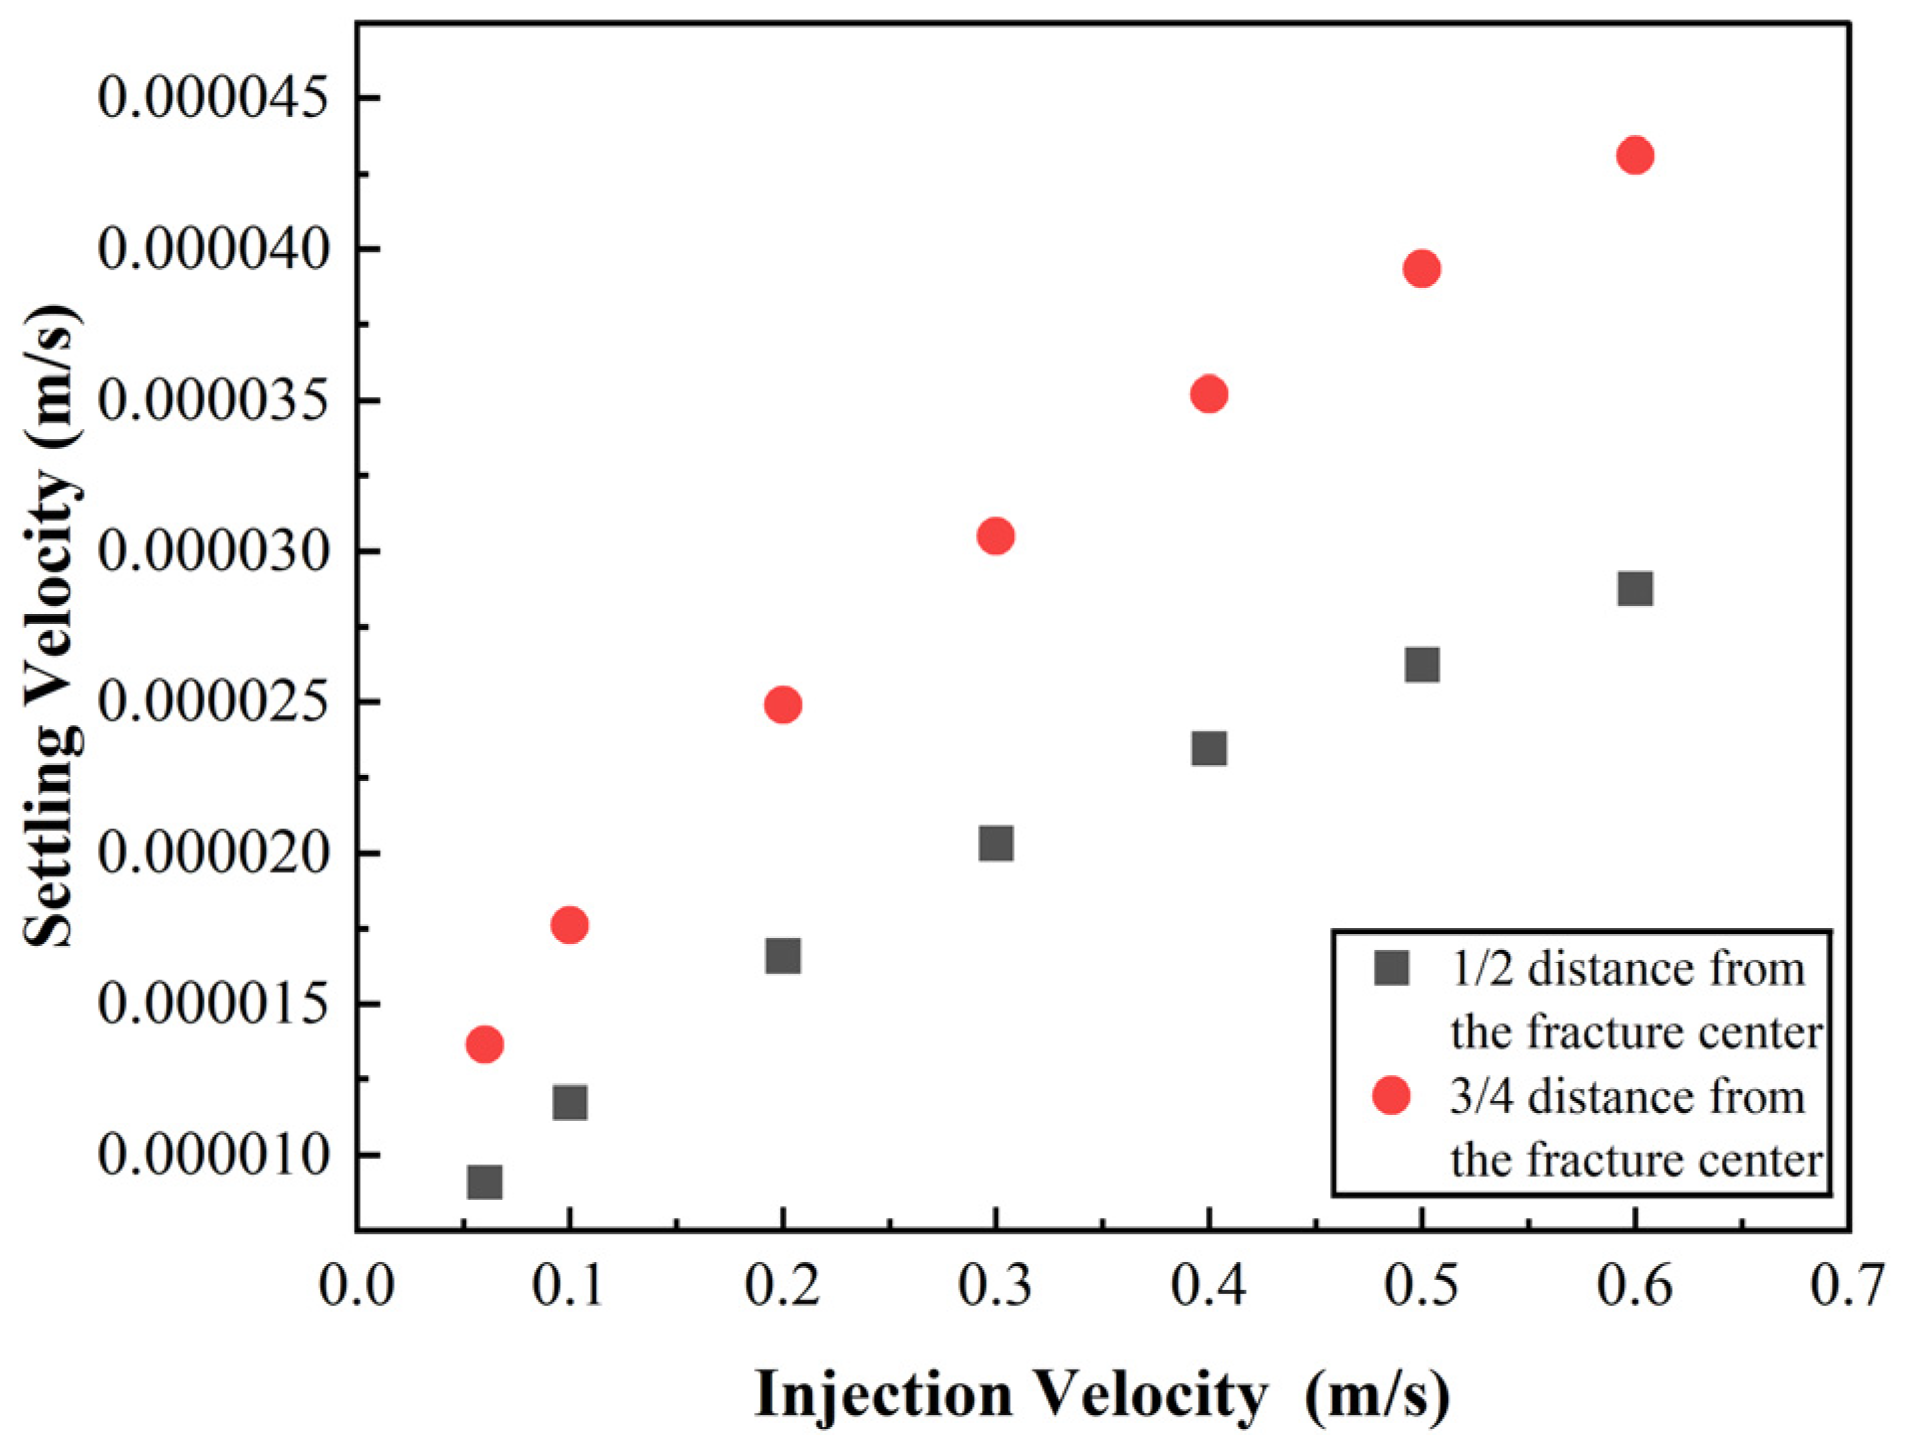
When they are suspended in a power-law fluid, the settling velocity of particles varies at different positions from fracture walls, as shown in Figure 11. As previously discussed, this is due to the spatial variation in fluid viscosity. Therefore, the local shear rate at various positions should be calculated using the prediction model proposed in this study to determine the corresponding settling velocities. By incorporating the spatial distribution of the shear rate and viscosity within the fracture, the proposed model enables the estimation of location-dependent settling velocities of particles. This provides a fundamental framework for understanding the influence of rheological properties on particle transport behavior. In particular, the method allows us to predict how particles settle at different locations within the fracture, offering insights into their transport distance and enabling estimation of the effective length of the propped fracture. These findings offer valuable theoretical guidance for optimizing fracturing fluid design and improving treatment performance in field applications.

4. Conclusions

This study proposes a novel method for predicting the proppant settling velocity in power-law non-Newtonian fluid, addressing limitations of traditional models in complex rheological environments. The key findings are summarized as follows:
  • Newtonian fluids: The proppant settling velocity is primarily governed by the fluid viscosity and particle diameter. Higher viscosity significantly enhances the drag force, reduces the settling velocity of proppants, and thus improves the proppant suspension capacity. Conversely, larger particle diameters accelerate settling due to the increased gravitational force. These observations align with Stokes’ law, validating the foundational principles of particle dynamics in the Newtonian fluid;
  • Non-Newtonian fluids: In power-law shear-thinning fluids, the settling behavior exhibits spatial heterogeneity due to localized variations in shear rate and viscosity. Beyond the viscosity and particle size, the injection position within the fracture critically influences the settling velocity. Near fracture walls, elevated shear rates reduce fluid viscosity, resulting in a rapid settling. In contrast, low-shear regions near the fracture center maintain a high fluid viscosity, which hinders the proppant settling;
  • Newly proposed model: A practical framework is established by integrating the spatial distribution of the shear rate calculated with the power-law rheological model. The local viscosity is derived from the shear-dependent rheology, and Stokes’ law is then adapted to predict the settling velocity of proppant in the non-Newtonian fluid. The results indicate that the model achieved high accuracy in the fracture center region, with an average relative error of 8.2%. Despite localized deviations in the near-wall region, the analytical model proposed in this study can still reliably predict settling velocities, providing theoretical support for the rapid and accurate estimation of particle settling behavior and key engineering parameters in practical fracturing scenarios.
This new model helps bridge theoretical models and field-scale complexities, providing theoretical foundations to optimize fracturing fluid design and operational parameters. By mitigating premature proppant settling, it enhances fracture conductivity and supports efficient hydrocarbon recovery in shale or tight reservoirs. Furthermore, this work underscores the critical role of spatial shear and viscosity heterogeneity in fracture simulations. The proposed approach offers significant engineering value for optimizing proppant transport and ensuring sustainable productivity in hydraulic fracturing operations.

Author Contributions

Conceptualization, T.L. and Z.D.; Methodology, Z.D. and L.Z.; Validation, M.Y.; Investigation, Z.D., J.W., L.Z. and M.Y.; Data curation, J.W., F.X. and L.Z.; Writing—original draft, T.L. and Z.D.; Writing—review and editing, T.L.; Visualization, F.X.; Supervision, T.L., M.Y. and F.Z.; Project administration, F.Z.; Funding acquisition, T.L. and F.Z. All authors have read and agreed to the published version of the manuscript.

Funding

This work was financially supported by the General Program Grant from the National Natural Science Foundation of China (52274051), and the Key Program of the Joint Fund from the National Natural Science Foundation of China (U23B2084).

Data Availability Statement

The original contributions presented in this study are included in the article. Further inquiries can be directed to the corresponding author.

Acknowledgments

The authors gratefully acknowledge the technical support from the State Key Laboratory of Petroleum Resources and Engineering at China University of Petroleum, Beijing. Special thanks are extended to the editors and reviewers of Processes for their time and effort in improving the quality of this paper.

Conflicts of Interest

The authors declare no conflict of interest.

References

  1. Wu, Z.; Cui, C.; Jia, P.; Wang, Z.; Sui, Y. Advances and challenges in the development of hydraulic fracturing of tight reservoirs: A critical review. Energy Geosci. 2021, 3, 427–435. [Google Scholar] [CrossRef]
  2. Sun, L.; Zou, C.; Jia, A.; Wei, Y.; Zhu, R.; Wu, S.; Guo, Z. Development characteristics and orientation of tight oil and gas in China. Pet. Explor. Dev. 2019, 46, 1073–1087. [Google Scholar] [CrossRef]
  3. Zhai, G.M. Speculations on the exploration and development of unconventional hydrocarbon resources. Nat. Gas Ind. 2008, 28, 1–3. [Google Scholar]
  4. Barati, R.; Liang, J.T. A review of fracturing fluid systems used for hydraulic fracturing of oil and gas wells. J. Appl. Polym. Sci. 2014, 131, 318–323. [Google Scholar] [CrossRef]
  5. Fredd, C.N.; McConnell, S.B.; Boney, C.L.; England, K.W. Experimental study of fracture conductivity for water-fracturing and conventional fracturing applications. SPE J. 2001, 6, 288–298. [Google Scholar] [CrossRef]
  6. Li, Q.; Xing, H.; Liu, J.; Liu, X. A review on hydraulic fracturing of unconventional reservoir. Petroleum 2015, 1, 8–15. [Google Scholar] [CrossRef]
  7. Zhang, Y.; Lu, X.; Zhang, X.; Li, P. Proppant Transportation in Cross Fractures: Some Findings and Suggestions for Field Engineering. Energies 2020, 13, 4912. [Google Scholar] [CrossRef]
  8. Hou, Z.; Yuan, Y.; Chen, Y.; Feng, J.; Liu, Y.; Zhang, X. Experimental Study on Proppant Migration in Fractures Following Hydraulic Fracturing. Water 2024, 16, 1941. [Google Scholar] [CrossRef]
  9. Yu, H.; Xu, W.L.; Li, B.; Huang, H.; Micheal, M.; Wang, Q.; Huang, M.; Meng, S.; Liu, H.; Wu, H. Hydraulic fracturing and enhanced recovery in shale reservoirs: Theoretical analysis to engineering applications. Energy Fuels 2023, 37, 9956–9997. [Google Scholar] [CrossRef]
  10. Kong, C.; Yang, L.; Guo, X.; Tian, F.; Li, Y. Proppant Migration Law Considering Complex Fractures. Processes 2023, 11, 14. [Google Scholar] [CrossRef]
  11. Huang, H.; Zheng, Y.; Zhang, W. Characteristics of proppant transport and placement within rough hydraulic fractures. Pet. Explor. Dev. 2024, 51, 453–463. [Google Scholar] [CrossRef]
  12. Yang, S.; Cheng, W.; Hu, Q.; Lei, G. Sensitivity analysis of proppant transportation and settling in a hydraulic fracture. Phys. Fluids 2025, 37, 013360. [Google Scholar] [CrossRef]
  13. Zeng, J.; Li, H.; Zhang, D. Numerical simulation of proppant transport in hydraulic fracture with the upscaling CFD-DEM method. J. Nat. Gas Sci. Eng. 2016, 33, 264–277. [Google Scholar] [CrossRef]
  14. Kumar, D.; Ghassemi, A. Modeling and Analysis of Proppant Transport and Deposition in Hydraulic/Natural Fracture Networks. In Proceedings of the 7th Unconventional Resources Technology Conference, Denver, Colorado, 22–24 July 2019. [Google Scholar] [CrossRef]
  15. Zhao, K.; Wang, J.; Xu, H.; Zhang, L.; Jiang, H. Numerical simulation of proppant migration and sedimentation behavior in complex fractures based on computational fluid dynamics. Phys. Fluids 2023, 35, 093103. [Google Scholar] [CrossRef]
  16. Tang, P.; Zeng, J.; Zhang, D.; Li, H. Constructing sub-scale surrogate model for proppant settling in inclined fractures from simulation data with multi-fidelity neural network. J. Pet. Sci. Eng. 2022, 210, 110051. [Google Scholar] [CrossRef]
  17. Wu, Z.; Hu, Y.; Lu, B.; Jiang, T. Study on the Law and Influencing Factors of Proppant Settling in Fracturing Fluid. In Proceedings of the International Field Exploration and Development Conference 2020, Chengdu, China, 23–25 September 2020; Springer: Singapore, 2020; pp. 2834–2842. [Google Scholar]
  18. Du, Q.; Yang, H.; He, S.; Deng, P.; Yang, X.; Lin, C.; Sun, Z.; Ren, L.; Yin, H.; He, B.; et al. Numerical Simulation and Application of Coated Proppant Transport in Hydraulic Fracturing Systems. Processes 2025, 13, 1062. [Google Scholar] [CrossRef]
  19. Stokes, G.G. On the effect of the internal friction of fluids on the motion of pendulums. In Transactions of the Cambridge Philosophical Society; Cambridge University Press: Cambridge, UK, 1851. [Google Scholar]
  20. Wrobel, M.; Mishuris, G.; Papanastasiou, P. On the influence of fluid rheology on the hydraulic fracture evolution. arXiv 2020. [Google Scholar] [CrossRef]
  21. Almubarak, T.; Li, L.; Ng, J.H.; Nasr-El-Din, H.; AlKhaldi, M. New Insights into Hydraulic Fracturing Fluids used for High Temperature Wells. Petroleum 2020, 70, 70–79. [Google Scholar] [CrossRef]
  22. Abdelaal, A.; Aljawad, M.S.; Alyousef, Z.; Almajid, M.M. A review of foam-based fracturing fluids applications: From lab studies to field implementations. J. Nat. Gas Sci. Eng. 2021, 95, 104236. [Google Scholar] [CrossRef]
  23. Wanniarachchi, W.A.M.; Ranjith, P.G.; Perera, M.S.A. Shale gas fracturing using foam-based fracturing fluid: A review. Environ. Earth Sci. 2017, 76, 91. [Google Scholar] [CrossRef]
  24. Arabi, A.S.; Sanders, R.S. Particle terminal settling velocities in non-Newtonian viscoplastic fluids. Can. J. Chem. Eng. 2016, 94, 1092–1101. [Google Scholar] [CrossRef]
  25. Moreira, B.A.; de Oliveira Arouca, F.; Damasceno, J.J.R. Analysis of suspension sedimentation in fluids with rheological shear-thinning properties and thixotropic effects. Powder Technol. 2017, 308, 290–297. [Google Scholar] [CrossRef]
  26. Alghalibi, D.; Fornari, W.; Rosti, M.E.; Brandt, L. Sedimentation of finite-size particles in quiescent wall-bounded shear-thinning and Newtonian fluids. Int. J. Multiph. Flow 2020, 129, 103291. [Google Scholar] [CrossRef]
  27. Murch, W.L.; Shaqfeh, E.S.G. Collective effects in the sedimentation of particles in a viscoelastic fluid. Phys. Rev. Fluids 2020, 5, 073301. [Google Scholar] [CrossRef]
  28. Patankar, N.A.; Huang, P.Y.; Ko, T.; Joseph, D.D. Lift-off of a single particle in Newtonian and viscoelastic fluids by direct numerical simulation. J. Fluid Mech. 2001, 438, 67–100. [Google Scholar] [CrossRef]
  29. Chhabra, R.P. Bubbles, Drops, and Particles in Non-Newtonian Fluids; CRC Press: Boca Raton, FL, USA, 2023. [Google Scholar]
  30. Matveenko, V.N.; Kirsanov, E.A. Rheology of structured liquids. Flow regimes and rheological equations. Colloid J. 2025, 87, 38–48. [Google Scholar] [CrossRef]
  31. Khataniar, S.; Chukwu, G.A.; Xu, H. Evaluation of rheological models and application to flow regime determination. J. Pet. Sci. Eng. 1994, 11, 155–164. [Google Scholar] [CrossRef]
  32. Shah, S.N. Proppant-settling correlations for non-Newtonian Fluids. SPE Prod. Eng. 1986, 1, 446–448. [Google Scholar] [CrossRef]
  33. Roodhart, L.P. Proppant settling in non-Newtonian fracturing fluids. In Proceedings of the SPE Rocky Mountain Petroleum Technology Conference/Low-Permeability Reservoirs Symposium, Denver, Colorado, 19–22 May 1985; SPE: Richardson, TX, USA, 1985. SPE-13905-MS. [Google Scholar]
  34. Ovarlez, G.; Bertrand, F.; Coussot, P.; Chateau, X. Shear-induced sedimentation in yield stress fluids. J. Non-Newton. Fluid Mech. 2012, 177–178, 19–28. [Google Scholar] [CrossRef]
  35. Amaratunga, M.; Rabenjafimanantsoa, H.A.; Time, R.W. Estimation of shear rate change in vertically oscillating non-Newtonian fluids: Predictions on particle settling. J. Non-Newton. Fluid Mech. 2020, 277, 104236. [Google Scholar] [CrossRef]
  36. Anyaoku, C.C.; Bhattacharya, S.; Parthasarathy, R. Sheared settling in viscoelastic shear-thinning fluids: Empirical studies and model development. AIChE J. 2024, 70, e18460. [Google Scholar] [CrossRef]
  37. Bai, Z.; Li, M. Prediction of proppant settling velocity in fiber-containing fracturing fluids. ACS Omega 2023, 8, 31857–31869. [Google Scholar] [CrossRef] [PubMed]
  38. Liu, Z.; Fan, W. Velocity distribution and scaling properties of wall bounded flow. J. Zhejiang Univ.-Sci. A 2010, 11, 505–510. [Google Scholar] [CrossRef]
  39. Liu, Y. Settling and Hydrodynamic Retardation of Proppants in Hydraulic Fractures. Ph.D. Thesis, The University of Texas at Austin, Austin, TX, USA, 2006. [Google Scholar]
  40. Richardson, J.F.; Zaki, W.N. Sedimentation and fluidisation: Part I. Chem. Eng. Res. Des. 1997, 75, S82–S100. [Google Scholar] [CrossRef]
  41. Daneshy, A.A. Numerical solution of sand transport in hydraulic fracturing. J. Pet. Technol. 1978, 30, 132–140. [Google Scholar] [CrossRef]
  42. Happel, J.; Brenner, H. Low Reynolds Number Hydrodynamics: With Special Applications to Particulate Media; Springer Science & Business Media: Berlin, Germany, 2012. [Google Scholar]
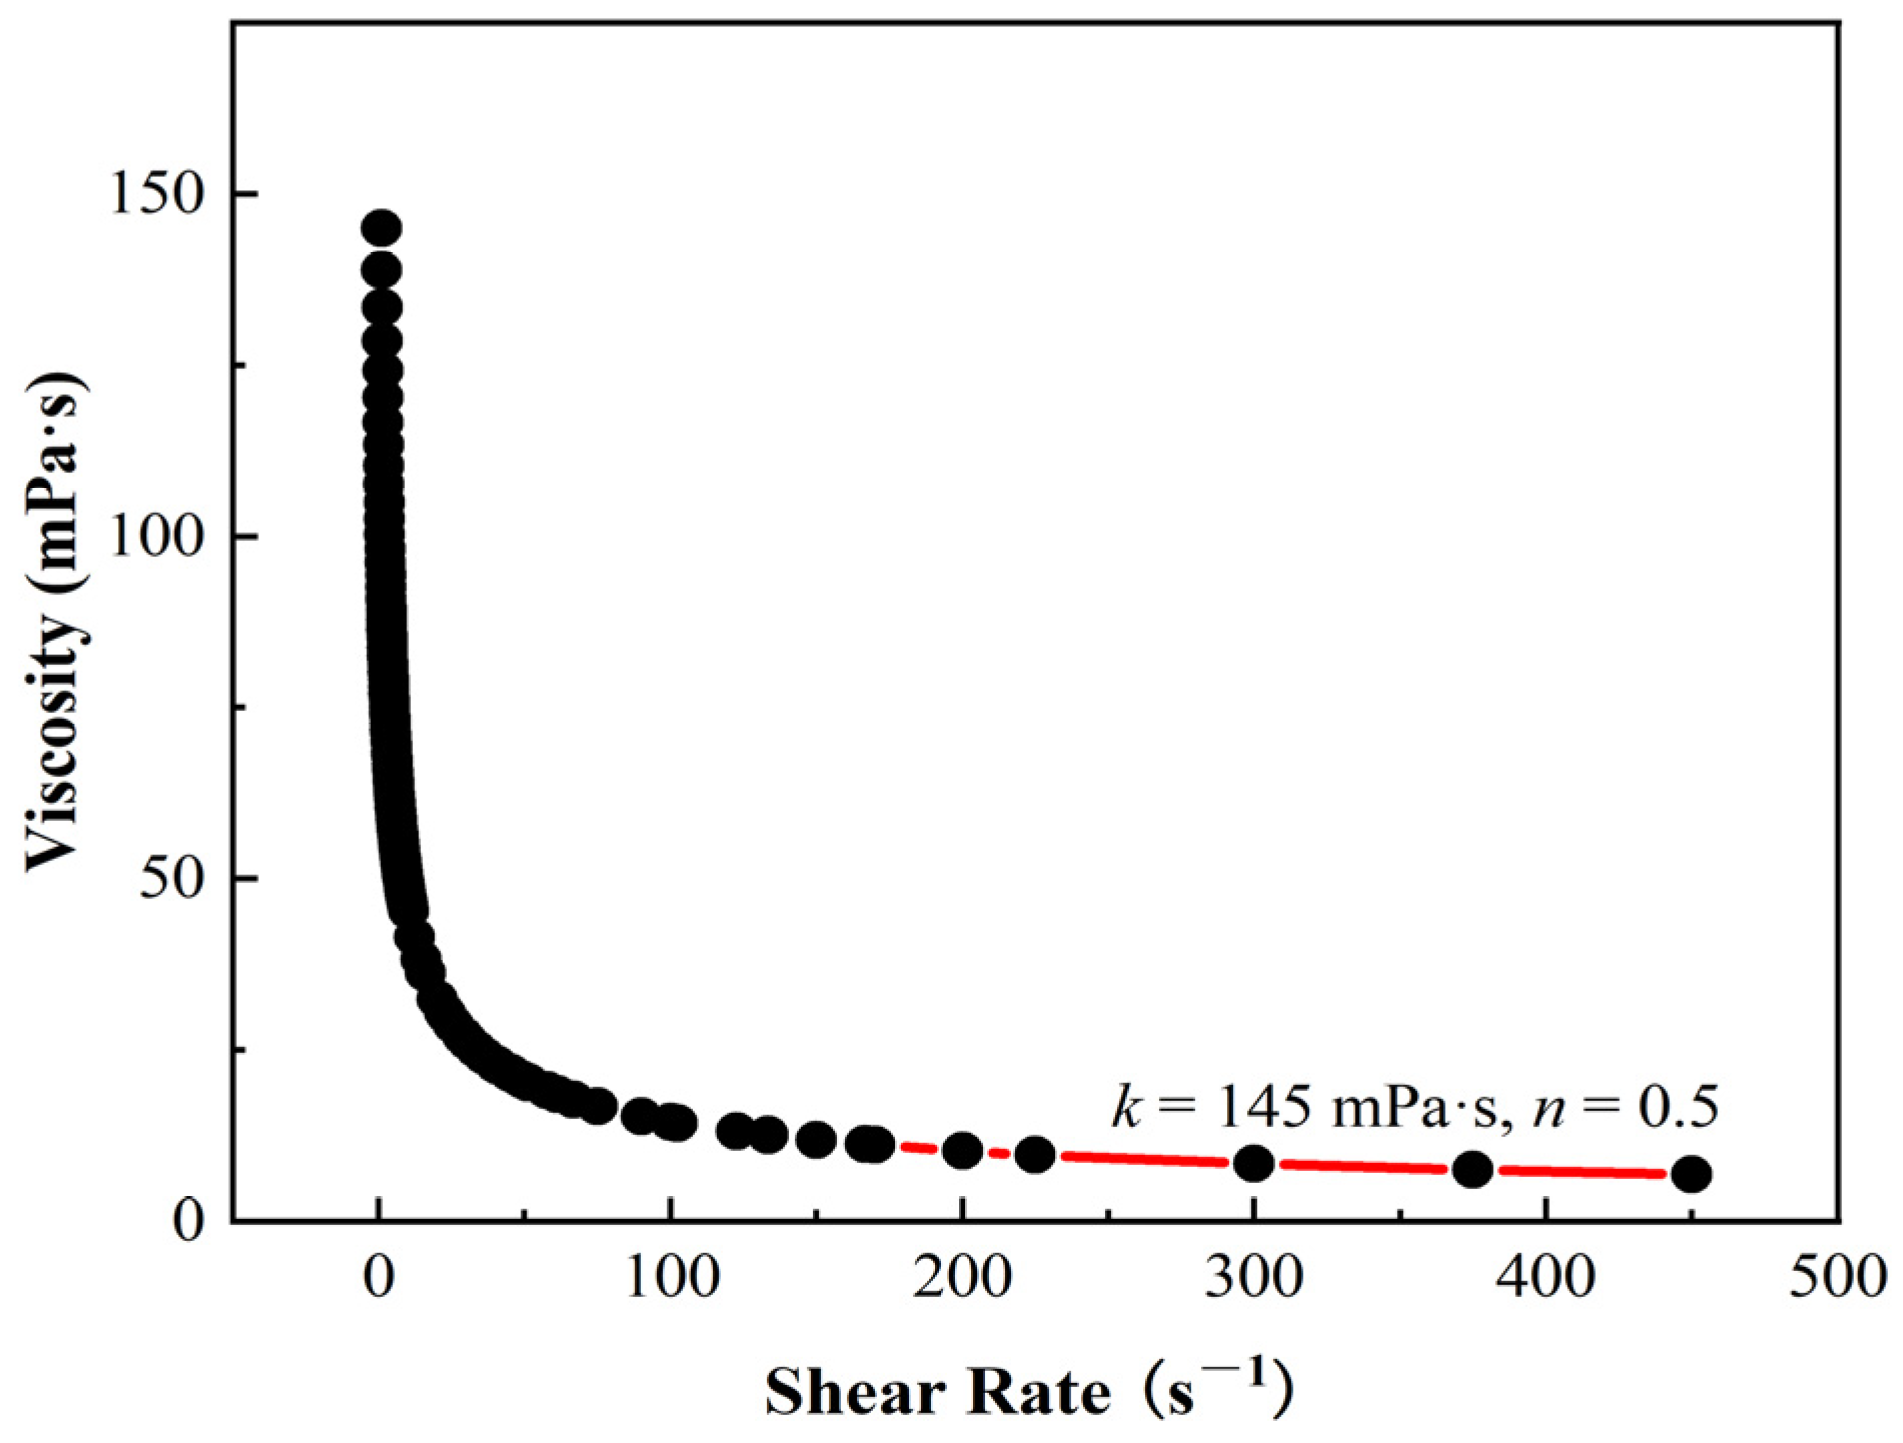
Figure 1. The viscosity of the non-Newtonian fluid used in the simulation as a function of the shear rate.
Processes 13 02631 g001
Figure 2. Schematic diagram of a hydraulic fracture.
Processes 13 02631 g002
Figure 3. Schematic diagram of the hydraulic fracture model.
Processes 13 02631 g003
Figure 4. Comparison of settling velocities of particles with different particle concentrations using different models.
Processes 13 02631 g004
Figure 5. Vertical position of particles in Newtonian fluids with various viscosities.
Processes 13 02631 g005
Figure 6. Settling velocity of particle in Newtonian fluids with various fluid viscosities and particle diameters.
Processes 13 02631 g006
Figure 7. Comparison of settling velocity of particles in Newtonian and non-Newtonian fluids under various horizontal flow velocities.
Processes 13 02631 g007
Figure 8. Vertical position of particles under various injection velocities of the non-Newtonian fluid.
Processes 13 02631 g008
Figure 9. Distribution of shear rate and settling velocity at different locations of a hydraulic fracture.
Processes 13 02631 g009
Figure 10. Fitting of the calculated settling velocity and the simulated settling velocity at different locations of a hydraulic fracture.
Processes 13 02631 g010
Figure 11. Variation in settling velocity at different injection flow velocities at different positions of non-Newtonian fluid.
Processes 13 02631 g011
Table 1. Average relative error between simulated and formula-corrected settling velocities.
Distance from Fracture CenterAverage Relative Error (%)
1/2 (near center)8.2
2/310.6
3/423.3
4/5 (near wall)30.9
Disclaimer/Publisher’s Note: The statements, opinions and data contained in all publications are solely those of the individual author(s) and contributor(s) and not of MDPI and/or the editor(s). MDPI and/or the editor(s) disclaim responsibility for any injury to people or property resulting from any ideas, methods, instructions or products referred to in the content.