1. Introduction
The Kelameili volcanic rock gas reservoir exhibits dual-medium characteristics (fracture–pore systems), featuring hard lithology, poor reservoir properties, well-developed natural fractures, and low natural productivity. To achieve commercial production, hydraulic fracturing stimulation is essential. However, the initial daily gas production of some gas wells drops rapidly after fracturing, mainly due to the small scale of the initial fracturing and modification, long production time, no contribution of productivity in the near-well area, the reduced conductivity of artificial fractures, and deteriorated supply capacity from the remote reservoir to the near-well area. Re-fracturing has proven an effective approach to unlock remaining development potential in this reservoir. The key challenge for the efficient development of Kelameili gas field lies in optimizing re-fracturing parameters [
1]. As a major producing block, Dixi 14 presents complex lithology, poor reservoir quality, and sparsely distributed microfractures that tend to generate complex fracture networks during stimulation [
2]. After extended production, the in situ stress distribution has become ambiguous in this block. Current re-fracturing designs lack proper parameter optimization based on stress field evolution, resulting in suboptimal stimulation outcomes [
3]. Therefore, comprehensive studies on in situ stress field evolution and re-fracturing parameter optimization are critically needed to enhance recovery efficiency in Kelameili’s volcanic gas reservoirs.
In recent years, research on the fracturing technology of volcanic rock reservoirs, as an important means to increase the production and efficiency of this type of unconventional gas reservoir, has received extensive attention and application in various oil fields. Field practice has shown that this technology has significant potential for increasing production. Deng et al. [
4] proposed a multi-stage temporary plugging and return fracturing technology approach of “detailed hole filling + pre-pressure energy replenishment + expanded modification volume”, which achieved an average daily increase of 4.7 tons in oil per well and a cumulative increase of 832 tons in oil production in the unconventional volcanic rock oil reservoir of Niudong at the Tuha Oilfield. Liu et al. [
5] summarized engineering technology and characteristic schemes for the development of volcanic rock gas reservoirs and pointed out that hydraulic fracturing is the key technology for exploiting such gas reservoirs. Liu et al. [
6] established a 3D-EPM coupling equation and simulated three-dimensional hydraulic fracture propagation, the interaction with natural fractures, and the influence of in situ stress. Chen et al. [
7] conducted laboratory experiments to study the three processes of volcanic rock hydraulic fracturing, acid pressure, and proppant acid pressure and evaluated the average acid erosion depth and proppant embedding depth under acid pressure. Yu et al. [
8] compared the fracture pressures of rocks under different experimental conditions and conducted an in-depth study on the fracture propagation behavior of different rocks under different influencing factors. Guo et al. [
9] investigated the effect of in situ stress, treatment parameters and different patterns of multi-well fracturing (staggered or tip to tip) on fracture propagation.
During oil and gas development, the in situ stress field undergoes dynamic evolution across different exploration and production stages. The hydraulic fractures generated during primary hydraulic fracturing alter both the magnitude and orientation of the original in situ stress [
10]. Furthermore, long-term production post fracturing generates elastic-induced stress and production-induced stress, leading to variations in formation pore pressure and in situ stress redistribution [
11]. To address these complexities, researchers have investigated the evolution of in situ stress fields. For example, Li et al. [
12] developed a three-dimensional heterogeneous geological model incorporating in situ stress characteristics, reservoir properties, and rock mechanics parameters for a single well. Chen et al. [
13] established a highly accurate geomechanical model using compensated neutron density and acoustic logging data. Wang et al. [
14] analyzed induced stress near hydraulic fractures in elastic, poroelastic, and dual-porosity media, providing detailed characterizations of low-permeability, sandstone, and fractured formations. While these studies primarily focus on theoretical predictions of in situ stress field distribution, few account for the actual effects of production and fracturing operations on stress field dynamics.
This study investigates the Dixi 14 block, integrating rock mechanics experiments and well logging data to calibrate finite element simulation parameters. An initial geomechanical model was developed, and stress field evolution was analyzed to determine the current in situ stress distribution. Building on the current geomechanical and in situ stress field models, the re-fracturing well construction parameters were optimized, resulting in an optimal parameter combination tailored for the target block.
2. Rock Mechanics and In Situ Stress Experiments
The rock mechanical parameters, including Young’s modulus, Poisson’s ratio, tensile strength, and fracture toughness, serve as the critical link between reservoir geological parameters and geomechanical characteristics [
15,
16]. These parameters are fundamental to fracture mechanism analysis and reservoir stress field simulation [
17,
18]. In practice, dynamic rock mechanical parameters (obtained through well log interpretation) are typically converted to static parameters (determined via laboratory rock mechanics tests) to accurately evaluate reservoir rock mechanical properties.
2.1. Triaxial Compression Experiment of Volcanic Rock
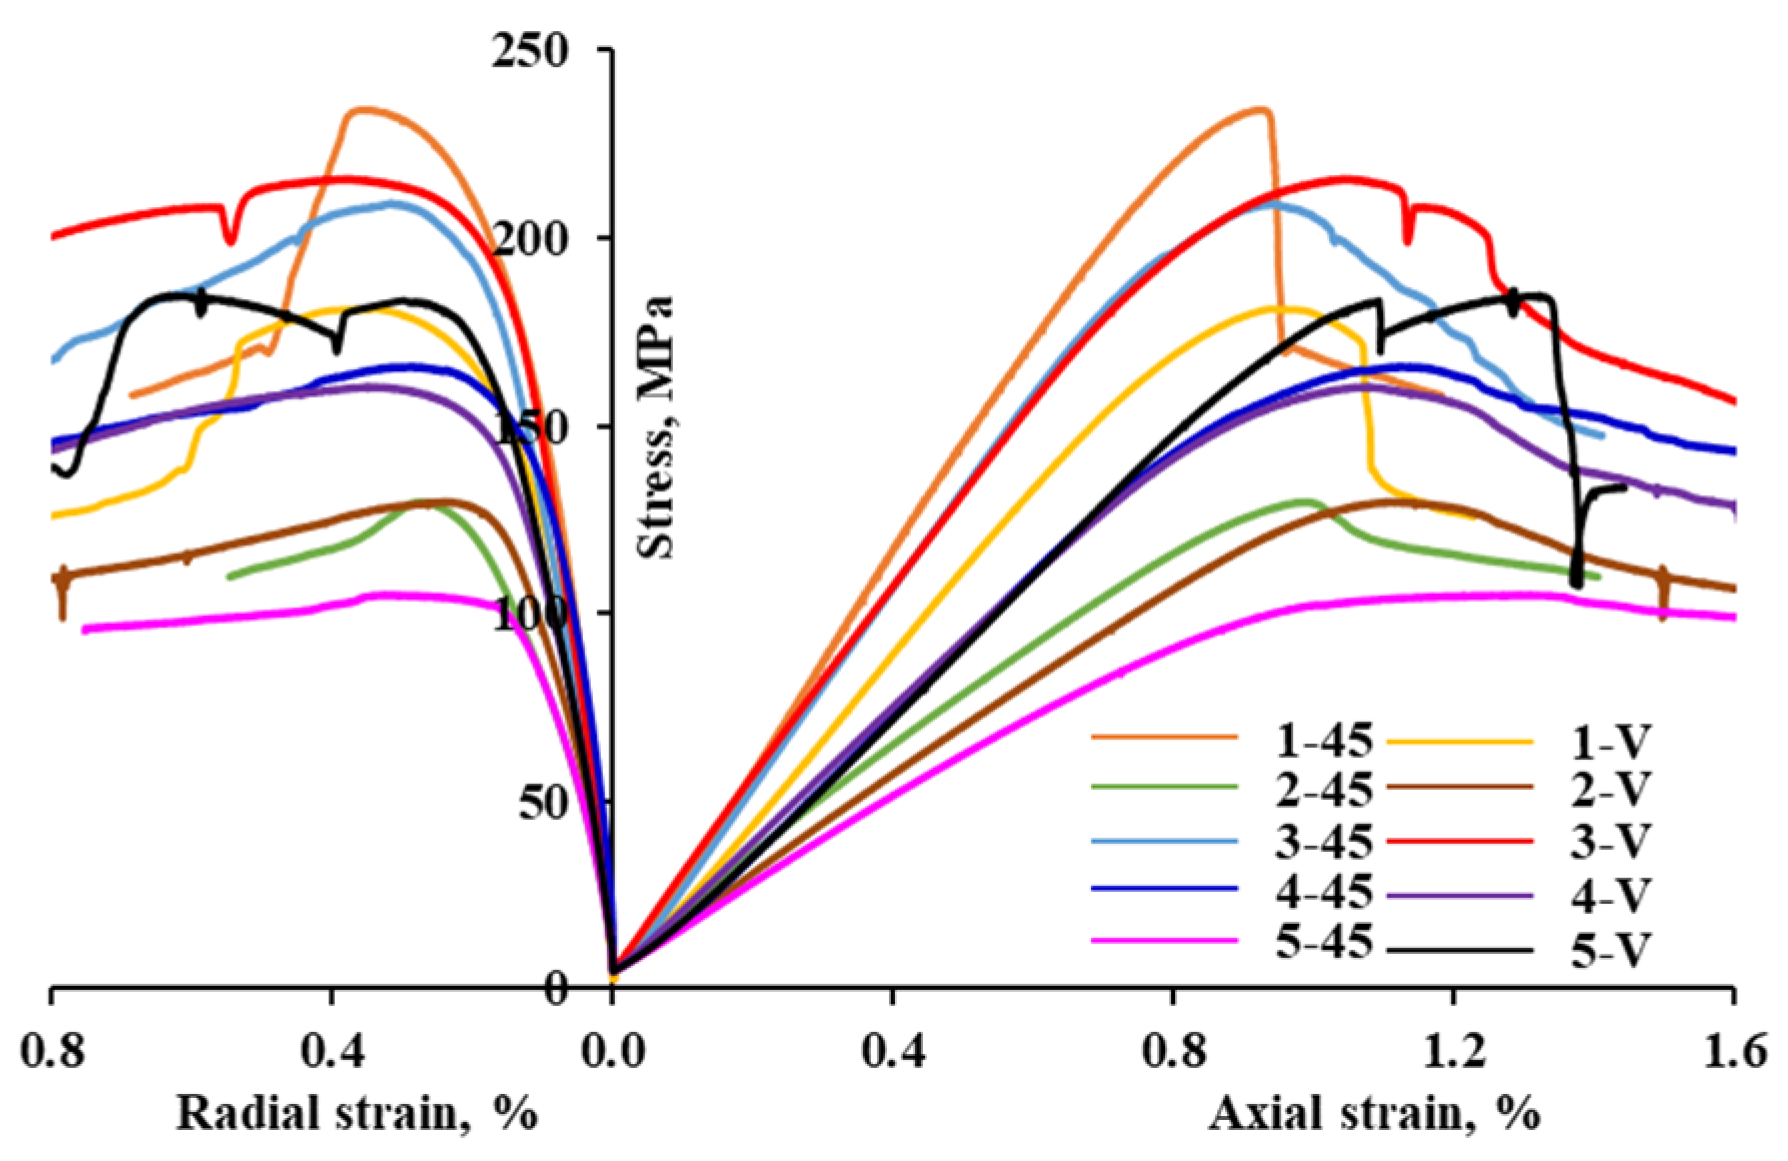
We employed a comprehensive rock mechanics testing system to conduct standard triaxial compression tests on core samples, determining the static Young modulus and Poisson ratio of the rock. Ten core samples collected on-site were selected for the experiment. The core samples were from five typical production wells in this block, with a collection depth ranging from 3652 to 3691 m. This depth corresponds to the main development layer system of the Dixi 14 block. Considering that the current formation pressure of Well K6 is 28.7 MPa and the well is in production, the confining pressure was set at 25 MPa. The triaxial compression test procedures and corresponding results are presented in
Figure 1 and
Table 1, respectively. The experimental results indicate that the volcanic rock samples exhibited an average Poisson ratio of 0.22 and an average Young modulus of 16.97 GPa.
2.2. Volcanic Rock Tensile Strength Test
Based on the third part of the industry standard recommended by the American Rock Mechanics Association, using the GCTSRTR-1500 high-temperature and high-pressure comprehensive rock testing system, Brazilian splitting tests were conducted on the samples from the Dixi 14 block. The samples were processed into short cylindrical bodies with a diameter of Φ25 mm and a length of 15 mm using a vertical core drilling machine and a face grinding machine. By measuring the failure load in the diameter direction and the size of the sample, the tensile strength of the rock was obtained. The calculation formula for the tensile strength is as follows [
19]:
where
σt represents the tensile strength, MPa;
P is the maximum load when the rock breaks, N;
D is the diameter of the rock sample, mm; t is the thickness of the rock sample, mm.
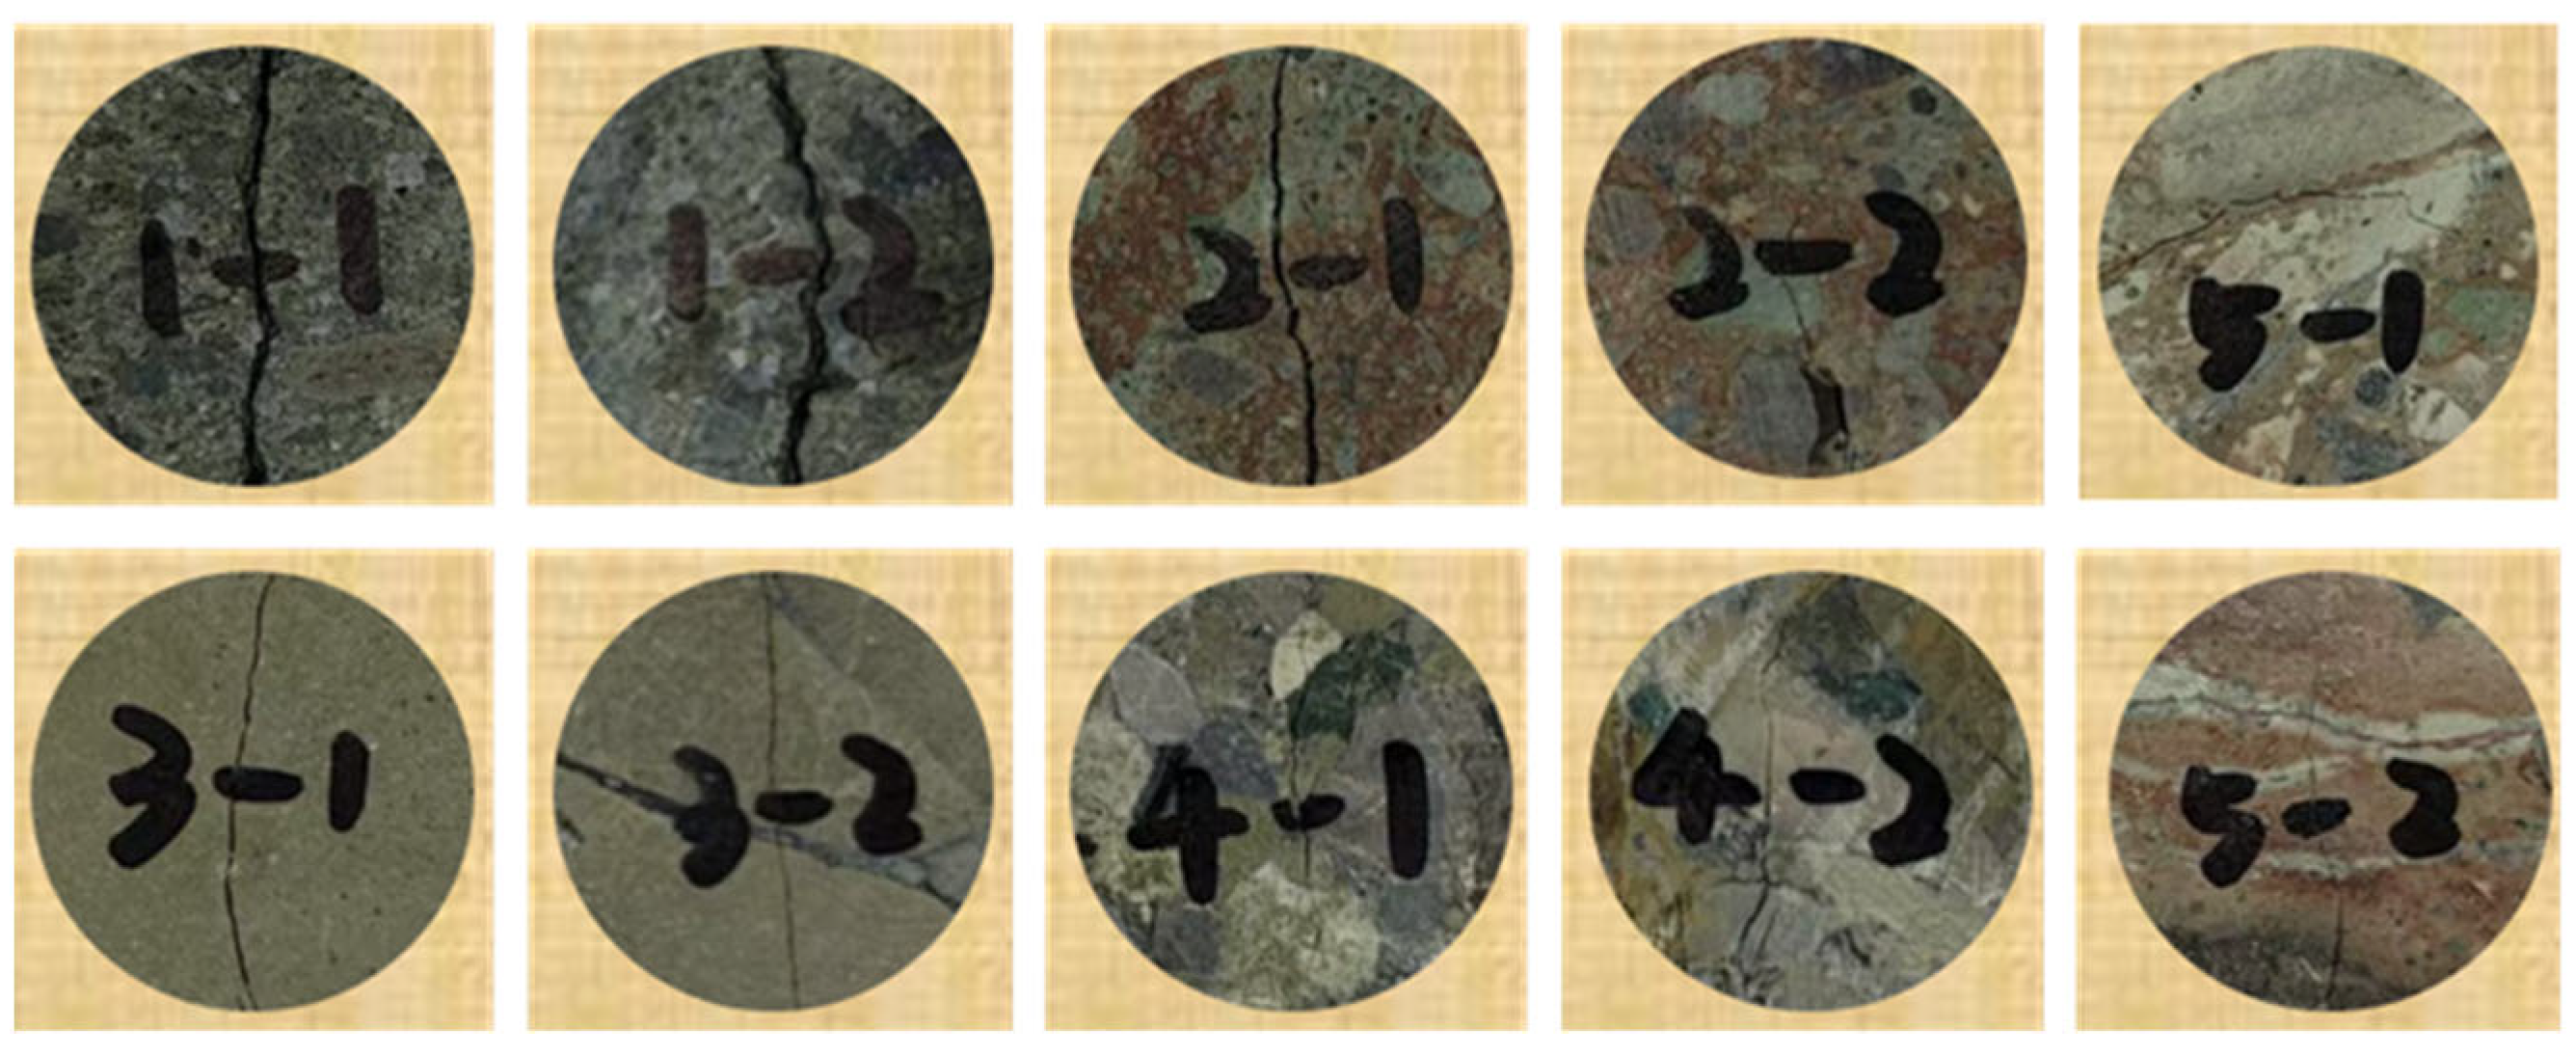
A series of Brazilian splitting tests were conducted on 10 rock specimens to determine their tensile strength. The tested samples are shown in
Figure 2, while
Table 2 presents the Brazilian tensile strength results for all 10 test groups. The measured tensile strength in the Dixi 14 block ranges from 0.93 to 10.53 MPa.
2.3. Experimental Study on Magnitude of In Situ Stress in Volcanic Rocks
The core samples used in this experiment were obtained from the gas field. Full-diameter field cores were drilled to extract cylindrical specimens (Φ25 × 50 mm) in three orientations: one vertical specimen (
Z-axis) and two horizontal specimens (Φ25 × 50 mm each) perpendicular to the core axis, totaling 20 specimens as shown in
Figure 3. Triaxial compression tests with acoustic emission monitoring were conducted on specimens from each orientation to determine the Kaiser effect (the Kaiser effect on rocks refers to the phenomenon where under the action of monotonic stress loading, the number of acoustic emissions of rocks suddenly increases when the stress value reaches its in situ stress underground) stress points [
20]. These stress values were then substituted into Equations (2)–(5) [
21] to calculate the three principal in situ stresses acting on the rock formation underground.
where
σH,
σh, and
σv represent the maximum and minimum horizontal principal stress and vertical stress, MPa;
PP represents the formation pore pressure, MPa;
α is the Biot coefficient;
σ⊥ is the Kaiser point stress of the core in the vertical direction, MPa; and
σ0°,
σ45°, and
σ90° are the Kaiser point stresses of the core in the three horizontal directions of 0°, 45°, and 90°, respectively, MPa.
The experiment conducted in situ stress tests on five full-diameter core samples collected from representative wells in the target block. With reference to Well K6′s current formation pressure of 28.7 MPa and considering its production status, the tests were performed under a confining pressure of 25 MPa.
Table 3 presents the results of five sets of volcanic rock in situ stress tests. The maximum horizontal principal stress in the Dixi 14 well area ranges from 85.57 to 98.96 MPa, the minimum horizontal principal stress ranges from 51.89 to 64.37 MPa, the vertical stress ranges from 89.50 to 94.06 MPa, and the difference in horizontal stress ranges from 26.41 to 34.95 MPa.
2.4. Dynamic and Static Conversion of Rock Mechanical Parameters
The acquisition of rock mechanical parameters typically relies on laboratory core testing, which provides high-precision mechanical property data through the direct measurement of subsurface core samples. However, this method cannot achieve continuous in situ stress characterization across entire well sections or construct mechanical field models at a regional scale. In contrast, well logging data are more readily available and can provide a one-dimensional distribution of rock mechanical parameters along the borehole with superior vertical continuity. By utilizing array acoustic logging data—including compressional wave (P-wave) and shear wave (S-wave) slowness, bulk density, and shale content—rock elastic parameters and strength properties can be calculated [
22,
23,
24]. The specific formulas are as follows:
where
Ed represents the dynamic Young modulus, GPa;
ρ denotes rock density, g/cm
3;
Vp is the velocity of the longitudinal wave, m/s;
Vs is the velocity of the transverse wave, m/s; and
μd is the dynamic Poisson ratio, dimensionless.
Based on the above equations, the dynamic rock mechanical parameters of deep volcanic reservoirs were first calculated using well logging data. The logging-derived results were then calibrated by plotting both dynamic and static rock mechanical parameters at the same depth on a unified coordinate system to establish their correlation and achieve dynamic-to-static parameter conversion. As shown in the cross-plot in
Figure 4, the conversion coefficients between dynamic and static rock mechanical parameters exhibit strong positive linear correlations. This analysis further yields dynamic–static conversion Formulas (8) and (9) as follows:
where
Es represents the static Young modulus, GPa;
Ed represents the dynamic Young modulus, GPa;
μs represents the static Poisson ratio, dimensionless; and
μd represents the dynamic Poisson ratio, dimensionless.
After establishing the calibration relationship between dynamic and static rock mechanical parameters, the well-log-derived profiles can be corrected to obtain triaxial static parameter profiles. This process yields continuous rock mechanical parameter profiles for key well locations, as illustrated in
Figure 5.
3. Establishment of Numerical Simulation Models and Applicability Verification
3.1. Establishment of Numerical Simulation Model
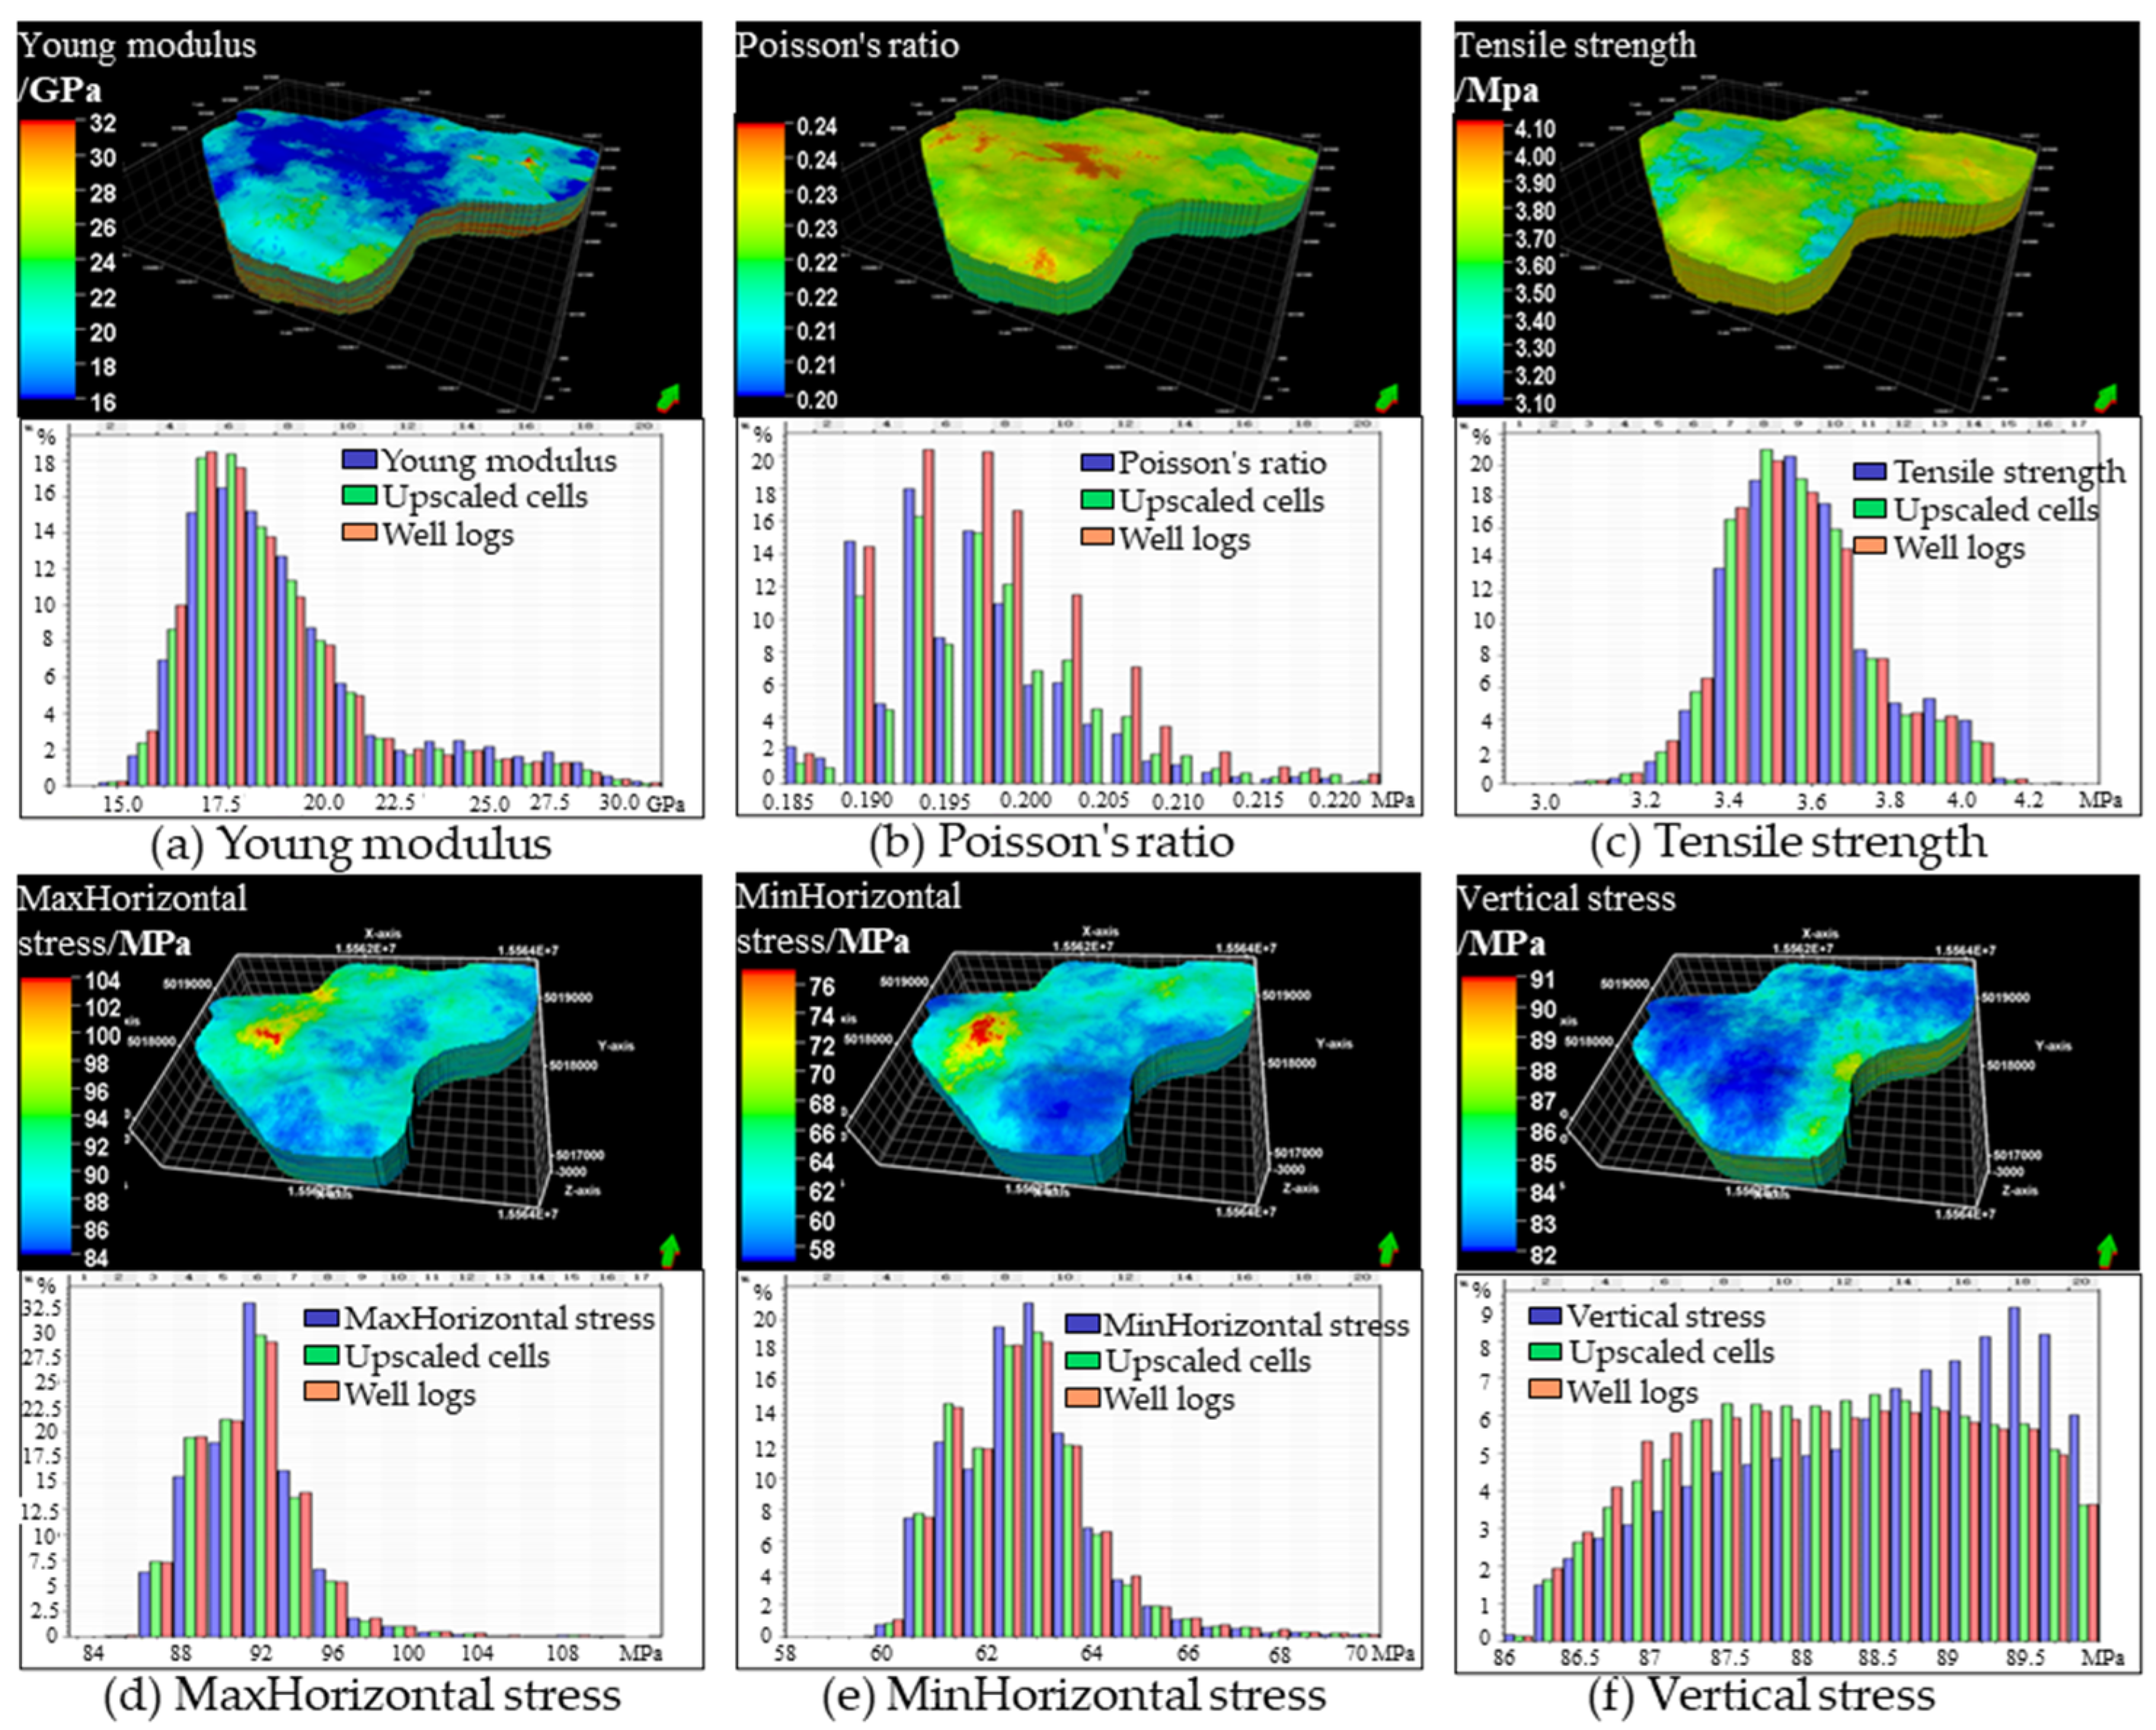
Based on the geological data and static rock mechanical parameter calculation results of 13 wells in the Dixi 14 block, a geological mechanics model was established using the integrated geological engineering software. The simulation area (the Dixi 14 rock mass) has a size of 3725 m × 3100 m × 458 m. According to the size of the simulation area, the grid size was determined to be 10 m × 10 m, and the vertical layer was divided into a grid size of 1 m. The total number of grids was 52,816,560 (
Figure 6). The initial Young modulus of the Dixi 14 block was 15–32 GPa, with an average of 19 GPa; Poisson’s ratio was 0.19–0.24, with an average of 0.20; the tensile strength was 3.08–4.12 MPa, with an average of 3.59 MPa; the initial maximum horizontal principal stress range was 84–104 MPa, with a peak of 95 MPa; the minimum horizontal principal stress range was 57–77 MPa, with a peak of 62 MPa; and the vertical stress range was 82–96 MPa, with a peak of 89 MPa.
3.2. Model Applicability Verification
Before conducting a series of simulation analyses, the applicability of both fracturing and production simulation processes was first validated through two approaches: (1) Fracture Geometry Characterization: compared to orthogonal fracture [
25] or discrete fracture [
26] models, fracture propagation simulations based on actual geological data and engineering designs provide the most direct method for characterizing complex fracture morphology. For Well K1 in the Dixi-14 block, net pressure matching was performed using second-by-second fracturing operation data. The inversion fracture parameters (including fracture length and height) are shown in
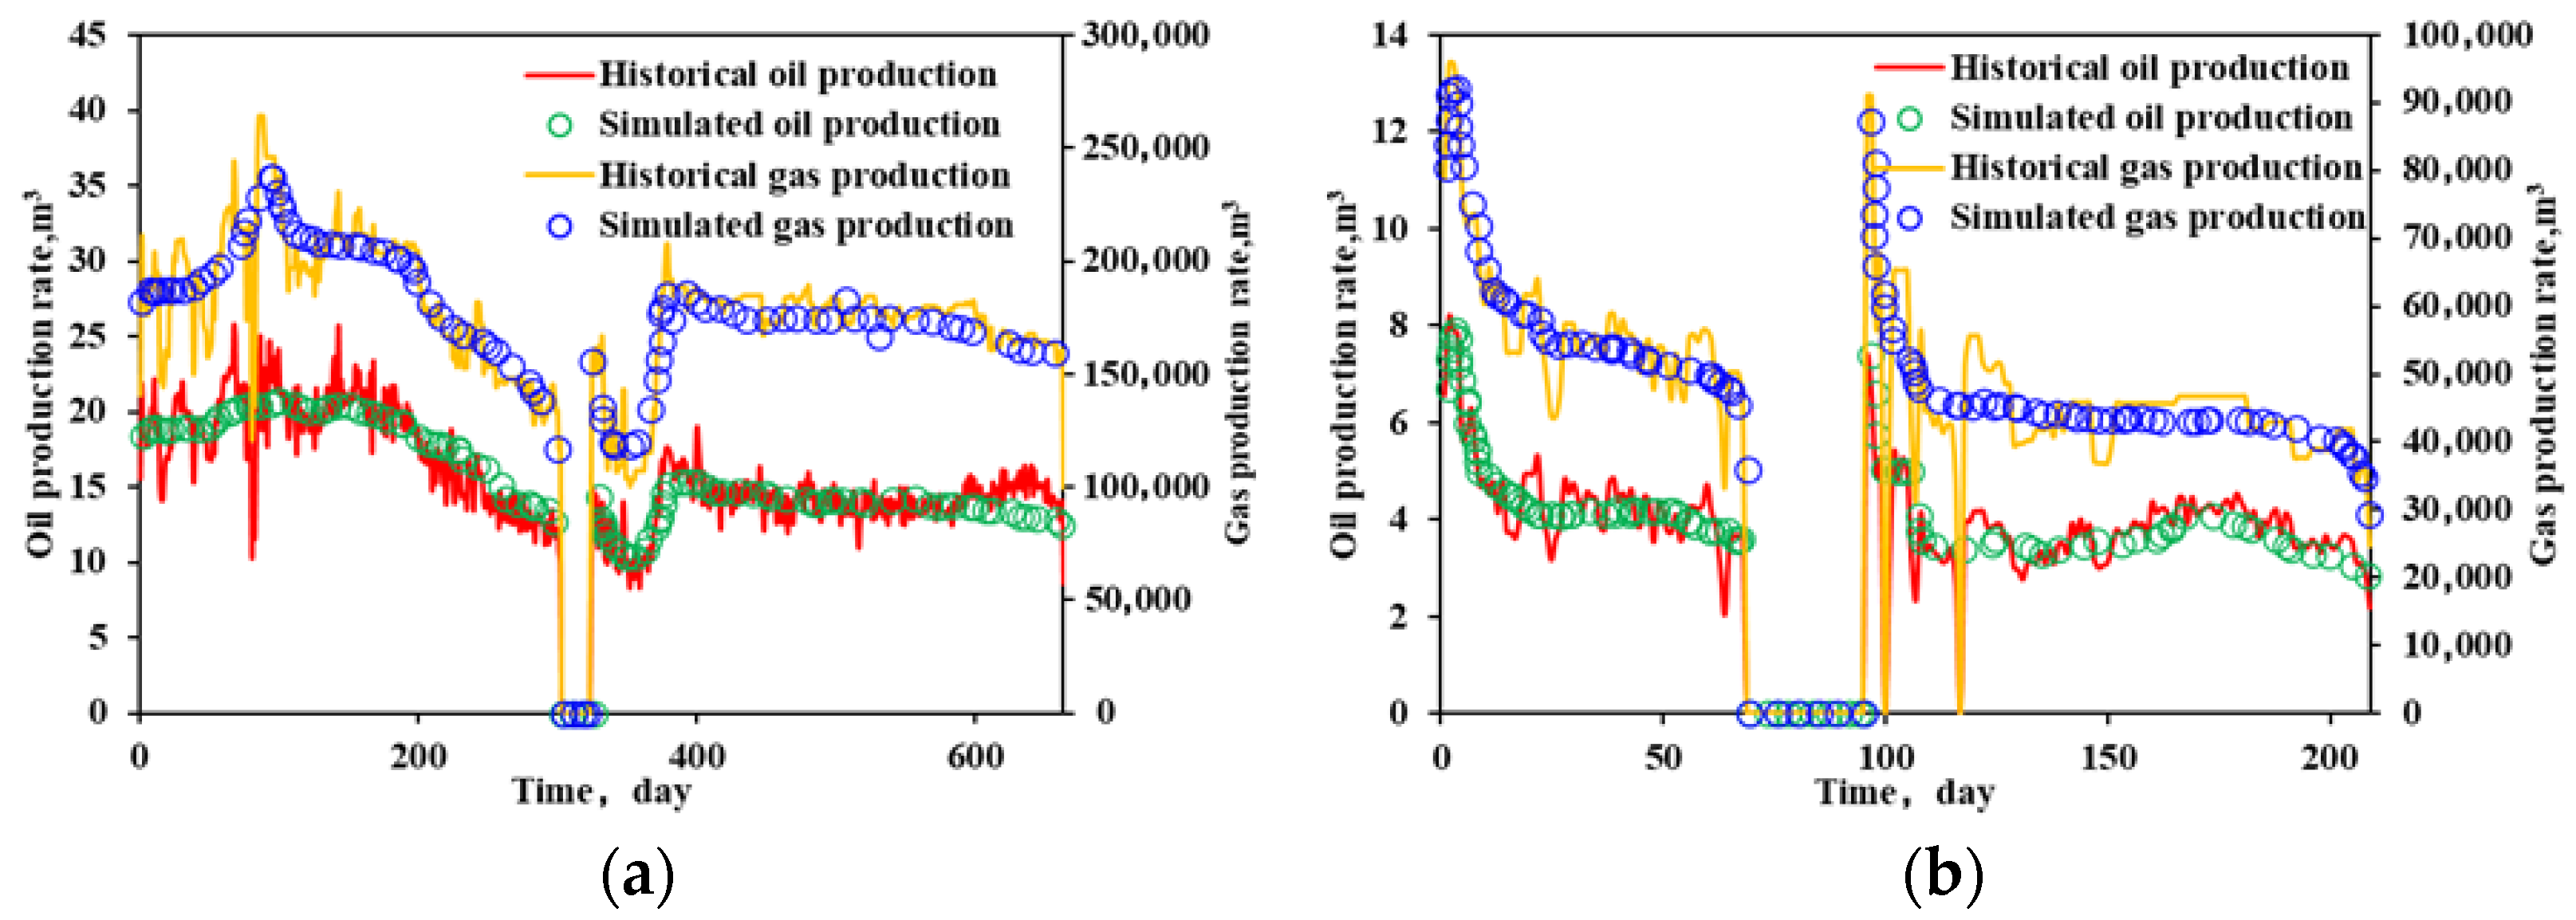
Table 4. Due to the fact that the dynamic fluctuations during construction (such as displacement changes, sand blockage events) and fluid loss differences were not fully considered in the fracturing simulation, there may be slight deviations between the simulated fracture parameters and the inversion fractures, but the error between the two is relatively small. This further confirms that the simulated fracture geometry can effectively approximate the actual fracturing results, indicating that the initial geomechanical parameters are relatively accurate. (2) Production History Matching: constant bottomhole pressure production was simulated using historical pressure data. By comparing the actual production data with the simulated results [
27], the final matching outcome (shown in
Figure 7) shows that the error between the historical daily gas production and the simulated daily gas production is 5.8–6.9%, and the error between the historical daily oil production and the simulated daily oil production is 4.0–4.7%. Both errors are within a reasonable range, indicating a reliable simulation performance.
4. Evolution of Geostress Field and Optimization of Fracturing Parameters
The in situ stress distribution prior to re-fracturing shows significant changes compared to the initial state, exhibiting induced stresses from multiple factors—primarily caused by the opening of primary fractures and injection/production activities. Considering fracture dilation, pressure depletion, and other factors, long-term production after fracturing in the development layer with fluid extraction generates both elastic-induced stresses and production-induced stresses. This leads to alterations in formation pore pressure and stress distribution. A finite element geomechanical model was employed to reconstruct the current in situ stress field distribution in the target area, establishing a 3D geomechanical model of the target reservoir. This provides the foundational model for numerical simulations of hydraulic fracture propagation.
4.1. The Establishment of the Evolution Model for the Geostress Field
The development process of gas reservoirs involves fluid–solid coupling (fluid flow interacts with rock deformation) interactions between seepage fields and stress fields. The injection of fracturing fluid creates underground seepage effects, altering the stress distribution within the rock matrix and modifying the physical properties of formation rocks. This leads to stress redistribution in the geostress field, ultimately influencing the final geometry of hydraulic fractures in re-fractured wells [
28]. Given the significant variation in fracturing times among wells in the Dixi-14 block and the continuous evolution of the geostress field during reservoir development, using initial geostress and fracture data for subsequent fracturing simulations would introduce substantial errors [
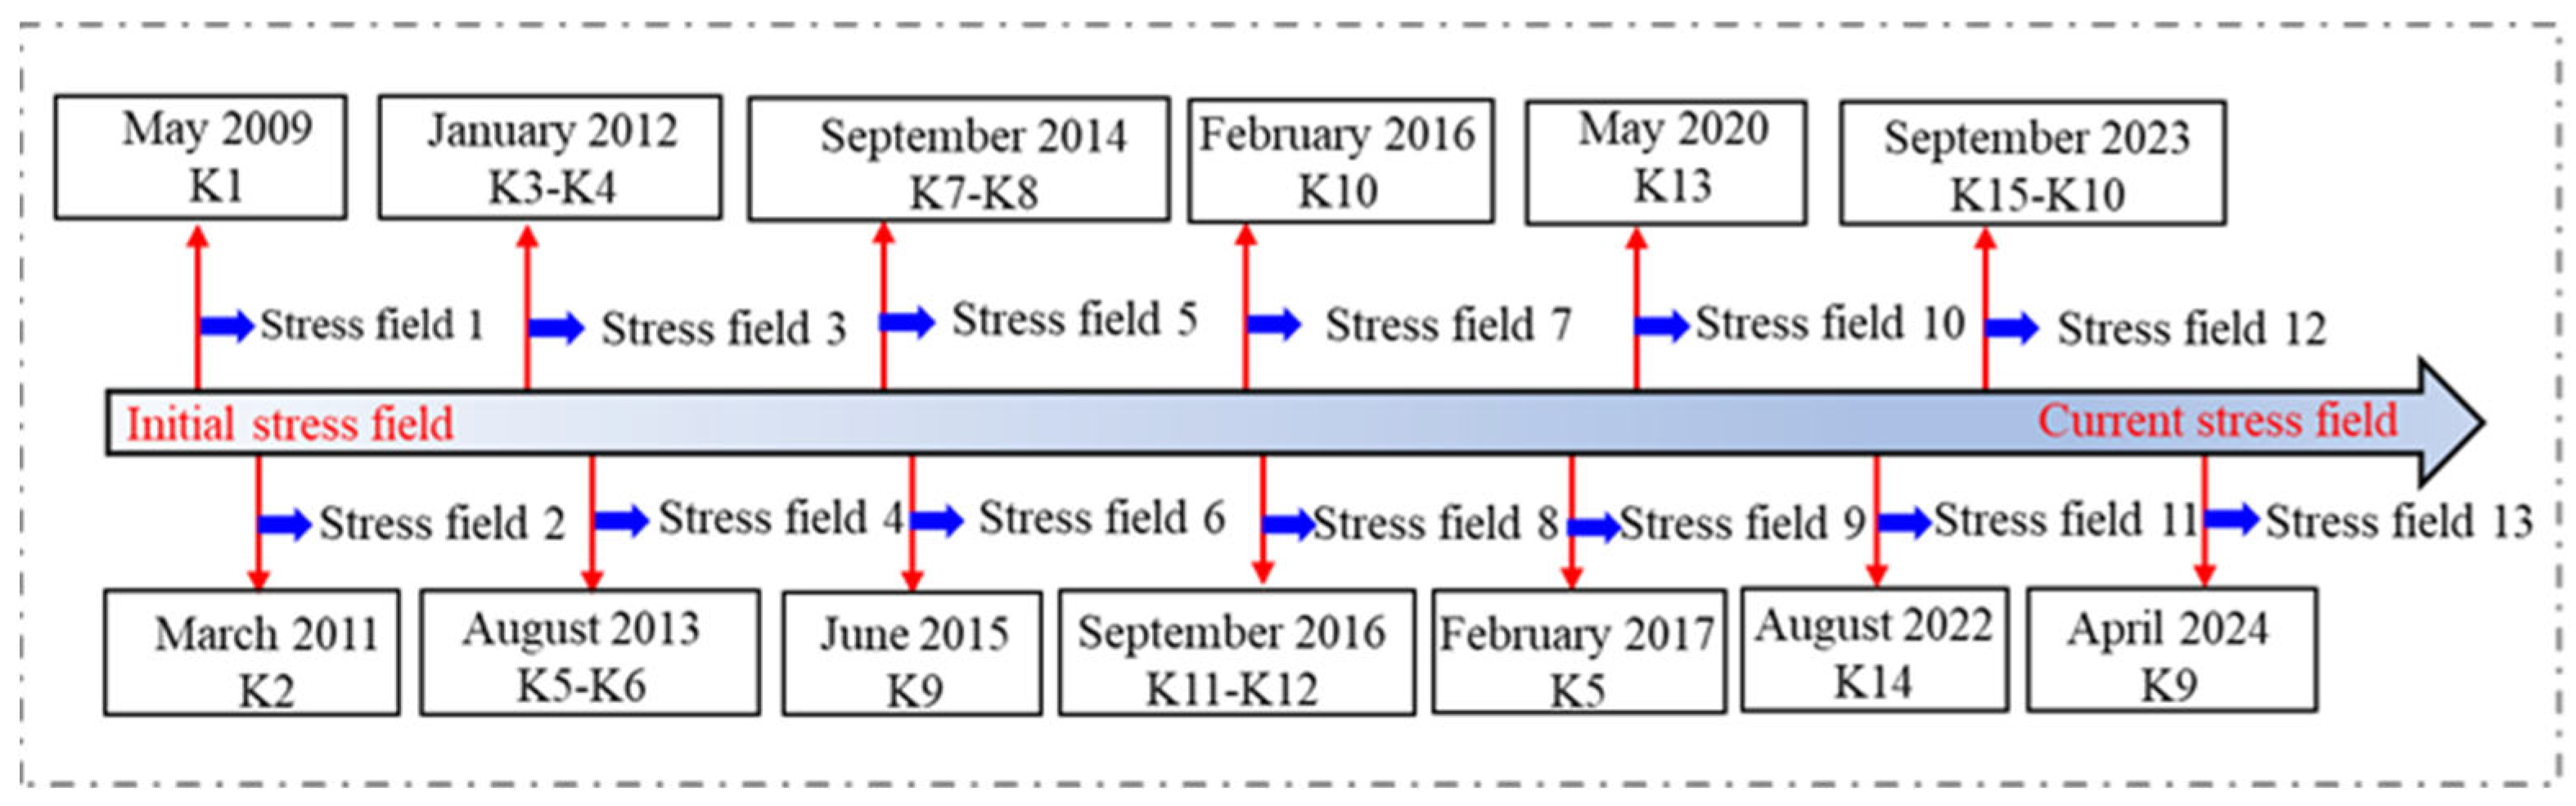
29]. To accurately characterize the impact of fracturing on geostress field variations, this study adopts a dynamic stress field approach and an integrated geological–engineering workflow. The 3D geomechanical model is updated in real time based on the actual fracturing sequence, incorporating post-fracturing geostress fields and fracture states for each well. This enables a more realistic simulation of subsequent fracturing operations. The fracturing time of each well serves as an evolutionary node for geostress field updates, with wells fractured at similar times grouped under the same node. After compiling the fracturing timeline for all wells in the Dixi-14 block, the resulting stress field evolution sequence was determined and is illustrated in
Figure 8.
4.2. Evolution Analysis of Geostress Field
Figure 9 illustrates the specific simulation workflow for Evolutionary Node Stress Field 1. Well K1, being the first fractured well in the Dixi-14 block, was assumed to have the initial geostress field prior to fracturing due to the short development history of the block at that time. After simulating the fracturing process of Well K1 according to its actual treatment parameters, the post-fracturing stress distribution was obtained. The results demonstrate that fluid injection increased net pressure within fractures, inducing a compressive deformation of the rock matrix through fracture face stresses and altering the stress state of surrounding formations [
30,
31], with a notable increase in minimum horizontal principal stress. Subsequently, production simulation was conducted for all wells in the block using actual production data, with the simulation period ending at the fracturing time of the next well (K2). Reservoir depletion caused by fluid production led to geostress reduction corresponding to decreasing pore pressure, ultimately establishing Stress Field 1—the first evolutionary node of geostress redistribution in the Dixi-14 block. This Stress Field 1 then served as the baseline geostress condition for Well K2′s fracturing simulation. By applying the same workflow, the post-fracturing stress distribution of Well K2 could be accurately derived.
Considering factors such as fracture opening and pressure depletion, the geostress field at each fracturing stage was simulated according to the evolutionary sequence of the Dixi-14 block. The current in situ stress distribution of the block is shown in
Figure 10 and
Table 5. The current geostress fields of the Dixi 14 block are as follows: the minimum horizontal principal stress range is 48–76 MPa, the maximum horizontal principal stress is 78–102 MPa, the vertical pressure is 79–94 MPa, and the formation pressure is 20–35 MPa.
5. Optimization of Fracturing Construction Parameters
Well K6 is a development well deployed in the Dixi 14 composite lithologic body of the Dixi 14 block in the Kelameili Gas Field. The primary hydraulic fracturing was conducted in August 2013, resulting in an initial daily gas production rate of 6 × 10⁴ m3/d. After approximately two years of production, the gas rate gradually declined to 3 × 10⁴ m3/d. Subsequently, the well was operated intermittently, and by September 2024, the daily gas production had declined to 2.5 × 10⁴ m3/d, indicating an urgent need for re-fracturing and the optimization of treatment parameters. Based on the current geomechanical model of the Dixi 14 block, derived from the evolution of the in situ stress field, a parametric study was conducted to evaluate the effects of the injection rate, fluid volume, prepad ratio, and proppant intensity on fracture geometry.
5.1. The Influence of the Injection Rate on Fracture Parameters
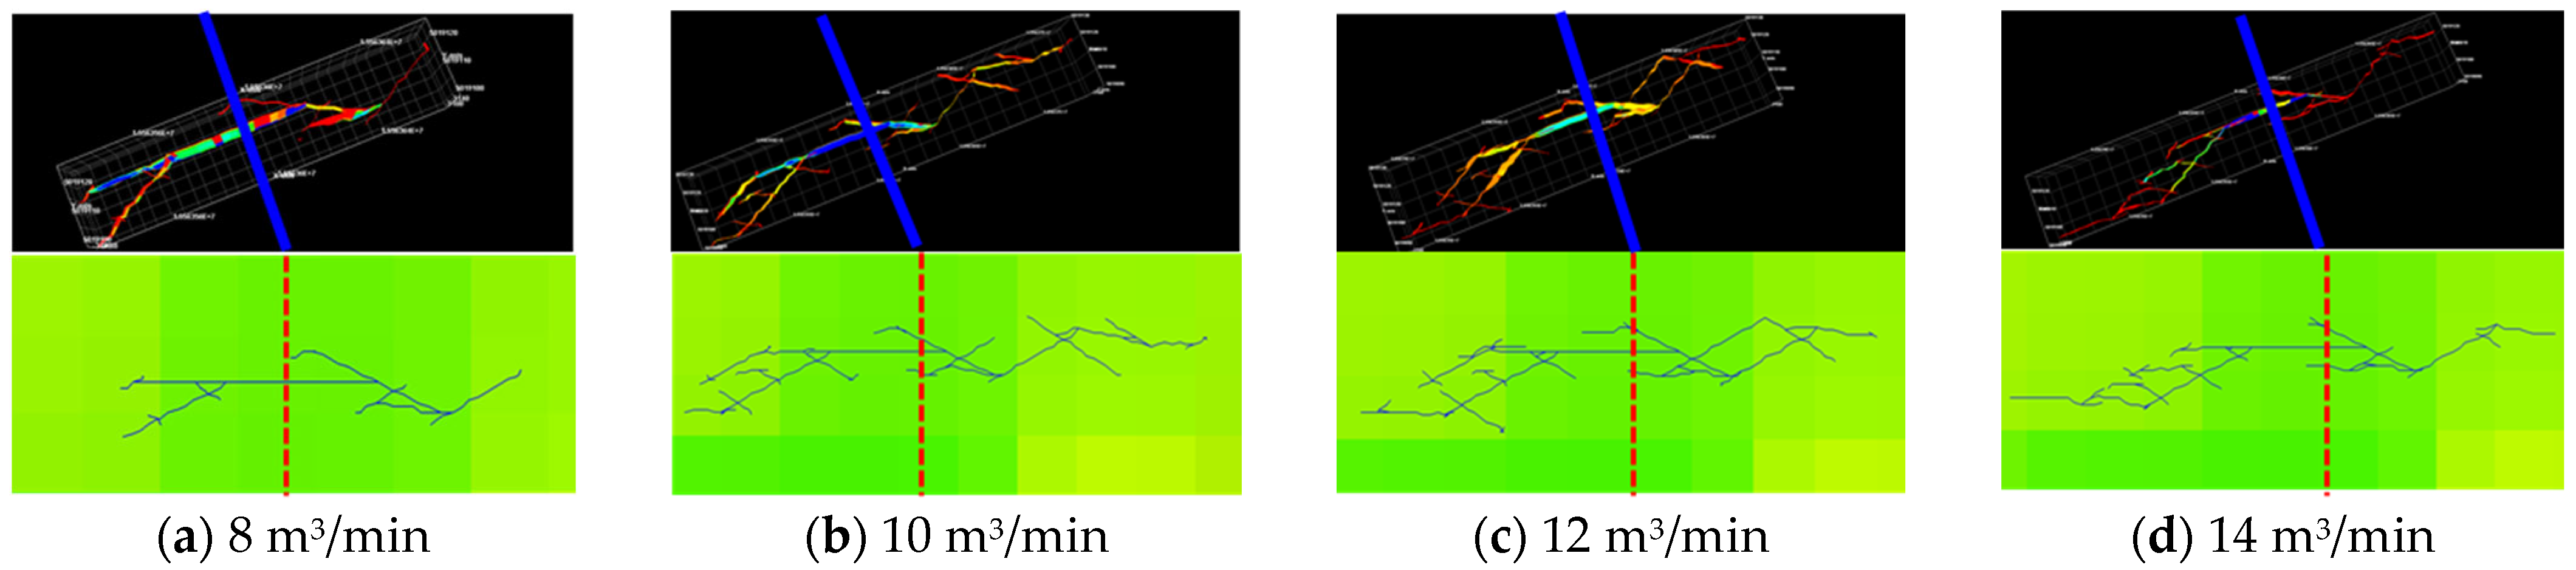
The effectiveness of hydraulic fracturing is closely related to the injection rate. A high injection rate facilitates fracture initiation and promotes the forward propagation of fracture tips, yet excessively high rates impose greater demands on equipment and tubular performance. Conversely, insufficient rates reduce proppant transport capacity. Therefore, determining an optimal injection rate is critical. Simulations were conducted with injection rates of 8, 10, 12, and 14 m
3/min, using a pad fluid ratio of 50%, total fluid volume of 725 m
3, and proppant volume of 65 m
3. The resulting hydraulic fracture geometries are shown in
Figure 11.
As shown in
Figure 11, with increasing injection rates, fracture complexity and stimulation volume first increase and then decrease. This is primarily because at excessively high rates, fractures predominantly propagate along the main fracture direction.
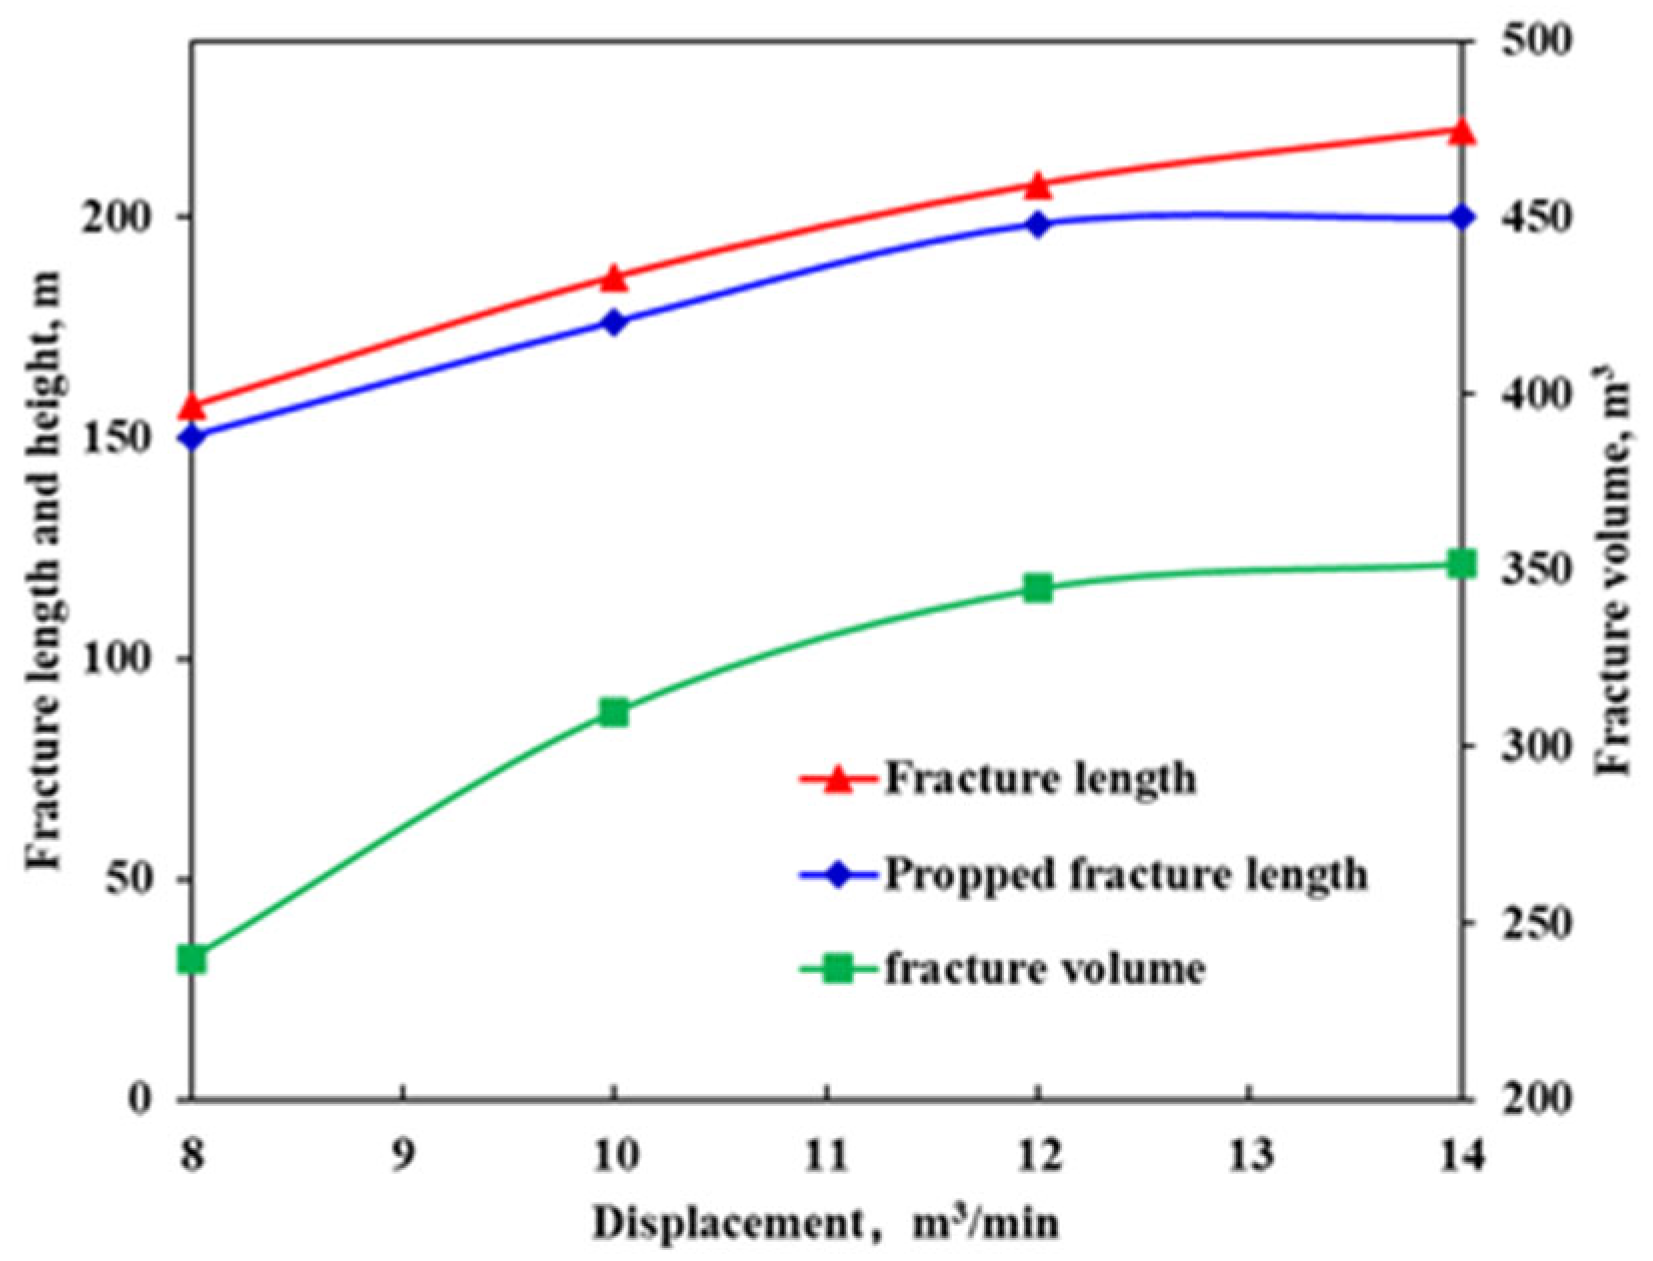
Figure 12 presents fracture parameter charts under different injection rates. The analysis reveals that fracture length increases linearly with higher injection rates and propped fracture length shows progressively poorer matching with dynamic fracture length. While lower rates achieve the best match between propped and dynamic lengths, the resulting fracture length fails to meet stimulation requirements. Therefore, optimal fracturing performance is achieved when selecting injection rates between 10 and 12 m
3/min.
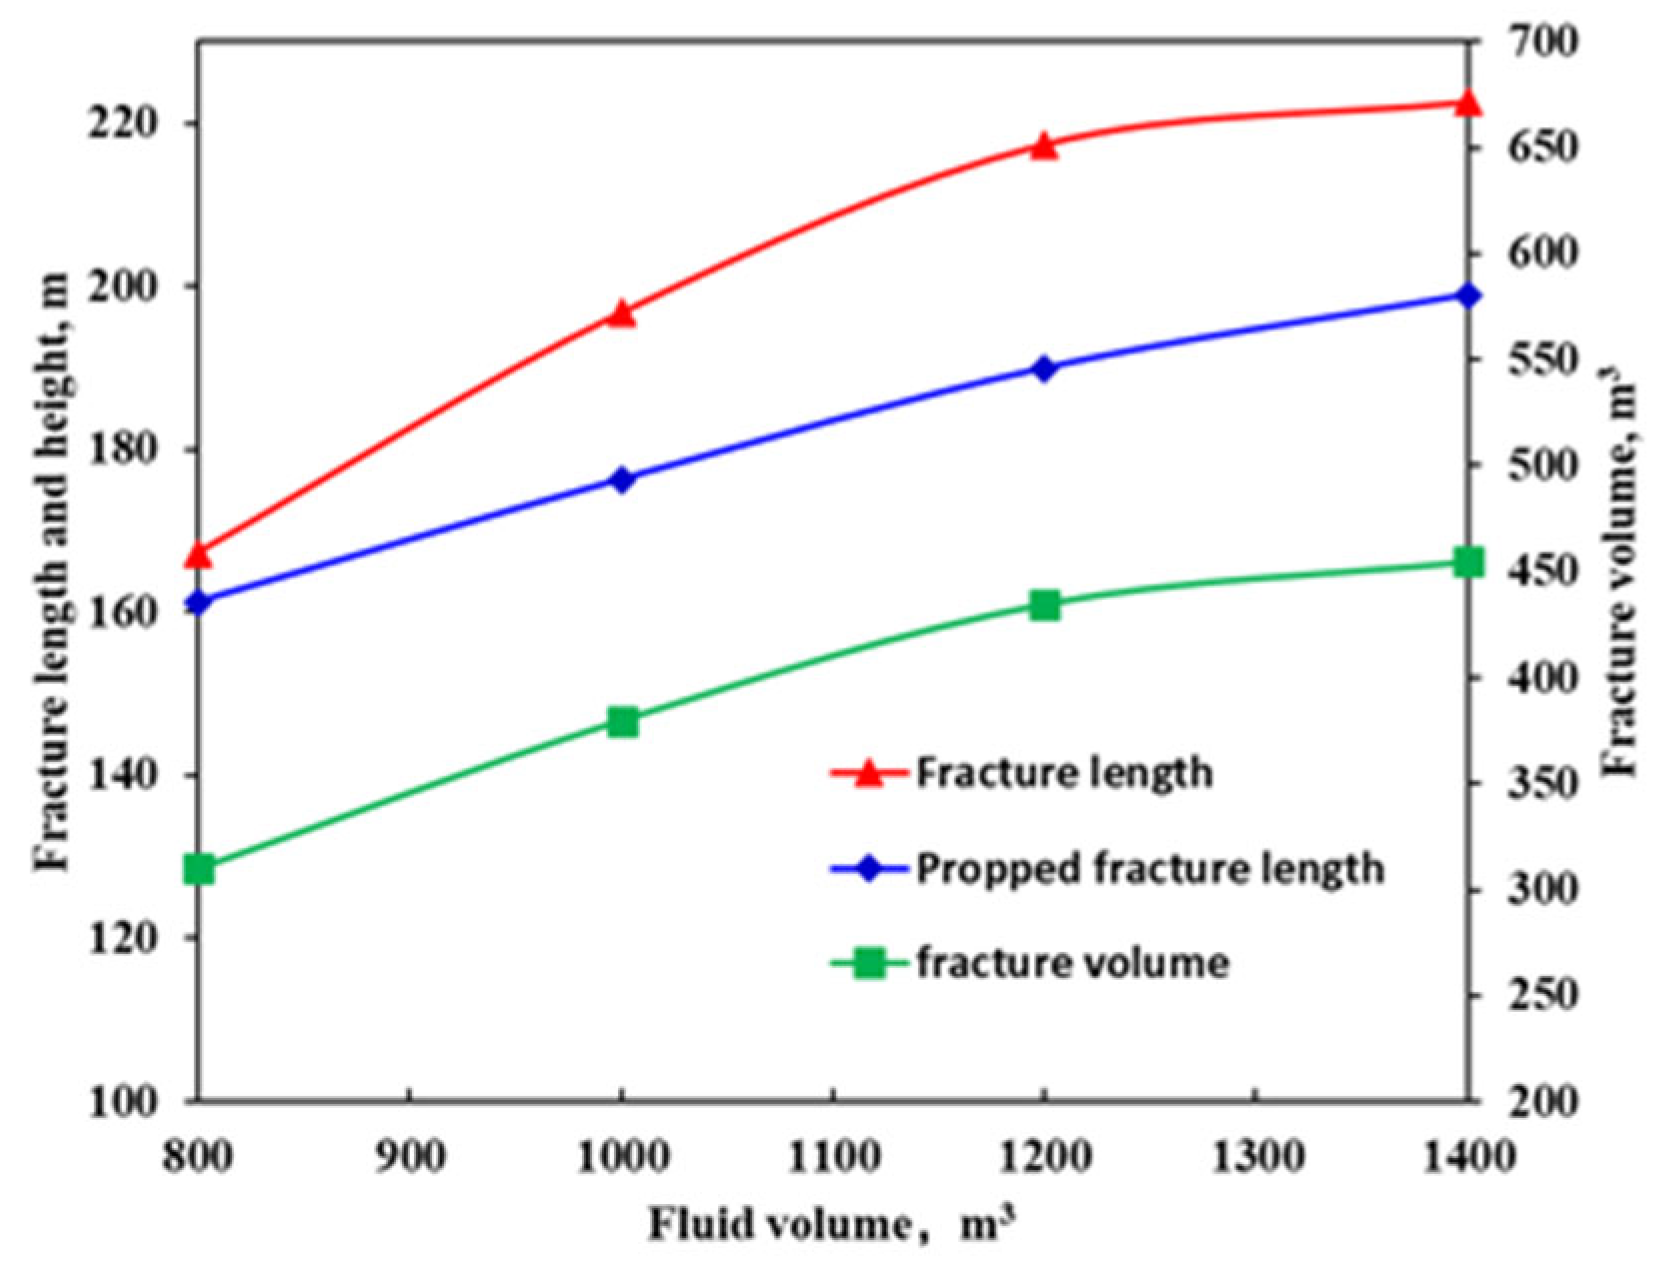
5.2. The Influence of Injection Liquid Volume on Fracture Parameters
Optimizing injection fluid volume intensity can enhance fracture complexity and boost well productivity, though some wells exhibit rapid fluid breakthrough with significant wastage [
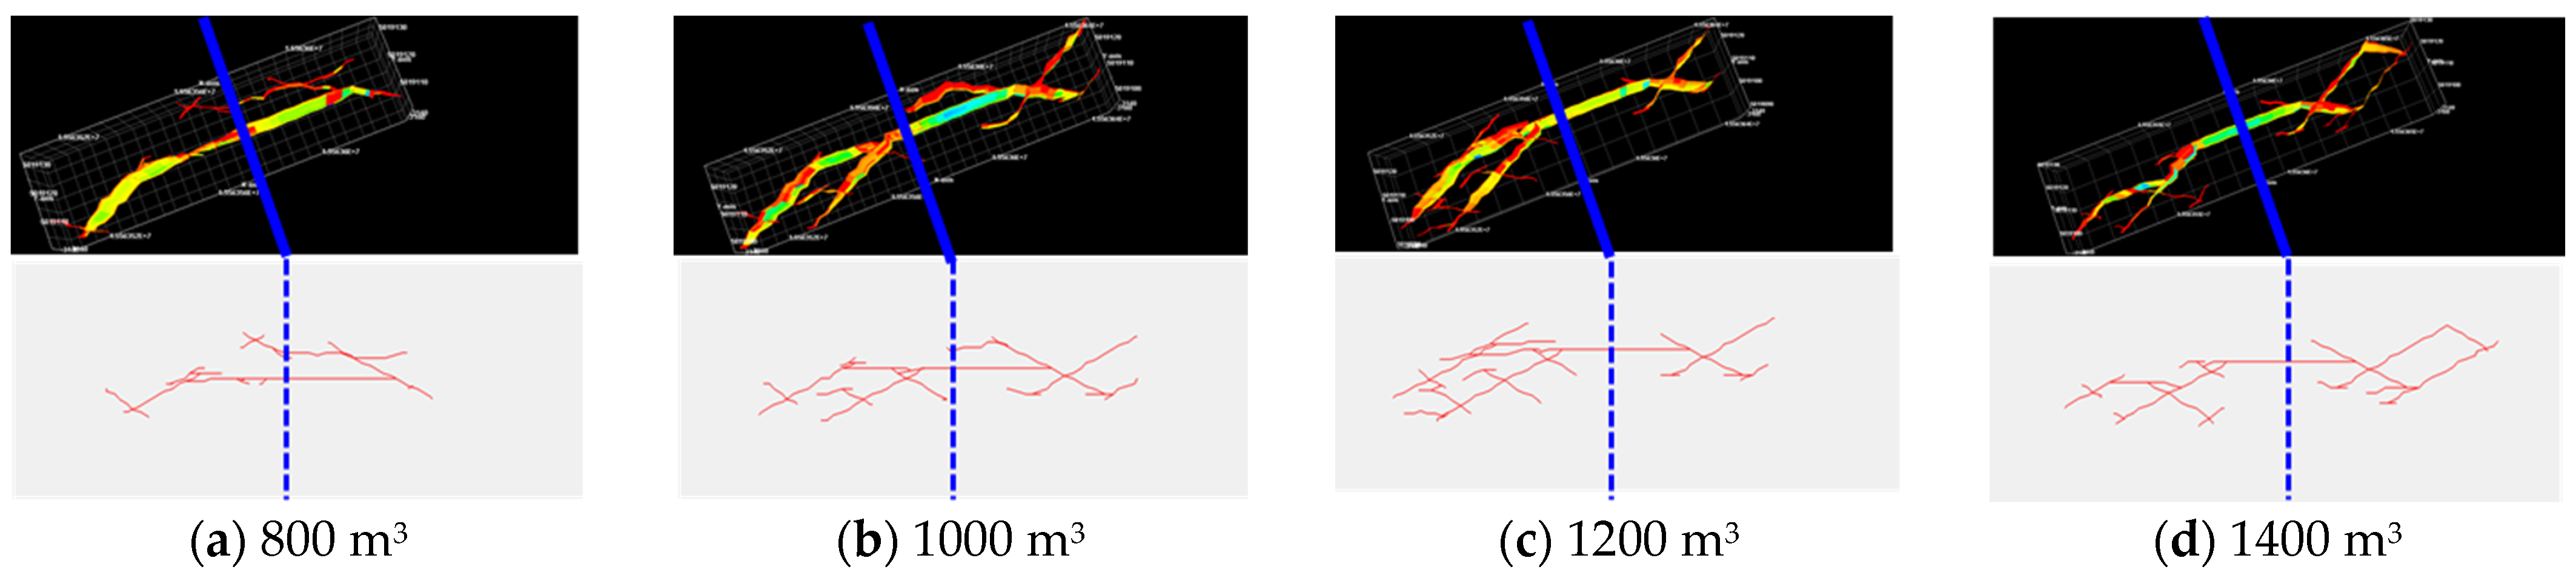
32]. Simulations were performed with fluid volumes of 800, 1000, 1200, and 1400 m
3 (the pad fluid ratio: 50%, injection rate: 12 m
3/min, and proppant volume: 65 m
3). The resulting hydraulic fracture geometries are illustrated in
Figure 13.
As shown in
Figure 13, fracture complexity initially increases and then decreases with higher fluid volumes. The primary reason is that excessive injection may lead to exacerbated fracturing fluid leak-off (into natural fractures or the matrix), reducing the effective energy available for fracture propagation. As a result, branch fractures cannot fully develop. The complexity of the fractures is highest at a liquid volume of 1200 m
3.
Figure 14 presents fracture parameters under different fluid volumes. It can be observed that dynamic fracture length gradually increases with fluid volume before stabilizing. In addition, the matching degree between propped and dynamic fracture lengths deteriorates progressively, and the stimulated reservoir volume (SRV) first grows linearly and then slows with increasing fluid volume. Therefore, considering both fracturing costs and stimulation requirements, a fluid volume of 1200 m
3 is optimal.
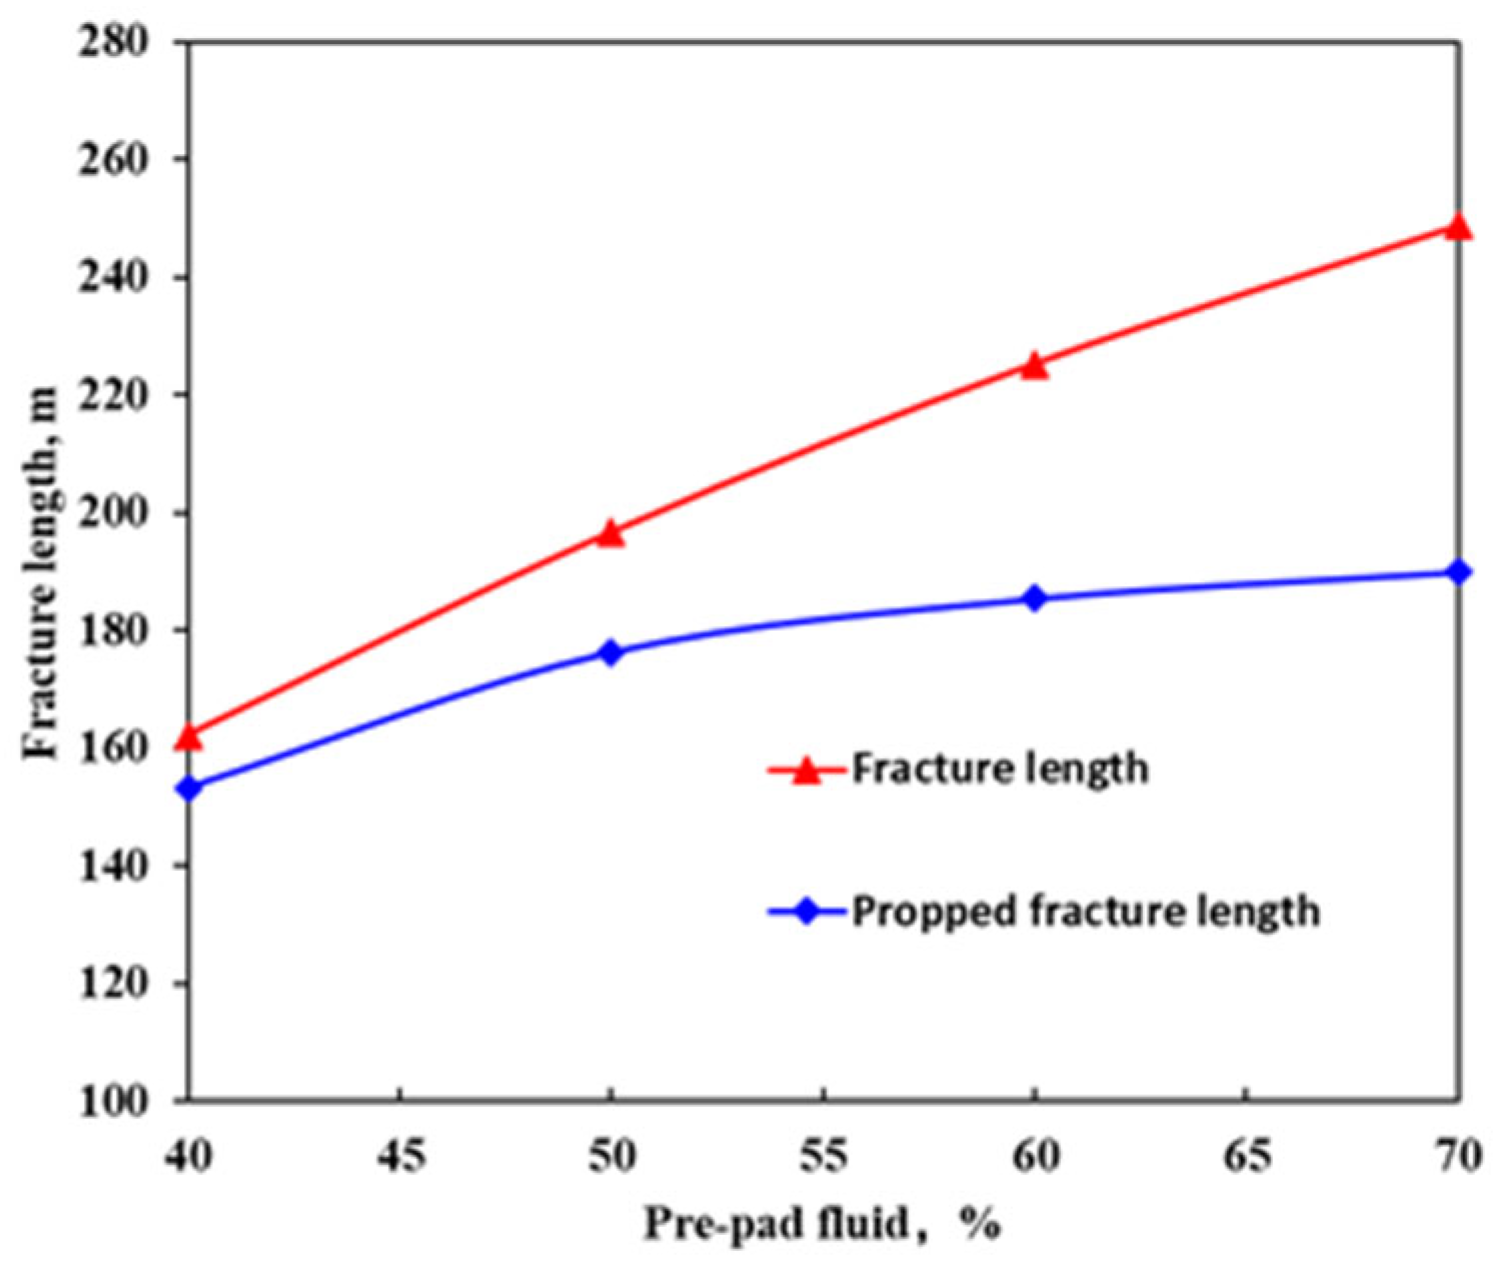
5.3. The Influence of the Proportion of the Preflush Fluid on the Fracture Parameters
To minimize formation damage while ensuring effective fracture creation and proppant transport, pad fluid usage should be optimized. Simulations were conducted with pad fluid ratios of 40%, 50%, 60%, and 70% (the total fluid volume: 1200 m
3, injection rate: 12 m
3/min, and proppant volume: 65 m
3). The resulting hydraulic fracture geometries are presented in
Figure 15.
As shown in
Figure 15, the fracture complexity increases progressively with higher prepad fluid ratios.
Figure 16 presents fracture parameter charts under different pad fluid ratios, revealing that while greater pad fluid ratios yield longer fractures, the correlation between dynamic fracture length and propped fracture length deteriorates when the ratio exceeds a certain threshold, resulting in suboptimal stimulation performance. Therefore, a pad fluid ratio between 50% and 60% achieves optimal alignment between propped and dynamic fracture lengths, ensuring effective reservoir stimulation.
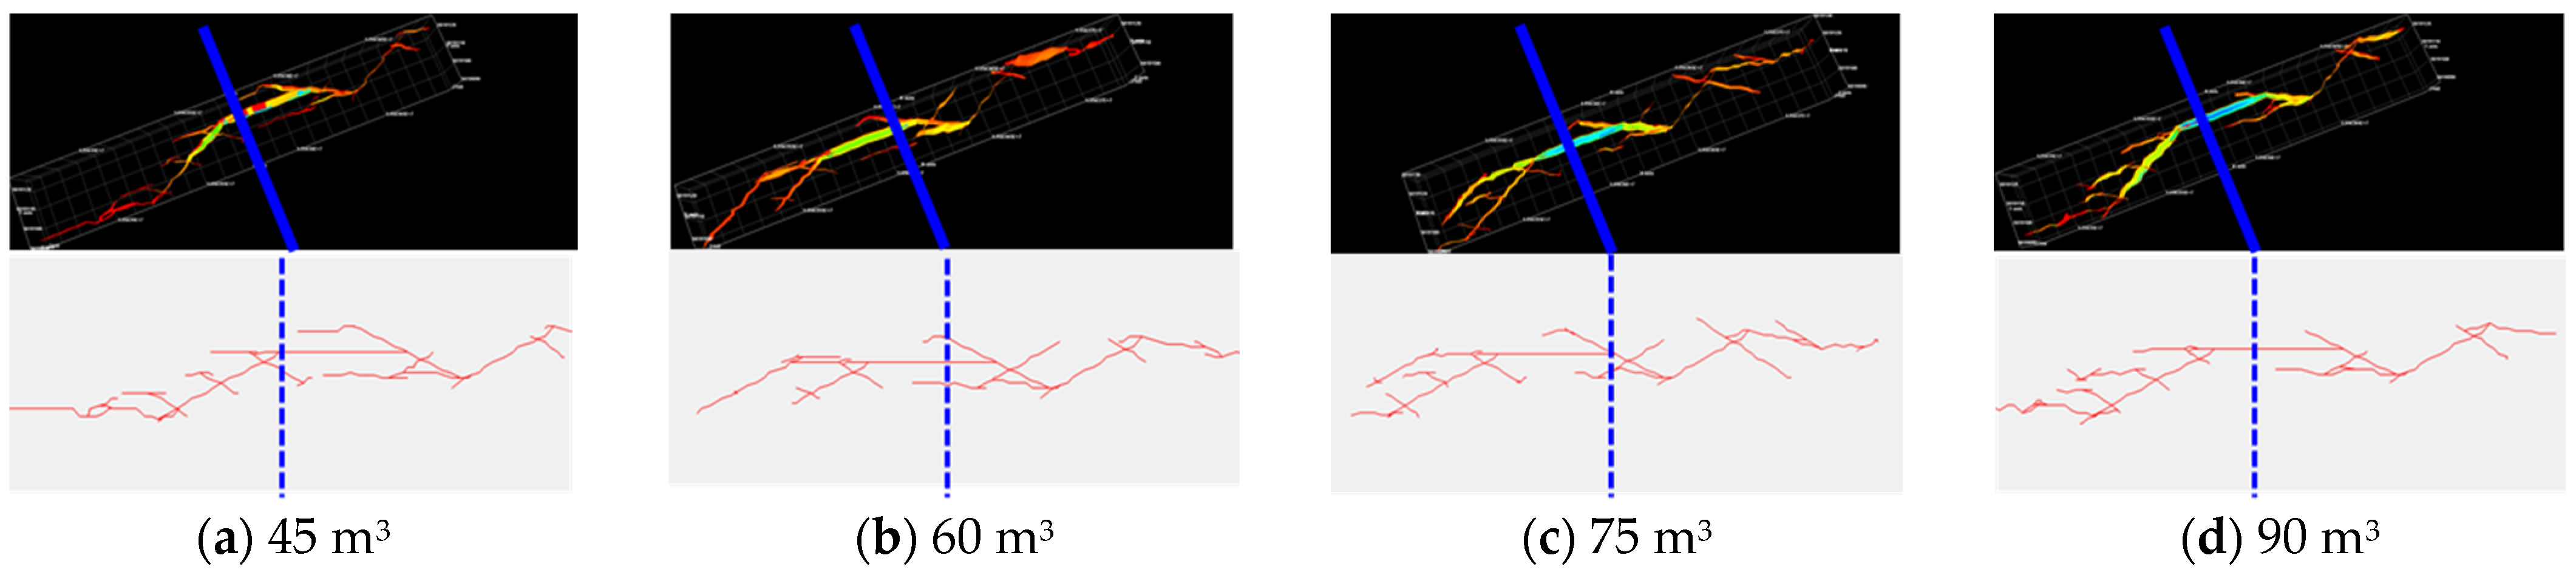
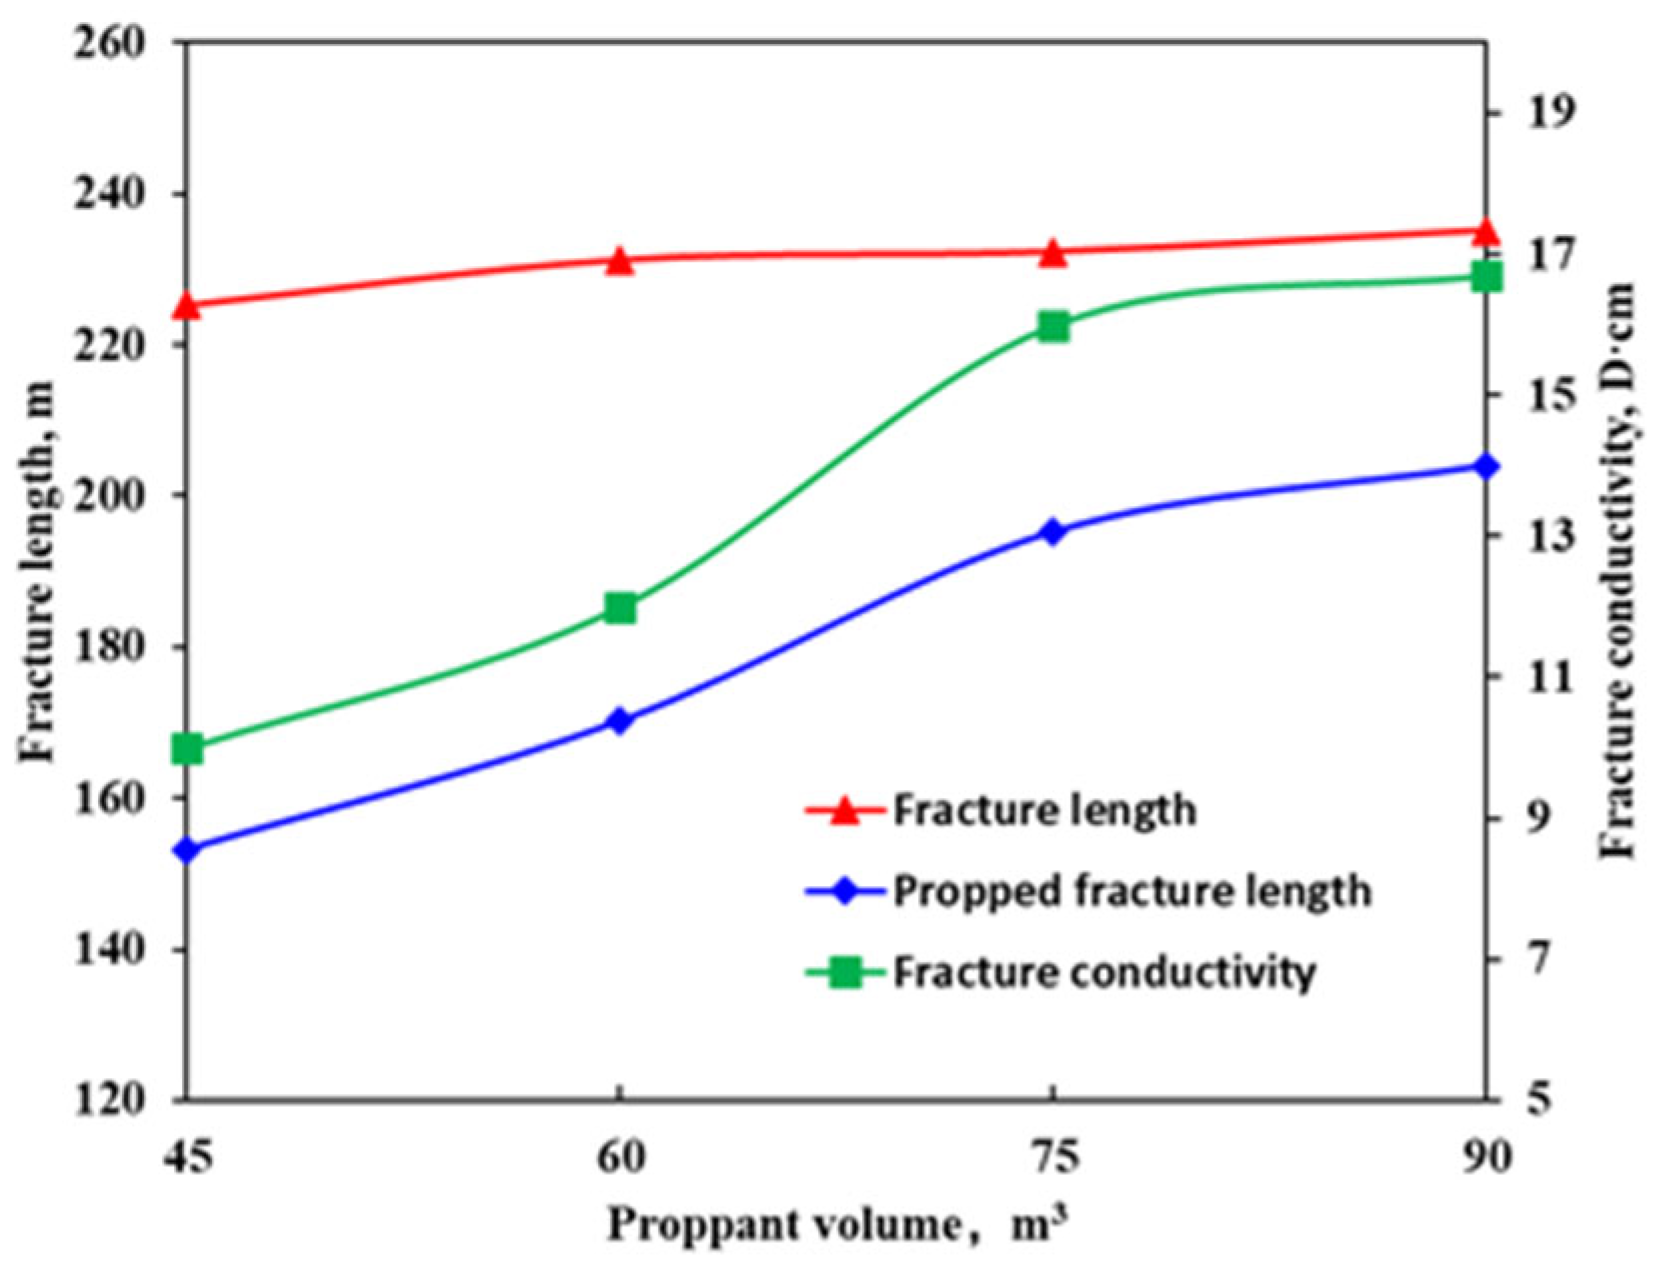
5.4. The Influence of Sand Content on Fracture Parameters
Optimizing fracturing operations requires balancing three key factors: improving proppant transport capacity, maximizing the effective stimulated volume, and controlling costs—a major technical challenge in process enhancement [
33,
34]. Simulations were conducted with proppant volumes of 45 m
3, 60 m
3, 75 m
3, and 90 m
3 (the fluid volume: 1200 m
3, injection rate: 12 m
3/min, and prepad fluid ratio: 55%). The resulting hydraulic fracture geometries are presented in
Figure 17.
As illustrated in
Figure 17, fracture complexity exhibits minimal correlation with proppant volume.
Figure 18 presents the evolution of fracture parameters (e.g., fracture length and conductivity) under different proppant volumes. It can be observed that proppant volume has limited influence on dynamic fracture length, while propped fracture length initially increases linearly with higher proppant volumes but shows diminishing growth beyond a critical volume. Fracture conductivity improves consistently with increasing proppant volume; however, considering operational costs, a proppant volume of 75 m
3 proves sufficient to meet conductivity requirements while maintaining economic efficiency.
5.5. An Effect Evaluation of the Re-Fracturing Treatment
Based on the optimized re-fracturing design, Well K6 was re-stimulated using a KQ78/65-105 wellhead and 139.7 mm open hole completion. The operation achieved strong alignment with design parameters involving a total fluid volume of 1725 m
3, with a prepad ratio of 60%, an average sand ratio of 15.3%, and a main injection rate of 12 m
3/min. Overall, the treatment parameters were in good agreement with the optimized design, and the operation proceeded smoothly. The re-fracturing treatment was conducted in two stages. The fracturing treatment curve is shown in
Figure 19. The operation was conducted in two stages. At the first stage, initial pad fluid injection showed no pressure buildup, indicating fluid loss into the formation. The main proppant stage proceeded smoothly with stable pressure (24–26 MPa) and a peak concentration of 280 kg/m
3. Operations paused after injecting 300 kg of diverting agent due to insufficient fluid volume. The shut-in pressure was 8.8 MPa. At the second stage, an additional 500 kg of diverting agent was injected during the main proppant stage, resulting in a 1–1.5 MPa pressure increase. The operation resumed after fluid replenishment, with extra diverting agent added pre-stimulation.
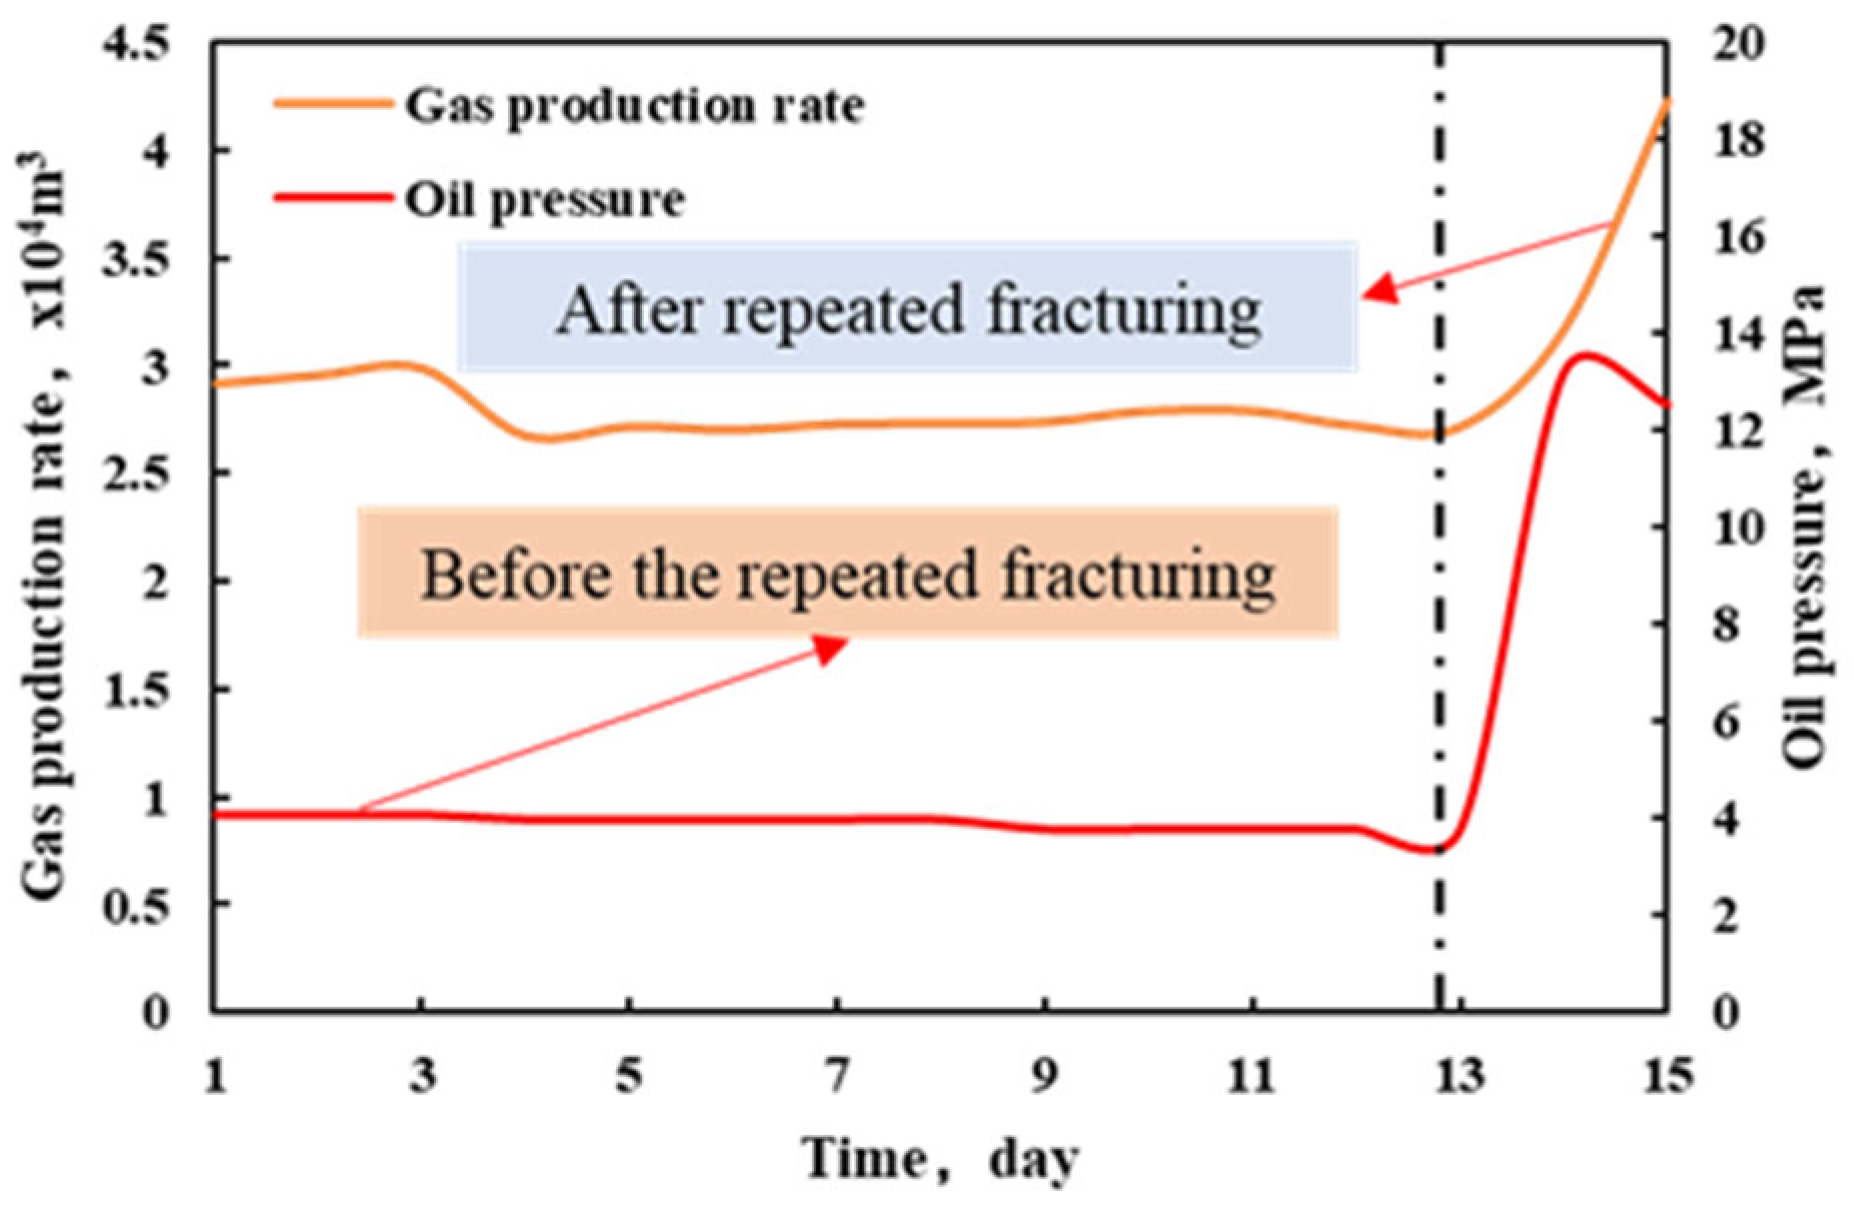
The production performance of Well K6 before and after re-fracturing is shown in
Figure 20. By September 2024, the intermittent production rate had declined to 2.7 × 10
4 m
3/d with a wellhead pressure of 4 MPa. After re-fracturing, the daily gas production increased to 4.2 × 10
4 m
3/d, representing a 56% increase in single-well productivity. The wellhead pressure also rose to 12 MPa, indicating that the re-fracturing treatment achieved a favorable reservoir stimulation effect.
6. Conclusions
In this study, the mechanical properties of the rock in Block 14 of Dixi were characterized through indoor mechanical tests and in situ stress tests. A dynamic and static parameter conversion model was constructed using logging data and a continuous static mechanical profile was generated. On this basis, a dynamically updated geomechanical model was established and verified, and the influence of fracturing and production on in situ stress was quantified. Finally, based on the model, the construction parameters of repeated fracturing in Well K6 were optimized and on-site production was guided.
(1) Laboratory triaxial compression tests, Brazilian tensile strength tests, and in situ stress measurements of volcanic rock were conducted to characterize the mechanical properties of the Dixi 14 block. The results indicate that the tensile strength ranges from 0.93 to 10.53 MPa, the average Young modulus is 16.97 GPa, and the average Poisson ratio is 0.22. The maximum horizontal principal stress ranges from 85.57 to 8.96 MPa, the minimum horizontal principal stress from 51.89 to 4.37 MPa, and the vertical stress from 89.50 to 4.06 MPa. The horizontal stress difference ranges from 26.41 to 4.95 MPa.
(2) Dynamic rock mechanical parameters were calculated based on well logging data. Regression analysis was used to establish transformation models between dynamic and static mechanical parameters. The models exhibit high correlation coefficients. Using the transformation models, logging-derived mechanical property profiles were corrected to triaxial static profiles, enabling the construction of continuous static mechanical property profiles at key wells in the Dixi 14 block.
(3) Based on the continuous rock mechanical property profiles at key well locations, a geomechanical model of the Dixi 14 block was established using an integrated geological and engineering software platform. The model was validated through simulations of both hydraulic fracturing and production processes, demonstrating good accuracy. On the basis of the initial geomechanical model, a dynamic stress field concept was introduced to continuously update the stress distribution during fracturing simulations. This approach allows for a more accurate assessment of stress variations caused by fracturing and production activities. The results indicate that hydraulic fracturing increases the stress magnitude in the vicinity of the fractures, while reservoir depletion leads to a reduction in in situ stress. Under the combined effects of fracturing and production, the current stress state of the Dixi 14 block was determined: the minimum horizontal stress ranges from 48 to 76 MPa, the maximum horizontal stress from 78 to 102 MPa, the vertical stress from 79 to 94 MPa, and formation pressure from 20 to 35 MPa.
(4) Based on the current geomechanical model of the Dixi 14 block, a study was conducted on fracture propagation behavior during the re-fracturing of Well K6. The results show that as the injection rate, fluid volume, and prepad ratio increase, the matching between dynamic and propped fracture length tends to deteriorate. Fracture conductivity improves with increasing proppant volume, but this benefit diminishes beyond a certain threshold. The optimal combination of treatment parameters for Well K6 was determined to be an injection rate of 12 m3/min, fluid volume of 1200 m3, prepad ratio of 50–60%, and proppant volume of 75 m3. Field re-fracturing operations were conducted using these optimized parameters. Following re-fracturing, the daily gas production of Well K6 increased by 56%, indicating a significant stimulation effect and successful field application. Other repeated fracturing wells in this block also face the problems of an unreasonable design of construction parameters and a poor repeated fracturing effect. The reservoir physical properties of these wells are relatively close to those of Well K6. The success of Well K6 can provide a reference for the repeated fracturing design of these wells.
Author Contributions
Conceptualization, H.L. (Honglei Liu); methodology, J.H.; validation, W.S. and X.W.; formal analysis, H.L. (Haoqi Li); resources, X.M.; data curation, Y.W. All authors have read and agreed to the published version of the manuscript.
Funding
This research received no external funding.
Data Availability Statement
The original contributions presented in this study are included in the article. Further inquiries can be directed to the corresponding author.
Conflicts of Interest
Authors Honglei Liu, Jiangling Hong, Wei Shu, Xiaolei Wang and Haoqi Li are employed by the company The First Gas Company, Xinjiang Oilfield Company, PetroChina. The remaining authors declare that the research was conducted in the absence of any commercial or financial relationships that could be construed as a potential conflict of interest.
References
- Tang, P.F.; Wang, Y.Q.; Guo, R.; Qi, S.L.; Yang, C.C. Fracturing Productivity Prediction Technology for Intermediate-Basic Volcanic Gas Reservoirs in Songliao Basin. In Proceedings of the International Field Exploration and Development Conference, Xi’an, China, 12–14 September 2024; Springer: Singapore, 2025; pp. 817–837. [Google Scholar]
- Hou, Y.; Wu, C.; Chen, L.; Xie, B.; He, L.; Qin, J. New opinion of development potential of carboniferous volcanic gas reservoir: Taking the Kelameili gas filed as an example. Front. Energy Res. 2022, 10, 861901. [Google Scholar] [CrossRef]
- Li, K.; Ji, G.; Liu, W. A method for calculating current in-situ stress field before refracturing horizontal shale wells. Nat. Gas Explor. Dev. 2020, 43, 110–118. [Google Scholar]
- Deng, Y.; Zheng, B.; Li, Y.; Yue, H.; Li, B. Refracturing technology for horizontal wells in Niudong volcanic oil reservoir. Well Test 2024, 30, 32–36. [Google Scholar]
- Liu, S.; Zhang, Y.; Wu, Q.; Ayers, W.B.; Wang, Y.; Ott, W.K. Crucial Development Technologies for Volcanic Hydrocarbon Reservoirs: Lessons Learned from Asian Operations. Processes 2023, 11, 3052. [Google Scholar] [CrossRef]
- Liu, S.; Zhang, Z.; Huang, Z. Three-Dimensional hydraulic fracture simulation with hydromechanical coupled-element partition method. Int. J. Geomech. 2021, 21, 04021162. [Google Scholar] [CrossRef]
- Chen, X.; Luo, Z.; Zhao, L.; Xiong, X.; Chen, W.; Miao, W.; Chen, X. Hydraulic, acid, and proppant-carrying acid fracturing stimulation of volcanic reservoirs in Sichuan Basin, China: An experimental study. Pet. Sci. Technol. 2023, 41, 731–749. [Google Scholar] [CrossRef]
- Yu, J.; Li, N.; Hui, B.; Zhao, W.; Li, Y.; Kang, J.; Chen, Y. Experimental simulation of fracture propagation and extension in hydraulic fracturing: A state-of-the-art review. Fuel 2024, 363, 131021. [Google Scholar] [CrossRef]
- Guo, T.; Wang, Y.; Chen, M.; Qu, Z.; Tang, S.; Wen, D. Multi-stage and multi-well fracturing and induced stress evaluation: An experiment study. Geoenergy Sci. Eng. 2023, 230, 212271. [Google Scholar] [CrossRef]
- Siebrits, E.; Elbel, J.L.; Detournay, E.; Detournay-Piette, C.; Christianson, M.; Robinson, B.M.; Diyashev, I.R. Parameters affecting azimuth and length of a secondary fracture during a refracture treatment. In Proceedings of the SPE Annual Technical Conference and Exhibition, Paper SPE-48928, New Orleans, LA, USA, 27–30 September 1998. [Google Scholar]
- Zhao, J.; Wang, Q.; Hu, Y.; Zhao, C.; Zhao, J. Prediction of pore pressure–induced stress changes during hydraulic fracturing of heterogeneous reservoirs through coupled fluid flow/geomechanics. J. Eng. Mech. 2019, 145, 05019001. [Google Scholar] [CrossRef]
- Li, H.; Lin, C.Y.; Ren, L.H.; Dong, C.M.; Ma, C.F.; Li, S.T.; Liang, S.Y. An Integrated quantitative modeling approach for fault-related fractures in tight sandstone reservoirs. J. Pet. Sci. Eng. 2020, 194, 107552. [Google Scholar] [CrossRef]
- Chen, G.; Wright, C.; Olivas, V. Geomechanical Study for a Modern Drilling Testing Facility in Grimes County, Texas; American Rock Mechanics Association: Alexandria, VA, USA, 2018. [Google Scholar]
- Wang, Y.L. Coupled fluid flow to geomechanics in fractued reservoir: Governing equation, geomechanics parameters and numerical method. In Proceedings of the SPE Reservoir Characterisation and Simulation Conference and Exhibition, SPE-186041-MS, Abu Dhabi, United Arab Emirates, 8–10 May 2017. [Google Scholar]
- Tuzingila, R.M.; Kong, L.; Koy Kasongo, R. A review on experimental techniques and their applications in the effects of mineral content on geomechanical properties of reservoir shale rock. Rock Mech. Bull. 2024, 3, 100110. [Google Scholar] [CrossRef]
- Eyinla, D.S.; Oladunjoye, M.A.; Olayinka, A.I.; Bate, B.B. Rock physics and geomechanical application in the interpretation of rock property trends for overpressure detection. J. Pet. Explor. Prod. 2021, 11, 75–95. [Google Scholar] [CrossRef]
- Lian, P.Q.; Cheng, L.S.; Deng, B. Simulation of ground stress field and fracture anticipation with effect of pore pressure. Theor. Appl. Fract. Mech. 2011, 56, 34–41. [Google Scholar] [CrossRef]
- Wang, J.; Jiang, L.; Cang, T.; Zhou, X.; Wang, B. Simulation of a multi-stage stress field and regional prediction of structural fractures in the tucheng syncline. Geosciences 2025, 15, 132. [Google Scholar] [CrossRef]
- Yun, X.; Mitri, H.S.; Yang, X.; Wang, Y. Experimental investigation into biaxial compressive strength of granite. Int. J. Rock Mech. Min. Sci. 2010, 47, 334–341. [Google Scholar] [CrossRef]
- Bai, X.; Zhang, D.-M.; Wang, H.; Li, S.-J.; Rao, Z. A novel in situ stress measurement method based on acoustic emission Kaiser effect: A theoretical and experimental study. R. Soc. Open Sci. 2018, 5, 181263. [Google Scholar] [CrossRef] [PubMed]
- Lavrov, A. The Kaiser effect in rocks: Principles and stress estimation techniques. Int. J. Rock Mech. Min. Sci. 2003, 40, 151–171. [Google Scholar] [CrossRef]
- Garia, S.; Pal, A.K.; Ravi, K.; Nair, A.M. A comprehensive analysis on the relationships between elastic wave velocities and petrophysical properties of sedimentary rocks based on laboratory measurements. J. Pet. Explor. Prod. Technol. 2019, 9, 1869–1881. [Google Scholar] [CrossRef]
- Zingano, A.C.; Salvadoretti, P.; Rocha, R.U.; Costa, J. Estimating uniaxial compressive strength, density and porosity of rocks from the p-wave velocity measurements in-situ and in the laboratory. REM-Int. Eng. J. 2021, 74, 521–528. [Google Scholar] [CrossRef]
- Shi, W.R.; Wang, X.Z.; Shi, Y.H.; Feng, A.G.; Zou, Y.; Young, S. Application of dipole array acoustic logging in the evaluation of shale gas reservoirs. Energies 2019, 12, 3882. [Google Scholar] [CrossRef]
- Fan, T.G.; Zhang, G.Q. Laboratory investigation of hydraulic fracture networks in formations with continuous orthogonal fractures. Energy 2014, 74, 164–173. [Google Scholar] [CrossRef]
- Sarda, S.; Jeannin, L.; Basquet, R.; Bourbiaux, B. Hydraulic characterization of fractured reservoirs: Simulation on discrete fracture models. SPE Reserv. Eval. Eng. 2002, 5, 154–162. [Google Scholar] [CrossRef]
- Zheng, S.; Xu, W. Calibration of fluid models using multiphase well test data for improved history matching. J. Pet. Sci. Eng. 2010, 75, 168–177. [Google Scholar] [CrossRef]
- Zhao, K.; Huang, P.; He, Y.; Cui, L.; Liu, P.; Feng, Y.; Cao, S. Effect of geostress variation on hydraulic fracturing behavior and stress redistribution in coal seam roofs. Processes 2025, 13, 1732. [Google Scholar] [CrossRef]
- Tang, Z.; Wu, Z.; Jia, D.; Lv, J. The distribution law of ground stress field in yingcheng coal mine based on rhino surface modeling. Processes 2024, 12, 668. [Google Scholar] [CrossRef]
- Berchenko, I.; Detournay, E. Deviation of hydraulic fractures through poroelastic stress changes induced by fluid injection and pumping. Int. J. Rock Mech. Min. Sci. 1997, 34, 1009–1019. [Google Scholar] [CrossRef]
- Sun, C.; Zhang, Y.; Han, L.; Liu, M.; Hu, J. Impacts of fracturing fluid viscosity and injection rate variations on the fracture network propagation in deep coalbed reservoirs. AIP Adv. 2025, 15, 105–109. [Google Scholar] [CrossRef]
- Liu, H.; Huang, Y.; Cai, M.; Meng, S.; Tao, J. Practice and development suggestions of hydraulic fracturing technology in the Gulong shale oil reservoirs of Songliao Basin. Pet. Explor. Dev. 2023, 50, 603–612. [Google Scholar] [CrossRef]
- Wu, Q.; Xu, Y.; Wang, X.Q. Volume fracturing technology of unconventional reservoirs: Connotation, design optimization and implementation. Pet. Dev. 2012, 39, 352. [Google Scholar] [CrossRef]
- Zhou, F.; Su, H.; Liang, X.; Meng, L.; Yuan, L.; Li, X.; Liang, T. Integrated hydraulic fracturing techniques to enhance oil recovery from tight rocks. Pet. Explor. Dev. 2019, 46, 1065–1072. [Google Scholar] [CrossRef]
Figure 1.
Triaxial compression test curve.
Figure 1.
Triaxial compression test curve.
Figure 2.
Shows the sample after the splitting experiment in Brazil.
Figure 2.
Shows the sample after the splitting experiment in Brazil.
Figure 3.
Schematic diagram of standard core sampling.
Figure 3.
Schematic diagram of standard core sampling.
Figure 4.
(a) Young’s modulus correlation diagram; (b) Poisson’s ratio correlation diagram.
Figure 4.
(a) Young’s modulus correlation diagram; (b) Poisson’s ratio correlation diagram.
Figure 5.
The calculation results of static rock mechanical parameters.
Figure 5.
The calculation results of static rock mechanical parameters.
Figure 6.
Initial geomechanical model.
Figure 6.
Initial geomechanical model.
Figure 7.
(a) Fitting results of Well K1; (b) fitting results of Well K2.
Figure 7.
(a) Fitting results of Well K1; (b) fitting results of Well K2.
Figure 8.
The evolution sequence of the geostress field in the Dixi 14 block.
Figure 8.
The evolution sequence of the geostress field in the Dixi 14 block.
Figure 9.
Evolution process of Stress Field 1.
Figure 9.
Evolution process of Stress Field 1.
Figure 10.
The distribution of the current ground stress field in block Dixi 14.
Figure 10.
The distribution of the current ground stress field in block Dixi 14.
Figure 11.
Crack morphology diagrams under different displacements.
Figure 11.
Crack morphology diagrams under different displacements.
Figure 12.
Crack parameter plates at different displacements.
Figure 12.
Crack parameter plates at different displacements.
Figure 13.
Crack morphology diagrams under different liquid volumes.
Figure 13.
Crack morphology diagrams under different liquid volumes.
Figure 14.
The crack parameter plates under different liquid volumes.
Figure 14.
The crack parameter plates under different liquid volumes.
Figure 15.
Crack morphology diagrams under different proportions of pre-liquid.
Figure 15.
Crack morphology diagrams under different proportions of pre-liquid.
Figure 16.
The crack parameter plates under different proportions of pre-liquid.
Figure 16.
The crack parameter plates under different proportions of pre-liquid.
Figure 17.
Crack morphology diagrams under different sand amounts.
Figure 17.
Crack morphology diagrams under different sand amounts.
Figure 18.
Crack parameter plates under different sand contents.
Figure 18.
Crack parameter plates under different sand contents.
Figure 19.
The construction curve of repeated fracturing in Well K6.
Figure 19.
The construction curve of repeated fracturing in Well K6.
Figure 20.
Production curves of Well K6 before and after repeated fracturing.
Figure 20.
Production curves of Well K6 before and after repeated fracturing.
Table 1.
Triaxial compressive strength test scheme and results.
Table 1.
Triaxial compressive strength test scheme and results.
| Core Sample Number | Well Depth
(m) | Differential Stress
(MPa) | Young’s Modulus
(GPa) | Poisson’s Ratio |
|---|
| 1-45 | 3655.86 | 129.82 | 13.51 | 0.247 |
| 1-v | 3655.90 | 129.38 | 12.59 | 0.175 |
| 2-45 | 3696.76 | 209.42 | 26.09 | 0.26 |
| 2-v | 3696.81 | 215.88 | 24.75 | 0.209 |
| 3-45 | 3694.85 | 165.93 | 19.00 | 0.174 |
| 3-v | 3694.90 | 160.64 | 17.58 | 0.217 |
| 4-45 | 3653.81 | 105.16 | 10.67 | 0.172 |
| 4-v | 3653.86 | 186.08 | 19.10 | 0.218 |
| 5-45 | 3840.26 | 131.61 | 16.31 | 0.201 |
| 5-v | 3840.29 | 101.08 | 10.11 | 0.341 |
Table 2.
Test results of splitting tensile strength in Brazil.
Table 2.
Test results of splitting tensile strength in Brazil.
| Number of Samples | Depth
(m) | Diameter
(mm) | Thickness
(mm) | Load
(N) | Tensile Strength (MPa) |
|---|
| 1-1 | 3691.56 | 25.75 | 15.11 | 4882 | 7.99 |
| 1-2 | 25.63 | 14.84 | 6320 | 10.58 |
| 2-1 | 3694.85 | 25.57 | 14.52 | 1694 | 2.90 |
| 2-2 | 25.21 | 14.75 | 1862 | 3.19 |
| 3-1 | 3674.62 | 25.10 | 15.15 | 2066 | 3.46 |
| 3-2 | 25.39 | 15.10 | 2604 | 4.32 |
| 4-1 | 3653.19 | 25.26 | 14.85 | 1402 | 2.38 |
| 4-2 | 25.21 | 14.85 | 2670 | 4.54 |
| 5-1 | 3692.42 | 25.05 | 14.84 | 606 | 1.04 |
| 5-2 | 25.56 | 14.51 | 540 | 0.93 |
Table 3.
Results of in situ stress tests.
Table 3.
Results of in situ stress tests.
| Number | Depth
(m) | Max Horizontal Stress (MPa) | Min Horizontal Stress (MPa) | Vertical Stress (MPa) | Horizontal Stress Difference (MPa) |
|---|
| 1 | 3655.86 | 91.19 | 59.74 | 89.50 | 31.45 |
| 2 | 3696.76 | 98.96 | 64.01 | 90.43 | 34.95 |
| 3 | 3694.85 | 85.57 | 51.89 | 90.43 | 33.68 |
| 4 | 3653.81 | 91.06 | 62.64 | 87.10 | 28.43 |
| 5 | 3840.26 | 90.78 | 64.37 | 94.06 | 26.41 |
Table 4.
Comparison of hydraulic fracture inversion results and simulated construction crack sizes.
Table 4.
Comparison of hydraulic fracture inversion results and simulated construction crack sizes.
| Fracture Geometry | Fracture Inversion | Simulated Construction | Error Value (%) |
|---|
| Fracture length (m) | 218.6 | 234.8 | 6.9 |
| Fracture height (m) | 45.6 | 47.8 | 4.2 |
| Fracture width (mm) | 11.2 | 10.4 | 7.1 |
Table 5.
Comparison table of changes in geostress before and after.
Table 5.
Comparison table of changes in geostress before and after.
| Stage | Max Horizontal Stress (MPa) | Min Horizontal Stress (MPa) | Vertical Stress (MPa) | Pore Pressure (MPa) |
|---|
| Initial | 84–104 | 57–77 | 82–96 | 42–51 |
| Current | 78–102 | 48–76 | 79–94 | 20–35 |
| Disclaimer/Publisher’s Note: The statements, opinions and data contained in all publications are solely those of the individual author(s) and contributor(s) and not of MDPI and/or the editor(s). MDPI and/or the editor(s) disclaim responsibility for any injury to people or property resulting from any ideas, methods, instructions or products referred to in the content. |
© 2025 by the authors. Licensee MDPI, Basel, Switzerland. This article is an open access article distributed under the terms and conditions of the Creative Commons Attribution (CC BY) license (https://creativecommons.org/licenses/by/4.0/).


 ,
, 


