Article

Small-Signal Stability Analysis of Converter-Interfaced Systems in DC Voltage Timescale Based on Amplitude/Frequency Operating Points

State Key Laboratory of Advanced Electromagnetic Engineering and Technology, School of Electrical and Electronic Engineering, Huazhong University of Science and Technology, Wuhan 430074, China
*
Author to whom correspondence should be addressed.
Processes 2025, 13(8), 2583; https://doi.org/10.3390/pr13082583
Submission received: 18 July 2025 / Revised: 9 August 2025 / Accepted: 13 August 2025 / Published: 15 August 2025

Abstract

The oscillations induced by voltage source converters (VSCs) in DC voltage timescale dynamics pose significant challenges to the safe and stable operation of VSC-dominated power systems. However, previous studies have conducted simplified analyses without fully understanding the fundamental roles of different timescale control loops in converter-interfaced systems. In light of this, this study first identifies the key state variables and operating points that directly characterize the energy storage levels of devices and networks in AC systems. A model for the converter-interfaced system is then established in the specified DC voltage timescale. The key contribution of this work is the proposal of an analytical framework that decomposes system stability into self-stabilizing (Self-stable) and externally coupled stabilizing (En-stable) paths based on internal voltage amplitude and frequency, aiming to reveal the physical mechanisms behind internal voltage amplitude and frequency oscillations in DC voltage timescale dynamics. Based on this framework, the Self-stable path and En-stable path of the internal voltage amplitude/frequency of converter-interfaced systems are derived. This novel analytical method mathematically decouples the stability of a single variable into a direct self-influence path and an indirect path coupled through other system variables. Subsequently, the causes of internal voltage amplitude/frequency oscillations in the specified voltage timescale are explained using the Self-stability and En-stability analysis method. A key finding of this study is that the stability of the internal voltage amplitude and frequency exhibits a dual relationship: for amplitude stability, the Self-stable path is stabilizing, whereas the coupled path is destabilizing; for frequency stability, the roles are reversed. Finally, the results are verified through simulations.

1. Introduction

Currently, due to the fact that the growth rate of renewable energy capacity in power systems exceeds that of synchronous generator capacity [1], an increasing number of DC voltage timescale dynamic stability issues have emerged in power systems [2,3,4]. These challenges are not merely theoretical; a comprehensive survey by Cheng et al. has documented a wide array of real-world subsynchronous oscillation (SSO) events over the past decade, highlighting the practical urgency of this problem [5]. Whether it is doubly fed wind turbines, direct-drive wind turbines, or photovoltaic power generation, all include an interface connected to the grid via a VSC [6,7]. In the future, it will be possible to apply 100% renewable energy equipment in practical power systems [8,9]. Therefore, in new power systems, the issues of voltage amplitude stability and frequency stability will become more complex compared to synchronous generator-dominated power systems.
The timescale issue of DC voltage caused by DC bus capacitors has been extensively studied by numerous scholars. For example, in [10], the authors investigated the impact of reactive power control on the stability of VSC DC bus voltage control under weak grid conditions. In [11], the authors investigated the influence of AC bus voltage control on both damping components and restoring components under different operating conditions with low short-circuit ratios. In [12], the paper proposes a reduced-order small-signal model of DFIG, which analyzes the influence of control loops, such as DC voltage control, by neglecting the current control and flux dynamic response components. These models employ certain assumptions and simplifications to facilitate analytical tractability. While existing studies provide valuable insights through simplified models [13,14], two fundamental challenges often limit a deeper understanding of the instability mechanisms. First is the issue of the operating point: traditional small-signal models are typically linearized around a static dq operating point, which may fail to capture the crucial dynamic interactions with the AC system’s amplitude and frequency. Second is the issue of the analytical method: comprehensive MIMO state-space analysis can identify unstable modes but often obscures the physical interaction pathways, whereas single-input single-output (SISO) analysis, while better at revealing mechanisms, has been less applied to DC voltage dynamics. This paper aims to address these two challenges, starting from the DC voltage timescale problem to provide a more insightful stability analysis.
The amplitude–frequency dynamics of AC systems are often neglected in the electromechanical timescale. However, on faster timescales, to ensure the accuracy of the analysis, it is necessary to establish a more precise linearized model. The dq DC operating point is often used to establish a linearized model of AC networks. This method is employed to simplify the analysis of VSC-infinite grid systems. For instance, Askarov et al. [15] conducted a comprehensive analysis and identified as many as six distinct mechanisms of SSOs arising from various combinations of control strategies, phase-locked loop (PLL) bandwidth, and grid strength. This diversity of oscillation phenomena underscores the limitations of conventional analytical approaches. In [16], the authors established a small-signal impedance model of the grid-connected VSC in the dq-frame, incorporating the PLL and DC bus voltage loop. Based on this model, they analyzed the influence of the proportional gains in the PLL and DC voltage loop on system stability under weak grid conditions. In [17], the authors focused on investigating the modal resonance phenomenon between the PLL and DC voltage control (DVC) under weak grid conditions. By establishing a two-degree-of-freedom mass–spring–damper model, they revealed the modal interaction mechanism between PLL and DVC. In [18], the authors established a full-order impedance model in both the dq frame and αβ frame and analyzed the impact of the interaction between DC voltage control and AC current control on the stability of DC voltage control. These models approximate the dq-axis currents and voltages of the network as steady-state operating points, which may not fully capture the dynamics influencing voltage amplitude and frequency stability—key considerations in power system analysis [19,20]. Recently, researchers have started using amplitude–frequency characteristics as operating points for VSC analysis. For example, the authors of [21] used Bessel functions to explain sideband harmonics in AC power systems. This approach successfully clarified the physical meaning of internal voltage and frequency as operating points, along with their energy implications. Yang et al. [22] adopted the time-varying amplitude–frequency rotating vector as the core analysis tool, successfully modeling and verifying the power separation mechanisms of various power generation equipment during the dynamic process, providing a new approach for dynamic analysis. Building on this, but focusing on small-signal stability, this study adopts direct linearization for seamless integration with the device’s small-signal model, enabling intuitive stability analysis.
The stability of multiple-input multiple-output (MIMO) systems can be effectively analyzed using state-space methods. In [23], the authors established a full-order state-space model of the inverter and employed eigenvalue analysis to examine the harmonic frequency oscillation modes induced by the inverter. Some scholars have further analyzed power system equipment by utilizing state-space right eigenvectors and participation factors. In [3], the authors employed participation factors to analyze the interactions between different timescale modes. These analysis results can intuitively demonstrate the various modes present in the system, as well as the participation of state variables [24,25]. However, these analyses struggle to elucidate the instability mechanisms from the perspective of amplitude–frequency interaction pathways. To bridge this gap, some studies have adopted impedance-based MIMO models, such as the network–node impedance approach, which can efficiently assess the stability of complex multi-converter systems by analyzing the interaction between converter admittances and the grid impedance matrix [26]. Meanwhile, some scholars have also employed SISO analysis to investigate stability conditions and explain the stabilization mechanisms in AC current timescale dynamics [27,28]. However, these studies have primarily focused on other aspects, with relatively less attention given to DC voltage timescale dynamics.
This paper proposes a DC voltage timescale dynamic modeling and stability analysis method for converter-interfaced systems based on voltage magnitude–frequency operating points. The proposed model incorporates complete control loops, including DC voltage control, terminal voltage control, inner current control, and PLL components. A comparison of the methods proposed in this paper with those of previous studies is shown in Table 1.
The main contributions of this paper are summarized as follows:
(1)
A universal linearized modeling method for amplitude–frequency operating points is proposed, which can be used for both qualitative and quantitative analysis of the stability mechanisms of internal voltage amplitude and internal voltage frequency.
(2)
The amplitude–frequency stability mechanism is analyzed using the SISO method. The influence of controller bandwidth at different DC voltage timescales on the Self-stable path and En-stable path is quantitatively evaluated. It is revealed that the instability of grid-connected converter systems is caused by insufficient damping provided by either the Self-stable path or the En-stable path.
(3)
The research results provide a mechanistic explanation for adjusting the control parameters of grid-connected converter systems under different DC voltage timescale bandwidths.
The remainder of this paper is organized as follows: Section II introduces the amplitude–frequency DC operating point modeling method for AC networks and utilizes this method to establish a converter-interfaced system model for DC voltage timescale analysis. In Section III, the Self-stable and En-stable path method is employed to theoretically analyze the Self-stable and En-stable paths of converter-interfaced systems. In Section IV, simulation analysis is conducted to examine the relationship between DC voltage timescale oscillation modes and Self-stable/En-stable paths in converter-interfaced systems. Section V concisely presents several conclusions. Finally, Section VI describes the limitations of this work and provides future prospects.

2. Small-Signal Modeling of Converter-Interfaced Systems in DC Voltage Timescale Based on Amplitude/Frequency Operating Points

The converter-interfaced system structure investigated in this study is illustrated in Figure 1.

2.1. Modeling of AC Networks Based on Amplitude–Frequency Operating Points

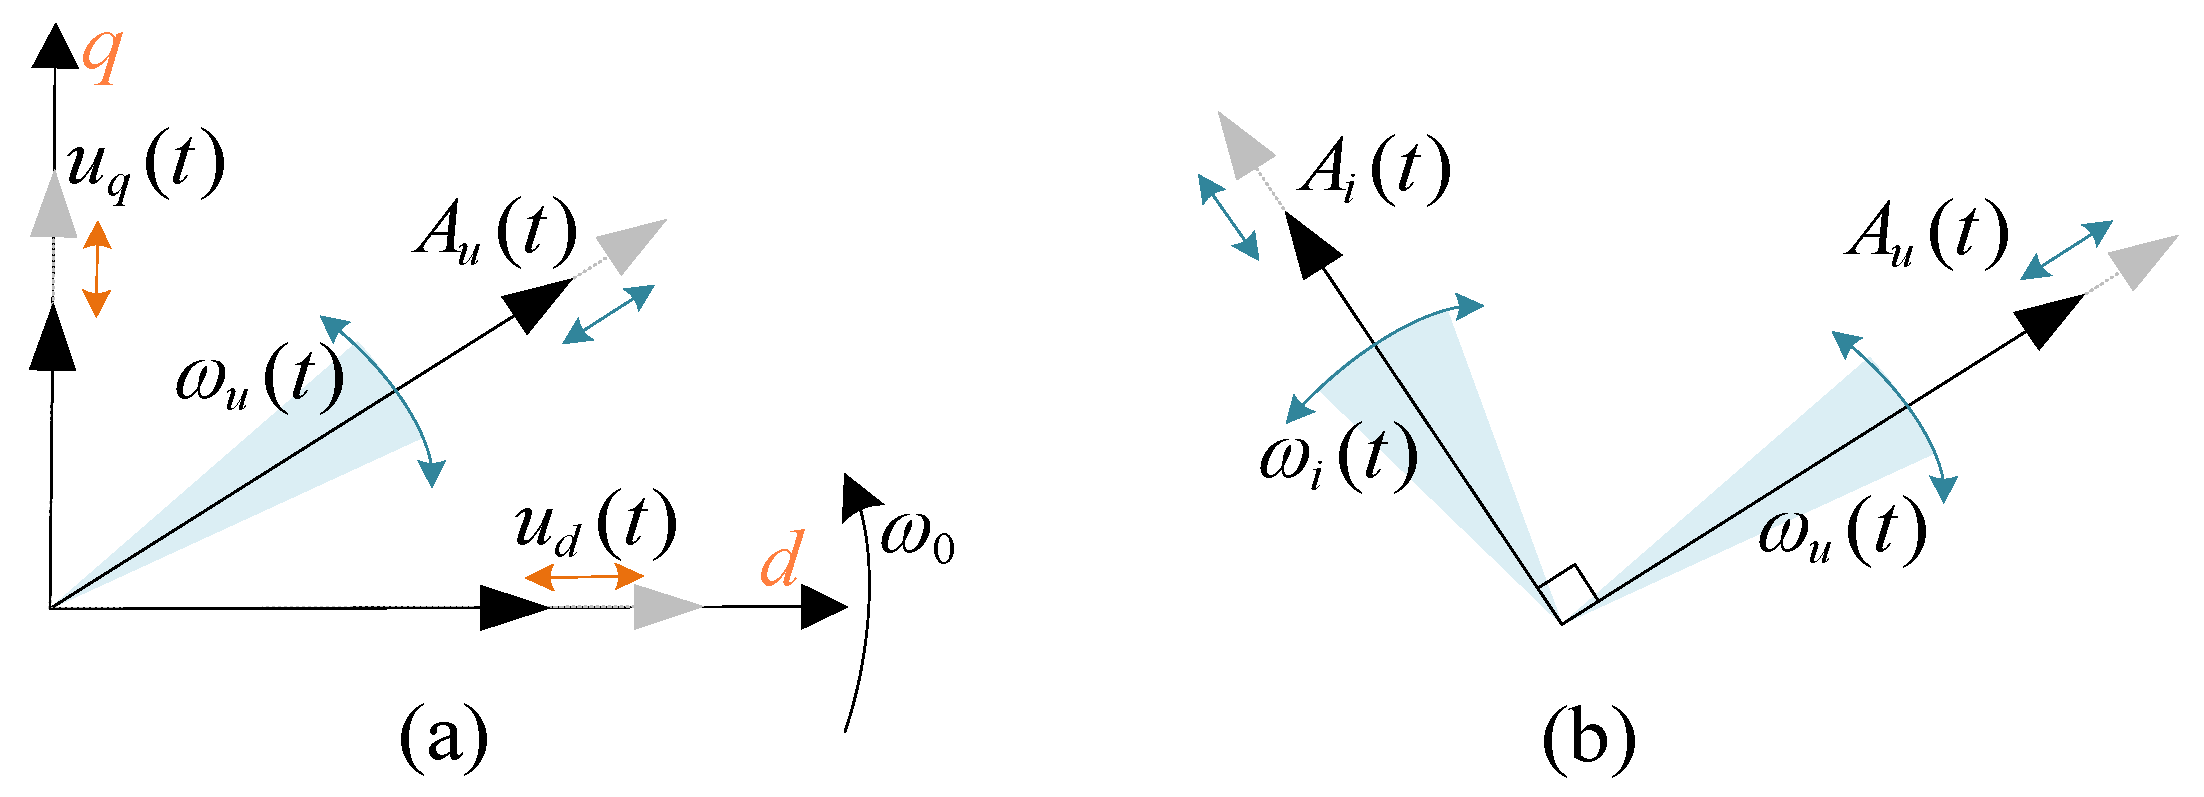
To perform small-signal analysis of an AC system using the state-space method, it is necessary to convert the AC state variables in the system into DC state variables. Previously, a common method for small-signal modeling was to transform the AC network. This was carried out by projecting the three-phase voltage and current phasors onto a virtual, synchronously rotating dq coordinate system. However, due to two reasons, this method makes it difficult to intuitively analyze the dynamic operation process of the power system. The first reason is that the system’s steady-state frequency may not always align with the nominal reference. Some insightful studies [29,30,31] have addressed this by using a dynamic fundamental frequency for dq operating point modeling, particularly for two-area two-machine islanded systems with VSC-VSG. However, the applicability of this method to larger, more interconnected systems is not yet straightforward and often requires significant adaptation. Secondly, amplitude and frequency are fundamental state variables in power systems, directly correlating with active and reactive power. In Figure 2a, it can be observed that the dynamic projection of a voltage phasor onto the synchronously rotating dq coordinate frame yields the dq variables u d t and u q t . Unlike dq variables, the A u t and ω u ( t ) in Figure 2a, which represent the dynamics of the voltage phasor, offer more distinct physical significance. This makes the modeling of the amplitude–frequency operating points a more intuitive approach for AC networks.
Numerous modeling methods have been developed focusing on amplitude–frequency characteristics. In [21], in order to reveal the intrinsic relationship between current amplitude–frequency and voltage amplitude–frequency in AC networks under small disturbances, the Jacobi–Anger identity was employed to model the network at the amplitude–frequency operating point. Reference [32] utilized the integration-by-parts method to establish an amplitude–frequency operating point model, demonstrating that current components are actually composed of different sequences and can be applied to both small and large disturbance analyses. Since the focus of this paper is not to explore the fundamental relationship between voltage and current in the network and to maintain consistency with the small-signal modeling approach for devices, this study adopted the traditional small-signal linearization method to model the network at the amplitude–frequency operating point.
For the small signal linearization of three-phase capacitors and inductors, the state variations of the system are also directly represented using the increments around the equilibrium point. Based on this, the corresponding relationships between voltage and current for these two components are derived. Since the expressions for three-phase inductors and capacitors are dual, the following derivation takes the three-phase capacitor as an example to establish the relationship between the voltage amplitude/frequency and the current amplitude/frequency flowing through the capacitor. The relationship between the current amplitude–frequency and voltage amplitude–frequency in a symmetrical three-phase capacitor is shown in Figure 2b and can be expressed by Equation (1).
A u ( t ) e j ω u ( t ) d t = 1 C A i ( t ) e j ω i ( t ) d t d t
By solving Equation (1), the relationship between the three-phase voltage amplitude and frequency and the current amplitude and frequency can be obtained, as shown in Equations (2) and (3).
A u ( t ) = 1 C ( A i ( t ) cos ( ω i ( t ) ω u ( t ) d t ) d t
ω u ( t ) = A i ( t ) sin [ ω i ( t ) ω u ( t ) ] d t C A u ( t )
After performing small-signal linearization on Equations (2) and (3), the results are shown in Equations (4) and (5).
Δ A u = A t 0 A i 0 ω 0 2 s 2 + ω 0 2 Δ A i + C A t 0 2 A i 0 ω 0 2 s 2 + ω 0 2 Δ ω i
Δ ω t = 1 C A t 0 s 2 s 2 + ω 0 2 Δ A i + s 2 s 2 + ω 0 2 Δ ω i
The derivation process from Equations (2)–(5) is provided in Appendix B
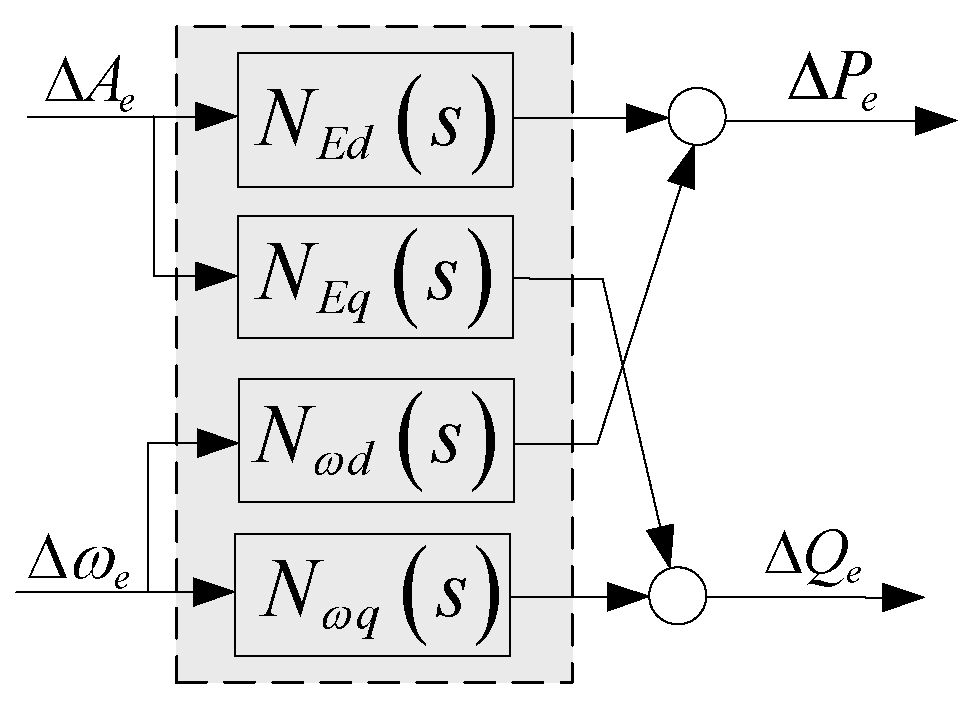
By projecting the network’s output current onto the internal voltage vector, the active/reactive power components can be obtained. The small-signal input–output relationship of the network is shown in Equation (6).
Δ P e Δ Q e = N E d N ω d N E q N ω q Δ A e Δ ω e
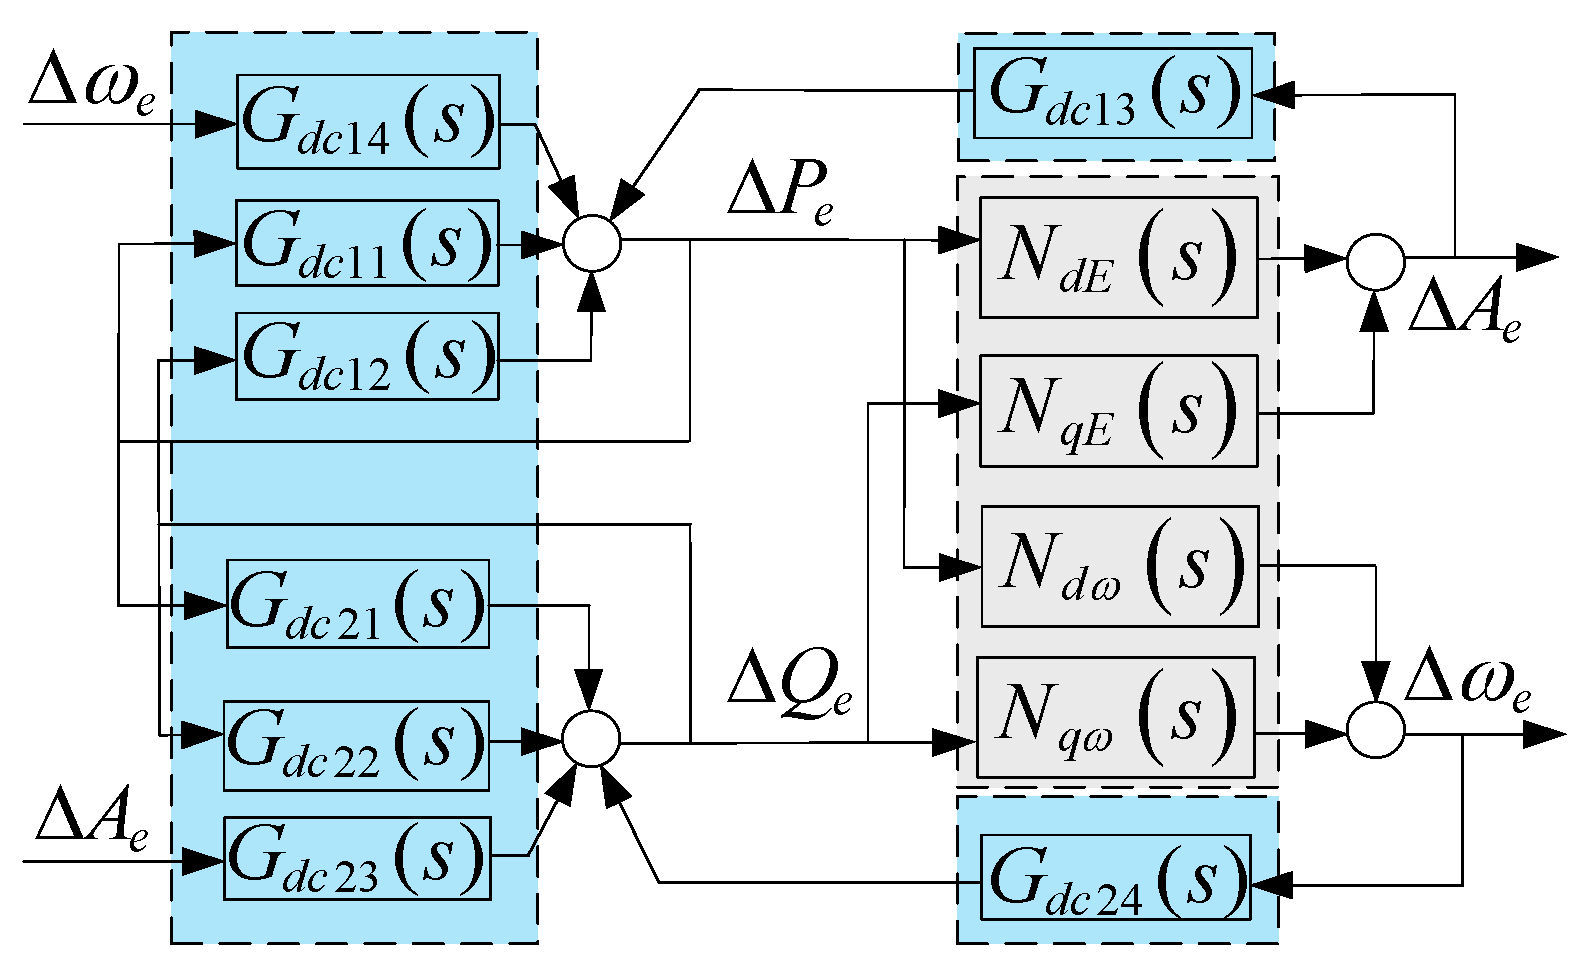
The corresponding equivalent block diagram of network transfer function is represented in Figure 3.

2.2. Small-Signal Modeling of VSC

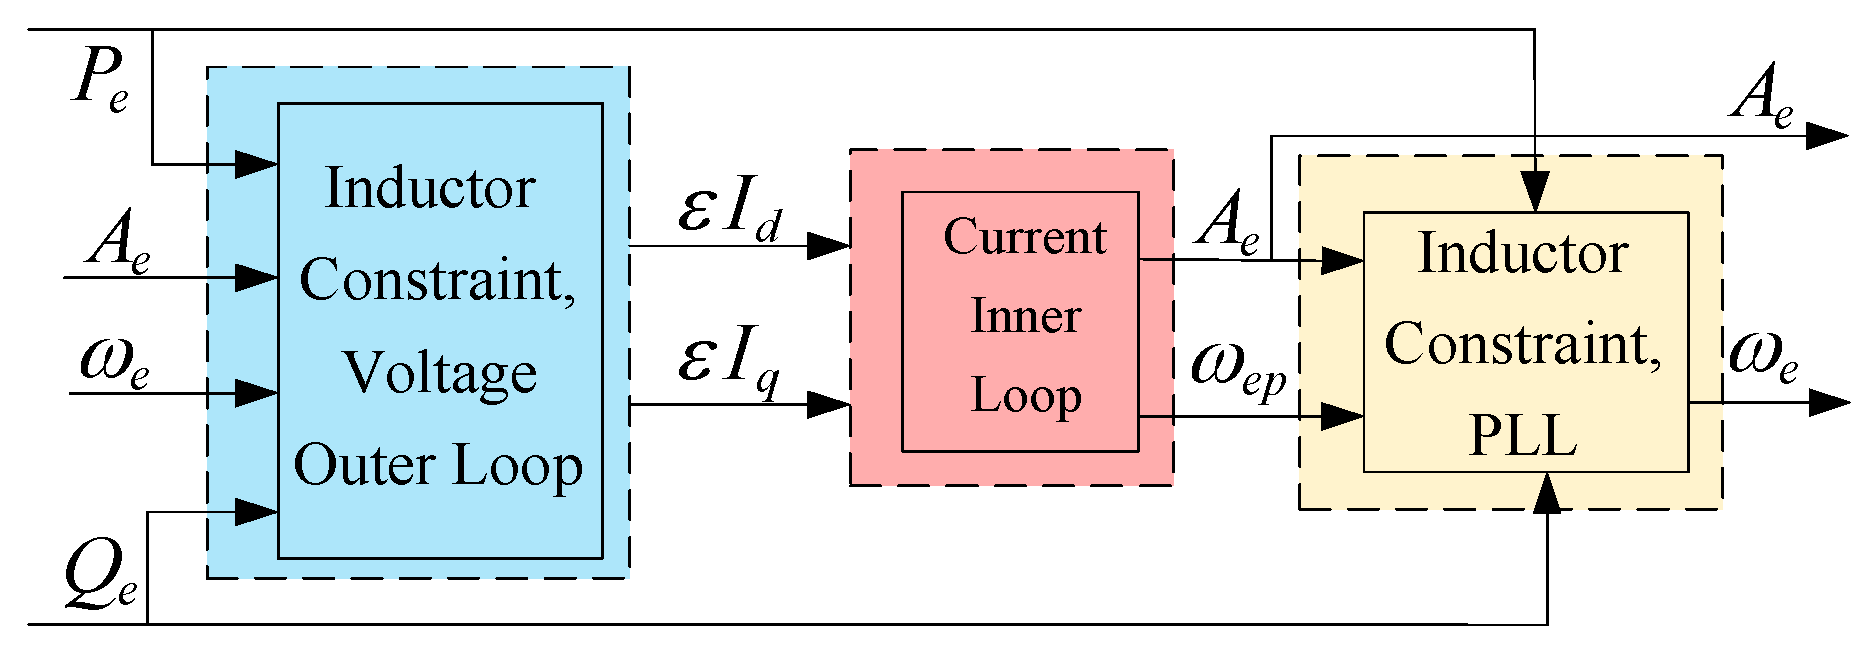
The VSC first forms the terminal voltage amplitude through the converter-side inductance constraints based on the network’s input active power and reactive power, as well as its own output internal voltage amplitude and frequency. Then, the terminal voltage amplitude and DC voltage amplitude form the active current reference value and reactive current reference value through the DC voltage scaling outer-loop controller. Next, the actual values of active/reactive current and the reference values of active/reactive current form the unbalanced active/reactive current. The unbalanced active/reactive current is regulated through current timescale control to form the frequency difference between the internal voltage frequency and the phase-locked loop frequency. Finally, the internal voltage amplitude, the frequency difference of the internal voltage phase-locked loop, and the active/reactive power form the internal voltage frequency through inductance constraints [13]. Based on the fundamental operating principles of the VSC, an equivalent block diagram, as shown in Figure 4, can be drawn.
The small-signal relationship of the input–output relationship represented by the blue box in Figure 4 is shown in Equation (7).
Δ ε I d Δ ε I q = G d c 11 G d c 12 G d c 13 G d c 14 G d c 21 G d c 22 G d c 23 G d c 24 Δ P e Δ Q e Δ A e Δ ω e
The small-signal relationship of the input–output relationship represented by the red box is shown in Equation (8).
Δ A e Δ ω e p = G c c 11 G c c 12 G c c 21 G c c 22 Δ ε I d Δ ε I q
The small-signal relationship of the input–output relationship represented by the yellow box is shown in Equation (9).
Δ ω e = G p l l 1 G p l l 2 G p l l 3 G p l l 4 Δ P e Δ Q e Δ A e Δ ω e p
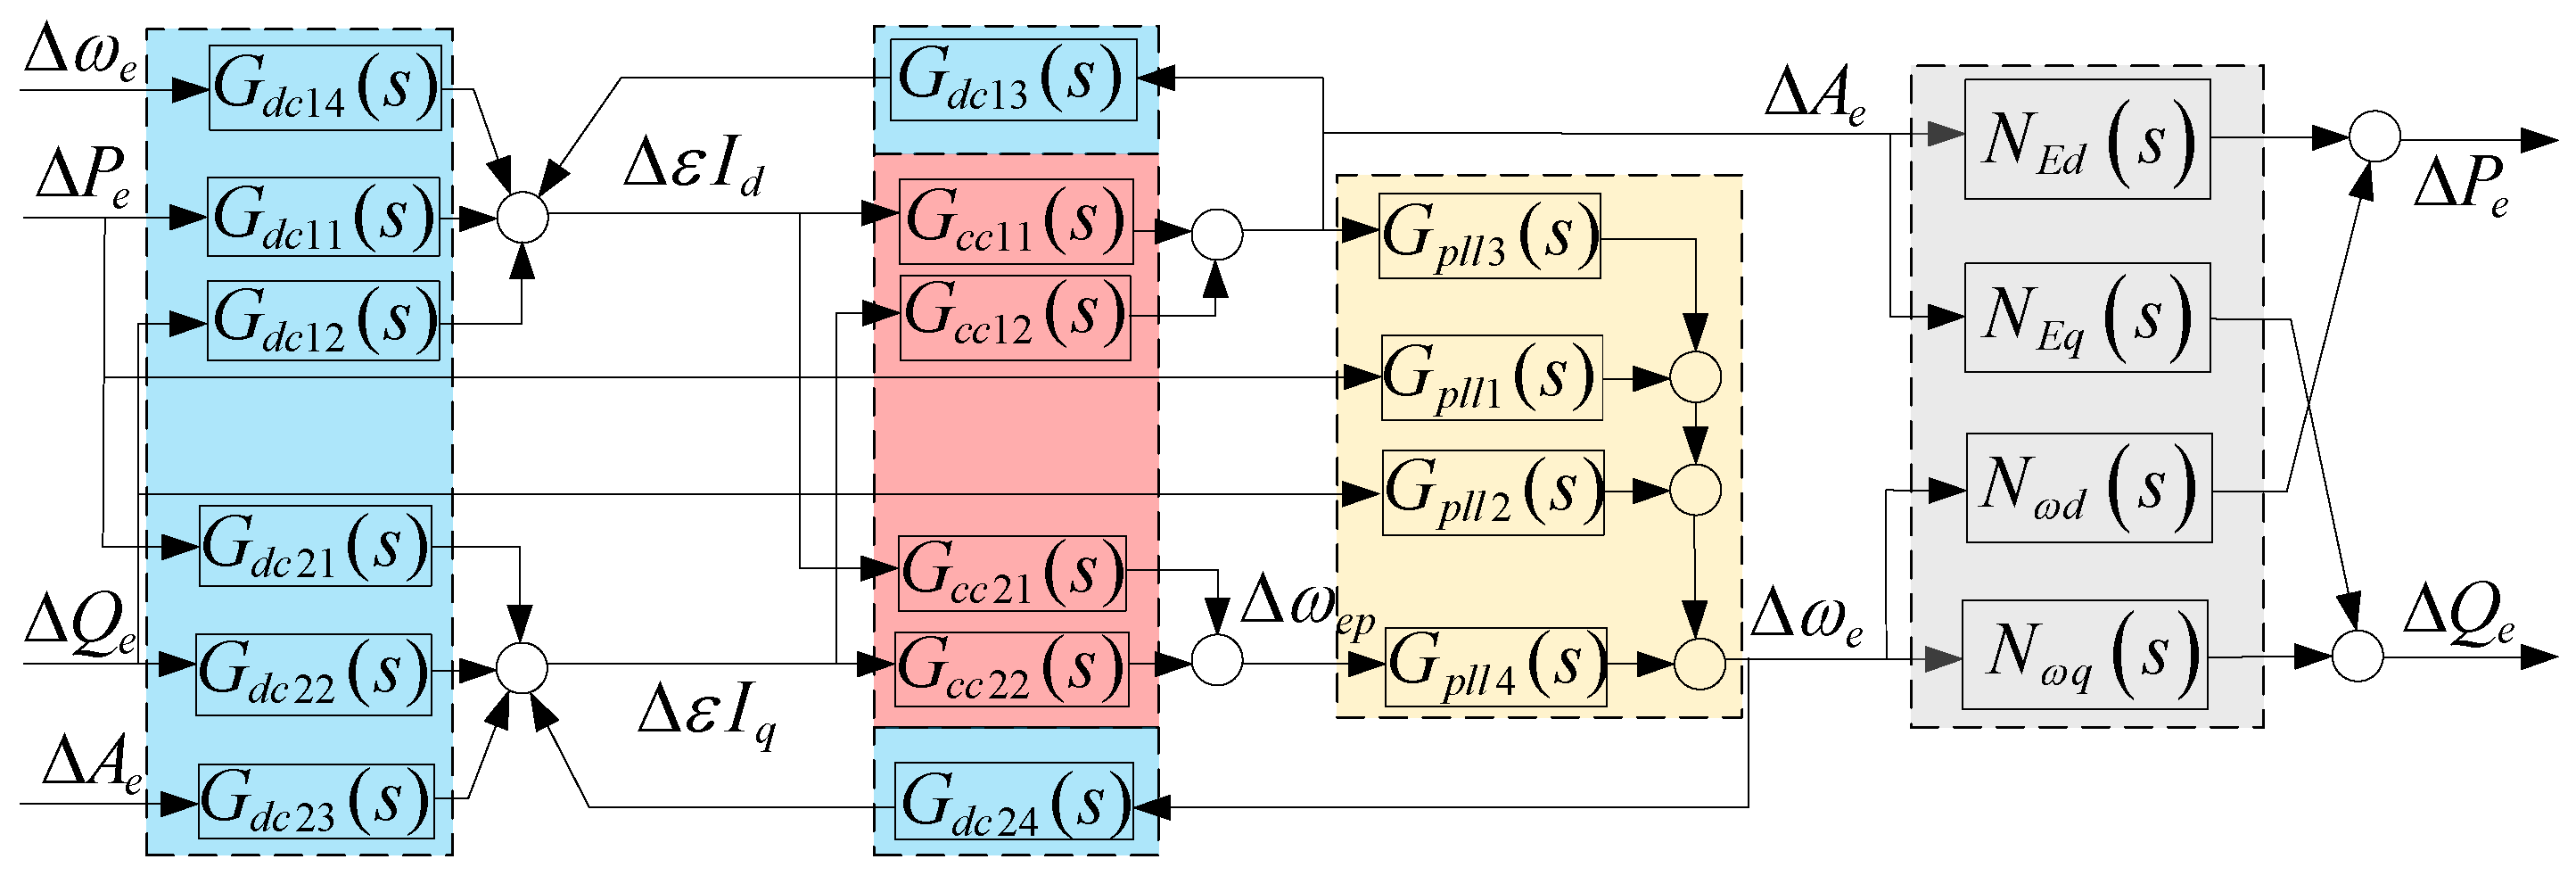
Based on the aforementioned relationships, the small-signal paths of various physical quantities in the VSC after linearization are shown in Figure 5:
The small-signal model of the grid-connected converter is presented in Appendix C. The transfer functions in this section are calculated by setting input disturbances and output measurement points in Simulink.

2.3. Reduced-Order DC Voltage Timescale Model for Converter-Interfaced Systems

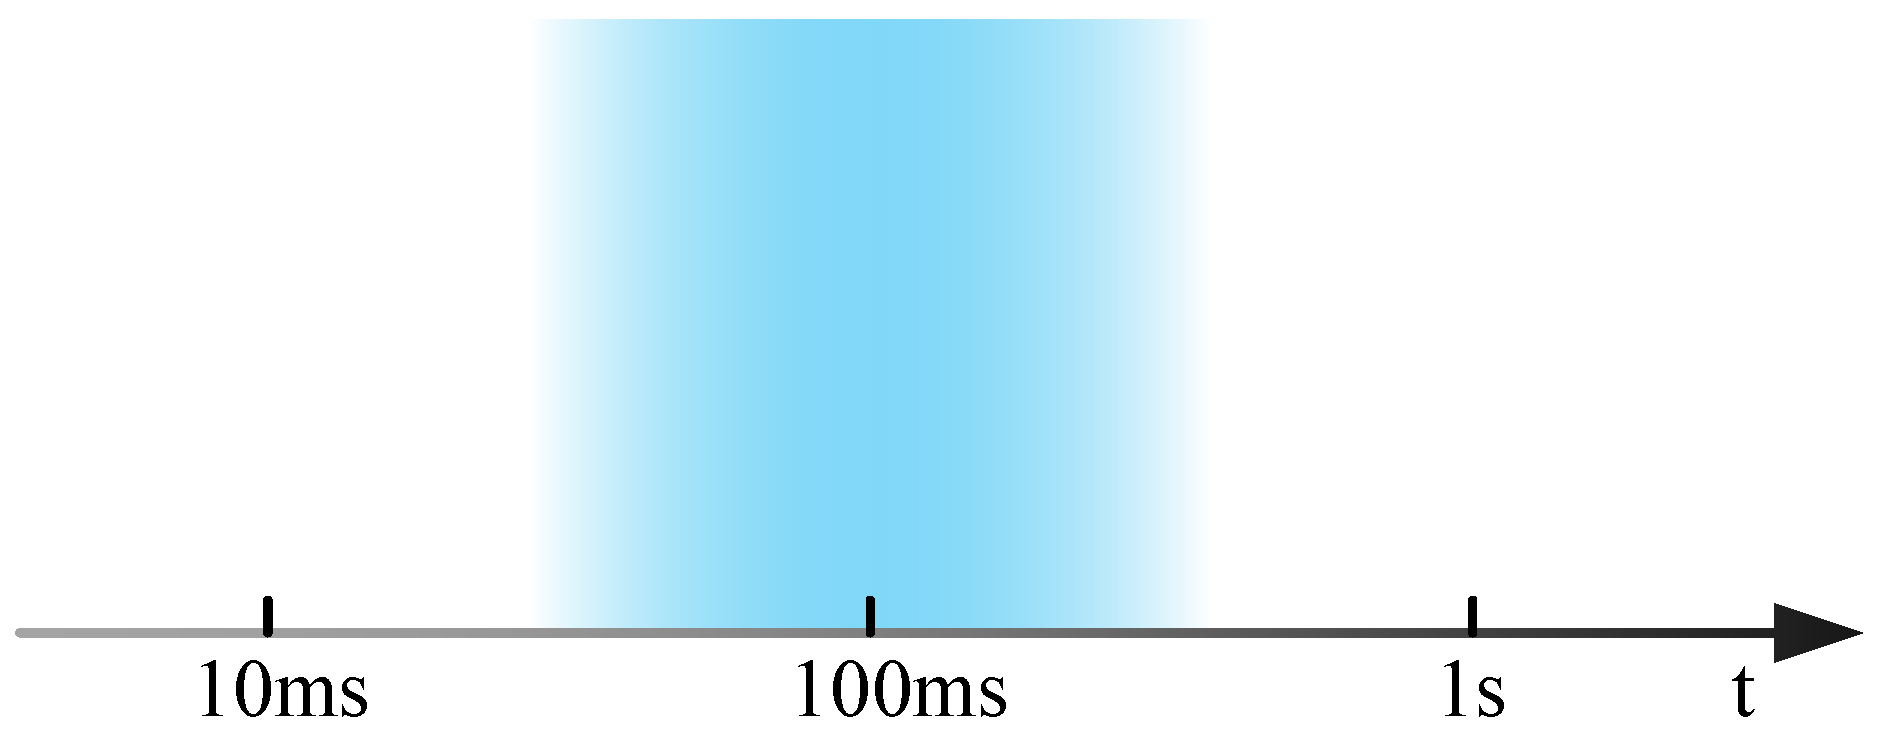
With the large-scale integration of converter-interfaced systems, the grid strength gradually decreases, potentially leading to oscillations in the DC voltage timescale domain under certain operating conditions. This DC voltage timescale, which is central to this paper, pertains to the dynamic phenomena associated with the energy balance of the converter’s DC-link capacitor, with oscillations typically occurring around 10 Hz (a time constant of ~100 ms, as shown in Figure 6). This timescale is significantly slower than the dynamics of the converter’s AC current control and PLL (hundreds of Hertz or higher) but faster than the traditional electromechanical timescale (~1 Hz). Due to this clear timescale separation, the DC voltage control plays a dominant role in these oscillations, while the faster dynamics of the AC current can be neglected. Therefore, to analyze such phenomena, this paper proposes a dedicated DC voltage timescale model, established by simplifying the AC current dynamics. Analyzing stability on this timescale is critical for ensuring the power balance and stable operation of the converter.
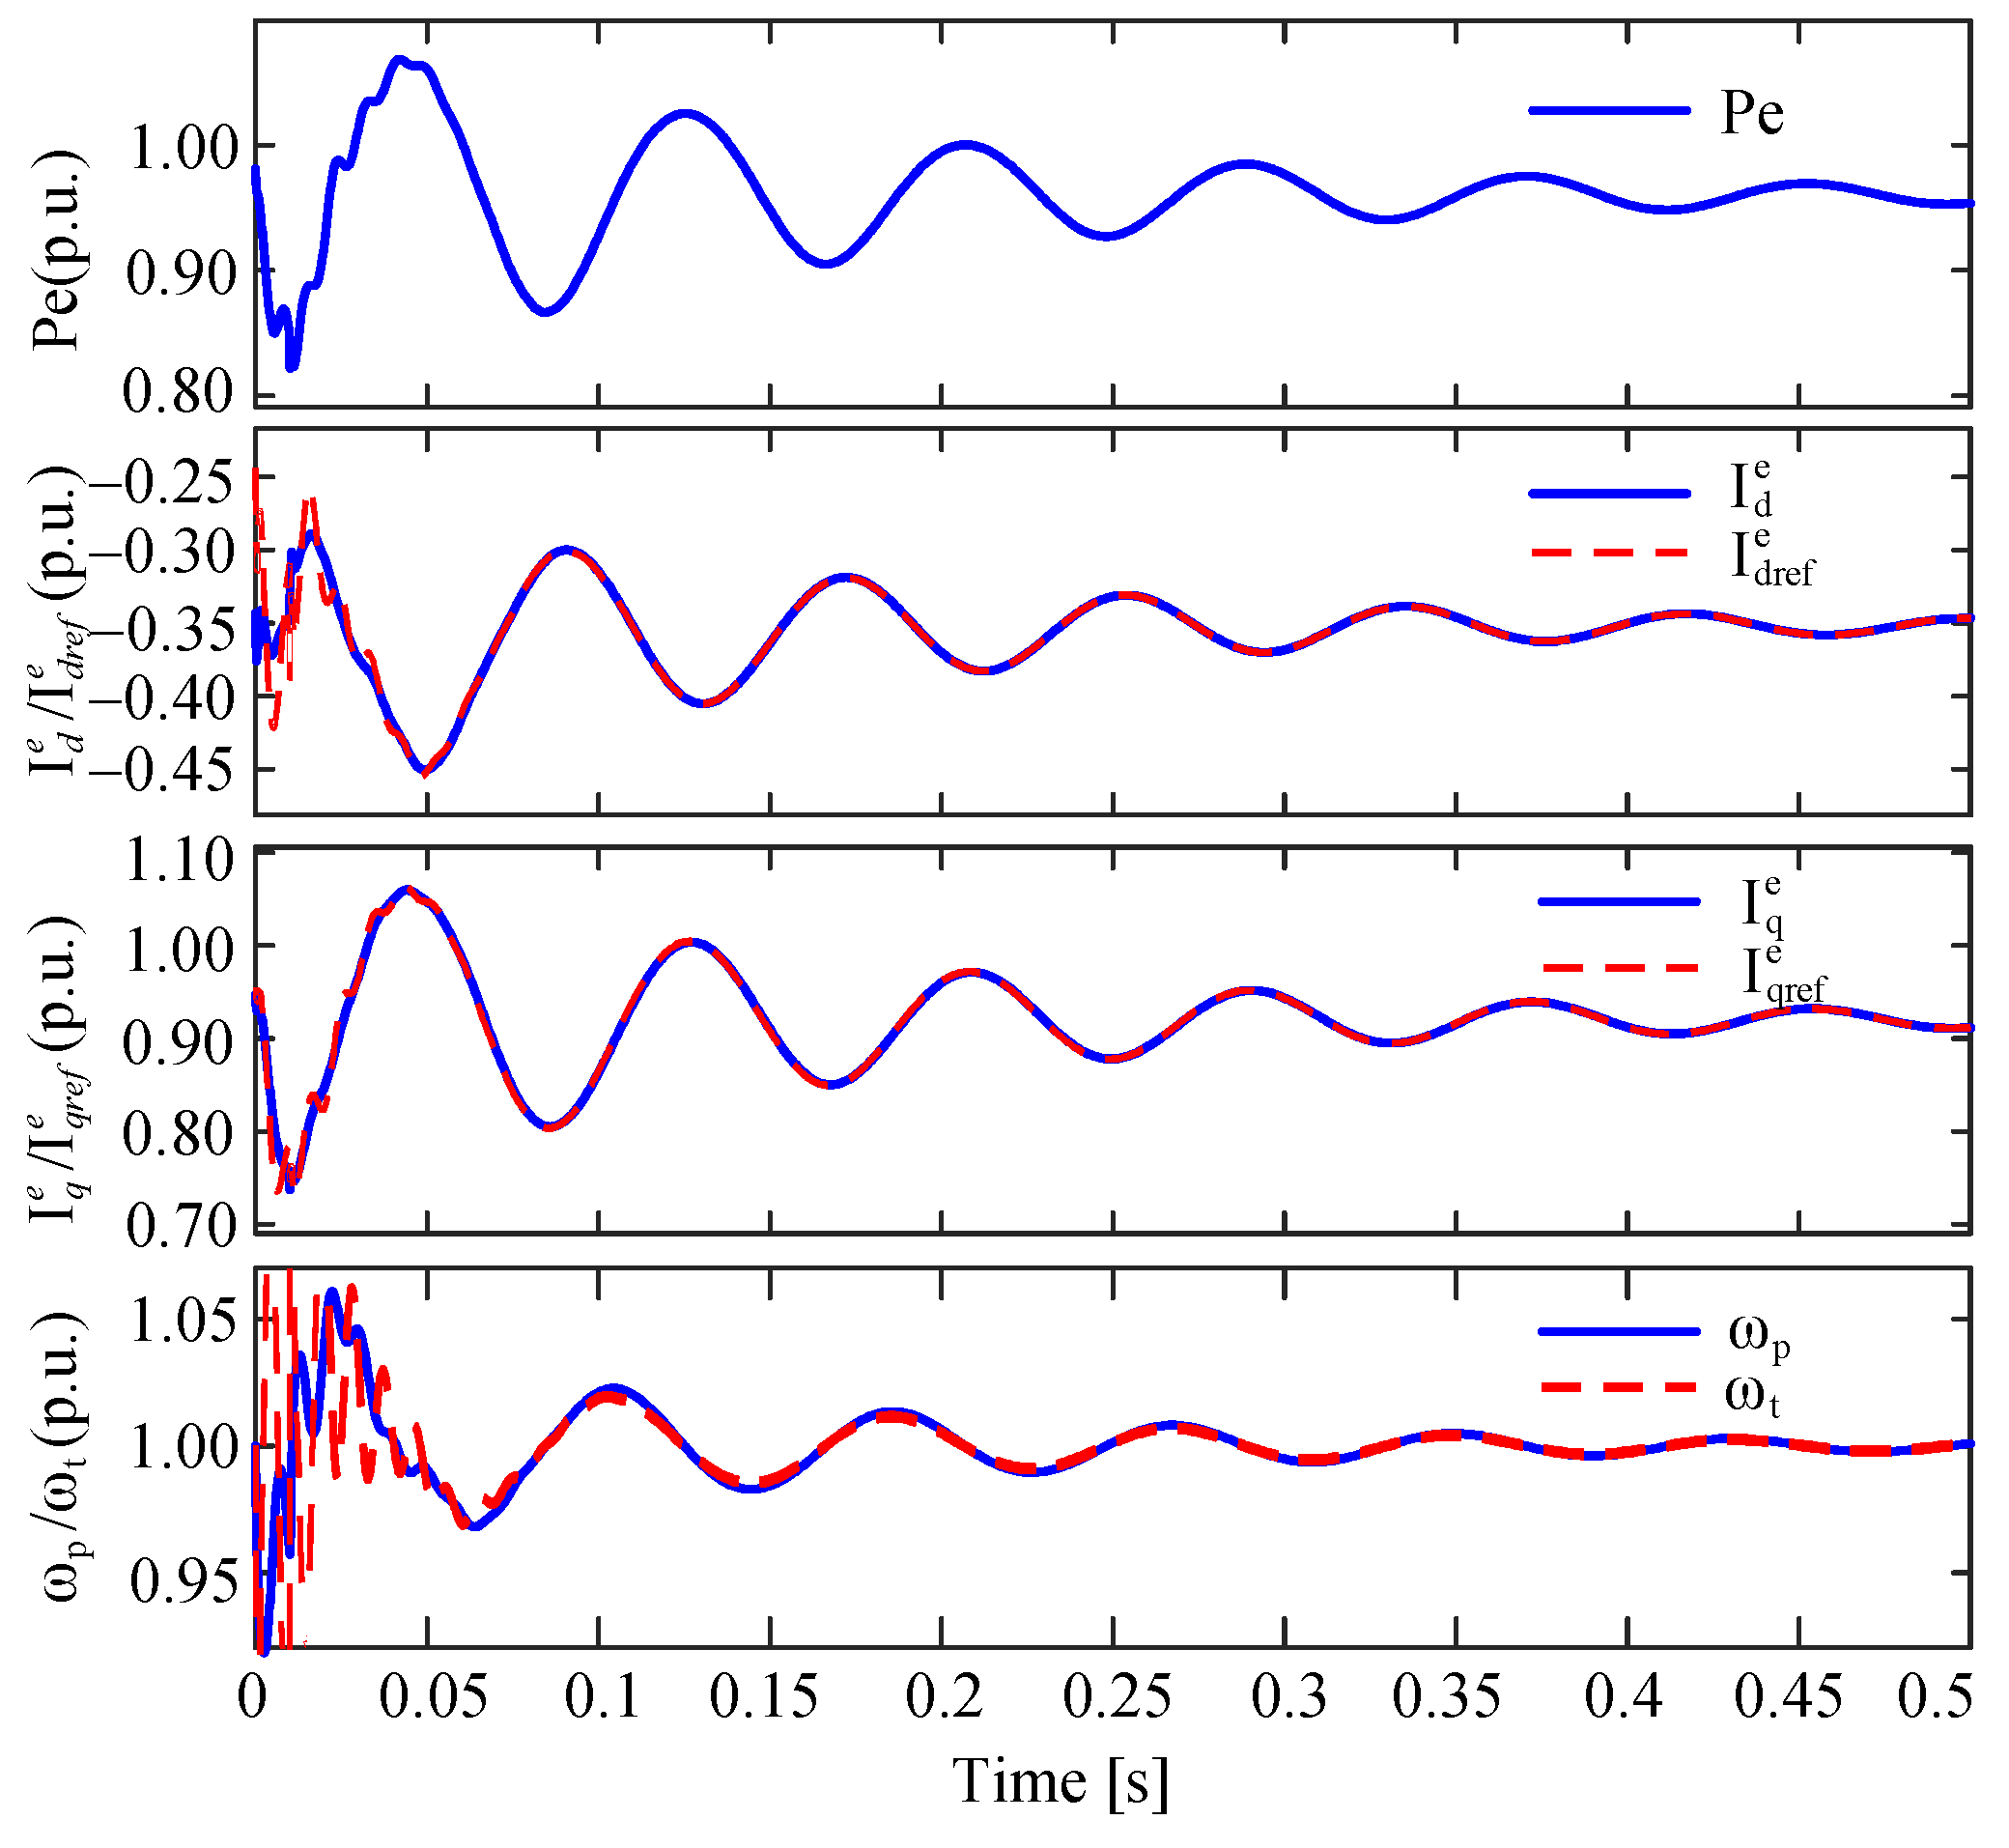
The scenario under investigation is characterized by the ability of the actual active/reactive current values to track their reference values within the DC voltage timescale, while the PLL frequency can synchronize with the terminal voltage frequency in the same timescale. To emulate these characteristics, an approach employing infinite integral gains in both the AC current controller and PLL controller can be adopted [14]. By simulating the aforementioned scenario in Matlab/Simulink R2023b, the waveforms shown in Figure 7 can be obtained.
As shown in Figure 7, for the voltage timescale model, due to the delay in current balance regulation by the current control timescale component, current errors occur, meaning that the active/reactive currents cannot instantaneously track their reference values. Although significant dynamic discrepancy exists between the actual and reference values of active/reactive currents at the current control timescale, the DC voltage timescale dynamics are nearly negligible. In other words, the current control timescale component’s regulation of internal voltage amplitude and frequency to achieve balance between active/reactive currents and their command values exhibits almost no delay at the DC voltage timescale. Consequently, for the DC voltage timescale dynamics of primary concern, the current control timescale component can effectively assist the DC voltage control timescale component in adjusting the internal voltage amplitude and frequency according to active/reactive power imbalances. The excitation–response relationship between current control timescale dynamics and the DC voltage timescale model is perfectly correspondent. Therefore, under these conditions, the established DC voltage timescale model can intuitively represent the regulation process of internal voltage amplitude and frequency by the DC voltage control timescale under active/reactive power imbalances, as well as the DC voltage timescale characteristics exhibited by converter-interfaced systems during this process.
As shown in the last subplot in Figure 7, in the established DC voltage timescale model, the frequency difference between the PLL frequency and the terminal voltage frequency is also essentially zero within the voltage timescale. This indicates that the influence of PLL control on the DC voltage timescale regulation of internal voltage amplitude/frequency is also minimal, which aligns with the characteristics of the research scenario under investigation.
Based on the analysis above, it can be concluded that in the scenario of DC voltage timescale oscillations, converter-interfaced systems can neglect the AC current timescale control loops, including the inner-loop current control and the PLL control. Therefore, the simplified voltage control timescale influence path diagram shown in Figure 8 can be obtained. It should be noted that due to the change in the input–output relationship, the relationship between the new network matrix and the original network matrix is as shown in Equation (10):
N d E N q E N d ω N q ω = N E d N ω d N E q N ω q 1

3. Self-Stable/En-Stable Path Analysis for Converter-Interfaced Systems

From the converter-interfaced system model in the previous section, it can be observed that the VSC itself is an MIMO system. It is important to clarify that all stability analyses in this paper, including the Self-stable/En-stable path analysis method introduced below, are performed on the linear time-invariant (LTI) model obtained by linearizing the original nonlinear system around a specific operating point. While the state-space small-signal analysis method can be used to obtain the eigenvalues of this linearized system, it often makes it difficult to gain physical insight into the internal damping paths and stability mechanisms. Therefore, to achieve a deeper physical understanding, this study adopted the Self-stable/En-stable path analysis method, which is derived from SISO theory, to analyze and decouple this linearized MIMO system.

3.1. Self-Stable/En-Stable Path Analysis Method

When studying individual equipment, researchers typically focus on its specific characteristics. For a single converter-interfaced system, the most critical characteristics are its internal voltage amplitude and frequency behaviors. For synchronous machines, the internal voltage and frequency have clear, intuitive physical meanings. In contrast, the internal voltage and frequency of a converter-interfaced system lack this kind of direct physical interpretation. Moreover, there exists coupling between the internal voltage amplitude and frequency signals in converter-interfaced systems. Consequently, it remains challenging to separately analyze the internal voltage amplitude stability and internal voltage frequency stability of converter-interfaced systems at present.
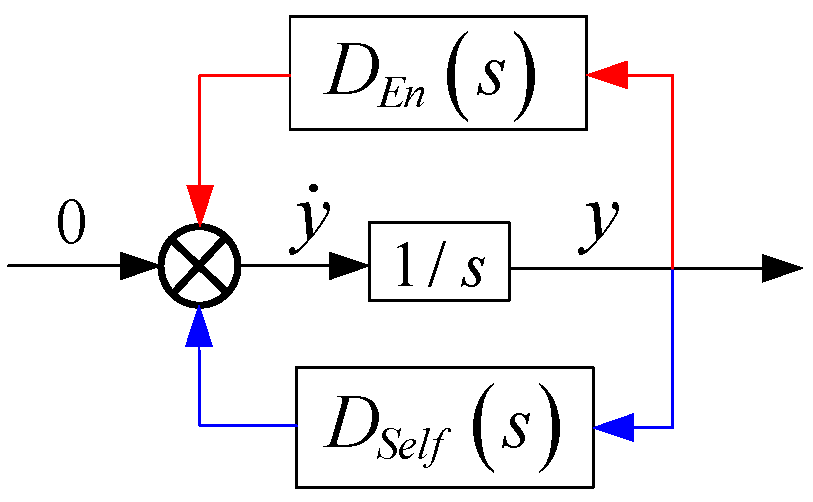
For linear systems under study that contain two key variables (x and y), the equivalent block diagram of the Self-stable/En-stable characteristics for the single variable y is shown in Figure 9.
The Self-stable path of the single variable y is defined as the influence path where the small disturbance signal of variable y affects y itself without passing through variable x, as shown in the blue path in Figure 9. The En-stable path of the single variable y is defined as the influence path where the small disturbance signal of variable y affects y itself after passing through variable x, as shown in the red path in Figure 9. It can be easily understood that the sum of these two paths constitutes the total influence path of variable y on itself. According to the proof in [27], the stability of the transfer function of the total influence path of variable y on itself is consistent with the stability of the original system. Furthermore, since this paper focuses on DC voltage timescale oscillation phenomena, the condition σ d ω d is satisfied near the small-signal stability boundary, where λ d 1,2 = σ d ± ω d represents the dominant eigenvalue of the system. The specific stability assessment method and the determination of positive/negative damping provided by the Self-stable/En-stable paths for variable stability can be found in [28].

3.2. Self-Stable and En-Stable Paths of Internal Voltage Amplitude in Converter-Interfaced Systems

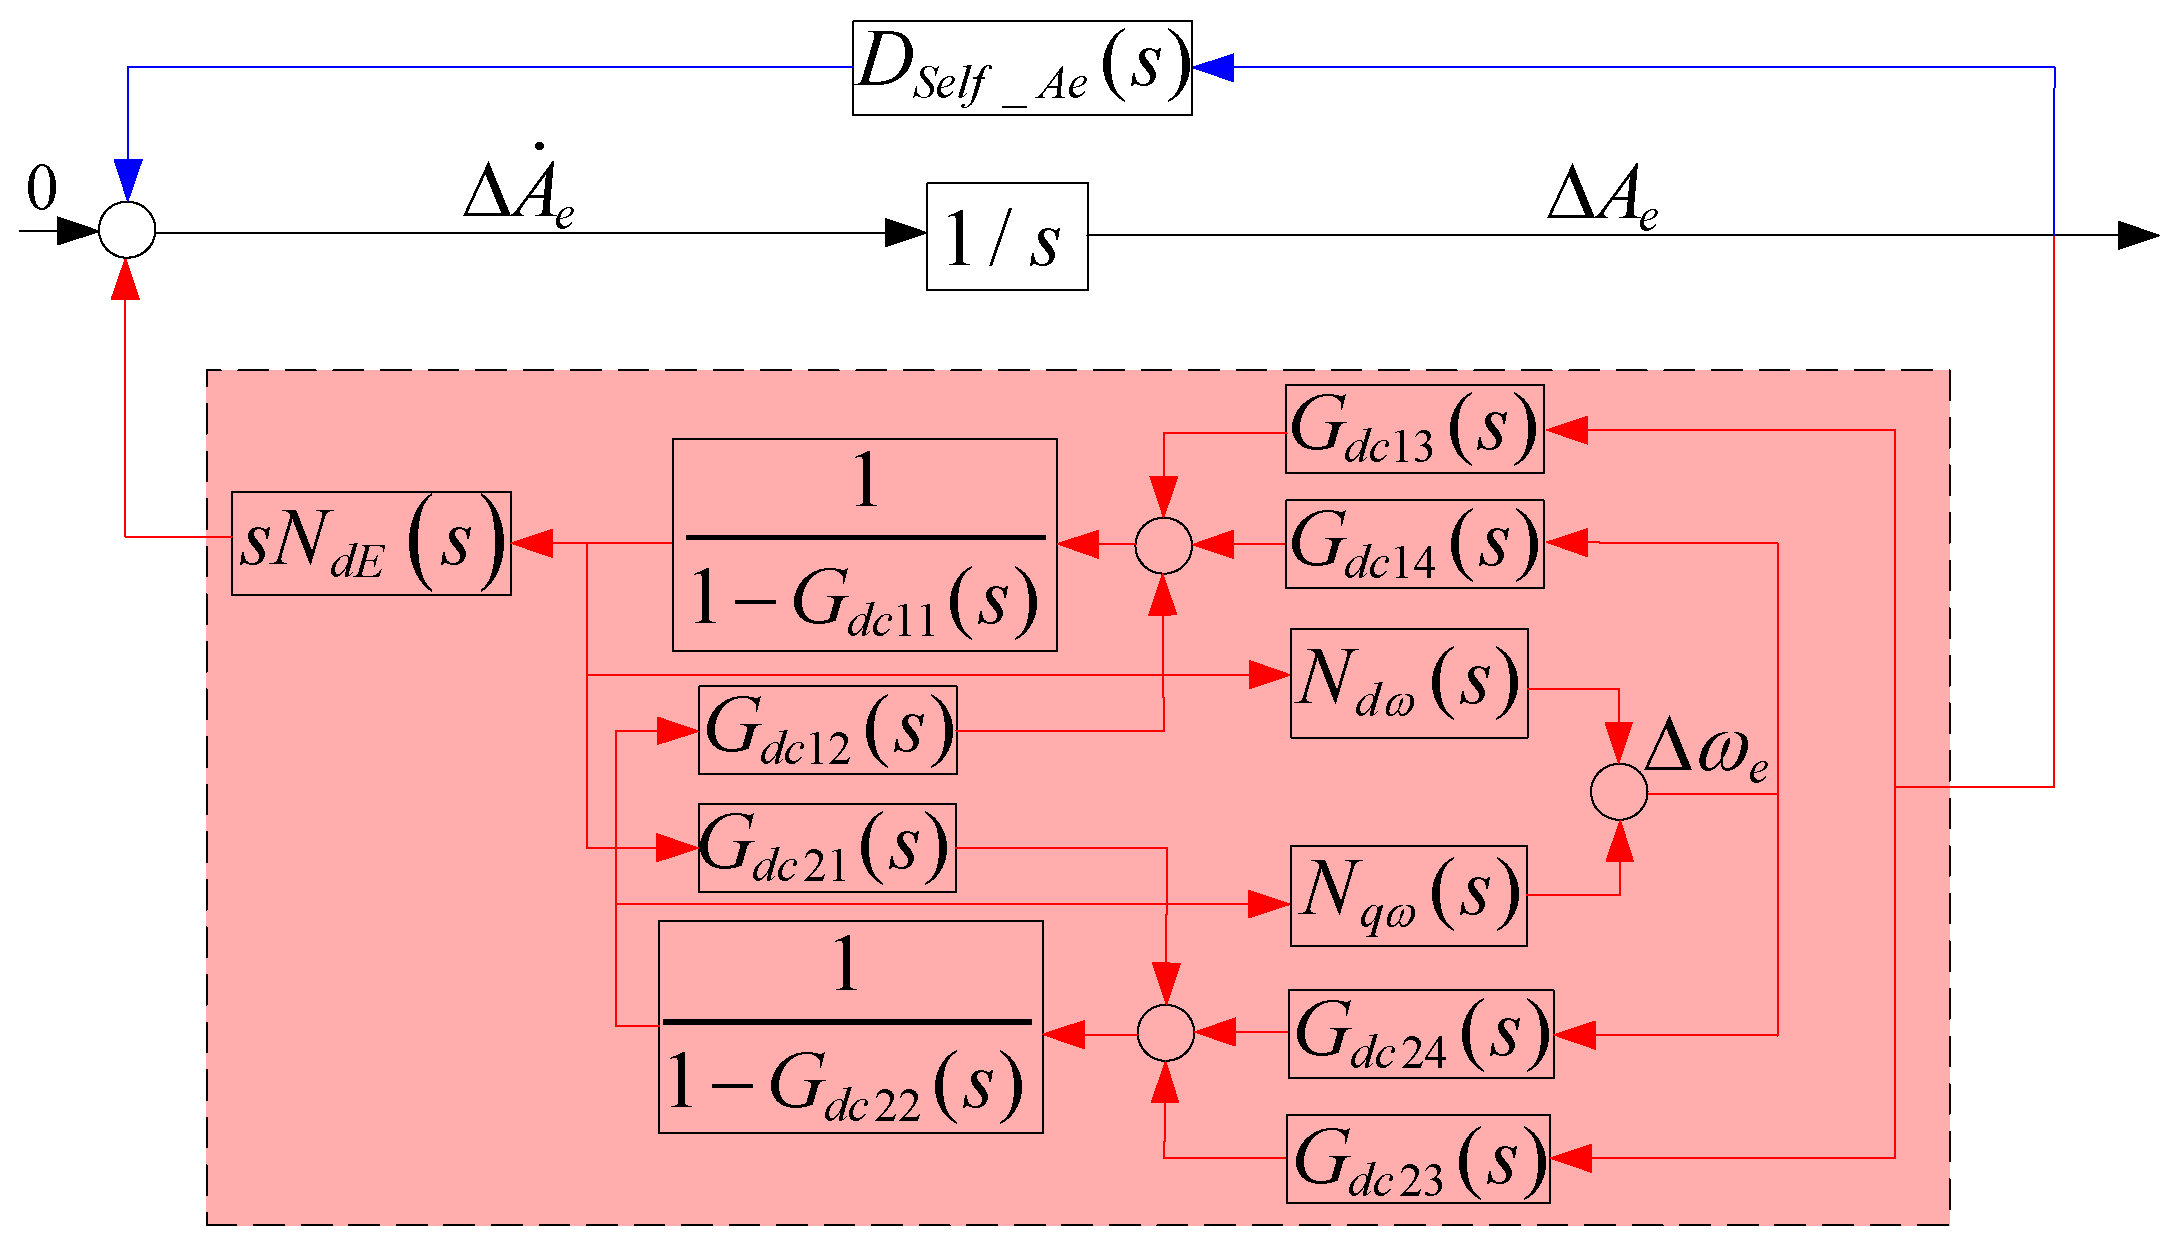
According to Figure 8, it can be observed that in converter-interfaced systems, the internal voltage amplitude and frequency not only interact through coupling channels within the equipment itself but also influence each other through network paths. The Self-stability of internal voltage amplitude refers to the effect of the internal voltage amplitude on itself without interacting with the internal voltage frequency dynamics. The influence path of the internal voltage amplitude on itself without passing through the internal voltage frequency can be identified in Figure 8, as indicated by the blue box in Figure 10. In the blue box, the transfer function where the internal voltage amplitude serves as the input and the derivative of the internal voltage amplitude serves as the output is defined as the Self-stable transfer function of the internal voltage amplitude.
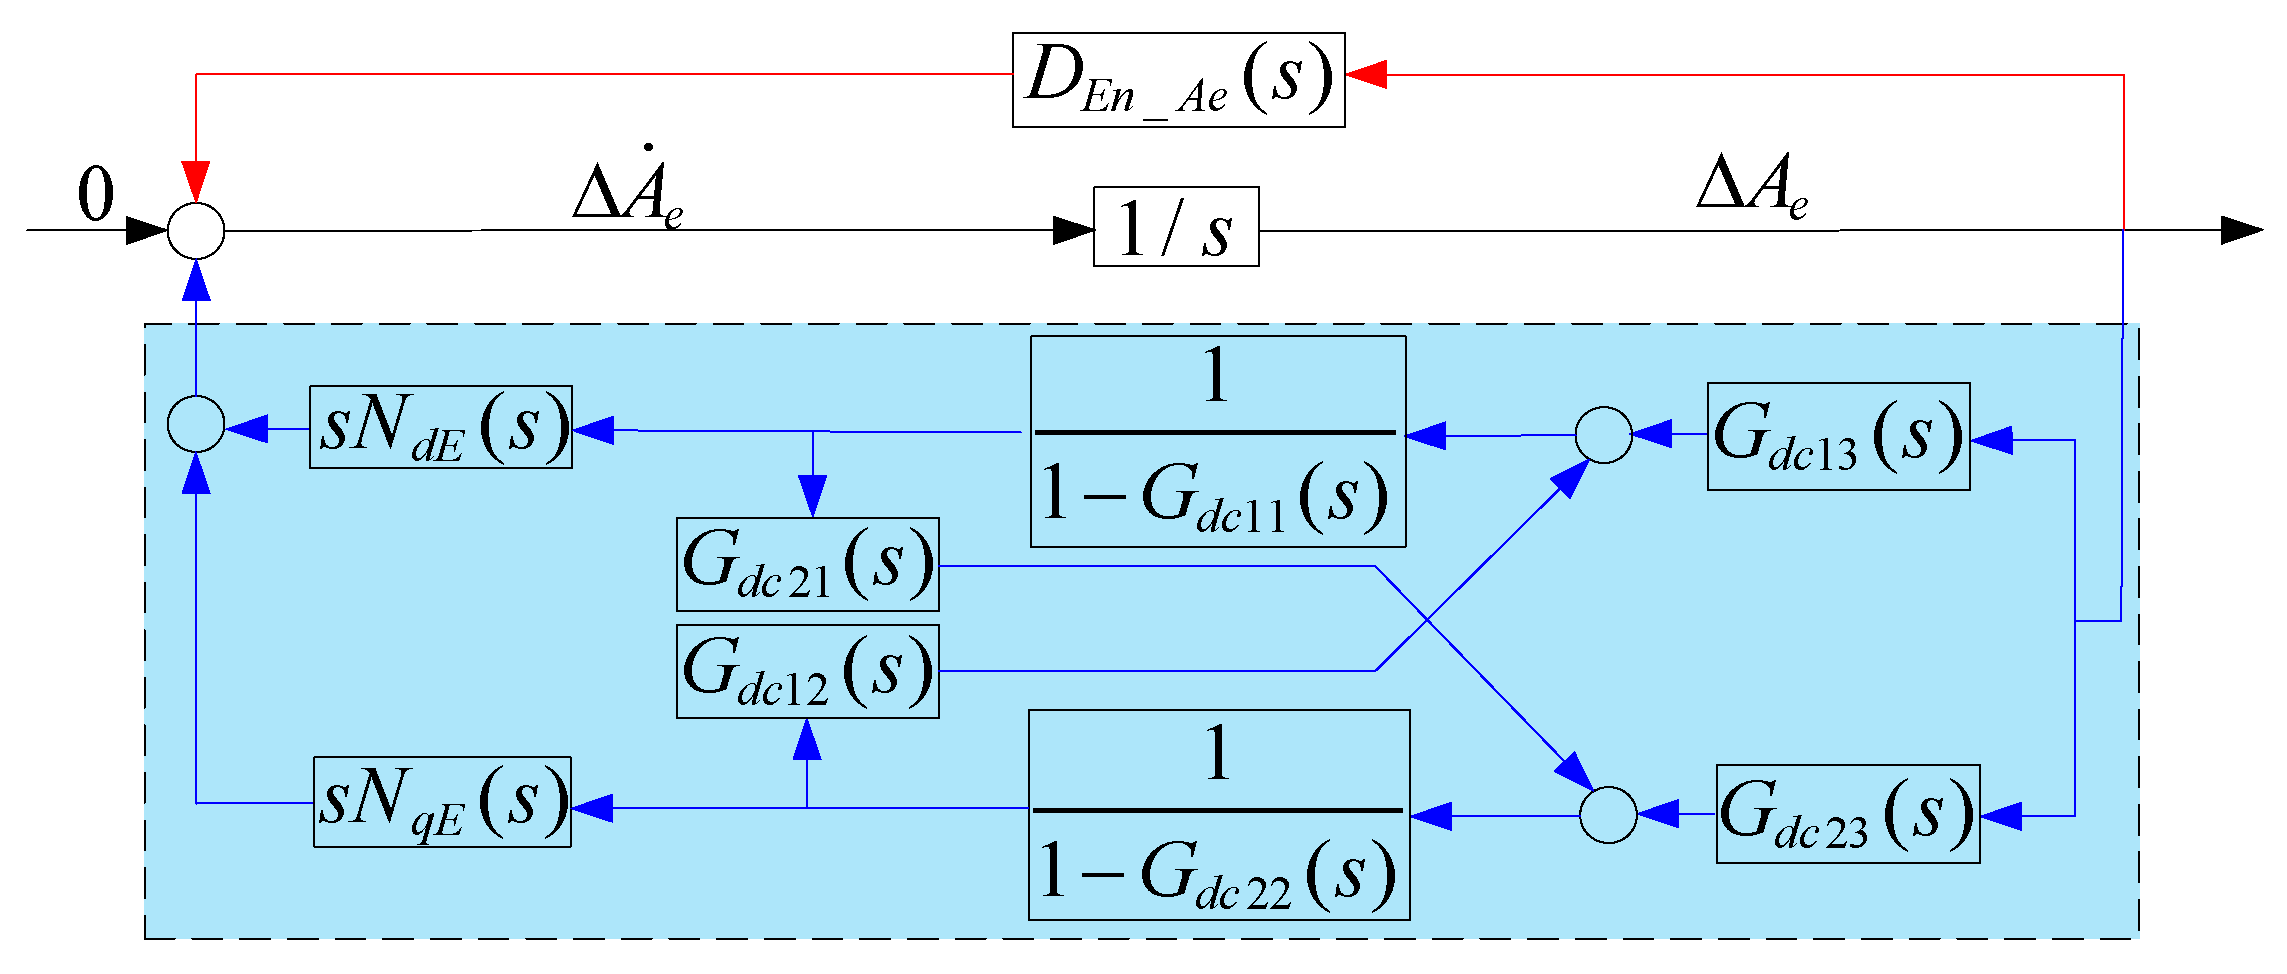
The En-stability of internal voltage amplitude refers to the influence of internal voltage amplitude on itself after interacting with the internal voltage frequency dynamics. According to the definition of the En-stable path of internal voltage amplitude, the following steps are taken: First, derive the open-loop transfer function, where the internal voltage amplitude serves as the input and the internal voltage frequency serves as the output. Then, derive the forward-path transfer function, where the internal voltage frequency serves as the input and the internal voltage amplitude serves as the output. The product of these two transfer functions constitutes the En-stable transfer function of the internal voltage amplitude. The En-stable path in the motion equation of internal voltage amplitude is illustrated in Figure 11, where the forward-path transfer function is explicitly represented.
From the Self-stable and En-stable paths of internal voltage amplitude, it can be observed that both paths influence the stability of internal voltage amplitude by affecting the active/reactive power. By analyzing the Self-stable and En-stable paths of internal voltage, we can explain the stability mechanism of internal voltage amplitude in converter-interfaced systems at the DC voltage timescale. Based on the Self-stable and En-stable paths and their transfer functions shown in Figure 10 and Figure 11, we can derive both the Self-stable path transfer function and En-stable path transfer function of internal voltage amplitude in converter-interfaced systems.
The Self-stable transfer function of the internal voltage amplitude for the converter-interfaced systems is shown in Equation (11).
D S e l f _ E ( s )   path Δ A ˙ e = s N E d ( s ) Δ P e + s N E q ( s ) Δ Q e Δ P e = G d c 11 ( s ) Δ P e + G d c 12 ( s ) Δ Q e + G d c 13 ( s ) Δ A e Δ Q e = G d c 21 ( s ) Δ P e + G d c 22 ( s ) Δ Q e + G d c 23 ( s ) Δ A e
The En-stable transfer function of the internal voltage frequency for the converter-interfaced system is shown in Equation (12).
D E n _ E ( s )   path Δ A ˙ e = s N E d ( s ) Δ P e Δ ω e = N ω d ( s ) Δ P e + N ω q ( s ) Δ Q e Δ P e = G d c 14 ( s ) Δ ω e + G d c 13 ( s ) Δ A e + G d c 11 ( s ) Δ P e + G d c 12 ( s ) Δ Q e Δ Q e = G d c 24 ( s ) Δ ω e + G d c 23 ( s ) Δ A e + G d c 21 ( s ) Δ P e + G d c 22 ( s ) Δ Q e
Letting D A e ( s ) = D S e l f _ A e ( s ) + D E n _ A e ( s ) , this transfer function can be used to analyze the amplitude stability of converter-interfaced systems. Here, D A e ( s ) is referred to as the internal voltage amplitude motion equation.

3.3. Self-Stable and En-Stable Paths of Internal Voltage Frequency in Converter-Interfaced Systems

Similarly, to analyze the frequency stability of converter-interfaced systems, the Self-stable and En-stable paths of internal voltage frequency in converter-interfaced systems can be plotted separately following the aforementioned methodology. Based on the Self-stable and En-stable paths of internal voltage frequency, the corresponding Self-stable and En-stable transfer functions of internal voltage frequency can be derived, respectively.
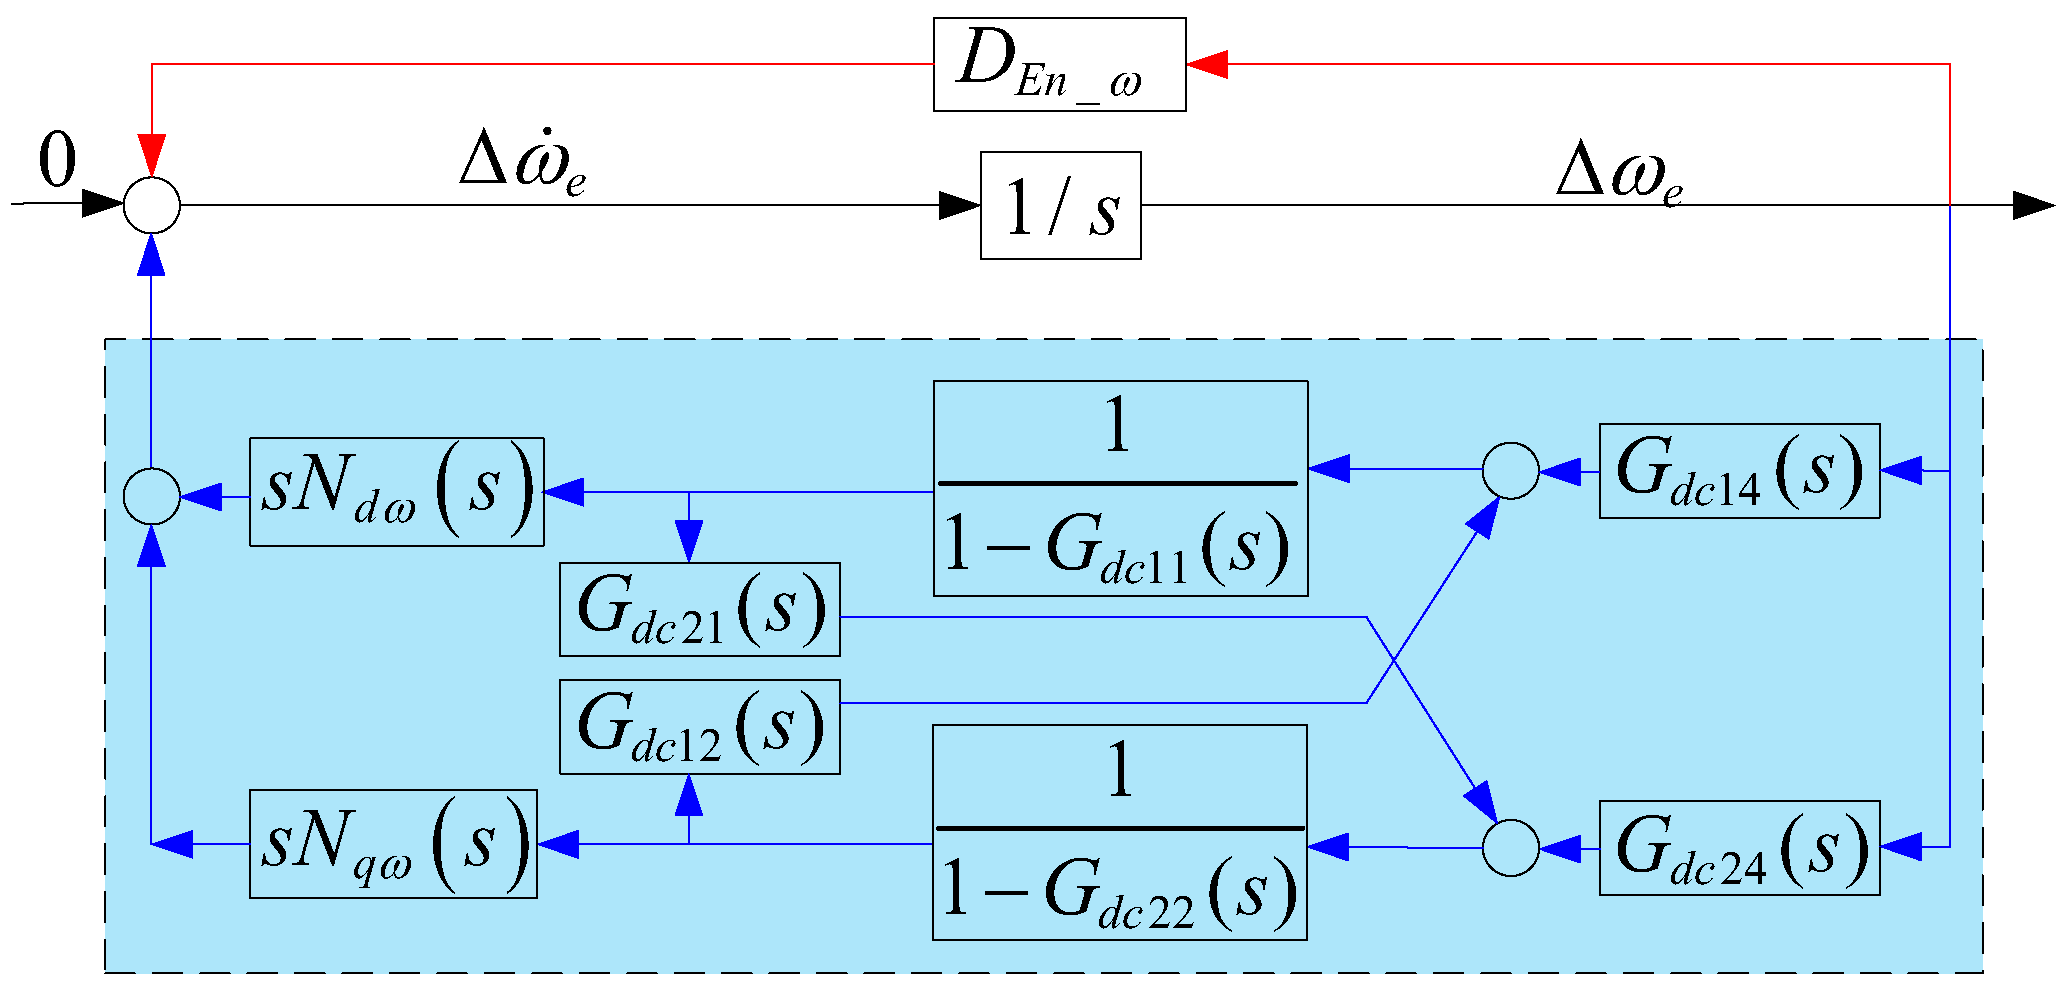
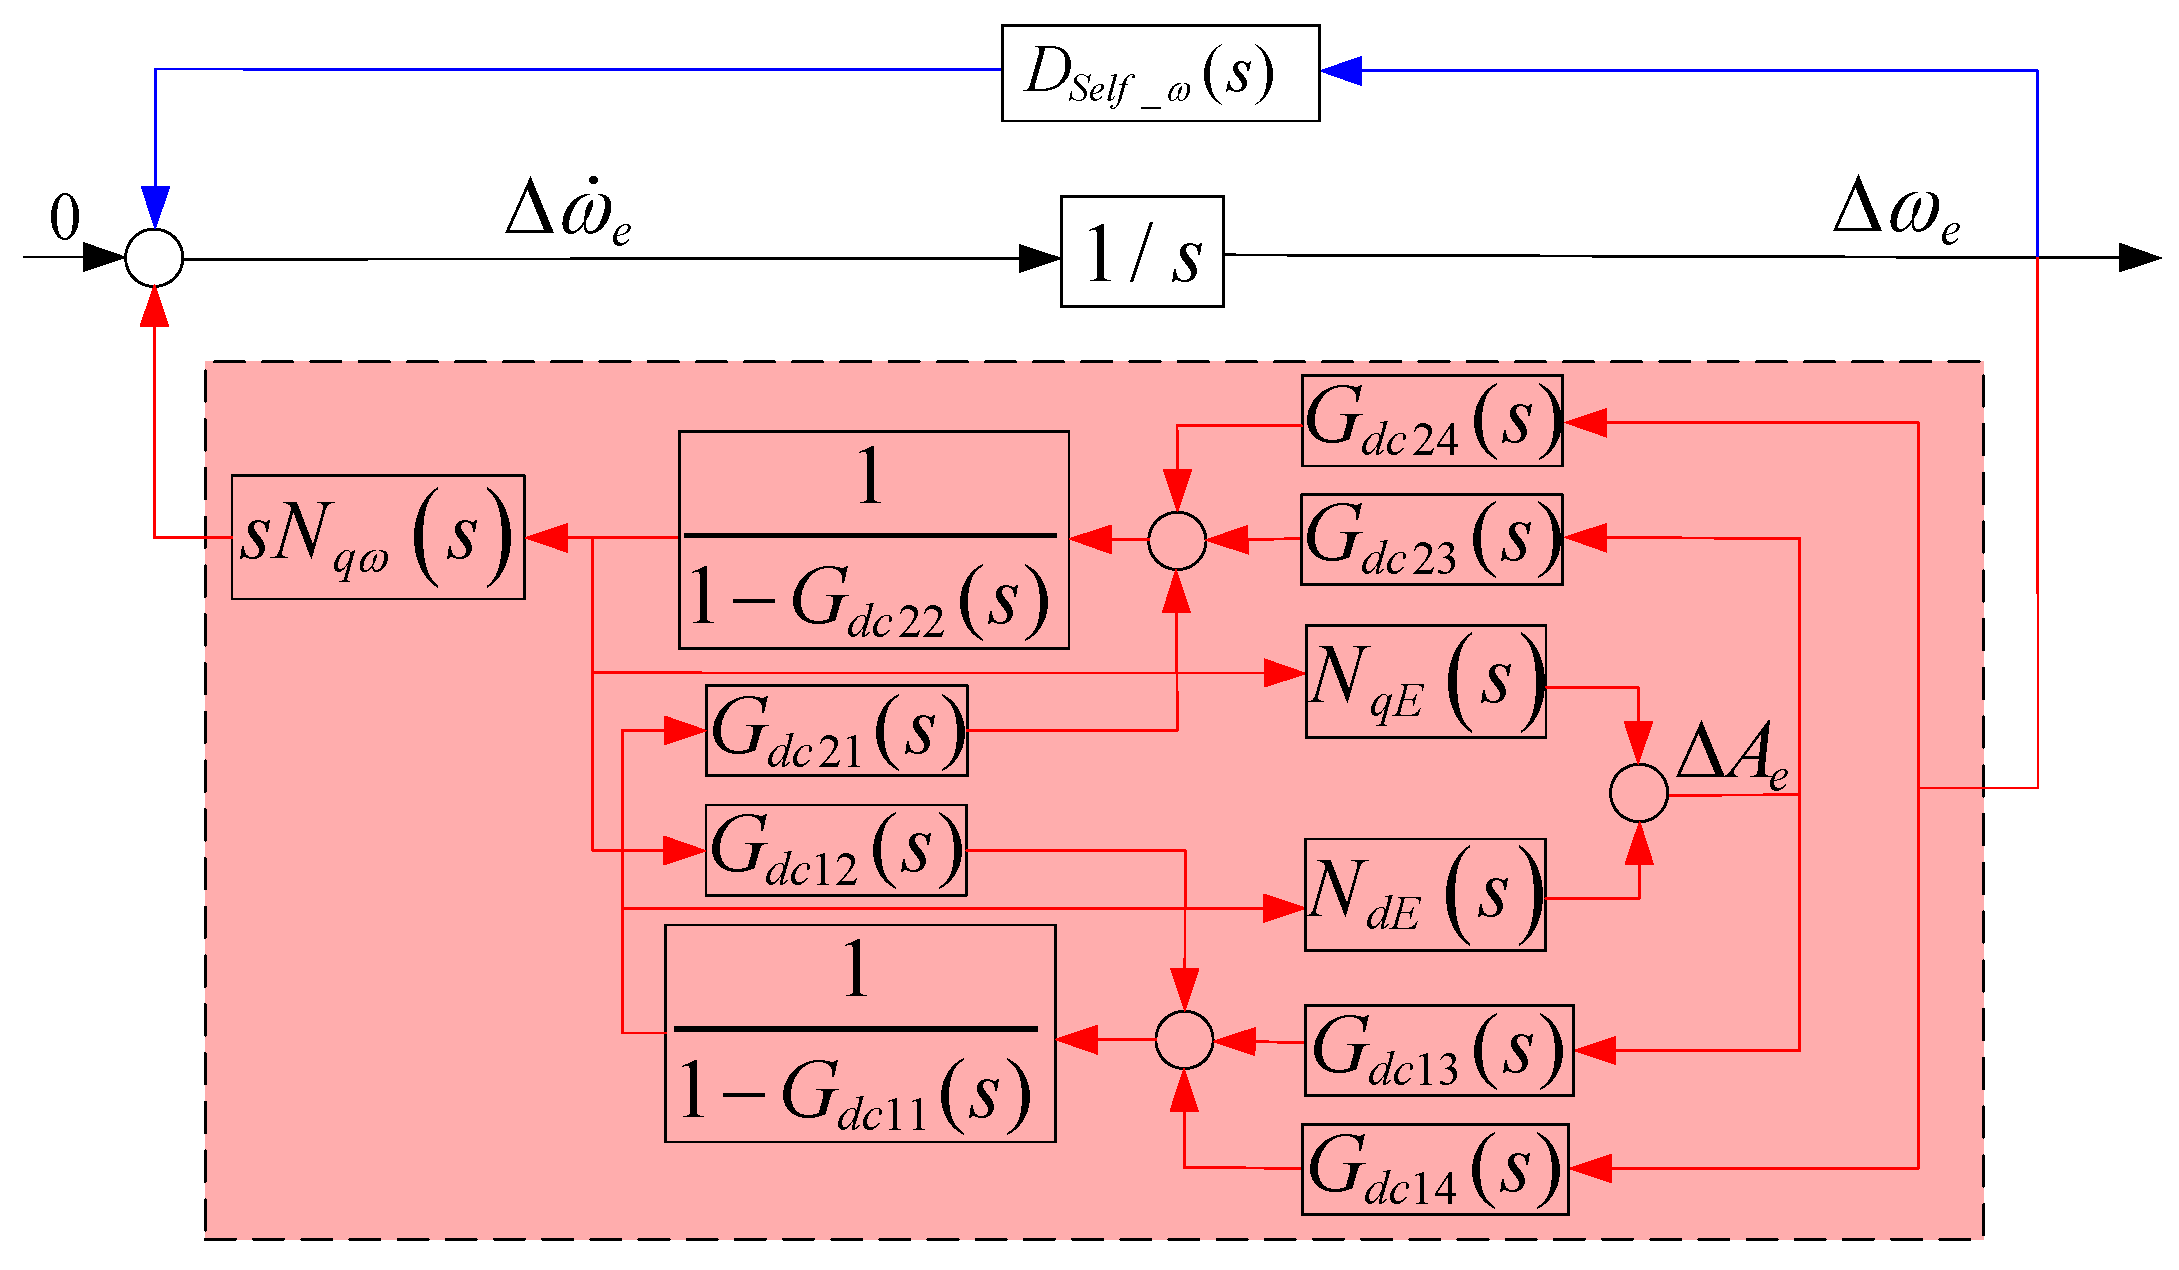
The Self-stable and En-stable path of internal voltage frequency in converter-interfaced systems is shown in Figure 12 and Figure 13. The Self-stable and En-stable path transfer function of internal voltage frequency in converter-interfaced systems is shown in Equations (13) and (14).
D S e l f _ ω ( s )   path Δ ω ˙ e = s N ω d ( s ) Δ P e + s N ω q ( s ) Δ Q e Δ P e = G d c 11 ( s ) Δ P e + G d c 12 ( s ) Δ Q e + G d c 14 ( s ) Δ A e Δ Q e = G d c 21 ( s ) Δ P e + G d c 22 ( s ) Δ Q e + G d c 24 ( s ) Δ A e
D E n _ ω ( s )   path Δ ω ˙ e = N ω q ( s ) Δ Q e Δ A e = N E q ( s ) Δ P e + N E q ( s ) Δ Q e Δ P e = G d c 14 ( s ) Δ ω e + G d c 13 ( s ) Δ A e + G d c 11 ( s ) Δ P e + G d c 12 ( s ) Δ Q e Δ Q e = G d c 24 ( s ) Δ ω e + G d c 23 ( s ) Δ A e + G d c 21 ( s ) Δ P e + G d c 22 ( s ) Δ Q e
Similarly, by setting D ω s = D S e l f _ ω s + D E n _ ω s , this transfer function can be used to analyze the frequency stability of converter-interfaced systems. Here, D v s c _ ω s is referred to as the internal voltage frequency motion equation.

4. Case Study

In this section, we utilize the Self-stability/En-stability analysis method from the previous section and the Self-stable/En-stable transfer functions of the internal voltage amplitude–frequency of converter-interfaced systems to analyze the influence of DC voltage control bandwidth (DCCB) and terminal voltage control bandwidth (TVCB) on the stability of the internal voltage amplitude/frequency in converter-interfaced systems. To validate the effectiveness of the theoretical analysis, a detailed nonlinear simulation model of the single-machine infinite-bus system, as depicted in Figure 1, was developed in the MATLAB/Simulink environment. The model incorporates the complete VSC control system, including DC voltage control, terminal voltage control, inner current control, and the PLL, with the detailed parameters of the VSC, controller, and system provided in Appendix A (Table A1).
For the validation, a specific disturbance scenario was applied to test the system’s small-signal stability. At t = 0.1 s, a 0.1 p.u. step change lasting 0.01 s was introduced to the converter’s DC-side input power P i n . By observing the dynamic response of key system variables (such as the internal voltage amplitude A e and frequency f e ) following this disturbance, we can assess the system’s stability and compare the results with the predictions from our theoretical analysis.

4.1. Stability of Internal Voltage Amplitude in Converter-Interfaced Systems

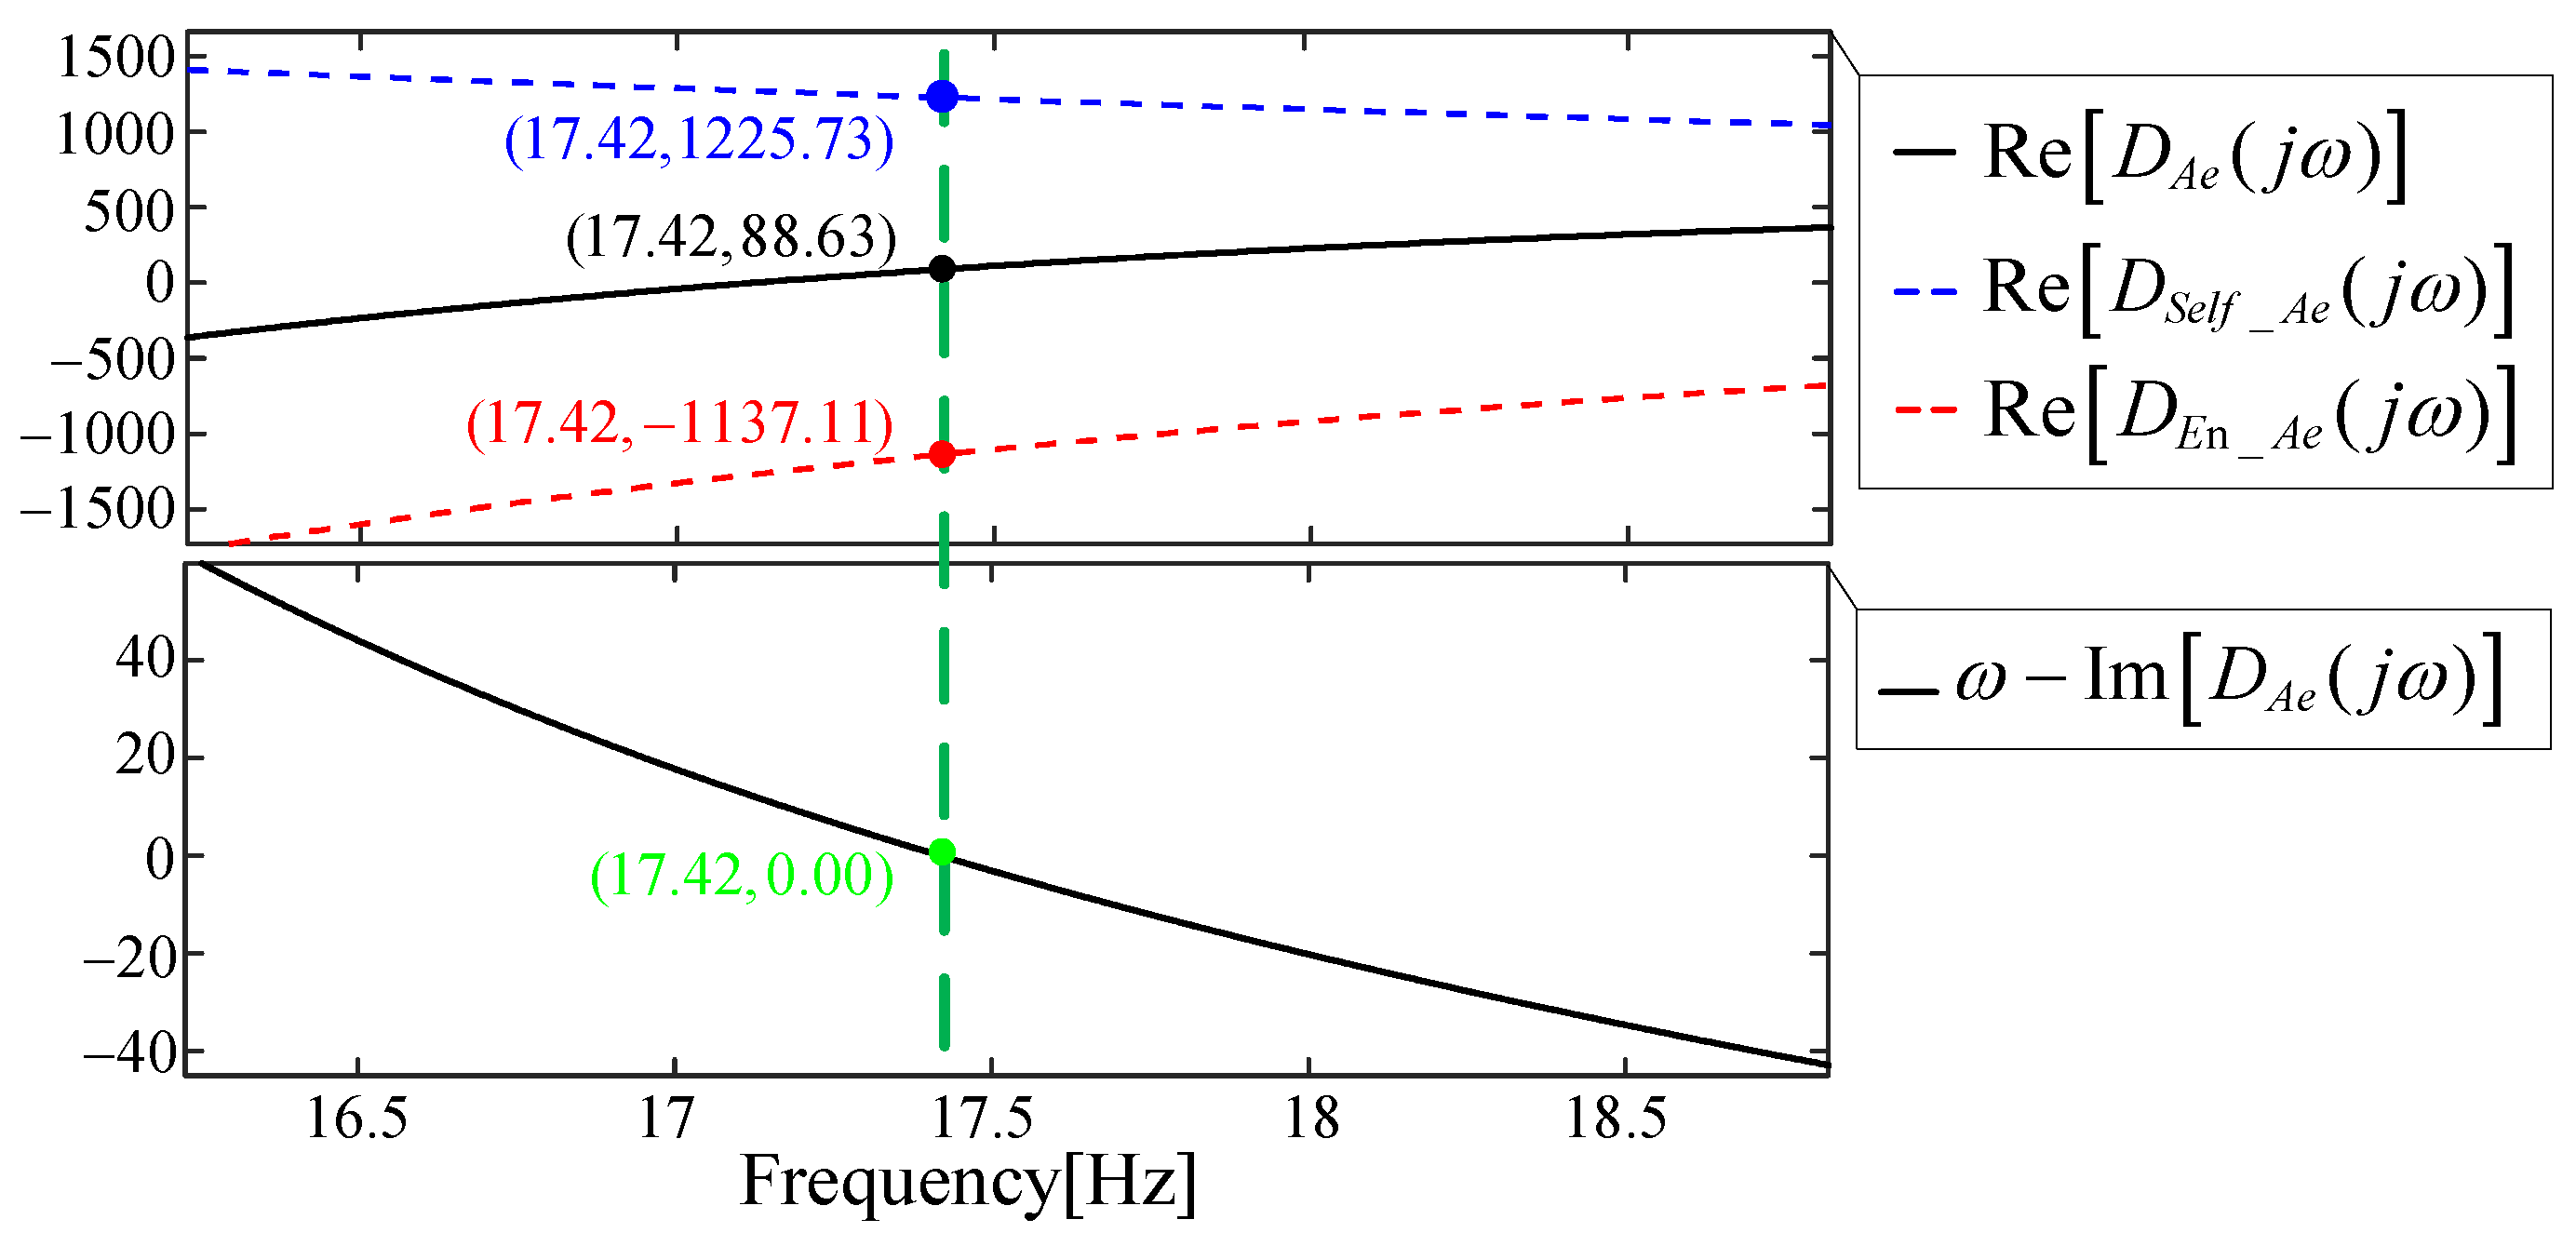
The frequency response curves of ω Im D A e j ω and Re D A e j ω near a certain stable critical point of the system are shown in Figure 14. It can be observed that the frequency response of ω Im D A e j ω crosses zero at a frequency of 17.42 Hz, and the derivative at the zero-crossing point is less than zero. Meanwhile, the real part of the frequency response of Re D A e j ω at this frequency is greater than zero.
According to the criterion, it can be concluded that the amplitude of the internal voltage is stable at this point, with positive values being favorable for stability and negative values being unfavorable for stability. Therefore, at this stage, the Self-stable path of the internal voltage amplitude is conducive to the stability of the internal voltage amplitude, while the En-stable path of the internal voltage amplitude is unfavorable for the stability of the internal voltage amplitude. Since the absolute value of the real part of the Self-stable path of the internal voltage amplitude is greater than that of the En-stable path of the internal voltage amplitude, the amplitude of the internal voltage is stable at this point.

4.1.1. Influence of DCCB on the Amplitude Stability of Internal Voltage in Converter-Interfaced Systems

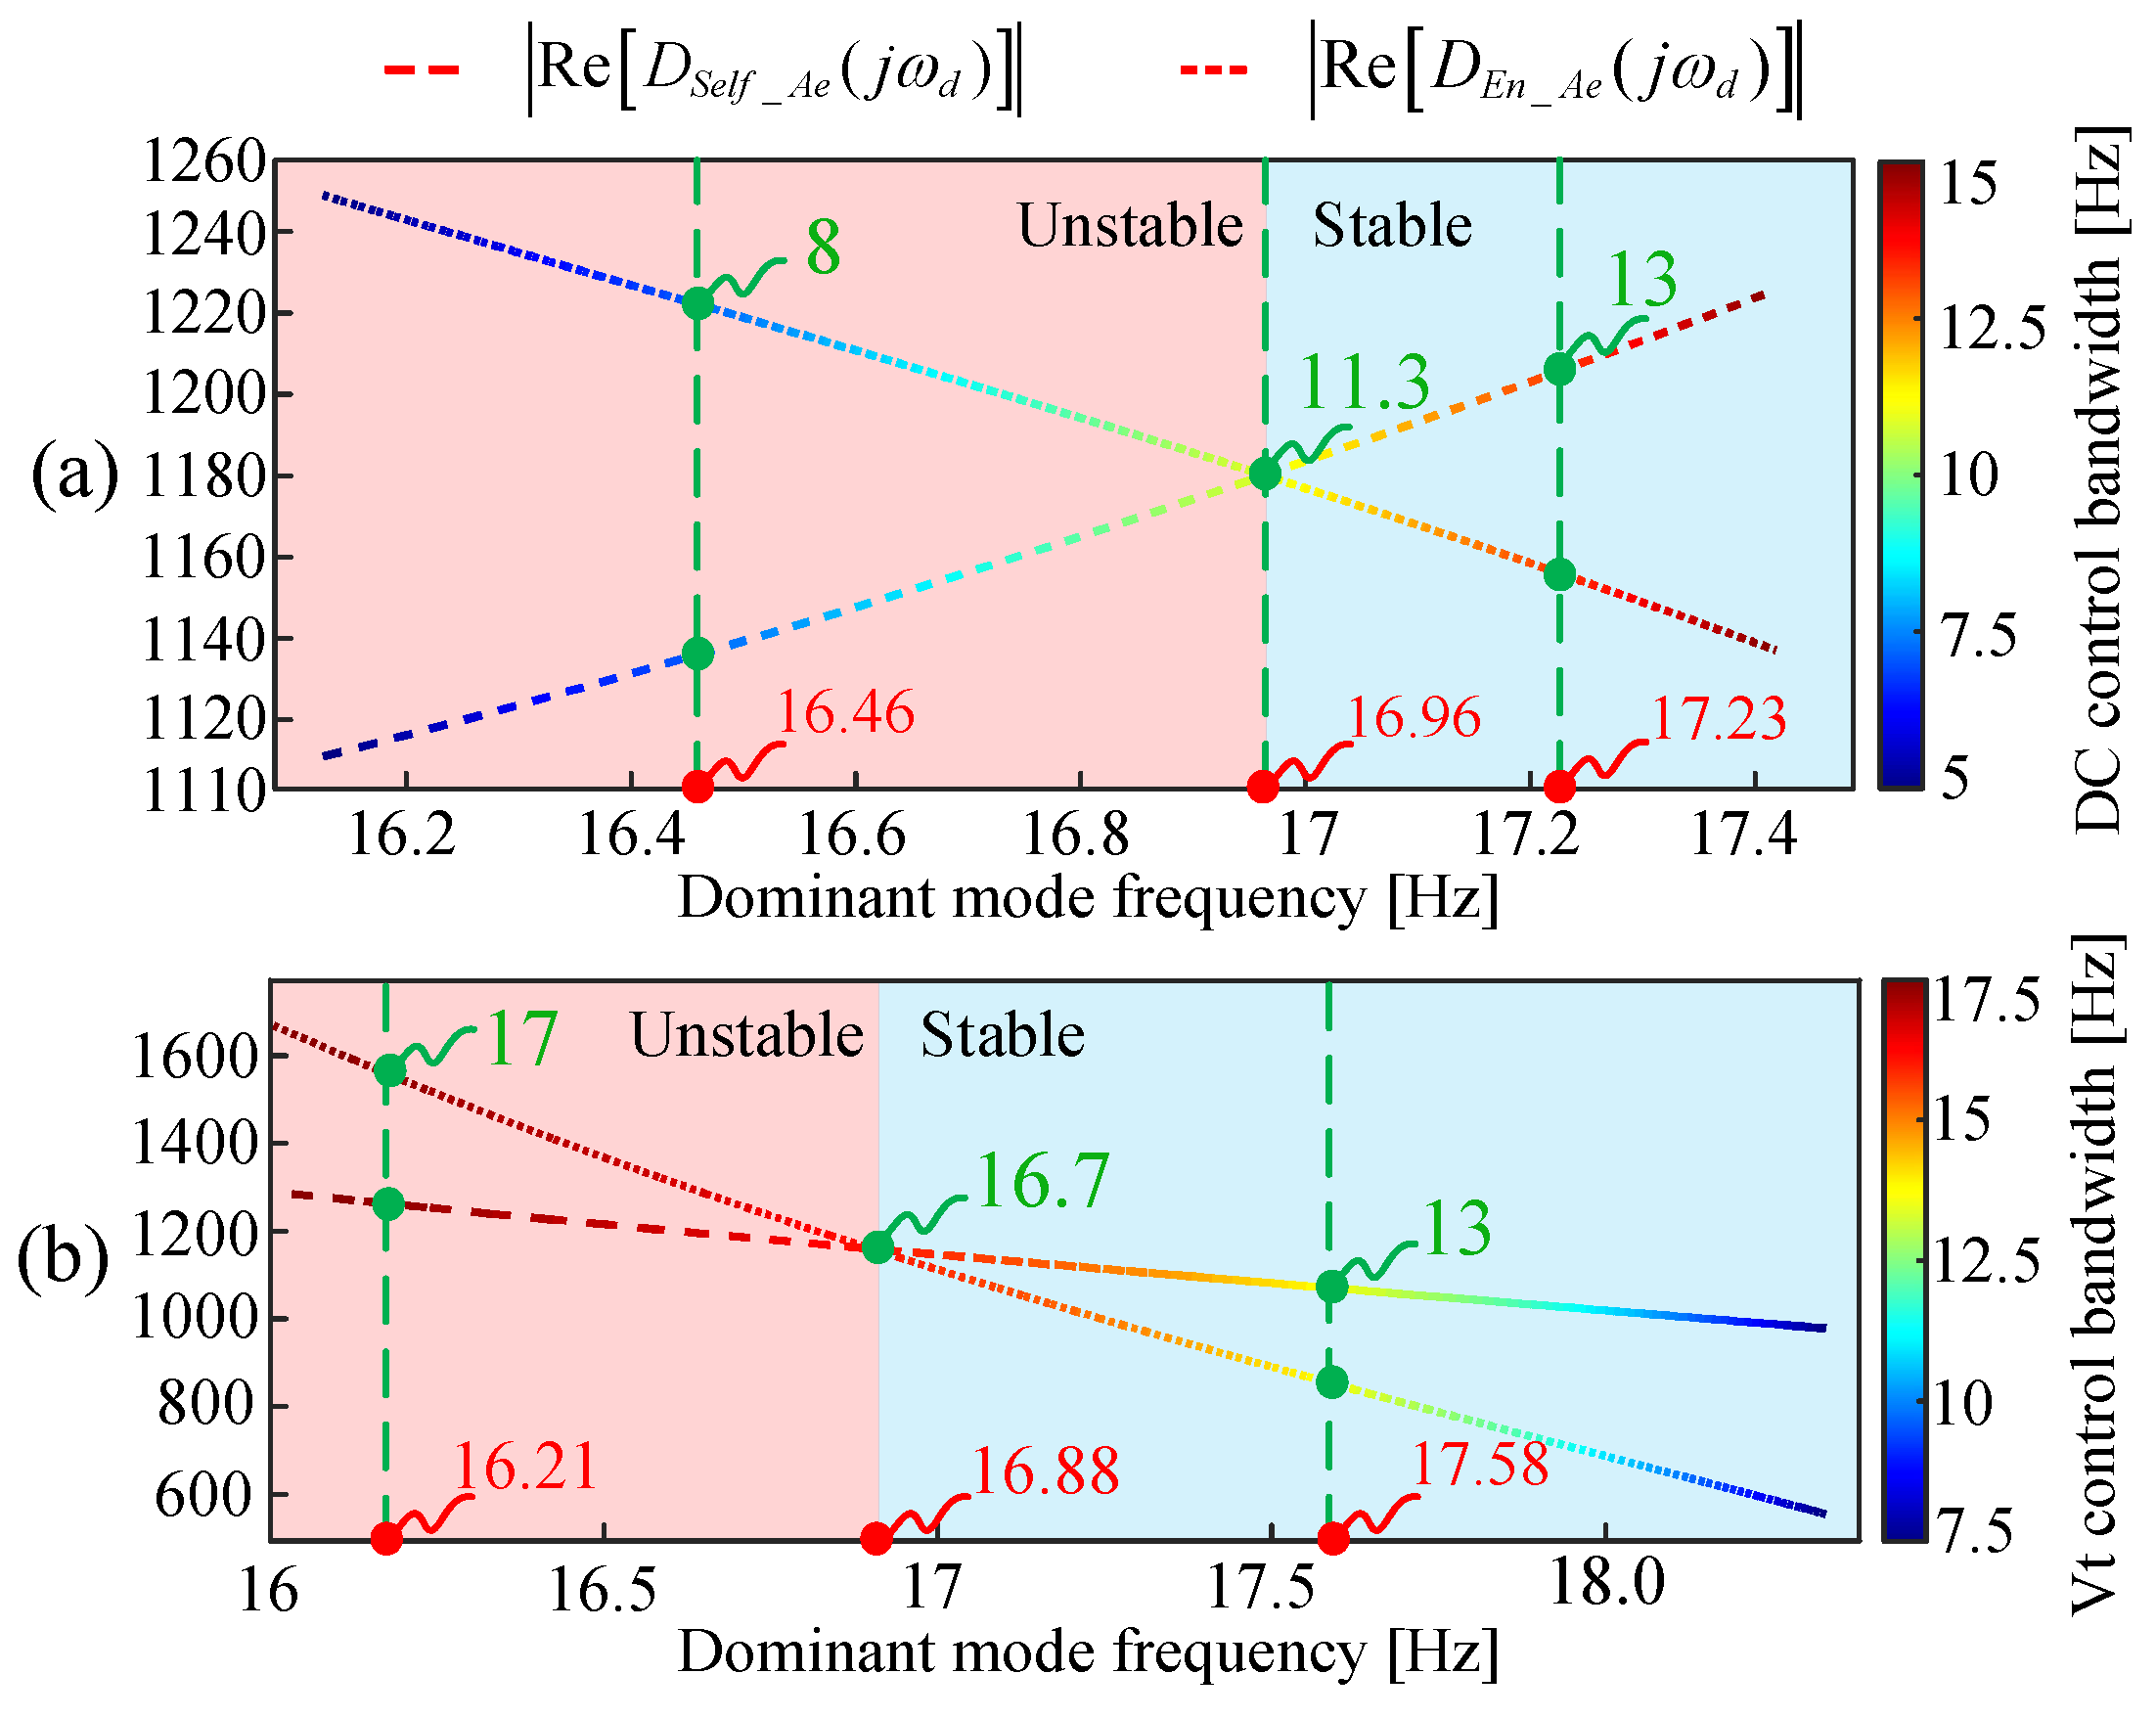
According to the stability criterion presented in the previous section, the frequency corresponding to the imaginary part’s zero-crossing point represents the dominant mode frequency of the motion equation. Therefore, we can plot the absolute value of the real part of the En-stable/Self-stable transfer function for the internal voltage amplitude motion equation and the variation of the dominant mode frequency with respect to the DC voltage control bandwidth.
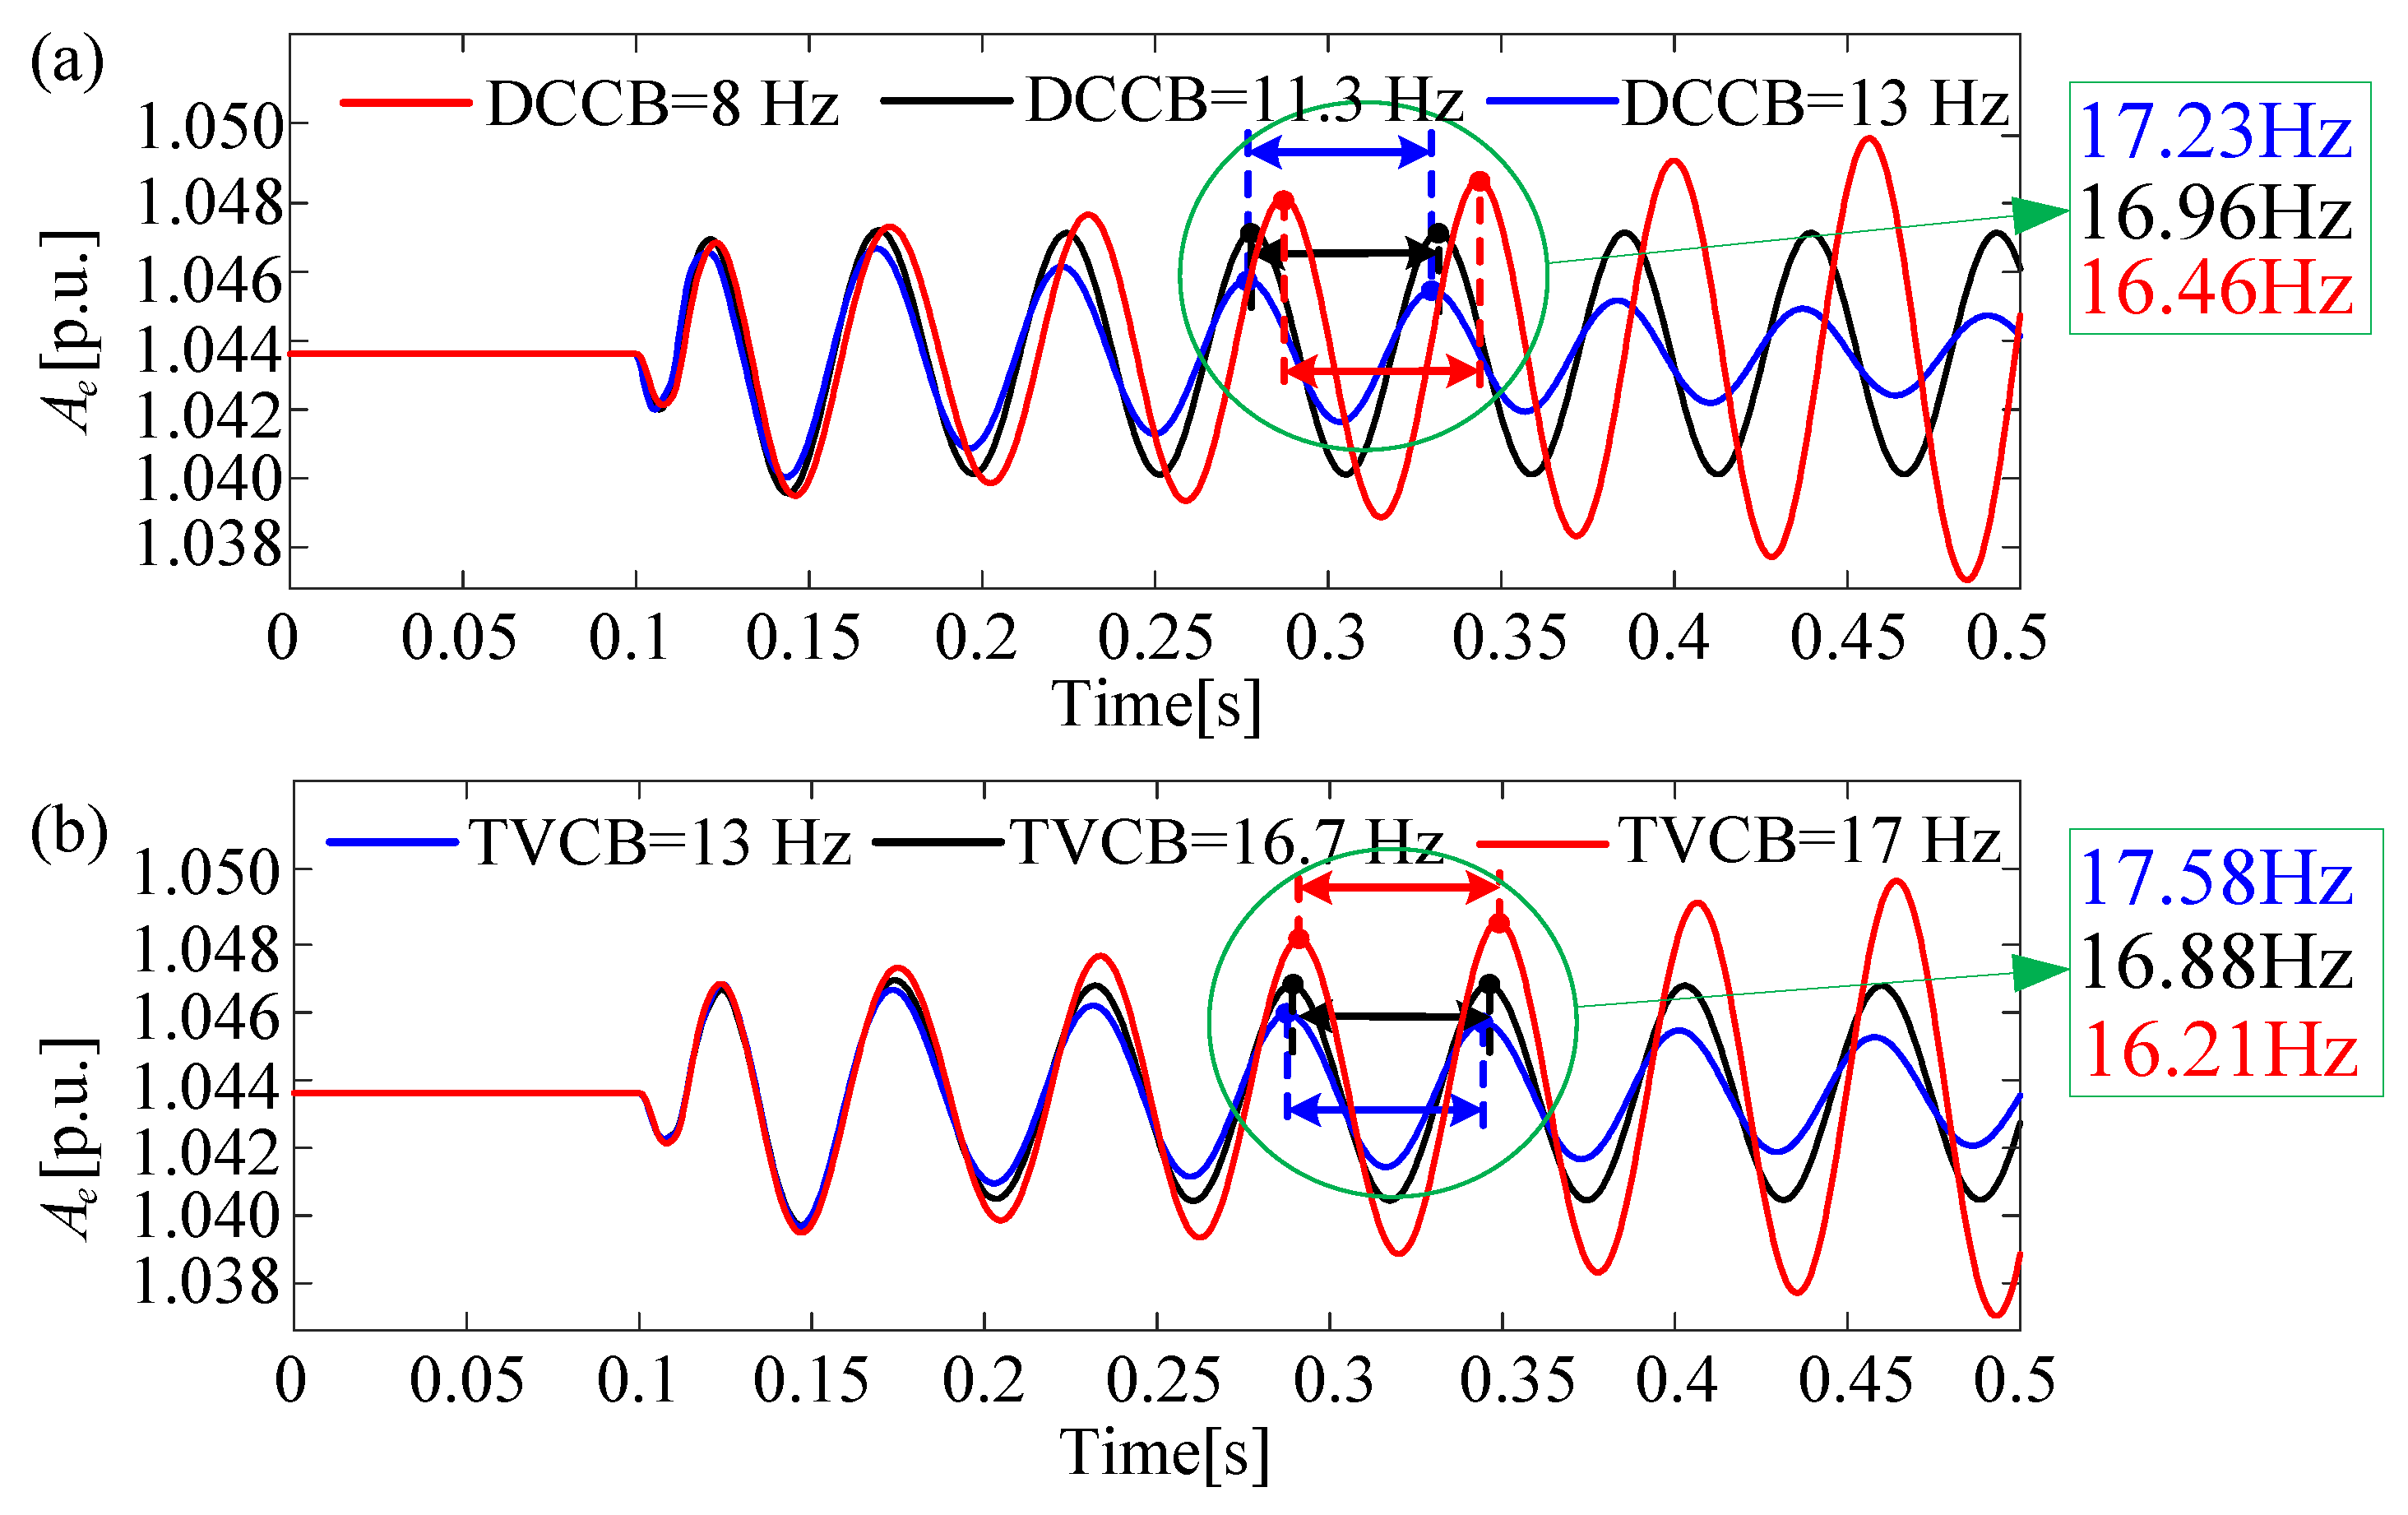
The Self-stable path benefits stability, while the En-stable path adversely affects stability. As observed in Figure 15a, where the green numbers represent the control bandwidth (Hz) and the red numbers represent the dominant mode frequency (Hz), when the DCCB decreases, the absolute value of the real part of the Self-stable path gradually decreases, while that of the En-stable path progressively increases. The system reaches critical stability when the DCCB is 11.3 Hz. Should the DCCB continue to decrease, the stabilizing capability of the Self-stable path would become inferior to the destabilizing effect of the En-stable path, resulting in internal voltage amplitude instability. To verify the correctness of the theoretical analysis, we set the DCCB to 8 Hz, 11.3 Hz, and 13 Hz, respectively. In Figure 15a, the corresponding dominant mode frequencies for these three DCCB values are 16.46 Hz, 16.96 Hz, and 17.23 Hz, respectively. It can be seen in the simulation waveform in Figure 16a that its oscillation frequency is consistent with the dominant mode oscillation frequency identified from the theoretical analysis.

4.1.2. Influence of TVCB on the Amplitude Stability of Internal Voltage in Converter-Interfaced Systems

The Self-stable path is conducive to stability, while the En-stable path is detrimental to stability. As shown in Figure 15b, when the TVCB increases, the absolute value of the real part of the Self-stable path gradually increases, and the absolute value of the real part of the En-stable path also increases. However, the absolute value of the real part of the En-stable path rises more rapidly with increasing TVCB. The system reaches a critical stability state when the TVCB is 16.7 Hz. If the TVCB continues to increase, the absolute value of the real part of the Self-stable path will become smaller than that of the En-stable path, at which point the internal voltage amplitude becomes unstable.
Similarly, for the TVCB, the correctness of the theoretical analysis can be verified by applying the same time-domain simulation analysis method and comparing Figure 16b with Figure 15b.

4.2. Stability of Internal Voltage Frequency in Converter-Interfaced Systems

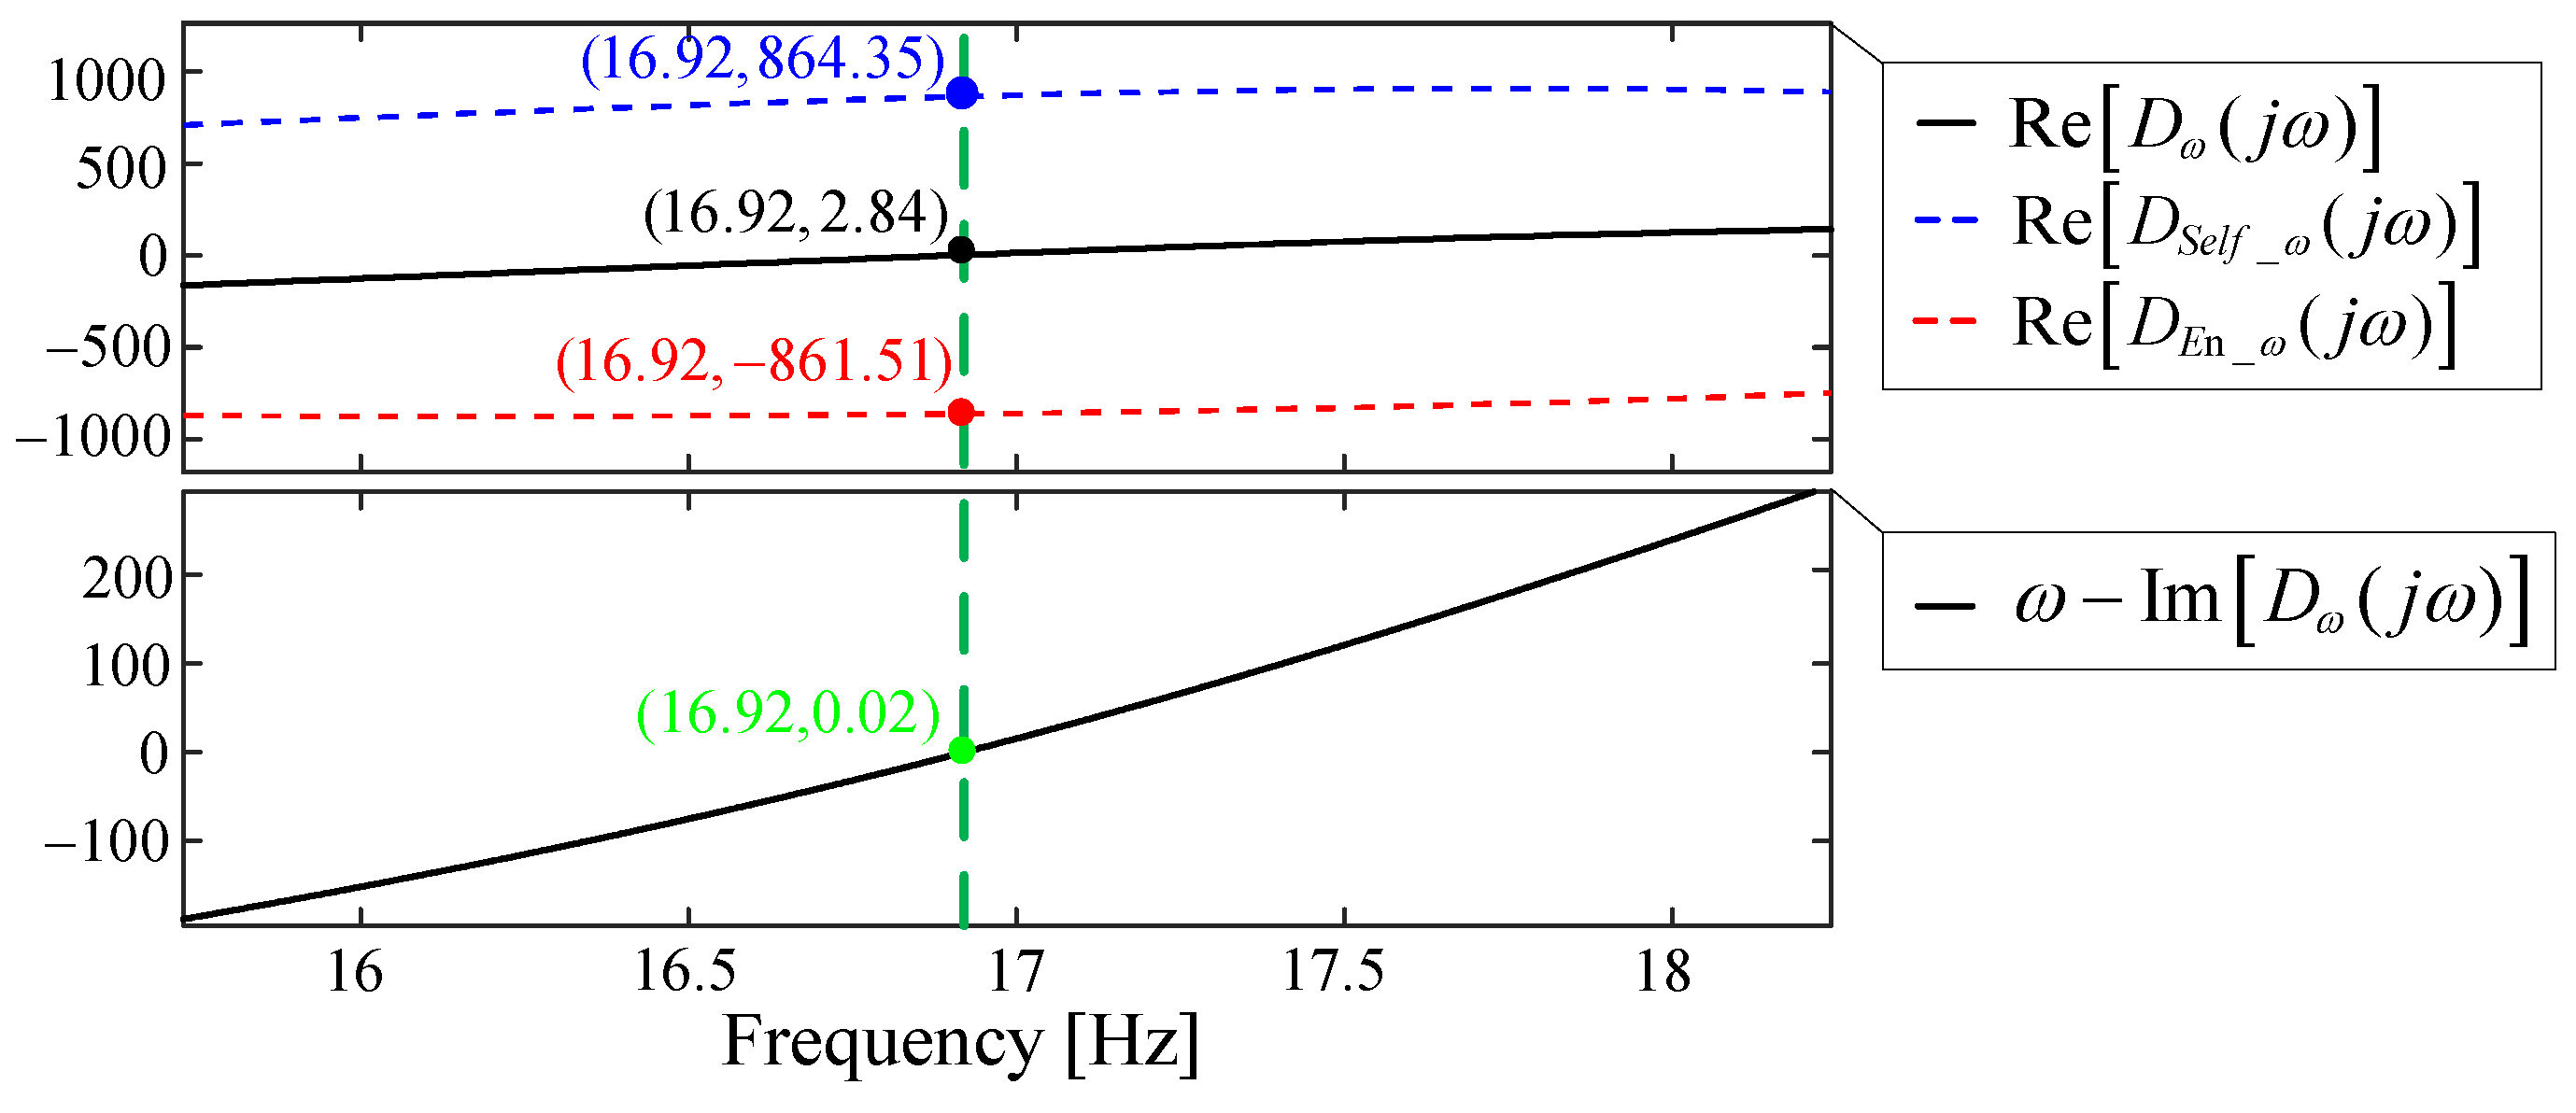
The frequency response curves of ω Im D ω j ω and Re D ω j ω near a certain stable critical point of the system are shown in Figure 17. It can be observed that the frequency response of ω Im D ω j ω crosses zero at a frequency of 16.92 Hz, and the derivative at the zero-crossing point is greater than zero. Meanwhile, the real part of the frequency response of Re D ω j ω at this frequency is greater than zero. According to the stability criterion, this indicates that the internal voltage frequency is currently unstable, where positive values are detrimental to stability, while negative values are beneficial to stability. Consequently, at this stage, the Self-stable path of the internal voltage frequency is unfavorable for frequency stability, whereas the En-stable path of the internal voltage frequency is favorable for frequency stability. Since the absolute value of the real part of the En-stable path is smaller than that of the Self-stable path, the internal voltage frequency is currently unstable.
To further investigate the key factors influencing this frequency stability and to validate our analytical framework, the following two subsections will detail the impact of two critical control parameters, the DCCB and the terminal TVCB, on the stability of the internal voltage frequency.

4.2.1. Influence of DCCB on the Frequency Stability of Internal Voltage in Converter-Interfaced Systems

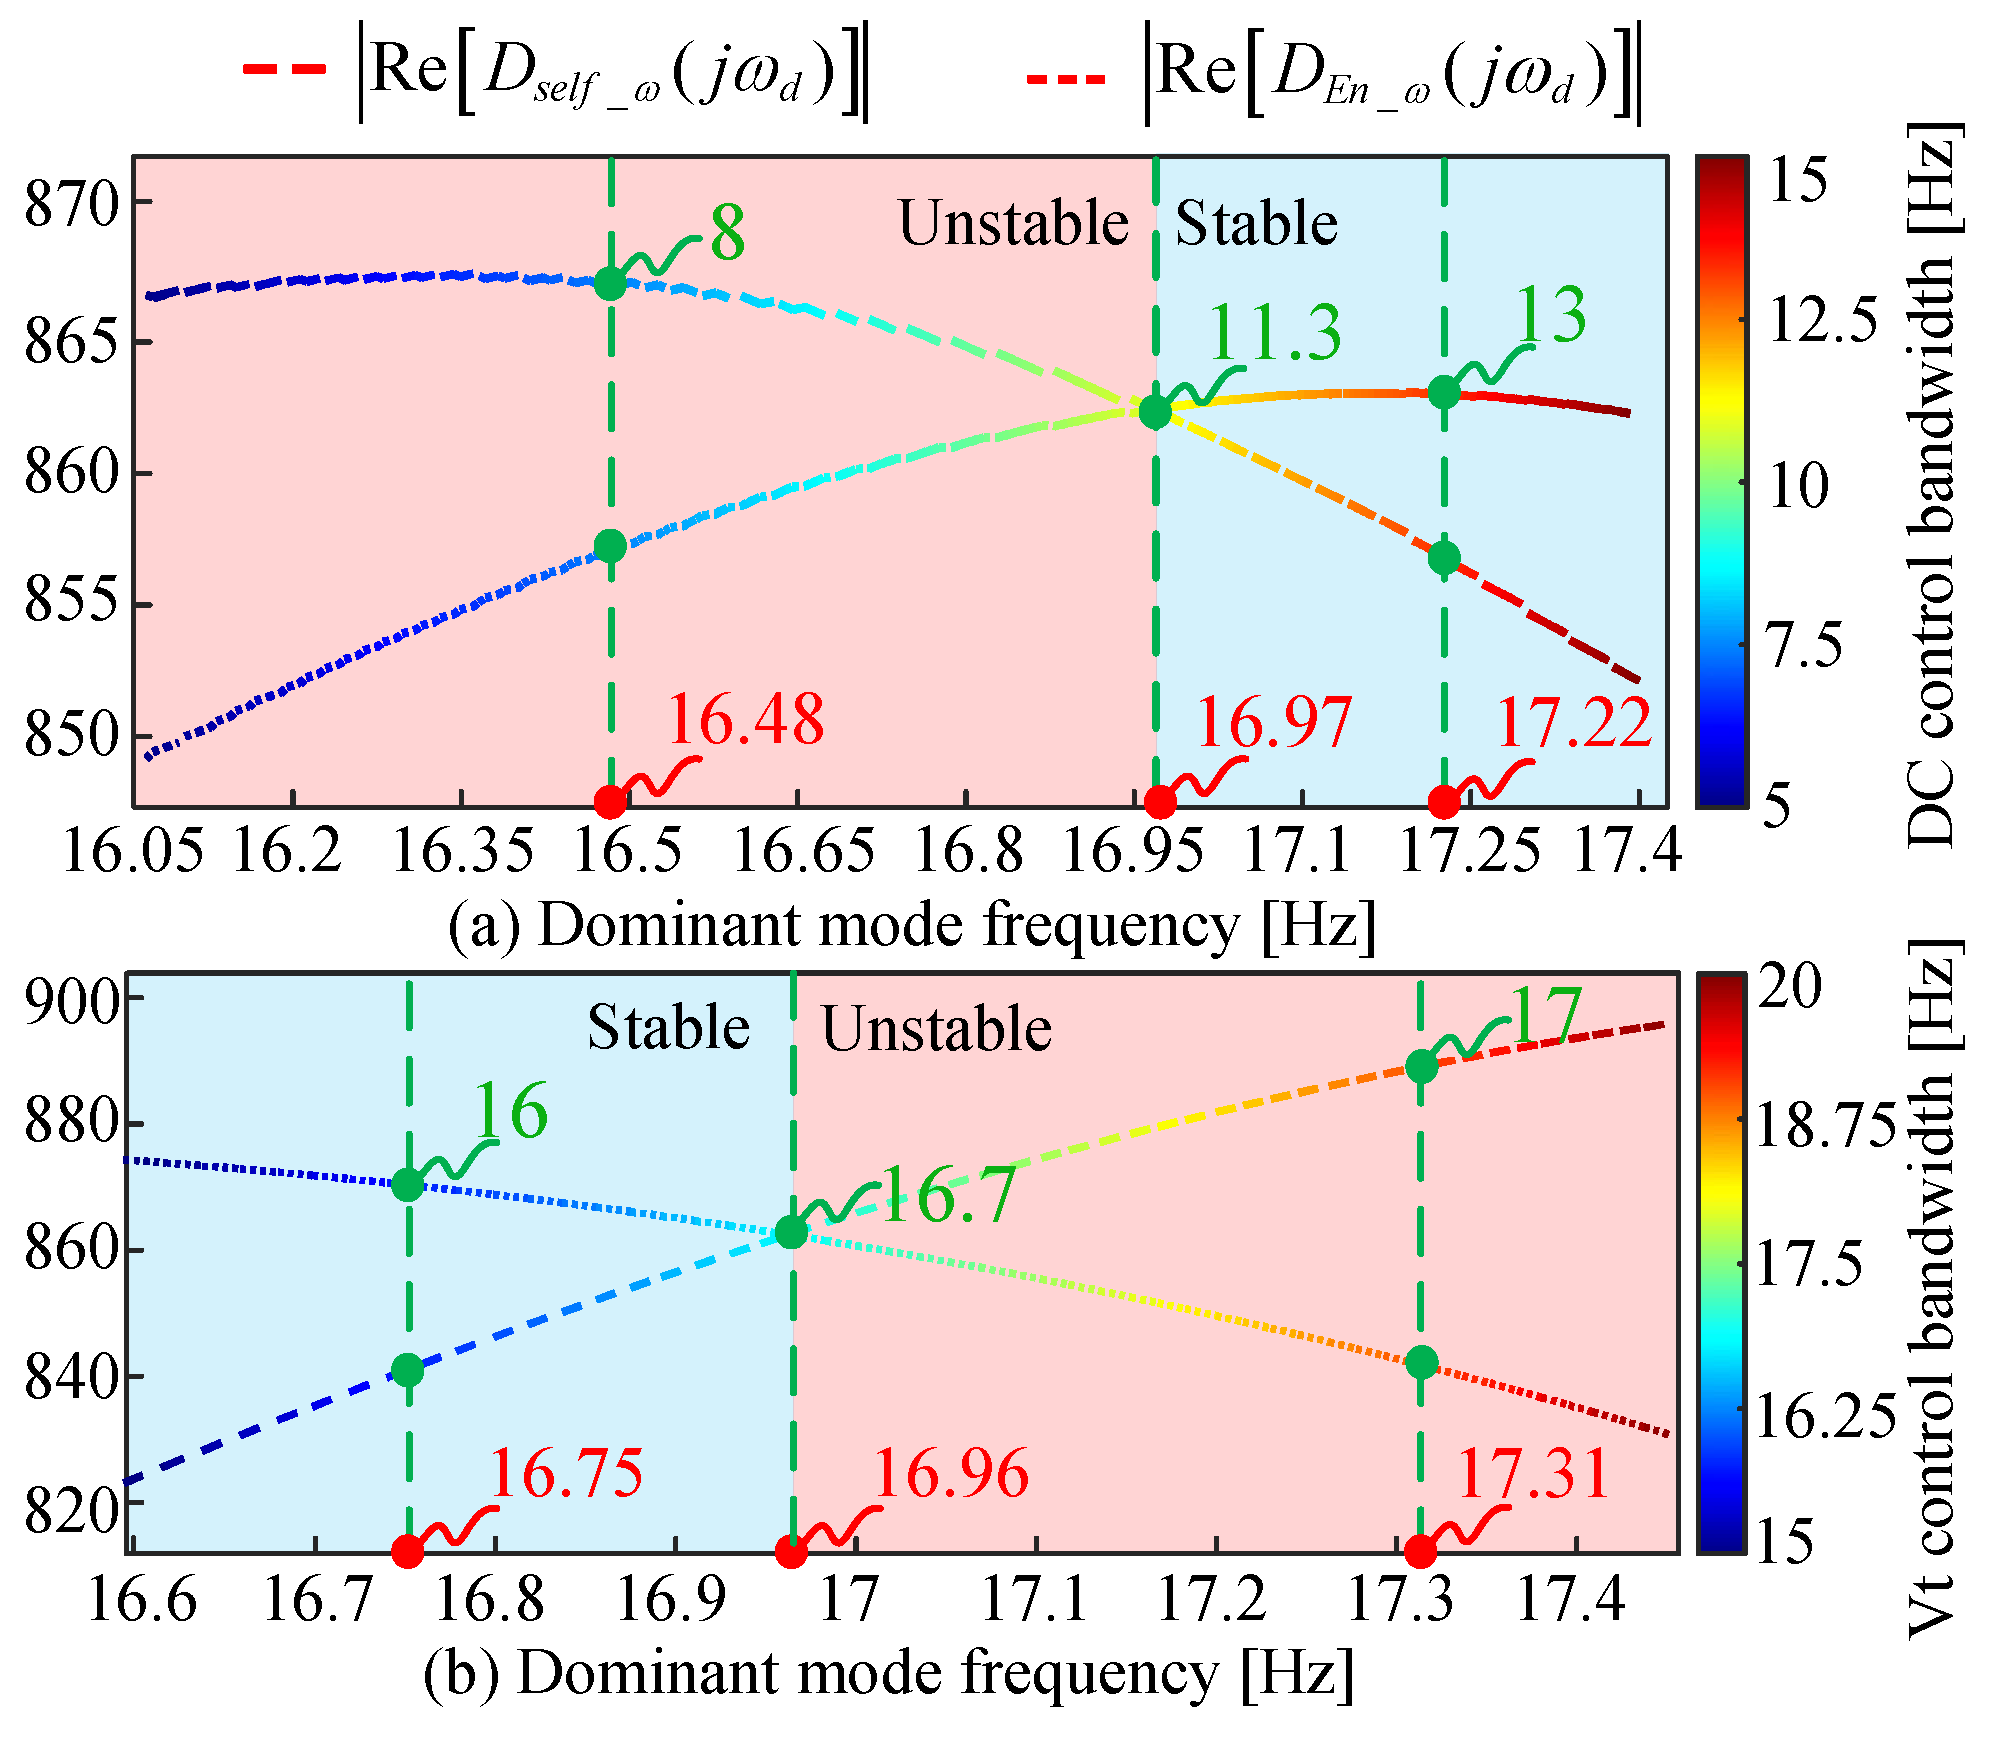
The Self-stable path is detrimental to stability, while the En-stable path is beneficial to stability. As shown in Figure 18a, when the DCCB decreases, the absolute value of the real part of the Self-stable path first increases and then decreases, and the same trend applies to the En-stable path. However, the absolute value of the real part of the Self-stable path rises more rapidly with the reduction in DCCB. The system reaches a critical stability state when the DCCB is 11.3 Hz. If the DCCB continues to decrease, the absolute value of the real part of the Self-stable path will become smaller than that of the En-stable path, at which point the internal voltage frequency loses stability.
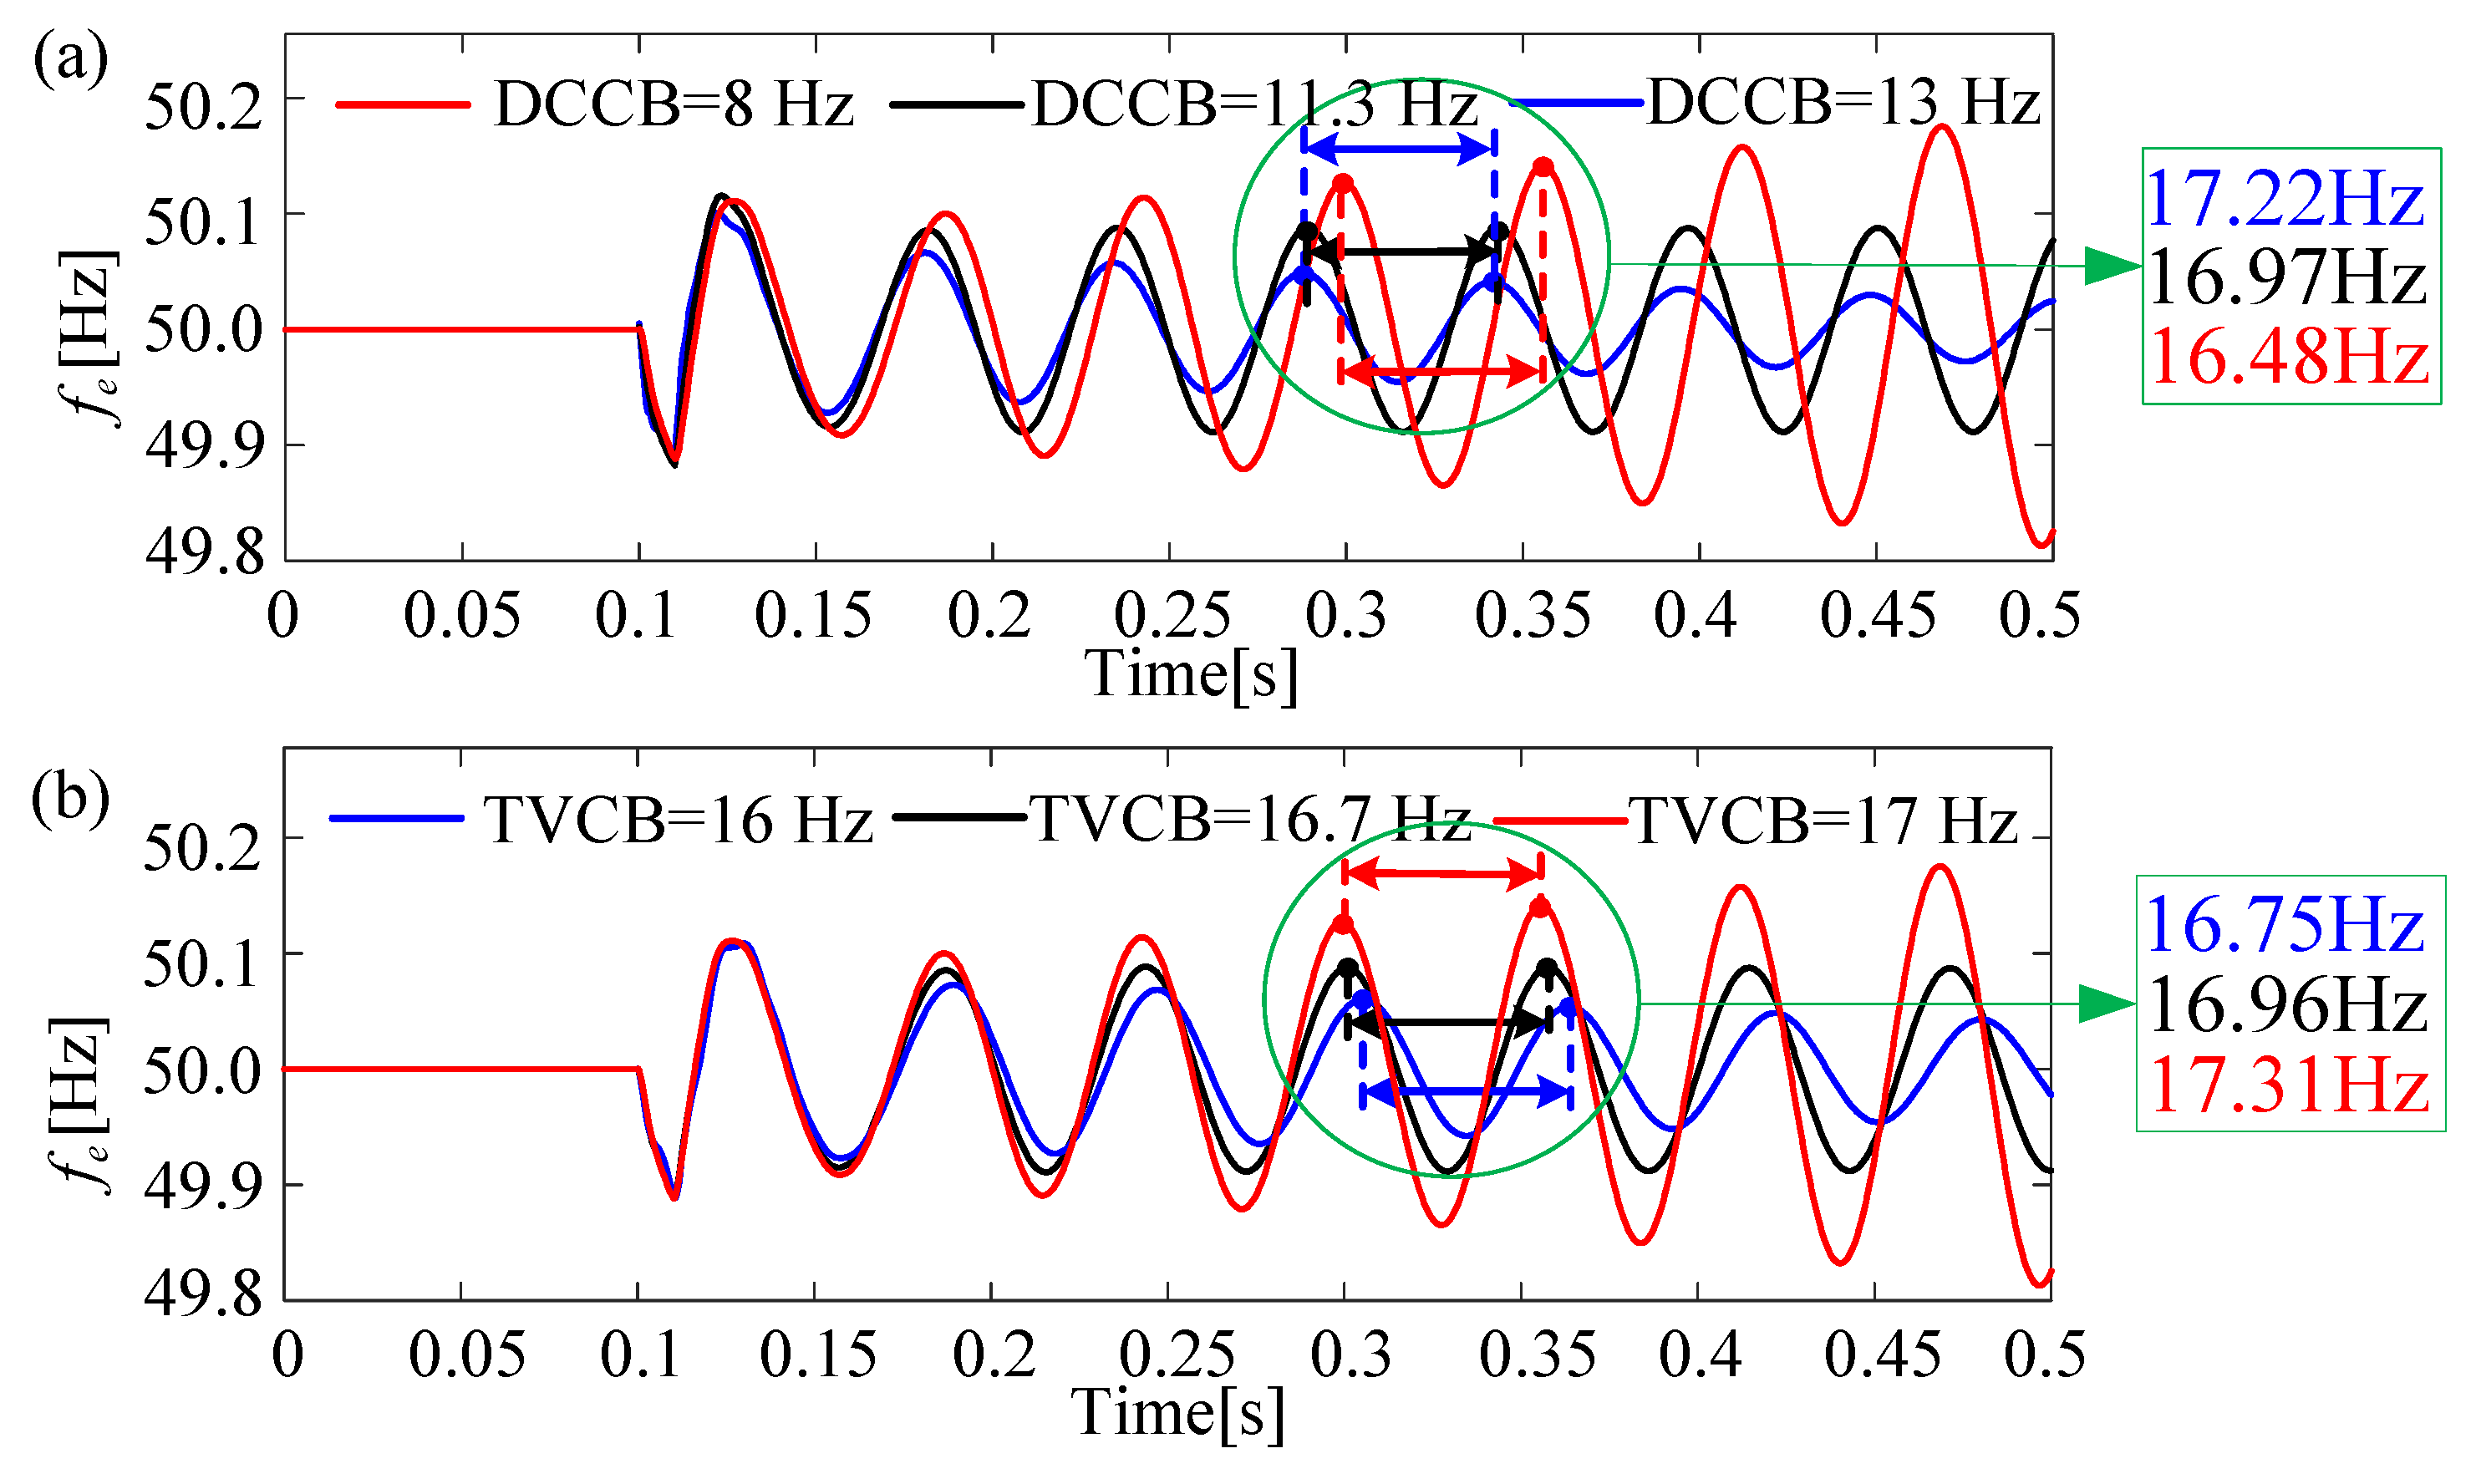
To verify the correctness of the theoretical analysis, we set the DCCB to 8 Hz, 11.3 Hz, and 13 Hz, respectively. In Figure 18a, the corresponding dominant mode frequencies for these three DCCB values are 16.48 Hz, 16.97 Hz, and 17.22 Hz. The simulation waveform in Figure 19a shows that its oscillation frequency is consistent with the dominant mode oscillation frequency identified from the theoretical analysis.

4.2.2. Influence of TVCB on the Frequency Stability of Internal Voltage in Converter-Interfaced Systems

The Self-stable path is detrimental to stability, while the En-stable path provides positive damping. As is evident from Figure 18b, when the TVCB increases, the absolute value of the real part of the Self-stable path rises, whereas the absolute value of the real part of the En-stable path declines. The system reaches a critical stability state when the TVCB reaches 16.7 Hz. Should the TVCB continue to increase beyond this point, the absolute value of the real part of the En-stable path will become smaller than that of the Self-stable path, resulting in loss of internal voltage frequency stability.
Similarly, for the TVCB, the correctness of the theoretical analysis can be verified by applying the same time-domain simulation analysis method and comparing Figure 18b with Figure 19b.

5. Conclusions

This paper proposes an amplitude–frequency DC operating point modeling method for AC networks, which enables the dynamic variations in network amplitude and frequency to be considered in the analysis of the DC voltage timescale. Then, based on the established simplified VSC DC voltage timescale model, the Self-stable and En-stable path method from SISO theory is employed to analyze the amplitude stability and frequency stability of the internal voltage of converter-interfaced systems. The analysis results indicate that near the small-signal stability boundary, for the internal voltage amplitude, the Self-stable path of the internal voltage amplitude enhances amplitude stability, while the En-stable path of the internal voltage amplitude weakens amplitude stability. However, for the internal voltage frequency, the Self-stable path of the internal voltage frequency weakens frequency stability, whereas the En-stable path of the internal voltage frequency enhances frequency stability.

6. Limitations and Future Work

Although this paper provides an insightful analytical framework, it has several limitations that also define our future research directions. This study is based on a simplified single-machine infinite-bus system and focuses solely on the stability of grid-following converters within the DC voltage timescale. Therefore, our future work will focus on extending this framework to complex multi-converter systems and systematically analyzing the stability mechanisms of grid-forming control strategies. Furthermore, we plan to conduct comprehensive practical verification through hardware-in-the-loop simulations and laboratory testbeds, as well as develop more advanced models to investigate cross-timescale coupling oscillations.

Author Contributions

Conceptualization, J.L. and S.W.; methodology, S.W.; formal analysis, J.L.; investigation, J.L.; resources, J.H.; data curation, J.L.; writing—original draft preparation, J.L.; writing—review and editing, S.W.; supervision, J.H.; project administration, J.H.; funding acquisition, J.H. All authors have read and agreed to the published version of the manuscript.

Funding

This paper and its related research are supported by grants from the Delta Power Electronics Science and Education Development Program of Delta Group.

Data Availability Statement

The original contributions presented in this study are included in the article; further inquiries can be directed to the corresponding author.

Conflicts of Interest

The authors declare that this study received funding from the Delta Power Electronics Science and Education Development Program of Delta Group. The funder was not involved in the study design, collection, analysis, interpretation of data, the writing of this article, or the decision to submit it for publication.

Appendix A. Parameters of Converter-Interfaced Systems

Table A1. Parameters of converter-interfaced systems.
NameParameterNameParameter
Sbase100 kVAUbase690 V
DC side power (Pdc)0.96 p.u.DC side voltage (Udc)1200 V
DC side capacitor (Cdc)1.68 mFFilter inductance (Lf)0.15 p.u.
Grid frequency50 HzFilter capacitor (Cf)0.08 p.u.
Line inductance (Lg)0.6 p.u.DC voltage controlPI1: 2/200
Terminal voltage controlPI2: 1/100Current controlPI3: 1.2/800
PLLPI4: 90/20,000\\

Appendix B. Derivation Process of Equations (2)–(5)

Differentiating both sides of Equation (2) with respect to the time variable t yields
A ˙ u ( t ) + j ω u ( t ) A u ( t ) e j ω u ( t ) d t = 1 C A i ( t ) e j ω i ( t ) d t
Combining the exponential terms yields
A ˙ u ( t ) + j ω u ( t ) A u ( t ) = 1 C A i ( t ) e j ω i ( t ) ω u ( t ) d t
Applying Euler’s formula to expand the exponential term into trigonometric form yields
A ˙ u ( t ) + j ω u ( t ) A u ( t ) = 1 C A i ( t ) cos ω i ( t ) ω u ( t ) d t + j sin ω i ( t ) ω u ( t ) d t
The complex equation is decomposed into real and imaginary parts, yielding the dynamic equations for amplitude and frequency, as shown in Equation (2) and Equation (3), respectively.
By applying small-signal linearization to Equations (2) and (3), we derive linearized Equations (4) and (5).

Appendix C. Small-Signal Model of Converter-Interfaced Systems

This section provides a detailed description of the small-signal model of converter-interfaced systems established in Simulink.
Filter inductor Lf constraint:
Δ A i f = 2 P e 0 3 A e 0 P e 0 2 + Q e 0 2 Δ P e + 2 Q e 0 3 A e 0 P e 0 2 + Q e 0 2 Δ Q e 2 P e 0 2 + Q e 0 2 3 A e 0 2 Δ A e
Δ ω e Δ ω i f = s P e 0 Δ Q e Q e 0 Δ P e P e 0 2 + Q e 0 2
Δ A t Δ ω t = G A ω 11 ( s ) G A ω 12 ( s ) G A ω 13 ( s ) G A ω 14 ( s ) G A ω 21 ( s ) G A ω 22 ( s ) G A ω 23 ( s ) G A ω 24 ( s ) Δ A e Δ ω e Δ A i g Δ ω i g
G A ω 11 ( s ) = A e 0 cos θ e t 0 ,   G A ω 12 ( s ) = A e 0 s sin θ e t 0
G A ω 13 ( s ) = L f ( s cos θ t i f 0 + ω i f 0 sin θ t i f 0 ) ,   G A ω 14 ( s ) = L f A i f 0 ω i f 0 s cos θ t i f 0 sin θ t i f 0
G A ω 21 ( s ) = A e 0 A t 0 s sin θ e t 0 ,   G A ω 22 ( s ) = A e 0 A t 0 cos θ e t 0
G A ω 23 ( s ) = L f A t 0 s 2 sin θ t i f 0 s ω i f 0 cos θ t i f 0 ,   G A ω 24 ( s ) = L f A i f 0 A t 0 s cos θ t i f 0 + ω i f 0 sin θ t i f 0
Particular small-signal model of the internal control loop:
Δ I d Δ I q = cos θ i p 0 A i f 0 sin θ i p 0 / s A i f 0 sin θ i p 0 / s sin θ i p 0 A i f 0 cos θ i p 0 / s A i f 0 cos θ i p 0 / s Δ A i f Δ ω i f Δ ω p
Δ U d c = 1 s C U d c 0 Δ P e
Δ I d r e f Δ I q r e f = G k d c 0 0 G k A t Δ U d c Δ A t
Δ ε I d Δ ε I q = 1 1 0 0 0 0 1 1 Δ I d r e f Δ I d Δ I q r e f Δ I q
Δ e d Δ e q = G k c ( s ) 0 0 G k c ( s ) Δ ε I d Δ ε I q
Δ ω p l l = G k p l l ( s ) cos θ t p 0 s + G k p l l ( s ) cos θ t p 0 Δ ω t
Δ ω e = s e d 0 Δ e q e q 0 Δ e d e d 0 2 + e q 0 2 + Δ ω p l l
Small-signal model of network:
Inductance Lg:
Δ A i g Δ ω i g = G L g 11 G L g 12 G L g 21 G L g 22 Δ A t Δ ω t
G L g 11 = s cos θ t i g 0 + ω i g 0 sin θ t i g 0 s 2 + ω i g 0 2 L g ,   G L g 12 = ω i g 0 A t 0 cos θ t i g 0 s A t 0 sin θ t i g 0 s s 2 + ω i g 0 2 L g
G L g 21 = s 2 sin θ t i g 0 s ω i g 0 cos θ t i g 0 s 2 + ω i g 0 2 L g A i g 0 ,   G L g 22 = ω i g 0 A t 0 sin θ t i g 0 + s A t 0 cos θ t i g 0 s 2 + ω i g 0 2 A i g 0 L g
Filter capacitor Cf:
Δ A t Δ ω t = G C f 11 G C f 12 G C f 13 G C f 14 G C f 21 G C f 22 G C f 23 G C f 24 Δ A i f Δ ω i f Δ A i g Δ ω i g
G C f 11 = s cos θ i f t 0 + ω i g 0 sin θ i f t 0 s 2 + ω t 0 2 C f ,   G C f 12 = ω t 0 A i f 0 cos θ i f t 0 s A i f 0 sin θ i f t 0 s s 2 + ω t 0 2 C f
G C f 13 = s cos θ i g t 0 + ω t 0 sin θ i g t 0 s 2 + ω t 0 2 C f ,   G C f 14 = ω t 0 A i g 0 cos θ i g t 0 s A i g 0 sin θ i g t 0 s s 2 + ω t 0 2 C f
G C f 21 = s 2 sin θ i f t 0 s ω t 0 cos θ i f t 0 s 2 + ω t 0 2 C i f A t 0 ,   G C f 22 = ω t 0 A i f 0 sin θ i f t 0 + s A i f 0 cos θ i f t 0 s 2 + ω t 0 2 A t 0 C f
G C f 23 = s 2 sin θ i g t 0 s ω t 0 cos θ i g t 0 s 2 + ω t 0 2 C f A t 0 ,   G C f 24 = ω t 0 A i g 0 sin θ i g t 0 + s A i g 0 cos θ i g t 0 s 2 + ω t 0 2 A t 0 C f
Filter inductor Lf:
Δ A i f Δ ω i f = G L f 11 G L f 12 G L f 13 G L f 14 G L f 21 G L f 22 G L f 23 G L f 24 Δ A e Δ ω e Δ A t Δ ω t
G L f 11 = s cos θ e i f 0 + ω i f 0 sin θ e i f 0 s 2 + ω i f 0 2 L f ,   G L f 12 = ω i f 0 A e 0 cos θ e i f 0 s A e 0 sin θ e i f 0 s s 2 + ω i f 0 2 L f
G L f 13 = s cos θ t i f 0 + ω i f 0 sin θ t i f 0 s 2 + ω i f 0 2 L f ,   G L f 14 = ω i f 0 A t 0 cos θ t i f 0 s A t 0 sin θ t i f 0 s s 2 + ω i f 0 2 L f
G L f 21 = s 2 sin θ e i f 0 s ω i f 0 cos θ e i f 0 s 2 + ω i f 0 2 L f A i f 0 ,   G L f 22 = ω i f 0 A e 0 sin θ e i f 0 + s A e 0 cos θ e i f 0 s 2 + ω i f 0 2 A i f 0 L f
G L f 23 = s 2 sin θ t i f 0 s ω i f 0 cos θ t i f 0 s 2 + ω i f 0 2 L f A i f 0 ,   G L f 24 = ω i f 0 A t 0 sin θ t i f 0 + s A t 0 cos θ t i f 0 s 2 + ω i f 0 2 A i f 0 L f
Active and reactive power at the internal voltage:
Δ P e Δ Q e = 3 2 A i f 0 cos θ e i f 0 A e 0 A i f 0 sin θ e i f 0 / s A e 0 cos θ e i f 0 A e 0 A i f 0 sin θ e i f 0 / s A i f 0 sin θ e i f 0 A e 0 A i f 0 cos θ e i f 0 / s A e 0 sin θ e i f 0 A e 0 A i f 0 cos θ e i f 0 / s Δ A e Δ ω e Δ A i f Δ ω i f

References

  1. Hu, J.; Guo, Z.; Zhu, J.; Kurths, J.; Hou, Y.; Du, B.; Wu, Z.; Zhao, G.; Liu, Y.; Xin, K.; et al. Electromagnetic Dynamic Stability Analysis of Power Electronics-Dominated Systems Using Eigenstructure-Preserved LTP Theory. Nat. Commun. 2025, 16, 6852. [Google Scholar] [CrossRef] [PubMed]
  2. Peng, Q.; Fang, J.; Yang, Y.; Liu, T.; Blaabjerg, F. Maximum Virtual Inertia from DC-Link Capacitors Considering System Stability at Voltage Control Timescale. IEEE J. Emerg. Sel. Top. Circuits Syst. 2021, 11, 79–89. [Google Scholar] [CrossRef]
  3. Du, W.; Wang, Y.; Wang, H.F.; Ren, B.; Xiao, X. Small-Disturbance Stability Limit of a Grid-Connected Wind Farm with PMSGs in the Timescale of DC Voltage Dynamics. IEEE Trans. Power Syst. 2021, 36, 2366–2379. [Google Scholar] [CrossRef]
  4. Xu, Y.; Nian, H.; Chen, L. Small-Signal Modeling and Analysis of DC-Link Dynamics in Type-IV Wind Turbine System. IEEE Trans. Ind. Electron. 2021, 68, 1423–1433. [Google Scholar] [CrossRef]
  5. Cheng, Y.; Fan, L.; Rose, J.; Huang, S.-H.; Schmall, J.; Wang, X.; Xie, X.; Shair, J.; Ramamurthy, J.R.; Modi, N.; et al. Real-World Subsynchronous Oscillation Events in Power Grids with High Penetrations of Inverter-Based Resources. IEEE Trans. Power Syst. 2023, 38, 316–330. [Google Scholar] [CrossRef]
  6. Narayanan, V.; Kewat, S.; Singh, B. Solar PV-BES Based Microgrid System with Multifunctional VSC. IEEE Trans. Ind. Appl. 2020, 56, 2957–2967. [Google Scholar] [CrossRef]
  7. Hu, J.; Yuan, H.; Yuan, X. Modeling of DFIG-Based WTs for Small-Signal Stability Analysis in DVC Timescale in Power Electronized Power Systems. IEEE Trans. Energy Convers. 2017, 32, 1151–1165. [Google Scholar] [CrossRef]
  8. Markovic, U.; Stanojev, O.; Aristidou, P.; Hug, G. Partial Grid Forming Concept for 100% Inverter-Based Transmission Systems. In Proceedings of the 2018 IEEE Power & Energy Society General Meeting (PESGM), Portland, OR, USA, 5–9 August 2018; IEEE: Piscataway, NJ, USA, 2018; pp. 1–5. [Google Scholar]
  9. Ma, F.; Xin, H.; Wu, D.; Liu, Y.; Chen, X. Assessing Small-Signal Grid Strength of 100% Inverter-Based Power Systems. IEEE Trans. Power Deliv. 2024, 39, 2784–2796. [Google Scholar] [CrossRef]
  10. Huang, Y.; Yuan, X.; Hu, J. Effect of Reactive Power Control on Stability of DC-Link Voltage Control in VSC Connected to Weak Grid. In Proceedings of the 2014 IEEE PES General Meeting|Conference & Exposition, National Harbor, MD, USA, 27–31 July 2014; IEEE: Piscataway, NJ, USA, 2014; pp. 1–5. [Google Scholar]
  11. Huang, Y.; Yuan, X.; Hu, J.; Zhou, P.; Wang, D. DC-Bus Voltage Control Stability Affected by AC-Bus Voltage Control in VSCs Connected to Weak AC Grids. IEEE J. Emerg. Sel. Top. Power Electron. 2016, 4, 445–458. [Google Scholar] [CrossRef]
  12. Yuan, H.; Yuan, X.; Hu, J. Modeling of Grid-Connected VSCs for Power System Small-Signal Stability Analysis in DC-Link Voltage Control Timescale. IEEE Trans. Power Syst. 2017, 32, 3981–3991. [Google Scholar] [CrossRef]
  13. Huang, J.; Yuan, X.; Wang, S. Cascaded multi-timescale modeling method of power electronic-interfaced device based on stimulation-response relationships of components for multi-timescale dynamic analysis of power systems. Proc. CSEE 2024, 45, 5467–5480. [Google Scholar]
  14. Huang, J.; Yuan, X.; Wang, S. Power-Imbalance Stimulation and Internal-Voltage Response Relationships Based Modeling Method of PE-Interfaced Devices in DC Voltage Control Timescale. IEEE Access 2023, 11, 105214–105224. [Google Scholar] [CrossRef]
  15. Askarov, A.; Bay, Y.; Ufa, R.; Radko, P.; Ilyushin, P.; Suvorov, A. Signatures and Mechanism Analysis of Converter-Grid Subsynchronous Oscillations. Mathematics 2024, 12, 3884. [Google Scholar] [CrossRef]
  16. Zhang, X.; Li, M.; Xu, D. PCC Voltage Perturbation Path Analysis and Compensation for Grid-Connected Voltage-Source Converter under Weak Grid. IEEE Trans. Ind. Electron. 2021, 68, 12331–12339. [Google Scholar] [CrossRef]
  17. Wang, D.; Liang, L.; Shi, L.; Hu, J.; Hou, Y. Analysis of Modal Resonance between PLL and DC-Link Voltage Control in Weak-Grid Tied VSCs. IEEE Trans. Power Syst. 2019, 34, 1127–1138. [Google Scholar] [CrossRef]
  18. Lu, D.; Wang, X.; Blaabjerg, F. Impedance-Based Analysis of DC-Link Voltage Dynamics in Voltage-Source Converters. IEEE Trans. Power Electron. 2019, 34, 3973–3985. [Google Scholar] [CrossRef]
  19. Zhao, M.; Yuan, X.; Hu, J. Modeling of DFIG Wind Turbine Based on Internal Voltage Motion Equation in Power Systems Phase-Amplitude Dynamics Analysis. IEEE Trans. Power Syst. 2018, 33, 1484–1495. [Google Scholar] [CrossRef]
  20. Li, C.; Yang, Y.; Cao, Y.; Wang, L.; Blaabjerg, F. Frequency and Voltage Stability Analysis of Grid-Forming Virtual Synchronous Generator Attached to Weak Grid. IEEE J. Emerg. Sel. Top. Power Electron. 2022, 10, 2662–2671. [Google Scholar] [CrossRef]
  21. Wang, S.; Yuan, X. Small-Disturbance Linearization Method for Converter Interfaced AC Power Systems Based on Operating Points of Internal-Voltage Amplitude/Frequency and Networks’ Active/Reactive Current. Proc. CSEE 2024, 44, 1081–1094. [Google Scholar] [CrossRef]
  22. Yang, H.; Yi, Y.; Li, S.; Zhou, Y. Active/Reactive Power Separation Mechanisms for Different Signal-Modulated Power Devices Based on Time-Varying Amplitude/Frequency Rotating Vectors in Dynamic Processes. Processes 2025, 13, 1907. [Google Scholar] [CrossRef]
  23. Wang, Y.; Wang, X.; Blaabjerg, F.; Chen, Z. Harmonic Instability Assessment Using State-Space Modeling and Participation Analysis in Inverter-Fed Power Systems. IEEE Trans. Ind. Electron. 2017, 64, 806–816. [Google Scholar] [CrossRef]
  24. Hu, J.; Wang, W.; Li, Y.; Guo, J. Cross-Timescale Interaction Analysis between Voltage-Control and Rotor-Speed-Control Timescales in DFIG-WTs-Dominated Power Systems. IEEE Trans. Power Syst. 2025, 40, 2764–2776. [Google Scholar] [CrossRef]
  25. Wu, G.; Sun, H.; Zhang, X.; Egea-Alvarez, A.; Zhao, B.; Xu, S.; Wang, S.; Zhou, X. Parameter Design Oriented Analysis of the Current Control Stability of the Weak-Grid-Tied VSC. IEEE Trans. Power Deliv. 2021, 36, 1458–1470. [Google Scholar] [CrossRef]
  26. He, L.; Liu, D.; Tao, H.; Shen, Y.; Ren, J.; Wang, Y.; Li, J.; Xu, Y. Small-Signal Stability Analysis of Grid-Connected System for Renewable Energy Based on Network Node Impedance Modelling. Processes 2025, 13, 1292. [Google Scholar] [CrossRef]
  27. Liu, H.; Xie, X.; He, G.; Liu, C. Synchronous reference frame based impedance model and stability criterion for grid-connected renewable energy generation systems. Proc. CSEE 2017, 37, 4002–4007. [Google Scholar] [CrossRef]
  28. Li, S.; Yan, Y.; Yuan, X. SISO Equivalent of MIMO VSC-Dominated Power Systems for Voltage Amplitude and Phase Dynamic Analyses in Current Control Timescale. IEEE Trans. Energy Convers. 2019, 34, 1454–1465. [Google Scholar] [CrossRef]
  29. Wu, Y.; Wu, H.; Zhao, F.; Zhou, Z.; Wang, X. Reference-Frame Selection on Impedance Modeling of VSCs with Fundamental Frequency Dynamics. IEEE Trans. Power Electron. 2025, 40, 10059–10076. [Google Scholar] [CrossRef]
  30. Wang, S.; Liu, Z.; Liu, J.; Boroyevich, D.; Burgos, R. Small-Signal Modeling and Stability Prediction of Parallel Droop-Controlled Inverters Based on Terminal Characteristics of Individual Inverters. IEEE Trans. Power Electron. 2020, 35, 1045–1063. [Google Scholar] [CrossRef]
  31. Yu, J.; Wang, S.; Liu, Z.; Li, J.; Liu, J.; Shang, J. Accurate Small-Signal Terminal Characteristic Model and SISO Stability Analysis Approach for Parallel Grid-Forming Inverters in Islanded Microgrids. IEEE Trans. Power Electron. 2023, 38, 6597–6612. [Google Scholar] [CrossRef]
  32. Yuan, X.; Li, S. An amplitude/frequency modulation based method of voltage source converter for power systems dynamic analysis in current control timescale. Proc. CSEE 2020, 40, 4732–4744. [Google Scholar] [CrossRef]
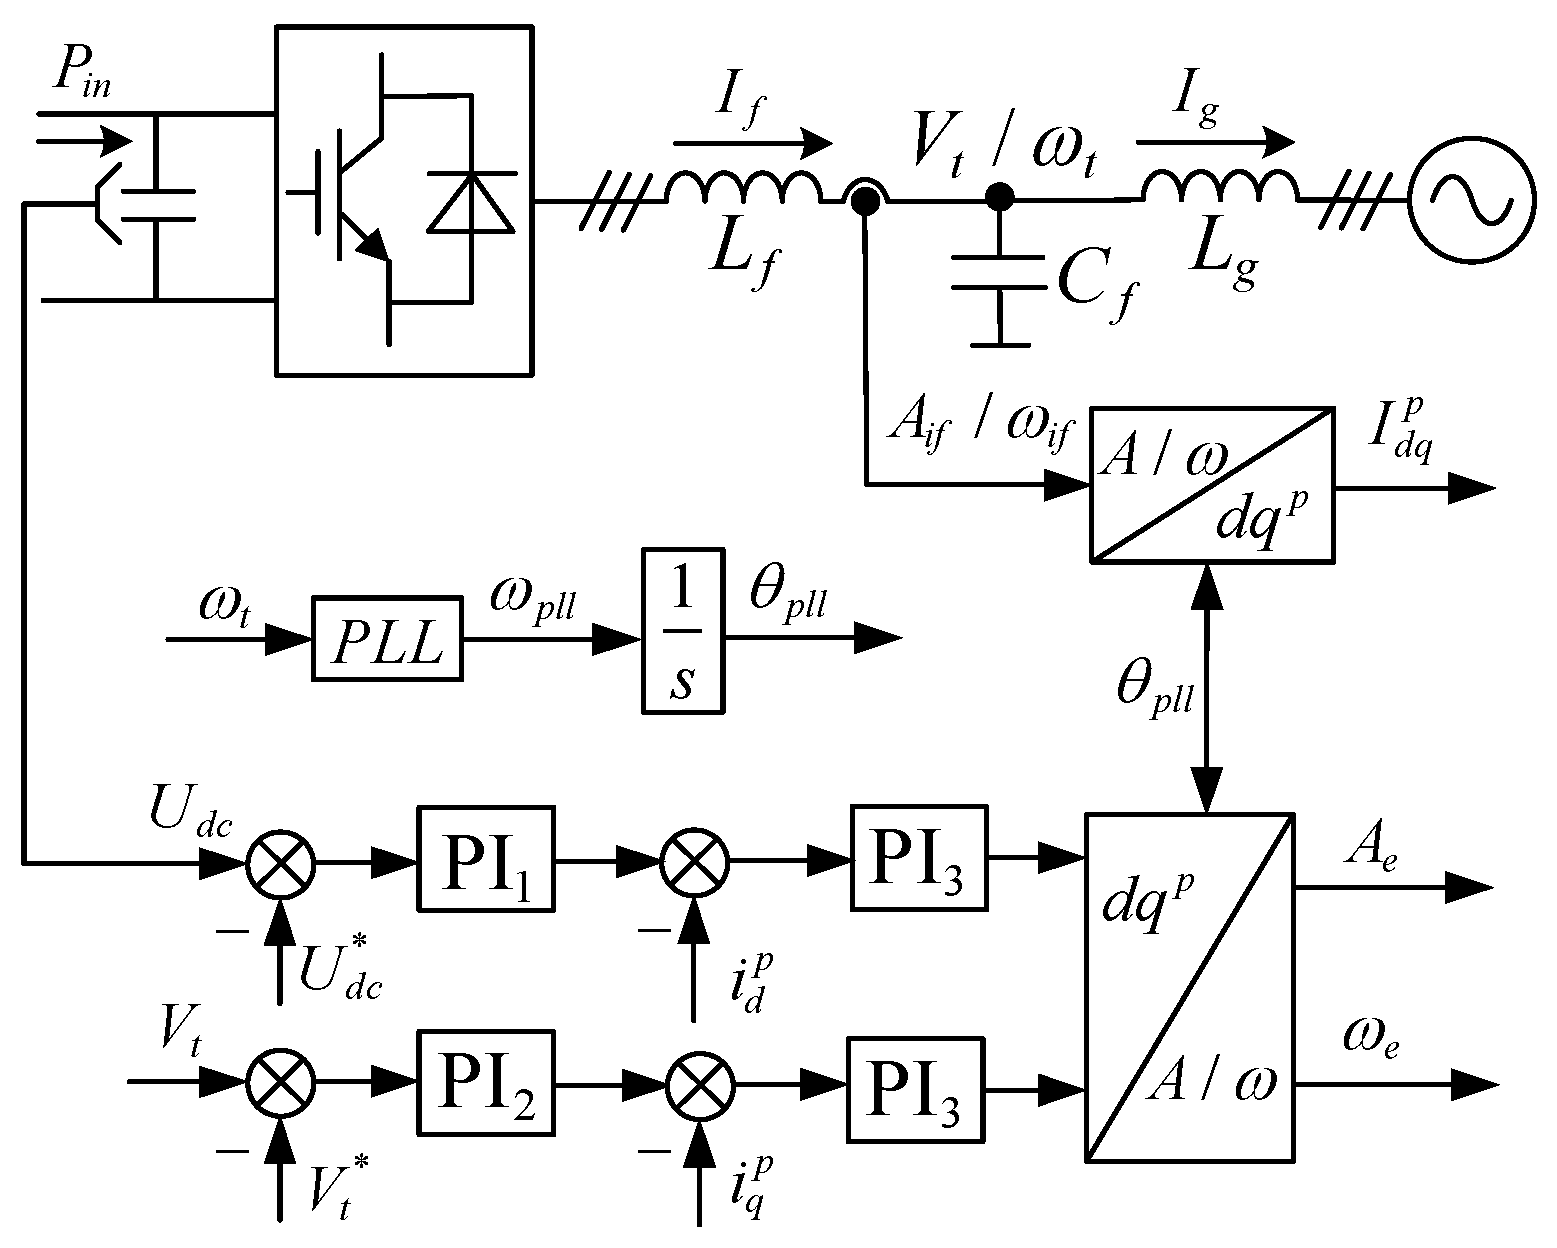
Figure 1. The converter-interfaced system configuration.
Processes 13 02583 g001
Figure 2. Dynamic illustration of steady-state operating points. (a) Dynamic characteristics of the dq working point and amplitude–frequency working point dynamics illustration. (b) Dynamic illustration of capacitance in the AC grid.
Processes 13 02583 g002
Figure 3. Equivalent block diagram of circuit transfer function.
Processes 13 02583 g003
Figure 4. The fundamental operating principles of the VSC.
Processes 13 02583 g004
Figure 5. The small-signal paths of VSC state variables.
Processes 13 02583 g005
Figure 6. DC voltage timescale range.
Processes 13 02583 g006
Figure 7. Waveforms of converter-interfaced system dominated by DC voltage timescale control.
Processes 13 02583 g007
Figure 8. The small-signal paths of VSC state variables in DC voltage timescale.
Processes 13 02583 g008
Figure 9. Equivalent block diagram of Self-stable/En-stable characteristics for the single variable.
Processes 13 02583 g009
Figure 10. Self-stable path of internal voltage amplitude in converter-interfaced systems.
Processes 13 02583 g010
Figure 11. En-stable path of internal voltage amplitude in converter-interfaced systems.
Processes 13 02583 g011
Figure 12. Self-stable path of internal voltage frequency in converter-interfaced systems.
Processes 13 02583 g012
Figure 13. En-stable path of internal voltage frequency in converter-interfaced systems.
Processes 13 02583 g013
Figure 14. Frequency response curve of the internal voltage amplitude motion equation.
Processes 13 02583 g014
Figure 15. Impact of control bandwidth variations on internal voltage amplitude stability: (a) DCCB; (b) TVCB.
Processes 13 02583 g015
Figure 16. Dynamic response of internal voltage amplitude under different control bandwidth: (a) DCCB; (b) TVCB.
Processes 13 02583 g016
Figure 17. Frequency response curve of the internal voltage frequency motion equation.
Processes 13 02583 g017
Figure 18. Impact of control bandwidth variations on internal voltage frequency stability: (a) DCCB; (b) TVCB.
Processes 13 02583 g018
Figure 19. Dynamic response of internal voltage frequency under different control bandwidth: (a) DCCB; (b) TVCB.
Processes 13 02583 g019
Table 1. Comparison of this research method with previous research methods.
Previous Approaches and LimitationsOur Innovative Approach and Advantages
1. Modeling Operating PointMethod: Primarily uses static DC values in the dq reference frame as operating points.
Limitation: dq components lack intuitive physical meaning and are difficult to directly relate to the system’s energy and power dynamics.
Method: Uses the amplitude and frequency of the AC voltage as core state variables and operating points.
Advantage: The operating points directly reflect the system’s energy state, providing clear physical meaning and an intuitive foundation for mechanism analysis.
2. Stability Analysis FrameworkMethod: (a) MIMO state-space analysis (e.g., eigenvalues). (b) SISO impedance analysis.
Limitation: (a) Accurate but acts as a “black box,” lacking physical insight and offering little guidance for design. (b) Intuitive but often requires oversimplification, potentially ignoring critical dynamic couplings.
Method: Proposes the “Self-stable/En-stable” path analytical framework.
Advantage: Unifies analytical rigor with physical intuition. Through mathematical decoupling, it preserves the complete coupling information of the MIMO system while leveraging the intuitiveness of SISO tools for physical mechanism analysis.
3. Oscillation Mechanism RevelationLimitation: Typically identifies unstable modes but cannot clearly explain the root causes of oscillation, especially how interactions between different dynamics (e.g., amplitude and frequency) lead to instability.Method: Performs quantitative analysis by decomposing the system into Self-stable and En-stable paths.
Advantage: Clearly and quantitatively reveals the root causes of oscillation. For example, this study is the first to uncover the “dual” relationship between the stability mechanisms of amplitude and frequency.
Disclaimer/Publisher’s Note: The statements, opinions and data contained in all publications are solely those of the individual author(s) and contributor(s) and not of MDPI and/or the editor(s). MDPI and/or the editor(s) disclaim responsibility for any injury to people or property resulting from any ideas, methods, instructions or products referred to in the content.