Article

Microfluidic Investigation on the Diffusion Law of Nano Displacement Agent in Porous Media

School of Petroleum, China University of Petroleum—Beijing at Karamay, Karamay 834000, China
*
Author to whom correspondence should be addressed.
Processes 2025, 13(8), 2546; https://doi.org/10.3390/pr13082546
Submission received: 22 July 2025 / Revised: 8 August 2025 / Accepted: 8 August 2025 / Published: 12 August 2025
(This article belongs to the Special Issue Advanced Strategies in Enhanced Oil Recovery: Theory and Technology)

Abstract

Unconventional oil reservoirs are tight and often host micro-nano pores, and huff and puff is usually adopted for such reservoirs, mainly utilizing the mechanism of spontaneous imbibition. The penetration depth into the matrix during imbibition is one of the key influencing factors of oil recovery. In circumstances where a water phase is present in the reservoir, the injected oil displacement agent may not directly contact the oil phase, but instead needs to diffuse and migrate to the oil–water interface to adjust the capillary force, thereby affecting the imbibition depth. Therefore, the diffusion law of the oil displacement agent can indirectly affect the oil recovery by imbibition. In this study, microfluidic experiments were conducted to investigate the diffusion of nano oil displacement agents at different pore sizes (100 μm). The results show that the concentration distribution of nano oil displacement agents near the injection end was uniform during the diffusion process, and the concentration showed a decreasing trend with increasing depth. As the pore size decreased, the diffusion coefficient also decreased, and the diffusion effect deteriorated. There was a lower limit of pore size that allowed diffusion at approximately 15.66 μm. The diffusion law of the nano oil displacement agent in porous media obtained in this study is of great significance for improving the recovery rate of unconventional oil and gas resources.

1. Introduction

China is rich in unconventional oil and gas resources. The total geological resources of tight oil reservoirs amount to nearly 2.0 × 10¹⁰ t, with technically recoverable reserves ranging from 2.0 × 10⁹–2.5 × 10⁹ t [1]. However, the majority of these energy resources are scattered across extensive areas, with usually low recovery efficiencies. Therefore, the efficient development of tight oil reservoirs holds strategic significance for ensuring energy security [2,3].
Imbibition is a fundamental process in porous media where a wetting phase spontaneously displaces a non-wetting phase due to capillary forces, playing a pivotal role in enhanced oil recovery (EOR) for unconventional reservoirs [4,5,6]. This phenomenon is particularly significant in low-permeability formations, such as shale and tight reservoirs, where traditional recovery methods are often ineffective. The development of unconventional reservoirs heavily relies on hydraulic fracturing [7], which creates extensive fracture networks that facilitate fluid flow. During this process, imbibition enables the uptake of fracturing fluids into the matrix, releasing trapped hydrocarbons and improving displacement efficiency [8]. The interplay between capillary forces, rock wettability, and pore structure governs imbibition dynamics, making it a critical factor in optimizing EOR strategies and fracturing fluid design [4]. The mechanisms of imbibition in unconventional reservoirs are complex, involving interactions between rock, fluids, and chemical additives [9]. Surfactants are a key type of chemical additive that ensures and enhances the imbibition efficiency [10,11]. Studies have shown that anionic surfactants outperform nonionic ones in altering wettability, reducing interfacial tension (IFT), and promoting spontaneous imbibition, leading to higher oil recovery [12]. For instance, field-scale applications demonstrate that surfactant-laden fracturing fluids can increase cumulative oil production by over 20% compared to conventional treatments [13]. Additionally, the integration of nanofluids and salinity optimization further enhances imbibition by modifying rock–fluid interactions and improving fluid penetration into micro-nano pores [14,15,16]. These advancements underscore the importance of tailored chemical formulations in maximizing EOR potential [5,6].
In actual oil reservoirs, surfactants injected through the wellbore do not always directly contact the oil phase to initiate imbibition. In the presence of an aqueous phase that already exists in the formation, surfactants must diffuse from the injected fracturing fluid through the existing water phase to the oil–water interface. That is, within the more complex porous media inside the formation, it is necessary to consider the time required for surfactants to reach the crude oil and the remaining effective concentration of the surfactants. Therefore, an in-depth understanding of the diffusion behavior of surfactants in porous media helps design more effective displacement agent formulations and injection methods. Traditional descriptions of mass diffusion are generally governed by Fick’s Law, which quantitatively relates the diffusion flux to the concentration gradient [17]. Regarding ion diffusion properties, Gu et al. [18] investigated the diffusion and distribution characteristics of Mn2+ in porous media gel systems, determining the diffusion coefficient of Mn2+ using Fick’s Law. They concluded that higher Mn2+ concentrations significantly affect the diffusion coefficient. Wang et al. [19] applied Fick’s Law to derive the variation characteristics of equivalent gas diffusion coefficients in porous media with respect to pore structure and gas parameters, finding that the effective gas diffusion coefficient is proportional to both the porosity and maximum pore diameter of the porous medium.
Microfluidic technology has become an important experimental tool for studying tight oil reservoir development in recent years, capable of simulating fluid flow and mass transfer in micro- or even nano-scale pores [20,21,22,23]. Wang et al. [24] used a microfluidic model to observe oil–water flow during imbibition, finding that chips with larger average pore-throat radii achieved higher imbibition recovery. Xu [25] conducted microscopic visualization experiments to screen optimal surfactant formulations, and Wang et al. [26] investigated the effects of surfactant penetration depth and concentration on spontaneous imbibition in deep matrixes, concluding that greater fracture complexity leads to higher dynamic imbibition recovery. Zhokh investigated the diffusion of molecules within micro- and meso-porous media, and found that the molecule size directly influences the diffusion characteristics [27]. Kang et al. simulated the diffusion of nanoparticles in heterogeneous porous media using the random walk algorithm and validated the importance of reservoir heterogeneity and reactivity during the flow [28]. However, no existing microfluidic studies have focused on aqueous phase imbibition depth or surfactant diffusion velocity/range at the micrometer scale. Therefore, it is necessary to design experiments to study surfactant diffusion behavior in micro-scale pores to investigate factors affecting imbibition depth in unconventional reservoirs.
In this work, the diffusion of a surfactant modified nano-displacement agent was evaluated using the microfluidic approach. To begin with, the type of nano-displacement agent was identified through color development reactions, and a microfluidic experiment was designed. By analyzing the relationship between the concentration of the nano-displacement agent and the solution color (expressed in RGB values), an analytical program was developed to investigate the diffusion behavior of the nano-displacement agent in porous media. This study holds significant importance for enhancing the recovery efficiency of unconventional oil and gas resources. The flow of this work is summarized in Figure 1.

2. Determination of Nano-Displacement Agent Type

The interaction between different types of surfactants and certain chemical substances can induce color changes, a phenomenon known as the colorimetric reaction of surfactants [29,30,31,32]. For example, Victoria Blue can form ionic complexes with anionic surfactants under acidic conditions, leading to its decolorization [33]. Quaternary ammonium cationic surfactants can undergo ionic association with Bromothymol Blue (BTB) in a phosphate buffer solution at pH 7.5–8.5, thereby reducing the BTB concentration and causing its decolorization [34,35]. To determine the type of nano-displacement agent used in the experiment, an experiment is designed based on the above-mentioned known colorimetric reactions as follows.
(1) Cationic surfactant detection solution preparation: Bromothymol blue (BTB, 0.001 g) was dissolved in 10 mL of distilled water to obtain a 1.6 mol/L BTB solution. Disodium hydrogen phosphate (Na2HPO4, 3.59 g) was dissolved in water and was diluted to 50 mL to prepare Solution A. Then, Solution B was prepared by dissolving 0.276 g of NaH2PO4 in water and diluted to 10 mL. The phosphate buffer solution (at pH = 7.6) was obtained by mixing 9.15 mL of Solution A with 0.85 mL of Solution B. Sequentially, 1.5 mL of BTB solution and 1 mL of the pH = 7.6 phosphate buffer solution was added to a container and diluted to 10 mL with water. Subsequently, 10 mL of the nano-displacement agent solution with varying concentrations was mixed with the prepared reagent, shaken well, and the color changes were observed, pictured, and analyzed.
(2) Anionic surfactant detection solution preparation: 0.1875 g of 80% Victoria Blue was added to 0.0125 g of 80% hydrolyzed polyvinyl alcohol and 9 mL of 85% phosphoric acid. The mixture was diluted to 20 mL with water. The nano-displacement agent solution was then mixed with both types of detection reagents at equal volumes to observe the changes in color.
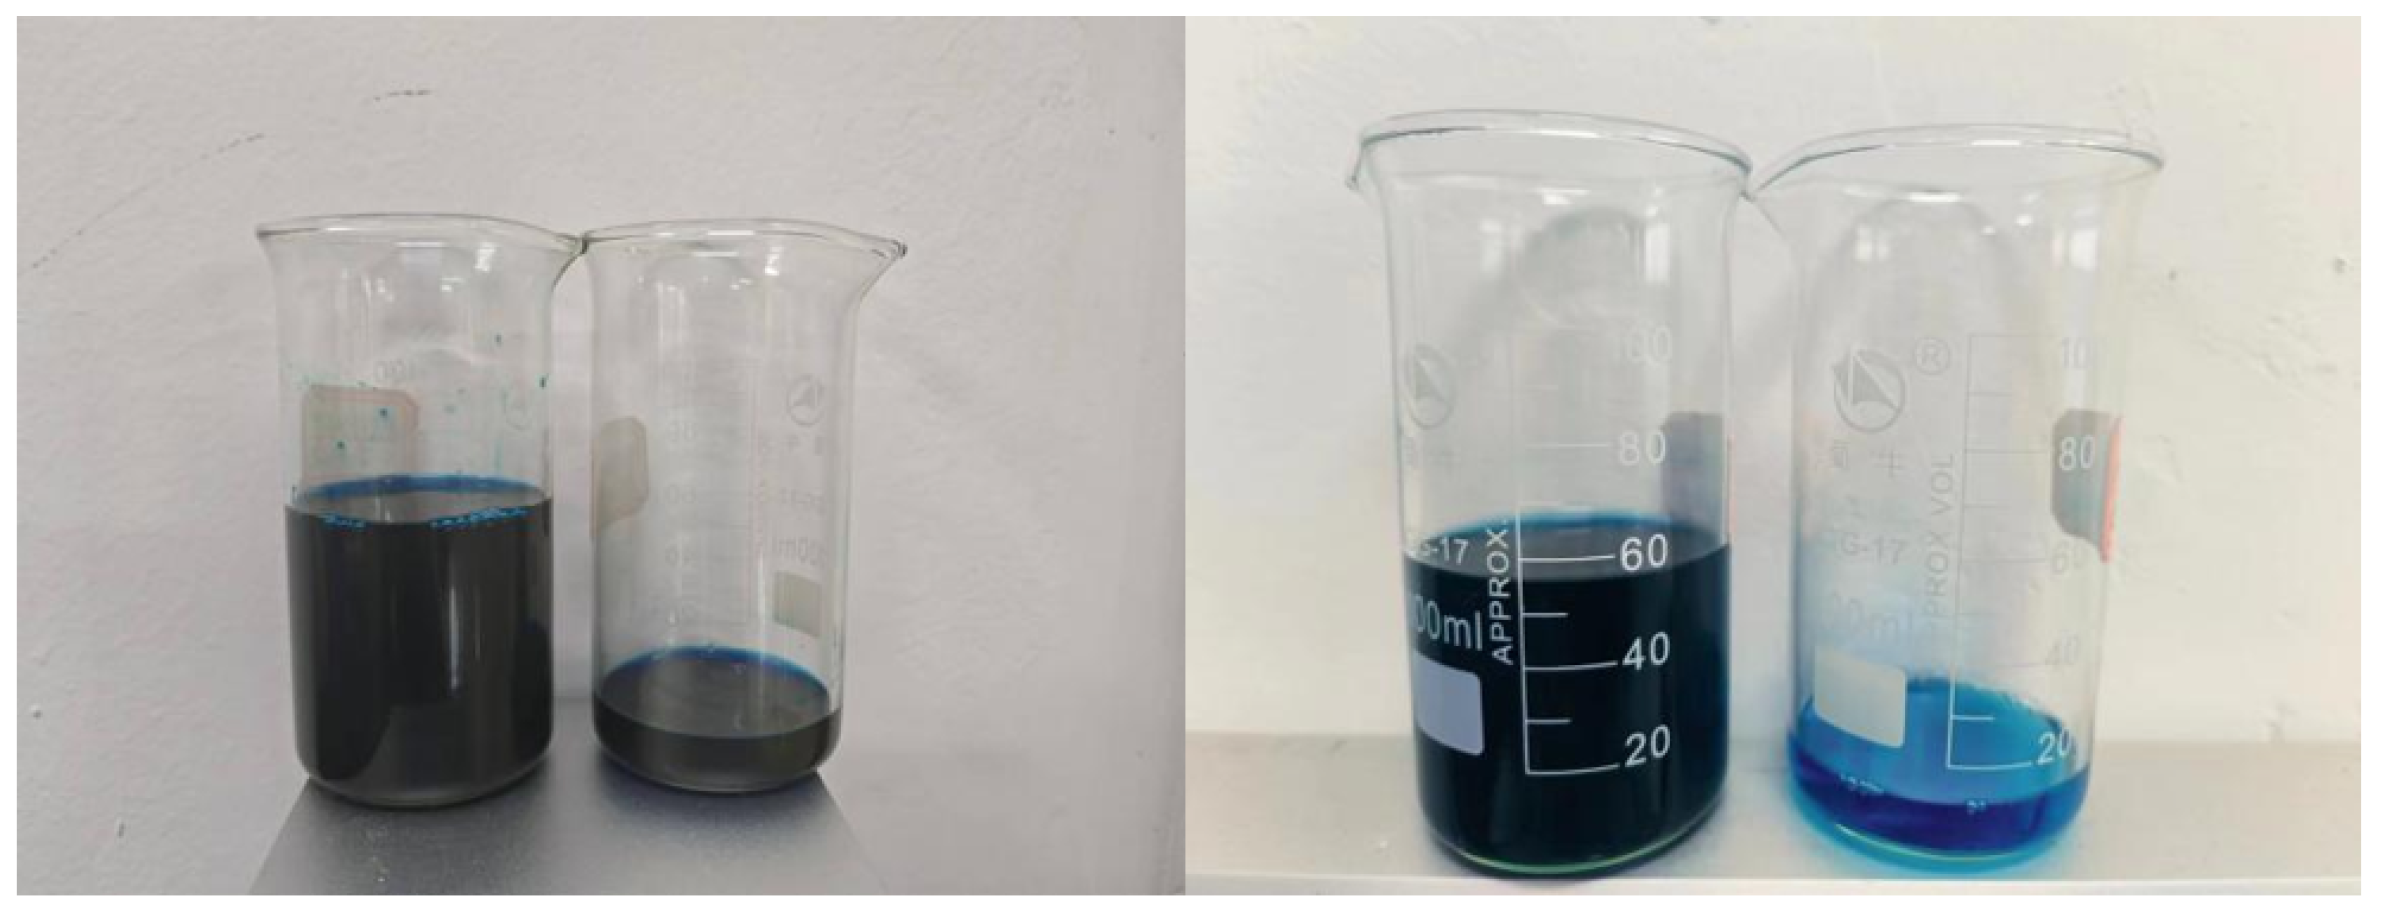
As shown in Figure 2, it is evident that the nano-displacement agent underwent a colorimetric reaction upon mixing with the anionic detection solution, indicating that the nano-displacement agent is anionic. Therefore, the anionic surfactant detection solution was consistently used in subsequent experiments.

3. Establishment of Correlation Between Surfactant Concentration and RGB Value

3.1. Base Solution Preparation and Colorimetric Reaction

A quantity of 0.1875 g of 80% Victoria Blue was added to 0.0125 g of 80% hydrolyzed polyvinyl alcohol and 9 mL of 85% phosphoric acid. The mixture was then diluted to 20 mL with water to obtain the base solution. Then, 2.5 g, 2 g, 1.5 g, 1 g, 0.5 g, 0.25 g, and 0.1 g of the agent was dissolved in distilled water and diluted to 10 mL. This yielded nano-displacement agent solutions with mass concentrations of 5%, 4%, 3%, 2%, 1%, 0.5%, 0.4%, and 0.2%, respectively.

3.2. Materials and Equipment

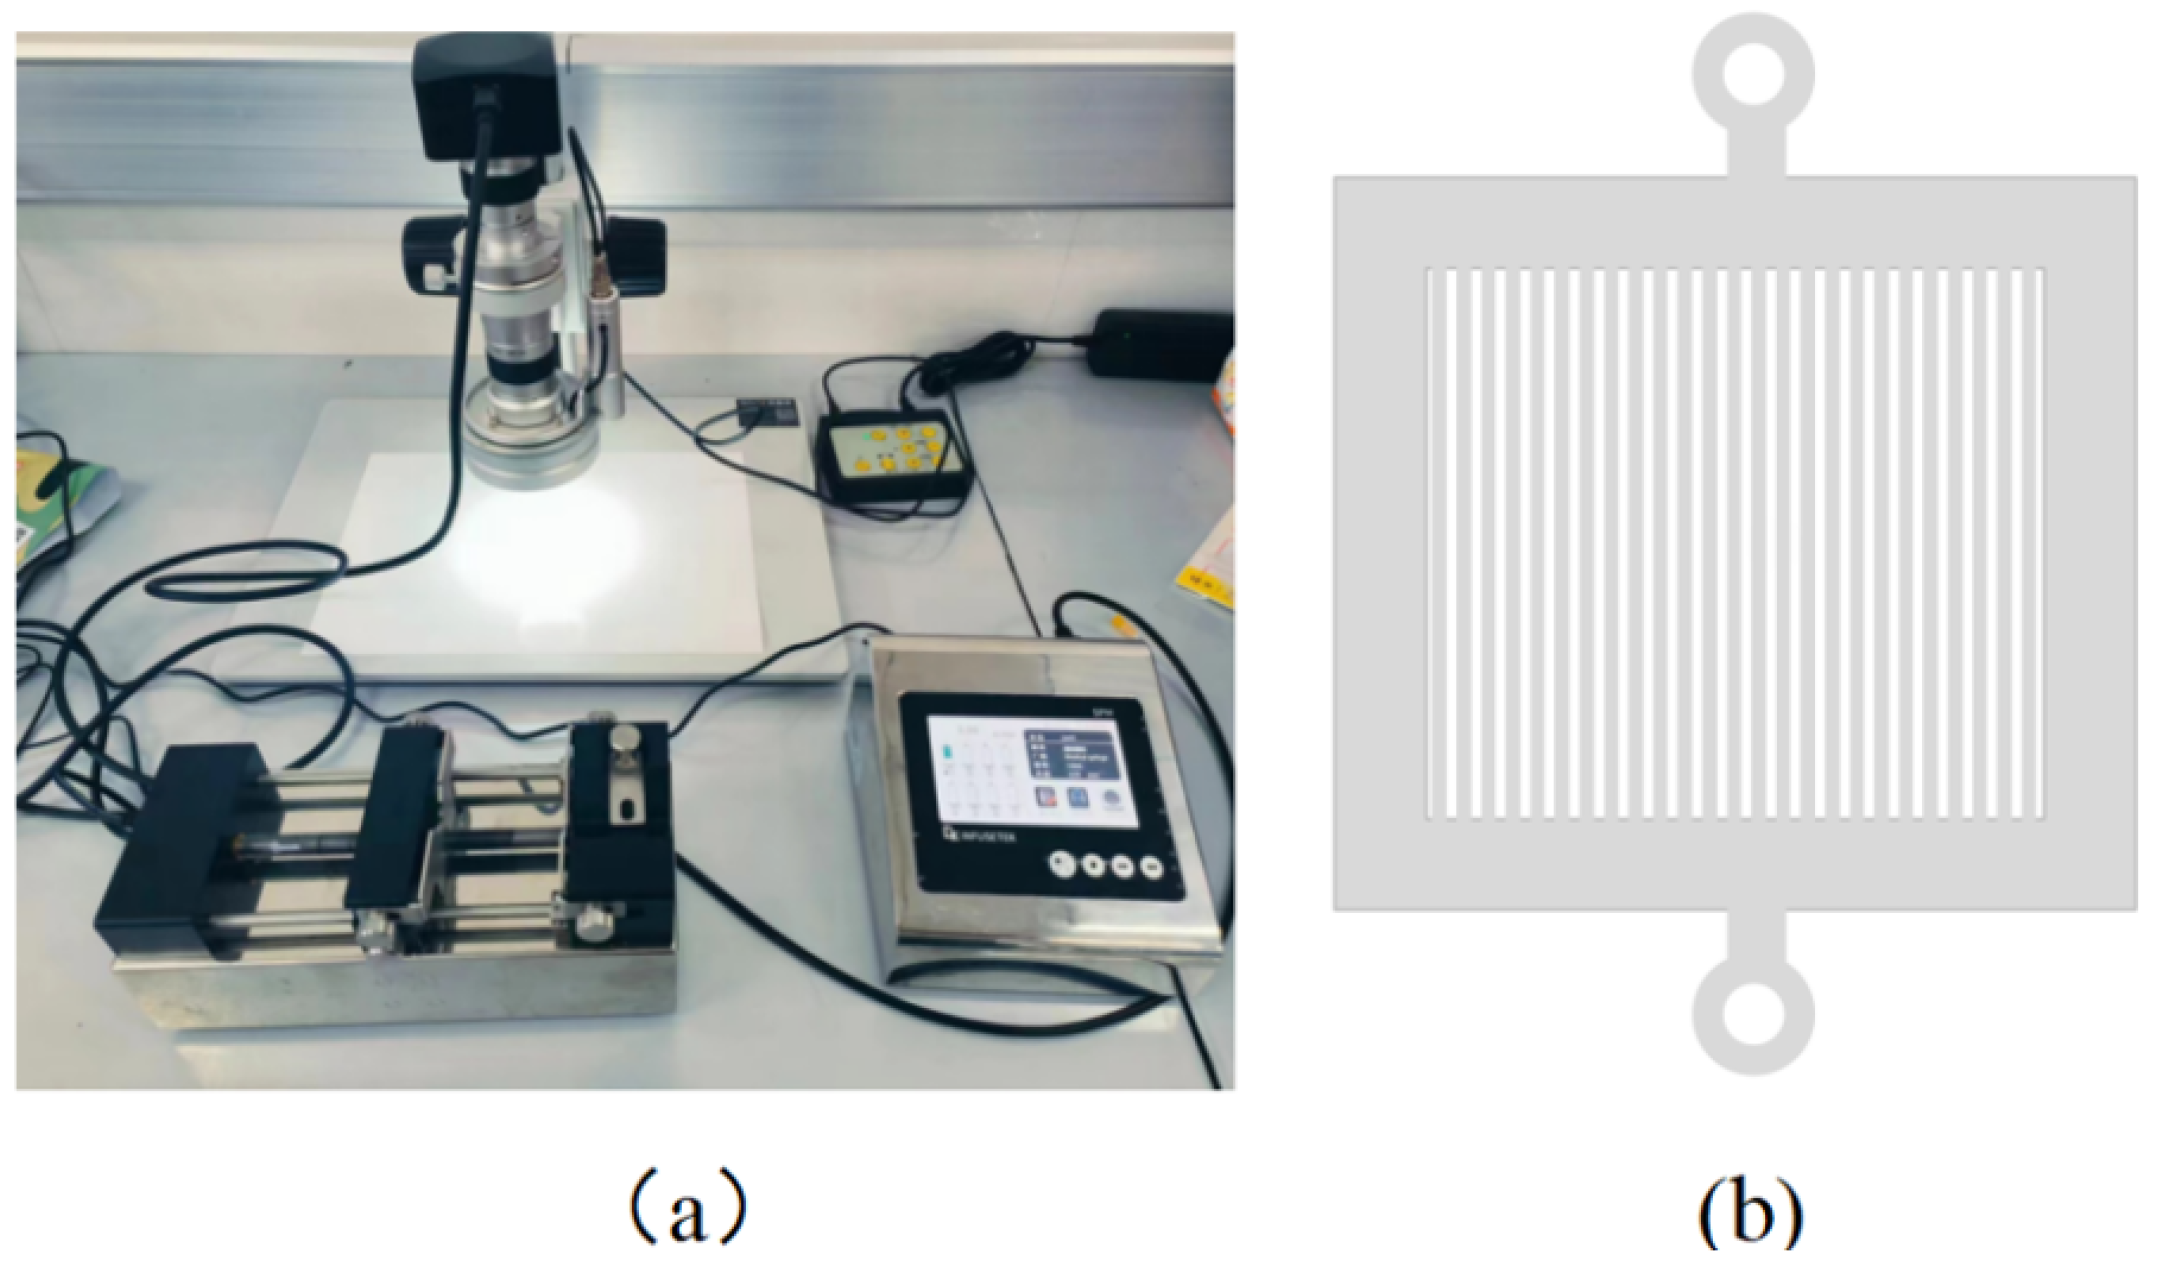
Major equipment used to quantify the diffusion of the nano-displacement agent included an Aosvi 3DM-3M180 optical microscope, an ISPLab01 single-channel experimental constant-flow microinjection pump, and a PDMS microfluidic chip. The interior of the chip features two structures: small pores and large pores, as shown in Figure 3b. The inner diameters of the small pores are 100 μm, 50 μm, and 20 μm, respectively, each with a length of 5 mm. These small pores serve as channels for the colorimetric reaction between the colorimetric reagent solution and the nano-displacement agent. The large pores isolate the colorimetric reagent solution from the nano-displacement agent during the air injection step, as will be described later.
The experimental system consists of three parts: a fluid control system, a microfluidic chip, and an image acquisition system. The fluid control system is an injection pump. The image acquisition system mainly comprises an external light source, a microscope, a camera, and imaging software. An external light source transmits light to the microscope, and then the objective lens (with magnification ranging from 50 to 300 times) directly captures the experimental images under the microscope. The test results are acquired by the camera and imaging software and then processed and analyzed. Based on this, utilizing the microfluidic chip and image acquisition technology, real-time monitoring of fluid flow within the reservoir is achieved, and full-process images of the diffusion of the nano-displacement agent are obtained, providing a basis for subsequent data processing, analysis, and evaluation.

3.3. Experimental Procedure

(1) The microfluidic chip was vacuumed to ensure it was completely dry and free of any liquid.
(2) The tubing, syringe, microflow pump, optical microscope, and microfluidic chip were connected to the microscopy setup. The chip was positioned so that the microscope was aligned with its central area.
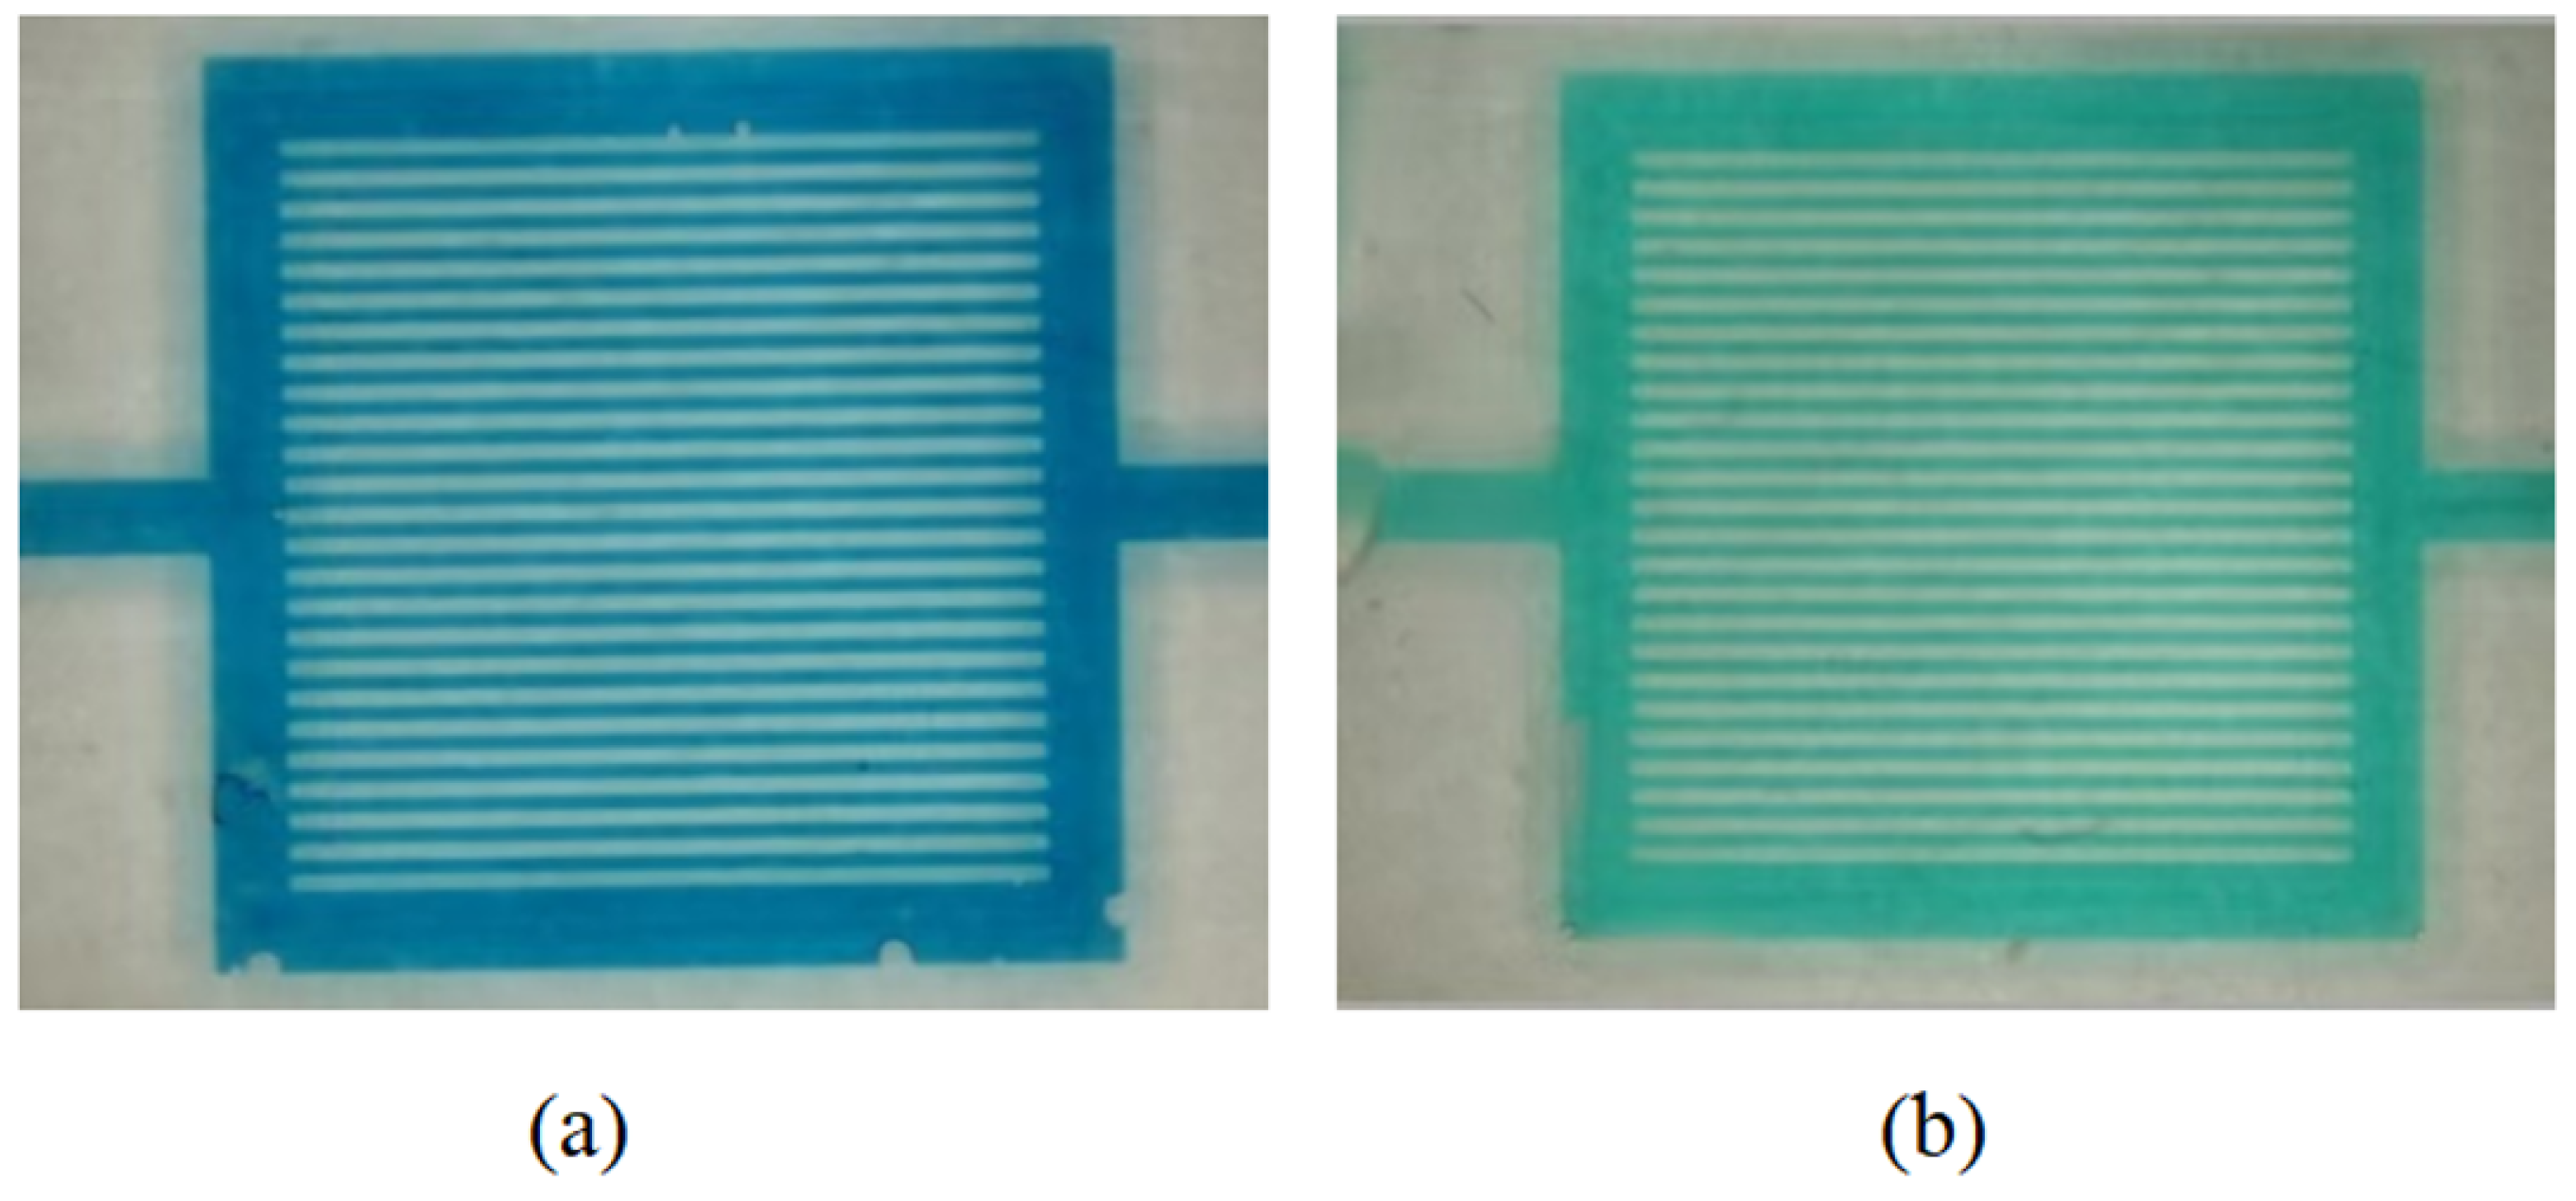
(3) Mixture of the nano-displacement agent (at varying concentrations) and the anionic surfactant detection solution were injected into the chip to fully saturate the porous space. An image of the chip 100% saturated with the mixture was taken (as shown in Figure 4).
(4) The RGB values of the colored regions were read, two points per pore, and the average of the acquired data was taken as the RGB values within the pores at the current concentration.
(5) The above steps were repeated for nano-displacement agent solutions with varying concentrations to establish a standard curve between the nano-displacement agent concentration and the RGB values of the small pores.
Figure 4. Color of solution in the channels (a) in the absence of a nano-displacement agent and (b) in the presence of 0.4% nano-displacement agent.
Processes 13 02546 g004

3.4. Establishment of the Concentration–RGB Standard Curve

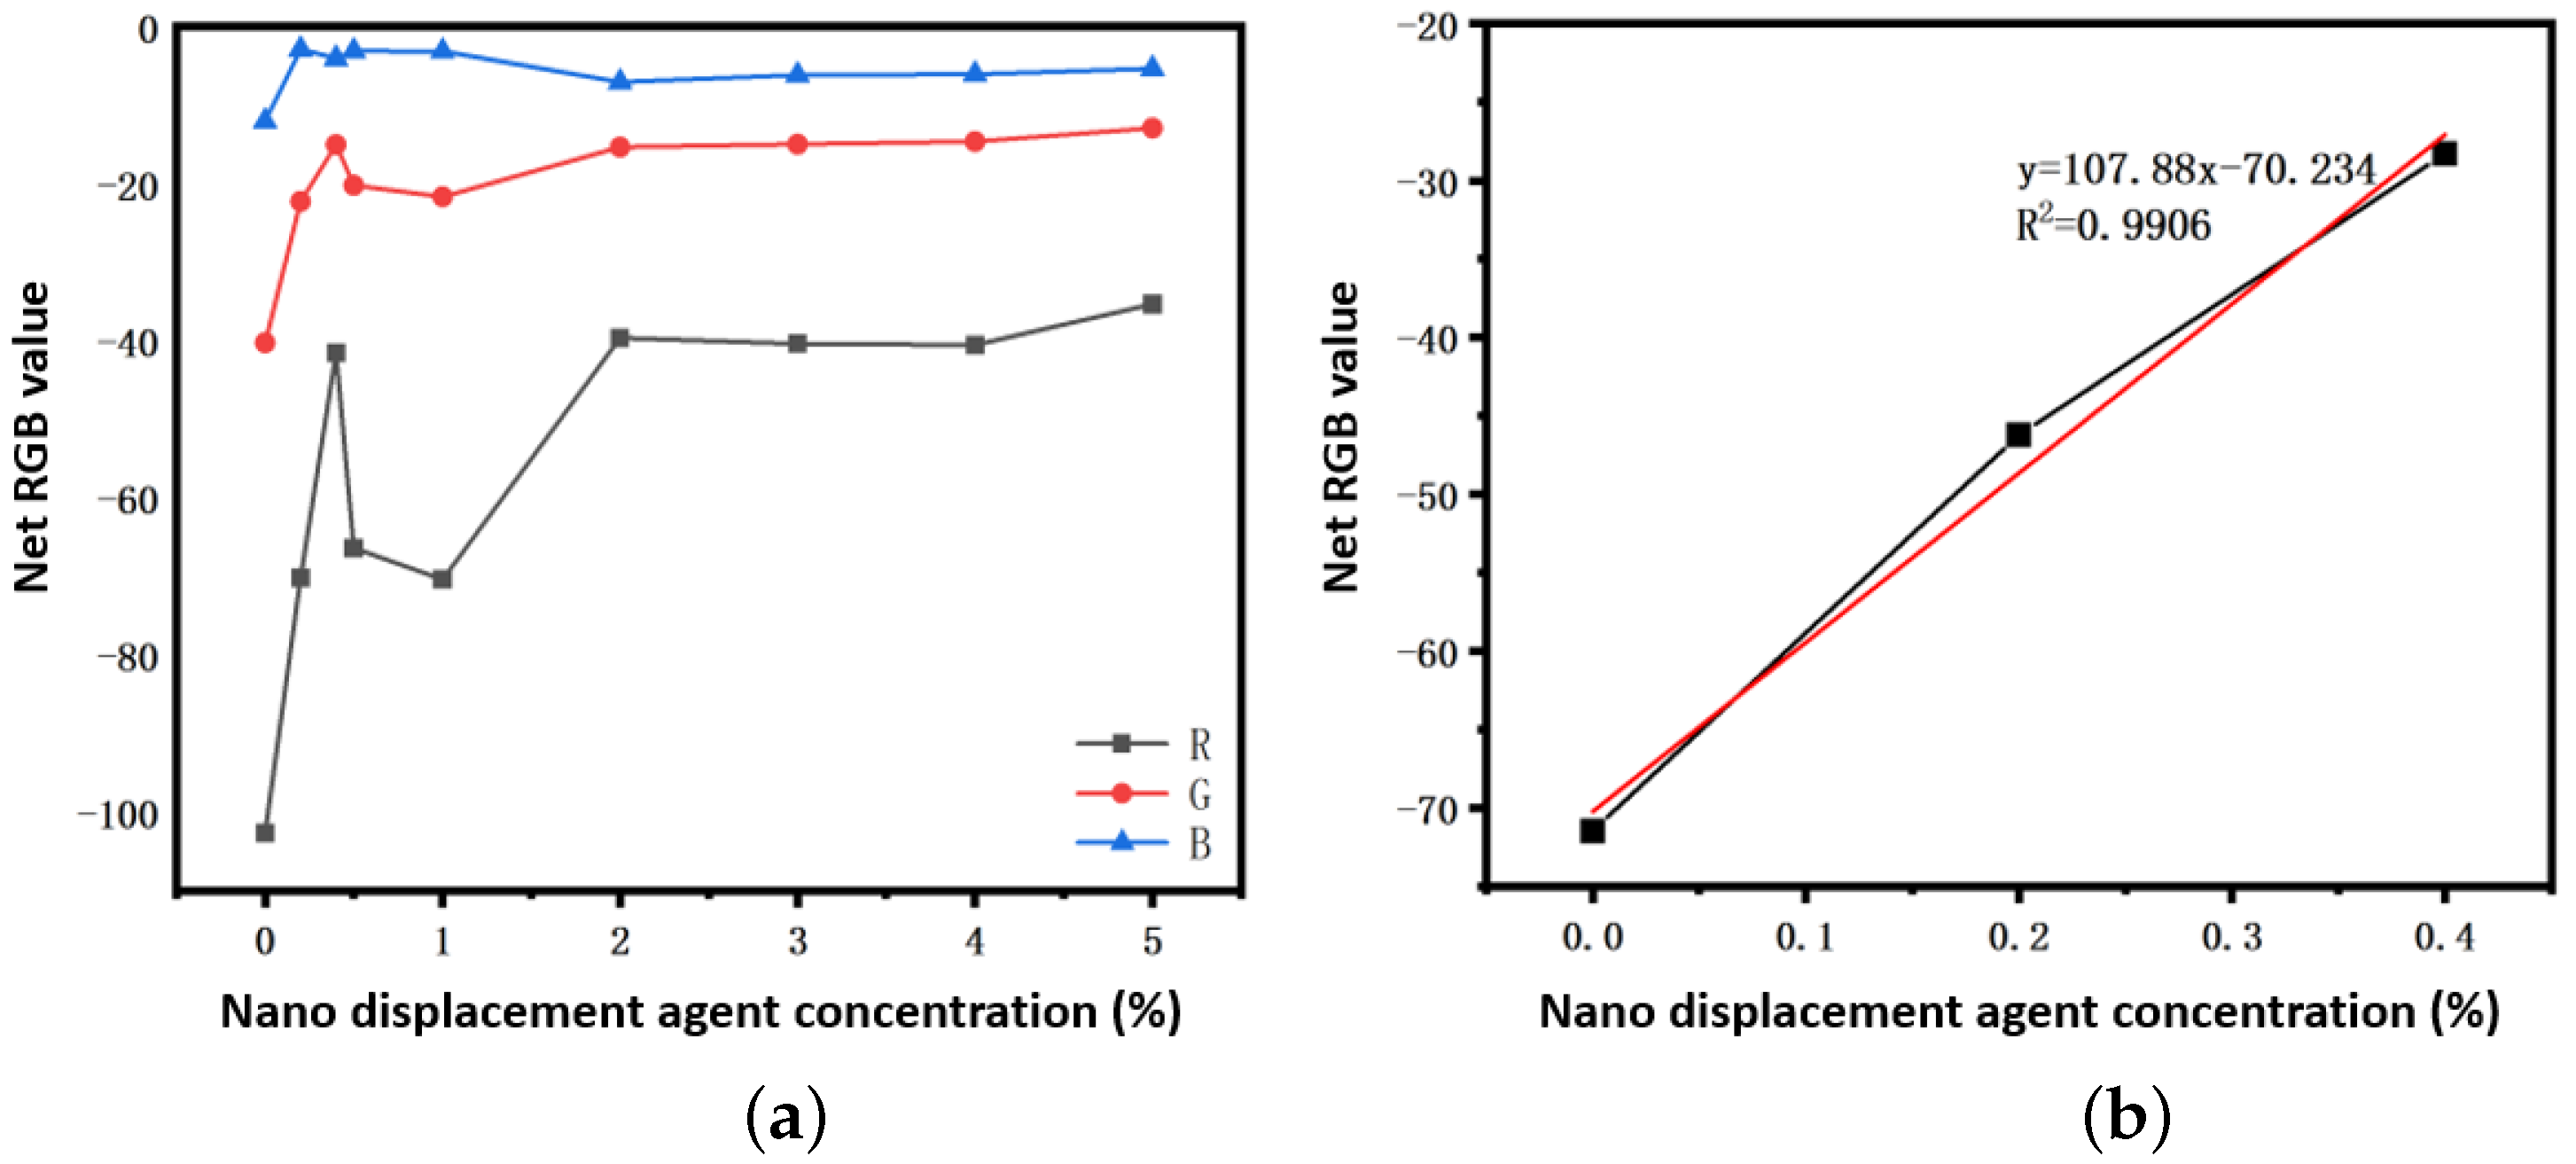
To eliminate the influence of the chip’s color that is inherent in the material itself, the RGB values of the nano-displacement agent and detection solution mixture were subtracted by the RGB values of the pure PDMS material outside of the pores to obtain the net RGB values within the small pores. The relationship curve between the net RGB values and the nano-displacement agent concentration is presented below in Figure 5.
As shown in Figure 5a, the net RGB value reaches its peak when the nano-displacement agent concentration is approximately 0.4%, indicating the most significant fading effect of the chromogenic reagent at this concentration. Below 0.4%, the fading effect of the chromogenic reagent is highly sensitive to concentration changes, while above 0.4%, the fading effect gradually diminishes.
The figure also reveals that, compared to B values, the R and G values exhibit a distinct linear trend when the nano-displacement agent concentration is below 0.4%. By calculating the arithmetic mean of the R and G values in the small pores, a standard relationship curve is obtained, as shown in Figure 5b. A linear fit of the nano-displacement agent concentration versus the net (R + G)/2 standard relationship curve yields the linear expression for small pores in the 0–0.4% range, as given by Equation (1):
y = 10.778 x 70.234 .

4. Diffusion Characteristics of Nano-Displacement Agent Within Micropores

4.1. Experimental Procedures
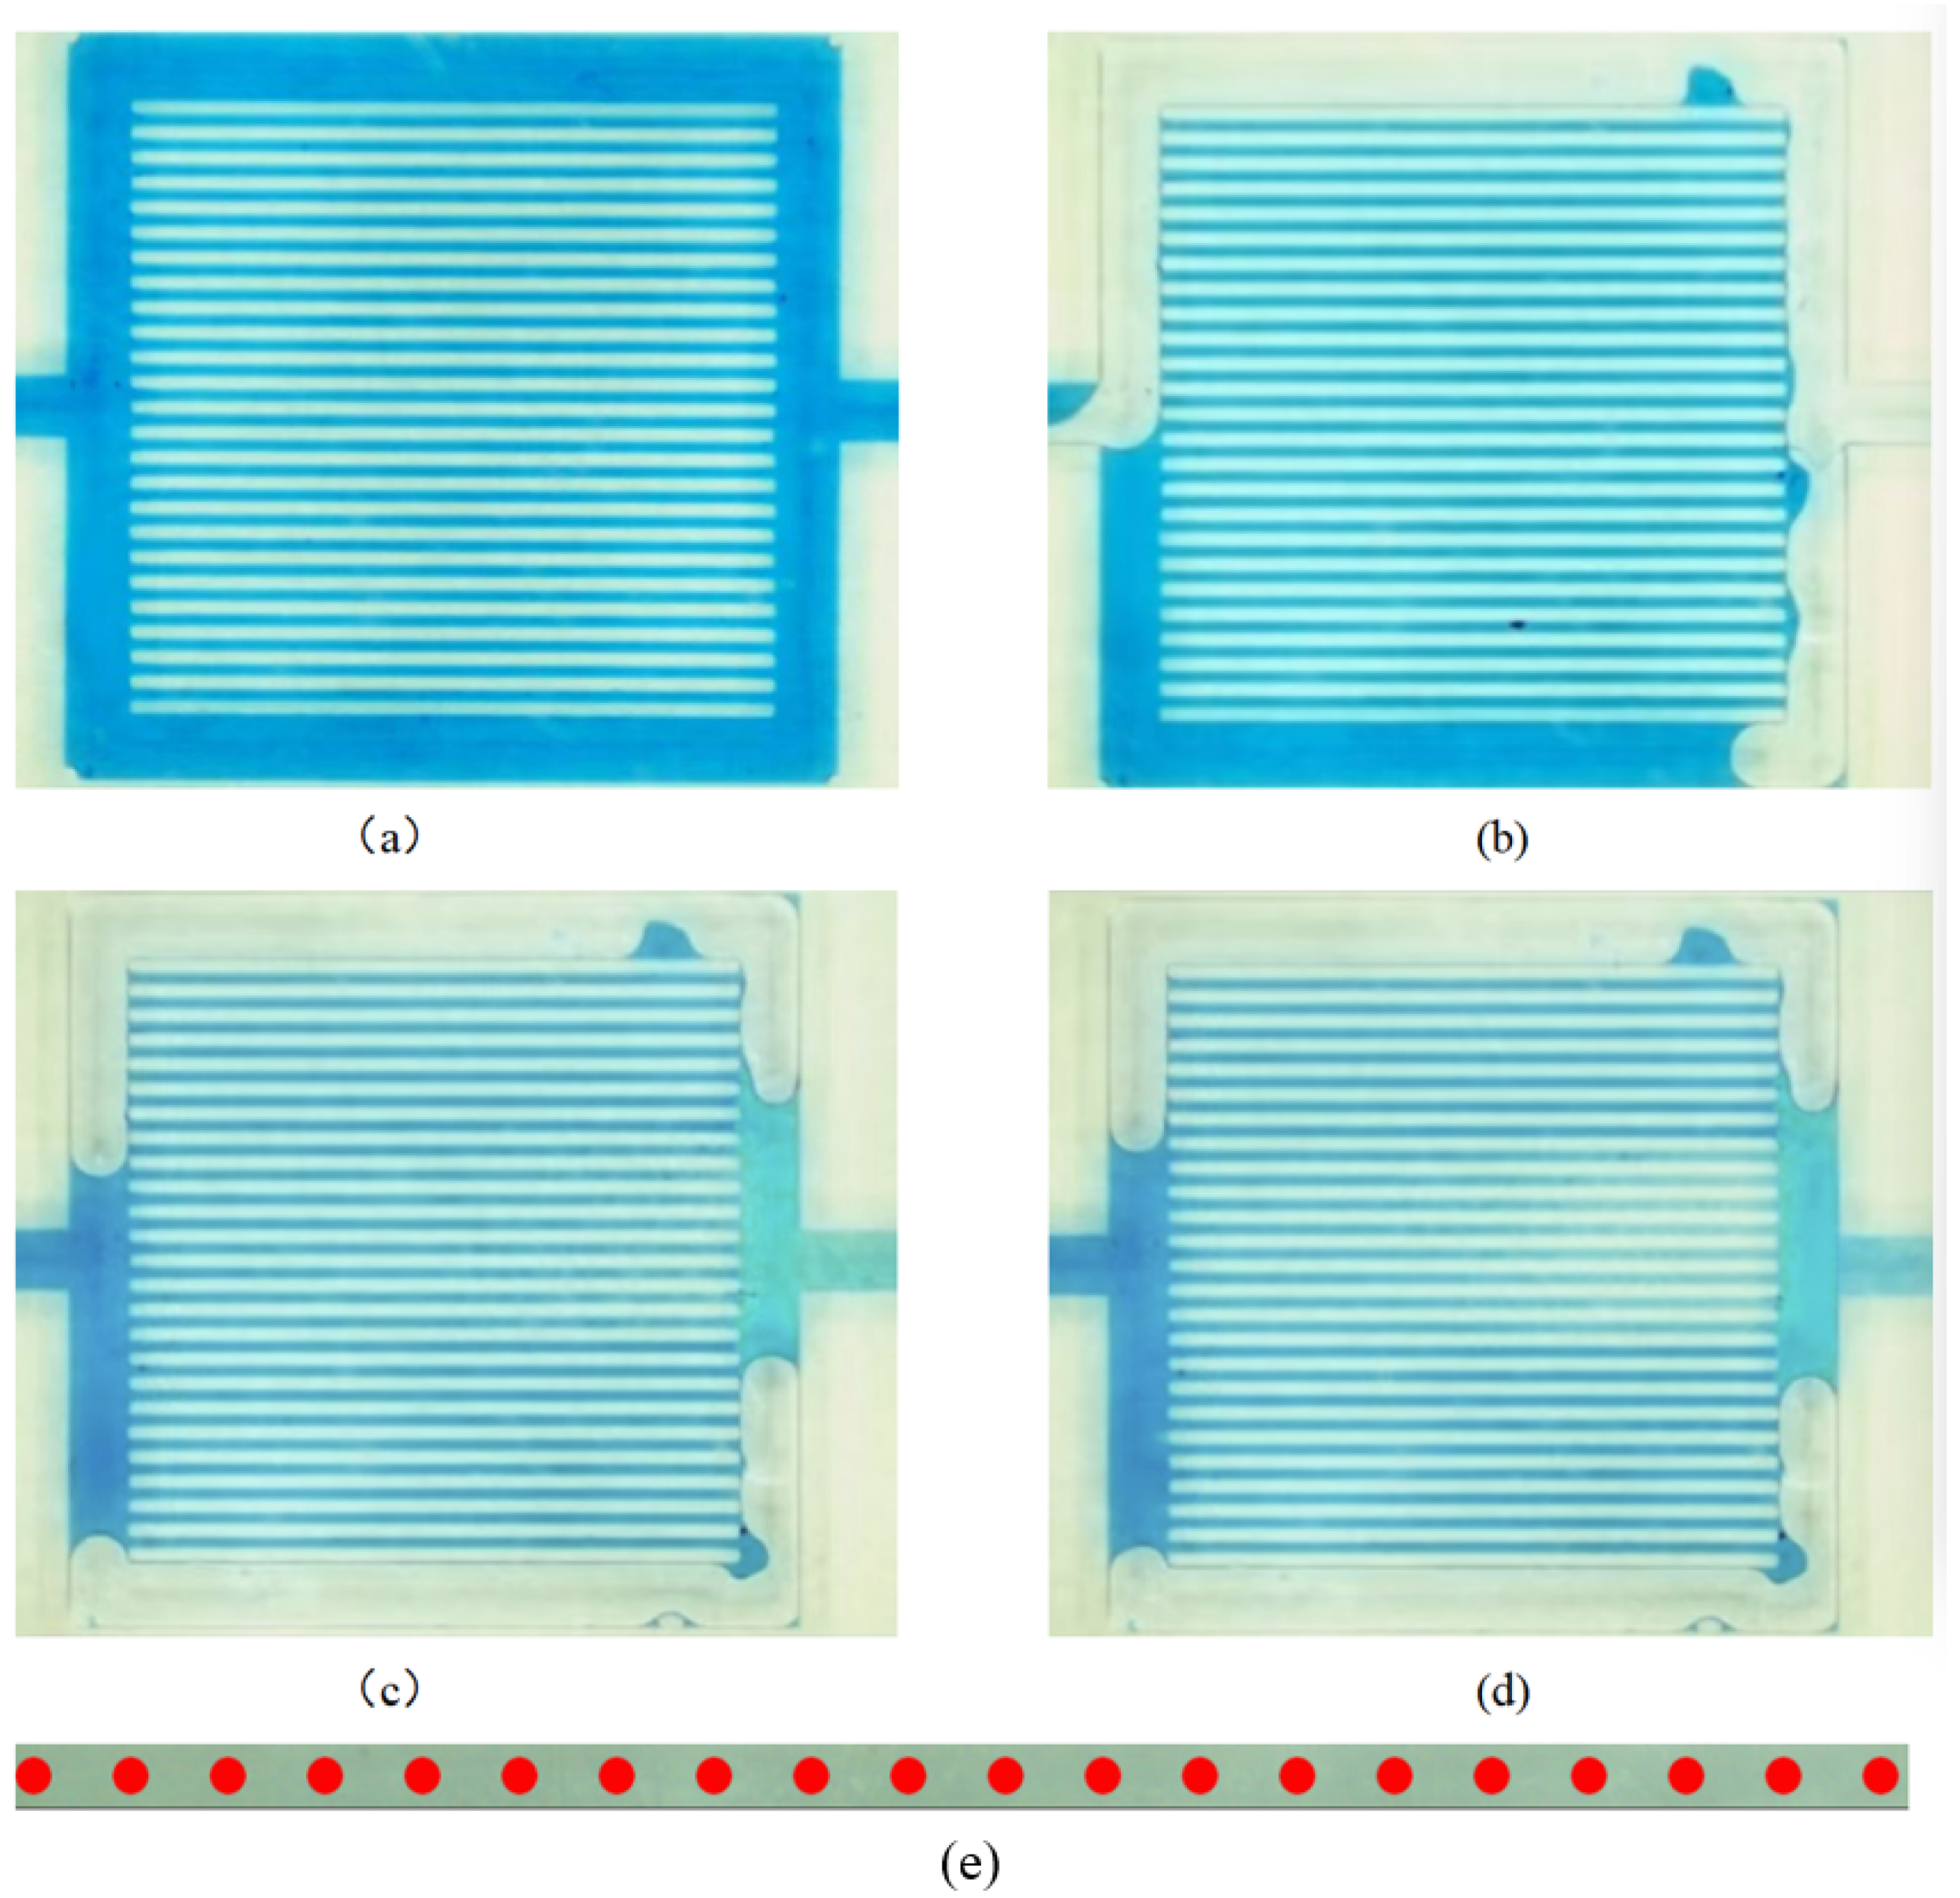
(1) The entire chip’s pores were fully saturated with the detection solution (in the absence of the nano-displacement agent).
(2) To prevent direct contact between the detection solution and the nano-displacement agent during injection, air was injected into chip at a low flow rate (0.01 mL/min). Due to the non-wetting nature of PDMS (the chip material) with water, air preferentially entered the larger pores (which have lower capillary resistance), while smaller pores remain unaffected. This isolated the detection solution from the nano-displacement agent solution (Figure 6b).
(3) The nano-displacement agent solution, 0.4% in concentration, was injected into the chip at the same flow rate (0.01 mL/min). The injection was immediately stopped when the nano-displacement agent contacted the edge of the small pores, where it met the detection solution. Changes in color was recorded as the nano-displacement agent slowly diffused into the small pores, and the diffusion behavior within micrometer-scale pores was analyzed.
Figure 6. (a) Chip is saturated with coloring agent, (b) distribution of fluids with the chip after air injection, (c) beginning of diffusion in 100 μm channel, (d) two hours after diffusion, and (e) positions where RGB values are sampled by programming.
Processes 13 02546 g006

4.2. Diffusion Characteristics of Nano-Displacement Agent Within Micropores

It can be observed that, at the onset of injection, all small pores appear blue. As time progresses, significant color fading occurs near the injection end of the nano-displacement agent. Through programming (code provided in Appendix A), RGB values of nano-displacement agent solutions at different concentrations and positions within the microfluidic chip were read at equal intervals, with twenty data points collected per small pore.
Based on the standard curve (Equation (1)), the RGB values within the small pores were converted into nano-displacement agent concentrations. This yielded concentration profiles of the nano-displacement agent at different positions.

4.3. Diffusion Within 100 μm Pores

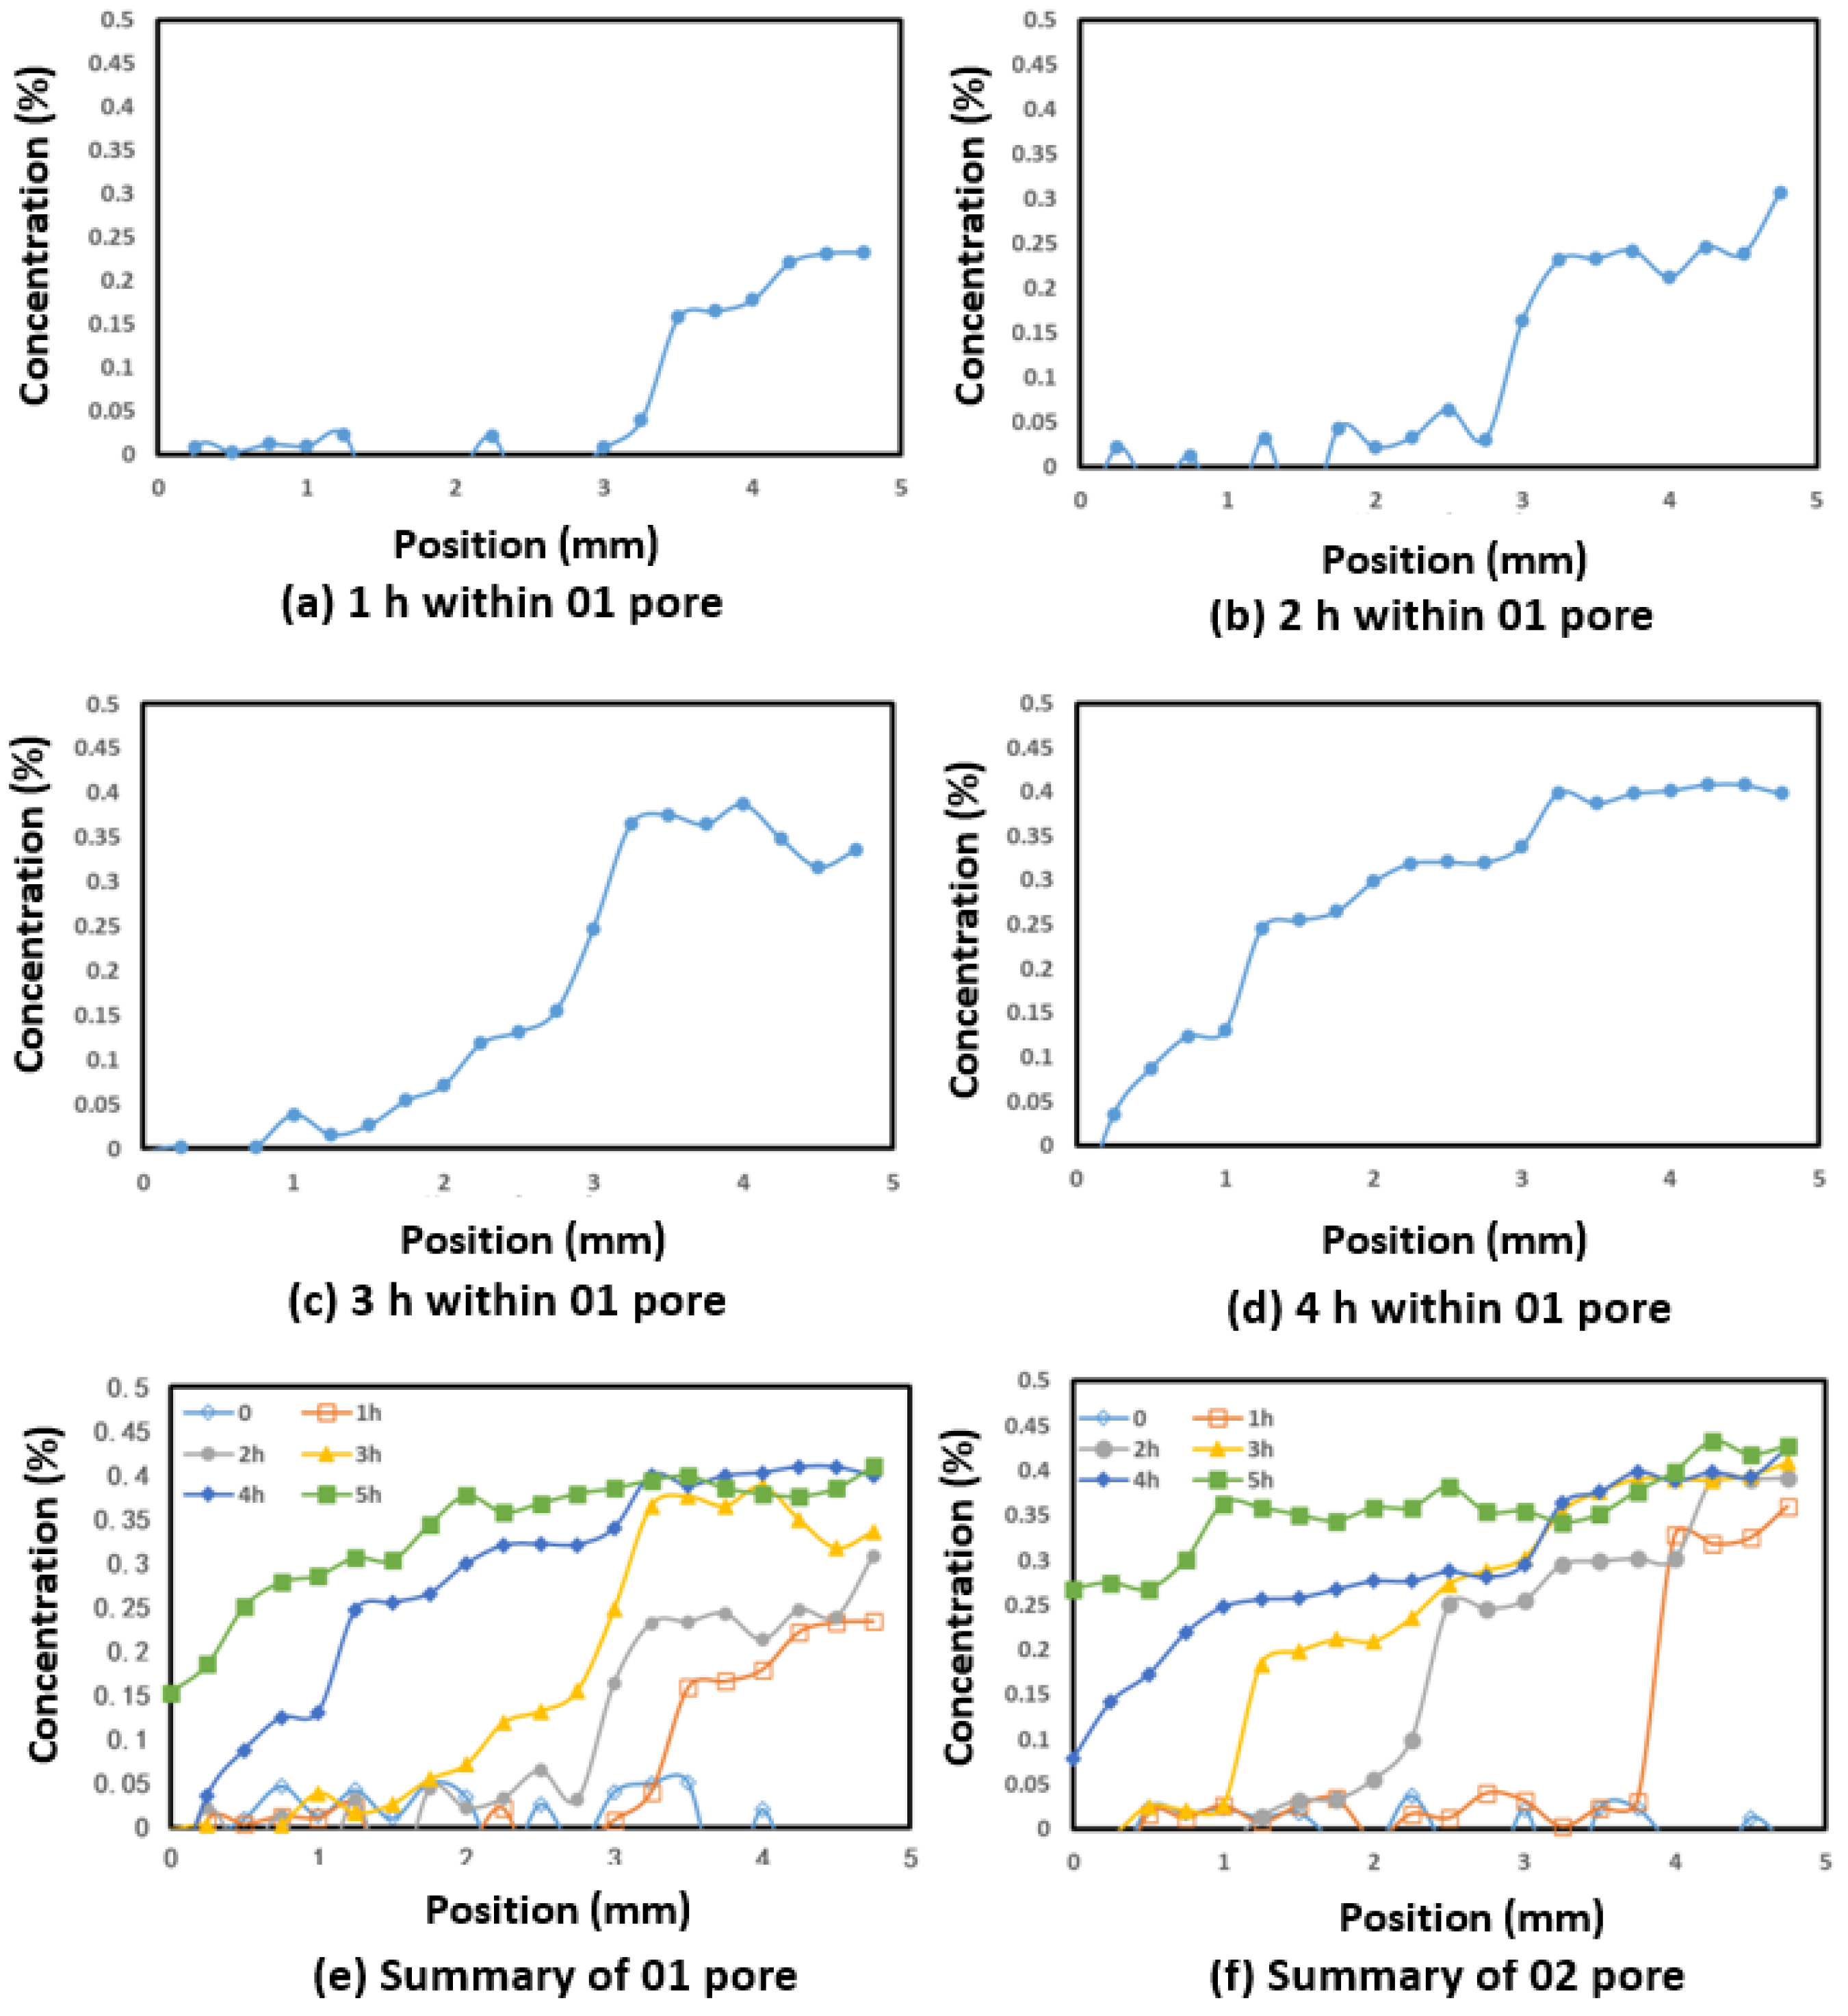
By using the standard curve, the RGB values within the small pores of a microfluidic chip with a pore diameter of 100 μm were fully converted into nano-displacement agent concentrations, resulting in concentration distributions at different time points within the analyzed small pores. Two representative pores (numbered 01 and 02) were selected and plotted as shown in Figure 7. Subfigures (a–d) represent the diffusion results of Pore 01 at different diffuse durations within the 100 μm pores. For easy comparison, the concentration distributions of the nano-displacement agent in Pore 01 at different time points were compiled in Figure 7e. Additionally, to demonstrate the repeatability of this distribution pattern, the same analysis was performed on Pore 02 and is summarized in Figure 7f.
As shown in Figure 7, it can be observed that the concentration of the nano-displacement agent near the injection end remains relatively stable over time, while the concentration distribution exhibits a decreasing trend as it continues to diffuse inward. As the diffusion proceeds, the advancement of the nano-displacement agent in the pores becomes relatively uniform. The concentration at the diffusion front is lower compared to the original concentration of the nano-displacement agent at the injection end, and a significant concentration gradient exists between the diffusion front and the injection end.

4.4. Diffusion Within 50 μm Pores

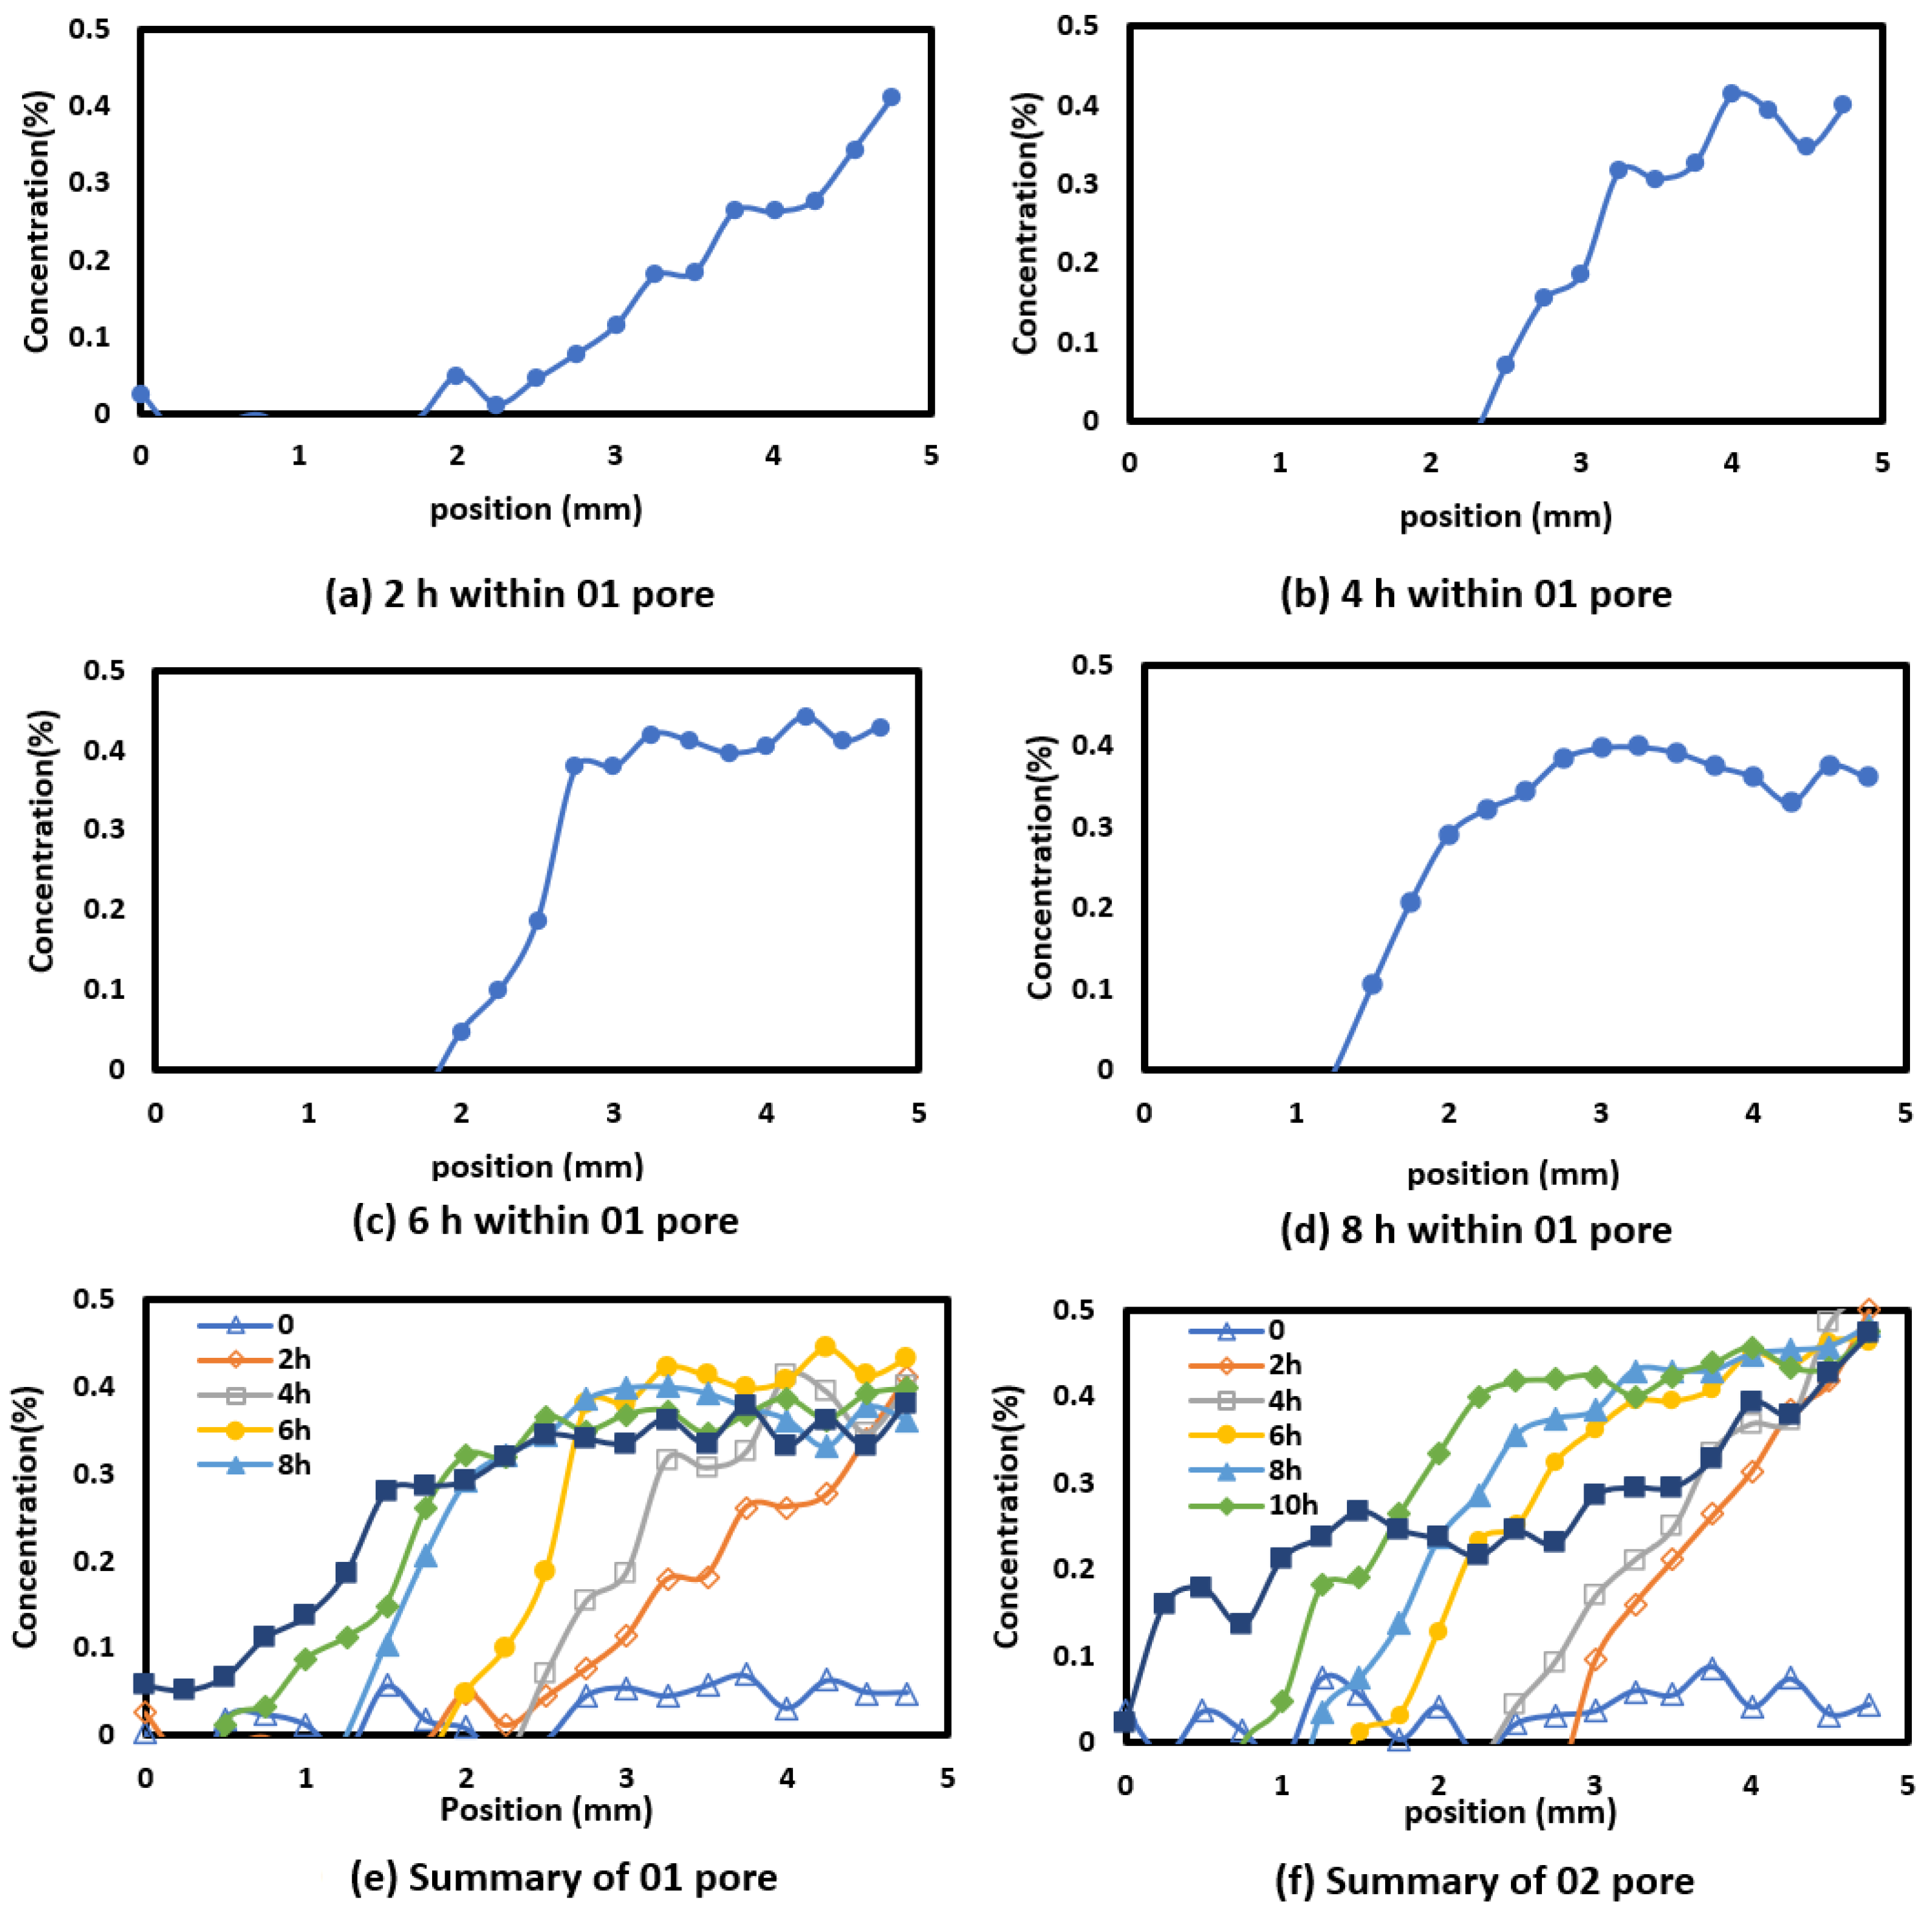
Using the standard curve, the RGB values within the small pores (50 μm) of a microfluidic chip were converted into nano-displacement agent concentrations within the selected pores 01 and 02 at a specific time, as illustrated in Figure 8. It can be observed that, similar to that within the 100 μm pores, with increasing time, the concentration of the nano-displacement agent near the injection end remains relatively uniform, while the concentration distribution exhibits a decreasing trend as it continues to diffuse inward. However, the rate of concentration decline is faster compared to that in a chip with a 100 μm pore diameter.

4.5. Diffusion Within 20 μm Pores

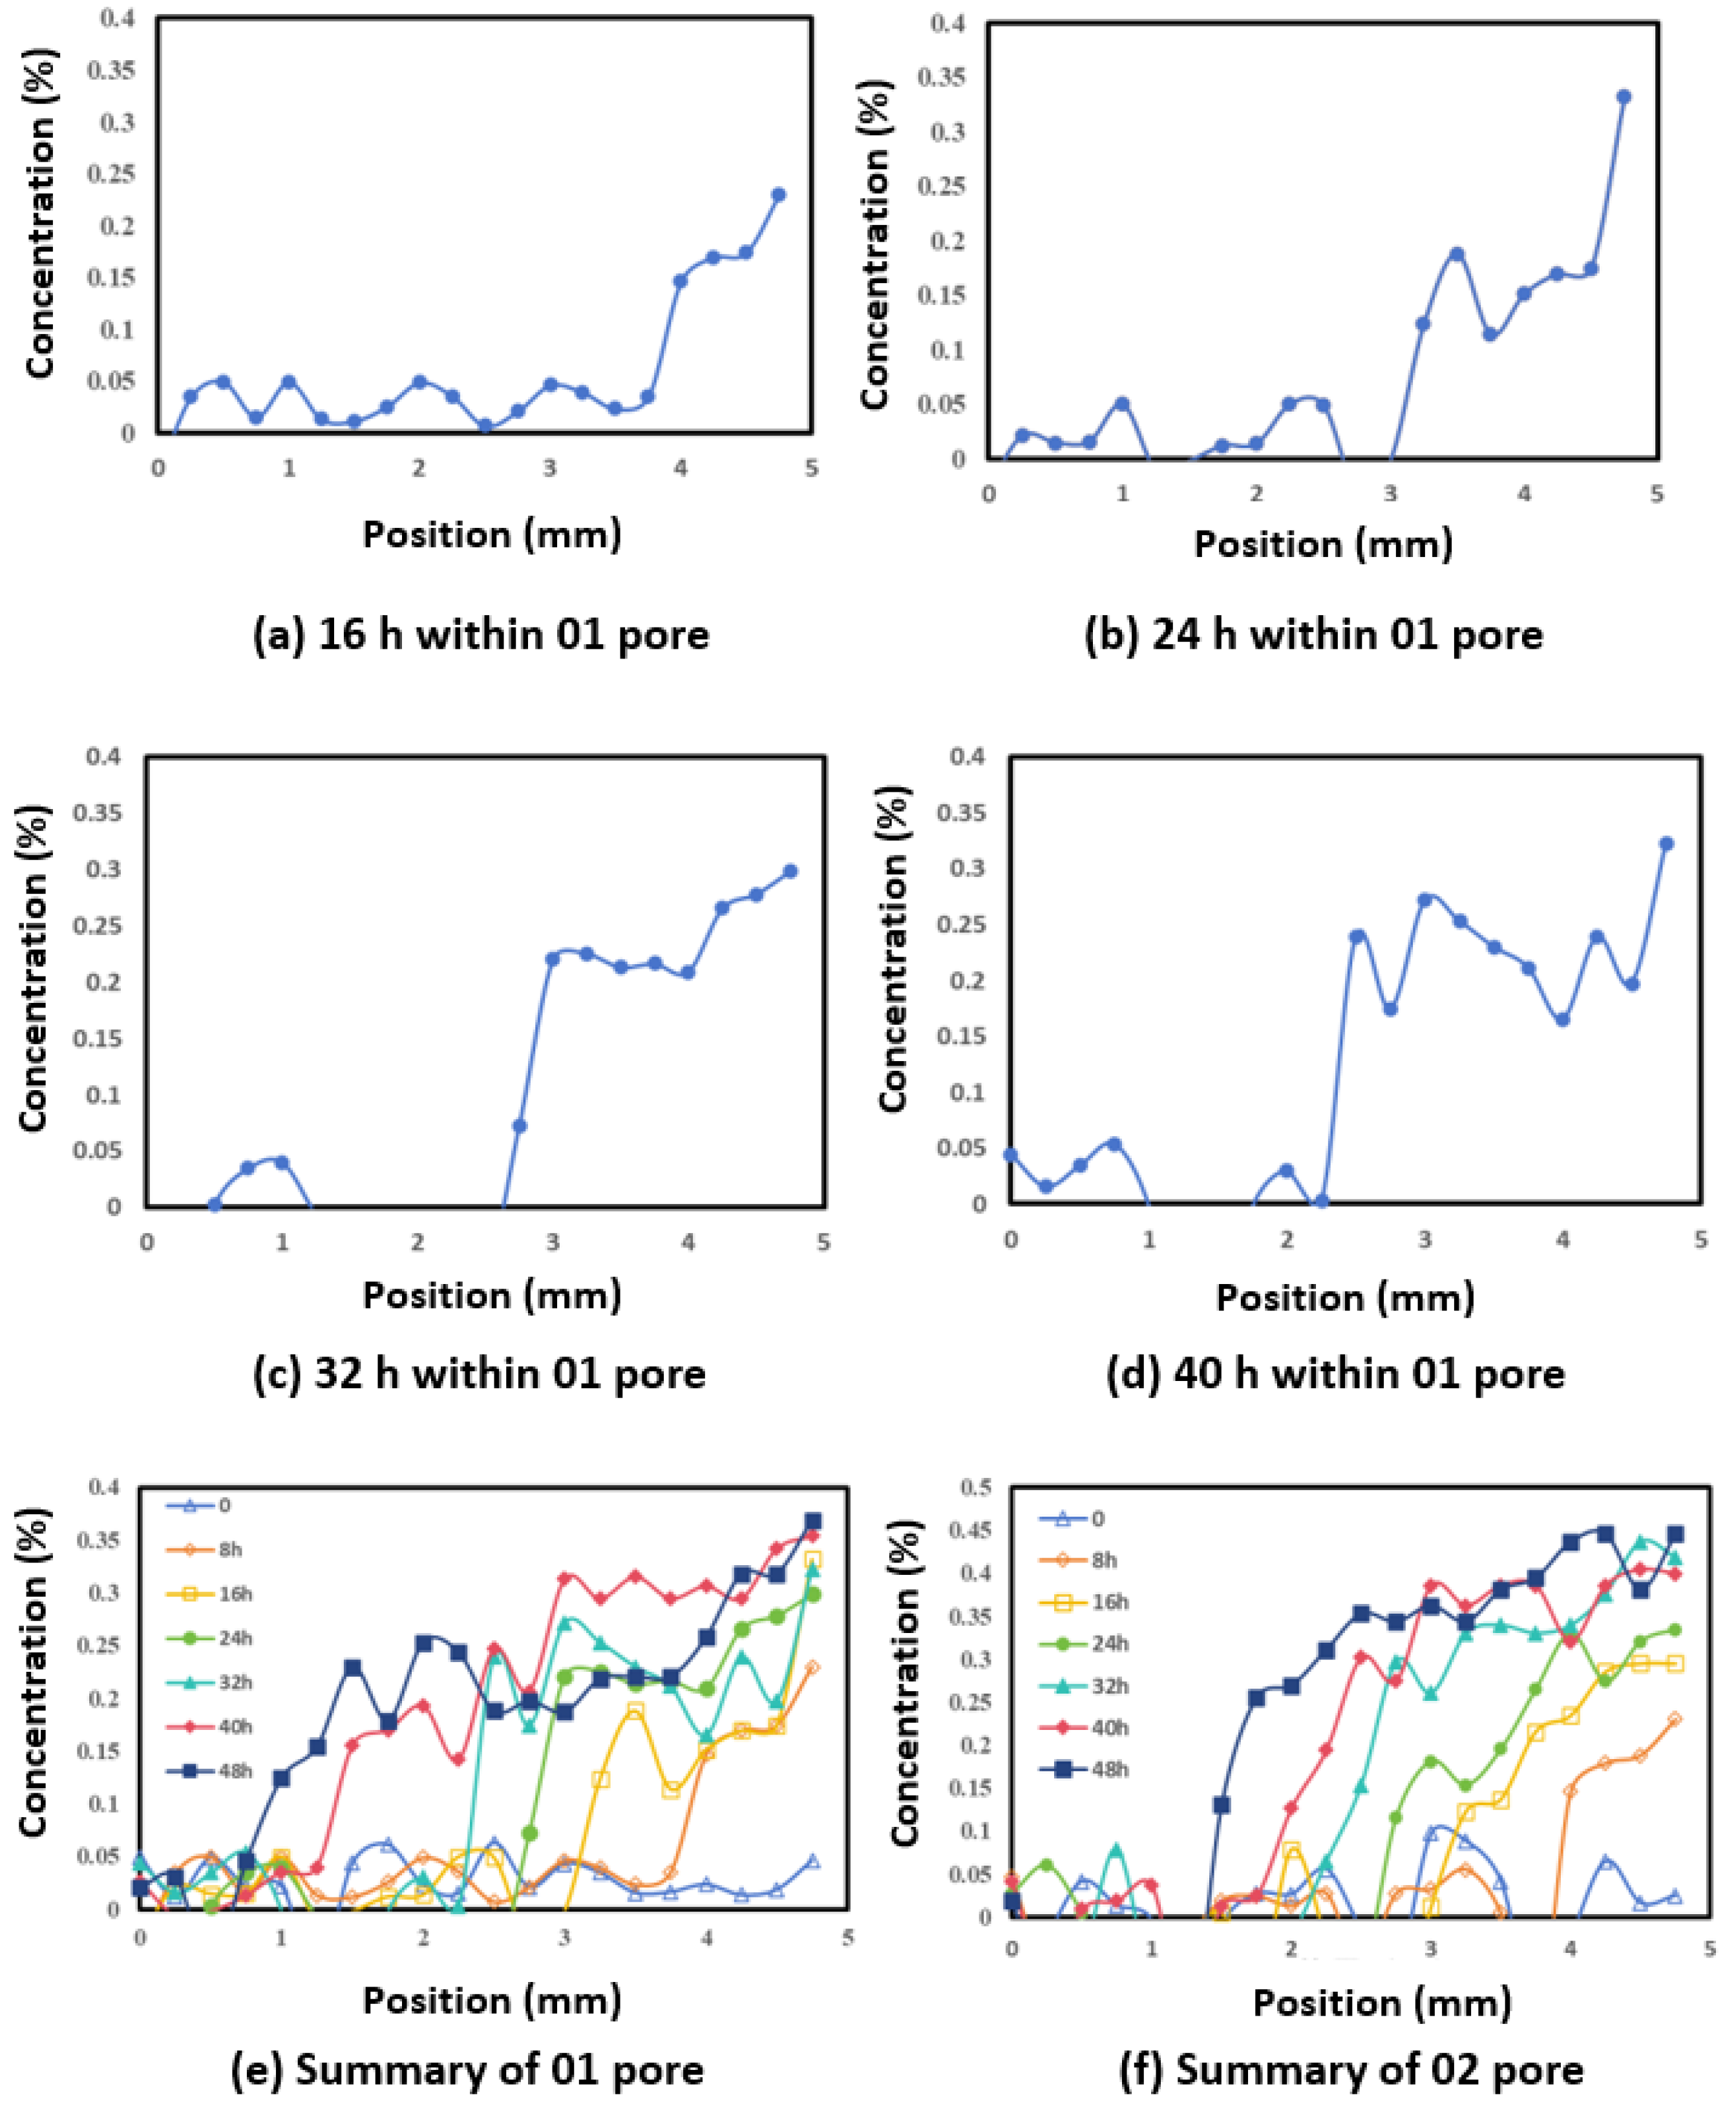
The color distribution of the solution in the microfluidic chip with a 20 μm pore diameter were obtained from the diffusion of the nano-displacement agent. Again, by employing the standard curve, the RGB values within the chip with a 20 μm pore diameter were fully converted into nano-displacement agent concentrations, as shown in Figure 9. It can be observed that, as time increases, the diffusion rate of the nano-displacement agent slows down significantly compared to the scenarios with larger pore diameters. Additionally, the concentration distribution exhibits a clear decreasing trend from the inlet end to the outlet end. This trend is consistent with the results observed previously.
Comparing the diffusion behaviors of nano-displacement agents within pores of different diameters, it is clear that with smaller pore sizes, both the diffusion depth and diffusing velocity decrease significantly. As the diffusion depth increases, the concentration of the nano-displacement agent along the flow path exhibits a decreasing trend. In practical unconventional oil reservoirs, which are characterized by predominantly nano- to micrometer-scale pore throats, poor pore connectivity, complex pore geometries, small pore radii, and strong heterogeneity [36], the diffusion velocity and penetration depth within reasonable time frames of the nano-displacement agent are significantly restricted by pore size under constant concentration and absence of external pressure. Therefore, in field applications, strategies such as increasing the concentration of the nano-displacement agent and applying external pressure should be adopted to enhance both the diffusion velocity and penetration depth of the agent.

4.6. Determination of the Diffusion Coefficient

The diffusion coefficient is a critical physical parameter that quantifies the ability of a substance to diffuse over time within another medium. Its magnitude is influenced by factors such as molecular size, medium properties, temperature, and pressure [37,38]. Fick’s First Law describes the impact of concentration gradients on diffusion rates. To more quantitively describe the characteristics of diffusion within restricted space, through simplification of its original form (Equation (2)) to derive Equation (3), and by integrating experimental diffusion data obtained from micropores in microfluidic chips under varying pore diameters, the diffusion coefficients corresponding to different pore sizes were determined.
J = D d C d x
D = ( Δ x ) ) 2 t
where J represents the diffusion flux (kg/mm2·h), D denotes the diffusion coefficient (mm2/h), x signifies the diffusion depth (mm), and t corresponds to the diffusion time (h).
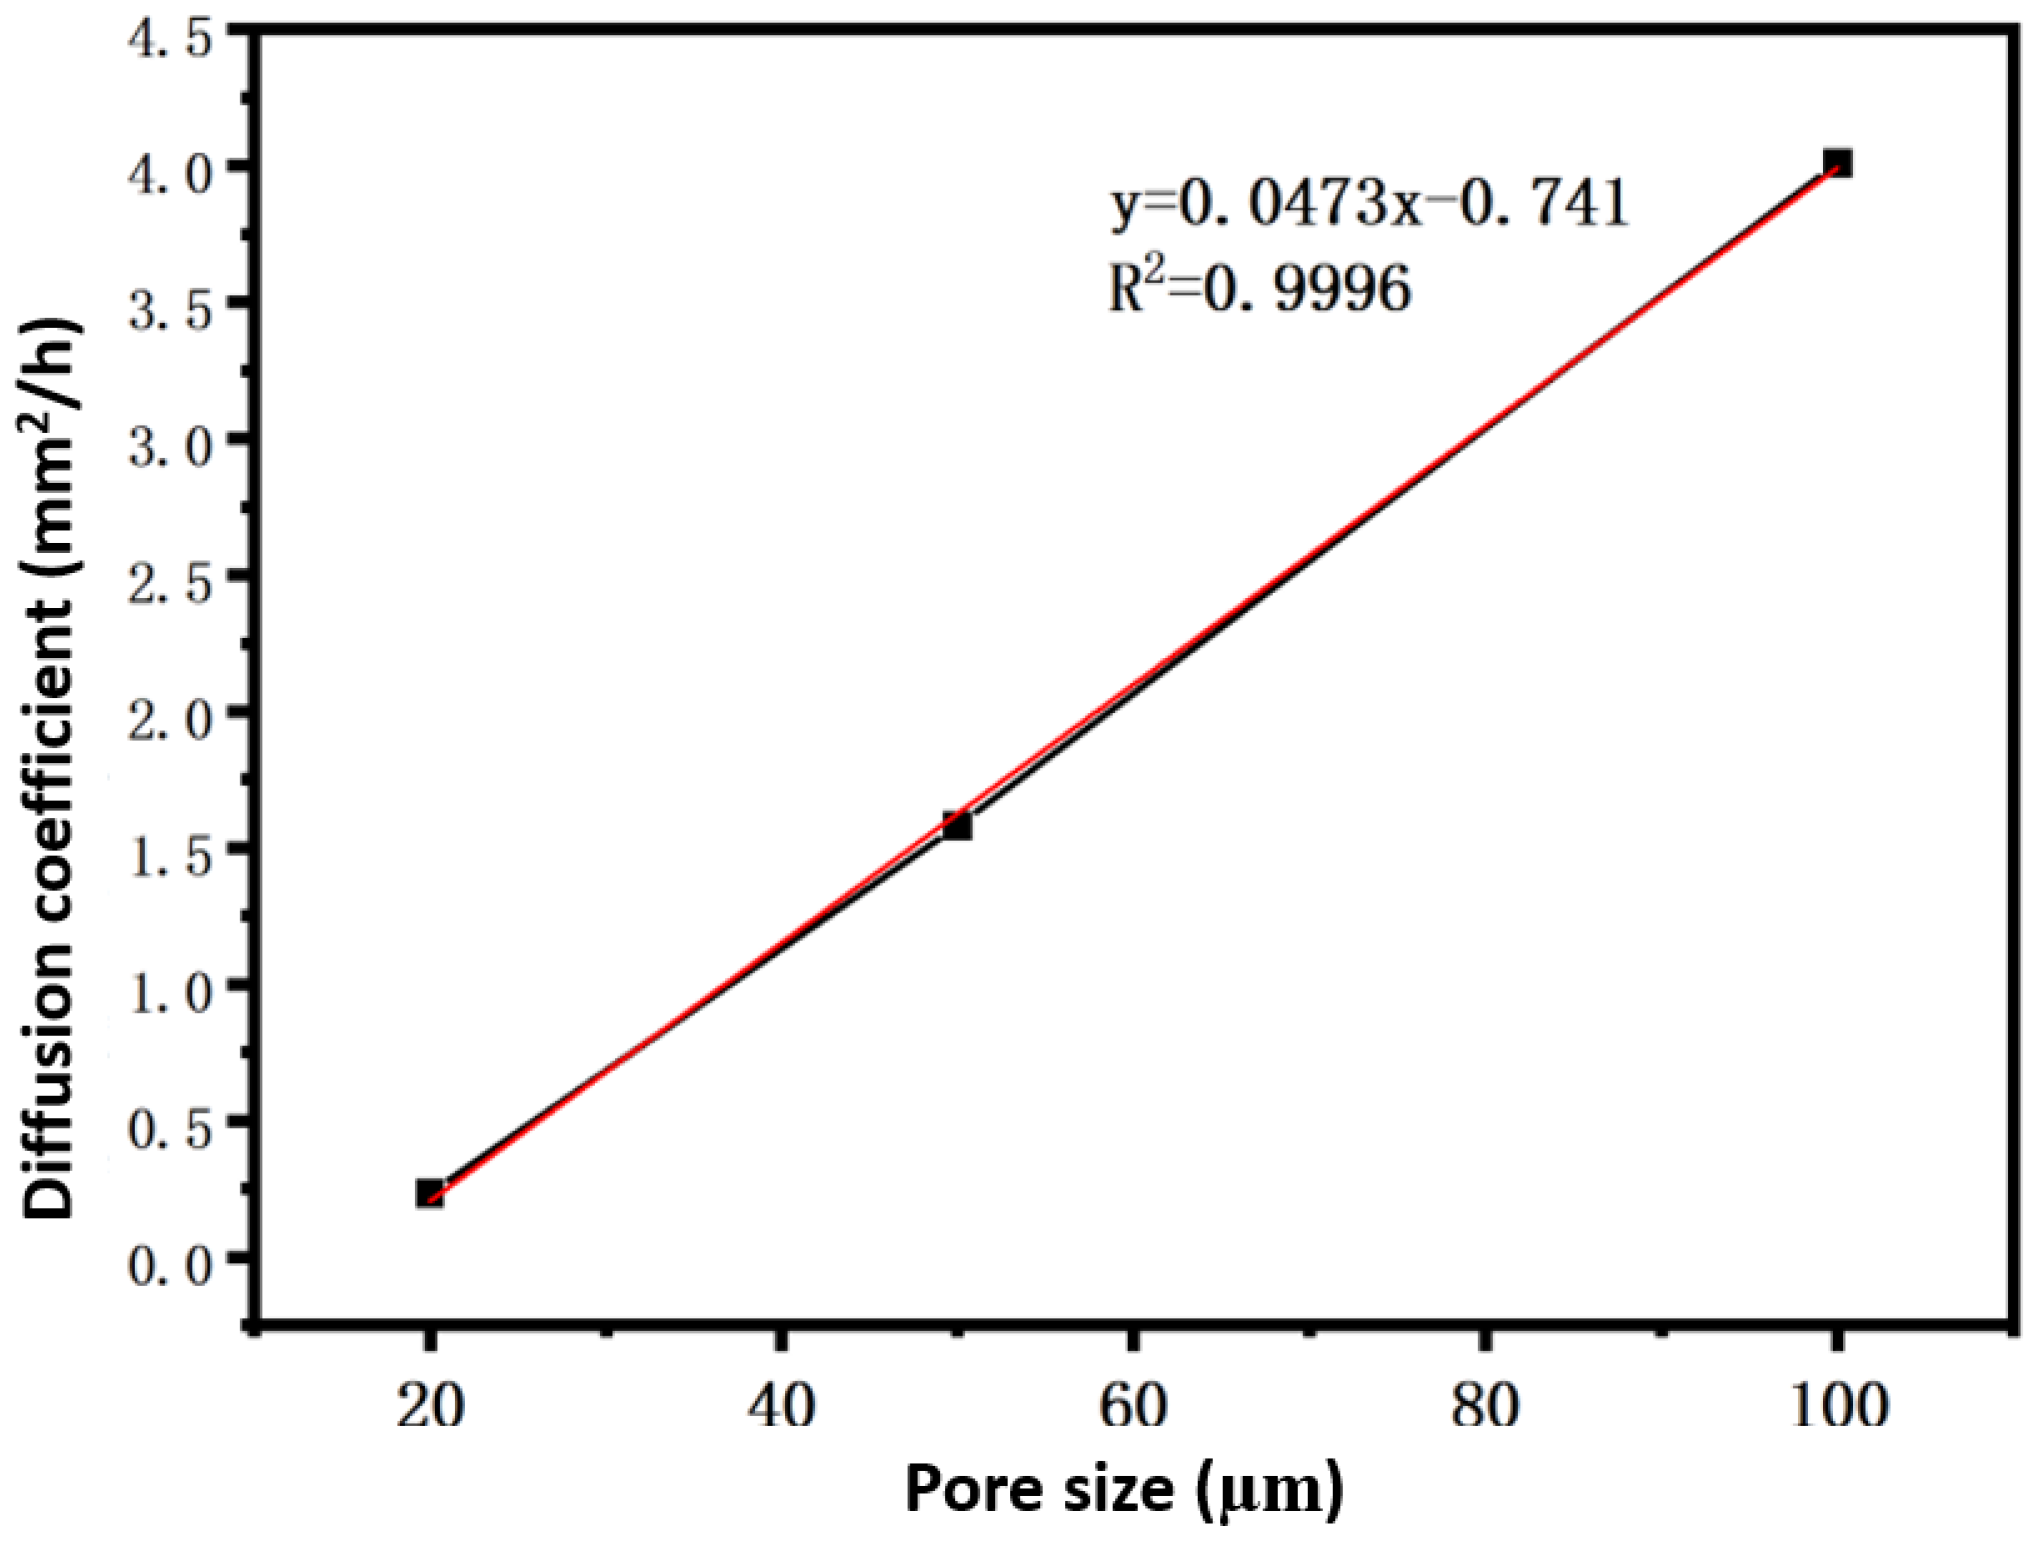
The calculated diffusion coefficients are 4.009 mm2/h, 1.580 mm2/h, and 0.234 mm2/h, respectively, for pore diameters of 100 μm, 50 μm, and 20 μm. This clearly shows that, as the pore diameter decreases, the diffusion coefficient diminishes, resulting in a slower diffusion rate.
To summarize, the experimental results indicate that the diffusion behavior of nano-displacement agents directly impacts their penetration depth in porous media. The diffusion coefficient decreases significantly as the pore size diminishes, thereby limiting both the diffusion depth and velocity of the displacing agent. Specifically, the agent achieves uniform diffusion to deeper regions within a relatively short timeframe in 100 μm pores, exhibiting a gentle concentration gradient. This may translate to a higher oil displacement efficiency if oil were present. By comparison, in 50 μm pores, the diffusion velocity slows down, resulting in a steeper concentration gradient, restricted diffusion depth, and a potentially moderate oil displacement efficiency. In 20 μm pores, the diffusion occurs at an extremely slow rate with a pronounced concentration gradient, making it difficult for the agent to effectively reach deep regions, potentially yielding low oil displacement efficiency. This generally falls in line with the findings of Wang et al. [26]
The calculated diffusion coefficients were plotted against the pore diameters of the microfluidic chip, as shown in Figure 10. It can be observed that there is a significant linear relationship between the pore diameter and the diffusion coefficient, with R2=0.9996. A linear fit to the data yielded the relationship between the diffusion coefficient and the chip pore diameter, as expressed in Equation (4). It can also be inferred that when the pore diameter is 15.66 μm, diffusion cannot proceed in the absence of external pressure. Thus, 15.66 μm represents the lower limit of pore size that permits diffusion of the nano-displacement agent under the experimental temperature and pressure conditions.
y = 0.0473 x 0.741 .
It should be noted that, during this study, it was assumed that the nano-displacement agent diffuses solely inward into the microfluidic chip, whereas the diffusion of the detection solution outward from the chip was neglected. Additionally, it was postulated that ion pairs formed between the nano-displacement agent and the detection agent do not affect the diffusion of the nano-displacement agent itself, and differences in color development due to variations in the concentration ratio of the two agents were disregarded. Despite these simplifications, the determination of the diffusion front position of the nano-displacement agent relied on rigorous RGB color change analysis. In addition, the dispersion of different components, if they are not in the form of complexes, is independent of each other. In other words, the backward diffusion of detection solution does not affect the forward diffusion of the surfactants; instead, it only impacts the color distribution, if any, outside the channels. As for the ion pairs (or complexes) formed between the surfactants and the detection agents, they may also influence the color distribution of the solution, because complexes that are larger in size and heavier in weight tend to move more slowly. However, this does not impact the diffusion front. Therefore, the major conclusions are still valid.
Furthermore, it should be mentioned that diffusion behavior in this work was obtained in a parallel set of homogeneous, smooth channels that are not inter-connected, where the diffusion may be influenced by other than the heterogeneity, tortuosity, and the smoothness of the pores. More dedicated investigation should be conducted using chips with more realistic and representative pore and channel design.

5. Conclusions

Based on microfluidic experiments and analysis of nano-displacement agent diffusion in porous media, this study reveals key insights into surfactant transport characteristics under reservoir conditions. The following conclusions can be drawn:
The anionic surfactant detection system exhibits optimal sensitivity at a nano-displacement agent concentration of approximately 0.4%, where Victoria Blue decolorization reaches maximum efficacy. Below this threshold, a robust linear correlation exists between RGB values (specifically, (R+G)/2) and surfactant concentrations, establishing a reliable quantitative method for real-time monitoring of surfactant distribution. Diffusion coefficients were determined as 4.009 mm2/h (100 μm), 1.580 mm2/h (50 μm), and 0.234 mm2/h (20 μm), demonstrating an inverse relationship with pore diameter, which can potentially affect the oil displacement efficiency in an actual reservoir. This finding confirms that diffusion velocity decreases with decreasing pore size, concentration gradients exhibit steeper decay in smaller pores, and that a critical pore size threshold of around 15.66 μm potentially exists for spontaneous diffusion under standard experimental conditions. This denotes a clear reservoir constraint for the effective application of nano-scale oil displacement agents in unconventional oil and gas reservoirs. For formations with pore sizes approaching or below a corresponding threshold, external pressure or other enhancement methods should be considered to facilitate the migration of the displacing agent.
The observed diffusion behaviors suggest significant practical implications for tight oil recovery and will ultimately contribute to optimized design of chemical flooding strategies for unconventional resources.

Author Contributions

Conceptualization, S.B.; methodology, J.L.; experiment, J.L., W.X. and S.G.; writing—original draft preparation, review, and editing, J.L. and S.B. All authors have read and agreed to the published version of the manuscript.

Funding

This work has been funded by the Basic scientific research fund of Xinjiang Uyghur Autonomous Region (No. XQZX20220094) and the Tianchi Talent Project.

Data Availability Statement

Data inquiries can be directed to the corresponding author.

Conflicts of Interest

The authors claim no conflicts of interest for this manuscript.

Abbreviations

The following abbreviations are used in this manuscript:
IFTinterfacial tension
RGBred green blue
EORenhanced oil recovery
PDMSPolydimethylsiloxane

Appendix A

The Python 3.13 code for RGB reading is as follows:
import numpy as np
from PIL import Image
class CFG:
l=3
class CFG:
path = r"xx.png"
x1 = 453
y1 = 466
x2 = 986
y2 = 466
def fun1(image, x1, y1, x2, y2):
x_= np.abs(x1-x2)
y_= np.abs(y1-y2)
if x_ == 0:
x_ list = np.full(20, x1)
else:
x_list = np.arange(x1, x2, np.abs(x2-x1)/20)
x_list = np.array([np.floor(x) for x in x_list])
if y_== 0:
y_list = np.full(20, y1)
else:
y_list = np.arange(y1, y2, np.abs(y2 - y1) / 20)
y_list = np.array([np.floor(y) for y in y_list])
return np.array([image[int(y_list[i]), int(×_list[i]), :] for i in range(len(x_list))])
image = Image.open(CFG.path)
rgb_image = image.convert("RGB")
rgb_image_li = np.asarray(rgb_image)
result_list = fun1(rgb_image_li, CFG.x1, CFG.y1, CFG.x2, CFG.y2)
print(result_list)

References

  1. Li, M.; Wu, S.; Zhu, R.; Hu, S.; Wang, P.; Cai, Y.; Zhang, S. Heterogeneity and sedimentary characteristics of shale laminae of fine-grained sediments in alkaline lacustrine strata in the Permian Fengcheng Formation, Mahu Sag, NW China. Energies 2024, 17, 962. [Google Scholar] [CrossRef]
  2. Kuang, L.; Tang, Y.; Lei, D.; Chang, Q.; Ouyang, M.; Hou, L.; Deguang, L. Formation conditions and exploration potential of tight oil in the permian saline lacustrine dolomitic rock, Junggar Basin, NW China. Pet. Explor. Dev. 2012, 39, 700–711. [Google Scholar] [CrossRef]
  3. Chaohua, G.; Mingzhen, W.; Hong, L. Study of gas production from shale reservoirs with multi-stage hydraulic fracturing horizontal well considering multiple transport mechanisms. PLoS ONE 2018, 13, e0188480. [Google Scholar]
  4. Wang, C.; Gao, H.; Qi, Y.; Li, X.; Zhang, R.; Fan, H. Investigation on the mechanisms of spontaneous imbibition at high pressures for tight oil recovery. ACS Omega 2020, 5, 12727–12734. [Google Scholar] [CrossRef]
  5. Bai, J.; Liu, H.; Wang, J.; Qian, G.; Peng, Y.; Gao, Y.; Yan, L.; Fu-Lin, C. CO2, water and N2 injection for enhanced oil recovery with spatial arrangement of fractures in tight-oil reservoirs using Huff-N-Puff. Energies 2019, 12, 823. [Google Scholar] [CrossRef]
  6. Tu, J.; Sheng, J.J. Effect of pressure on imbibition in shale oil reservoirs with wettability considered. Energy Fuels 2020, 34, 4260–4272. [Google Scholar] [CrossRef]
  7. Wan, T.; Sheng, J.J. Enhanced recovery of crude oil from shale formations by gas injection in zipper-fractured horizontal wells. Pet. Sci. Technol. 2015, 33, 1605–1610. [Google Scholar] [CrossRef]
  8. Tian, W.; Wu, K.; Gao, Y.; Chen, Z.; Gao, Y.; Li, J. A critical review of enhanced oil recovery by imbibition: Theory and practice. Energy Fuels 2021, 35, 5643–5670. [Google Scholar] [CrossRef]
  9. Cao, Y.; Pan, Y.; Yang, S.; Zhao, X. Nanomaterials of displacement performance in low permeability reservoirs: A comprehensive review of experimental research and model evaluation. Phys. Fluids 2025, 37, 071307. [Google Scholar] [CrossRef]
  10. Ding, M.; Xue, X.; Wang, Y.; Zhang, C.H.; Qiu, S.Z. Mobilization of tight oil by spontaneous imbibition of surfactants. Pet. Sci. 2024, 21, 4176–4188. [Google Scholar] [CrossRef]
  11. Sun, Y.; Xin, Y.; Lv, F.; Dai, C.L. Experimental study on the mechanism of adsorption-improved imbibition in oil-wet tight sandstone by a nonionic surfactant for enhanced oil recovery. Pet. Sci. 2021, 18, 1115–1126. [Google Scholar] [CrossRef]
  12. Alvarez, J.O.; Neog, A.; Jais, A.; Schechter, D.S. Impact of surfactants for settability alteration in stimulation fluids and the potential for surfactant EOR in unconventional liquid reservoirs. In Proceedings of the SPE Unconventional Resources Conference, Vienna, Austria, 25–27 February 2014. [Google Scholar]
  13. Zhang, F.; Saputra, I.W.; Niu, G.; Adel, I.A.; Xu, L.; Schechter, D.S. Upscaling laboratory result of surfactant-assisted spontaneous imbibition to the field scale through scaling group analysis, numerical simulation, and discrete fracture network model. In Proceedings of the SPE Improved Oil Recovery Conference, Tulsa, OK, USA, 14–18 April 2018. [Google Scholar]
  14. Chen, W.; Geng, X.; Liu, W.; Ding, B.; Xiong, C.; Sun, J.; Wang, C.; Jiang, K. A comprehensive review on screening, application, and perspectives of surfactant-based chemical-enhanced oil recovery methods in unconventional oil reservoirs. Energy Fuels 2023, 37, 4729–4750. [Google Scholar] [CrossRef]
  15. Zhang, T.; Li, Z.; Gao, M.; Xu, Z.; Adenutsi, C.D.; You, Q. New insights into the synergism between silica nanoparticles and surfactants on interfacial properties: Implications for spontaneous imbibition in tight oil reservoirs. J. Pet. Sci. Eng. 2022, 215, 110647. [Google Scholar] [CrossRef]
  16. Zhao, X.; Gao, Y.; Pan, Y.; Yang, Z. Progress on the Application of Nanomaterial Expansion in Oil Displacement. Appl. Sci. 2025, 15, 6484. [Google Scholar] [CrossRef]
  17. Li, B. Investigation into Stimulation Mechanism of CO2 Pre-Pad Energized Fracturing in Jimusar Shale Oil Reservoir. Ph.D. Thesis, China University of Petroleum, Beijing, China, 2023. (In Chinese). [Google Scholar]
  18. Gu, C.; Qin, R.; Di, Q.; Jiang, F.; Liu, Z.; Chen, H. Simulation and visualization experiment of manganese ion diffusion and damage to gel in a porous media-gel system. Pet. Explor. Dev. 2019, 46, 367–373. [Google Scholar] [CrossRef]
  19. Wang, C. Fractal Models of Single-Phase Gas Diffusion and Gas-Liquid Two-Phase Diffusion in Porous Media. Ph.D. Thesis, Kunming University of Science and Technology, Kunming, China, 2021. (In Chinese). [Google Scholar]
  20. Winanda, D.F.; Adisasmito, S. Addition of surfactants to Low Salinity Waterflooding in microfluidics system to increase oil recovery. Pet. Res. 2022, 7, 486–494. [Google Scholar] [CrossRef]
  21. Zou, G. Study on the Transport law Of Fracturing Fluid in Shale Gas Reservoirs. Ph.D. Thesis, University of Science and Technology Beijing, Beijing, China, 2023. (In Chinese). [Google Scholar]
  22. Liu, D. Microscopic Imbibition Effects in Shale Reservoir and Its Impact on Production. Ph.D. Thesis, China University of Petroleum, Beijing, China, 2021. (In Chinese). [Google Scholar]
  23. Yu, F.; Gao, Z.; Zhu, W.; Wang, C.; Liu, F.; Xu, F.; Jiang, H.; Li, J. Experiments on imbibition mechanisms of fractured reservoirs by microfluidic chips. Pet. Explor. Dev. 2021, 48, 1162–1172. [Google Scholar] [CrossRef]
  24. Wang, X.; He, A.; Ju, M.; Xu, Y.; Zhang, Y.; Xu, C. Improving Imbibition Recovery Efficiency in Tight Oil Reservoir Based On Microfluidic Method. Sci. Technol. Eng. 2021, 21, 6272–6277. (In Chinese) [Google Scholar]
  25. Xu, D. Study on Methods and Mechanisms of Enhanced Imbibition Efficiency for Changqing Tight Oil Reservoirs. Ph.D. Thesis, China University of Petroleum, Beijing, China, 2021. (In Chinese). [Google Scholar]
  26. Wang, X.; Liu, Y.; Yi, F.; Bo, H.; Wu, W.; Chen, W.; Fang, Y.; Caili, D. Characteristics of Crude Oil Utilization Improved by Imbibition of Surfactant in Matrix-fracture Dual Media. Oilfield Chem. 2022, 39, 108–114. (In Chinese) [Google Scholar]
  27. Zhokh, A. Size-controlled non-Fickian diffusion in a combined micro- and mesoporous material. Chem. Phys. 2019, 520, 27–31. [Google Scholar] [CrossRef]
  28. Kang, K.; Abdelfatah, E.; Pournik, M. Nanoparticles transport in heterogeneous porous media using continuous time random walk approach. J. Pet. Sci. Eng. 2019, 177, 544–557. [Google Scholar] [CrossRef]
  29. Coll, C.; Martinez-Manez, R.; Marcos, M.D.; Sancenon, F.; Soto, J. A simple approach for the selective and sensitive colorimetric detection of anionic surfactants in water. Angew. Chem. Int. Ed. Engl. 2007, 46. [Google Scholar] [CrossRef]
  30. Zhao, Y.; Li, X. Colorimetric and fluorometric detection of anionic surfactants with water soluble sensors. Sens. Actuators B Chem. 2015, 209, 258–264. [Google Scholar] [CrossRef]
  31. Lee, S.; Manjunatha, D.H.; Jeon, W.; Ban, C. Cationic Surfactant-Based Colorimetric Detection of Plasmodium Lactate Dehydrogenase, a Biomarker for Malaria, Using the Specific DNA Aptamer. PLoS One 2014, 9, e100847. [Google Scholar] [CrossRef] [PubMed]
  32. Smirnova, S.V.; Apyari, V.V. Aqueous Two-Phase Systems Based on Cationic and Anionic Surfactants Mixture for Rapid Extraction and Colorimetric Determination of Synthetic Food Dyes. Sensors 2023, 23, 3519. [Google Scholar] [CrossRef] [PubMed]
  33. Chen, L.; Wang, X.; L, W.; Wu, X.; Li, J. Molecular Imprinting: Perspectives and Applications. Chem. Soc. Rev. 2016, 45, 2137–2211. [Google Scholar] [CrossRef] [PubMed]
  34. Korzhan, L.; Kulichenko, S.; Lelyushok, S. Smart Colorimetric Determination of Ionic Surfactants With Bromothymol Blue at the Presence of Nonionic Surfactant Triton X-100. Methods Objects Chem. Anal. 2023, 18, 136–142. [Google Scholar] [CrossRef]
  35. Jia, L.; Sun, W.; Li, W.; Dong, Y.; Wu, L.; Saldaña, M.; Gao, Y.; Jin, Y.; Sun, W. A Colour Indicator Film Based on Bromothymol Blue/Poly(Lactic Acid)/Polyvinylpyrrolidone for Detecting Bacteria. Packag. Technol. Sci. 2023, 36, 549–556. [Google Scholar] [CrossRef]
  36. Hu, Y.; Chaoneng, Z.; Jinzhou, Z.; Gao, D.; Fu, C. Mechanisms of fracturing fluid spontaneous imbibition behavior in shale reservoir: A review. J. Nat. Gas Sci. Eng. 2020, 82, 103498. [Google Scholar] [CrossRef]
  37. Liu, G.; Zhao, Z.; Sun, M.; Li, J.; Hu, G.; Wang, X. New insights into natural gas diffusion coefficient in rocks. Pet. Explor. Dev. 2012, 39, 597–604. [Google Scholar] [CrossRef]
  38. Achour, S.H.; Okuno, R. A single-phase diffusion model for gas injection in tight oil reservoirs. J. Pet. Sci. Eng. 2022, 213, 110469. [Google Scholar] [CrossRef]
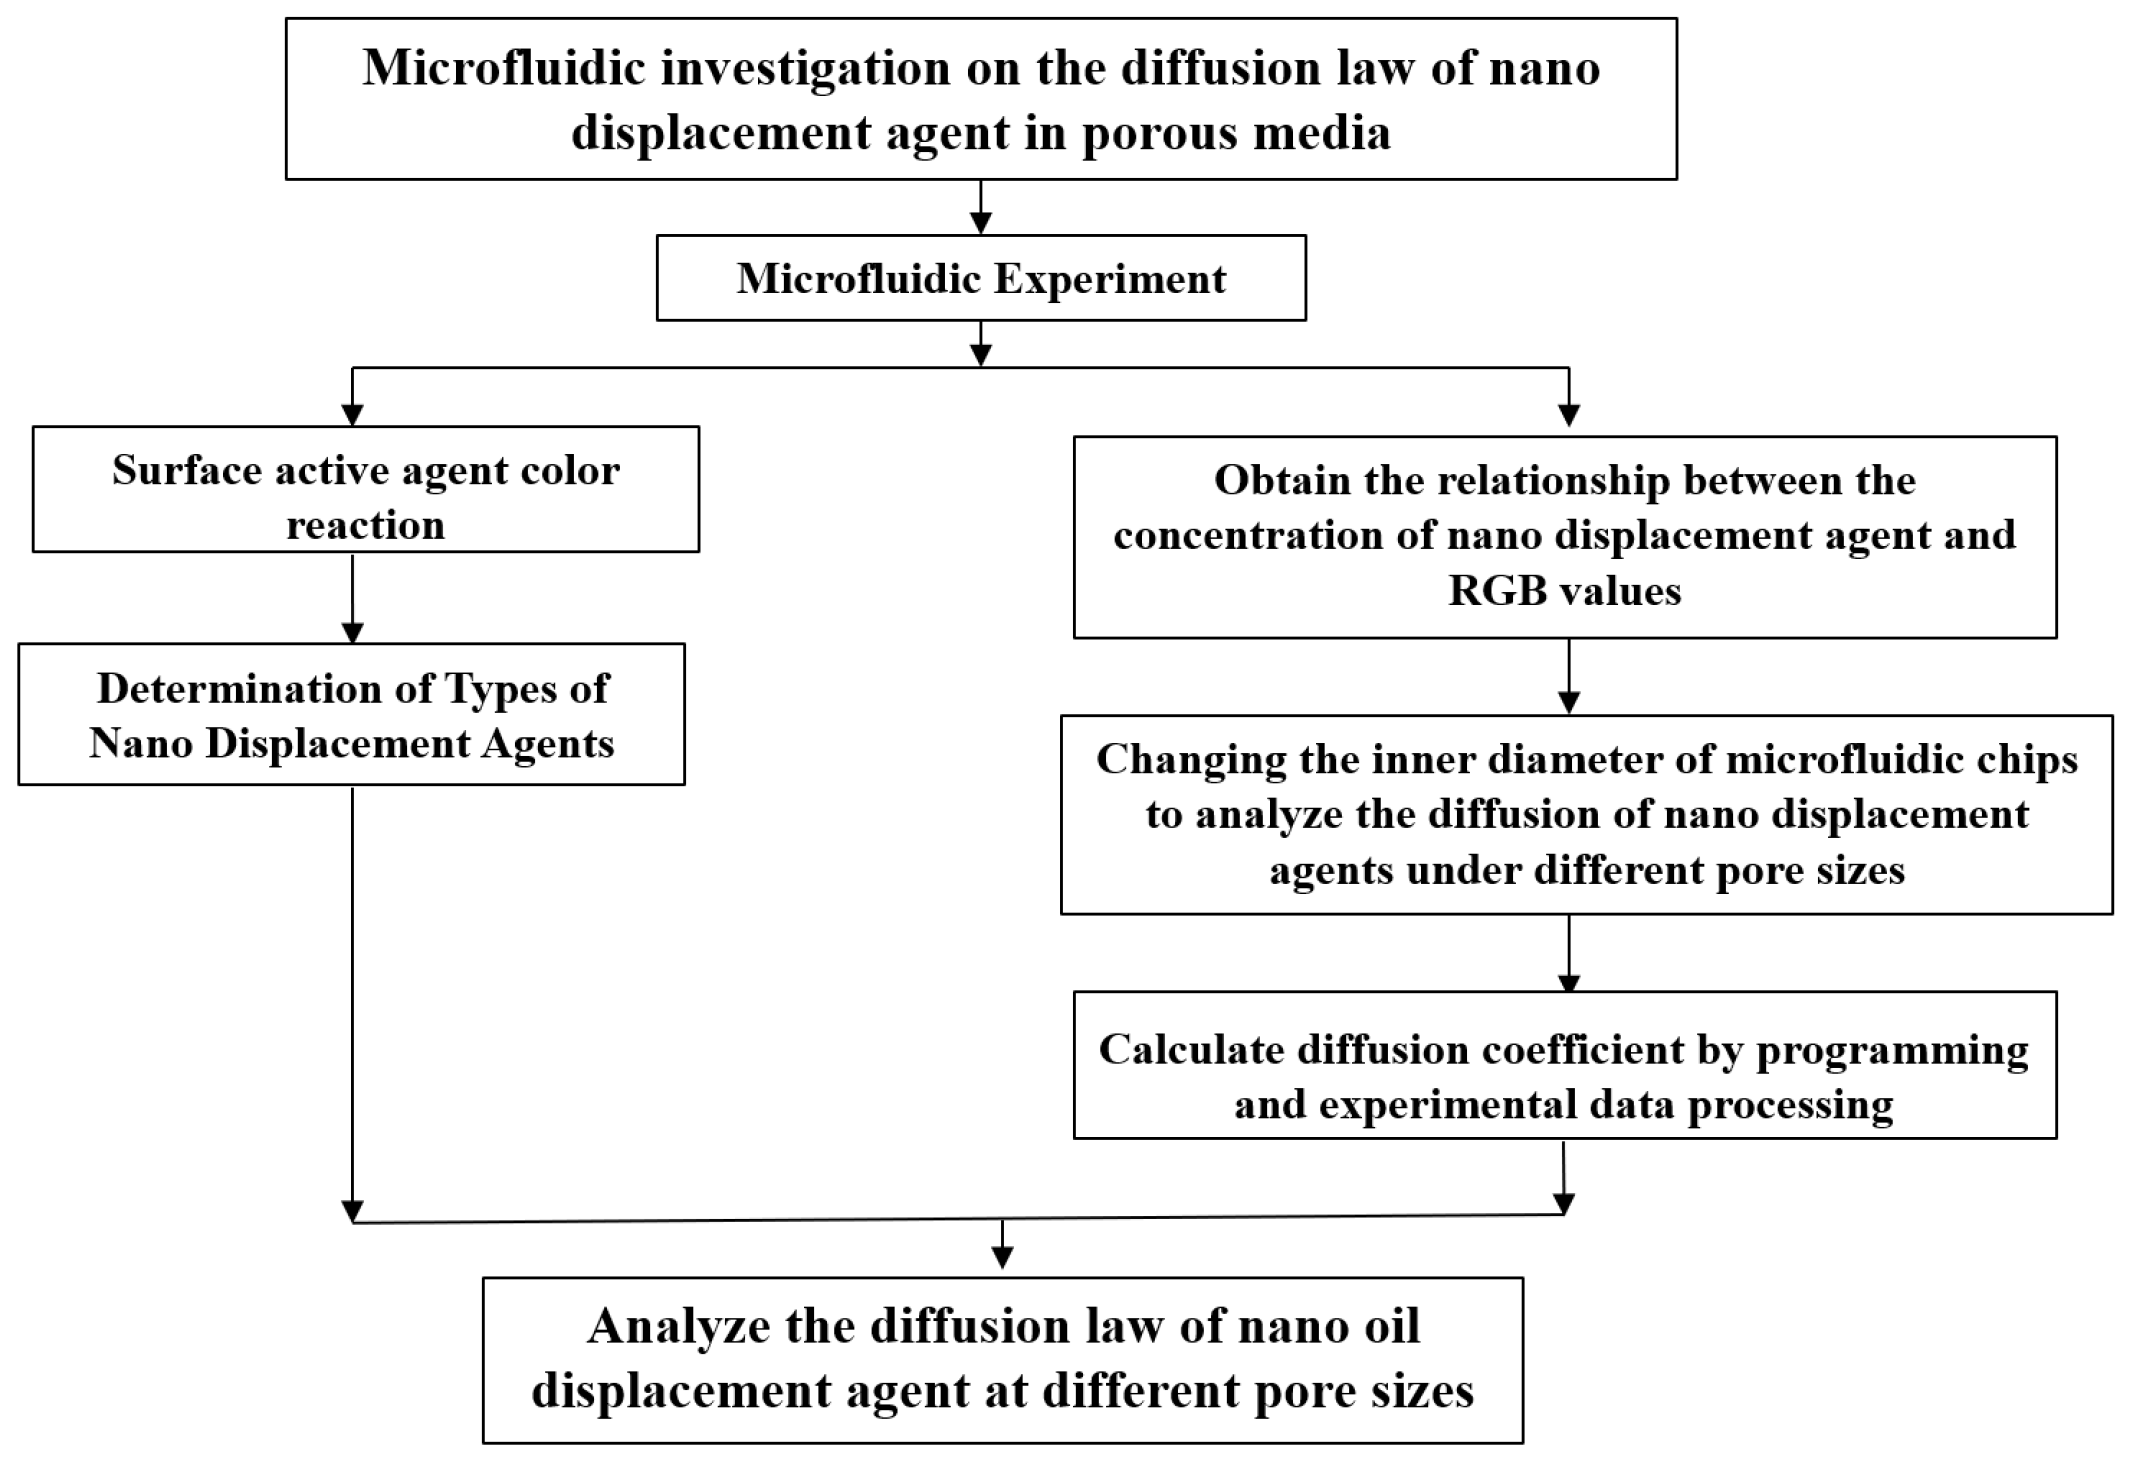
Figure 1. Workflow diagram.
Processes 13 02546 g001
Figure 2. Comparison in the absence and presence of a nano-displacement agent for cation detection solution (left) and anion detection solution (right).
Processes 13 02546 g002
Figure 3. (a) Schematic diagram of the microfluidic system and (b) channel structure of the microfluidic chip.
Processes 13 02546 g003
Figure 5. (a) Relationship curve between RGB values and concentration of nano oil displacement agent in small channels and (b) relationship curve between nano-displacement agent concentration and net (R + G)/2 value.
Processes 13 02546 g005
Figure 7. Concentration at different positions and different diffusion times within 100 μm channels. Within just 4 h in 100 μm pores, the agent rapidly diffuses uniformly to deeper regions, characterized by a gentle concentration gradient, ultimately reaching the chip outlet.
Processes 13 02546 g007
Figure 8. Concentration at different positions and different diffusion times within 50 μm channels. The diffusion is significantly limited by the small channel width, and did not penetrate the chip even after 48 h.
Processes 13 02546 g008
Figure 9. Concentration at different positions and different diffusion times within 20 μm channels. Unlike the 100 μm pores, the agent rapidly diffuses uniformly to deeper regions, characterized by a gentle concentration gradient, ultimately reaching the chip outlet.
Processes 13 02546 g009
Figure 10. Relationship between channel size and diffusion coefficient.
Processes 13 02546 g010
Disclaimer/Publisher’s Note: The statements, opinions and data contained in all publications are solely those of the individual author(s) and contributor(s) and not of MDPI and/or the editor(s). MDPI and/or the editor(s) disclaim responsibility for any injury to people or property resulting from any ideas, methods, instructions or products referred to in the content.