Abstract
Centrifugal pumps as turbines (PATs) are key components in energy micro-grids, playing a significant role in energy conversion and storage. However, vibration and pressure pulsation occur during their operation, impacting the operational stability of the system. To investigate the complex relationship between PAT vibrations, pressure pulsations, and performance characteristics, specialized experiments were conducted in the precision laboratory of the National Research Centre of Pumps in Jiangsu University to gather the vibration data, pressure pulsations, and overall performance parameters of a PAT under varying operating conditions. The resulting data were then analyzed in both the time and frequency domains. The final results indicate that under both pump and turbine operating conditions, the vibration intensity increases with the increase in the flow rate. The vibration energy is predominantly concentrated at fBEP (blade passing frequency) and its harmonics, while the pressure pulsation intensity is the most significant at fn (the shaft frequency), fBEP, and the latter’s harmonics. This study is highly significant for optimizing pump design, enhancing pump performance, and ensuring the safe and stable operation of PAT systems.
1. Introduction
With the rapid economic development and population growth, energy consumption and environmental issues are increasing significantly. In comparison with traditional centralized power systems, micro-grids utilizing distributed energy systems facilitate localized energy production and consumption, thereby significantly reducing the energy losses associated with long-distance transmission [1,2]. By generating and consuming electricity locally, micro-grids enhance energy efficiency and bolster the resilience of the energy system [3] and have thus become a focal point in the energy sector as flexible, efficient, and sustainable power systems. In micro-grids, the energy storage system is a critical component in ensuring the stability and reliability of power supply. Pumped storage systems have a longer service life and lower operational costs than other energy storage technologies. Centrifugal pumps are commonly used fluid transfer devices characterized by simple structure, high efficiency, and low operational and maintenance costs, which makes them an increasingly important component in micro and small pumped storage power plants [4,5]. In pumped storage technology, the application of pump-as-turbine (PAT) technology, where a standard pump is used as a turbine to generate electricity, significantly enhances the flexibility, ease of installation, and economic viability of hydropower storage systems [6,7].
1.1. Research Status of Experimental Studies
In recent years, many scholars have conducted a large number of experimental studies on the application of PATs. Bozorgi et al. [8] set up a test for the measurement of pressure head, flow rate, and power in order to validate numerical results and tested a pump in reverse mode. Postacchini et al. [9] evaluated the potential for hydroelectric power generation under different hydrodynamic (pressure and discharge) and mechanical (rotational speed and torque) conditions with laboratory tests, and the experimental results confirmed that the PAT system had good performance. Barbarelli et al. [10] introduced a one-dimensional numerical code for estimating the performance of centrifugal PATs, which was subsequently validated by comparing several experimental measurements conducted on PATs across a specific range of speeds. Frosina et al. [11] presented a method for predicting the reverse behavior of industrial centrifugal pumps by using simulation results from commercial 3D Computational Fluid Dynamics (CFD) software PumpLinx, developed by Simerics Inc., which were then compared to experimental data from pumps operating in reverse mode. Abazariyan et al. [12] experimentally investigated the effect of viscosity on the performance of a PAT system by using five different viscosity fluids on an established test rig. Derakhshan et al. [13] also conducted tests on an established test rig to validate the results of numerical calculations and showed that a propeller pump can be operated as a low-head turbine. Le et al. [14] built a test rig to test two centrifugal pumps as turbines and compared recent correlations with the experimental results obtained from the test rig. Finally, Ismail et al. [15] proposed experimental design and analysis of PATs for micro-hydro-systems over a range of speeds to test end suction centrifugal pumps by reversing the flow through them.
1.2. Research Status of Vibration
Despite extensive research in the field, the long-term operation of centrifugal pumps as turbines inevitably causes significant vibration, large pressure pulsations, and other issues due to high head, frequent start–stop cycles, and other operational factors. Additionally, frequent switching between different operating conditions accelerates the wear and fatigue of mechanical components, reduces the lifespan and reliability of the unit, and may even lead to severe production and operational accidents [16,17,18]. Therefore, accurately predicting pressure pulsation signals is crucial to optimizing pump design, enhancing pump performance, and ensuring the safe and stable operation of these systems. Numerous studies have focused on the vibration characteristics of PATs. Hodkiewicz et al. [19,20,21] combined time–frequency analysis with wavelet transform to extract feature signals from the bearing seat vibrations of multiple double-suction pump units under different operating conditions and successfully developed a vibration identification model for low-flow conditions. Li et al. [22] converted one-dimensional signals into three-dimensional image signals, reducing the impact of noise on diagnosis while simultaneously enhancing feature information visibility; the latter is then input into a convolutional neural network (CNN) for fault diagnosis, which effectively improves diagnostic accuracy. Jiang et al. [23] used a Long Short-Term Memory Network (LSTM) to develop a time-series prediction model for the pressure pulsation of hydraulic turbine units and applied the k-means clustering algorithm to optimize feature parameters, enabling the health assessment of the operating state. Zhang et al. [24] utilized a CNN and LSTM, demonstrating that the effective feature extraction capability of CNNs enhanced air quality prediction accuracy. Mele et al. [25] employed a coupled experimental and CFD approach to investigate the flow-induced vibration mechanism, confirming that vibration intensity positively correlates with rotational speed and has a significant correlation with the efficiency curve; they subsequently proposed a pressure pulsation time-series prediction model. Zhang et al. [26] employed a one-dimensional convolutional neural network to develop a bearing fault diagnosis model capable of adapting to varying operating conditions and environmental noise, effectively addressing the issue whereby training set imbalance causes low diagnostic accuracy. Finally, Egusquiza et al. [27] transmitted monitoring data from the power plant’s internal LAN to the company network, where signals were continuously collected and sent to the diagnostic center; this facilitated the analysis of vibration characteristics and spectral band changes, such as bearing damage, structural damage, and cavitation.
1.3. Outstanding Problems and Research Aims
Chinese and international scholars have performed extensive experimental research on PAT vibration characteristics and performance prediction, but most have focused on a single operating condition, i.e., pump or turbine; therefore, there is a lack of systematic data collection and analysis under different speeds and different operating conditions. The innovation of this study lies in the construction of a two-way test bench to investigate the vibration and pressure pulsation characteristics of pump-operated turbines in the time and frequency domains under both pump and turbine operating conditions from an experimental point of view. Thus, our research work provides a solid foundation for the monitoring of pump-operated turbines based on vibration signals and provides data support for early troubleshooting and performance prediction in PATs.
In this study, we provide a detailed description of reversible centrifugal pumps, motors, experimental platforms, testing instruments, and host computer software, along with the experimental program and methodology employed. In combined experiments aimed at determining external characteristics and both pressure pulsation and vibration, we selected four different locations in the reversible centrifugal pump to measure and analyze pressure pulsation and vibration signals, along with the corresponding performance parameters, at various flow rates. These results provide a crucial foundation for PAT preventive maintenance strategy and early fault diagnosis.
2. Study Subject and Experimental Equipment
2.1. Pump Parameters
The subject of this study is a reversible centrifugal pump supplied by Shandong Shuanglun Co., Ltd. (Weihai, China), with the following performance parameters: design flow rate (Qd) = 100 m3/h, head (H) = 10 m, rotational speed (n) = 1450 rpm, and specific rotational speed (ns) = 156. The centrifugal pump utilizes a YGDLB-10 high-efficiency permanent magnet frequency conversion motor as the driving motor, and its main geometric parameters are provided in Table 1.

Table 1.
Main geometric parameters of the centrifugal pump.
2.2. Experimental Equipment
2.2.1. Experimental Circuit
Figure 1 shows the schematic diagram of the experimental circuit and its composition, and Figure 2 presents its layout. The drive motor is connected to the frequency converter to regulate the centrifugal pump speed, the motor and the experimental centrifugal pump are fixed on the base and connected via a coupling, and the upper and lower pipelines are equipped with valves.
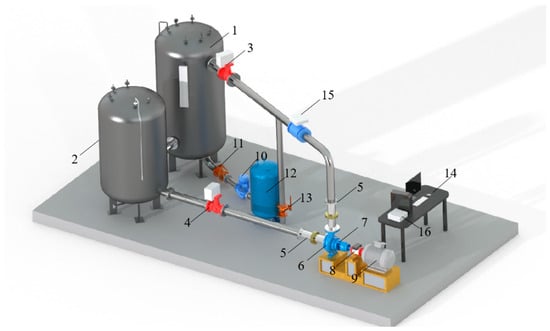
Figure 1.
Schematic diagram of the test circuit. 1—Large water tank. 2—Small water tank. 3—Electric valve. 4—Butterfly valve. 5—Pressure measuring tube. 6—PAT. 7—Bearing box. 8—Torque meter. 9—Electric motor. 10—Booster pump. 11—Ball valve I. 12—Pressure regulator tank III. 13—Ball valve II. 14—Host computer. 15—Flowmeter. 16—Acquisition system.
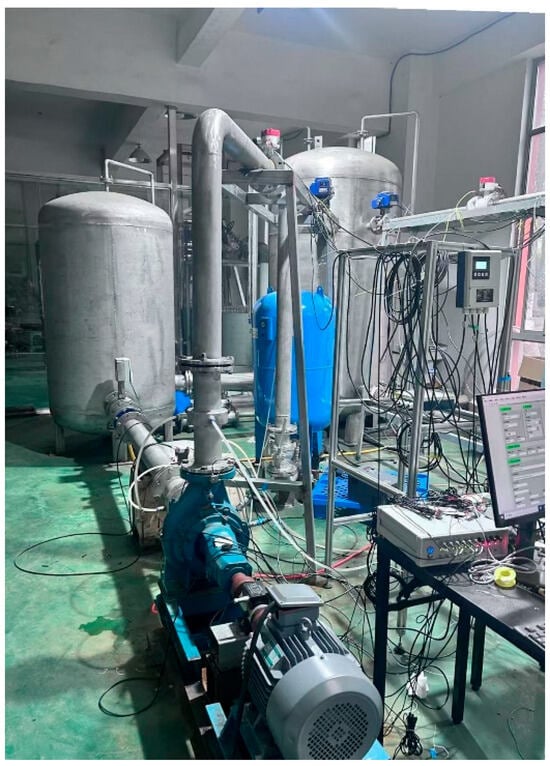
Figure 2.
On-site photo of the test loop.
In this experimental setup, the size of the input current signal is adjusted to control the valve opening, thereby regulating the flow, and the upper computer displays the real-time flow rate; the latter is stabilized by adjusting the valve, and the data acquisition button is pressed for data collection.
The experimental pressure sensors are positioned at the inlet, the tongue of the volute, the second section of the volute, and the outlet of the pump, labeled P1, P2, P3, and P4, respectively, and shown in Figure 3. In this experimental setup, a triaxial vibration acceleration sensor is placed on the volute, positioned as depicted in Figure 4. The pressure sensors used in the experiments were provided by Nanjing Helm Sci-tech Co., Ltd. (Nanjing, China), and the vibration acceleration sensor was supplied by Shanghai Chengtec Electronics Co., Ltd. (Shanghai, China).
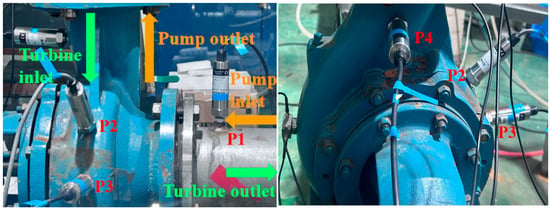
Figure 3.
Location of pressure pulsation sensor measurement points.
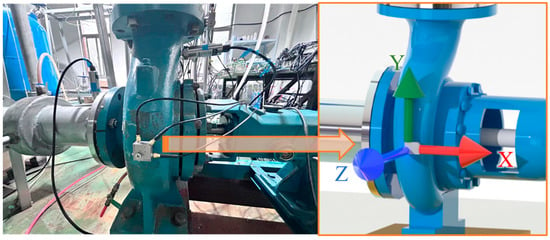
Figure 4.
Location of vibration sensor measurement point.
2.2.2. Data Acquisition System
The data acquisition module comprises three components, with the first one collecting the performance parameters of the reversible centrifugal pump, the second one collecting the vibration signals, and the third one collecting pressure the pulsation signals. These signals were simultaneously collected using three NI acquisition cards. The performance acquisition module comprises an inlet, an outlet, a volute, a tongue pressure sensor, an electromagnetic flowmeter, and a torque meter, whose specific parameters are provided in Table 2, and the vibration signals are collected using a three-axis vibration acceleration sensor. The signal acquisition procedures are implemented using LabVIEW, as illustrated in Figure 5.

Table 2.
Equipment parameters.
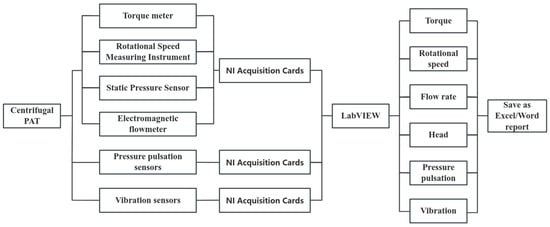
Figure 5.
Signal acquisition process.
3. Experimental Program Design
During the experimental process of simultaneously acquiring the performance parameters of the equipment under various operating conditions, vibration data and pressure pulsation signals, along with the following theoretical formulas, are used to calculate key performance indicators such as head, power, and efficiency, thus providing a comprehensive measurement of the equipment’s performance characteristics.
Flow refers to the volume of liquid transported by the pump per unit of time, denoted by qv (m3/s). In this study, an electromagnetic flowmeter is employed for real-time monitoring and to display the rate of liquid flow through the pipeline.
Head refers to the energy gained by the liquid as it moves from the pump inlet to the outlet, expressed in terms of the unit weight of the liquid. It is denoted by HH, with the unit of measurement being meters (m), and is calculated according to the formula presented in (1).
where and denote the static pressure of the transported liquid at the pump outlet and inlet, respectively, in Pa; and denote the speed of the conveyed liquid at the pump outlet and inlet, respectively, in m/s; and denote the distance from the pressure measurement surface to any vertical point at the pump outlet and inlet, respectively; is the density of the conveyed liquid; and g is the acceleration of gravity in m/s2.
The efficiency of the pump is defined as the ratio of effective power to shaft power, which can be determined using Formula (2).
3.1. Experimental Procedure for PATs in Pump Mode
The study procedure for experiments conducted under PAT pump operating conditions is outlined below:
- Data acquisition was conducted using a system for reversible centrifugal pump performance characterization and signal monitoring developed for this study.
- The outlet valve was opened to 100%, the centrifugal pump was started, and the motor speed was adjusted to 1450 rpm with the frequency converter. Under stable operating conditions, the flow value, inlet and outlet pressure sensor readings, head, efficiency, and other relevant data were simultaneously recorded using LabVIEW 2019 monitoring software on the host computer. To minimize measurement errors, data were repeatedly sampled on the test cloud platform, and the averages were taken as the effective values for the operating condition. Additionally, signals were collected with the three-axis vibration sensor and pressure pulsation sensors at the monitoring points for a flow rate range of 0 to 1.2Qd.
- The motor speed was set to 1000 rpm, and step (2) was repeated.
- The experimental data were exported from the MySQL database.
- The “End Experiment” button was pressed to turn off the centrifugal pump and disconnect the power supply.
3.2. Experimental Procedure for PATs in Turbine Mode
The study procedure for experiments conducted under PAT operating conditions is outlined below:
- The inlet valve was opened to allow water to gradually fill the pump body and the inlet and outlet pipelines. Simultaneously, the changes in the pressure sensor readings were checked to ensure that no air remained in the pipeline.
- The motor was started to operate the centrifugal pump in turbine mode, and the frequency converter was used to adjust the motor speed to 750 rpm for stable operation. Simultaneously, the flow value, inlet pressure, outlet pressure, head, efficiency, and other sensor readings were monitored with LabVIEW 2022 software on the host computer, and the data were accurately recorded on the pre-designed experimental data sheet. To minimize measurement errors, the data sampling process was repeated on the test platform, and the averages were taken as the valid values for the operating condition. Additionally, the three-axis vibration sensor and pressure pulsation sensors at the monitoring points were used to collect signals for flow rates of 1.0 to 1.8Qd.
- The experimental data were exported from the MySQL database.
- The “End Experiment” button was pressed to turn off the centrifugal pump and disconnect the power supply, and the sensors and monitoring terminals were removed.
3.3. Experimental External Characteristic Curve and Uncertainty Analysis
The external characteristic curve of the centrifugal pump was obtained with performance tests, and the experimentally obtained head and efficiency are shown in Figure 6.
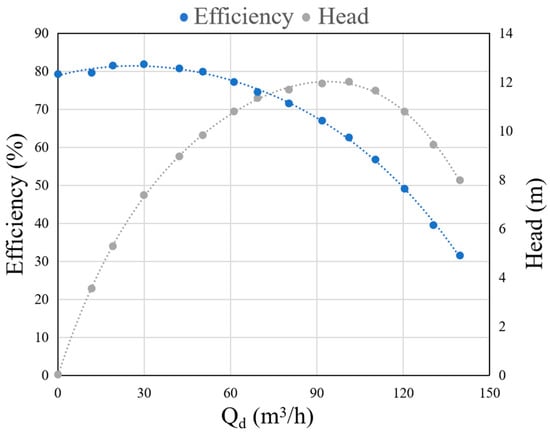
Figure 6.
Experimental external characteristic curve of centrifugal pump.
In order to verify the accuracy of the experiment, we carried out eight repeated measurements at the same flow point for the rated speed and finally obtained the data on flow, head, shaft power, and efficiency. The main error was determined by considering both instrument accuracy and measurement method accuracy. The uncertainty of each parameter comprises both systematic uncertainty and random (or consequent) uncertainty, where the former is determined according to the accuracy of the instrument used to measure the parameter and the latter is the measurement uncertainty caused by random effects.
The random uncertainty, , is calculated as follows:
where is the confidence coefficient, which is usually used with a 95% confidence probability; is the number of measurements; is the standard deviation of the measured parameter; and is the mean value of the measured parameter.
The uncertainty was calculated by using 8 sets of data relative to the same flow point of the pump for the rated speed, and the repeated test data and random uncertainty are shown in Table 3.

Table 3.
Repeated measurement data at the same flow rate for the rated speed.
The systematic uncertainty of the test rig was calculated according to Equation (4).
The calculated systematic uncertainty for the test in this study is about 0.88%.
The combined uncertainty is determined by considering both systematic and stochastic uncertainty. Substituting both into Equation (5) yields a combined uncertainty of about 0.842%; thus, the test accuracy meets the requirements of the study.
4. Results and Discussion
4.1. Signal Time–Frequency-Domain Analysis in Pump Mode
During the experiment, the test data were saved to the local host computer with the offline storage function of the monitoring software employed. Vibration and pressure pulsation signals under PAT pump operating conditions were collected at a speed of 1450 rpm, with Qd = 100 m3/h. In this study, a combination of time-domain waveform graphs and frequency-domain analysis techniques was adopted to investigate the pressure pulsation characteristics. As a visualization tool, time-domain waveforms show the evolution of the physical quantity to be analyzed over time in an intuitive manner. Frequency-domain analysis mainly relies on the conversion of a time-domain signal into a frequency-domain signal with Fourier transform (FFT) technology, so as to determine the frequency components of the signal. In this study, the speed of the pump was 1450 rpm, from which the shaft frequency and the blade passage frequency were derived as fn = n/60 = 24.17 Hz and fBPF = 6fn = 145 Hz, respectively.
In order to determine the magnitude of the pressure pulsations, we introduce a dimensionless pressure coefficient, , which is a dimensionless number widely used in fluid mechanics to describe the relationship between the pressure at a point on the surface of an object and the dynamic pressure of a free stream. In actual fluid flow, especially under turbulent or other unsteady flow conditions, the pressure is not constant but fluctuates with time, a phenomenon known as pressure pulsation. To describe these pulsation characteristics, we usually adopt statistical measures such as mean and variance (or standard deviation). For pressure pulsations, commonly used statistics include mean pressure, , and pulsation pressure, , where the latter is defined as the difference between the instantaneous pressure and its time-averaged value:
Based on the above concept, the pressure pulsation coefficient can be defined as the ratio of the standard deviation of the pulsation pressure to the dynamic pressure, where denotes the dynamic pressure.
where is the static pressure; is the average value of the static pressure at the monitoring point in the selected time period; is the density of the liquid, which is 1000 kg/m3, the density of water, in our experiment; is the impeller diameter; and is the rotational speed.
4.1.1. Time-Domain Analysis of Vibration Signals in Pump Mode
Figure 7 shows the vibration signals at the monitoring point measured with the triaxial vibration sensor under small-flow, rated-flow, and large-flow conditions at the rated speed (1450 rpm). In pump mode, 40,000 vibration data were collected in 4 s at a sampling frequency of fs = 40,000/t = 10,000 Hz.
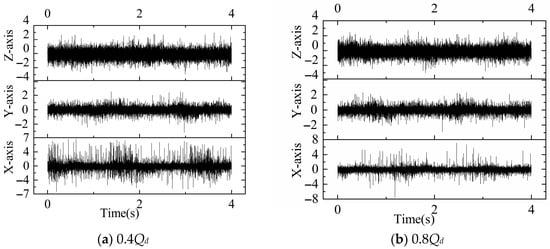
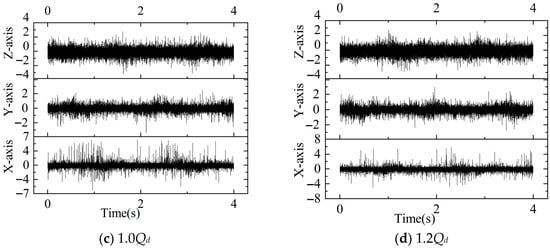
Figure 7.
Vibration signals at monitoring point under different operating conditions at 1450 rpm.
The following time-domain statistical indicators are used as time-domain features [28,29] to gain a deeper understanding of the operational state of the reversible centrifugal pump.
- Standard Deviation:
The standard deviation represents the degree of dispersion in the distribution of vibration signal data.
- 2.
- Skewness:
Skewness measures the asymmetry of a distribution around its mean, and its value can be positive, negative, or even undefined. Therefore, if any fault in the pump causes changes in the distribution, these variations can be reflected by measuring the skewness.
- 3.
- Kurtosis:
Kurtosis is a statistical parameter used to measure the “peakedness” of a random signal. Signals with sharper peaks exhibit higher kurtosis values.
- 4.
- Root Mean Square (RMS):
The RMS value serves as a metric for assessing data fluctuation intensity, reflecting the average energy or power level of the dataset.
Here, μ represents the mean value, xi denotes each data point, and n is the number of data points.
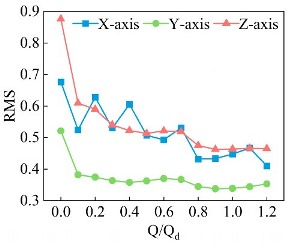
Figure 8 presents the time-domain statistical indicators at different flow rates and 1450 rpm. The results demonstrate that the skewness and kurtosis features exhibit significant variations with the increase in the flow rate, showing chaotic patterns and severe overlap, making it difficult to determine the operating conditions based on these two time-domain characteristics. However, both the standard deviation and RMS values in the Z direction gradually decrease with the increase in the flow rate. Since RMS values can reflect the total energy level of a signal, they can serve as a reliable basis for vibration classification [30].
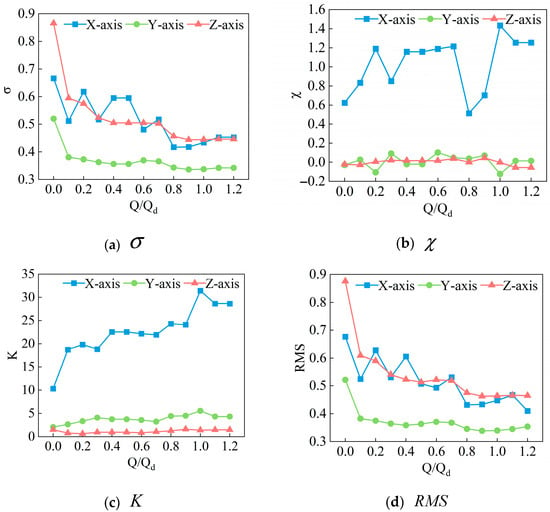
Figure 8.
Time–frequency characteristics at different flow rates and 1450 rpm.
4.1.2. Frequency-Domain Analysis of Vibration Signals in Pump Mode
Frequency-domain analysis is a commonly used signal processing method where the Fourier transform is applied to the vibration signals of a centrifugal pump to convert non-stationary time-domain signals into the frequency domain for analysis.
As shown in Figure 9, the frequency-domain plots of the vibration signals in the X, Y, and Z directions under different flow conditions are presented. While the spectra under the three operating conditions share similarities, with overlapping peak distributions, frequency-domain analysis alone cannot directly distinguish among them. From the figure, it can be found that the vibration amplitude increases with the flow rate in all directions. At 0.4Qd, the vibration energy is mainly concentrated at fn and fBEP, while at 1.0Qd and 1.2Qd, it is mainly concentrated at fn. The pump shaft generates a periodic force by rotating and transmits it to the pump casing, resulting in vibration consistent with the shaft frequency. At the same time, resonance may occur when the intrinsic frequency of the system is close to the shaft frequency, further enhancing the vibration signal at the shaft frequency. Under small-flow conditions, the flow separation phenomenon can easily occur due to the low flow rate: when the fluid flows out of the impeller and into the volute, due to changes in the flow path, part of it detaches itself from the wall, forming a low-pressure zone, and subsequently re-attaches itself to the wall, resulting in periodic pressure fluctuations. Thus, this phenomenon produces not only vibrations at fn but also significant pressure pulsations at fBEP.
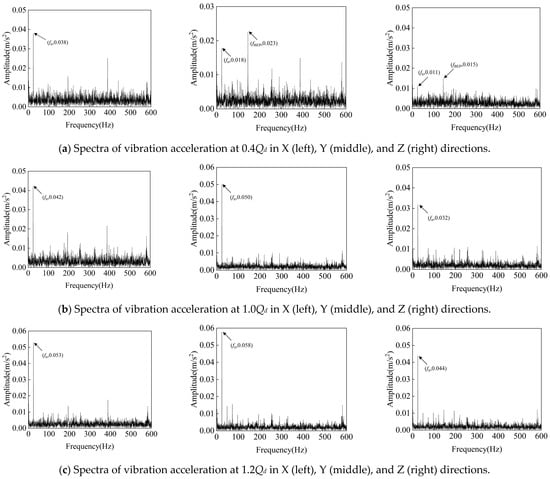
Figure 9.
Spectral characteristics of vibration signals at different flow rates and 1450 rpm.
4.1.3. Time-Domain Analysis of Pressure Pulsation Signals in Pump Mode
In pump mode, 4000 pressure pulsation data were collected in 4 s at a sampling frequency fs = 1000 Hz. Figure 10, Figure 11 and Figure 12 show the time-domain pressure pulsation diagrams of four monitoring points under different flow conditions at the rated speed (1450 rpm). The analysis of the original pressure pulsation time-domain diagrams under low-flow, design-flow, and large-flow conditions reveals the following: The pressure pulsation at the inlet intensifies significantly under large-flow conditions, with its amplitude substantially exceeding that of both the design and low-flow off-design conditions. The pressure pulsation in the volute tongue region gradually increases with the increase in the flow rate. Similarly, the pressure pulsation in the second cross-section of the volute also demonstrates an increasing trend with the flow rate while progressively stabilizing. In contrast, the pressure pulsation at the outlet exhibits an opposite variation pattern, gradually decreasing as the flow rate increases.
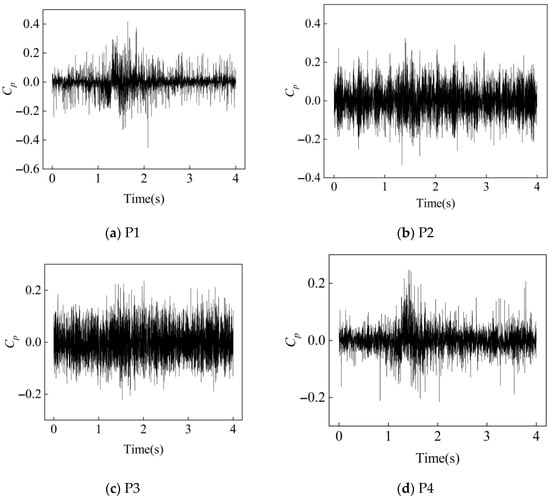
Figure 10.
Time-Domain signals at 4 monitoring points under 0.4Qd condition at 1450 rpm.
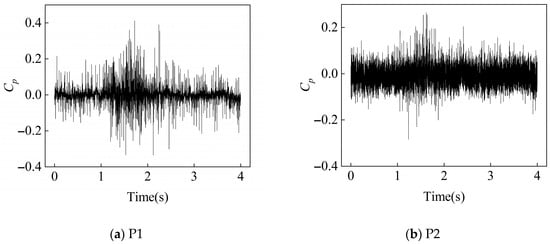
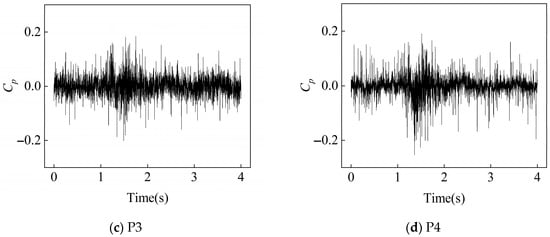
Figure 11.
Time-Domain signals at 4 monitoring points under 1.0Qd condition at 1450 rpm.
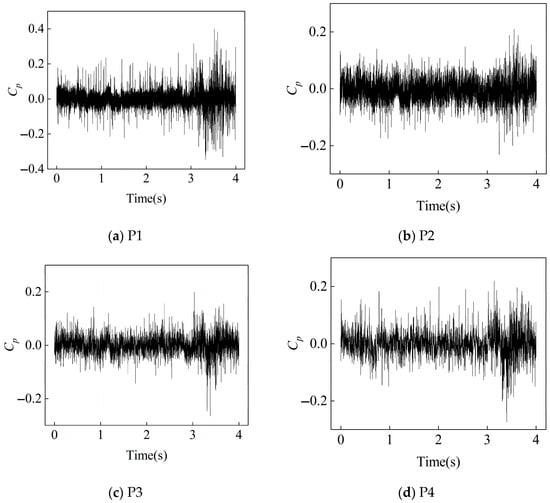
Figure 12.
Time-Domain signals at 4 monitoring points under 1.2Qd condition at 1450 rpm.
4.1.4. Frequency-Domain Analysis of Pressure Pulsation Signals in Pump Mode
Figure 13, Figure 14 and Figure 15 present the frequency-domain diagrams of pressure pulsation at four monitoring points under different flow conditions at the rated speed (1450 rpm). By examining the frequency-domain diagrams of pressure pulsation at the four locations under low-flow, design-flow, and high-flow conditions, it can be observed that the pressure pulsation intensity is particularly significant at the pump’s fn, fBEP, and the latter’s harmonics, which is due to the rotor–stator interaction phenomenon between the impeller and the volute; this demonstrates the rigor of the experimental process and the accuracy of the experimental results. Specifically, the amplitude at the blade passing frequency at the inlet position gradually increases with the increase in the flow rate, and this phenomenon is particularly noticeable. At the second cross-section of the volute and at the outlet, the vibration amplitude under design conditions is significantly reduced compared with off-design conditions.
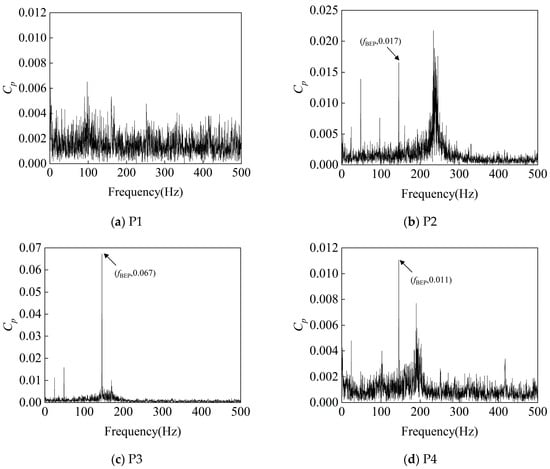
Figure 13.
Frequency-Domain signals at 4 monitoring points under 0.4Qd condition at 1450 rpm.
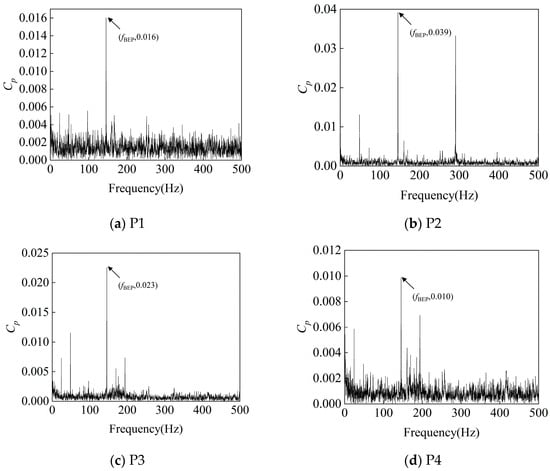
Figure 14.
Frequency-Domain signals at 4 monitoring points under 1.0Qd condition at 1450 rpm.
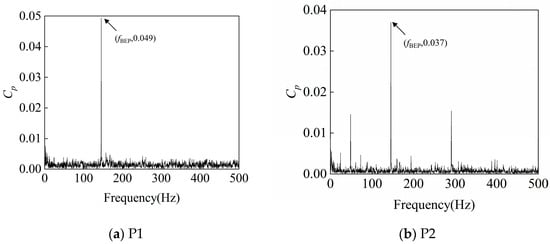
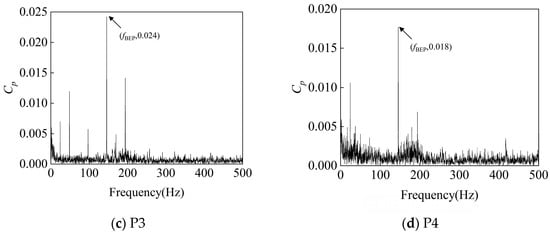
Figure 15.
Frequency-Domain signals at 4 monitoring points under 1.2Qd condition at 1450 rpm.
At 0.4Qd, fBEP at monitoring point P3 is the largest, followed by that at monitoring point P2; this is because the velocity of the fluid through the impeller is lower under small-flow conditions, and flow separation is likely to occur in the second section due to the uneven distribution of the flow velocity and the change in the geometry of the worm shell. Flow separation leads to the formation of localized low-pressure zones and thus to periodic pressure fluctuations; although flow separation also exists at the tongue, the separation effect is relatively weak due to its location close to the outlet of the worm shell, where the fluid has already undergone some distance adjustment. At 1.0Qd, fBEP at monitoring point P2 is the largest, followed by that at monitoring point P3; this is because when the fluid flows out of the impeller and into the worm shell, especially at the position close to the spacer tongue, due to the drastic change in geometry and flow direction, the flow separation phenomenon occurs, and vortices are generated, leading to the formation of a local low-pressure region, which can lead to drastic fluctuations in local pressure. At 1.2Qd, fBEP at monitoring point P1 is the largest, and that at monitoring point P2 is the second-largest; this is because a higher flow rate leads to a larger momentum change, especially if the inlet is prone to uneven flow distribution (such as vortex and reflux), which causes pressure fluctuations.
4.2. Signal Time–Frequency-Domain Analysis in Turbine Mode
4.2.1. Time-Domain Analysis of Vibration Signals in Turbine Mode
In the experiment, we collected vibration and pressure pulsation signals at a rotational speed of 750 rpm under turbine operating conditions, with Qd = 50 m3/h. In turbine mode, 40,000 vibration data were collected in 4 s at a sampling frequency of fs = 4000 Hz. The speed of the turbine was 750 rpm, from which it was deduced that its shaft frequency fn = n/60 = 12.5 Hz and its blade passage frequency (lobe frequency) fBPF = 6fn = 75 Hz. The vibration signals generated by the PAT (pump as turbine) under turbine operating conditions contain information about its operational status. Figure 16 shows the vibration signals at the monitoring point during the first 4 s at different flow rates and 750 rpm. To facilitate the in-depth analysis and determination of turbine operating conditions, time-domain analysis was first performed on the vibration signals.
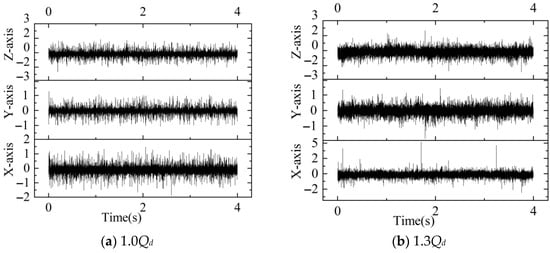
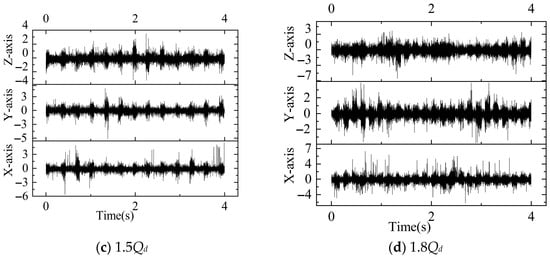
Figure 16.
Vibration signals at monitoring point under different operating conditions at 750 rpm.
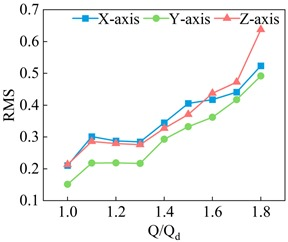
As shown in Figure 17, the time–frequency characteristics at 750 rpm under turbine operating conditions demonstrate that as the flow rate gradually increases, the skewness and kurtosis features show no discernible pattern, making these two time-domain characteristics unsuitable for determining operating conditions. However, both the standard deviation and RMS values exhibit a progressive increase along the X-, Y-, and Z-axes with the increase in the flow rate.
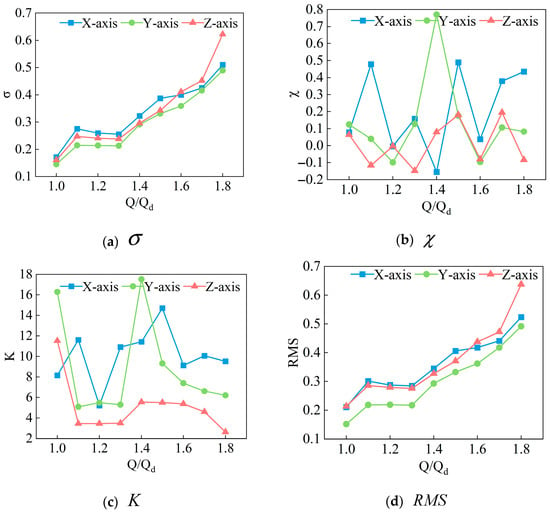
Figure 17.
Time–frequency characteristics at different flow rates and 750 rpm.
4.2.2. Frequency-Domain Analysis of Vibration Signals in Turbine Mode
Figure 18 displays the frequency-domain characteristics of vibration signals in the X, Y, and Z directions under different flow conditions. The vibration amplitude shows an increasing trend with the gradual increase in the flow rate, and significant vibration signals are particularly observed at fn, fBEP, and the latter’s harmonics. It is noteworthy that vibrations near 3fBEP are especially prominent. In turbine mode, fluid enters the pump impeller and creates complex flow patterns, and particularly at high flow rates or deviations from design conditions, the fluid may form complex vortex and turbulent structures, which can lead to localized pressure pulsations and significant vibration signals at certain frequencies (e.g., 3fBEP).
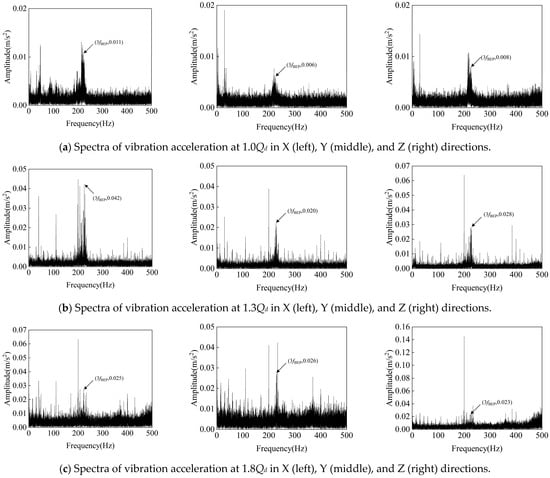
Figure 18.
Spectral characteristics of vibration signals at different flow rates and 750 rpm.
4.2.3. Time-Domain Analysis of Pressure Pulsation Signals in Turbine Mode
In turbine mode, 2000 pressure pulsations were collected in 4 s at a sampling frequency of fs = 500 Hz. Figure 19, Figure 20 and Figure 21 show the evolution of flow stability of the reversible centrifugal pump in reverse turbine operation mode (750 rpm) at 1.0Qd (design condition), 1.4Qd (high flow rate), and 1.8Qd (extremely high flow rate). The time-domain characteristics indicate that the dimensionless pressure pulsation amplitudes at monitoring points P1, P2, P3, and P4 gradually increase with the increase in the flow rate; specifically, the pulsation intensity at 1.8Qd shows a 37~52% increase compared with the design condition. This phenomenon is closely related to the intensified flow separation and enhanced rotor–stator interaction caused by increased fluid kinetic energy.
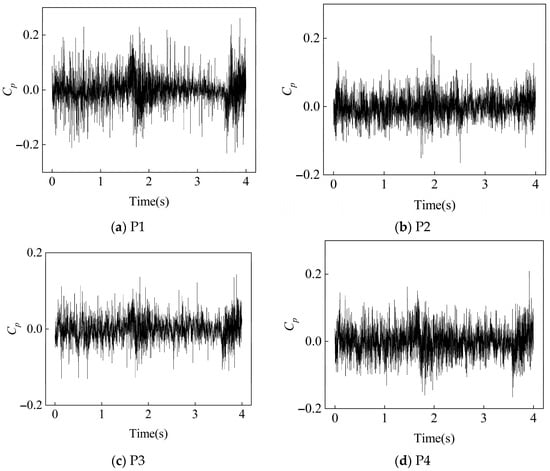
Figure 19.
Time-Domain signals at 4 monitoring points under 1.0Qd condition at 750 rpm.
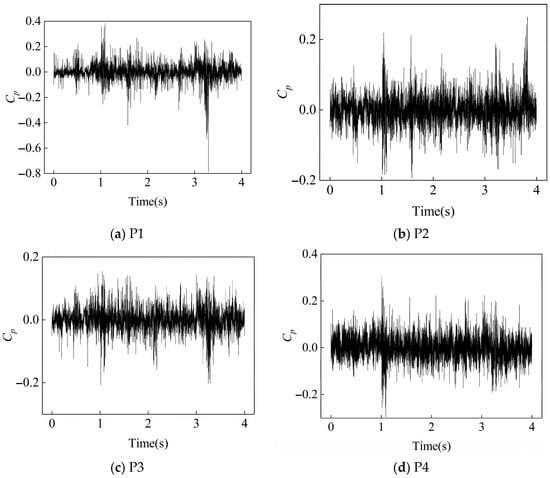
Figure 20.
Time-Domain signals at 4 monitoring points under 1.4Qd condition at 750 rpm.
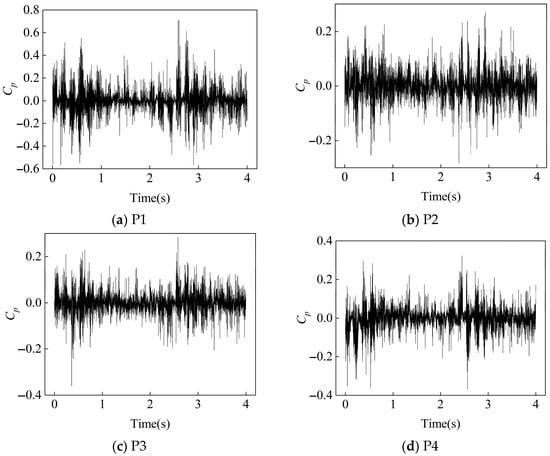
Figure 21.
Time-Domain at 4 monitoring points under 1.8Qd condition at 750 rpm.
Dimensionless processing effectively eliminates the influence of absolute pressure levels, more clearly reflecting the phase synchronization characteristics and propagation attenuation patterns of pressure pulsations at each measurement point. Notably, a strong coherence coefficient is observed between P2 and P4 in high-pressure pulsation components, supporting the mechanism of excitation transfer from inlet pulsations to the tongue region through fluid inertial forces. This flow-rate sensitivity indicates that the nonlinear superposition of pressure pulsations under extremely high-flow conditions may trigger fluid–structure interaction vibration risks. Therefore, accurately predicting pressure pulsations helps avoid resonance frequency bands.
4.2.4. Frequency-Domain Analysis of Pressure Pulsation Signals in Turbine Mode
As shown in Figure 22, Figure 23 and Figure 24, in the turbine model at a rotational speed of 750 rpm, the frequency-domain analysis of pressure pulsation signals reveals significant spectral characteristics at monitoring points P1–P4: significant pressure pulsation energy is observed at fn, fBEP, and the latter’s harmonics. This shows that the rotor–stator interaction between the impeller and the volute is an important cause of pressure pulsation.
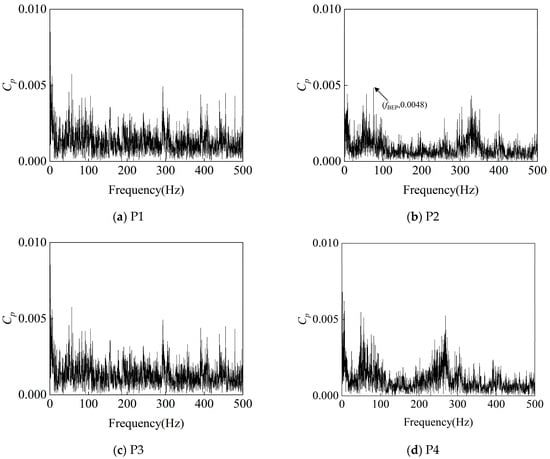
Figure 22.
Frequency-Domain signals at 4 monitoring points under 1.0Qd condition at 750 rpm.
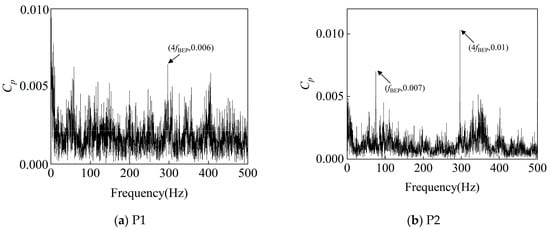
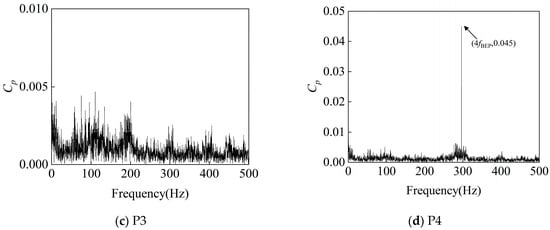
Figure 23.
Frequency-Domain signals at 4 monitoring points under 1.4Qd condition at 750 rpm.
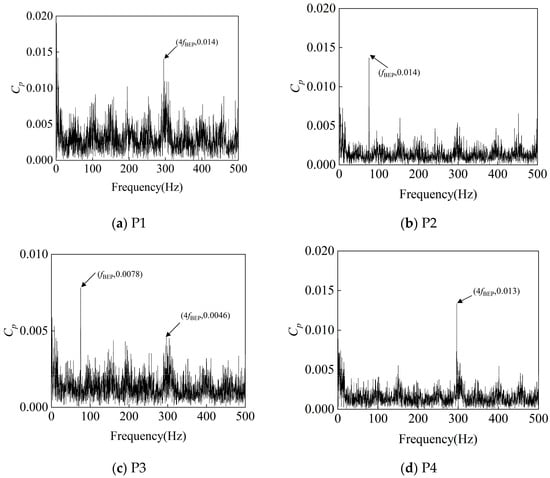
Figure 24.
Frequency-Domain signals at 4 monitoring points under 1.8Qd condition at 750 rpm.
Of particular note is the energy concentration phenomenon at P2 at 296 Hz, while a significant pressure pulsation signal is also observed at 4fBEP at P4. Given that P4 is located at the inlet under the turbine operating condition, the prominent 4fBEP signal reflects the pulsation frequency characteristics of the high-pressure fluid delivered by the booster pump. From a hydrodynamic perspective, this incoming pulsation frequency triggers a pronounced amplitude in the tongue region (i.e., the location of P2) at 4fBEP through a specific flow field transmission mechanism.
The pressure pulsation frequency-domain plots from 1.0Qd to 1.8Qd show that at 1.0Qd, the flow is smoother under the turbine condition, and the amplitude of pressure pulsation at each monitoring point is smaller. At 1.4Qd, the pressure pulsation amplitude at monitoring point P4 at 4fBEP is large, and that at monitoring point P2 at fBEP and 4fBEP is also large but slightly smaller than that at P4. This is due to the fluid entering the worm shell at a high flow rate, which often causes complex flow separation, vortices, and turbulence effects, which can lead to significant pressure pulsations. At 1.8Qd, the amplitude of pressure pulsation at the main frequency increases at all monitoring points, which is consistent with the correlation between the accumulation of fluid kinetic energy and the enhancement in boundary layer separation.
4.3. Comparison of Pump and Turbine Mode Results
In pump mode, the fluid flow is smooth, the main frequencies are fn and fBFP, the energy distribution is concentrated, the vibration and pressure signals are regular and easy to predict and analyze, the overall pressure pulsation amplitude is low, and the risk of resonance is low. The system should be designed to avoid the main excitation frequencies. In turbine mode, the fluid flows in the reverse direction and is susceptible to instability; the main frequencies are lobe frequencies fn, fBFP, 3fBFP, and 4fBFP; and the vibration signals are particularly significant near 3fBFP, while the pressure pulsation signals are particularly significant near 4fBFP. Overall, the signals fluctuate greatly and are significantly affected by flow instability; monitoring requires a higher resolution and analytical capability; and the risk of resonance is higher, as the lobe frequencies and their multiples may be close to the intrinsic frequency of the system. Specific comparative analyses are shown in Table 4.

Table 4.
Comparison table of pump and turbine mode results.
5. Conclusions and Directions for Future Work
5.1. Conclusions
This study provides a detailed introduction to an experimental setup for PAT testing including a reversible centrifugal pump, a motor, a test rig, measurement instruments, host computer software, experimental procedures, and the methodology. By integrating tests aimed at both determining external characteristics and measuring pressure pulsation and vibration, we obtained pressure pulsation signals at four different locations, vibration signals at the volute, and corresponding performance parameters at various flow rates and under different PAT operating conditions. We experimentally determined the vibration time- and frequency-domain characteristics of the PAT in pump and turbine modes, providing a solid foundation for PAT operation monitoring based on vibration signals. The key findings are as follows:
- In pump mode at 1450 rpm, the time- and frequency-domain analyses of the vibration signals reveal that skewness and kurtosis exhibit significant but irregular variations with the increase in the flow rate, making it difficult to use these time-domain features to determine the operating conditions. However, the standard deviation and RMS values in the Z direction gradually decrease with the increase in the flow rate; since the RMS reflects the overall energy of the signal, it can serve as a criterion for vibration classification. Vibration intensity increases with the flow rate, with energy being primarily concentrated at fBFP and its harmonics.
- In pump mode at 1450 rpm, the time- and frequency-domain analyses of the pressure pulsation signals indicate that inlet pressure pulsations intensify significantly under high-flow conditions. Meanwhile, pressure pulsations in the volute tongue region gradually increase with the increase in the flow rate, whereas those at the outlet diminish. As the flow rate increases, pressure pulsation strength becomes significantly large at fn, fBFP, and the latter’s harmonics.
- In turbine mode at 750 rpm, the time- and frequency-domain analyses of the vibration signals show that the standard deviation and RMS values increase progressively with the flow rate in the X, Y, and Z directions, making the RMS a viable indicator for determining the operating conditions. The vibration amplitudes exhibit an upward trend with the increase in the flow rate, with particularly pronounced vibrations near 3fBFP.
- In turbine mode at 750 rpm, the time- and frequency-domain analyses of the pressure pulsation signals demonstrate that dimensionless pressure pulsation amplitudes at all monitoring points increase with the increase in the flow rate, with a 37–52% increment in pulsation intensity at 1.8Qd compared with the design condition. A strong coherence coefficient between P2 and P4 in high-pressure pulsation components confirms a mechanism of excitation transfer from inlet pulsations to the tongue region via fluid inertial forces. Notably, at 4fBFP, P2 exhibits energy concentration, and P4 displays significant pressure pulsation signals.
5.2. Directions for Future Work
In this study, the vibration and pressure pulsation data of a PAT are obtained through experiments. In the future, pressure pulsation prediction research could be carried out in greater depth based on machine learning, and artificial intelligence algorithms could be introduced to predict operation trends and potential faults based on the analysis of historical and real-time data. On this basis, intelligent optimization and decision making could be performed to improve the reliability and safety of micro-grids. This would provide data support for the development of digital twin technology and the construction of new digital and intelligent hydropower stations.
Author Contributions
Conceptualization, M.Z. and Q.H.; methodology, W.W. and J.W. (Jianbao Wang); software, Y.W. and J.X.; validation, J.W. (Jianbao Wang) and J.X.; formal analysis, M.Z. and J.X.; investigation, J.W. (Jianbao Wang); resources, J.P.; data curation, Q.H. and J.W. (Jianbao Wang); writing—original draft preparation, M.Z. and W.W.; writing—review and editing, Q.H. and H.Z.; visualization, H.Z.; supervision, J.P.; project administration, Y.W. and J.W. (Jixuan Wei); funding acquisition, J.W. (Jixuan Wei) and Y.W. All authors have read and agreed to the published version of the manuscript.
Funding
This study was funded by the Natural Science Foundation of Jiangsu Province (Grant No. BK20190851) and the Natural Science Foundation of China (Grant No. 51879121).
Data Availability Statement
All the data in this paper are obtained by physical experiment and numerical simulation, respectively. The data used to support the findings of this study are available from the corresponding author upon request.
Conflicts of Interest
Authors M.Z., Q.H., Y.W., J.W. (Jianbao Wang), J.X. and J.W. (Jixuan Wei) were employed by the Power China Guiyang Engineering Corporation Limited. The remaining authors declare that the research was conducted in the absence of any commercial or financial relationships that could be construed as potential conflicts of interest.
Nomenclature
| Design flow rate, m3/h | |
| Head, m | |
| Rotational speed, rpm | |
| Specific rotational speed | |
| Impeller inlet diameter, mm | |
| Impeller outlet diameter, mm | |
| Volute outlet diameter, mm | |
| Inlet blade angle, ° | |
| Outlet blade angle, ° | |
| Blade outlet width, mm | |
| Blade Number | |
| Standard Deviation | |
| Skewness | |
| Kurtosis | |
| Shaft Frequency | |
| Blade Passing Frequency | |
| Sampling Frequency | |
| RMS | Root Mean Square |
| PAT | Pump as turbine |
| CFD | Computational Fluid Dynamics |
| BEP | Best Efficiency Point |
| CNN | Convolutional Neural Network |
| LSTM | Long Short Term Memory Network |
References
- Shafiullah, M.; Ahmed, S.D.; Al-Sulaiman, F.A. Grid integration challenges and solution strategies for solar PV systems: A review. IEEE Access 2022, 10, 52233–52257. [Google Scholar] [CrossRef]
- Binama, M.; Su, W.T.; Li, X.B.; Li, F.C.; Wei, X.Z.; An, S. Investigation on pump as turbine (PAT) technical aspects for micro hydropower schemes: A state-of-the-art review. Renew. Sustain. Energy Rev. 2017, 79, 148–179. [Google Scholar] [CrossRef]
- Alam, M.S.; Al-Ismail, F.S.; Abido, M.A. Power management and state of charge restoration of direct current microgrid with improved voltage-shifting controller. J. Energy Storage 2021, 44, 103253. [Google Scholar] [CrossRef]
- Han, Y.; Tan, L. Dynamic mode decomposition and reconstruction of tip leakage vortex in a mixed flow pump as turbine at pump mode. Renew. Energy 2020, 155, 725–734. [Google Scholar] [CrossRef]
- Yang, S.; Derakhshan, S.; Kong, F. Theoretical, numerical and experimental prediction of pump as turbine performance. Renew. Energy 2012, 48, 507–513. [Google Scholar] [CrossRef]
- Pei, J.; Shen, J.; Wang, W.; Yuan, S.; Zhao, J. Evaluating hydraulic dissipation in a reversible mixed-flow pump for micro-pumped hydro storage based on entropy production theory. Renew. Energy 2024, 225, 120271. [Google Scholar] [CrossRef]
- Wang, W.; Tai, G.; Shen, J.; Pei, J.; Yuan, S. Experimental investigation on pressure fluctuation characteristics of a mixed-flow pump as turbine at turbine and runaway conditions. J. Energy Storage 2022, 55, 105562. [Google Scholar] [CrossRef]
- Bozorgi, A.; Javidpour, E.; Riasi, A.; Nourbakhsh, A. Numerical and experimental study of using axial pump as turbine in Pico hydropower plants. Renew. Energy 2013, 53, 258–264. [Google Scholar] [CrossRef]
- Postacchini, M.; Darvini, G.; Finizio, F.; Pelagalli, L.; Soldini, L.; Di Giuseppe, E. Hydropower generation through pump as turbine: Experimental study and potential application to small-scale WDN. Water 2020, 12, 958. [Google Scholar] [CrossRef]
- Barbarelli, S.; Amelio, M.; Florio, G. Predictive model estimating the performances of centrifugal pumps used as turbines. Energy 2016, 107, 103–121. [Google Scholar] [CrossRef]
- Frosina, E.; Buono, D.; Senatore, A. A performance prediction method for pumps as turbines (PAT) using a computational fluid dynamics (CFD) modeling approach. Energies 2017, 10, 103. [Google Scholar] [CrossRef]
- Abazariyan, S.; Rafee, R.; Derakhshan, S. Experimental study of viscosity effects on a pump as turbine performance. Renew. Energy 2018, 127, 539–547. [Google Scholar] [CrossRef]
- Derakhshan, S.; Kasaeian, N. Optimization, numerical, and experimental study of a propeller pump as turbine. J. Energy Resour. Technol. 2014, 136, 012005. [Google Scholar] [CrossRef]
- Le Marre, M.; Mandin, P.; Lanoisellé, J.-L.; Bezuglov, R. Experimental study on performance predictions of pumps as turbine. Energy Convers. Manag. 2023, 292, 117235. [Google Scholar] [CrossRef]
- Ismail, M.A.; Muzammil, W.K.; Rahman, M.; Ibrahim, M.W.K.; Misran, S. Experimental design and analysis of pump as turbine for microhydro system. In Proceedings of the IOP Conference Series: Materials Science and Engineering, Busan, Republic of Korea, 25–27 August 2017; IOP Publishing: Bristol, UK, 2017; Volume 217, p. 012014. [Google Scholar]
- Lu, J.; Wu, F.; Liu, X.; Zhu, B.; Yuan, S.; Wang, J. Investigation of the mechanism of unsteady flow induced by cavitation at the tongue of a centrifugal pump based on the proper orthogonal decomposition method. Phys. Fluids 2022, 34, 105113. [Google Scholar] [CrossRef]
- Barzdaitis, V.; Mažeika, P.; Vasylius, M.; Kartašovas, V.; Tadžijevas, A. Investigation of pressure pulsations in centrifugal pump system. J. Vibroeng. 2016, 18, 1849–1860. [Google Scholar] [CrossRef][Green Version]
- Ma, X.; Bian, M.; Yang, Y.; Dai, T.; Tang, L.; Wang, J. Study on the effect mechanism of inlet pre-swirl on pressure pulsation within a mixed-flow centrifugal pump. Water 2023, 15, 1223. [Google Scholar] [CrossRef]
- Hodkiewicz, M. The Effect of Partial-Flow Operation on the Axial Vibration of Double-Suction Centrifugal Pumps. Ph.D. Thesis, The University of Western Australia, Crawley, Australia, 2004. [Google Scholar]
- Hodkiewicz, M.; Norton, M. The effect of change in flow rate on the vibration of double-suction centrifugal pumps. Proc. Inst. Mech. Eng. Part E J. Process. Mech. Eng. 2002, 216, 47–58. [Google Scholar] [CrossRef]
- Hodkiewicz, M.; Pan, J. Identification of transient axial vibration on double-suction pumps during partial flow operation. Acoust. Aust. 2004, 32, 25–32. [Google Scholar]
- Li, G.; Hu, J.; Shan, D.; Ao, J.; Huang, B.; Huang, Z. A CNN model based on innovative expansion operation improving the fault diagnosis accuracy of drilling pump fluid end. Mech. Syst. Signal Process. 2023, 187, 109974. [Google Scholar] [CrossRef]
- Jiang, X.; Gao, X.; Hu, J.; Wang, Z.; Wang, L. Research on state evaluation and prediction system of hydraulic turbine based on pressure pulsation parameters. In Proceedings of the IOP Conference Series: Earth and Environmental Science, Banda Aceh, Indonesia, 21 September 2021; IOP Publishing: Bristol, UK, 2017; Volume 774, p. 012035. [Google Scholar]
- Zhang, J.; Li, S. Air quality index forecast in Beijing based on CNN-LSTM multi-model. Chemosphere 2022, 308, 136180. [Google Scholar] [CrossRef]
- Mele, J.; Guzzomi, A.; Pan, J. Correlation of centrifugal pump vibration to unsteady flow under variable motor speed. Mech. Ind. 2014, 15, 525–534. [Google Scholar] [CrossRef]
- Zhang, W.; Li, C.; Peng, G.; Chen, Y.; Zhang, Z. A deep convolutional neural network with new training methods for bearing fault diagnosis under noisy environment and different working load. Mech. Syst. Signal Process. 2018, 100, 439–453. [Google Scholar] [CrossRef]
- Egusquiza, E.; Valero, C.; Valentin, D.; Presas, A.; Rodriguez, C.G. Condition monitoring of pump-turbines. New Chall. Meas. 2015, 67, 151–163. [Google Scholar] [CrossRef]
- Wu, Z.; Huang, N.E. Ensemble empirical mode decomposition: A noise-assisted data analysis method. Adv. Adapt. Data Anal. 2009, 1, 1–41. [Google Scholar] [CrossRef]
- Siegler, J.A.; Sarkady, A.A.; Nemarich, C. Motor current signal analysis for diagnosis of fault conditions in shipboard equipment. Nav. Eng. J. 1995, 107, 77–98. [Google Scholar] [CrossRef]
- Muralidhar, K.; Rajasekar, N. A review of various components of solar water-pumping system: Configuration, characteristics, and performance. Int. Trans. Electr. Energy Syst. 2021, 31, e13002. [Google Scholar] [CrossRef]
Disclaimer/Publisher’s Note: The statements, opinions and data contained in all publications are solely those of the individual author(s) and contributor(s) and not of MDPI and/or the editor(s). MDPI and/or the editor(s) disclaim responsibility for any injury to people or property resulting from any ideas, methods, instructions or products referred to in the content. |
© 2025 by the authors. Licensee MDPI, Basel, Switzerland. This article is an open access article distributed under the terms and conditions of the Creative Commons Attribution (CC BY) license (https://creativecommons.org/licenses/by/4.0/).
