1. Introduction
The management of air quality in operating rooms is critical for maintaining sterile conditions and minimizing the risk of postoperative infections. Achieving compliance with air cleanliness standards, such as ISO Class 7, requires a comprehensive understanding of airflow dynamics and particulate transport mechanisms. Contaminants in operating rooms primarily originate from sources such as medical personnel movement, surgical equipment, and patients. Studies have shown that human skin, clothing, and activities—such as periodic bending or movements of surgeons—significantly influence the distribution of bacteria-carrying particles within the surgical field, potentially leading to contamination [
1,
2,
3,
4].
In enclosed environments, the primary source of airborne bacteria is human presence, with skin particles, respiratory emissions, and clothing contributing to aerosolized particulates [
5,
6]. The behavior and dispersion of these particles largely depend on their size and the airflow patterns within the room. For instance, larger particles tend to settle quickly due to gravitational effects, whereas smaller particles remain suspended and can be transported over longer distances [
7,
8]. Additionally, while surgical activity and surgeon movement often leads to higher levels of airborne microbial contamination, proper ventilation systems can effectively maintain acceptable air quality [
4,
9,
10,
11,
12]. The configuration and positioning of medical equipment can also significantly influence contaminant dispersion in operating rooms, particularly under unidirectional down flow conditions [
13].
Computational Fluid Dynamics (CFD) has emerged as a powerful tool for simulating and analyzing complex airflow and particle dynamics in controlled environments. CFD methods, particularly the Eulerian approach, are widely used to model air and particle flow, providing detailed insights into distribution patterns and deposition rates [
3,
9,
14]. Previous studies have demonstrated the successful application of CFD in evaluating the effectiveness of ventilation systems in minimizing particle dispersion and reducing contamination risks in operating rooms [
3]. Moreover, numerical simulations employing the k-ε turbulence model have been utilized to analyze the impact of airflow systems on air quality and contaminant control in surgical environments [
9,
14]. On the other hand, advanced turbulence models such as Direct Numerical Simulation (DNS) and Large Eddy Simulation (LES) provide higher accuracy but are often associated with extremely high computational costs [
3].
This study applies steady-state CFD simulations using the k-ε turbulence model to evaluate airflow and particulate matter behavior in an operating room. The primary objective is to assess how airborne particles of varying sizes (0.5 µm, 1 µm, and 5 µm) behave under standard surgical conditions, with a focus on identifying regions of accumulation that may contribute to infection risk. It is hypothesized that airflow patterns within the room, influenced by ventilation design and equipment layout, significantly affect particle distribution. This study assumes a one-way coupling approach, where particles are influenced by the continuous air phase but do not affect the airflow. Additionally, particle interactions are considered negligible, meaning no collisions or agglomeration effects are accounted for. The Lagrangian multiphase method was employed to simulate particles with diameters of 0.5 µm, 1 µm, and 5 µm, investigating their accumulation and distribution under standard surgical conditions. The simulation results were validated against experimental data, providing valuable insights for optimizing air quality management in operating rooms. Furthermore, this work contributes to the development of infection control strategies by addressing the need for advanced simulations that incorporate dynamic factors such as personnel movement and variable contaminant sources.
2. Materials and Methods
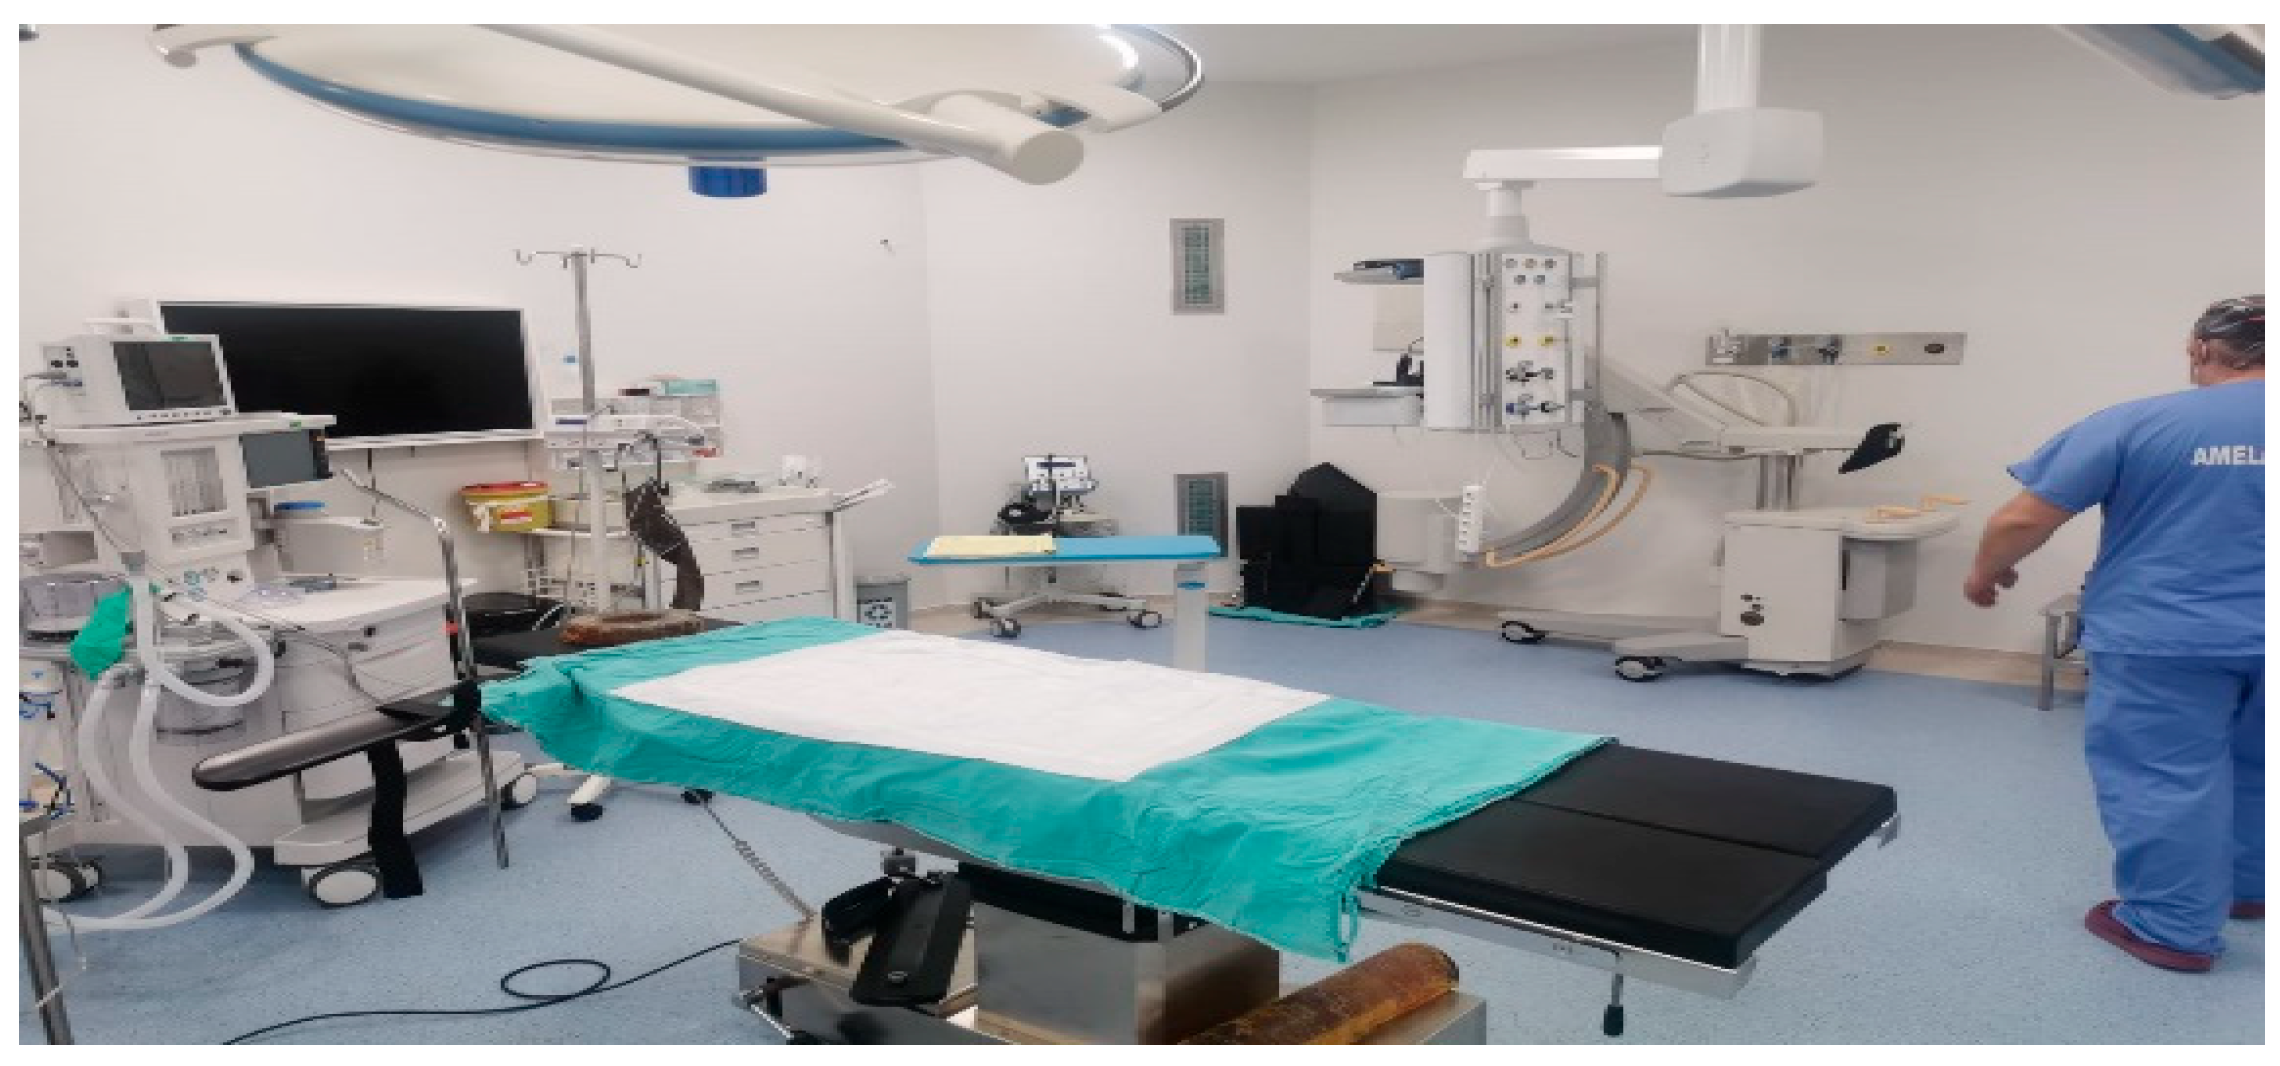
This study was conducted in an operating room at a private hospital in Antalya, with a total surface area of 49.7 m
2 and a ceiling height of 3 m, resulting in a volume of approximately 149 m
3. The general view of the operating room is shown in
Figure 1 below.
The operating room’s airflow system includes a High Efficiency Particulate Air (HEPA) filtered laminar flow unit positioned above the surgical area to provide clean air intake. The operating room walls also contain air outlet vents that exhaust air from the room.
The view of the operating room defined in the simulation is shown in
Figure 2. The operating room has an air inlet vent measuring 2400 × 1800 mm
2 for the laminar flow unit on the ceiling. There are a total of four air outlet vents, each measuring 310 × 310 mm
2, on two opposite walls of the operating room.
- (a)
Particle Count Measurements:
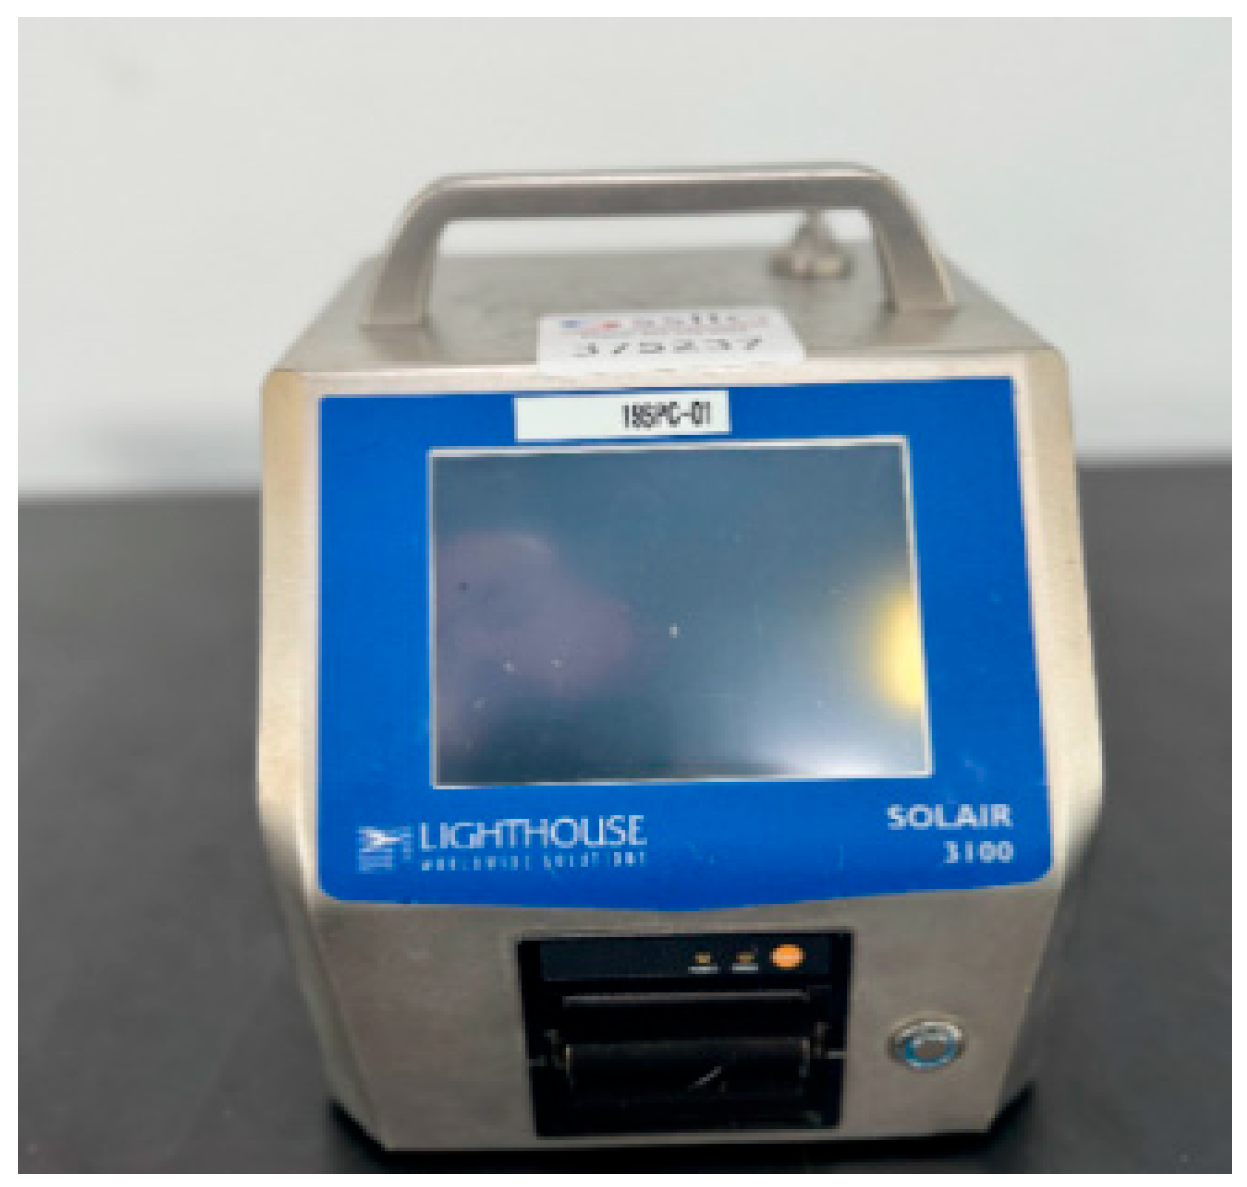
In the study, particulate matter measurements were conducted using the Solair 3100E (Lighthouse Worldwide Solutions, Fremont, CA, USA) device. Below,
Figure 3 shows the appearance of the Solair measurement device.
The Solair 3100E device utilizes the Optical Particle Counter (OPC) method for particle counting. It operates with Extreme Life Laser Diode Technology to optically detect airborne particles. Capable of counting particles ranging from 0.3 µm to 10 µm, the device complies with cleanroom standards and holds ISO 21501-4 [
15] certification, allowing simultaneous display of different particle sizes. The technical specifications of the Solair 3100E device are provided in
Table 1.
- (b)
Simulation Approach
Computational Fluid Dynamics (CFD) simulations were conducted using Simcenter STAR-CCM+ 2410 software to analyze airflow and particulate matter behavior in the operating room. A steady-state solver was used for velocity profile modeling, and the k-ε turbulence model was applied to accurately represent turbulent airflow. This model was chosen for its robustness, computational efficiency, and proven reliability in predicting general turbulent flow behavior in enclosed environments such as rooms and ventilation systems. Once the airflow reached a steady state, the solver was frozen, and the Lagrangian multiphase solver was activated to simulate particle trajectories. This decoupling of the fluid velocity solver from the particle transport solver is appropriate for cases with low particle volume fractions, where the influence of particles on the continuous phase is minimal. This decoupling is valid under the assumption of a low particle volume fraction, where the particles do not exert significant feedback forces on the airflow. The one-way coupling approach was therefore appropriate and ensured numerical stability while reducing computational demand. A one-way coupling approach was therefore employed, in which particles are affected by the airflow but do not alter it. Particle-particle interactions were also neglected, assuming a dilute particle dispersion without significant collisions or agglomeration.
The computational domain was meshed using a polyhedral mesher, which is well-suited for capturing complex velocity fields due to its multidirectional cell faces that enhance numerical stability and accuracy. The mesh was refined at critical regions to resolve flow gradients effectively. Specifically, a cell size of 2.5 cm was applied at the inlet and outlet, while the wall regions used a slightly coarser cell size of 5 cm. Away from surfaces, the cell size was gradually increased up to 20 cm to reduce computational cost without compromising solution accuracy near areas of interest. To better capture the boundary layer near wall surfaces, two prism layers were added with a total thickness of 2 cm and a stretching ratio of 1.5, ensuring accurate resolution of near-wall flow behavior. The final mesh consisted of approximately 1.5 million cells, balancing computational efficiency with adequate resolution for accurate flow prediction.
The air was assumed to have a constant density of 1.18415 kg/m
3 and a constant viscosity of 1.85508 × 10
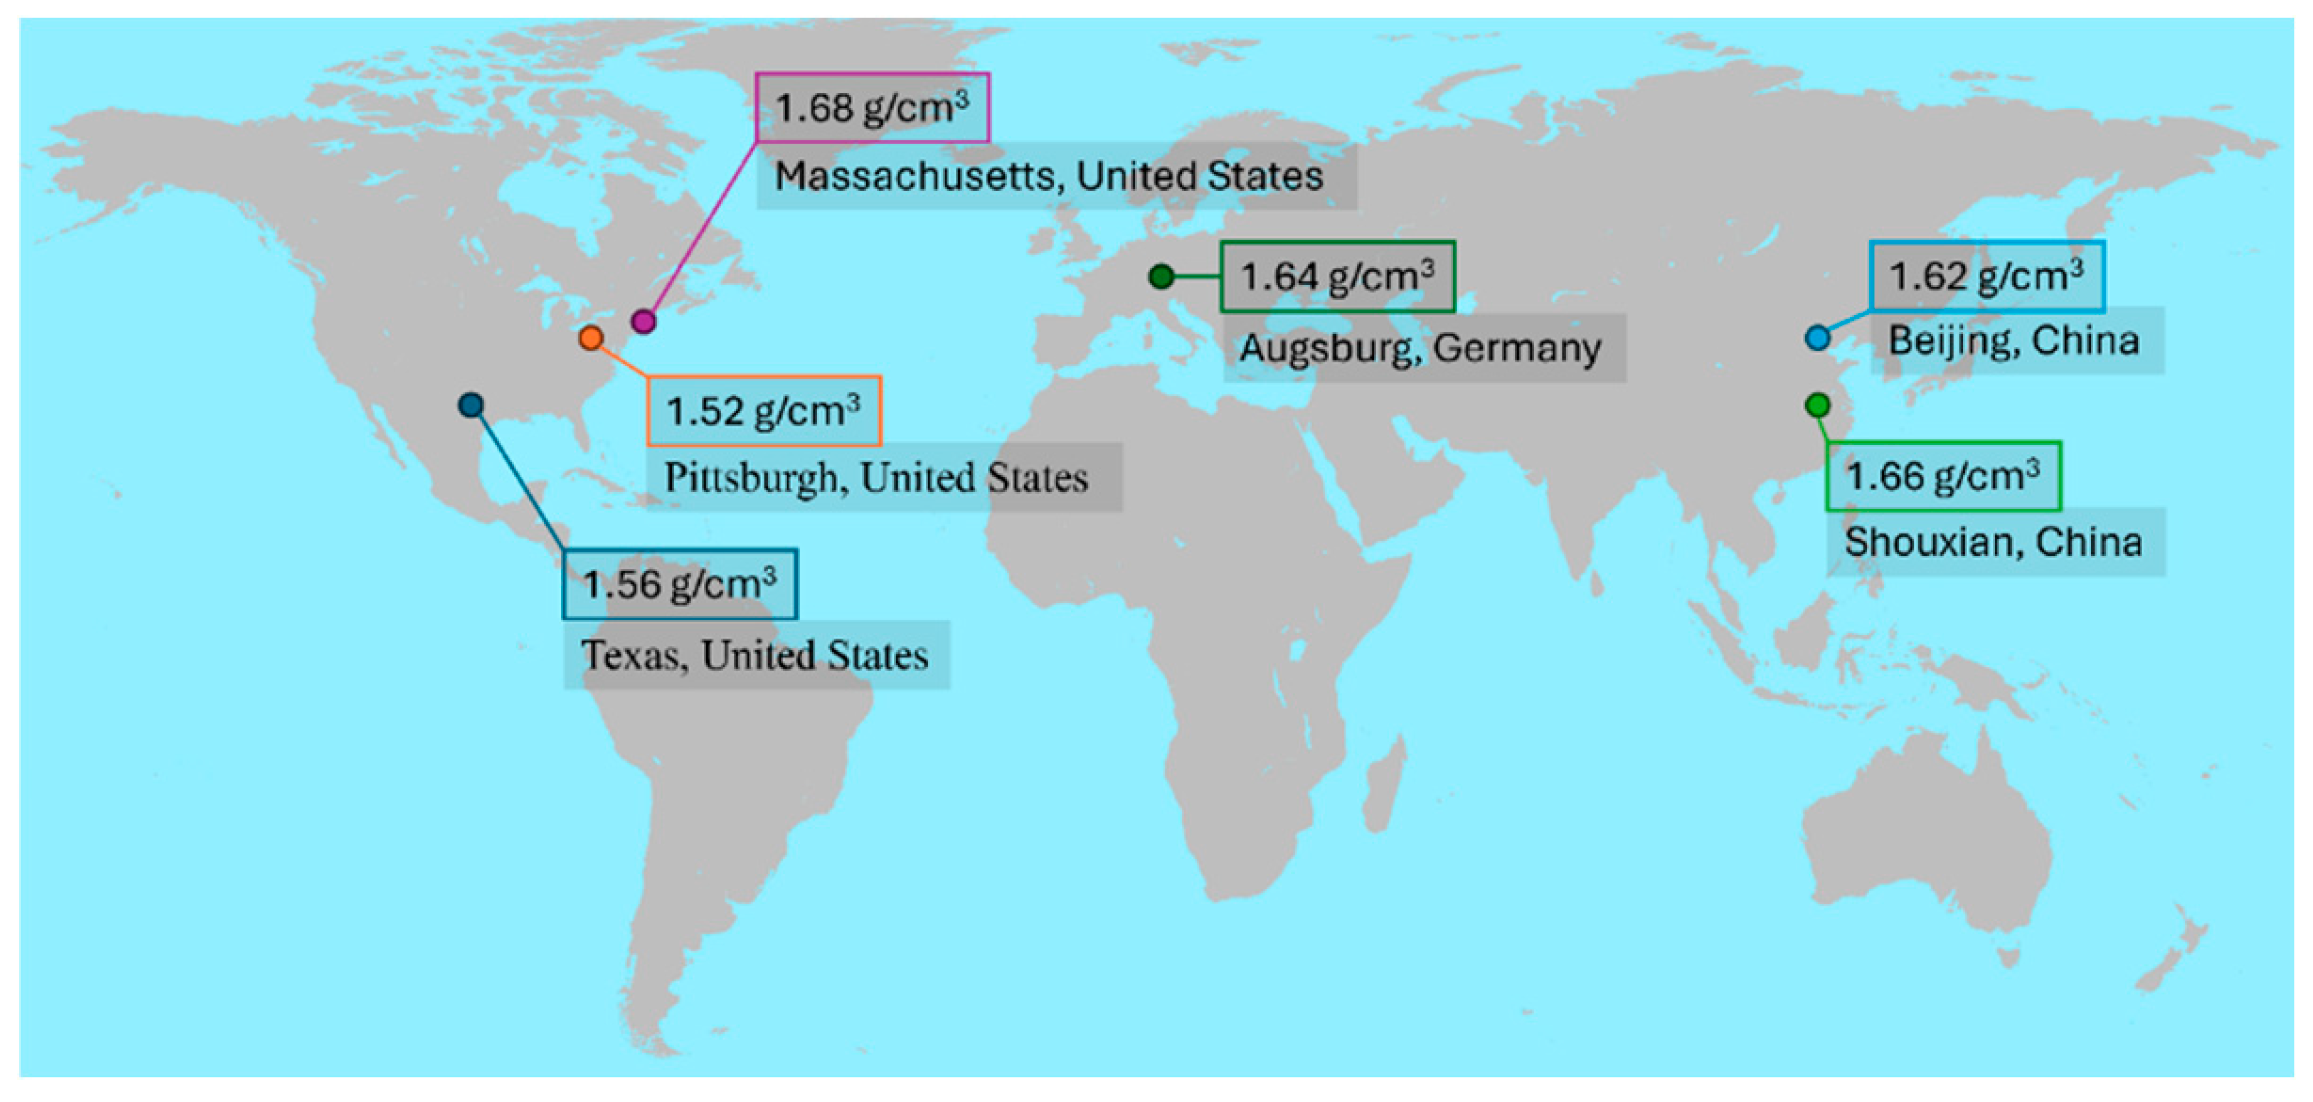
−5 Pa·s at a temperature of 298.15 K and a pressure of 101,325 Pa. Although temperature variations can induce natural convection and influence particle dynamics, this study assumes a constant temperature within the room. The simulations were conducted in an empty operating room, where thermal effects were considered negligible. Therefore, the segregated fluid isothermal model was used as the energy model. Experimentally measured particle densities in air from various locations around the world are obtained from previous studies and given in
Figure 4. In this simulation study, particle density is assumed as 1.66 g/cm
3, slightly lower than maximum (1.64 g/cm
3) particle density in
Figure 4. In this study, particle–particle interactions were assumed to be negligible, enabling independent analysis of different particle sizes. Three particle size groups—0.5 μm, 1 μm, and 5 μm—were selected based on ISO Class 7 classification criteria. While real operating environments typically contain a continuous range of particle sizes, this study adopted three discrete size groups to reflect the ISO 14644-1 [
16] Class 7 thresholds, which are standard in operating room contamination control assessments. Due to limitations in available measurement data and to reduce computational complexity, particle size distribution was not modeled continuously. Instead, the selected representative diameters (0.5 μm, 1 μm, and 5 μm) correspond to key reference values in surgical air cleanliness standards. Each size group was simulated independently, which allowed for clearer interpretation of particle transport mechanisms under varying aerodynamic responses. Future studies may incorporate detailed particle spectra to further enhance realism. Each group was simulated separately using a Lagrangian multiphase solver
Simcenter STAR-CCM+ (Siemens Digital Industries Software, Plano, TX, USA). Gravitational acceleration was defined as −9.81 m/s
2 in the z-direction.
In the study, the simulation was initially performed until steady a state was reached, with an air inlet boundary condition of 0.24 m/s velocity from the laminar flow unit and a 0 Pa air pressure boundary condition at the four vents on the walls. This allowed for the determination of the velocity and pressure distribution of the air in the operating room at steady state. Assuming that the velocity distribution of the air was unaffected by the particles, the velocity and pressure distributions obtained from the steady-state solution on the air side were fixed, and the solver on the air side was frozen. Only the simulation of Lagrangian particles was then performed. The simulations of the Lagrangian particles were carried out separately according to their sizes.
In the simulation, particulate matter was initiated from the surface of the laminar flow unit’s air inlet with a certain number of airflows moving in the same direction and at the same speed. The trajectory of the particles was calculated by considering the effects of gravity and airflow. To accurately model the drag forces exerted by the air flow on the particles, a drag force model was used, and the drag coefficient was determined using the Schiller-Naumann correlation [
23]. Additionally, to ensure the precise representation of particle motion, a shear lift force model was applied, and the shear lift force coefficient was calculated using the Sommerfeld method [
24]. A turbulent dispersion model, based on principles outlined in [
25], was implemented to simulate the effects of turbulent flow on particle distribution. Particle trajectories were obtained as the simulation result.
The multidimensional approach in the simulation ensures that the dynamics of particulate matter are comprehensively simulated under the combined effects of gravity, aerodynamics, and turbulent flow.
Governing Equations and Lagrangian Modeling Framework.
To ensure numerical consistency, the airflow simulation was based on the Reynolds-averaged Navier–Stokes (RANS) equations under incompressible and steady-state conditions:
here, u is the velocity vector, p is the pressure, ρ is the air density, μ is the dynamic viscosity, and g is the gravitational acceleration vector. Turbulence effects were modeled using the standard k-ε model.
For the particulate phase, the simulation employed a Discrete Phase Model (DPM), where particle motion was governed by Newton’s second law:
Instead of using a time-dependent approach with continuous particle feeding, the particles were fed into a previously obtained steady-state air flow solution domain, and their trajectories were simulated. This reduced the number of particles to be simulated, significantly decreasing the required time and computational resources for the simulation. However, additional processing was needed to obtain volumetric particle count values from the simulation results. By using the particle path data obtained from the simulation, the number of particles passing through any surface in the simulation can be determined. The particle count obtained from surfaces placed in the simulation can be converted into volumetric particle count values, similar to the experimental measurements, by using the ratio of the number of particles fed per unit area from the laminar flow unit to the experimentally measured particle count just below the laminar flow unit. This method allows for a direct comparison of simulation results with experimental data.
- (c)
ISO Particulate Standards
In evaluating the particulate concentrations in the operating room, the ISO 14644-1 standard, which defines cleanroom standards, has been used as a reference.
Table 2 summarizes the ISO classification criteria for different particle sizes. These standards were used as a benchmark to determine the air cleanliness level obtained in the simulated operating room.
- (d)
Validation and Analysis
Simulation results were compared with experimental velocity and pressure measurements obtained from the operating room. By evaluating particulate matter accumulation patterns, potential contamination areas were identified, and the accuracy of the simulation was examined based on its agreement with experimental data. This methodological framework serves as a foundation for future studies investigating more complex scenarios, such as optimizing operating room airflow and particle distribution by altering personnel and equipment positions in room and analyzing alternative air inlet-outlet configurations.
3. Results
As a result of the simulation study, air pressure, airflow velocity, and the trajectories of particulate matter within the operating room were obtained. Air pressure and airflow velocities were compared with experimental data. The trajectories of particulate matter obtained from the simulation were analyzed by determining the number of intersections with measurement surfaces, which were then converted into volumetric count data for comparison with experimental results. The results are presented under specific headings.
- (a)
Air Pressure Distribution
The pressure distribution in the operating room is shown in
Figure 5. The pressure values range between 7.12 and 7.19 Pa.
The pressure distribution obtained from the simulation, ranging between 7.12 and 7.19 Pa, meets the minimum pressure difference criterion of p > 6 Pa, which is required to maintain positive pressure in the operating room. Additionally, the simulation results show a high correlation with the experimental data, which was measured as 7 Pa. This confirms that the numerical model accurately predicts the pressure conditions. Positive pressure plays a critical role in preventing contaminants from infiltrating the operating room, which is vital for maintaining a sterile environment.
- (b)
Velocity Profiles
The experimental velocity results measured at various points 140–300 mm below the laminar flow unit are presented in
Table 3. The recorded velocities range between 0.21 and 0.26 m/s, with an average velocity of 0.24 m/s.
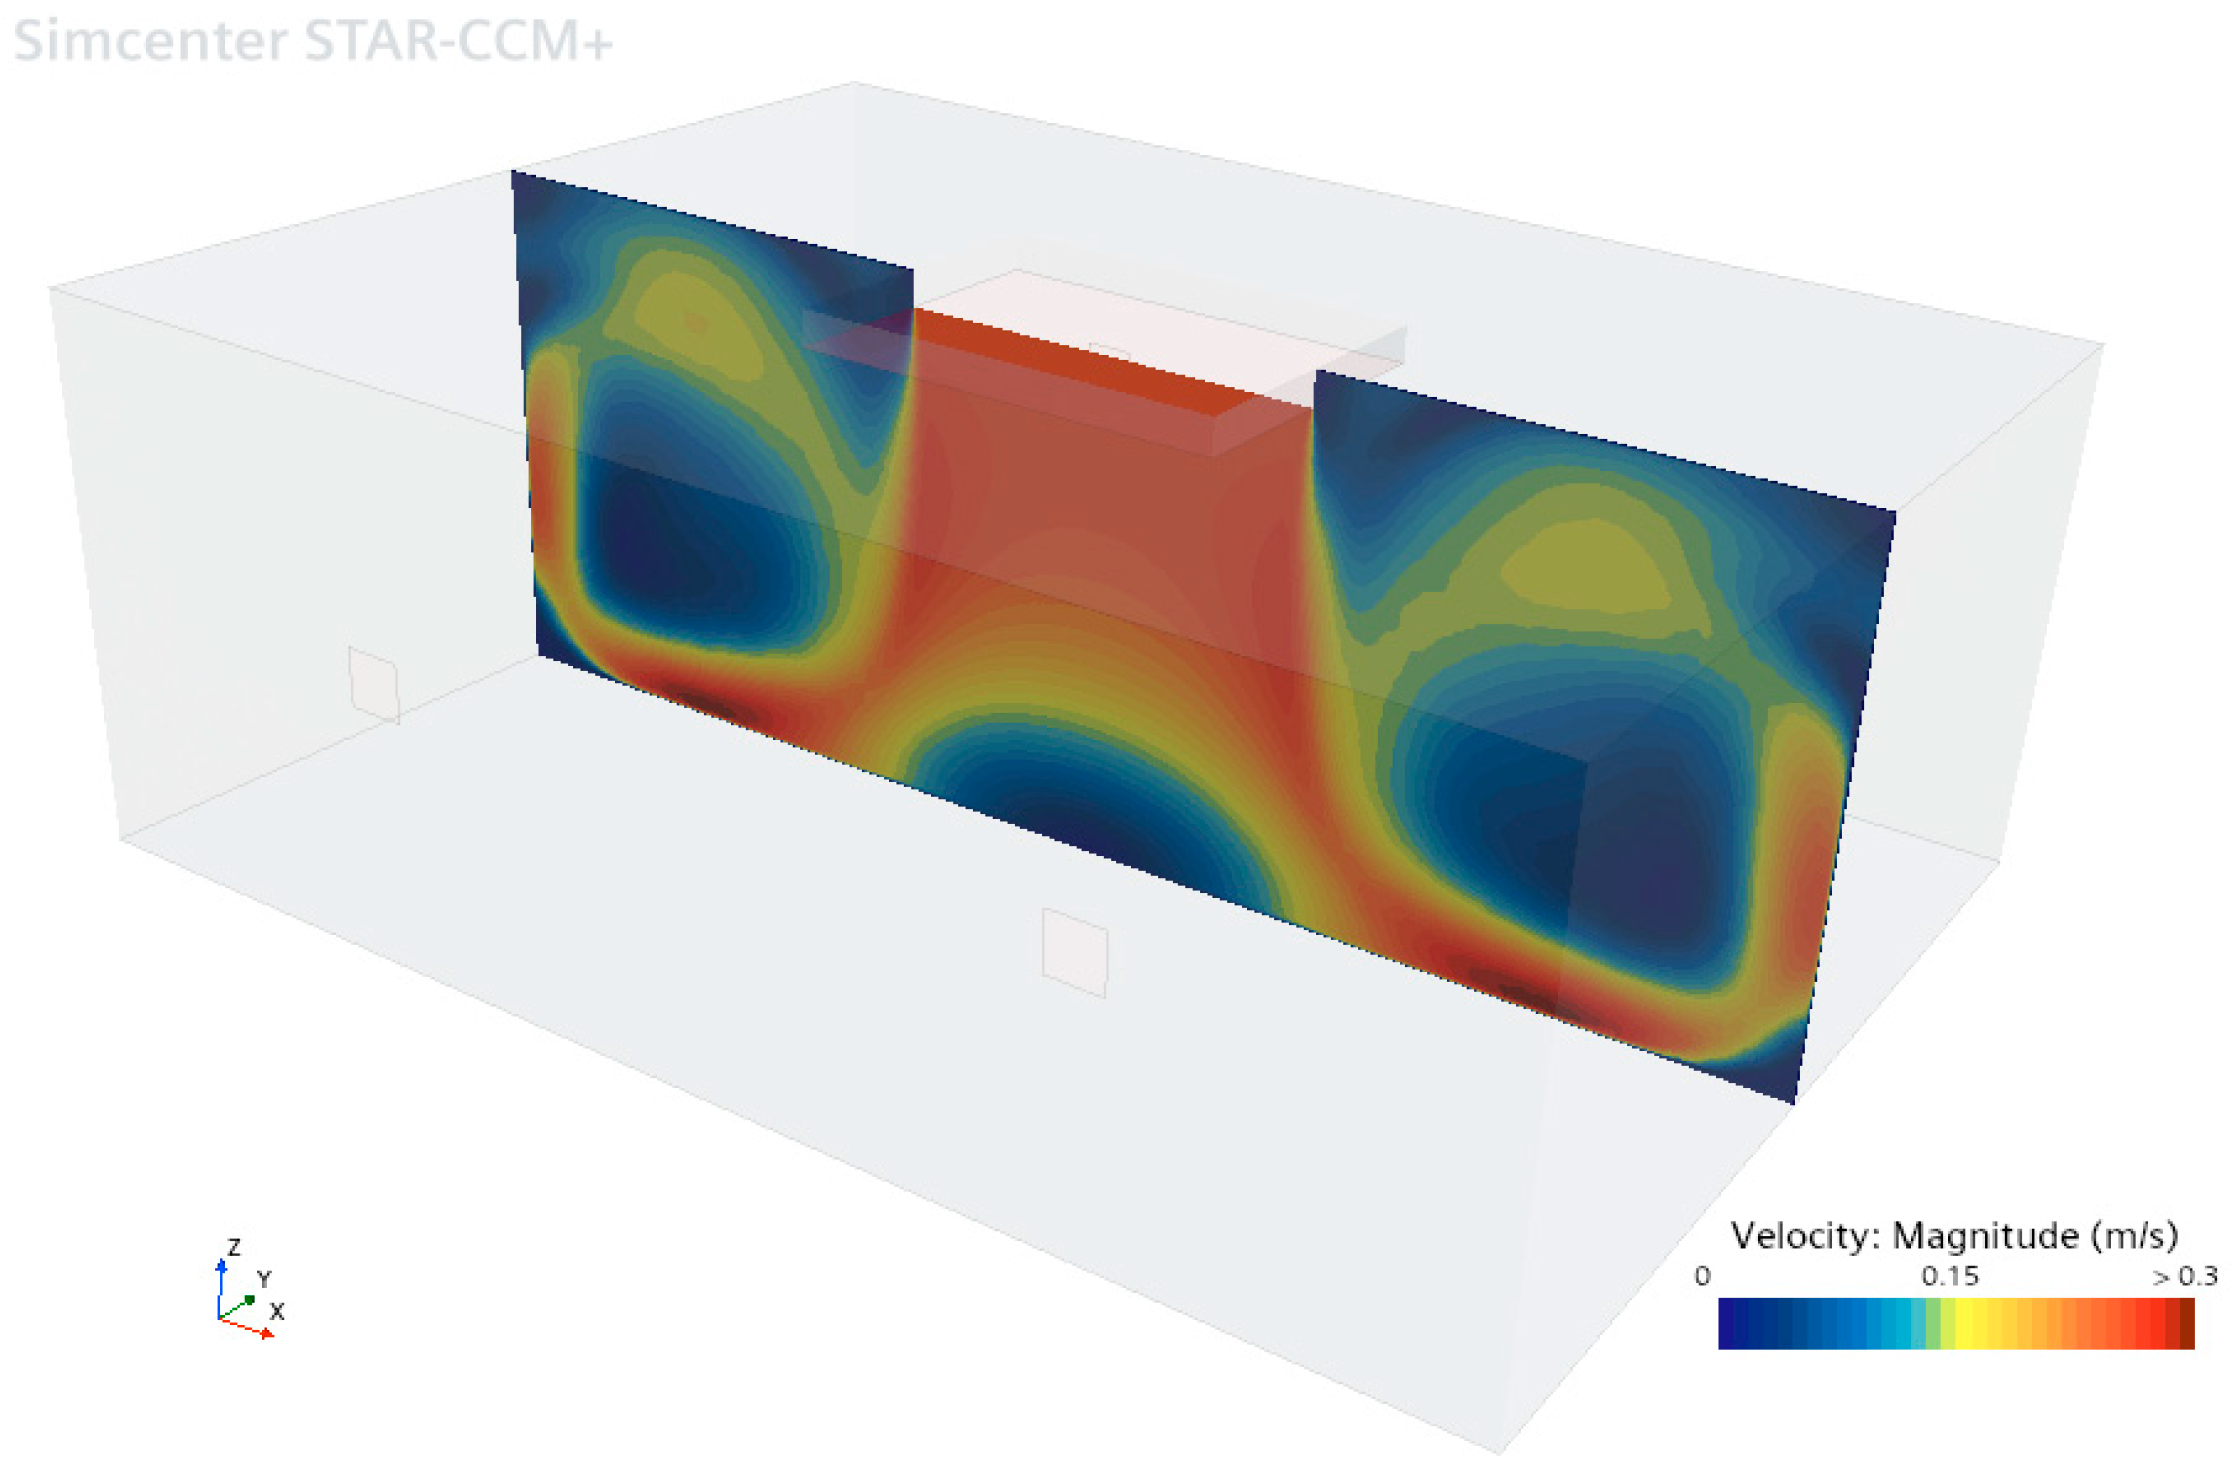
In the vertical section of the operating room shown in
Figure 6, the velocity near the inlet of the laminar flow unit is approximately 0.24 m/s. These results are consistent with the experimental measurement data presented in
Table 3. In the circulation areas between the laminar flow unit and the walls, the air velocity varies between 0 and 0.3 m/s. This velocity distribution indicates that laminar flow is effectively maintained in the area beneath the laminar flow unit.
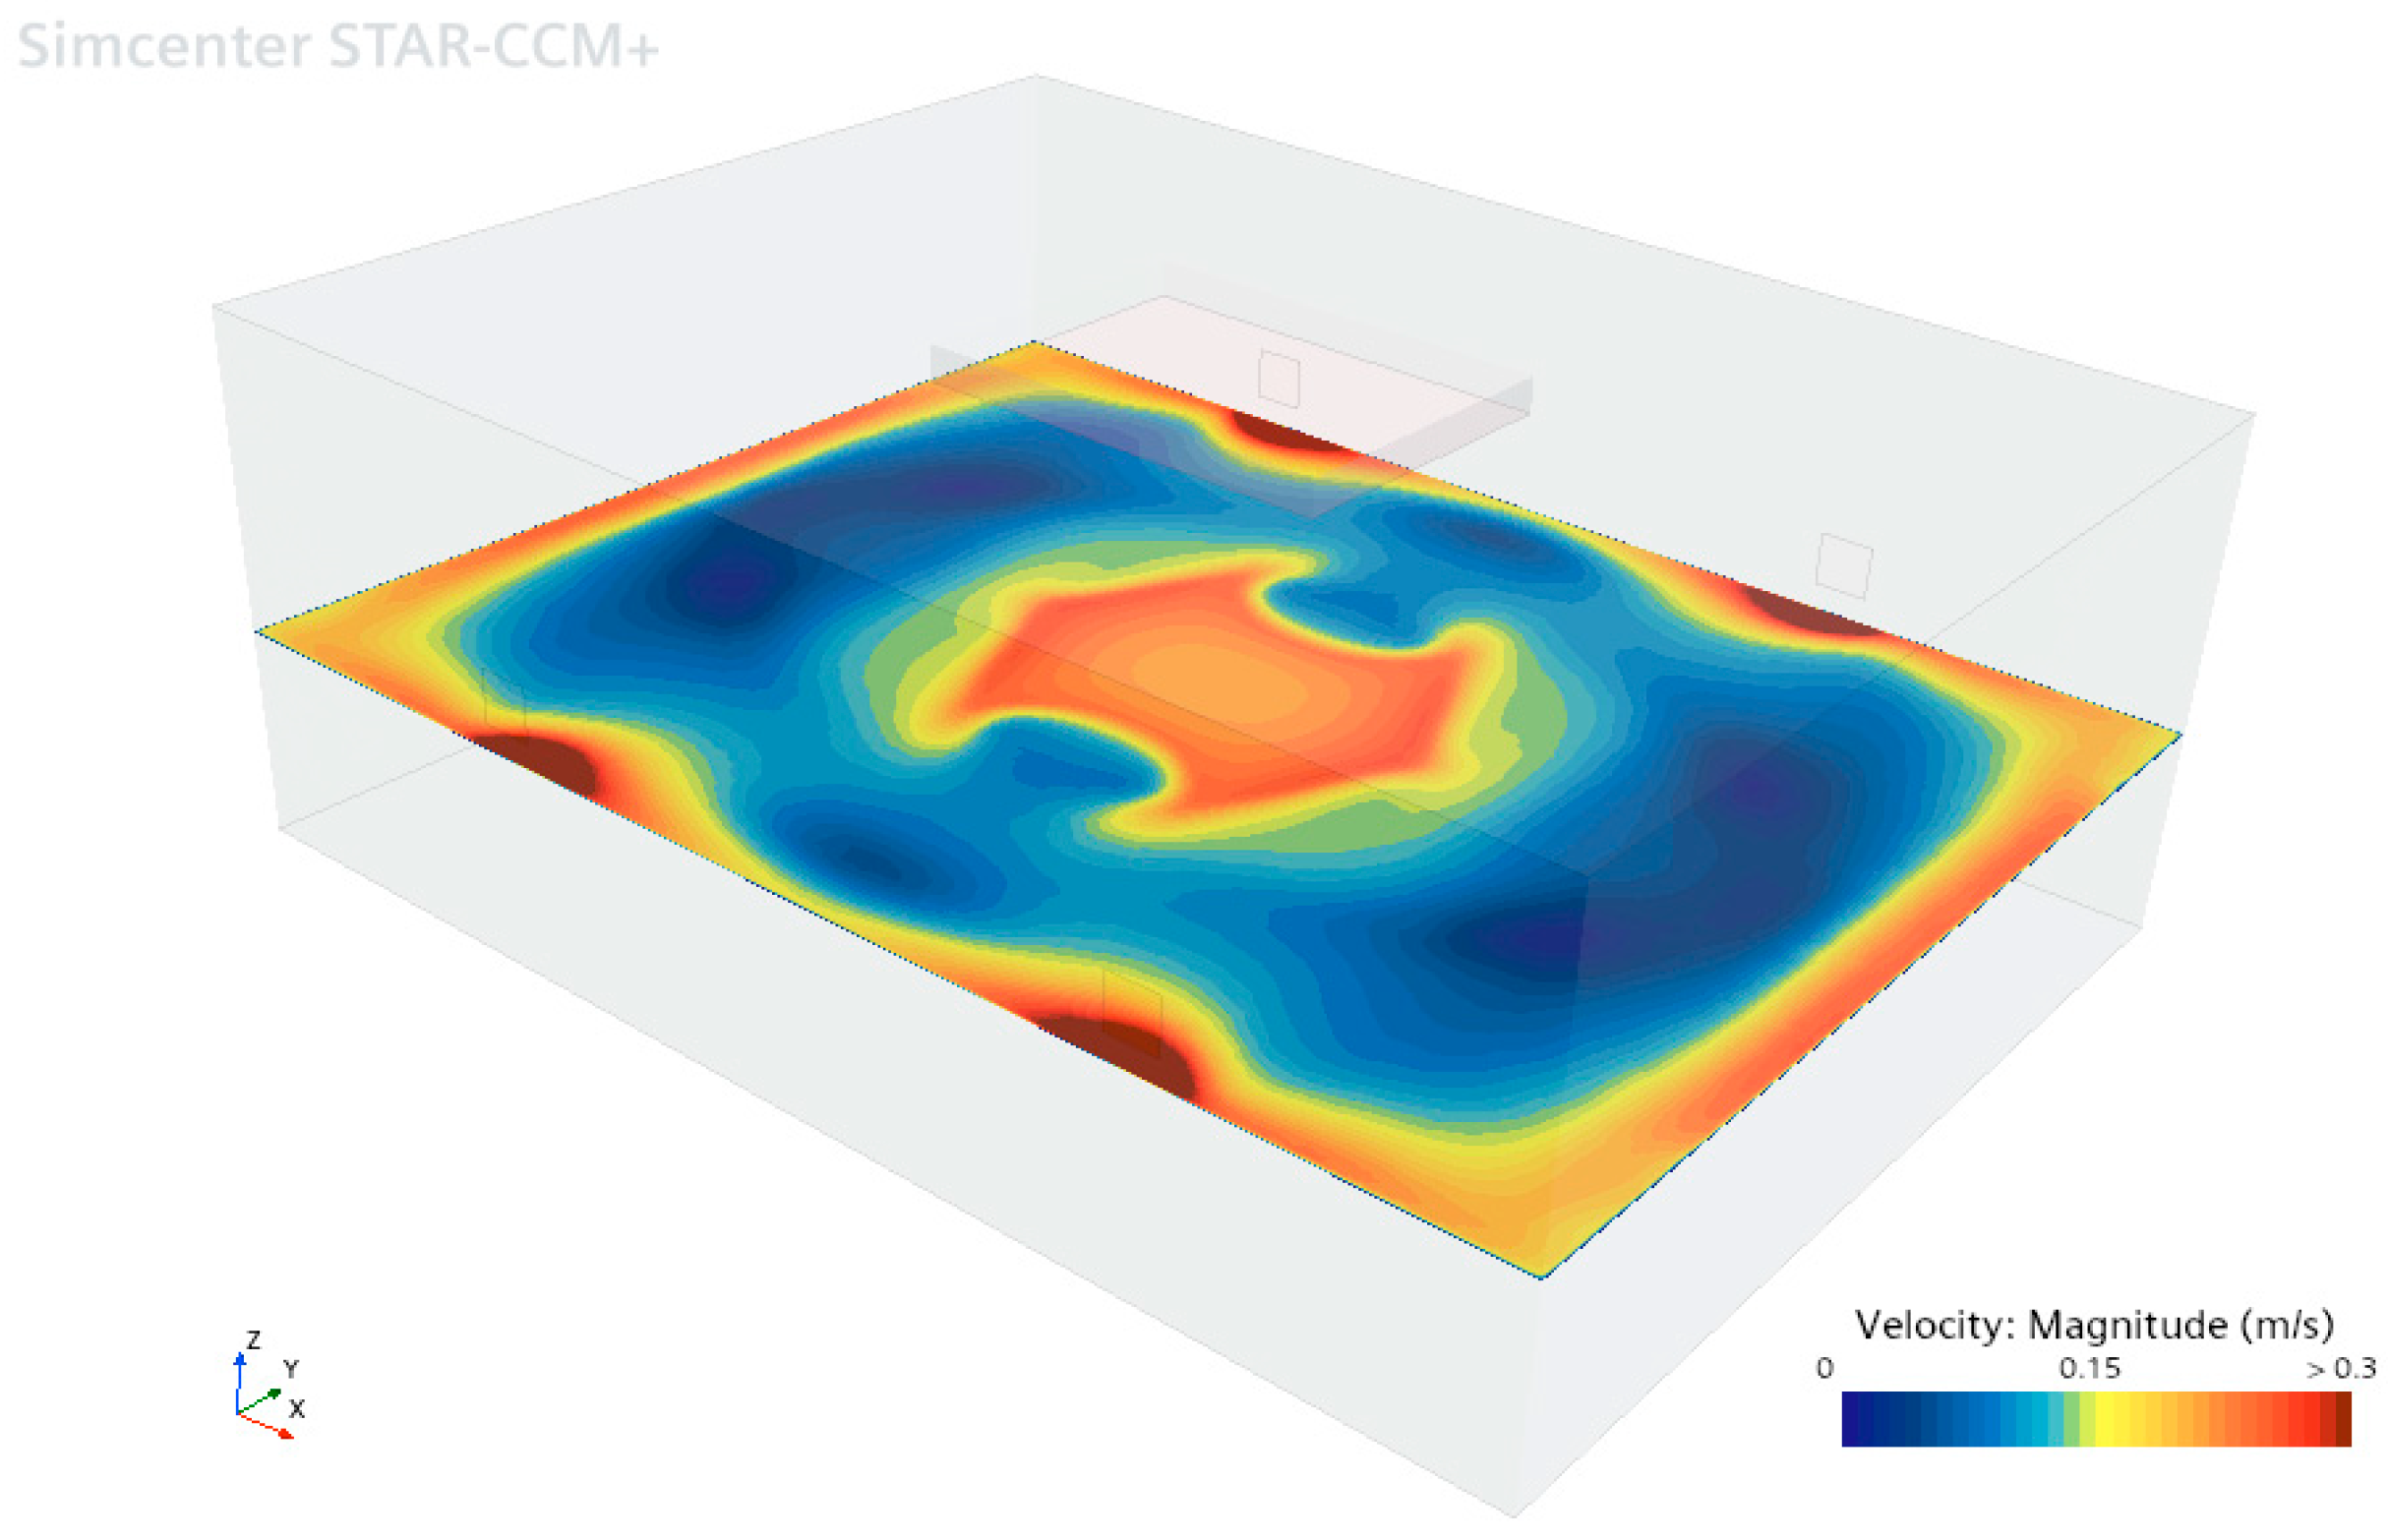
In
Figure 7, the velocity distribution in the horizontal section of the operating room at a height of 1.2 m above the floor shows that the air velocity is 0.24 m/s beneath the laminar flow unit and near the walls. However, in areas close to the outlet vents, the air velocity increases to approximately 0.3 m/s. Throughout the operating room, the velocity variation is within the range of 0–0.3 m/s, and the resulting velocity distribution reveals the circulation zones inside. The simulation results indicate that the airflow design effectively maintains a consistent air velocity in the critical operating area.
The air velocity results obtained through simulation analysis at the previously experimentally measured points are presented in
Table 4.
When
Table 4 is examined, the simulation results show that the air velocity ranges between 0.240 and 0.244 m/s, while the experimental results range between 0.21 and 0.26 m/s (
Table 3). The larger variation in the experimental results may be due to the shape of the exit plate at the laminar flow unit vent. Specifically, the grid holes on the air exit vent plate and the internal structure of the laminar unit can cause the exit air velocities to vary depending on the location. In the simulation, since the vent plate geometry was not considered in this study, a regular air velocity profile was observed near the inlet boundary, as expected.
- (c)
Distribution and Accumulation of Particulate Matter
In the simulation, the trajectories of Lagrangian particulate matter were calculated over a period of 100 min. A particle density of 10,000 particles/m2 was defined at the laminar flow vent, which corresponds to 43,201 particulate matter particles. Instead of continuous particle feeding, a one-time particle feed was implemented in the study. The paths followed by the particles, along with data such as the number of times they passed through specific surfaces, were used to determine the volumetric particle count.
In the simulation of the operating room,
Figure 8 shows the paths followed by 0.5 µm diameter particles over 50 s after being released from the laminar flow unit. The paths of the particles within the air are color-coded based on time. In the dark blue areas, the particles indicate their entry position into the operating room. The blue particles that descend to the floor are directed toward the side walls. Around 25 s, the yellow particles are seen moving upward from the side wall edges. Similarly, the red dust particles reach the ceiling at around 45 s and head toward the laminar flow vent. By 50 s, the particles are seen moving downward from the laminar flow vent. Some particles are observed exiting the room through the air exit vents.
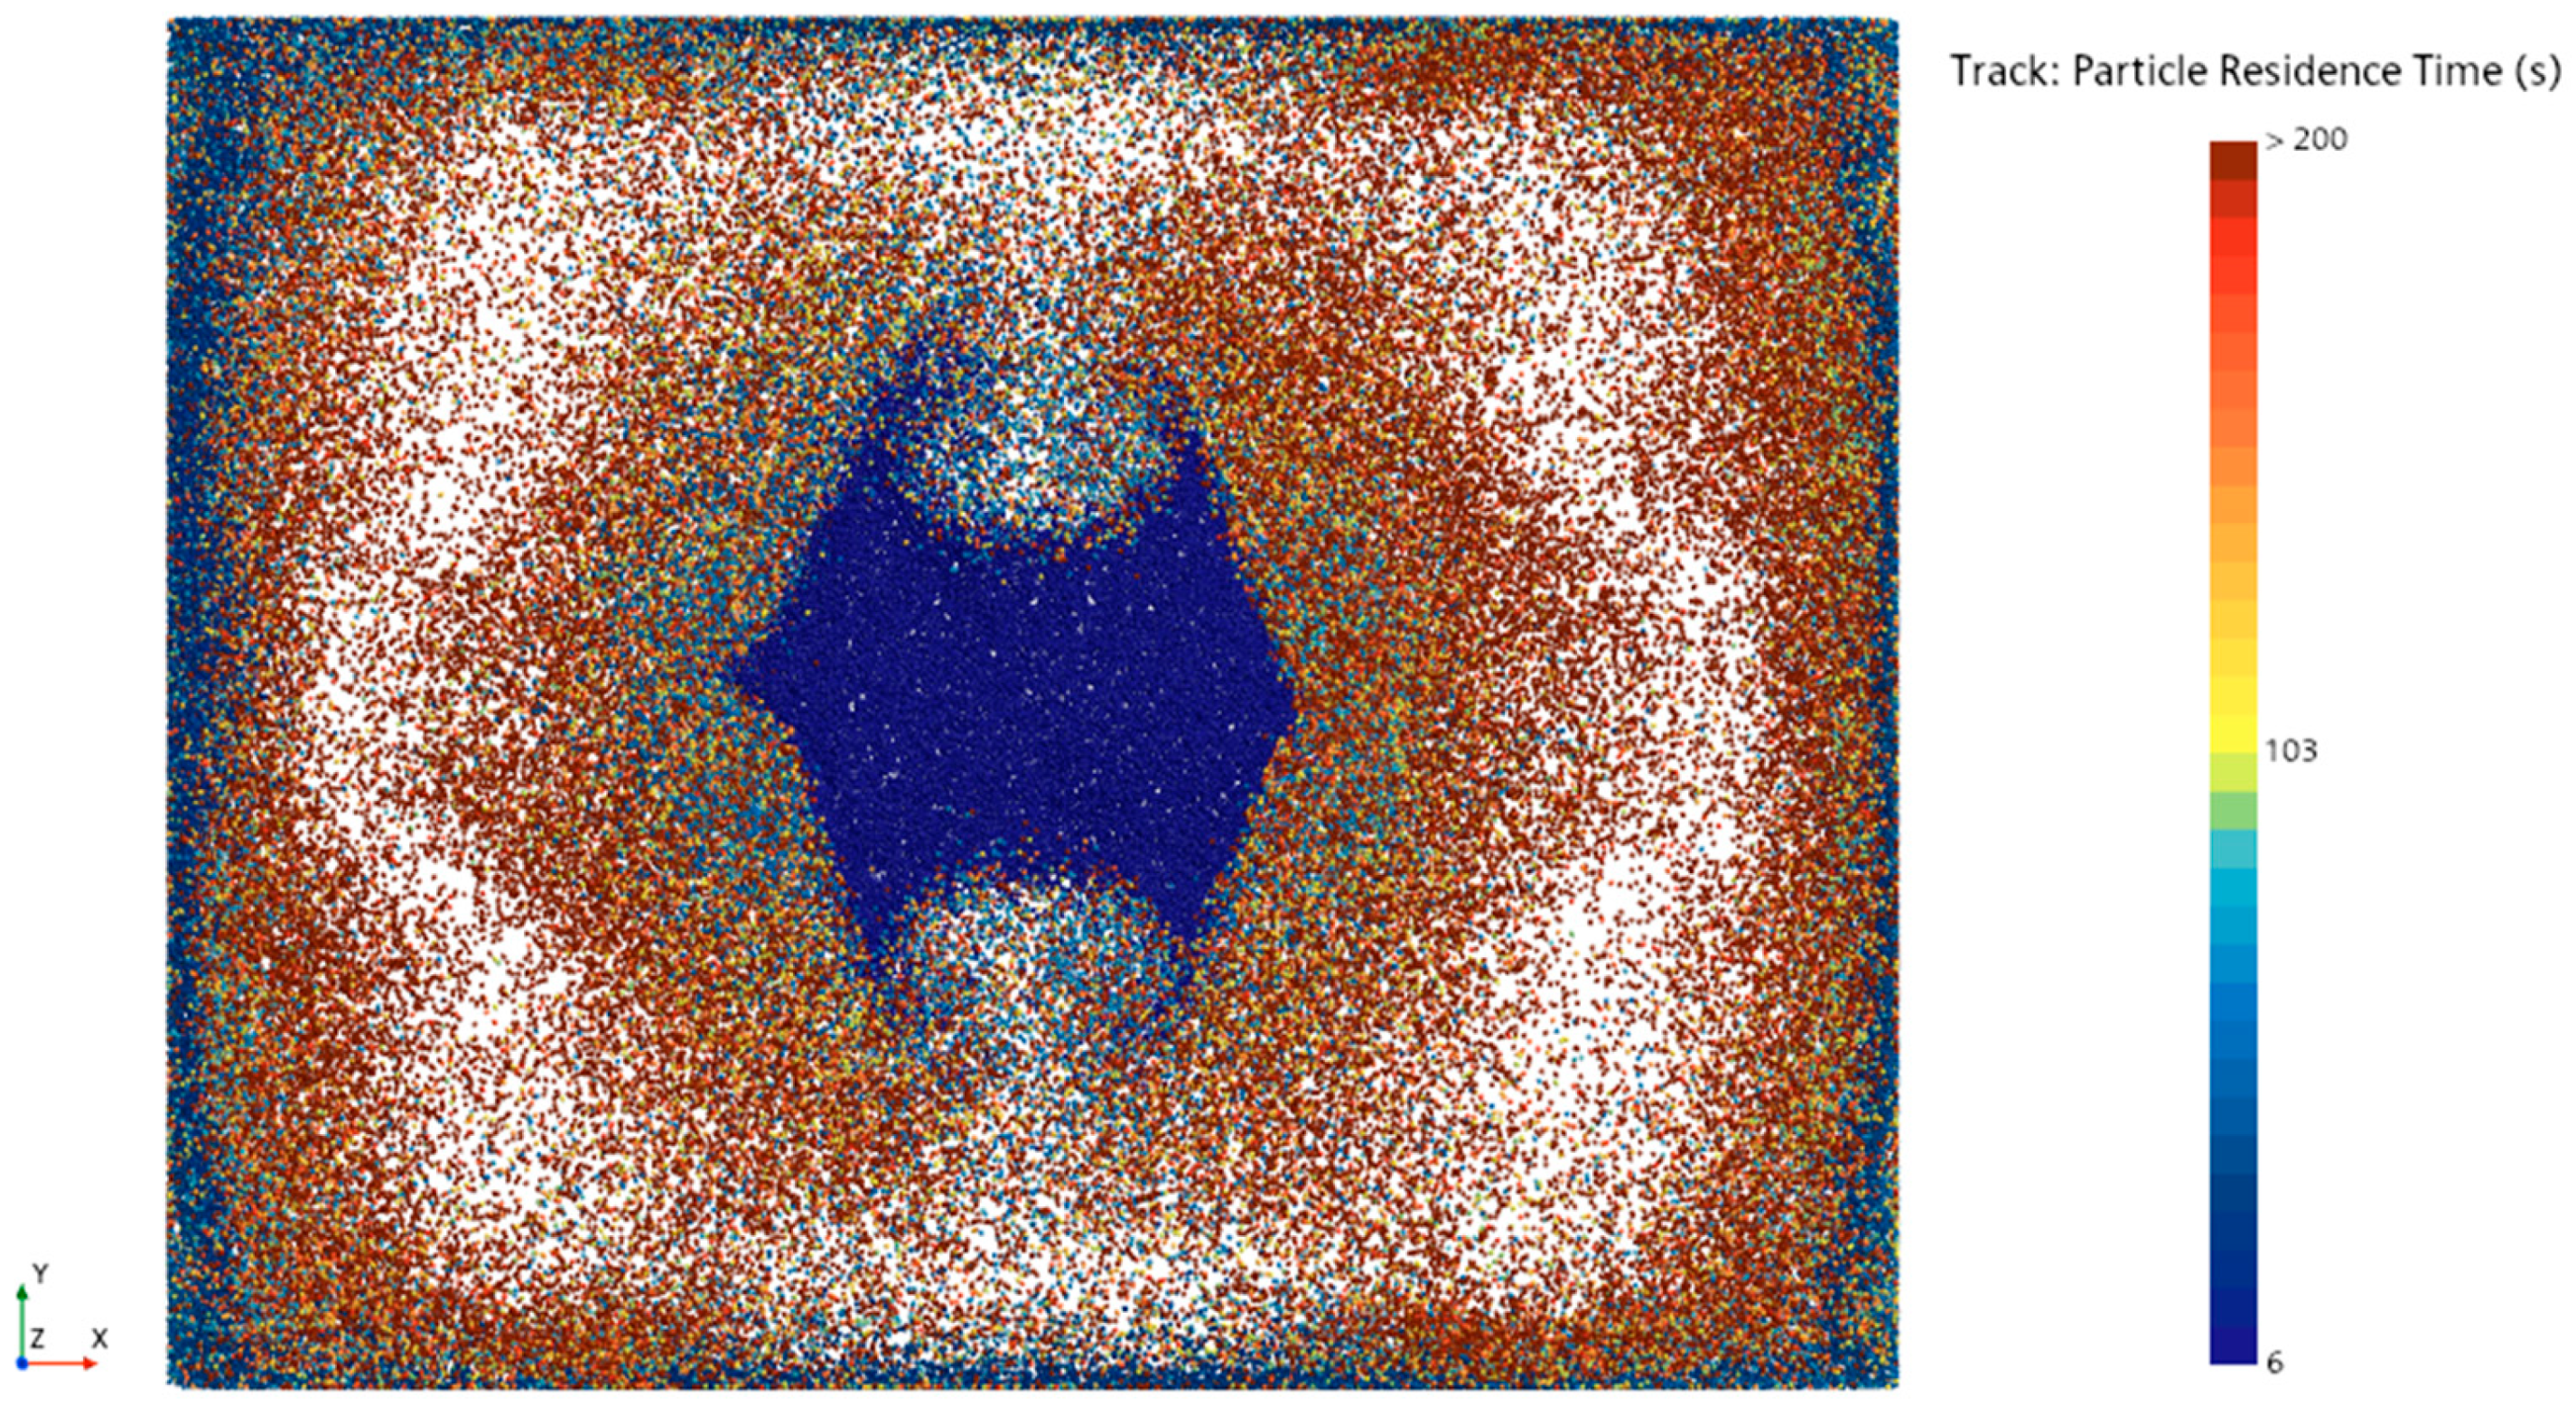
The plane section is placed 1.2 m above the operating room floor, and the intersection points of particulate matter over 10 min crossing this plane section are visualized in
Figure 9. According to
Figure 8, the particles begin circulating within the operating room after crossing the plane 6 s later, especially moving between the walls and the laminar flow area. Some particles leave the operating room through suction vents located on the side wall, which is normally to the
y-axis. As a result, the circulation of dust particles is lower in regions near these side walls compared to other walls, and the circulation of dust particles is especially less in the area between the two exit vents on the same wall. This situation highlights the differences in the movement and accumulation areas of particulate matter within the operating room.
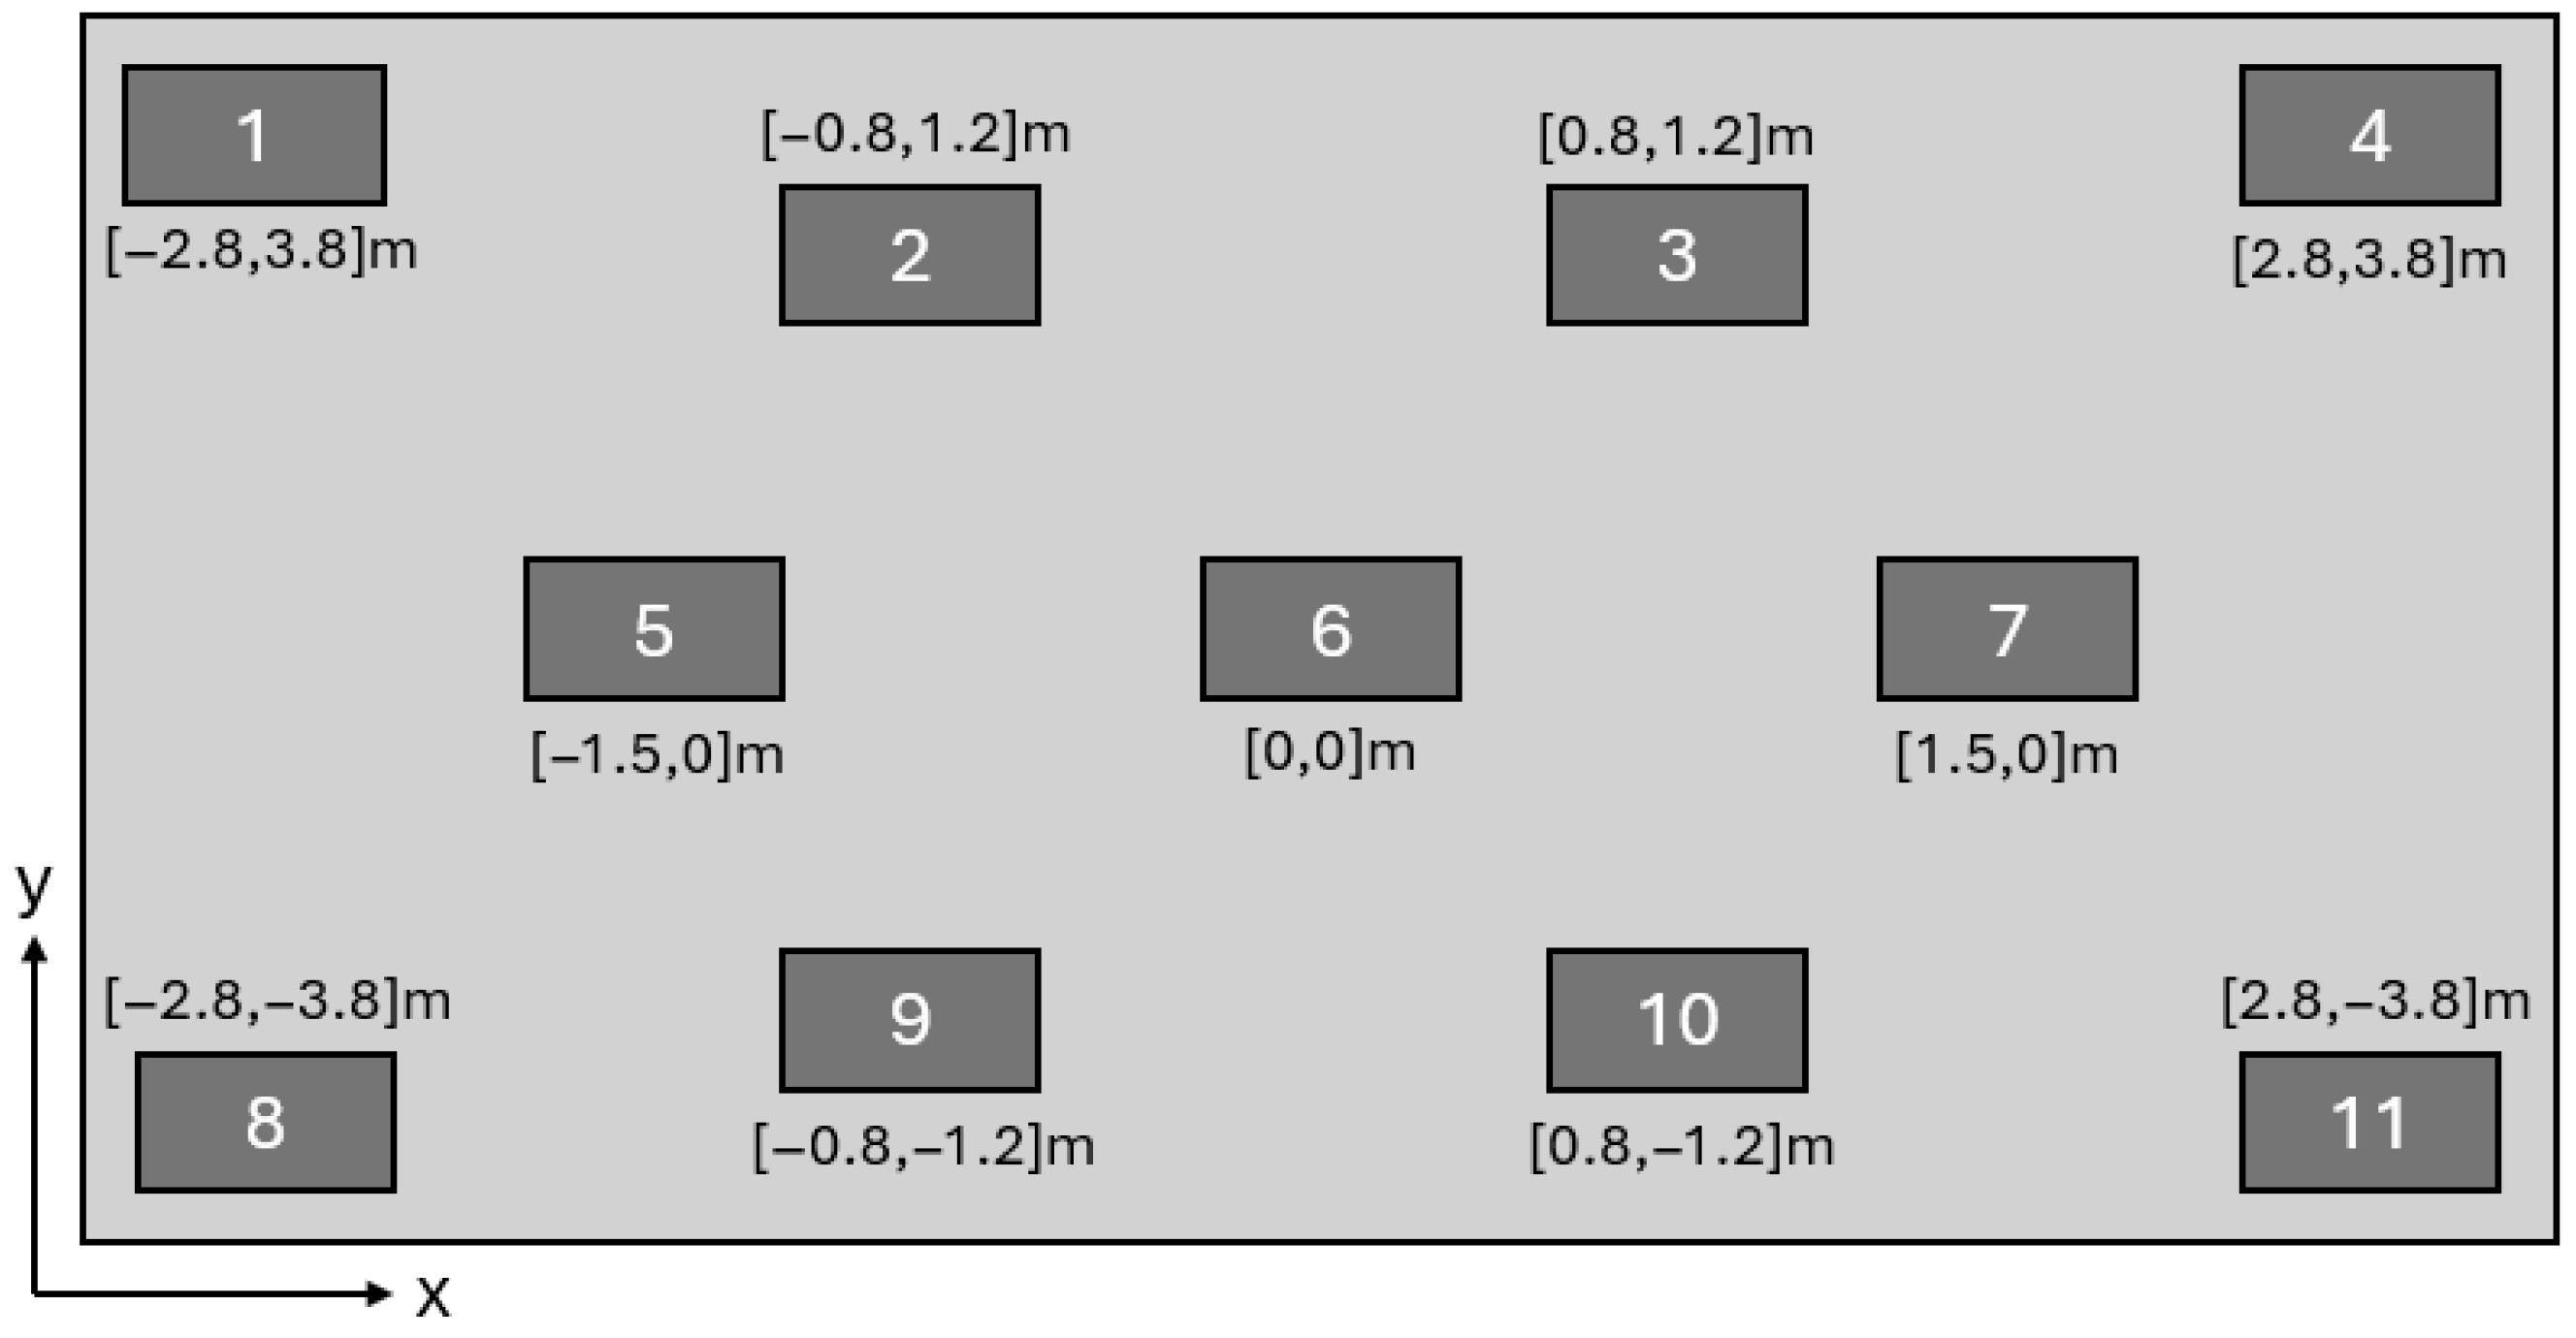
In the experimental study, the locations where particulate matter measurements were made at a height of 1.2 m are shown in the regions of
Figure 10. The height of 1.2 m was selected because it approximately corresponds to the nose or eye level of an operator during surgical operation. This allows the simulation results to be compared with what a surgeon or medical staff member would realistically observe during an operation, ensuring relevance to actual working conditions in the operating room. The measurement duration at each location was set to 1 min. The particle count measurements are expressed in particles/m
3. These data were used to assess the particle density in the room and compare it with the simulation results.
In the simulation study, the number of particles passing through the surfaces positioned at a height of 1.2 m in the regions numbered in
Figure 10 was recorded. The number of particles passing through each surface was divided by the surface area to obtain the number of particles passing per unit area. Using the ratio between the volumetric measurement value at the laminar flow unit inlet and the number of particles entering through the defined unit area at the laminar flow unit inlet in the simulation, the number of particles passing per unit area in the simulation results was converted into the number of particles per unit volume. Since no experimental data were available at the outlet of the laminar flow unit, the experimental measurement result from Region 6 was used instead. The reason for selecting Region 6 is that, according to the simulation results, particles pass through this region only once, making it the closest region to the values at the laminar flow unit inlet.
The measurement plane was placed at a height of 1.2 m above the floor, which approximately corresponds to the breathing zone (nose and eye level) of surgical staff during operations. This height selection ensures that the particle concentrations evaluated in the study reflect the actual exposure risk faced by surgeons and medical personnel during procedures, enhancing the clinical relevance and applicability of the simulation findings.
- (d)
Comparison of Simulation Results with Experimental Measurements
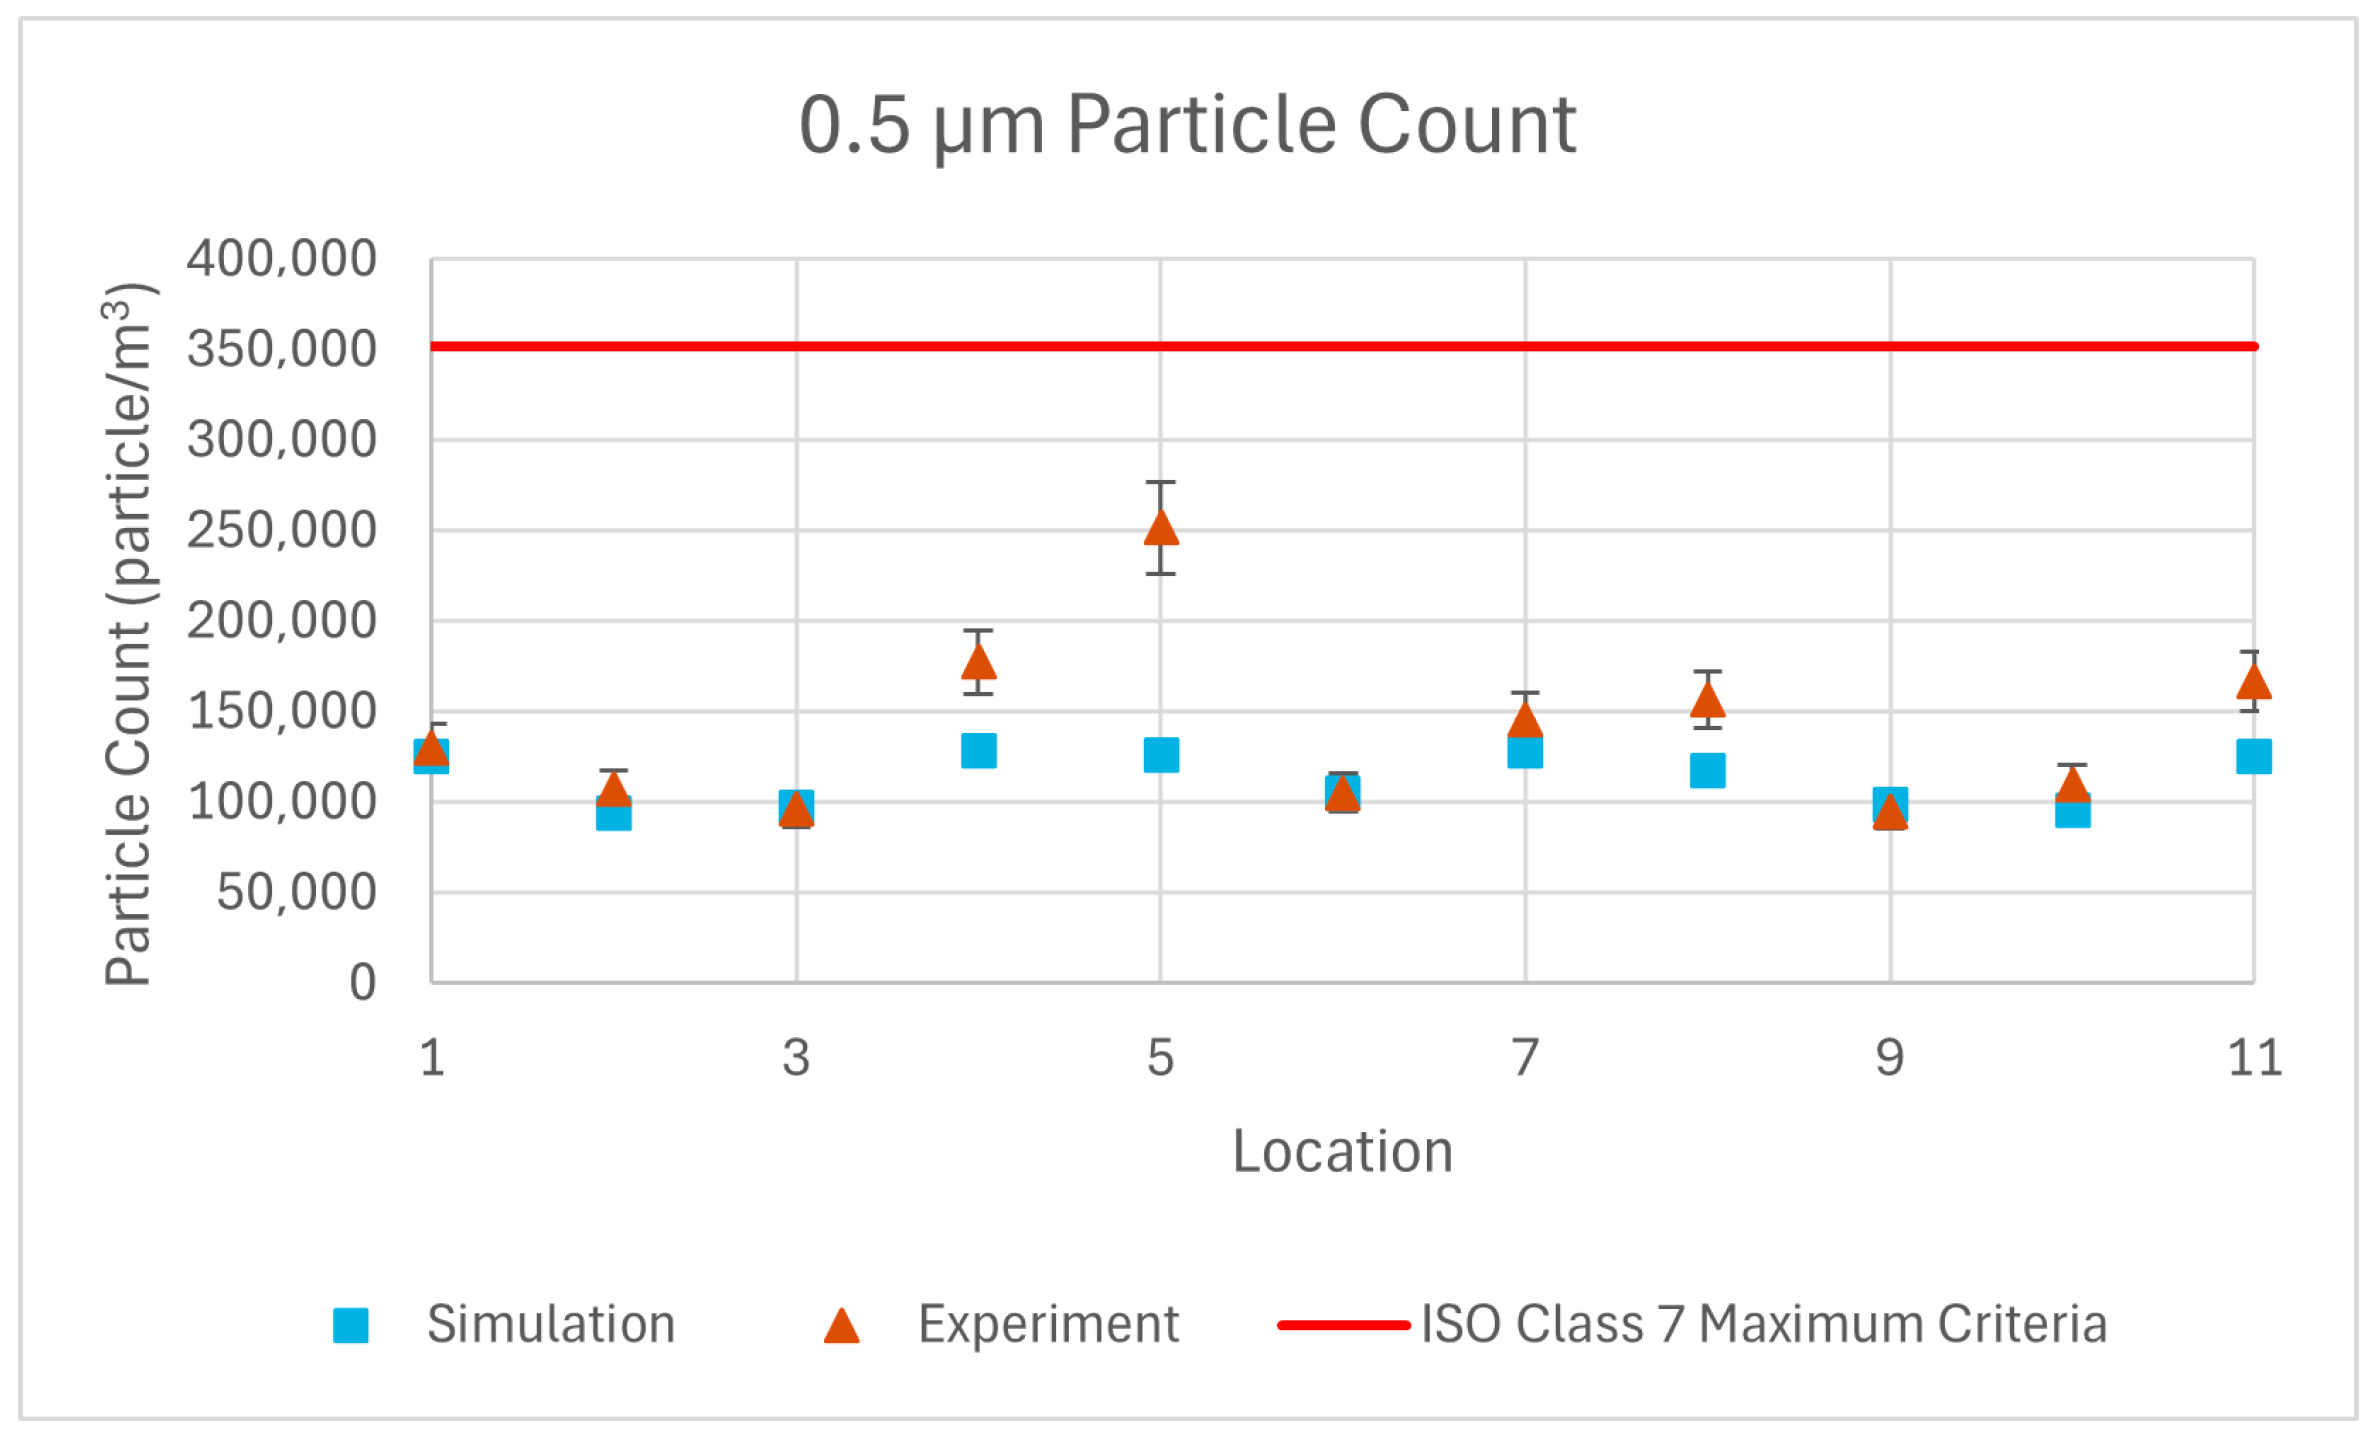
The results of repeated simulations for 0.5 µm, 1 µm, and 5 µm particulate matter have been compared with experimental measurements through graphical representations.
The volumetric particle count graphs obtained from the simulation results show a close similarity to the experimental results. The average error for 0.5 µm, 1 µm, and 5 µm particles are 17.3%, 17.7% and 39.7%, respectively. These error percentages are acceptable when considering the 10% measurement sensitivity of the device, uncertainty in calibration of the device, and assumptions made in the simulation such as isothermal flow, spherical particle shape, no particle–particle interactions and defining a single particle size for each group instead of defining a size distribution.
In the simulation results, particle counts between points 1–6 and 6–11 exhibit a symmetric distribution, which is expected since the model did not include equipment or other elements that could disrupt airflow patterns. In contrast, the experimental results reveal asymmetry at specific locations—particularly at points 5 and 7, as shown in
Figure 11 and
Figure 12—likely due to the non-symmetrical placement of equipment within the actual room. To quantify this, particle concentrations at symmetric points were compared, revealing that the average variation in simulation data was minimal—2.9%, 2.8%, and 2.1%—for 0.5 µm, 1 µm, and 5 µm particles, respectively. However, the experimental data showed substantially higher asymmetry, with variations of 17.2%, 18.0%, and 26.5% for the same particle sizes. This contrast underscores how real-world factors such as equipment layout can introduce localized airflow disruptions and create contamination risk zones. These findings offer practical insights for infection control by identifying areas within the operating room where interventions—such as repositioning equipment or enhancing airflow—may be necessary to reduce particle accumulation and improve overall cleanliness.
Additionally, the measurement duration at each sampling location was set to 1 min. This duration was selected in accordance with standard cleanroom measurement protocols and the operational limits of the Solair 3100E device. Given that the CFD simulations were based on steady-state conditions, time-averaged comparisons were considered valid and sufficient for capturing representative particle distributions. Therefore, extending the measurement duration was not required for the purpose of validating the simulation results.
Both the experimental and simulation results (
Figure 13) demonstrate that the particle counts meet the ISO Class 7 standards, confirming the reliability and accuracy of the airflow and particle distribution predictions within the operating room environment.
4. Conclusions
This study confirms that the simulated operating room meets the air cleanliness and pressure standards required for ISO Class 7. The alignment between experimental measurement data and simulation results demonstrates the applicability of the Computational Fluid Dynamics (CFD) model in analyzing airflow and particulate matter.
In this study, a simulation was performed with a one-time regular placement of particles at the entrance of the laminar flow unit, demonstrating that particle distribution within the room can be accurately obtained. This approach avoided excessively long solution times, which are typically caused by high particle counts in simulations with continuous particle feeding.
Such simulation studies can provide valuable insights for improving the design of the laminar flow unit and other equipment affecting airflow within the operating room. Future simulations may incorporate more detailed geometries of surgical personnel, surgical equipment, and other medical gas installations that influence the gas dynamics during an operation. Additionally, the effect of surgical personnel and equipment on airflow and particulate matter behavior could be considered in future research. Exploration of alternative turbulence models, such as the k-ω SST or LES, may also be conducted to evaluate their effectiveness in capturing more complex flow structures and improving the accuracy of airflow and contamination predictions.
Alternative inlet and outlet vent configurations in operating rooms may minimize particle accumulation in circulation areas and improve overall airflow distribution. This study serves as a useful reference for future research aimed at improving these aspects of operating room design. However, the methodology has certain limitations. A one-way coupling approach was used, where particles are influenced by airflow but do not affect it—an assumption valid only for dilute particle concentrations. Additionally, particle–particle interactions were neglected, based on the assumption of a low particle volume fraction without significant collisions or agglomeration. These simplifications may limit the applicability of the results to scenarios with higher particle loads or more complex interactions.
Furthermore, this study highlights the importance of air quality within specialized rooms, such as operating rooms, in hospital climate control systems and provides valuable data for the literature.
In time-dependent simulation solutions, particularly in transient conditions, the number of particles can be excessively high, and the simulation duration could extend to several days. Therefore, the ability to relate Lagrangian solution results to experimental data in steady-state conditions makes this approach unique. This study is expected to serve as a pioneering reference for master’s and doctoral students in the field of mechanical engineering, particularly in sustainable airflow studies. Despite the strengths of this study, certain limitations must be acknowledged. The one-way coupling assumption limits applicability to dilute particle conditions where feedback effects are negligible. Particle–particle interactions and size distribution effects were also not considered, which may influence results under dense aerosol conditions. Additionally, the steady-state airflow field combined with transient particle tracking may not capture dynamic airflow–particle interactions caused by real-time surgical activities. Future work may focus on integrating transient flow solvers, more realistic boundary conditions, full particle spectra, and human motion models to enhance the accuracy and clinical relevance of CFD-based contamination assessments in surgical environments.
