Abstract
This study presents the synthesis and physicochemical characterization of coordination compounds formed between chrysin, a natural flavonoid, and transition metal ions: Mn(II), Co(II), and Zn(II). The complexes were obtained under mildly basic conditions and analyzed using elemental analysis, thermogravimetric analysis (TGA), silver-assisted laser desorption/ionization mass spectrometry (SALDI-MS), FT-IR spectroscopy, and 1H NMR. The spectroscopic data confirm that chrysin coordinates as a bidentate ligand through the 5-hydroxyl and 4-carbonyl groups, with structural differences depending on the metal ion involved. The mass spectrometry results revealed distinct stoichiometries: 1:2 metal-to-ligand ratios for Mn(II) and Co(II), and 1:1 for Zn(II), with additional hydroxide coordination. Biological assays demonstrated that Co(II) and Mn(II) complexes exhibit enhanced antibacterial and anti-biofilm activity compared to free chrysin, particularly against drug-resistant Staphylococcus epidermidis, whereas the Zn(II) complex showed negligible biological activity.
1. Introduction
The growing resistance of bacteria to conventional antimicrobial agents poses a serious challenge to global public health [1,2]. A key factor contributing to treatment failure is the ability of many pathogens to form biofilms—structured microbial communities embedded in an extracellular matrix composed of polysaccharides, proteins, lipids, and extracellular DNA [3,4,5]. This matrix acts as a physical and chemical barrier, limiting antibiotic penetration and fostering the survival of slow-growing, metabolically inactive subpopulations with increased drug tolerance [6]. Biofilm-associated infections are particularly common in clinical settings and are frequently linked to chronic wounds, medical implants, and hospital-acquired infections [7,8,9]. In the search for natural alternatives to conventional antibiotics, propolis—a resinous substance produced by bees from plant materials—has drawn increasing attention. It is rich in bioactive compounds such as flavonoids, phenolic acids, tannins, and terpenoids, which contribute to its broad-spectrum antimicrobial, antioxidant, and anti-inflammatory properties [10,11,12,13,14,15]. Ethanolic extracts of propolis (PEEs) have demonstrated strong bactericidal activity against Staphylococcus aureus and coagulase-negative staphylococci (e.g., S. epidermidis), including multidrug-resistant strains [16]. They are also effective in inhibiting biofilm formation and disrupting mature biofilms, with their activity closely linked to phenolic and flavonoid content. At a concentration of 1.0 mg/mL, PEEs showed potent antimicrobial effects while being well tolerated by dermal fibroblasts and moderately tolerated by keratinocytes, suggesting their suitability for topical use [17]. One of the major flavonoids found in propolis is chrysin (5,7-dihydroxyflavone), a naturally occurring polyphenol present in honey, propolis, passion fruit peel, doum palm (Hyphaene thebaica), and several medicinal plants, including Scutellaria species [18,19,20]. Interestingly, chrysin has also been identified as a metabolite of the endophytic fungus Chaetomium globosum, isolated from marine algae, providing a non-traditional and non-plant-derived source of this compound [19]. Chrysin, whose structure is presented in Figure 1, has attracted attention for its wide-ranging biological activities, including antiviral, antibacterial, antifungal, antioxidant, anti-inflammatory, anticancer, anxiolytic, and hepatoprotective effects [18,21,22,23,24]. However, its clinical application is limited by poor water solubility, rapid metabolism, and low systemic bioavailability [25]. To overcome these limitations and enhance its antimicrobial activity, 22 chrysin derivatives were synthesized by modifying the 7-OH group [26,27,28]. Several compounds exhibited significantly enhanced antibacterial and anti-biofilm activity against E. coli, achieving over 92% biofilm inhibition compared to 33.57% for unmodified chrysin. These derivatives also impaired bacterial motility, suggesting interference with the early stages of biofilm formation, and demonstrated improved solubility and bioavailability, as confirmed by in silico ADME and SAR analyses [27].
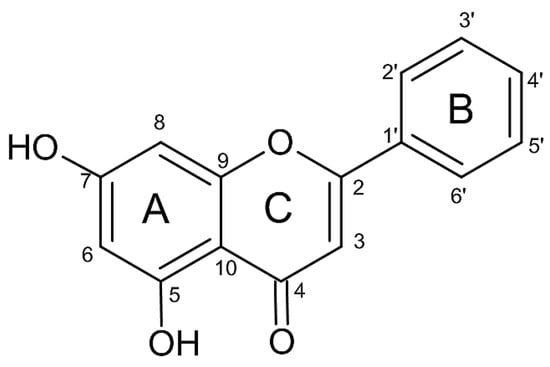
Figure 1.
Structure of chrysin with numbered carbon atoms.
Another promising strategy to improve the biological properties of chrysin is its modification through the formation of coordination complexes with metal ions [20]. Complexes with various metal ions, such as chromium(III), zinc(II), copper(II), lanthanum(III), and ruthenium(II), have already demonstrated antioxidant, cytotoxic, DNA-binding, antithrombotic, and anticancer properties [29,30,31,32,33]. Recent studies on the copper(II)–chrysin complex have confirmed the potential of this approach. This complex has been shown to be biocompatible and to promote bone tissue formation. It stimulated extracellular matrix mineralization and increased the activity of alkaline phosphatase, an enzyme that serves as an early marker of osteoblast differentiation. At the molecular level, the complex enhanced the expression of genes involved in the maturation of bone-forming cells, including those responsible for type I collagen production and key transcription factors related to osteogenesis. Furthermore, it elevated the levels of essential bone matrix proteins such as osteonectin and osteocalcin. Importantly, the copper–chrysin complex also exhibited greater antibacterial activity than free chrysin [34].
Since implants and scaffolds used in bone tissue engineering are particularly vulnerable to bacterial infections and biofilm formation, the development of materials that combine regenerative and antimicrobial properties is of high importance.
Despite these promising findings, the antimicrobial and especially antibiofilm properties of chrysin–metal complexes remain insufficiently explored, and to date, no comprehensive studies addressing this issue have been published. This gap in knowledge highlights the need for further research aimed at evaluating such biological activities.
The aim of this study was to synthesize and characterize new coordination complexes of chrysin with manganese(II), cobalt(II), and zinc(II) ions. The obtained complexes were characterized using spectroscopic techniques (FT-IR, UV-Vis, and elemental analysis) to elucidate their structure and coordination mode, while thermal analysis (TG/DSC) was used to assess their thermal stability. Furthermore, the antibacterial properties of the complexes were evaluated against both Gram-negative (Escherichia coli ATCC 10536) and Gram-positive (Staphylococcus epidermidis ATCC 35984) bacterial strains. Their ability to inhibit biofilm formation was also assessed. These studies aim to explore the potential of chrysin–metal complexes as effective antimicrobial and anti-biofilm agents, which may offer valuable functionalities for future biomedical applications.
2. Materials and Methods
2.1. Reagents
All reagents used in this study were of analytical grade, except for chrysin, which was of 98% purity and obtained from Alfa Aesar (Ward Hill, Haverhill, MA, USA). These chemicals were used without further purification. ZnCl2, MnCl2·4H2O, CoCl2·6H2O, Na2H2EDTA·2H2O, NaOH, chloric(VII) acid, and HPLC-grade methanol were sourced from POCH (Gliwice, Poland). A stock solution of chrysin (10−2 mol·dm−3) was prepared by dissolving the accurately weighed compound in methanol. Likewise, stock solutions of metal chlorides (10−2 mol·dm−3) were obtained by dissolving the appropriate amounts of each salt in distilled water. Chemicals used for microbiological assays—Mueller Hinton Broth (MHB), oxacillin, rifampicin, PBS (phosphate buffered saline), MTT (3-(4,5-dimethyl-2-thiazolyl)-2,5-diphenyl-2H-tetrazolium bromide)—were obtained from Merck (Darmstadt, Germany). DMSO (dimethyl sulfoxide) was provided by POCH (Gliwice, Poland).
2.2. Complex Synthesis
The synthesis procedure was developed based on our previous experience with metal–flavonoid complexation reactions, as well as methodologies reported in the literature [32,35,36,37,38].
Aqueous solutions of Mn(II), Co(II), and Zn(II) chlorides, as well as a methanolic solution of chrysin, were prepared. The reactions were carried out at approximately 60 °C under continuous stirring. Aqueous NaOH solutions (1 M and 0.5 M) were added gradually to adjust the pH to around 8.0 in a controlled manner. Once the target pH was reached, the mixtures were maintained at 60 °C for an additional hour, then left to stand for 24 h to allow complete precipitation. The resulting precipitates were decanted, washed with a 1:1 methanol–water mixture, centrifuged four times, and dried at room temperature. The presence of residual chloride ions was verified using silver nitrate (AgNO3). Anal. Calcd. for Mn(C15H9O4)2(H2O)2, (597.43 g mol−1), %: C, 60.31; H, 3.71; M 9.20; H2O, 6.03 Found: C, 59.90; H, 3.91; M 9.76; H2O, 6.23.
Anal. Calcd. for Co(C15H9O4)2(H2O)2·2H2O, (637.45 g mol−1), %: C, 56.53; H, 4.11; M 9.25; H2O, 11.29. Found: C, 56.78; H, 4.11; M 9.47; H2O, 11.00.
Anal. Calcd. for Zn(OH)(C15H9O4)·H2O, (353.63 g mol−1), % C, 50.95; H, 3.42; M 18.49; H2O, 5.09. Found: C, 51.37; H, 3.32; M 18.60; H2O, 5.06.
2.3. Instrumentation and Methods
Elemental and Metal Content Analysis. The carbon and hydrogen contents of the synthesized complexes were determined using a CHN/CHNS elemental analyzer (EuroEA3000, EuroVector, Pavia, Italy). The manganese content was quantified by complexometric titration using disodium ethylenediaminetetraacetic acid (Na2EDTA) as the titrant and xylene orange as the indicator, following prior sample mineralization with a 1:1 (v/v) mixture of perchloric acid (HClO4) and water. The water content was determined based on thermogravimetric analysis (TGA).
Spectroscopic Measurements. Ultraviolet–visible (UV–Vis) spectra in the 200–600 nm range were recorded for methanolic solutions of the ligand and the synthesized complexes using a UV-VIS-NIR V-670 spectrophotometer (Jasco, Hachioji, Tokyo, Japan). Infrared (IR) spectra were collected in the range of 4000–400 cm−1 using the KBr pellet method on an Alpha FT-IR spectrometer (Bruker, Ettlingen, Germany). Proton nuclear magnetic resonance (1H NMR) spectra of the ligand and the complexes in deuterated DMSO (DMSO-d6) were recorded at room temperature using a 500 MHz Bruker Avance™ NMR spectrometer (Rheinstetten, Germany).
Mass Spectrometry. Mass spectra of the complexes were obtained using the 109AgLGN LDI MS technique with a Bruker Daltonics UltrafleXtreme™ mass spectrometer (Bremen, Germany).
Thermal Analysis. Thermogravimetric and differential scanning calorimetry (TGA/DSC) analyses were performed using a TGA/DSC1 instrument (Mettler Toledo, Columbus, OH, USA) in air over the temperature range of 25–800 °C, with a heating rate of 20 °C/min.
Solution Conductivity. The molar conductivity of the complexes was measured in DMSO solutions (c = 1 × 10⁻³ mol dm−3) at 20 °C using a CX-505 conductometer (Elmetron, Zabrze, Poland).
Solubility determination. The solubility of the obtained complexes was determined in methanol and water at 20 ± 1 °C. A weighed amount of each complex was stirred in 25 mL of the respective solvent for 12 h. The suspension was then filtered to remove the undissolved solid. The filtrate was evaporated under reduced pressure, and the remaining residue was accurately weighed. The solubility values were calculated and are presented in Table 1.

Table 1.
Physical properties of the complexes.
2.4. Bacterial Strains and Minimum Inhibitory Concentration (MIC) Evaluation
Antibacterial properties were evaluated against Gram-negative (Escherichia coli ATCC 10536) and Gram-positive (Staphylococcus epidermidis ATCC 36984) bacterial strains with the use of microdilution method on 96-well plates as previously described by Ciszkowicz et al. 2025 [39]. For experimental use, bacterial strains were cultured in MHB, undergoing at least two passages at 37 °C in a New Brunswick Innova 40 Shaker (Eppendorf AG, Hamburg, Germany) to ensure consistent growth. Working 24 h cultures, standardized to 0.5 McFarland (108 CFU/mL) at λ = 600 nm using a Varioskan™ LUX multimode microplate reader (Thermo Scientific™, Waltham, MA, USA), and diluted in MHB to 105 CFU/mL were used across all experiments. The complexes were pre-dissolved in DMSO and then dilutions were prepared in MHB (0.1, 0.2, 0.4, 0.8, 1.6, 2.1, 2.5, 3.1, 6.3, 12.5 mg/mL). Data were analyzed only when the final DMSO concentration remained below 10%. Rifampicin and oxacillin were pre-dissolved in sterile distilled water and then used as standard drugs (2-fold dilutions in MHB: 3.9—500 µg/mL). Positive (bacterial growth), negative (sterility control) and solvent (DMSO) controls were also included in all three biological and three technical repetitions. The colorful complexes, though initially clear in DMSO, exhibited a slight turbidity upon 2-fold dilution in MHB medium during microplate dilution preparation. Thus, the minimum inhibitory concentration (MIC) was determined by absorbance measurement (λ = 600 nm, Varioskan™ LUX multimode microplate reader, Thermo Scientific, Waltham, MA, USA) both before adding bacteria and again after 24 h of incubation at 37 °C. By subtracting the initial absorbance from the final one, the accurate quantification of bacterial growth based on changes in turbidity was possible.
2.5. Inhibition of Biofilm Formation
The effect of the tested compounds on biofilm formation was assessed against Escherichia coli and Staphylococcus epidermidis by the intravital staining method using MTT solution according to Bocian et al. 2020 [40]. Bacterial strains were cultured in the presence of subminimal inhibitory concentrations (0.1, 0.2, 0.4, 0.8, 1.6, 3.1, 6.3 and 12.5 mg/mL) of compounds. Data were analyzed only when the final DMSO concentration remained below 10%. After 24 h incubation at 37 °C, the medium was removed and the wells were washed with phosphate buffered saline (PBS) to remove any remaining planktonic bacteria. Living adherent cells forming the biofilm were stained with MTT solution (MTT; 0.5% in PBS) for 2 h at 37 °C, protected from light. After incubation, the solution was removed and DMSO was added to dissolve the resulting formazan crystals, followed by stirring for 15 min at room temperature. Absorbance was measured at 600 nm using a spectrophotometer, determining the degree of inhibition of biofilm formation in relation to the amount of biofilm formed without the use of any agents (defined as 100%) and the control for medium sterility (defined as 0%).
3. Results and Discussion
3.1. Composition and Physicochemical Properties
As a result of the conducted syntheses, coordination complexes of transition metals—manganese(II), cobalt(II), and zinc(II)—with chrysin as a ligand were obtained. Chrysin was dissolved in methanol due to its high polarity and excellent solubilizing properties for flavonoid ligands, while metal salts were dissolved in distilled water. Consequently, the reactions were carried out in a water–methanol medium, maintaining a molar concentration ratio of metal ions to ligand of 1:2. This solvent system enabled the efficient formation of stable flavonoid–metal ion coordination complexes under mild reaction conditions. The synthesis was performed at a pH of approximately 8 and under elevated temperature, which facilitated the precipitation of the resulting metal complexes. Based on elemental analysis (C, H), complexometric titration (metal), thermogravimetric analysis (TGA), and mass spectrometry (MS), the empirical formulas of the resulting complexes were established as follows: [Mn(C15H9O4)2(H2O)2], [Co(C15H9O4)2(H2O)2]·2H2O, [Zn(OH)(C15H9O4)]·H2O. These findings indicate differences in stoichiometry and hydration among the complexes, likely reflecting the distinct coordination preferences and geometries of the metal ions. The differences in the stoichiometry of the synthesized complexes can be attributed to the distinct coordination preferences and chemical properties of the metal ions.
The final products were obtained with moderate yields. The Mn(II) and Co(II) complexes were isolated with comparable efficiencies (~57–58%), whereas the Zn(II) complex exhibited a significantly lower yield (31%) under similar conditions. The observed lower yield of the Zn(II) complex may be attributed to its different stoichiometry (1:1), in contrast to the Mn(II) and Co(II) complexes, which form 1:2 metal-to-ligand assemblies with chrysin. The smaller number of ligand molecules coordinated to the Zn(II) ion could result in reduced complex stability, thereby hindering its precipitation from solution. Additionally, Zn(II) ions (d10) do not benefit from ligand field stabilization effects and prefer different coordination geometries compared to Mn(II) (d5) and Co(II) (d7) ions, which may further limit the efficiency of complex formation [41].
The molar conductivities of the complexes in DMSO were determined to be 5.8, 5.2, and 1.9 Ω−1cm2mol−1 for the Co(II), Mn(II), and Zn(II) complexes, respectively. These low values confirm the non-electrolytic nature of the studied compounds. The solubility of the complexes was assessed in both water and methanol. All synthesized complexes exhibited low water solubility, a property that may be beneficial for their stability in biological environments. In methanol, solubility increased for all complexes, possibly due to enhanced polarity or more effective donor–acceptor interactions with the solvent. The summarized physicochemical properties of the complexes are presented in Table 1.
3.2. Thermal Analysis
The results of the thermogravimetric analysis are summarized in Table 2. The TG/DTG–DSC curves of the thermal decomposition of the studied compounds are included in the Supplementary Materials (Figure S1).
Table 2.
Summary of thermogravimetric analysis of complexes of the Mn(II), Co(II), and Zn(II) with chrysin.
Examination of the thermal decomposition behavior of the manganese(II), cobalt(II), and zinc(II) complexes with chrysin in an air atmosphere reveals that the degradation process occurs in multiple distinct stages for each compound. For the Mn(II) and Co(II) complexes, the first and second decomposition stages are associated with an endothermic dehydration process. These occur in the temperature range of 25–150 °C, suggesting that the water molecules involved are of crystallization nature [42]. In the case of the Zn(II) complex, the lattice water is released in a single step within the 25–110 °C range. The mass loss observed in this stage (5.0%) corresponds to one molecule of crystallization water. The second decomposition stage of the Zn(II) complex 220–260 °C indicates the presence of a hydroxyl group coordinated to the central metal ion. Subsequent stages of decomposition for the Mn(II), Co(II), and Zn(II) complexes correspond to the breakdown of the organic ligand moiety. The final decomposition products of the studied complexes are the respective metal oxides: manganese(III) oxide (Mn2O3) [43], cobalt(III) oxide (Co3O4) [44], and zinc(II) oxide (ZnO) [45].
3.3. Mass Spectrometry
In this work, we applied 109AgLGN LDI MS (Surface-Assisted Laser Desorption/Ionization Time-of-Flight Mass Spectrometry using Silver-109 Nanoparticles generated by Fiber Laser Ablation), which utilizes silver-109 nanoparticles to enhance ion production during laser desorption. Although the method is referred to as LDI MS in the name of the technique, the use of silver-109 nanoparticles as an assisting substrate classifies it as a variant of Surface-Assisted Laser Desorption/Ionization (SALDI). Therefore, throughout this work, the term SALDI-TOF MS is used to reflect the specific nature of the ionization process and the mass analyzer employed. This technique demonstrated high efficiency in the analysis of metal complexes of Co(II), Mn(II), and Zn(II) with chrysin, providing strong signal intensity and clear mass spectra that allow for precise identification of coordination species. Compared to conventional organic matrices, SALDI-TOF MS with silver-coated substrates offers substantial analytical benefits, including uniform sample dispersion, improved measurement repeatability, and suppression of matrix-related background signals, particularly in the low m/z region (<1000). These features are especially advantageous for accurate mass determination of small coordination compounds [46,47]. Mass spectrometry (109AgLGN LDI MS) was employed to investigate the complexes of chrysin with Mn(II), Co(II), and Zn(II) ions to confirm their composition, stoichiometry, and coordination modes. The resulting spectra displayed characteristic signals that enabled the identification of both the metal–chrysin complexes and free chrysin, as well as additional species formed during the ionization process. It is important to note that, in the analysis of MS spectra of metal complexes, each observed peak typically represents a cluster of signals spaced 1–2 atomic mass units apart, arising from various combinations of naturally occurring isotopes [48,49]. The observed and calculated m/z values of ions detected in the SALDI-MS spectra of free chrysin and its Mn(II), Co(II), and Zn(II) complexes, along with the corresponding ion assignments, are presented in Table 3. The spectra of the complexes are shown in Figure 2.
Table 3.
Observed and calculated m/z values of ions detected in the SALDI-MS spectra of free chrysin and its Mn(II), Co(II), and Zn(II) complexes, with corresponding ion assignments.
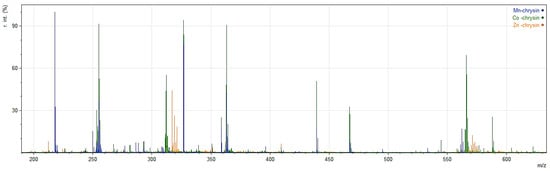
Figure 2.
Overlaid positive ion 109AgLGN LDI MS spectra of Mn(II), Co(II), and Zn(II) complexes with chrysin in the m/z range 200–600.
In all spectra, intense signals corresponding to chrysin and its adducts were observed. The main peak at m/z 255.0651 corresponds to the protonated molecule [C15H9O4 + H]+, while additional peaks at m/z 277.0522 and 293.0156 were assigned to sodium and potassium adducts, respectively: [C15H9O4 + Na]+ and [C15H9O4 + K]+. The presence of these ions confirms the coexistence of free chrysin in each sample, which may originate from fragmentation processes during desorption/ionization. Furthermore, the peak at m/z 362.9609, corresponding to the silver adduct [C15H9O4 + 109Ag]+, highlights the strong tendency of chrysin to form complexes with soft metal cations [36].
In the spectra of Mn(II) and Co(II) complexes, intense peaks were detected at m/z 562.0286 and 566.0284, respectively, assigned to the species [M(C15H8O4)2 + H]+, composed of two deprotonated chrysin ligands (C15H8O−), a divalent metal ion (M2+), and one additional proton. The calculated monoisotopic masses for these ions (562.0461 Da for Mn and 566.0406 Da for Co) are in excellent agreement with the experimental values, confirming that both hydroxyl groups at position 5 of chrysin undergo deprotonation and that the ligand coordinates as a bidentate anion through its phenolate and carbonyl oxygen atoms.
In the positive ion SALDI TOF spectrum of the Zn(II) complex, the most intense peak appears at m/z 316.9665, assigned to the 1:1 ion [Zn(C15H8O4)]+. A much weaker peak at m/z 571.0366 corresponds nominally to [Zn(C15H8O4)2 + H]+, which, based on structural and synthetic data, does not represent the solid-state complex composition. The actual Zn(II) complex contains one deprotonated chrysin ligand and one hydroxide group, i.e., [Zn(C15H8O4)(OH)]. The low-intensity 1:2 peak is attributed to gas-phase association during ionization, where an additional chrysin molecule transiently binds to the monoligand complex. Such behavior is characteristic of Zn(II) compounds, which readily form loose clusters and pseudomolecular ions under MS conditions [50,51]. For example, Zn(II) complexes with imidazo [1,5-a]pyridine ligands generate gas-phase species such as Zn(L)2(NO3)+ and Zn(L)32+ that are absent in solution but appear in the source and fragment readily by the loss of one ligand, confirming their in-source origin [50]. In contrast, the Co(II) and Mn(II) complexes form 1:2 species in the solid state, which is reflected in their spectra by dominant 1:2 ions [M(C15H8O4)2 + H]+, with only minor signals corresponding to the 1:1 ions (m/z 311.9635 for Co and 307.9738 for Mn). These spectral differences primarily arise from the differing stoichiometries of the complexes, rather than from any inherent gas-phase preferences of the metal ions.
Additionally, silver adduct ions such as [M(C15H8O4)2 + 109Ag]+ (Co, Zn) and multimeric adducts [Zn(C15H8O4)2 + 109Ag2]+ and [Zn(C15H8O4)2 + 109Ag4]+ are observed, indicating a strong tendency of these chrysin–metal systems to form mixed metal cluster ions during ionization.
In summary, the MS data confirm that chrysin acts as a bidentate, deprotonated ligand coordinating through the carbonyl oxygen and phenolic 5-OH group in Mn(II) and Co(II) complexes.
3.4. 1H NMR Analysis
The 1H NMR spectra of chrysin and its complexes with Mn(II), Co(II), and Zn(II) ions, recorded in DMSO-d6, provided essential insights into the coordination mode of the ligand and the influence of metal ions on the electronic environment of the flavonoid framework of chrysin. The 1H NMR spectra of chrysin and its complexes are provided in the Supplementary Materials (Figure S2). The chemical shift values for chrysin and the Zn-chrysin complex are summarized in Table 4.
Table 4.
Comparison of 1H NMR chemical shifts for chrysin and its Zn(II) complexes.
In the spectrum of chrysin, characteristic signals of hydroxyl protons were observed at δ 12.82 ppm (5-OH) and δ 10.90 ppm (7-OH). The aromatic proton signals of the A and B rings appeared within the δ 6.22–8.04 ppm range, while the H-3 proton of the C-ring resonated at δ 6.95 ppm [52].
Complexation with Zn(II) resulted in noticeable upfield shifts of the A-ring proton signals, indicating changes in their electronic environment upon coordination. Specifically, the H-6 proton shifted from δ 6.22 ppm to δ 5.90 ppm, H-8 from δ 6.52 ppm to δ 6.08 ppm, and the H-3 proton from δ 6.95 ppm to δ 6.83 ppm. These chemical shift changes can be attributed to increased electron density (shielding effect) around the A-ring protons resulting from coordination of Zn(II) through the 5-OH group (after deprotonation) and the carbonyl oxygen. Chelation alters the π-electron distribution in the flavone core, leading to upfield shifts of nearby proton signals. In the spectrum of the Zn(II) complex, significant weakening and slight broadening of the 5-OH signal were observed. Although the signal did not vanish completely, it appeared with very low intensity in a region similar to that of the free ligand. This behavior suggests the presence of a dynamic equilibrium in solution between deprotonated and partially reprotonated species, which could result from the moderate stability of the Zn(II) complex and potential proton exchange with the solvent. These observations align with previously reported data on Zn(II)-flavonoid complexes [32,41].
Interestingly, the 7-OH proton signal also exhibited a noticeable upfield shift from δ 10.90 ppm (free ligand) to δ 10.10 ppm in the Zn(II) complex. Unlike the 5-OH group, the 7-OH group is spatially distant from the carbonyl oxygen and cannot participate in classical intramolecular hydrogen bonding. However, the observed chemical shift change suggests that the 7-OH group may still interact weakly with the Zn(II) center through lone pair–metal interactions. In such cases, the lone pair of electrons on the oxygen atom of the 7-OH group can transiently coordinate to the vacant orbitals of Zn(II), forming a labile donor–acceptor interaction. Such weak coordination does not involve deprotonation of the 7-OH group but may locally perturb the electron density, leading to shielding of the proton and a shift to higher magnetic field (upfield) [53]. This interaction is likely dynamic in solution and sensitive to the spatial arrangement of the ligand, which is consistent with structural models where the identity of a fourth coordination donor remains ambiguous. As previously discussed in the structural characterization section, the fourth coordination site may involve weak contacts from an additional oxygen atom (such as 7-OH), π-system interactions, or lone pair–metal interactions.
Interpretation of the 1H NMR spectra of chrysin complexes with transition metal ions such as Mn(II) and Co(II) is particularly challenging for several reasons. Firstly, the inherently low solubility of these complexes in standard NMR solvents significantly hinders spectral acquisition, resulting in weak signals and low signal-to-noise ratios, which severely restrict spectral analysis.
Moreover, the presence of transition metal ions with unpaired electrons (Mn(II), Co(II)) introduces significant paramagnetic shifts. The strong magnetic fields generated by the unpaired electrons induce proton signal shifts to extreme ppm values, both downfield and upfield. In the case of the Mn(II) complex, signals were observed outside the conventional spectral range—at approximately −11.79 ppm and −16.18 ppm. The effect is even more pronounced for the Co(II) complex, where signals appeared at 61.83 ppm, 31.76 ppm, and −25.44 ppm. Such a broad chemical shift range is typical of Co(II), which frequently induces stronger paramagnetic effects than Mn(II).
Additionally, these signals are considerably broadened due to the shortening of the T2 relaxation time of protons in proximity to the metal center. Furthermore, coordination-induced asymmetry disrupts the magnetic equivalence of protons that were magnetically equivalent in the free ligand, leading to the appearance of additional signals or significant peak broadening [54].
Similar phenomena have been reported in the literature for flavonoids such as morin and chrysin complexes with lanthanide ions [37,55]. In these cases, aromatic proton signals undergo shifts both upfield and downfield, depending on their distance and orientation relative to the paramagnetic center. Protons closer to the metal exhibit pronounced signal broadening, while more distant protons may give sharper signals, though still shifted relative to the free ligand. In contrast, complexes with diamagnetic ions like La(III) show significantly less pronounced shifts, primarily due to deshielding effects.
An analogy can be drawn to chrysin-Cu(II) complexes described in the literature [56], where the presence of paramagnetic Cu(II) ions caused universal broadening of signals across the entire 1H NMR spectrum. However, these studies revealed substantial differences in signal intensities of protons in the A and C rings, interpreted as evidence of preferential interaction of Cu(II) with the carbonyl group at position 4 and the hydroxyl group at position 5 of chrysin. Although Cu(II) complexes were not experimentally studied in this work, the literature data provide a valuable reference point for understanding the influence of paramagnetic centers on the NMR spectra of flavonoid-metal systems.
In summary, the observed effects in the 1H NMR spectra of Co(II) and Mn(II) chrysin complexes, significant chemical shift dispersion, signal broadening, and spectral smearing, are consistent with the literature-reported characteristics of other flavonoid–metal systems containing paramagnetic ions. Therefore, the interpretation of these spectra necessitates the use of complementary methods such as IR and UV-Vis, which can provide insights into the coordination mode and stoichiometry of the complexes. Detailed 1H NMR spectra of chrysin and the discussed complexes will be presented in the Supplementary Materials (Figure S2).
3.5. FT-IR Spectral Analysis
The FT-IR spectra of the synthesized metal complexes of chrysin with Mn(II), Co(II), and Zn(II) demonstrate significant changes compared to the spectrum of the free ligand, confirming coordination through oxygen donor atoms and the involvement of additional ligands such as water and hydroxide. The summary of characteristic bands and their shifts for the ligand and its complexes is presented in Table 5, which forms the basis of the above spectroscopic analysis. The FTIR spectra of chrysin are presented in the Supplementary Materials (Figures S3–S6).
Table 5.
Characteristic IR bands (cm−1) for chrysin and its metal complexes.
The spectrum of chrysin shows a broad band at 3424 cm−1, characteristic of O–H stretching vibrations, likely involved in intramolecular hydrogen bonding. The strong absorption band at 1653 cm−1 corresponds to the stretching vibration of the carbonyl group (C=O), while the region between 1600 and 1000 cm−1 displays typical aromatic C=C and C–H deformation modes.
Upon complexation with metal ions, significant shifts and the appearance of new absorption bands are observed, indicating successful coordination [37]. All metal complexes exhibit a broad absorption band in the 3450–2800 cm−1 range, which corresponds to O–H and C–H stretching vibrations. This region becomes more intense and broadened upon complexation, due to the presence of hydrogen-bonded water molecules and phenolic hydroxyl groups [57]. A notable distinction is the presence of a sharp band at 3627 cm−1, observed only in the Mn(II) complex, which is attributed to a non-hydrogen-bonded O–H group, likely arising from a weakly bound or uncoordinated water molecule [58]. Such a feature is absent in the Co(II) and Zn(II) analogues, which show only broad O–H stretches.
The ν(C=O) band of chrysin appears at 1653 cm−1 and shifts to 1629 cm−1 (Mn), 1639 cm−1 (Co), and 1637 cm−1 (Zn) in the metal complexes. This red shift reflects coordination through the carbonyl oxygen, as electron donation to the metal reduces the double bond character and thus lowers the stretching frequency [59,60].
The presence of three distinct bands in the 1550–1612 cm−1 region, attributed to the ν(C=C) stretching vibrations of the aromatic system, is observed in both the free ligand and its metal complexes. This indicates that the aromatic framework of chrysin remains largely preserved upon coordination. However, slight shifts in these bands suggest minor changes in the electron density distribution within the benzene rings, likely resulting from metal–ligand interactions.
A particularly strong indication of phenolic group involvement in coordination is the complete disappearance of the δ(O–H) in-plane bending vibration, originally observed at 1025 cm−1 in the spectrum of free chrysin, across all three metal complexes.
The out-of-plane wagging vibration of the phenolic O–H group (γ(O–H)), observed at 807 cm−1 in the free ligand, is slightly shifted to 809 cm−1 and 810 cm−1 in the Mn(II) and Zn(II) complexes, respectively. In contrast, this band is not clearly resolved in the Co(II) complex, which may be due to a shift beyond the detectable range or significant band broadening caused by strong hydrogen bonding or coordination-induced effects.
New bands in the low-frequency region (478–492 cm−1) appear in all metal complexes and are absent in the spectrum of free chrysin. These are assigned to metal–oxygen (ν(M–O)) stretching vibrations, confirming the formation of coordination bonds between the metal ions and the oxygen donor atoms of the ligand [32,61].
The IR spectral analysis confirms that chrysin coordinates to Mn(II), Co(II), and Zn(II) ions primarily through its phenolic (–OH) and carbonyl (C=O) groups. This coordination results in significant changes in the characteristic vibrational modes of these functional groups. The observed shifts in the C=C and C–O regions are consistent with electronic modifications of the ligand upon complexation.
3.6. UV-Vis Spectra
Chrysin exhibits two characteristic absorption bands in its UV-Vis spectrum that correspond to π→π* electronic transitions within the aromatic system. According to published data, Band II, which originates from the A-ring (benzoyl system), is an intense absorption typically observed at 268 nm. Band I, arising from the B-ring (cinnamoyl system), appears as a weaker signal in the 310–330 nm range [62]. The electronic absorption spectra of the Mn(II), Co(II), and Zn(II) complexes with chrysin in methanol are shown in Figure 3.
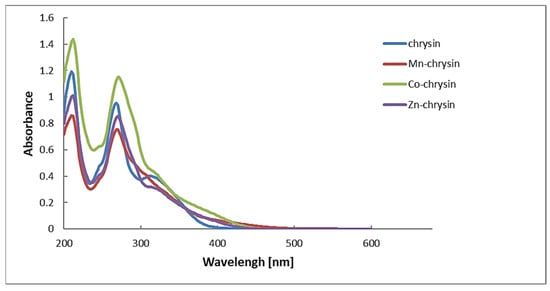
Figure 3.
Electronic absorption spectra of Mn(II), Co(II), and Zn(II) complexes with chrysin in methanol. The solutions of Mn(II) and Zn(II) complexes were saturated, while the concentrations of chrysin and Co(II) complex were 0.01 mg/mL.
The UV-Vis spectra of chrysin metal complexes show no significant shifts in the positions of the main absorption bands related to π→π* transitions in the aromatic system. However, a new absorption band appears in the 370–430 nm range in the spectra of the complexes, which is absent in the free ligand [63].
This newly observed band can be attributed to ligand-to-metal charge transfer (LMCT) or metal-perturbed π→π* transitions, indicating the formation of coordination bonds between the metal ions and the ligand [64]. The lack of major shifts in the original π→π* bands suggests that the core aromatic electronic structure of chrysin remains largely unperturbed by complexation. This is likely because the conjugation within the A and B rings of the flavonoid scaffold is preserved, and the metal coordination occurs primarily at the C-ring chelating sites (4=O and 5-OH), without extensively altering the conjugated π-system [60].
3.7. Structural Characterization of Mn(II), Co(II), and Zn(II) Complexes with Chrysin
Spectroscopic analysis of Mn(II), Co(II), and Zn(II) complexes clearly indicates that chrysin (5,7-dihydroxyflavone) acts as a bidentate ligand, coordinating to metal ions via the carbonyl group at position 4 and the deprotonated hydroxyl group at position 5. Despite the similar coordination mode, significant differences in the stoichiometry and structure of the resulting complexes were observed.
The Mn(II) and Co(II) complexes exhibit a metal-to-ligand molar ratio of 1:2 and contain two coordinated water molecules. Thermogravimetric analysis confirms the presence of coordinated water, as its loss occurs in the temperature range up to approximately 150 °C, consistent with the behavior of coordinated ligands. Structurally, these complexes correspond to classical octahedral geometries, where two chrysin ligands and two water molecules complete the metal coordination sphere. These findings are in agreement with the literature reports on flavonoid complexes such as luteolin (5,7,3′,4′-tetrahydroxyflavone) and quercetin (3,5,7,3′,4′-pentahydroxyflavone), which similarly show Mn(II) and Co(II) preference for forming 1:2 complexes with coordination through the 4-keto–5-hydroxy groups [41,65].
In contrast, the Zn(II) complex displays a distinct structure. Both spectroscopic and elemental analyses indicate a 1:1 metal-to-ligand ratio, with the presence of one hydroxyl group (OH−) and one water molecule. However, TGA reveals that this water molecule is lost below 100 °C, suggesting it is non-coordinated and likely represents crystallization water. Consequently, the Zn–chrysin complex can be formulated as Zn(OH)(chrysin). Chrysin coordinates to the Zn2+ ion through the carbonyl (C=O) and deprotonated 5-OH groups, forming a five-membered chelate ring, while the hydroxide ion serves as a third ligand. The identity of a fourth coordination donor remains ambiguous; however, weak interactions involving an additional oxygen atom (e.g., 7-OH group), the aromatic π-system, or lone pair–metal interactions may be present. Despite formal three-coordinate bonding, the complex geometry may functionally correspond to a tetrahedral arrangement, as similarly reported for Zn(II) complexes with luteolin and quercetin [41].
This behavior can be rationalized within the framework of HSAB (Hard and Soft Acids and Bases) theory. Zn(II) ions are classified as borderline acids, capable of forming bonds with both covalent and electrostatic character. Therefore, the stabilization of the Zn(OH)(chryzin) complex primarily arises from electrostatic interactions combined with spatial accommodation of a tetrahedral geometry. Density Functional Theory (DFT) calculations and Natural Bond Orbital (NBO) charge analyses performed on the analogous Zn(II)–luteolin complex demonstrated that the Zn–ligand interactions are predominantly electrostatic, which is likely relevant for the Zn–chrysin complexes investigated herein [41]. The proposed structures of the complexes are presented in Figure 4.
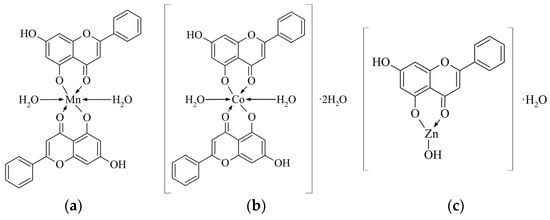
Figure 4.
Proposed structures of the metal complexes with chrysin: (a) Mn-chrysin, (b) Co-chrysin, and (c) Zn-chrysin.
3.8. Antibacterial Activity
The antibacterial efficacy of the tested compounds against both Gram-negative and Gram-positive bacterial strains was quantitatively assessed by determining their minimal inhibitory concentration (MIC) via the serial microdilution method [39,66]. This approach revealed their ability to inhibit the proliferation of certified bacterial isolates, specifically by chrysin and its complexes with transition metal ions. The results indicate moderate antibacterial activity for chrysin complexes (Table 6). Similar properties were observed for the Co-chrysin and Mn-chrysin with MICs between 0.8 and 2.1 mg/mL against tested bacterial strains. Even at concentrations up to 12.5 mg/mL, no antibacterial activity was observed for the Zn-chrysin complex against S. epidermidis strain. Complexation with Co(II) and Mn(II) ions increased the antibacterial activity compared to the parent compound by approximately 3–3.9 fold, respectively, against both bacterial strains. This may be due to several factors resulting from complexation with these metal ions. Chelation with metal ions induces electronic transitions, reducing the polarity of the ligand and increasing the lipophilicity of the complex. This increases the complexes’ ability to cross cell membranes, which can result in enzyme inactivation [67].
Table 6.
Minimum inhibitory concentrations (mg/mL) of studied compounds and antibiotics against reference strains.
Wang et al. noticed that antibacterial activity may be related to electron transfer between titanium and silver nanoparticles [68]. This electron transfer causes increased reactive oxygen species production both within bacterial cells and in the surrounding medium, ultimately leading to bacterial cell death through oxidative damage, changes in membrane potential and release of intracellular contents. In our case, metal ions Mn(II) and Co(II) have redox properties and can generate reactive oxygen species (ROS) via the Fenton-like reaction. ROS can then lead to damage to proteins, lipids, and DNA in bacterial cells [69,70]. The lack of antibacterial activity of the zinc complex in this case may be due to its lack of redox activity in biological systems [71].
Despite the moderate antibacterial properties of chrysin, Co-chrysin, and Mn-chrysin, their inhibitory potency against S. epidermidis is noteworthy, particularly when compared to oxacillin, an antibiotic that demonstrated no ability to inhibit the growth of this strain.
3.9. Determination and Analysis of Optical Band Gap Energies
The estimation of the optical band gap (Eg) is a crucial step in understanding the electronic transitions of metal–organic complexes, as it provides insights into their electron–hole pair generation capacity and their potential for reactive oxygen species (ROS) production [72]. In this study, UV–Visible absorption spectra were recorded for methanolic solutions of free chrysin and its Mn(II), Co(II), and Zn(II) complexes. The band gap energies were determined using the Tauc plot method, which, despite being initially developed for solid-state semiconductors [73], has been widely applied to molecular complexes in solution due to its simplicity and reliability in visualizing absorption edge behavior [72]. The Tauc plots used to estimate the optical band gap energies (Eg) of the tested compounds are provided in the Supplementary Materials (Figure S7).
The calculated optical band gap values are as follows: free chrysin—3.02 eV, Mn-chrysin complex—2.44 eV, Co-chrysin complex—2.58 eV, and Zn-chrysin complex—2.68 eV. The observed reduction in band gap energies upon complex formation indicates a significant electronic interaction between the metal ions and chrysin ligands. This decrease suggests a narrowing of the energy difference between the highest occupied molecular orbital (HOMO) and the lowest unoccupied molecular orbital (LUMO), which can facilitate easier excitation of electrons under visible light irradiation [74].
Such a narrowing of the band gap is often associated with enhanced electron delocalization and charge-transfer transitions within the complex, which is beneficial for the generation of ROS through photocatalytic or photoinduced mechanisms. Among the studied complexes, the Mn-chrysin complex exhibited the lowest band gap value (2.44 eV), indicating its superior potential for electronic excitation and, consequently, higher ROS generation capacity. The trend of increasing band gap energies in the order Mn(II) < Co(II) < Zn(II) correlates with the expected influence of metal ion electronic configurations on ligand–field interactions and molecular orbital overlap.
These findings align with literature reports [75], where coordination of organic ligands with transition metal ions often results in reduced band gap energies, enhancing their photophysical and photocatalytic activities. The observed band gap narrowing in the synthesized metal–chrysin complexes indicates that these compounds possess favorable electronic properties for applications in light-driven processes, including antimicrobial photodynamic therapy and photocatalytic degradation of organic pollutants [76]. Their ability to generate ROS under visible light irradiation suggests a promising potential for biomedical and environmental applications.
Moreover, the enhancement of antibacterial activity observed for Mn- and Co-chrysin complexes correlates directly with their reduced optical band gap energies. The narrowed band gap facilitates electron excitation, enhancing the complexes’ capacity to generate ROS via redox mechanisms. These ROS induce oxidative damage to bacterial cells, explaining the lower MIC values found for these complexes compared to free chrysin. In contrast, the Zn-chrysin complex, with a higher band gap and lacking redox activity, exhibited no antibacterial effect. Therefore, the electronic properties of the metal–chrysin complexes, particularly their influence on ROS generation, are key factors determining their antibacterial efficacy.
A schematic illustration of the proposed antibacterial mechanism of Co- and Mn-chrysin complexes is presented in Figure 5 to visualize the role of ROS generation and its impact on bacterial cell integrity.
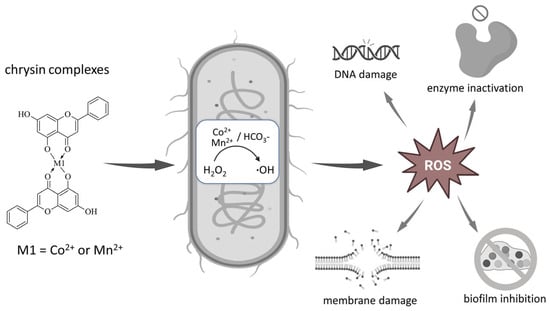
Figure 5.
Schematic illustration of proposed antibacterial mechanism of Co(II) and Mn(II) complexes of chrysin.
3.10. Anti-Biofilm Effects
A quantitative test was conducted to assess the effect of transition metal ion complexes with chrysin on the formation of E. coli and S. epidermidis biofilm. The results showed that exposure to the tested compounds had a different effect on the amount of biofilm formation of both bacterial strains (Figure 6A–D). In each case, a relationship associated with the use of increasing concentrations of the compounds can be seen. Complexation of chrysin with metal ions did not significantly affect the inhibition of biofilm formation. The highest activity was achieved by the complex of chrysin with Co(II) ions; in the case of both strains, there was a significant decrease in biofilm formation at the subminimal inhibitory concentration of the compound (0.8 mg/mL). The result obtained for the highest concentration of this complex was comparable to the value obtained for the starting compound. Complexation of chrysin with Mn(II) and Zn(II) ions, among other metals, generally led to an increase in activity, which in turn reduced biofilm formation. Notably, the Zn-chrysin complex was the least active compound against the E. coli strain. While complexes with transition metal ions are known to exhibit improved antibacterial properties [77], for instance, luteolin–manganese complexes showed a 1.3–1.5 times increase in antibacterial activity against various strains compared to the parent compound [78]—the inhibition of biofilm formation by metal complexes is not extensively documented in the literature.
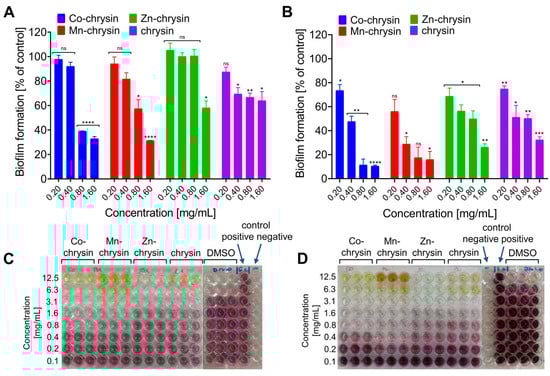
Figure 6.
Anti-biofilm activity of tested compounds against Escherichia coli ((A)—level of biofilm inhibition compared to the positive control (E. coli growth) for selected concentrations; (C)—inhibition of E. coli biofilm formation, view of the 96-well plate with the MTT test performed) and Staphylococcus epidermidis (B)—level of biofilm inhibition compared to the positive control (S. epidermidis growth) for selected concentrations; ((D)—inhibition of S. epidermidis biofilm formation, view of the 96-well plate with the MTT test performed); data are presented as mean ± standard deviation (SD); the statistical significance was evaluated using the one-way ANOVA test followed by Dunnett’s multiple comparisons (* p < 0.05, ** p < 0.001, *** p < 0.0005, **** p < 0.0001, ns—no statistical significance compared to untreated control).
Although chrysin itself possesses some bacterial biofilm-inhibiting properties, and some synthesized derivatives have shown significant improvement in these properties [27], the increase in activity in our study was not as substantial. Nevertheless, the effect of Co(II) and Mn(II) complexes at sub-minimal concentrations is promising. The decreased activity observed with zinc in the context of biofilm inhibition might be attributed to its generally reduced antibacterial properties.
4. Conclusions
This study describes the synthesis and characterization of chrysin complexes with Mn(II), Co(II), and Zn(II) ions, with a focus on their structural, spectroscopic, and biological properties. Based on elemental analysis, complexometric titration, thermogravimetric analysis, and mass spectrometry, the empirical formulas of the obtained complexes were determined as follows: [Mn(C15H9O4)2(H2O)2], [Co(C15H9O4)2(H2O)2]·2H2O, and [Zn(OH)(C15H9O4)]·H2O. FT-IR, UV-Vis, and 1H NMR spectroscopic data clearly indicate that chrysin acts as a bidentate ligand, coordinating metal ions through the carbonyl group at position 4 and the deprotonated hydroxyl group at position 5.
Biological studies showed that Co- and Mn-chrysin complexes have significantly higher antibacterial activity than chrysin, especially against oxacillin-resistant Staphylococcus epidermidis. The Zn-chrysin complex was inactive under tested conditions. This activity correlates with their electronic properties; band gap narrowing in Co(II) and Mn(II) complexes enhances ROS generation, boosting antimicrobial effects. Notably, the Co-chrysin complex also exhibited the strongest anti-biofilm activity at sub-MIC levels, highlighting its potential to inhibit pathogenic biofilm formation.
In summary, chrysin complexes with selected transition metal ions exhibit distinct structural and biological properties depending on the coordinated metal. Their notable antibacterial and anti-biofilm activities make them promising candidates for further development as bioactive compounds.
Supplementary Materials
The following supporting information can be downloaded at: https://www.mdpi.com/article/10.3390/pr13082468/s1, Figure S1: TG/DTG–DSC curves of thermal decomposition of the studied compounds in air atmosphere: (a) Mn-chrysin, (b) Co-chrysin, (c) Zn-chrysin. Figure S2: 1H NMR spectra of chrysin and its metal complexes: (a) chrysin, (b) Mn(II) –chrysin complex, (c) Co(II)–chrysin complex, and (d) Zn(II)–chrysin complex, recorded in DMSO-d6 at 25 °C. Figure S3: FTIR spectrum of chrysin recorded in KBr pellet. Figure S4: FTIR spectrum of Mn-chrysin complex recorded in KBr pellet. Figure S5: FTIR spectrum of Co-chrysin complex recorded in KBr pellet. Figure S6: FTIR spectrum of Zn-chrysin complex recorded in KBr pellet. Figure S7: Tauc’s plots used to estimate the optical band gap energy (Eg) of tested compounds: (a) chrysin, (b) Mn(II) –chrysin, (c) Co(II)–chrysin, and (d) Zn(II)-chrysin. For each compound, the upper panel shows the full Tauc plot and the lower panel shows the linear fitting to determine Eg.
Author Contributions
Conceptualization, E.W. and A.M.; methodology, E.W. and A.M.; software, Ł.B.; validation, L.Z. and M.K.-P.; formal analysis, E.W. and A.M.; investigation, E.W., A.M., L.Z., M.K.-P., K.L.-S. and Ł.B.; data curation E.W.; writing—original draft preparation, E.W. and A.M.; writing—review and editing, E.W. and A.M.; visualization, E.W. and A.M.; supervision, E.W. All authors have read and agreed to the published version of the manuscript.
Funding
This research received no external funding.
Data Availability Statement
The data presented in this study are openly available in Zenodo at https://doi.org/10.5281/zenodo.15774833.
Acknowledgments
We thank the Laboratory of Spectrometry, Faculty of Chemistry, Rzeszow University of Technology for NMR spectra.
Conflicts of Interest
The authors declare no conflicts of interest.
Abbreviations
The following abbreviations are used in this manuscript:
| Mn-chrysin | Complex of Mn(II) ions with chrysin |
| Co-chrysin | Complex of Co(II) ions with chrysin |
| Zn-chrysin | Complex of Zn(II) ions with chrysin |
| DMSO | Dimethylsulfoxide |
| MIC | Minimum Inhibitory Concentration |
| PBS | Phosphate buffered saline |
| SALDI—MS | Surface-Assisted Laser Desorption/Ionization |
| TGA | Thermogravimetric analysis |
| 109AgLGN LDI MS | Surface-Assisted Laser Desorption/Ionization Time-of-Flight Mass Spectrometry using Silver-109 Nanoparticles generated by Fiber Laser Ablation |
References
- Salam, M.A.; Al-Amin, M.Y.; Salam, M.T.; Pawar, J.S.; Akhter, N.; Rabaan, A.A.; Alqumber, M.A.A. Antimicrobial Resistance: A Growing Serious Threat for Global Public Health. Healthcare 2023, 11, 1946. [Google Scholar] [CrossRef]
- Oliveira, M.; Antunes, W.; Mota, S.; Madureira-Carvalho, Á.; Dinis-Oliveira, R.J.; Dias da Silva, D. An Overview of the Recent Advances in Antimicrobial Resistance. Microorganisms 2024, 12, 1920. [Google Scholar] [CrossRef] [PubMed]
- Zhao, A.; Sun, J.; Liu, Y. Understanding Bacterial Biofilms: From Definition to Treatment Strategies. Front. Cell. Infect. Microbiol. 2023, 13, 1137947. [Google Scholar] [CrossRef] [PubMed]
- Olaimat, A.N.; Ababneh, A.M.; Al-Holy, M.; Al-Nabulsi, A.; Osaili, T.; Abughoush, M.; Ayyash, M.; Holley, R.A. A Review of Bacterial Biofilm Components and Formation, Detection Methods, and Their Prevention and Control on Food Contact Surfaces. Microbiol. Res. 2024, 15, 1973–1992. [Google Scholar] [CrossRef]
- Limoli, D.H.; Jones, C.J.; Wozniak, D.J. Bacterial Extracellular Polysaccharides in Biofilm Formation and Function. Microbiol. Spectr. 2015, 3, 1–30. [Google Scholar] [CrossRef] [PubMed]
- Almatroudi, A. Biofilm Resilience: Molecular Mechanisms Driving Antibiotic Resistance in Clinical Contexts. Biology 2025, 14, 165. [Google Scholar] [CrossRef]
- Mirzaei, R.; Mohammadzadeh, R.; Alikhani, M.Y.; Shokri Moghadam, M.; Karampoor, S.; Kazemi, S.; Barfipoursalar, A.; Yousefimashouf, R. The Biofilm-Associated Bacterial Infections Unrelated to Indwelling Devices. IUBMB Life 2020, 72, 1271–1285. [Google Scholar] [CrossRef]
- Zafer, M.M.; Mohamed, G.A.; Ibrahim, S.R.M.; Ghosh, S.; Bornman, C.; Elfaky, M.A. Biofilm-Mediated Infections by Multidrug-Resistant Microbes: A Comprehensive Exploration and Forward Perspectives. Arch. Microbiol. 2024, 206, 101. [Google Scholar] [CrossRef] [PubMed]
- Sharma, S.; Mohler, J.; Mahajan, S.D.; Schwartz, S.A.; Bruggemann, L.; Aalinkeel, R. Correction: Sharma et al. Microbial Biofilm: A Review on Formation, Infection, Antibiotic Resistance, Control Measures, and Innovative Treatment. Microorganisms 2023, 11, 1614. Microorganisms 2024, 12, 1961. [Google Scholar] [CrossRef]
- Bouchelaghem, S. Propolis Characterization and Antimicrobial Activities against Staphylococcus aureus and Candida albicans: A Review. Saudi J. Biol. Sci. 2022, 29, 1936–1946. [Google Scholar] [CrossRef]
- Zulhendri, F.; Chandrasekaran, K.; Kowacz, M.; Ravalia, M.; Kripal, K.; Fearnley, J.; Perera, C.O. Antiviral, Antibacterial, Antifungal, and Antiparasitic Properties of Propolis: A Review. Foods 2021, 10, 1360. [Google Scholar] [CrossRef]
- Otręba, M.; Marek, Ł.; Tyczyńska, N.; Stojko, J.; Kurek-Górecka, A.; Górecki, M.; Olczyk, P.; Rzepecka-Stojko, A. Propolis as Natural Product in the Oral Cavity Bacterial Infections Treatment: A Systematic Review. Appl. Sci. 2022, 12, 10123. [Google Scholar] [CrossRef]
- Kurek-Górecka, A.; Górecki, M.; Rzepecka-Stojko, A.; Balwierz, R.; Stojko, J. Bee Products in Dermatology and Skin Care. Molecules 2020, 25, 556. [Google Scholar] [CrossRef] [PubMed]
- Touzani, S.; Embaslat, W.; Imtara, H.; Kmail, A.; Kadan, S.; Zaid, H.; ElArabi, I.; Badiaa, L.; Saad, B. In Vitro Evaluation of the Potential Use of Propolis as a Multitarget Therapeutic Product: Physicochemical Properties, Chemical Composition, and Immunomodulatory, Antibacterial, and Anticancer Properties. BioMed Res. Int. 2019, 2019, 4836378. [Google Scholar] [CrossRef]
- Cushnie, T.P.T.; Lamb, A.J. Antimicrobial Activity of Flavonoids. Int. J. Antimicrob. Agents 2005, 26, 343–356. [Google Scholar] [CrossRef]
- Uzel, A.; Sorkun, K.; Onçağ, O.; Cogŭlu, D.; Gençay, O.; Salih, B. Chemical Compositions and Antimicrobial Activities of Four Different Anatolian Propolis Samples. Microbiol. Res. 2005, 160, 189–195. [Google Scholar] [CrossRef]
- Queiroga, M.C.; Laranjo, M.; Andrade, N.; Marques, M.; Costa, A.R.; Antunes, C.M. Antimicrobial, Antibiofilm and Toxicological Assessment of Propolis. Antibiotics 2023, 12, 347. [Google Scholar] [CrossRef] [PubMed]
- Mani, R.; Natesan, V. Chrysin: Sources, Beneficial Pharmacological Activities, and Molecular Mechanism of Action. Phytochemistry 2018, 145, 187–196. [Google Scholar] [CrossRef] [PubMed]
- Kamat, S.; Kumari, M.; Sajna, K.V.; Singh, S.K.; Kaushalendra; Kumar, A.; Jayabaskaran, C. Improved Chrysin Production by a Combination of Fermentation Factors and Elicitation from Chaetomium Globosum. Microorganisms 2023, 11, 999. [Google Scholar] [CrossRef]
- Stompor-Gorący, M.; Bajek-Bil, A.; Machaczka, M. Chrysin: Perspectives on Contemporary Status and Future Possibilities as Pro-Health Agent. Nutrients 2021, 13, 2038. [Google Scholar] [CrossRef] [PubMed]
- Sopjani, M.; Falco, F.; Impellitteri, F.; Guarrasi, V.; Nguyen Thi, X.; Dërmaku-Sopjani, M.; Faggio, C. Flavonoids Derived from Medicinal Plants as a COVID-19 Treatment. Phytother. Res. 2024, 38, 1589–1609. [Google Scholar] [CrossRef]
- Naz, S.; Imran, M.; Rauf, A.; Orhan, I.E.; Shariati, M.A.; Iahtisham-Ul-Haq; IqraYasmin; Shahbaz, M.; Qaisrani, T.B.; Shah, Z.A.; et al. Chrysin: Pharmacological and Therapeutic Properties. Life Sci. 2019, 235, 116797. [Google Scholar] [CrossRef]
- Garg, A.; Chaturvedi, S. A Comprehensive Review on Chrysin: Emphasis on Molecular Targets, Pharmacological Actions and Bio-Pharmaceutical Aspects. Curr. Drug Targets 2022, 23, 420–436. [Google Scholar] [CrossRef] [PubMed]
- Emerging Cellular and Molecular Mechanisms Underlying Anticancer Indications of Chrysin|Cancer Cell International. Available online: https://cancerci.biomedcentral.com/articles/10.1186/s12935-021-01906-y (accessed on 13 June 2025).
- Gao, S.; Siddiqui, N.; Etim, I.; Du, T.; Zhang, Y.; Liang, D. Developing Nutritional Component Chrysin as a Therapeutic Agent: Bioavailability and Pharmacokinetics Consideration, and ADME Mechanisms. Biomed. Pharmacother. 2021, 142, 112080. [Google Scholar] [CrossRef] [PubMed]
- Suresh Babu, K.; Hari Babu, T.; Srinivas, P.V.; Hara Kishore, K.; Murthy, U.S.N.; Rao, J.M. Synthesis and Biological Evaluation of Novel C (7) Modified Chrysin Analogues as Antibacterial Agents. Bioorg. Med. Chem. Lett. 2006, 16, 221–224. [Google Scholar] [CrossRef]
- Bhowmik, S.; Anand, P.; Das, R.; Sen, T.; Akhter, Y.; Das, M.C.; De, U.C. Synthesis of New Chrysin Derivatives with Substantial Antibiofilm Activity. Mol. Divers. 2022, 26, 137–156. [Google Scholar] [CrossRef] [PubMed]
- Li, Y.; Li, Y.-P.; He, J.; Liu, D.; Zhang, Q.-Z.; Li, K.; Zheng, X.; Tang, G.-T.; Guo, Y.; Liu, Y. The Relationship between Pharmacological Properties and Structure- Activity of Chrysin Derivatives. Mini Rev. Med. Chem. 2019, 19, 555–568. [Google Scholar] [CrossRef]
- Matsia, S.; Tsave, O.; Hatzidimitriou, A.; Salifoglou, A. Chromium Flavonoid Complexation in an Antioxidant Capacity Role. Int. J. Mol. Sci. 2022, 23, 7171. [Google Scholar] [CrossRef]
- Ravishankar, D.; Salamah, M.; Attina, A.; Pothi, R.; Vallance, T.M.; Javed, M.; Williams, H.F.; Alzahrani, E.M.S.; Kabova, E.; Vaiyapuri, R.; et al. Ruthenium-Conjugated Chrysin Analogues Modulate Platelet Activity, Thrombus Formation and Haemostasis with Enhanced Efficacy. Sci. Rep. 2017, 7, 5738. [Google Scholar] [CrossRef]
- Zeng, Y.-B.; Yang, N.; Liu, W.-S.; Tang, N. Synthesis, Characterization and DNA-Binding Properties of La(III) Complex of Chrysin. J. Inorg. Biochem. 2003, 97, 258–264. [Google Scholar] [CrossRef]
- Halevas, E.; Mavroidi, B.; Pelecanou, M.; Hatzidimitriou, A.G. Structurally Characterized Zinc Complexes of Flavonoids Chrysin and Quercetin with Antioxidant Potential. Inorg. Chim. Acta 2021, 523, 120407. [Google Scholar] [CrossRef]
- Selvaraj, S.; Krishnaswamy, S.; Devashya, V.; Sethuraman, S.; Krishnan, U.M. Investigations on Membrane Perturbation by Chrysin and Its Copper Complex Using Self-Assembled Lipid Bilayers. Langmuir 2011, 27, 13374–13382. [Google Scholar] [CrossRef]
- Zhang, S.; Sadhasivam, D.R.; Soundarajan, S.; Shanmugavel, P.; Raji, A.; Xu, M. In Vitro and in Vivo Investigation of Chrysin Chelated Copper Complex as Biocompatible Materials for Bone Tissue Engineering Applications. 3 Biotech 2023, 13, 45. [Google Scholar] [CrossRef]
- Dyba, B.; Miłoś, A.; Woźnicka, E.; Rudolphi-Szydło, E.; Ciszkowicz, E. The Effects of 3-Hydroxyflavone Complexes with Transition Metal Ions on the Physicochemical and Microbial Properties of Bacterial Cell Membranes. Sci. Rep. 2025, 15, 20743. [Google Scholar] [CrossRef]
- Woźnicka, E.; Zapała, L.; Miłoś, A.; Ciszkowicz, E.; Lecka-Szlachta, K.; Woźnicki, P.; Przygórzewska, A.; Kosińska-Pezda, M.; Byczyński, Ł. Synthesis, Spectroscopic Characterization and Biological Activities of Complexes of Light Lanthanide Ions with 3-Hydroxyflavone. Spectrochim. Acta A Mol. Biomol. Spectrosc. 2024, 322, 124870. [Google Scholar] [CrossRef]
- Pusz, J.; Woźnicka, E.; Wołowiec, S.; Umbreit, M.H. New Solid Compounds of Tb(III), Ho(III), Er(III) and Yb(III) with Chrysin. J. Therm. Anal. Calorim. 2009, 97, 987–992. [Google Scholar] [CrossRef]
- Halevas, E.; Mitrakas, A.; Mavroidi, B.; Athanasiou, D.; Gkika, P.; Antoniou, K.; Samaras, G.; Lialiaris, E.; Hatzidimitriou, A.; Pantazaki, A.; et al. Structurally Characterized Copper-Chrysin Complexes Display Genotoxic and Cytotoxic Activity in Human Cells. Inorg. Chim. Acta 2021, 515, 120062. [Google Scholar] [CrossRef]
- Ciszkowicz, E.; Miłoś, A.; Łyskowski, A.; Buczkowicz, J.; Nieczaj, A.; Lecka-Szlachta, K.; Hus, K.K.; Sikora, K.; Neubauer, D.; Bauer, M.; et al. AMPEC4: Naja Ashei Venom-Derived Peptide as a Stimulator of Fibroblast Migration with Antibacterial Activity. Molecules 2025, 30, 2167. [Google Scholar] [CrossRef]
- Bocian, A.; Ciszkowicz, E.; Hus, K.K.; Buczkowicz, J.; Lecka-Szlachta, K.; Pietrowska, M.; Petrilla, V.; Petrillova, M.; Legáth, Ľ.; Legáth, J. Antimicrobial Activity of Protein Fraction from Naja Ashei Venom against Staphylococcus Epidermidis. Molecules 2020, 25, 293. [Google Scholar] [CrossRef]
- Anna Corrente, G.; Malacaria, L.; Beneduci, A.; Marino, T.; Furia, E. Quercetin and Luteolin Complexation with First-Row Transition Metals in Purely Aqueous Solutions: Stoichiometry and Binding Site Selectivity. Dalton Trans. 2025, 54, 7828–7837. [Google Scholar] [CrossRef]
- Ferenc, W.; Osypiuk, D.; Sarzyński, J.; Głuchowska, H. Complexes of Mn(II), Co(II), Ni(II), Cu(II) and Zn(II) with Ligand Formed by Condensation Reaction of Isatin with Glutamic Acid. Eclética Química 2020, 45, 12–27. [Google Scholar] [CrossRef]
- Drzewiecka-Antonik, A.; Ferenc, W.; Mirosław, B.; Osypiuk, D.; Sarzyński, J. Structure, Thermal Stability and Magnetic Behavior of Mn(II) Complexes with Phenoxyacetic Acid Herbicides. Polyhedron 2021, 207, 115370. [Google Scholar] [CrossRef]
- Lehleh, A.; Beghidja, A.; Beghidja, C.; Mentré, O.; Welter, R. Synthesis, crystal structure and thermal decomposition of Cu(II), Co(II), Mn(II) complexes with hetero-ligands containing cysteic acid, 4,4’-dimethyl-2,2’-bipyridine and azide. Comptes Rendus Chim. 2011, 14, 462–470. [Google Scholar] [CrossRef]
- Findoráková, L.; Győryová, K.; Hudecová, D.; Mudroňová, D.; Kovářová, J.; Homzová, K.; Nour El-Dien, F.A. Thermal Decomposition Study and Biological Characterization of Zinc(II) 2-Chlorobenzoate Complexes with Bioactive Ligands. J. Therm. Anal. Calorim. 2013, 111, 1771–1781. [Google Scholar] [CrossRef]
- Krupa, Z.; Nizioł, J. Fiber Laser-Generated Silver-109 Nanoparticles for Laser Desorption/Ionization Mass Spectrometry of Illicit Drugs. J. Am. Soc. Mass. Spectrom. 2024, 35, 1156–1167. [Google Scholar] [CrossRef]
- Nizioł, J.; Ruman, T. Surface-Transfer Mass Spectrometry Imaging on a Monoisotopic Silver Nanoparticle Enhanced Target. Anal. Chem. 2013, 85, 12070–12076. [Google Scholar] [CrossRef]
- Jirásko, R.; Holčapek, M. Structural Analysis of Organometallic Compounds with Soft Ionization Mass Spectrometry. Mass Spectrom. Rev. 2011, 30, 1013–1036. [Google Scholar] [CrossRef]
- Gorczko, A.J.; Szymura, J.A. The Prediction of Relative Abundance of Isotopic Clusters in Mass Spectrometry of Coordination and Organometallic Compounds. Comput. Chem. 1999, 23, 135–142. [Google Scholar] [CrossRef]
- Cerrato, V.; Volpi, G.; Priola, E.; Giordana, A.; Garino, C.; Rabezzana, R.; Diana, E. Mono-, Bis-, and Tris-Chelate Zn(II) Complexes with Imidazo[1,5-a]Pyridine: Luminescence and Structural Dependence. Molecules 2023, 28, 3703. [Google Scholar] [CrossRef] [PubMed]
- Irto, A.; Cardiano, P.; Cataldo, S.; Chand, K.; Maria Cigala, R.; Crea, F.; De Stefano, C.; Gattuso, G.; Muratore, N.; Pettignano, A.; et al. Speciation Studies of Bifunctional 3-Hydroxy-4-Pyridinone Ligands in the Presence of Zn2+ at Different Ionic Strengths and Temperatures. Molecules 2019, 24, 4084. [Google Scholar] [CrossRef]
- Pusz, J.; Wolowiec, S. Solid Compounds of Ce(III), Pr(III), Nd(III), and Sm(III) Ions with Chrysin. J. Therm. Anal. Calorim. 2012, 110, 813–821. [Google Scholar] [CrossRef]
- Ansari, A.A. Paramagnetic NMR Shift, Spectroscopic and Molecular Modeling Studies of Lanthanide(III)-Morin Complexes. J. Coord. Chem. 2008, 61, 3869–3878. [Google Scholar] [CrossRef]
- Koehler, J.; Meiler, J. Expanding the Utility of NMR Restraints with Paramagnetic Compounds: Background and Practical Aspects. Prog. Nucl. Magn. Reson. Spectrosc. 2011, 59, 360. [Google Scholar] [CrossRef]
- Ansari, A.A. DFT and 1H NMR Molecular Spectroscopic Studies on Biologically Anti-Oxidant Active Paramagnetic Lanthanide(III)-Chrysin Complexes. Main Group Chem. 2008, 7, 43–56. [Google Scholar] [CrossRef]
- Lee, V.J.; Heffern, M.C. Structure-Activity Assessment of Flavonoids as Modulators of Copper Transport. Front. Chem. 2022, 10, 972198. [Google Scholar] [CrossRef] [PubMed]
- Díaz-Cárdenas, M.Y.; Uruchurtu Chavarín, J.; Valladares Cisneros, M.G.; Lagunas-Rivera, S.; Menchaca Campos, E.C. Evidence of Metal–Organic Coordination between Fe and Flavonoid Chrysin in a Green Anticorrosion Film. Heat Treat. Surf. Eng. 2022, 4, 35–42. [Google Scholar] [CrossRef]
- Carnegie, P.D.; Bandyopadhyay, B.; Duncan, M.A. Infrared Spectroscopy of Mn+ (H2O) and Mn2+ (H2O) via Argon Complex Predissociation. J. Phys. Chem. A 2011, 115, 7602–7609. [Google Scholar] [CrossRef]
- Matsia, S.; Papadopoulos, A.; Hatzidimitriou, A.; Schumacher, L.; Koldemir, A.; Pöttgen, R.; Panagiotopoulou, A.; Chasapis, C.T.; Salifoglou, A. Hybrid Lanthanide Metal-Organic Compounds with Flavonoids: Magneto-Optical Properties and Biological Activity Profiles. Int. J. Mol. Sci. 2025, 26, 1198. [Google Scholar] [CrossRef]
- Alem, M.B.; Desalegn, T.; Damena, T.; Bayle, E.A.; Koobotse, M.O.; Ngwira, K.J.; Ombito, J.O.; Zachariah, M.; Demissie, T.B. Organic-Inorganic Hybrid Salt and Mixed Ligand Cr(III) Complexes Containing the Natural Flavonoid Chrysin: Synthesis, Characterization, Computational, and Biological Studies. Front. Chem. 2023, 11, 1173604. [Google Scholar] [CrossRef]
- Khater, M.; Ravishankar, D.; Greco, F.; Osborn, H.M. Metal Complexes of Flavonoids: Their Synthesis, Characterization and Enhanced Antioxidant and Anticancer Activities. Future Med. Chem. 2019, 11, 2845–2867. [Google Scholar] [CrossRef] [PubMed]
- Castro, G.T.; Ferretti, F.H.; Blanco, S.E. Determination of the Overlapping pK(a) Values of Chrysin Using UV-Vis Spectroscopy and Ab Initio Methods. Spectrochim. Acta A Mol. Biomol. Spectrosc. 2005, 62, 657–665. [Google Scholar] [CrossRef]
- Pusz, J.; Nitka, B.; Zielińska, A.; Wawer, I. Synthesis and Physicochemical Properties of the Al(III), Ga(III) and In(III) Complexes with Chrysin. Microchem. J. 2000, 65, 245–253. [Google Scholar] [CrossRef]
- Pusz, J.; Nitka, B. Synthesis and Physicochemical Properties of the Complexes of Co(II), Ni(II), and Cu(II) with Chrysin. Microchem. J. 1997, 56, 373–381. [Google Scholar] [CrossRef]
- Elkaeed, E.B.; Mughal, E.U.; Kausar, S.; Al-ghulikah, H.A.; Naeem, N.; Altaf, A.A.; Sadiq, A. Theoretical Vibrational Spectroscopy (FT-IR), PED and DFT Calculations of Chromones and Thiochromones. J. Mol. Struct. 2022, 1270, 133972. [Google Scholar] [CrossRef]
- Zapała, L.; Ciszkowicz, E.; Kosińska-Pezda, M.; Maciołek, U.; Kozioł, A.E.; Miłoś, A.; Woźnicka, E.; Bocian, A.; Zapała, W.; Rydel-Ciszek, K.; et al. Novel Silver(I) Complexes with Fenamates: Insights into Synthesis, Spectral Characterization, and Bioactivity. J. Inorg. Biochem. 2025, 266, 112846. [Google Scholar] [CrossRef]
- Pitchumani Violet Mary, C.; Shankar, R.; Vijayakumar, S. Theoretical Insights into the Metal Chelating and Antimicrobial Properties of the Chalcone Based Schiff Bases. Mol. Simul. 2019, 45, 636–645. [Google Scholar] [CrossRef]
- Wang, G.; Jin, W.; Qasim, A.M.; Gao, A.; Peng, X.; Li, W.; Feng, H.; Chu, P.K. Antibacterial Effects of Titanium Embedded with Silver Nanoparticles Based on Electron-Transfer-Induced Reactive Oxygen Species. Biomaterials 2017, 124, 25–34. [Google Scholar] [CrossRef] [PubMed]
- Qian, X.; Zhang, J.; Gu, Z.; Chen, Y. Nanocatalysts-Augmented Fenton Chemical Reaction for Nanocatalytic Tumor Therapy. Biomaterials 2019, 211, 1–13. [Google Scholar] [CrossRef] [PubMed]
- Xu, A.; Li, X.; Ye, S.; Yin, G.; Zeng, Q. Catalyzed Oxidative Degradation of Methylene Blue by in Situ Generated Cobalt (II)-Bicarbonate Complexes with Hydrogen Peroxide. Appl. Catal. B Environ. 2011, 102, 37–43. [Google Scholar] [CrossRef]
- Oteiza, P.I. Zinc and the Modulation of Redox Homeostasis. Free Radic. Biol. Med. 2012, 53, 1748–1759. [Google Scholar] [CrossRef]
- Costa, J.C.S.; Taveira, R.J.S.; Lima, C.F.R.A.C.; Mendes, A.; Santos, L.M.N.B.F. Optical Band Gaps of Organic Semiconductor Materials. Opt. Mater. 2016, 58, 51–60. [Google Scholar] [CrossRef]
- Makuła, P.; Pacia, M.; Macyk, W. How To Correctly Determine the Band Gap Energy of Modified Semiconductor Photocatalysts Based on UV–Vis Spectra. J. Phys. Chem. Lett. 2018, 9, 6814–6817. [Google Scholar] [CrossRef] [PubMed]
- Huo, J.; Yu, D.; Li, H.; Luo, B.; Arulsamy, N. Mechanistic Investigation of Photocatalytic Degradation of Organic Dyes by a Novel Zinc Coordination Polymer. RSC Adv. 2019, 9, 39323–39331. [Google Scholar] [CrossRef]
- Chiyindiko, E.; Langner, E.H.G.; Conradie, J. Spectroscopic Behaviour of Copper(II) Complexes Containing 2-Hydroxyphenones. Molecules 2022, 27, 6033. [Google Scholar] [CrossRef]
- Ren, Y.; Liu, H.; Liu, X.; Zheng, Y.; Li, Z.; Li, C.; Yeung, K.W.K.; Zhu, S.; Liang, Y.; Cui, Z.; et al. Photoresponsive Materials for Antibacterial Applications. Cell Rep. Phys. Sci. 2020, 1, 100245. [Google Scholar] [CrossRef]
- Nandanwar, S.K.; Kim, H.J. Anticancer and Antibacterial Activity of Transition Metal Complexes. ChemistrySelect 2019, 4, 1706–1721. [Google Scholar] [CrossRef]
- Dong, H.; Yang, X.; He, J.; Cai, S.; Xiao, K.; Zhu, L. Enhanced Antioxidant Activity, Antibacterial Activity and Hypoglycemic Effect of Luteolin by Complexation with Manganese(II) and Its Inhibition Kinetics on Xanthine Oxidase. RSC Adv. 2017, 7, 53385–53395. [Google Scholar] [CrossRef]
Disclaimer/Publisher’s Note: The statements, opinions and data contained in all publications are solely those of the individual author(s) and contributor(s) and not of MDPI and/or the editor(s). MDPI and/or the editor(s) disclaim responsibility for any injury to people or property resulting from any ideas, methods, instructions or products referred to in the content. |
© 2025 by the authors. Licensee MDPI, Basel, Switzerland. This article is an open access article distributed under the terms and conditions of the Creative Commons Attribution (CC BY) license (https://creativecommons.org/licenses/by/4.0/).