1. Introduction
With the intensification of global warming, the reduction of greenhouse gas CO
2 emissions has become a major international concern. According to reports from the International Energy Agency, the primary source of increased CO
2 emissions is fossil fuel combustion [
1]. The steel industry is recognized as one of the largest CO
2 emitters within China’s industrial sector [
2,
3]. Reheating furnaces, which are widely used for heating slabs prior to rolling, are identified as key energy-consuming units in the steel production process [
4,
5,
6]. Moreover, these furnaces constitute a significant source of CO
2 emissions in steelmaking operations. Therefore, reducing energy consumption and improving the thermal efficiency of reheating furnaces are considered critical steps toward achieving China’s “Dual Carbon” goals.
In traditional reheating furnaces, combustion is typically carried out using air, in which nitrogen accounts for approximately 79%. This nitrogen does not participate in the combustion process but is instead discharged as flue gas, leading to significant heat loss and, consequently, low combustion efficiency [
7,
8]. Moreover, it contributes to the formation of pollutants such as NOx [
9]. Oxygen-enriched combustion (OEC) is a greenhouse gas reduction technology. It uses oxygen-enriched air (O
2% > 21%) or pure oxygen as an oxidant, which greatly reduces flue gas volume and exhaust heat loss. Consequently, the fuel consumption is reduced, leading to high efficiency and low emissions [
10]. A number of studies have been conducted on the application of OEC in reheating furnaces [
11,
12,
13,
14,
15,
16,
17,
18]. For example, Han et al. [
15] numerically compared thermal efficiency and fuel consumption in the air and pure oxygen condition for a reheating furnace. Wu et al. [
17] experimentally studied heating rate, temperature distribution, and fuel consumption in a burner at O
2% = 21~30%. These studies show that OEC greatly improves furnace combustion efficiency and energy saving rate.
However, existing studies also show that NO
x emissions increase significantly with the elevated oxygen concentration [
19]. To reduce NO
x generation, combining Moderate or Intense Low-Oxygen Dilution (MILD) combustion with OEC is proposed by researchers. MILD combustion is known for high thermal efficiency and low NO
x emission [
20]. There is no flame front and uniform temperature field for MILD combustion, which is due to high-temperature exhaust gas recirculation [
21]. Many scholars have studied MILD combustion in reheating furnaces. Ehab et al. [
22] and Tu et al. [
23,
24] performed 3D numerical simulations on an experimental furnaces. The NO
x generation was explored under different fuels in MILD combustion. Results confirmed the NOx emission is low in MILD combustion. Tu et al. [
25] and Pormehr et al. [
26] studied the effects of furnace shape and baffle on the MILD combustion characteristics in experimental furnaces. Results show that enhancing internal gas recirculation by changing geometry positively affects the MILD combustion process. Environmental factors affecting MILD combustion were also studied. Tu et al. [
27] used a 0.3 MW industrial furnace to study the performance of MILD and traditional burners. They found that MILD combustion reduced NO emissions by over 80% and improved the furnace temperature uniformity. Tu et al. [
28] also studied the effects of elevated pressure (1–8 atm) on the combustion process. Results show that increased operating pressure disrupts sustained MILD combustion.
Recently, combining OEC and MILD combustion has been attempted in industrial application. Currently, the research about MILD oxy-fuel combustion (MOFC) mostly focuses on the burner [
29,
30,
31,
32,
33] and the furnace-scale research is scarce. Yu et al. [
30] conducted a study on the impact of introducing H
2 and CO into syngas on the characteristics of MOFC. The critical oxygen concentration required to sustain MILD combustion was obtained for various H
2/CO/CH
4 blending ratios. Fordoei et al. [
31] studied heat transfer, ignition delay, flame color, flame structure, and CO/NO
x emissions of natural gas MILD flames in air, oxygen-enriched, and pure oxygen conditions. Mario et al. [
33] investigated the effect of oxygen concentration on the performance of a regenerative MILD combustion furnace. At O
2% = 30%, NO
x emissions are below 5 ppm, the thermal efficiency of the furnace increases by 5%, and the energy recovery rate of self-regenerative burners exceedes 80%. In addition to these studies, there are few studies about the MOFC in the reheating furnaces.
To address the gap in the application of MOFC in reheating furnaces, a CFD numerical model was developed in this study, incorporating slab movement and multi-zone heat transfer, to study the flow and heat transfer behavior under both OEC and MOFC modes. The effects of oxygen concentration (31–91%) and fuel types on flow and heat transfer characteristics were investigated. The temperature distribution, flue gas emissions, and slab heating performance in the furnace were analyzed. Furthermore, thermal efficiency and energy-saving rates were calculated for each condition. The applicable oxygen concentration ranges for both OEC and MOFC modes in reheating furnaces are clarified, providing valuable insights for practical retrofitting aimed at energy conservation and emission reduction in industrial reheating processes.
2. Methods
2.1. Physical Model
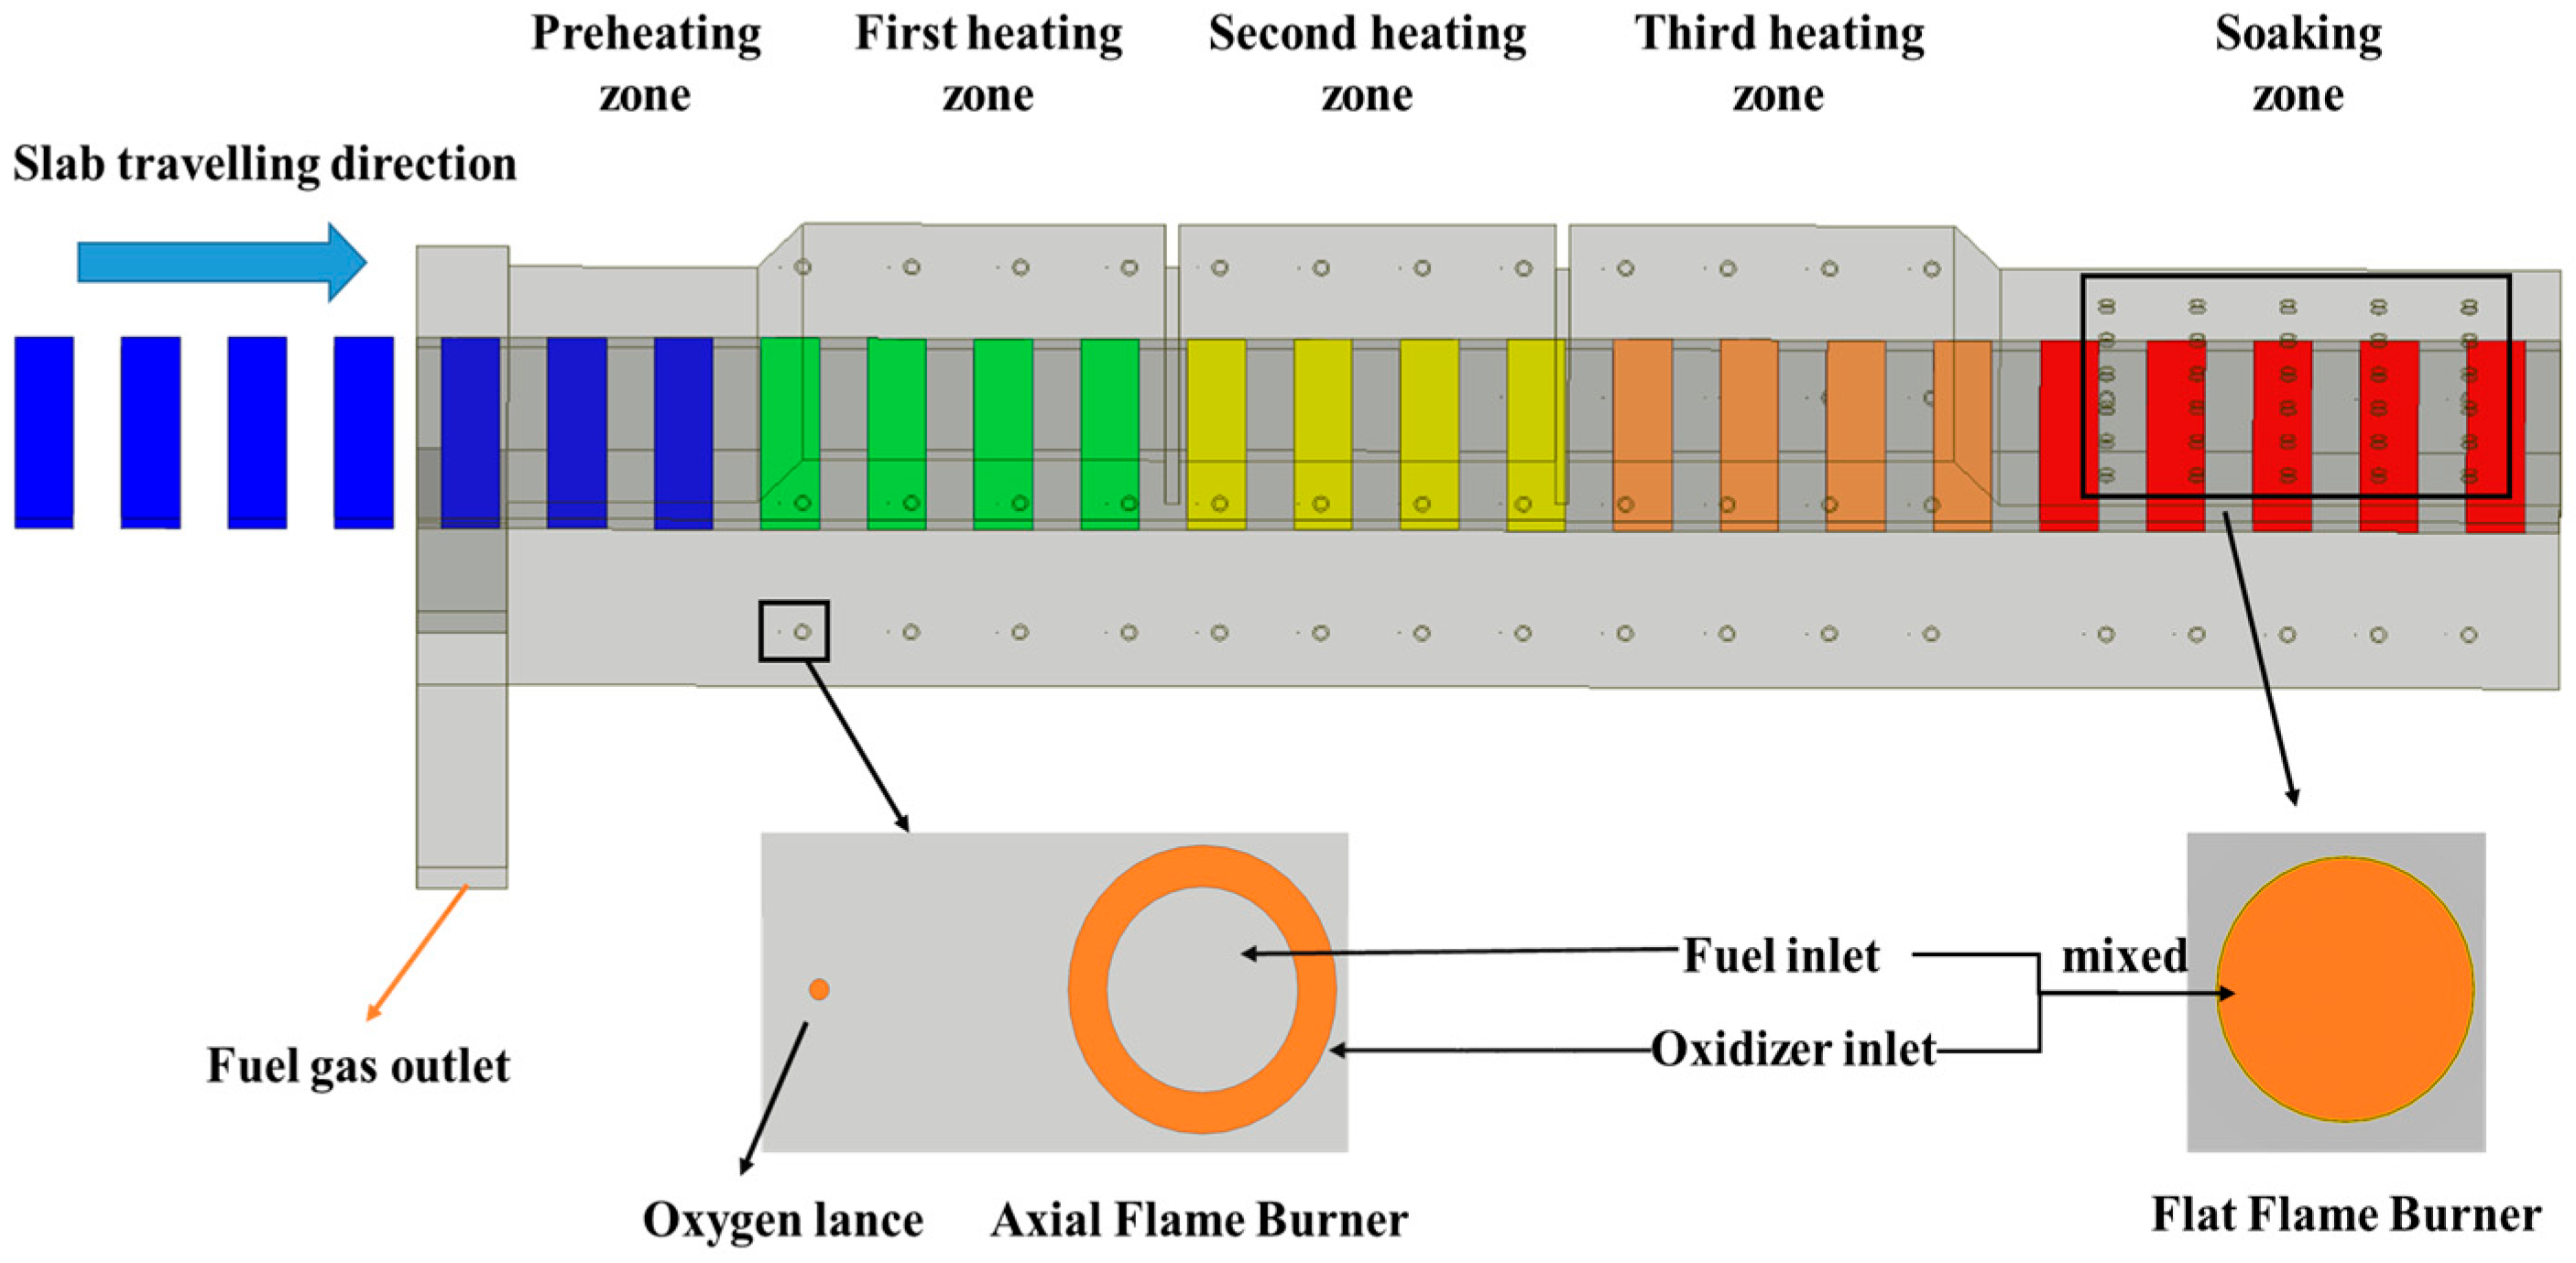
As shown in
Figure 1, the reheating furnace is structured into 5 sequential zones: the preheating zone, heating zone 1, heating zone 2, heating zone 3, and the soaking zone. Further details regarding the furnace geometry and burner layout are provided in
Table 1.
The reheating furnace in this study adopts an end-in and end-out charging/discharge configuration, with a fuel gas outlet located in the preheating zone. Burners are installed in both the heating and soaking zones, specifically arranged in the following section.
The burners in the heating zone are located on the side furnace walls and are symmetrically arranged relative to the horizontal centerline at the slab entry. The burners in the soaking zone are primarily positioned on the furnace roof and side walls. On the side walls of both the heating and soaking zones, axial flame burners are adopted under OEC mode, while MILD burners are adopted under MOFC mode. Flat flame burners are installed on the roof of the soaking zone.
The axial flame burners feature a concentric sleeve structure, with the inner tube serving as the fuel inlet and the annular gap of the outer sleeve acting as the oxidizer inlet. Within the MILD burners, the oxidizer is injected into the furnace chamber via an oxygen lance. This design aims to generate a strong internal recirculation effect through the high-velocity injection of oxygen into the furnace chamber. Consequently, the reactants become continuously diluted by the inert components present in the flue gas, thus achieving the MILD combustion regime.
The reheating furnace is used for heating low carbon steel. The slab dimensions are 230 mm × 1285 mm × 8960 mm. Slabs are charged at 30 °C and are discharged at 1250 °C, with a permissible discharge temperature fluctuation of ±50 °C. The maximum allowable temperature difference across the slab cross-section is 30 °C.
2.2. Meshing Details
2.2.1. Mesh Generation
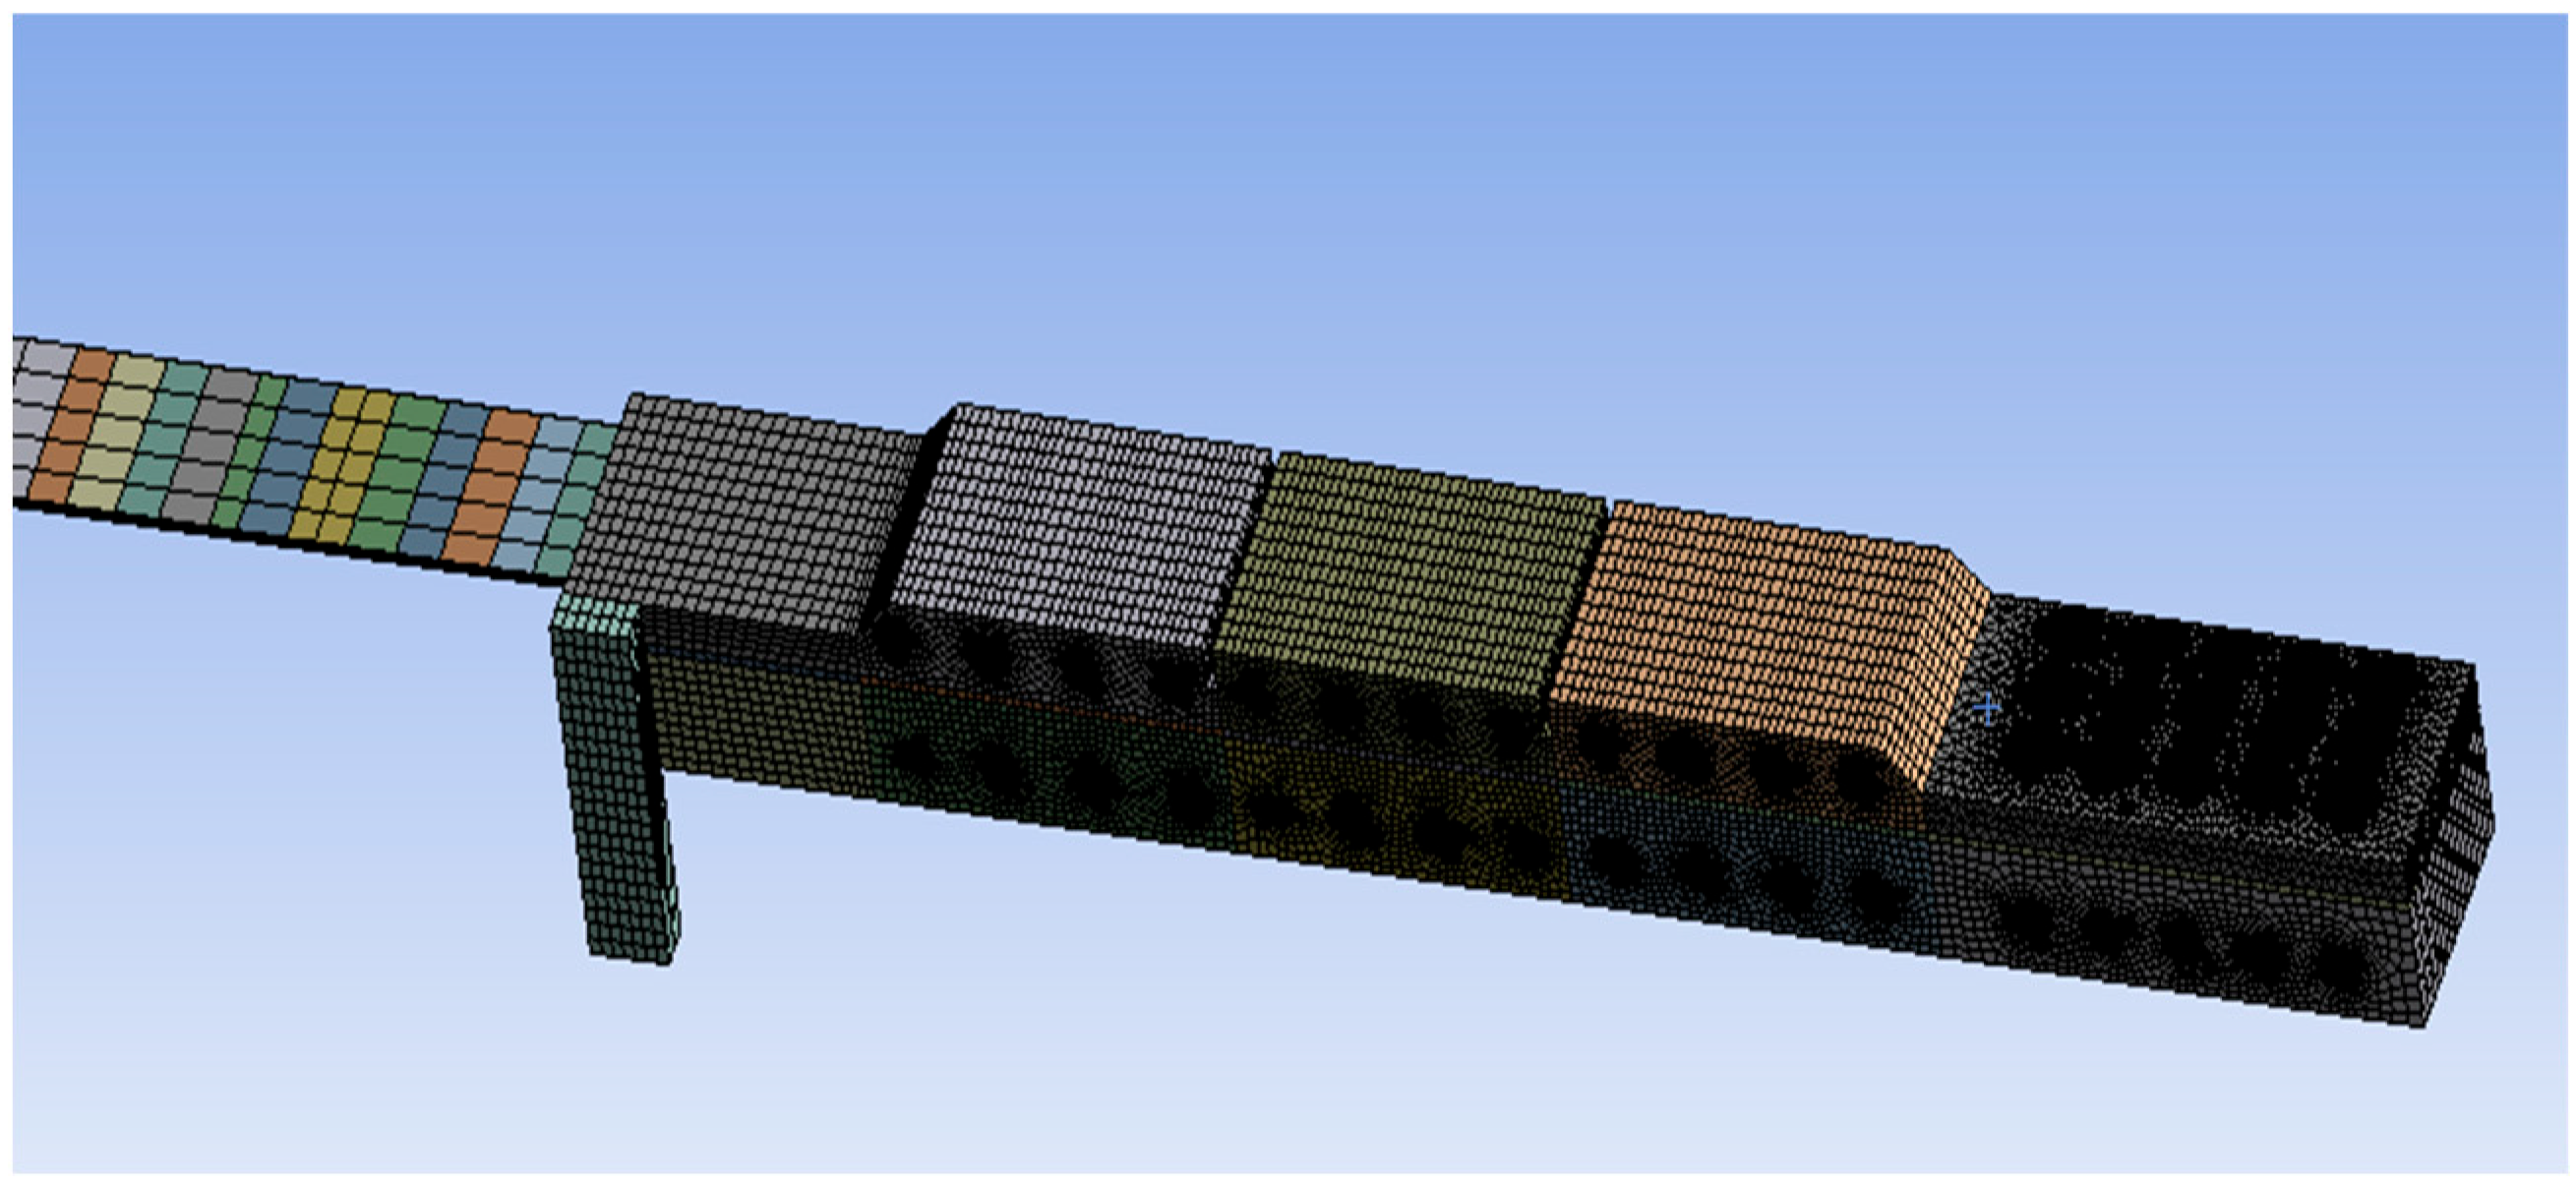
The computational domain of the reheating furnace model was meshed using MESH software.
Figure 2 shows the mesh schematic for the half-model. Due to the axisymmetric structure of the furnace, only half of the geometry was used for mesh generation and numerical simulation, thereby reducing computational cost. This approach was also applied during the mesh independence verification process. The primary meshing methodologies utilized included multi-zone partitioning and tetrahedral elements, with localized mesh refinement implemented specifically at burner locations and around slabs to enhance computational accuracy. The complete mesh comprises 420,000 cells, exhibiting a minimum orthogonality of 0.3 and an average orthogonality of 0.93, meeting all computational requirements.
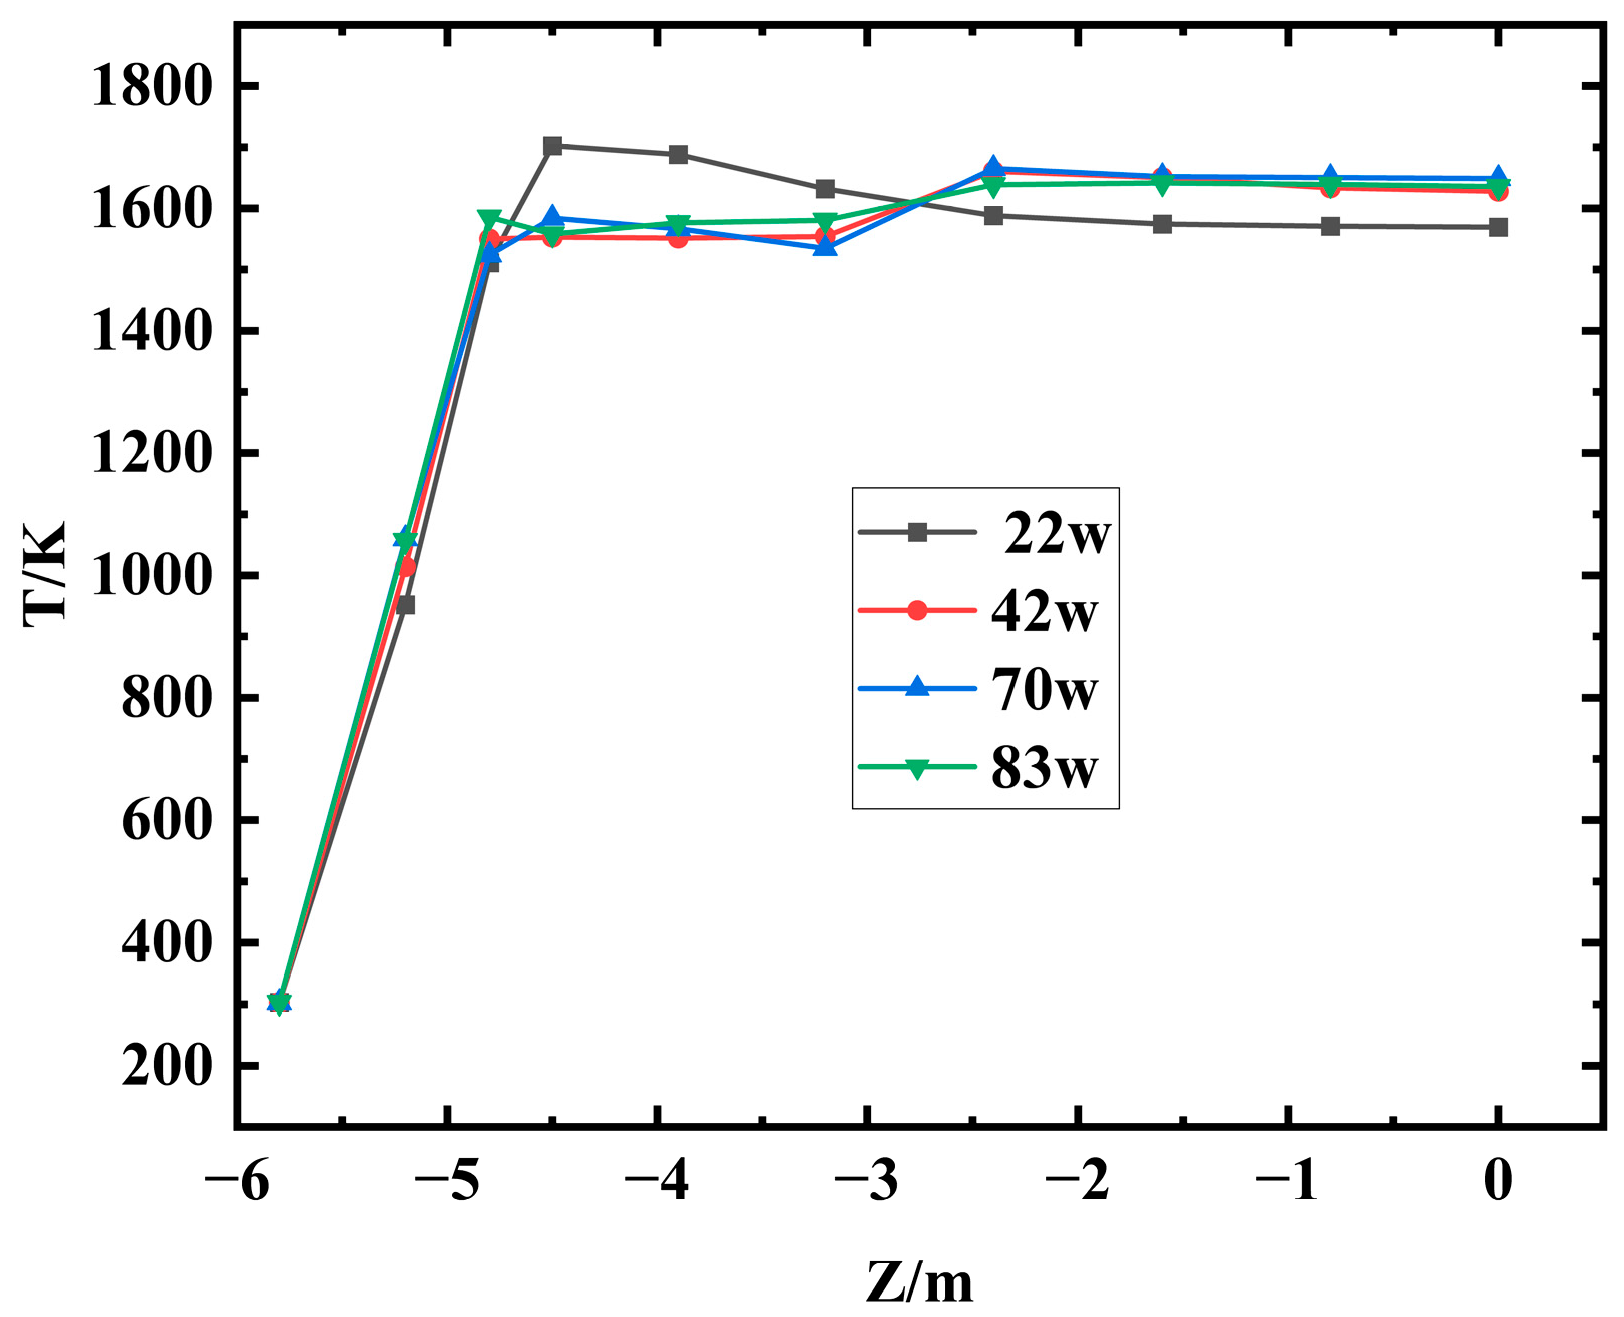
2.2.2. Grid Independence Verification
Mesh quality and quantity critically affect simulation accuracy. To find optimal mesh, cases with 220,000, 420,000, 700,000, and 830,000 cells were tested.
Figure 3 shows the flame center temperature at the same burner position for different mesh sizes. Above 420,000 cells, results show minor differences. The result with 220,000 cells has larger deviation. Balancing accuracy and resources, 420,000 cells were chosen in the following calculation.
2.3. Mathematical Model
2.3.1. Governing Equations
(1) Mass Conservation Equation
The mass conservation equation is fundamental in fluid dynamics and thermodynamics. It states that mass cannot be created or destroyed in a fixed control volume. Mass can only be transferred. Inflow mass flow rate must equal outflow plus mass change rate due to density variation. Under continuum assumption, for ideal-gas, it is usually written as follows:
where
is density;
is time; and
is velocity.
(2) Momentum Conservation Equation
The momentum equation describes fluid momentum change versus external forces. It applies Newton’s second law to continuous media. Momentum change rate in a control volume equals the sum of all external forces. For an ideal-gas, it is expressed as follows:
where
is static pressure;
is the stress tensor;
is external force; and
is gravity.
(3) Energy Conservation Equation
During fluid flow, energy is transferred and converted in multiple ways. These include convection, conduction, radiation, and energy changes from pressure and viscosity. For a continuous medium (e.g., fluid or gas), the energy equation is usually as follows:
where
is specific heat capacity;
is temperature;
is fluid thermal conductivity; and
is internal heat source and viscous dissipation term.
(4) Species Transport Equation
where
is mass fraction of species
i;
is net generation rate via chemical reaction; and
is net generation rate from other sources and user-defined terms.
2.3.2. Combustion, Radiation, Turbulence, and NOx Generation Models
The Eddy Dissipation Concept (EDC) model [
34] considers turbulence–chemistry interaction. It suits fast reaction systems and complex combustion that needs detailed chemistry. It models the combustion process. Additionally, according to the study by M. Vascellari et al. [
35], the EDC model yields better results for MILD combustion.
The Discrete Ordinates (DO) model handles radiation heat transfer [
36]. It is suitable for high-temperature, strong radiation scenarios like combustion. The DO model is applicable to a wide range of optical conditions, ranging from optically thin to optically thick media. It is capable of handling non-gray gas radiation and complex boundary conditions. Compared to other radiation models, the DO model offers significant advantages in terms of accuracy and versatility, particularly in combustion simulations involving high temperatures and intense radiative heat transfer. Although the DO model entails a relatively higher computational cost, its superior ability to resolve detailed radiative transport makes it an ideal choice for modeling combustion processes.
The standard
k-
ε model handles turbulence [
37]. By solving the transport equations for turbulent kinetic energy (
k) and its dissipation rate (
ε), the model offers a good balance between computational efficiency, numerical stability, and broad applicability. These advantages make it a well-established choice for simulating complex turbulence phenomena commonly encountered in practical industrial and engineering settings.
The Weighted Sum of Gray Gases (WSGG) model calculates absorption coefficient [
38]. It predicts radiative heat transfer from the medium. The WSGG model achieves a good balance between computational efficiency and accuracy by representing the radiative properties of non-gray gases as a weighted sum of contributions from multiple gray gas components.
A thermal NOx generation model is employed [
39]. In the NOx generation mechanisms, there are mainly three types: fuel-NOx, thermal-NOx, and prompt-NOx. The dominant type depends on the fuel composition. According to
Table 2, taking MG as an example, the generation of fuel-NOx is minimal, and the contribution of prompt-NOx typically accounts for less than 5%. Therefore, thermal-NOx becomes the primary source.
2.4. Boundary Conditions
Mixed gas (MG), natural gas (NG), and coke oven gas (COG) were used as fuels.
Table 2 shows fuel composition and calorific values.
Table 3 shows the burner parameters. To ensure consistency in the flow field, the fuel inlet diameter was adjusted such that the inlet velocity remained nearly constant across different fuels under the same combustion mode, despite variations in total flow rate.
Table 4 shows main simulation boundary conditions. Sliding mesh technology simulated slab movement. Slabs and inter-slab air were defined as moving domains. The rest of the furnace was a stationary domain. Moving domain length was twice the furnace length. Data exchange between the moving and stationary domains was achieved through an interface surface. The SIMPLE algorithm solved the equations numerically.
Additional simplifications were made: Bottom water-cooling heat loss of slabs was neglected. Oxidation and decarburization during heating were neglected. Gas escape/suction at furnace ends was neglected. Wall radiation heat transfer coefficient per zone was constant. Slab oxidation loss was neglected.
These simplifications have an impact on the heating process of the slab. However, the focus of this work is on the overall flow, temperature distribution, and NOx formation mechanisms inside the furnace chamber—characteristics that are primarily governed by gas flow and combustion reactions. The effects of simplifications such as neglecting heat loss from water cooling and oxidation loss on the gas flow, flue gas recirculation, and temperature field distribution are considered to be minimal. While emissivity affects radiative heat transfer within the furnace, the radiative heat flux is predominantly determined by the participation of high-temperature combustion gases (CO2 and H2O). Compared with traditional combustion, the change in the contributions from radiation between the slab and the furnace walls are not in a significantly oxy-enriched condition. Furthermore, the key conclusions of this study—such as the effect of oxygen concentration on temperature uniformity and the NOx reduction mechanism under MOFC—are found to be insensitive to variations in emissivity. Therefore, the aforementioned simplifications do not compromise the general applicability of the results.
2.5. Simulation Cases
Table 5 shows the simulation cases. To study the effects of oxygen concentration under both modes, MG was used as fuel. OEC and MOFC cases were set at O
2% = 31~91%. To study the effects of fuel type under both modes, NG and COG cases were set at O
2% = 51%.
4. Conclusions
In this study, the flow, heat transfer properties, and thermal efficiency of a steel reheating furnace were studied with numerical simulations. The effects of different oxygen concentrations and fuels were analyzed under OEC and MOFC modes. The main findings are as follows:
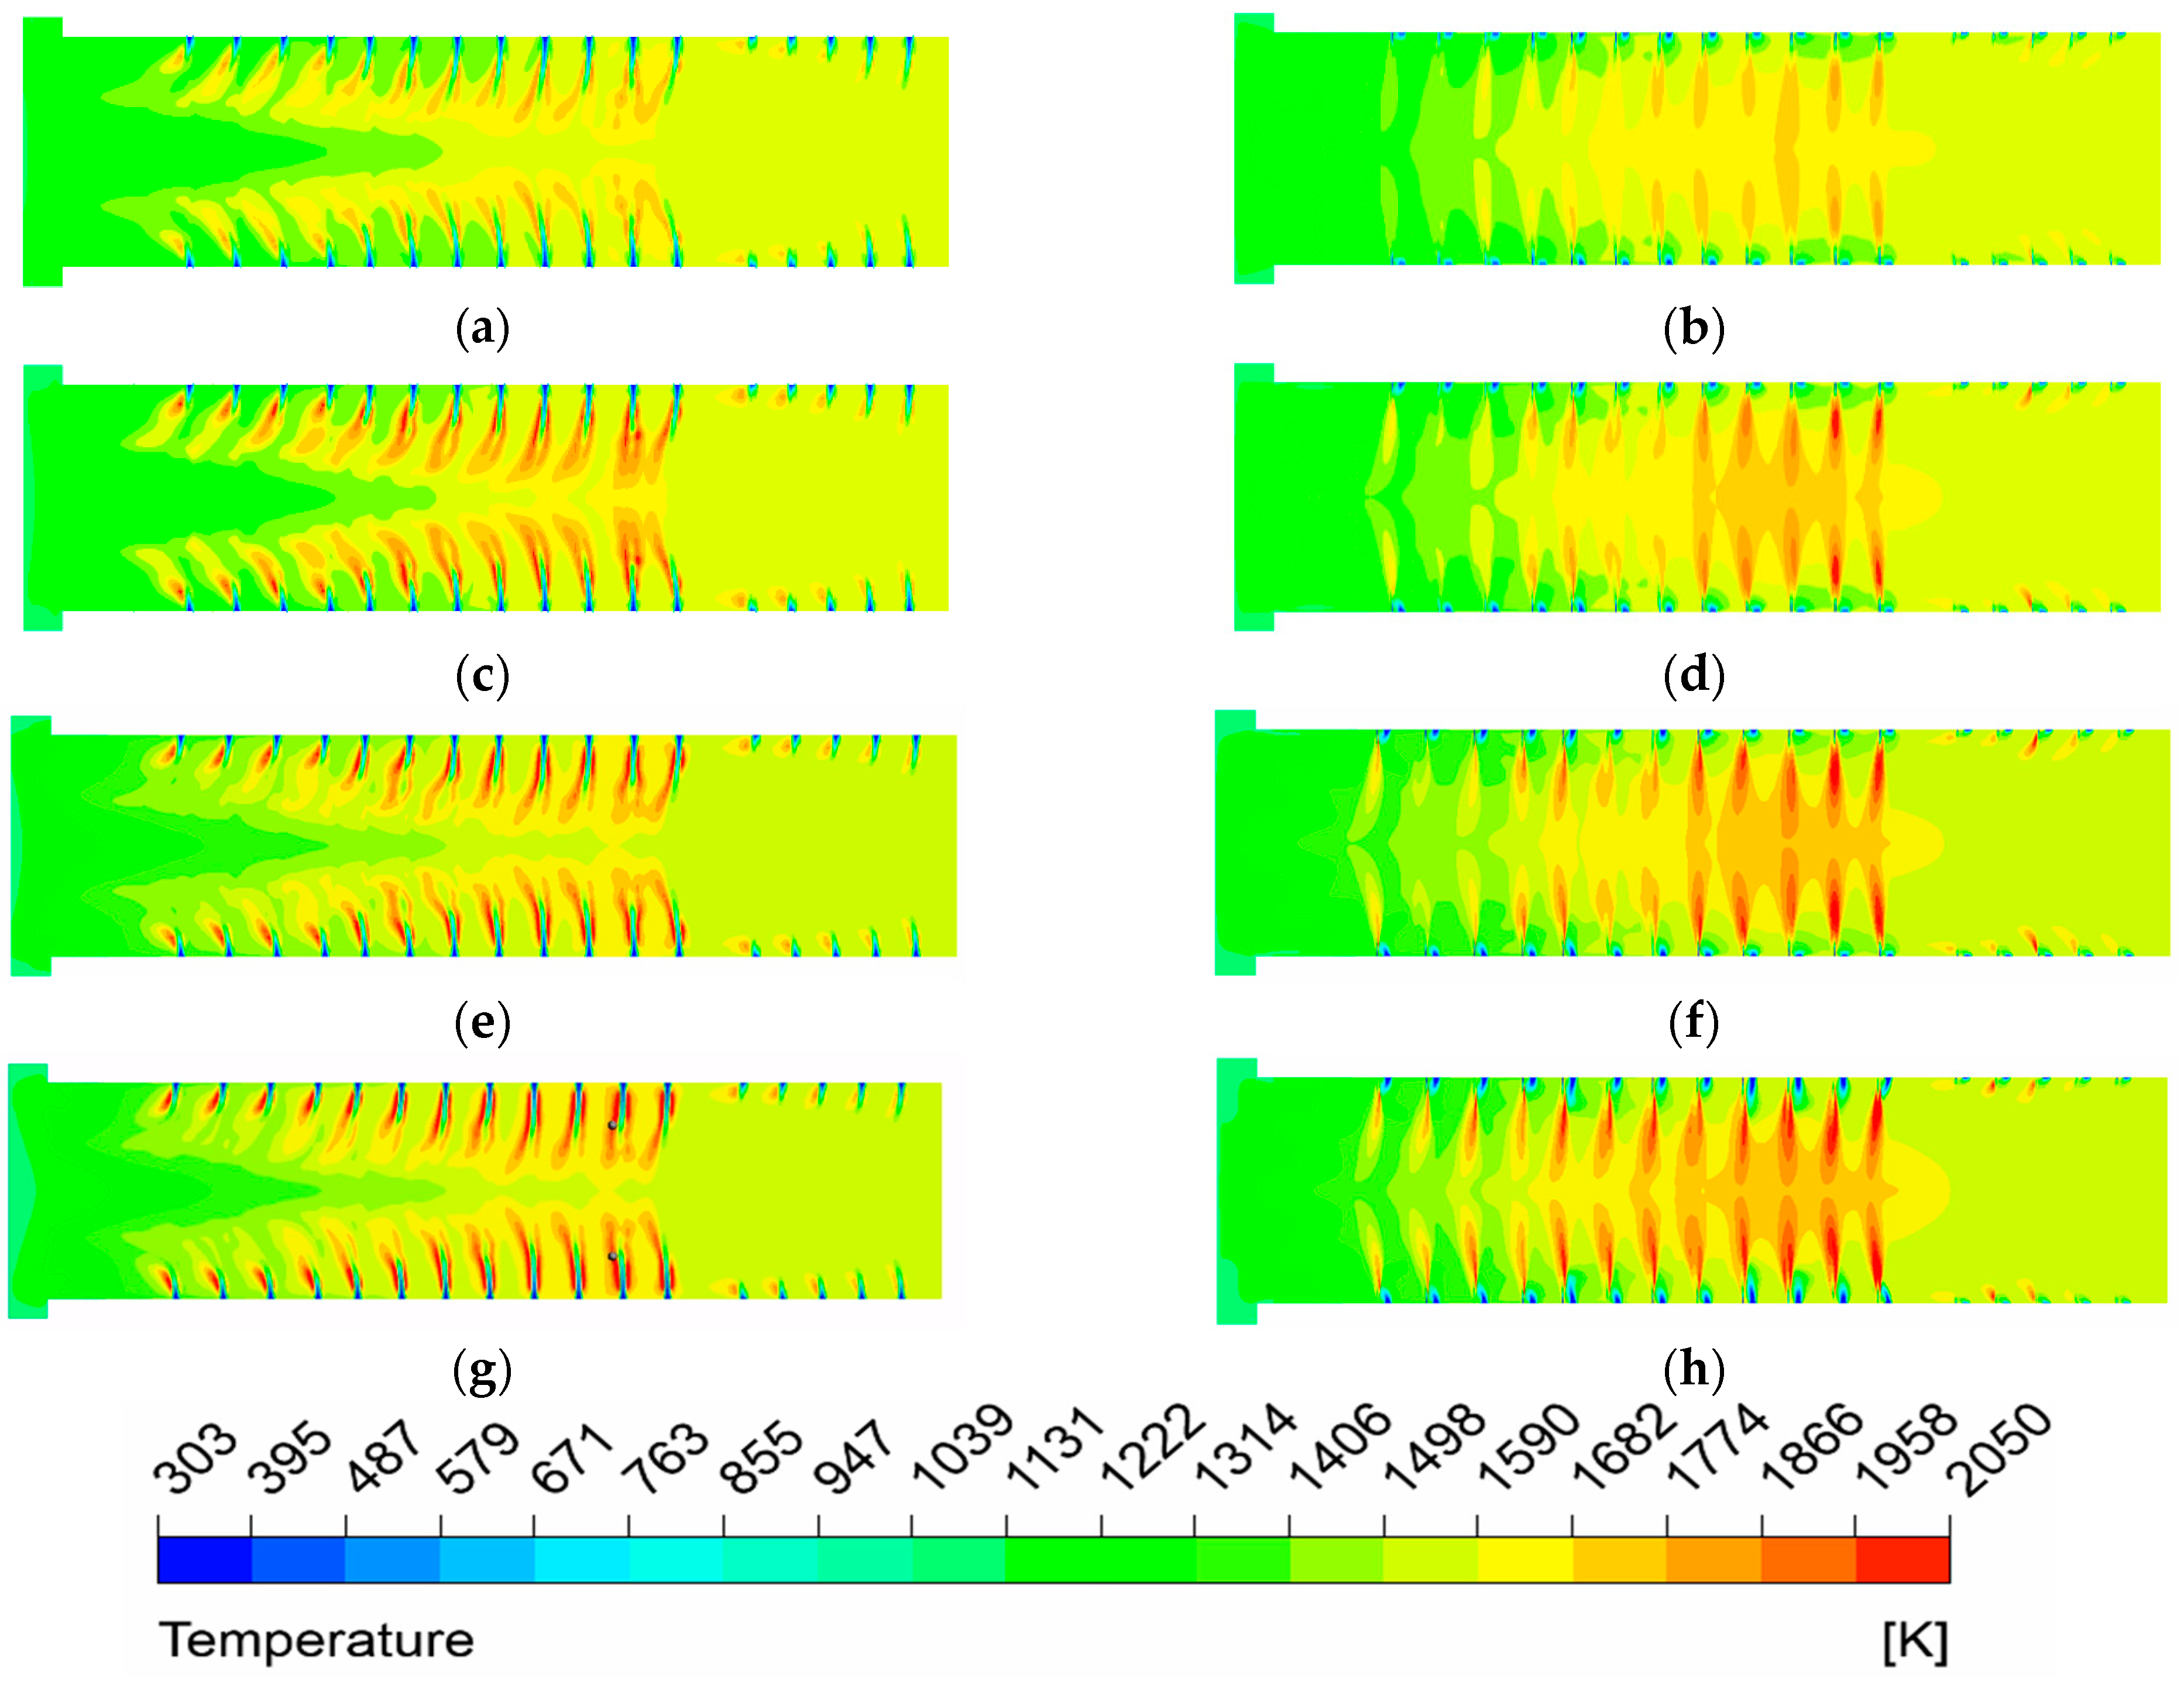
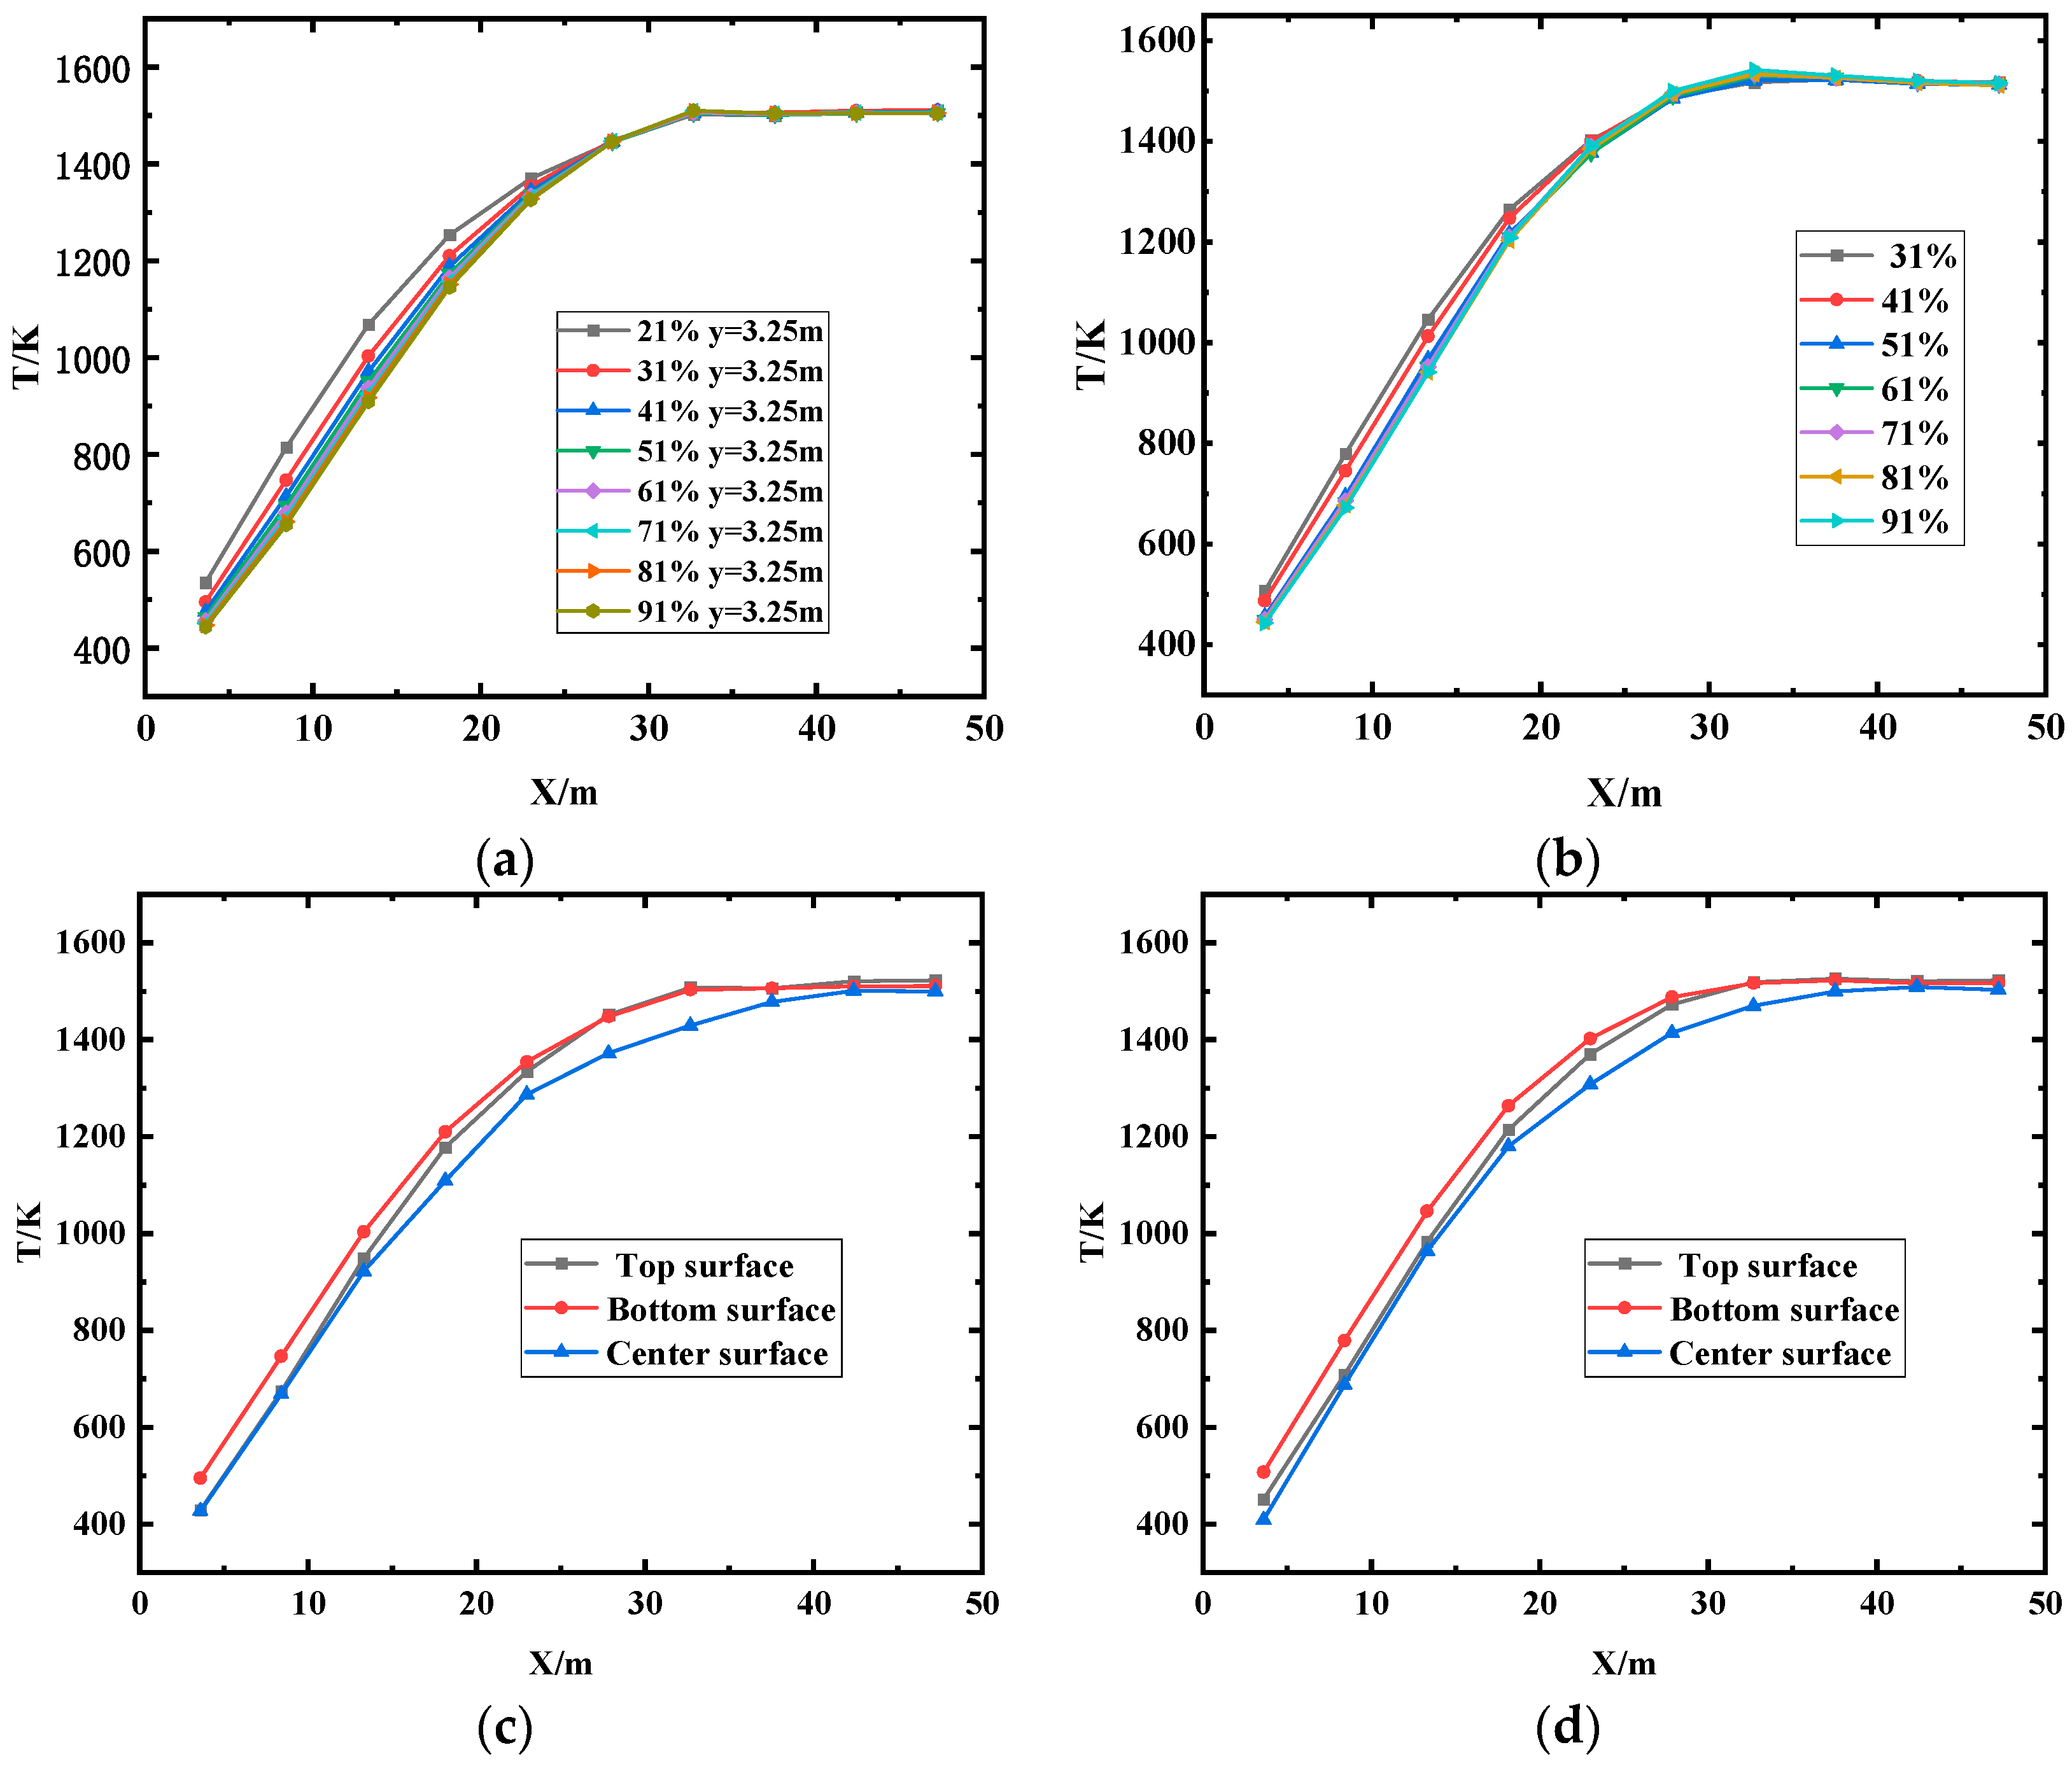
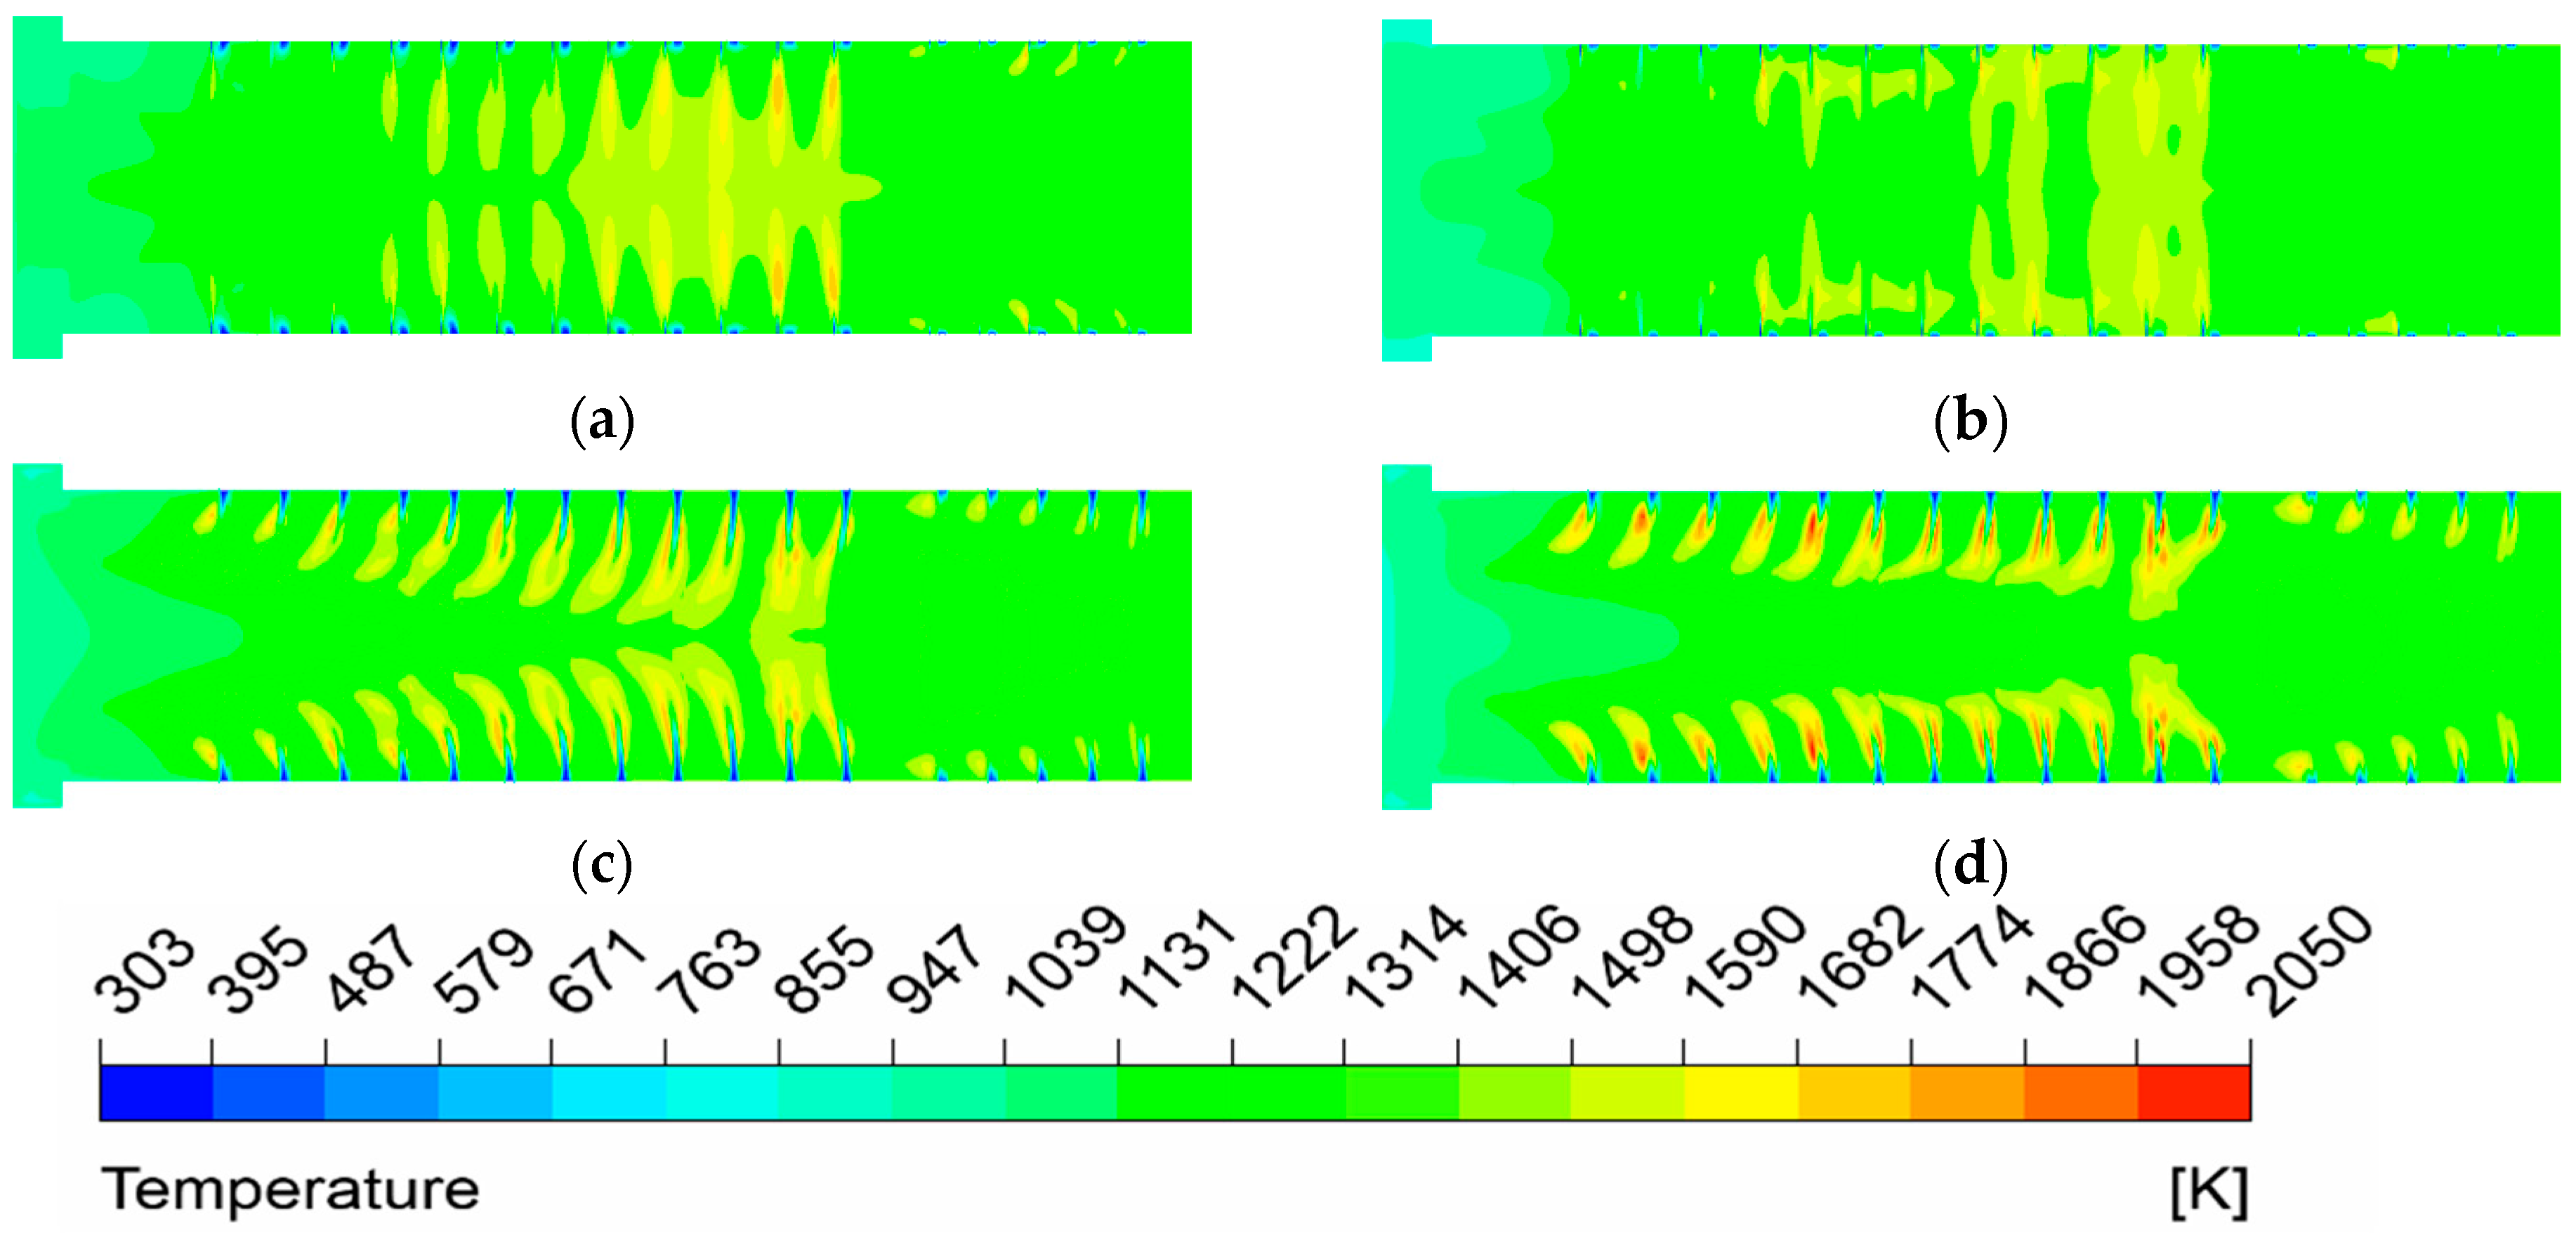
(1) The temperature uniformity of the furnace is improved with the elevated oxygen concentration. The most uniform temperature distribution appeals at O2% = 31% under MOFC mode.
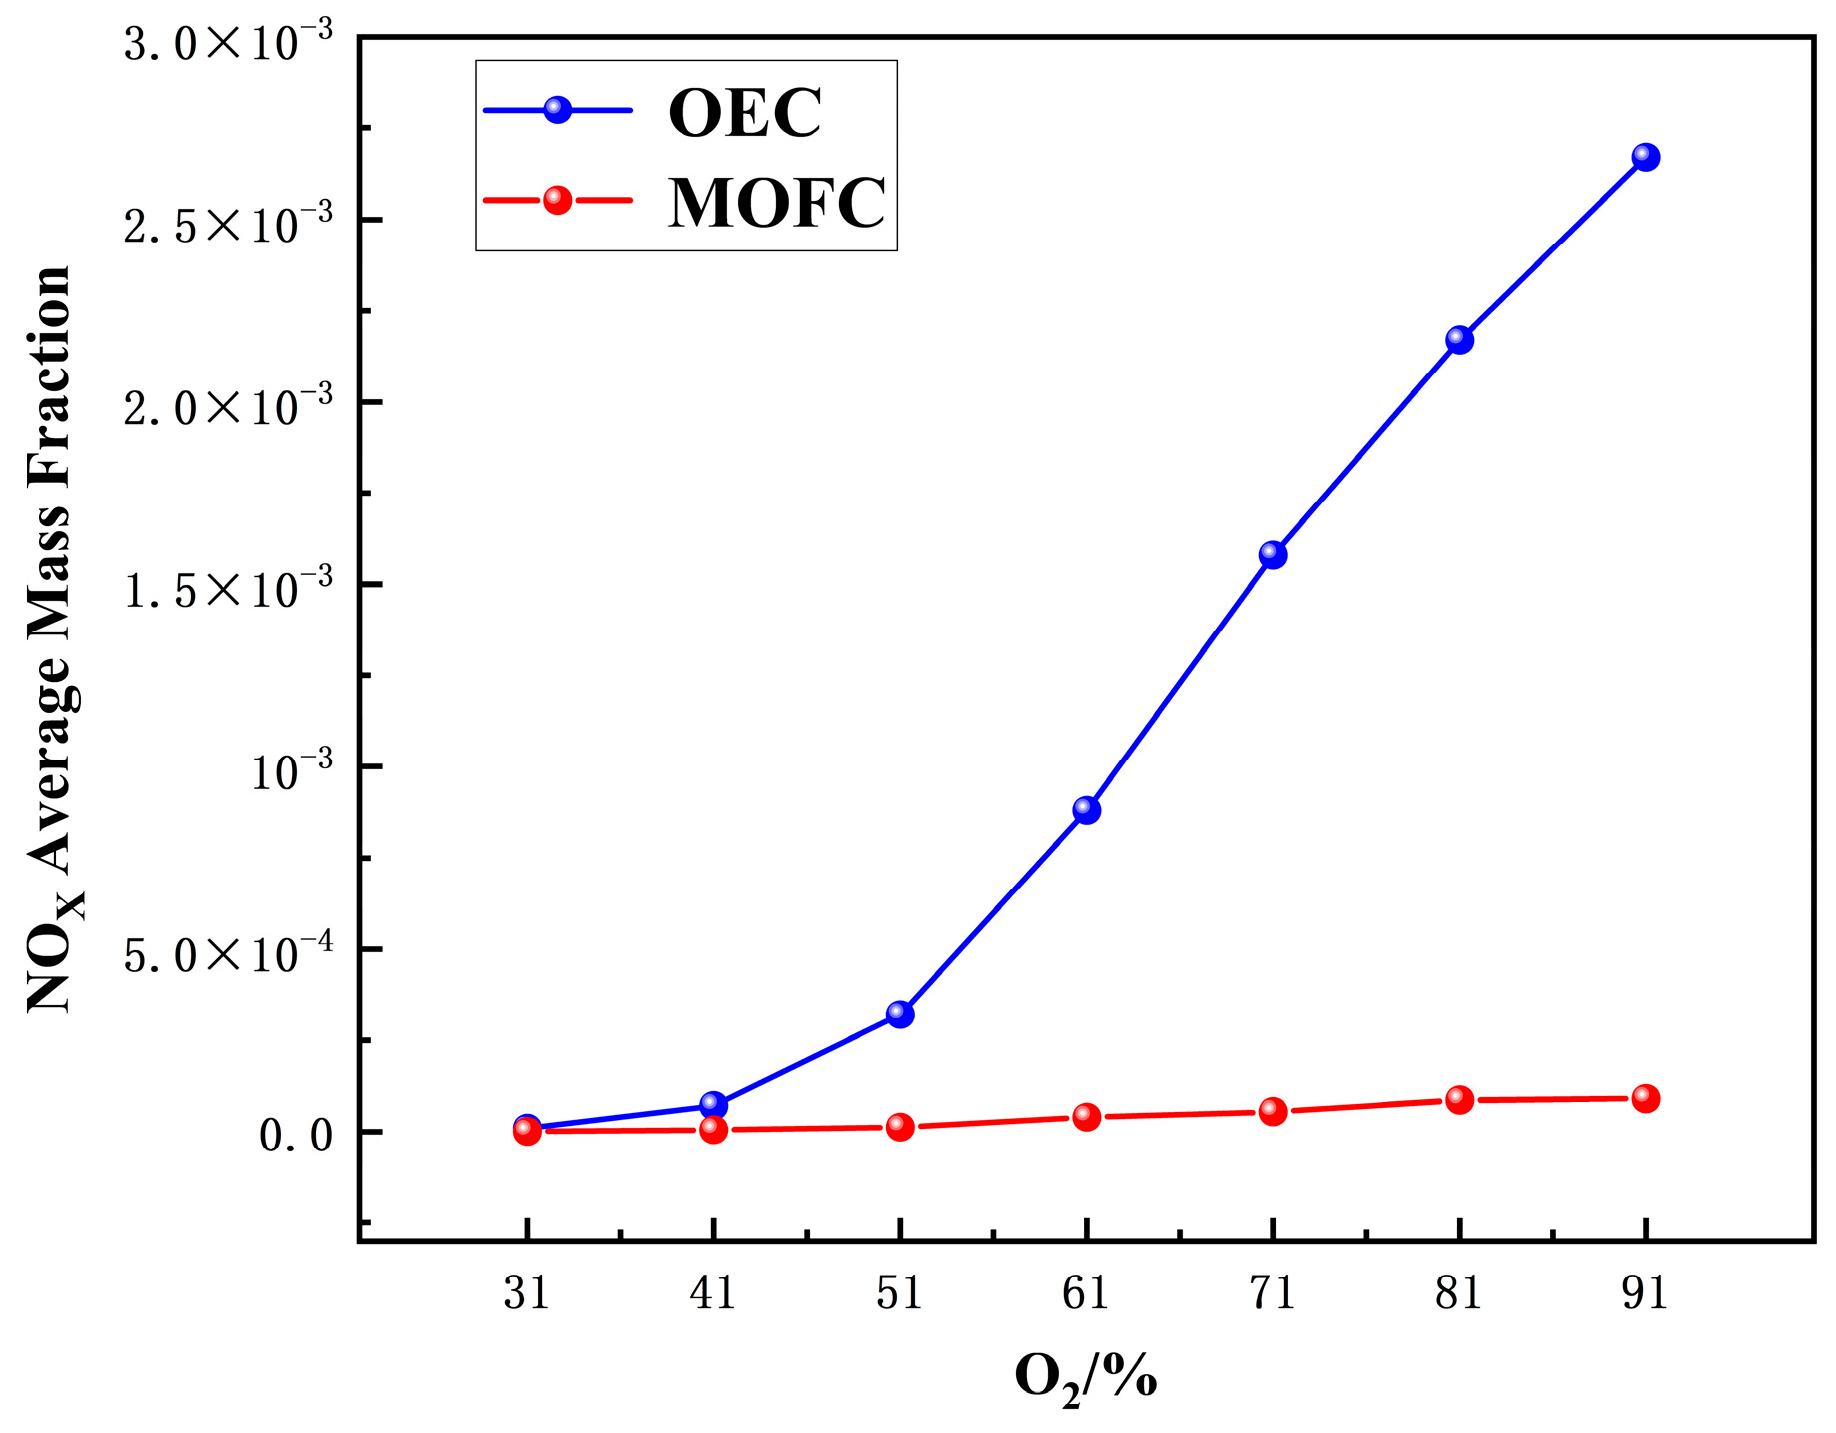
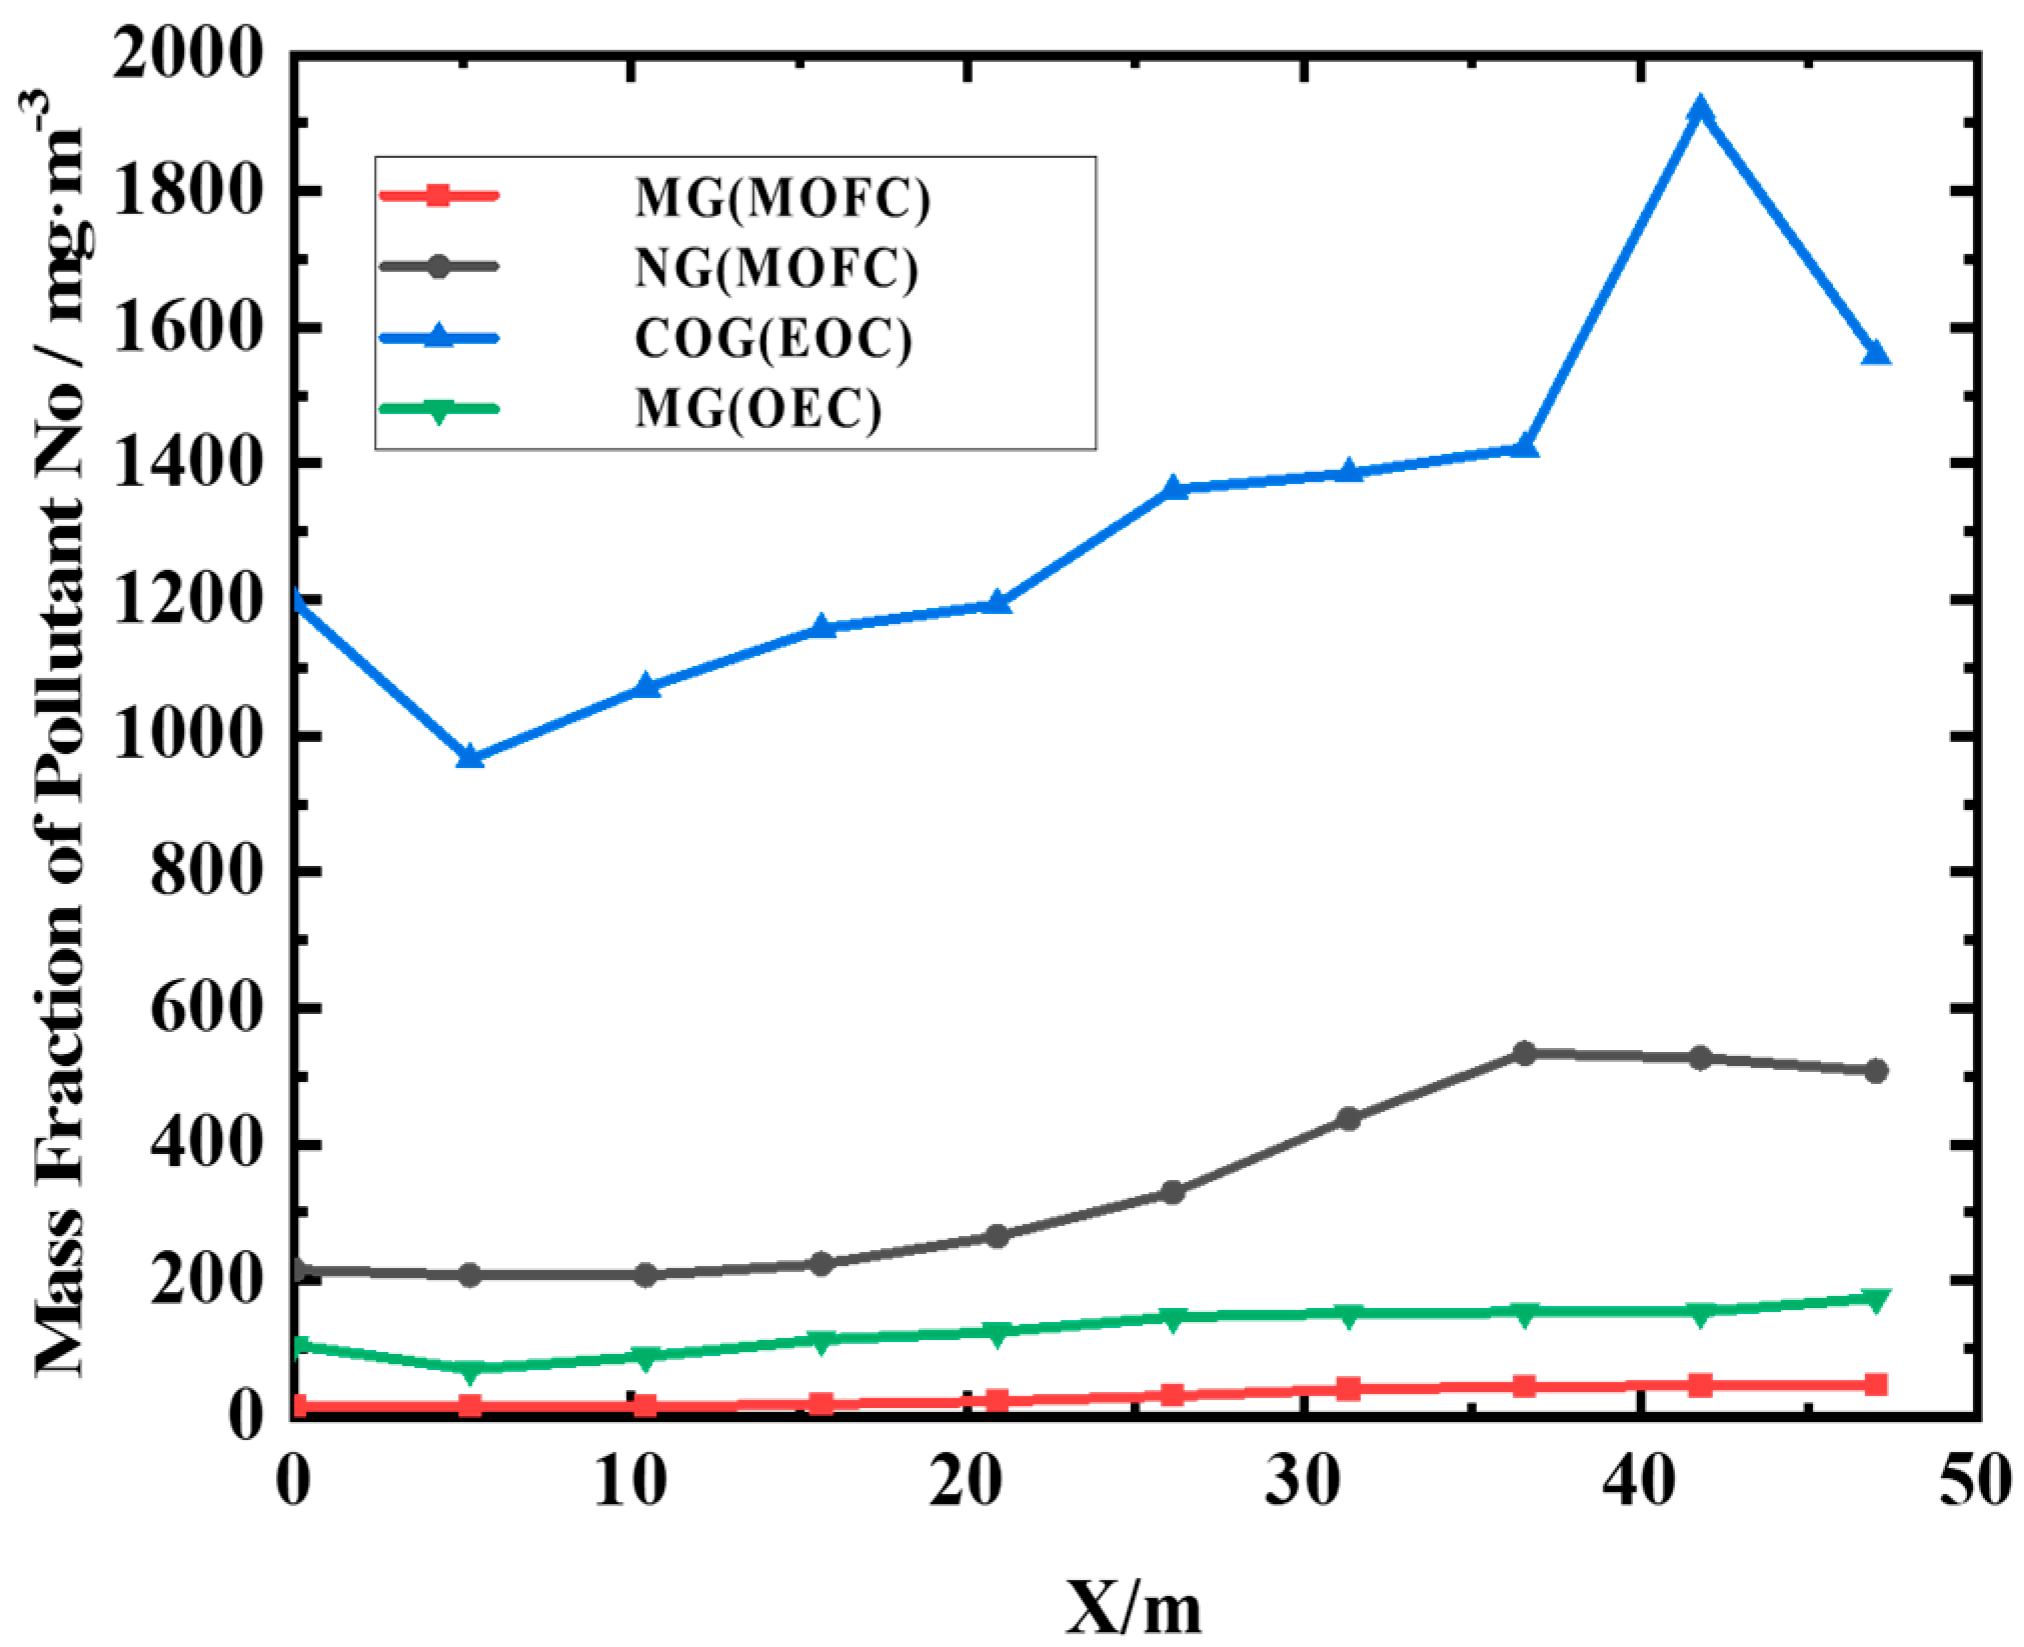
(2) MOFC mode drastically reduces NOx compared to OEC. NOx emission under MOFC mode is 1–2 orders of magnitude lower than that under OEC mode.
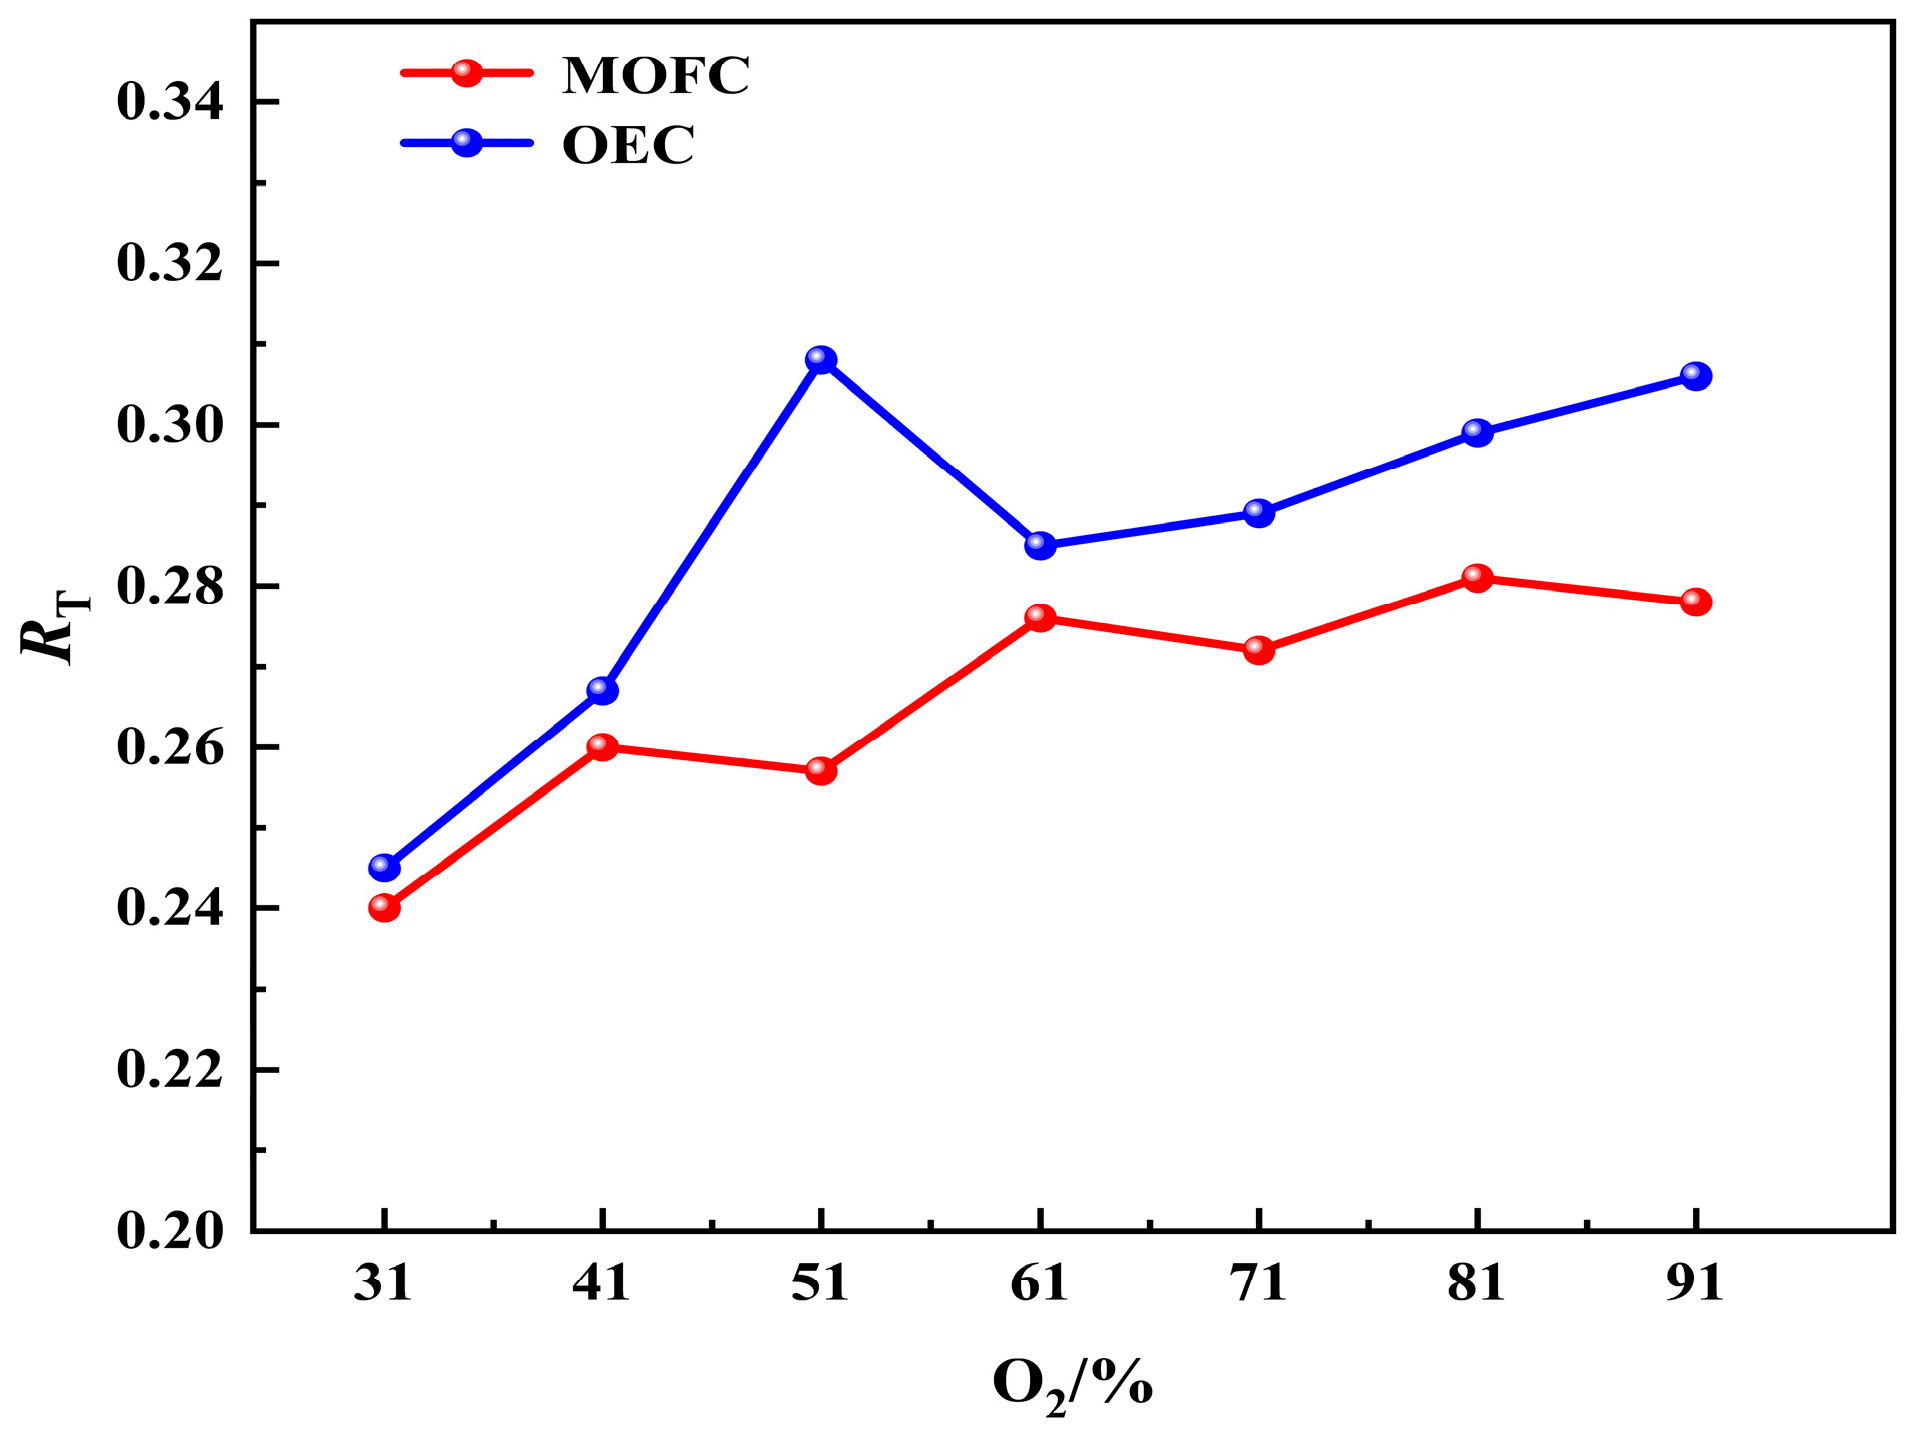
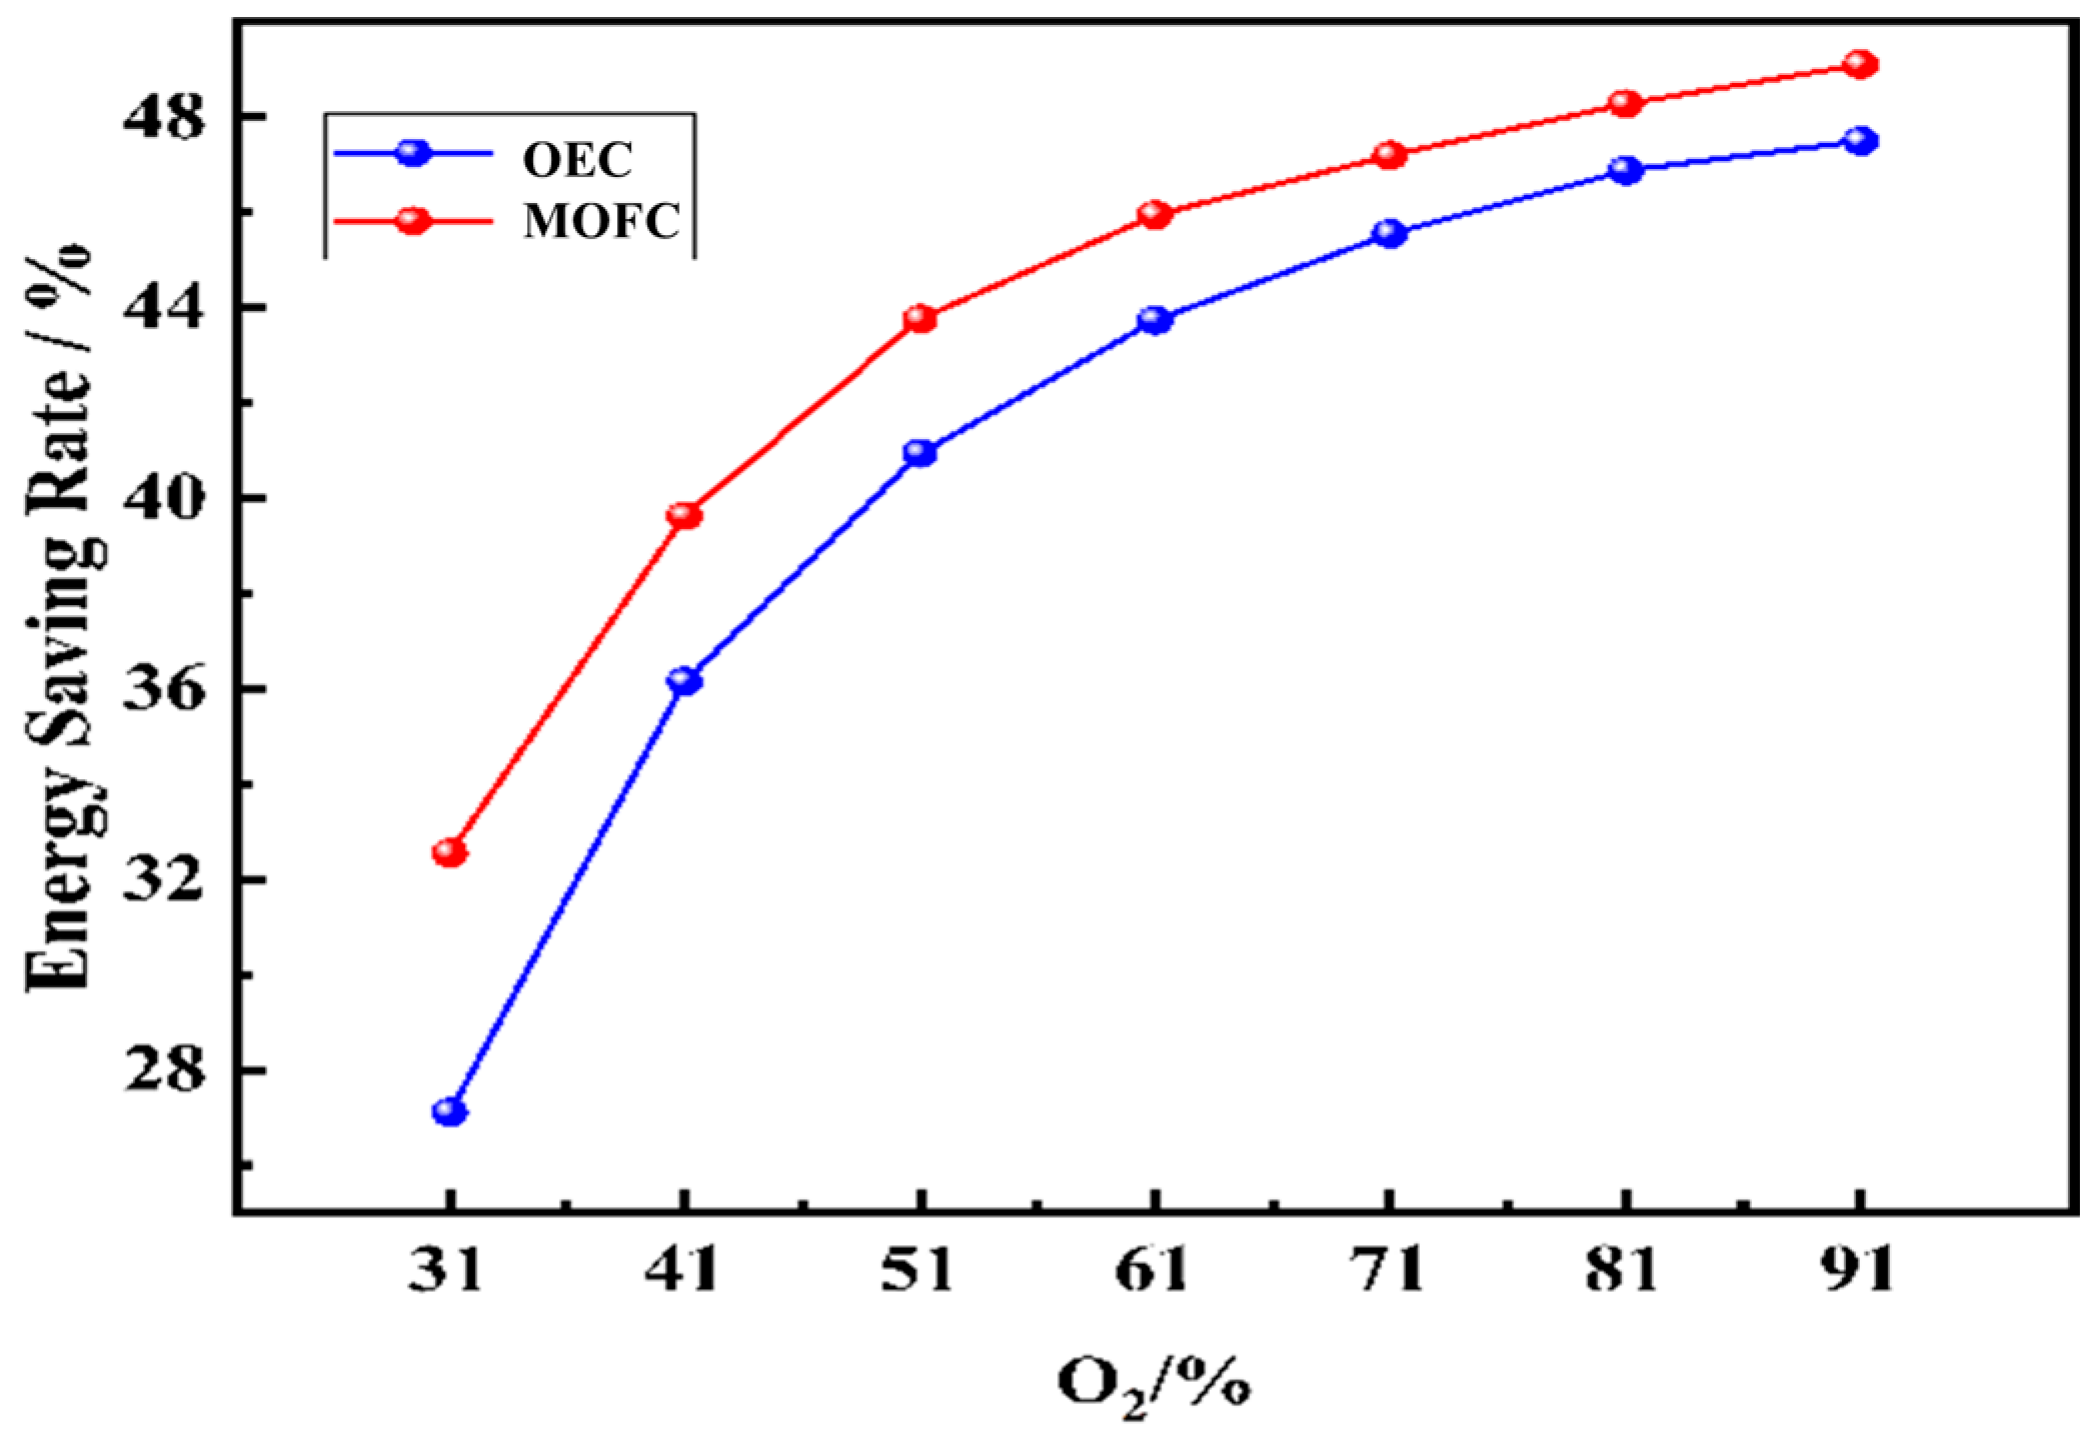
(3) The increasing oxygen concentration improves the thermal efficiency and energy saving rate of the furnace. At O2% = 91%, the thermal efficiency under MOFC reaches 60.98% and the energy saving rate reaches 47.04%.
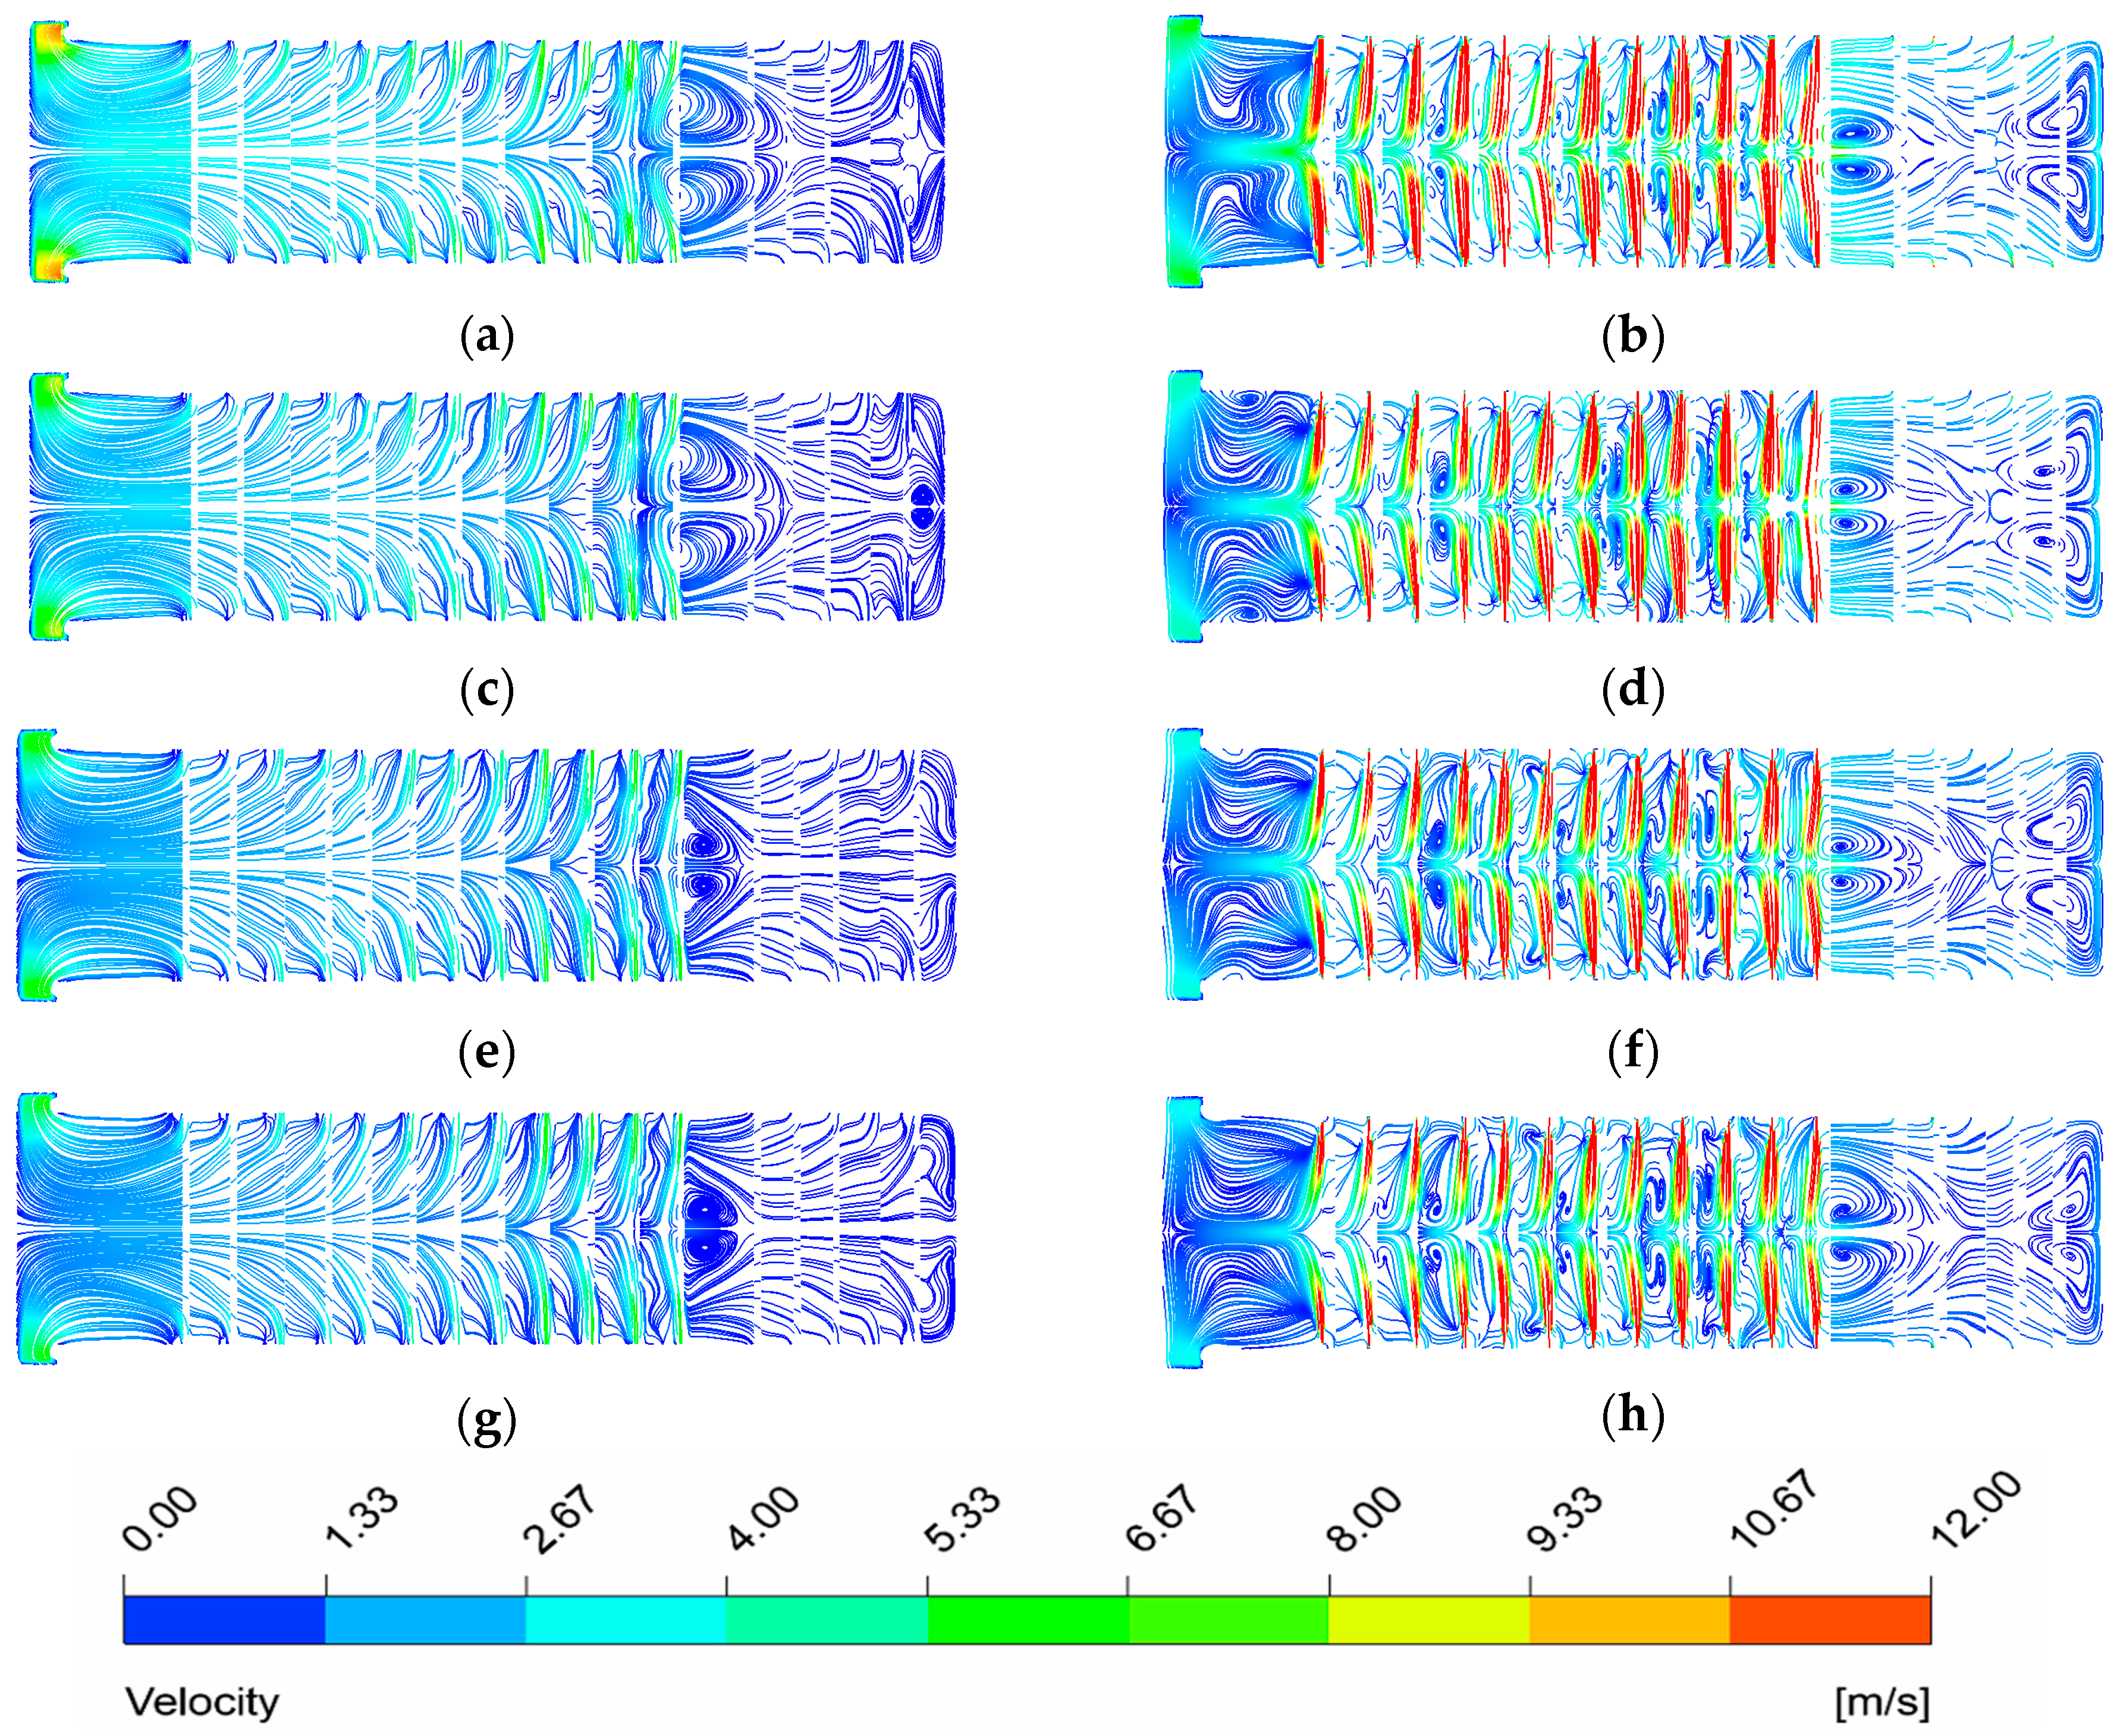
(4) There is a uniform gas flow distribution and almost no visible flame exists under MOFC mode for NG. The thermal efficiency in this condition is the highest (62.68%).
(5) Considering the heating characteristics of the slabs, MOFC technology combined with MG or NG is recommended. Efficient, low-emission operation is achievable at O2% = 51~71%.


