Abstract
This study developed a water-soluble antifouling coating to protect ship hulls against corrosion and fouling without the usage of a primer. The coating retains its adhesion to the steel substrate and reduces corrosion rates compared to those for uncoated specimens. The coating’s protective properties rely on the interaction of conductive polyaniline (PAni) nanorods, magnetite (Fe3O4) nanoparticles, and graphene oxide (GO) sheets modified with titanium dioxide (TiO2) nanoparticles. The PAni/Fe3O4 nanocomposite improves the antifouling layer’s out-of-plane conductivity, whereas GO increases its in-plane conductivity. The anisotropy in the conductivity distribution reduces the electrostatic attraction and limits primary bacterial and pathogen adsorption. TiO2 augments the conductivity of the PAni nanorods, enabling visible light to generate H2O2. The latter decomposes into H2O and O2, rendering the coating environmentally benign. The coating acts as an effective barrier with limited permeability to the steel surface, demonstrating outstanding durability for naval steel over extended periods.
1. Introduction
Marine biofoulants comprise more than 4000 identified species that inhabit maritime environments, classified into two categories: micro-fouling and macro-fouling [1,2].
Table 1 presents a representative list of the primary families of colonization species and their distribution across several categories of marine fouling. Organisms classified as macro-fouling are further categorized into soft and hard fouling [3]. The presentation of the biofouling species in Table 1 does not reflect their temporal sequence of appearance on a submerged surface in a marine environment. The conventional model depicting the colonization of submerged surfaces in marine environments as a linear progression through four stages [4,5,6,7] has been supplanted by the dynamic model [3], which emphasizes the substantial impact of organism diversity and abundance on colonization [3,8].

Table 1.
Qualitative categorization of colonizing species. The dashed line distinguishes micro-fouling from macro-fouling.
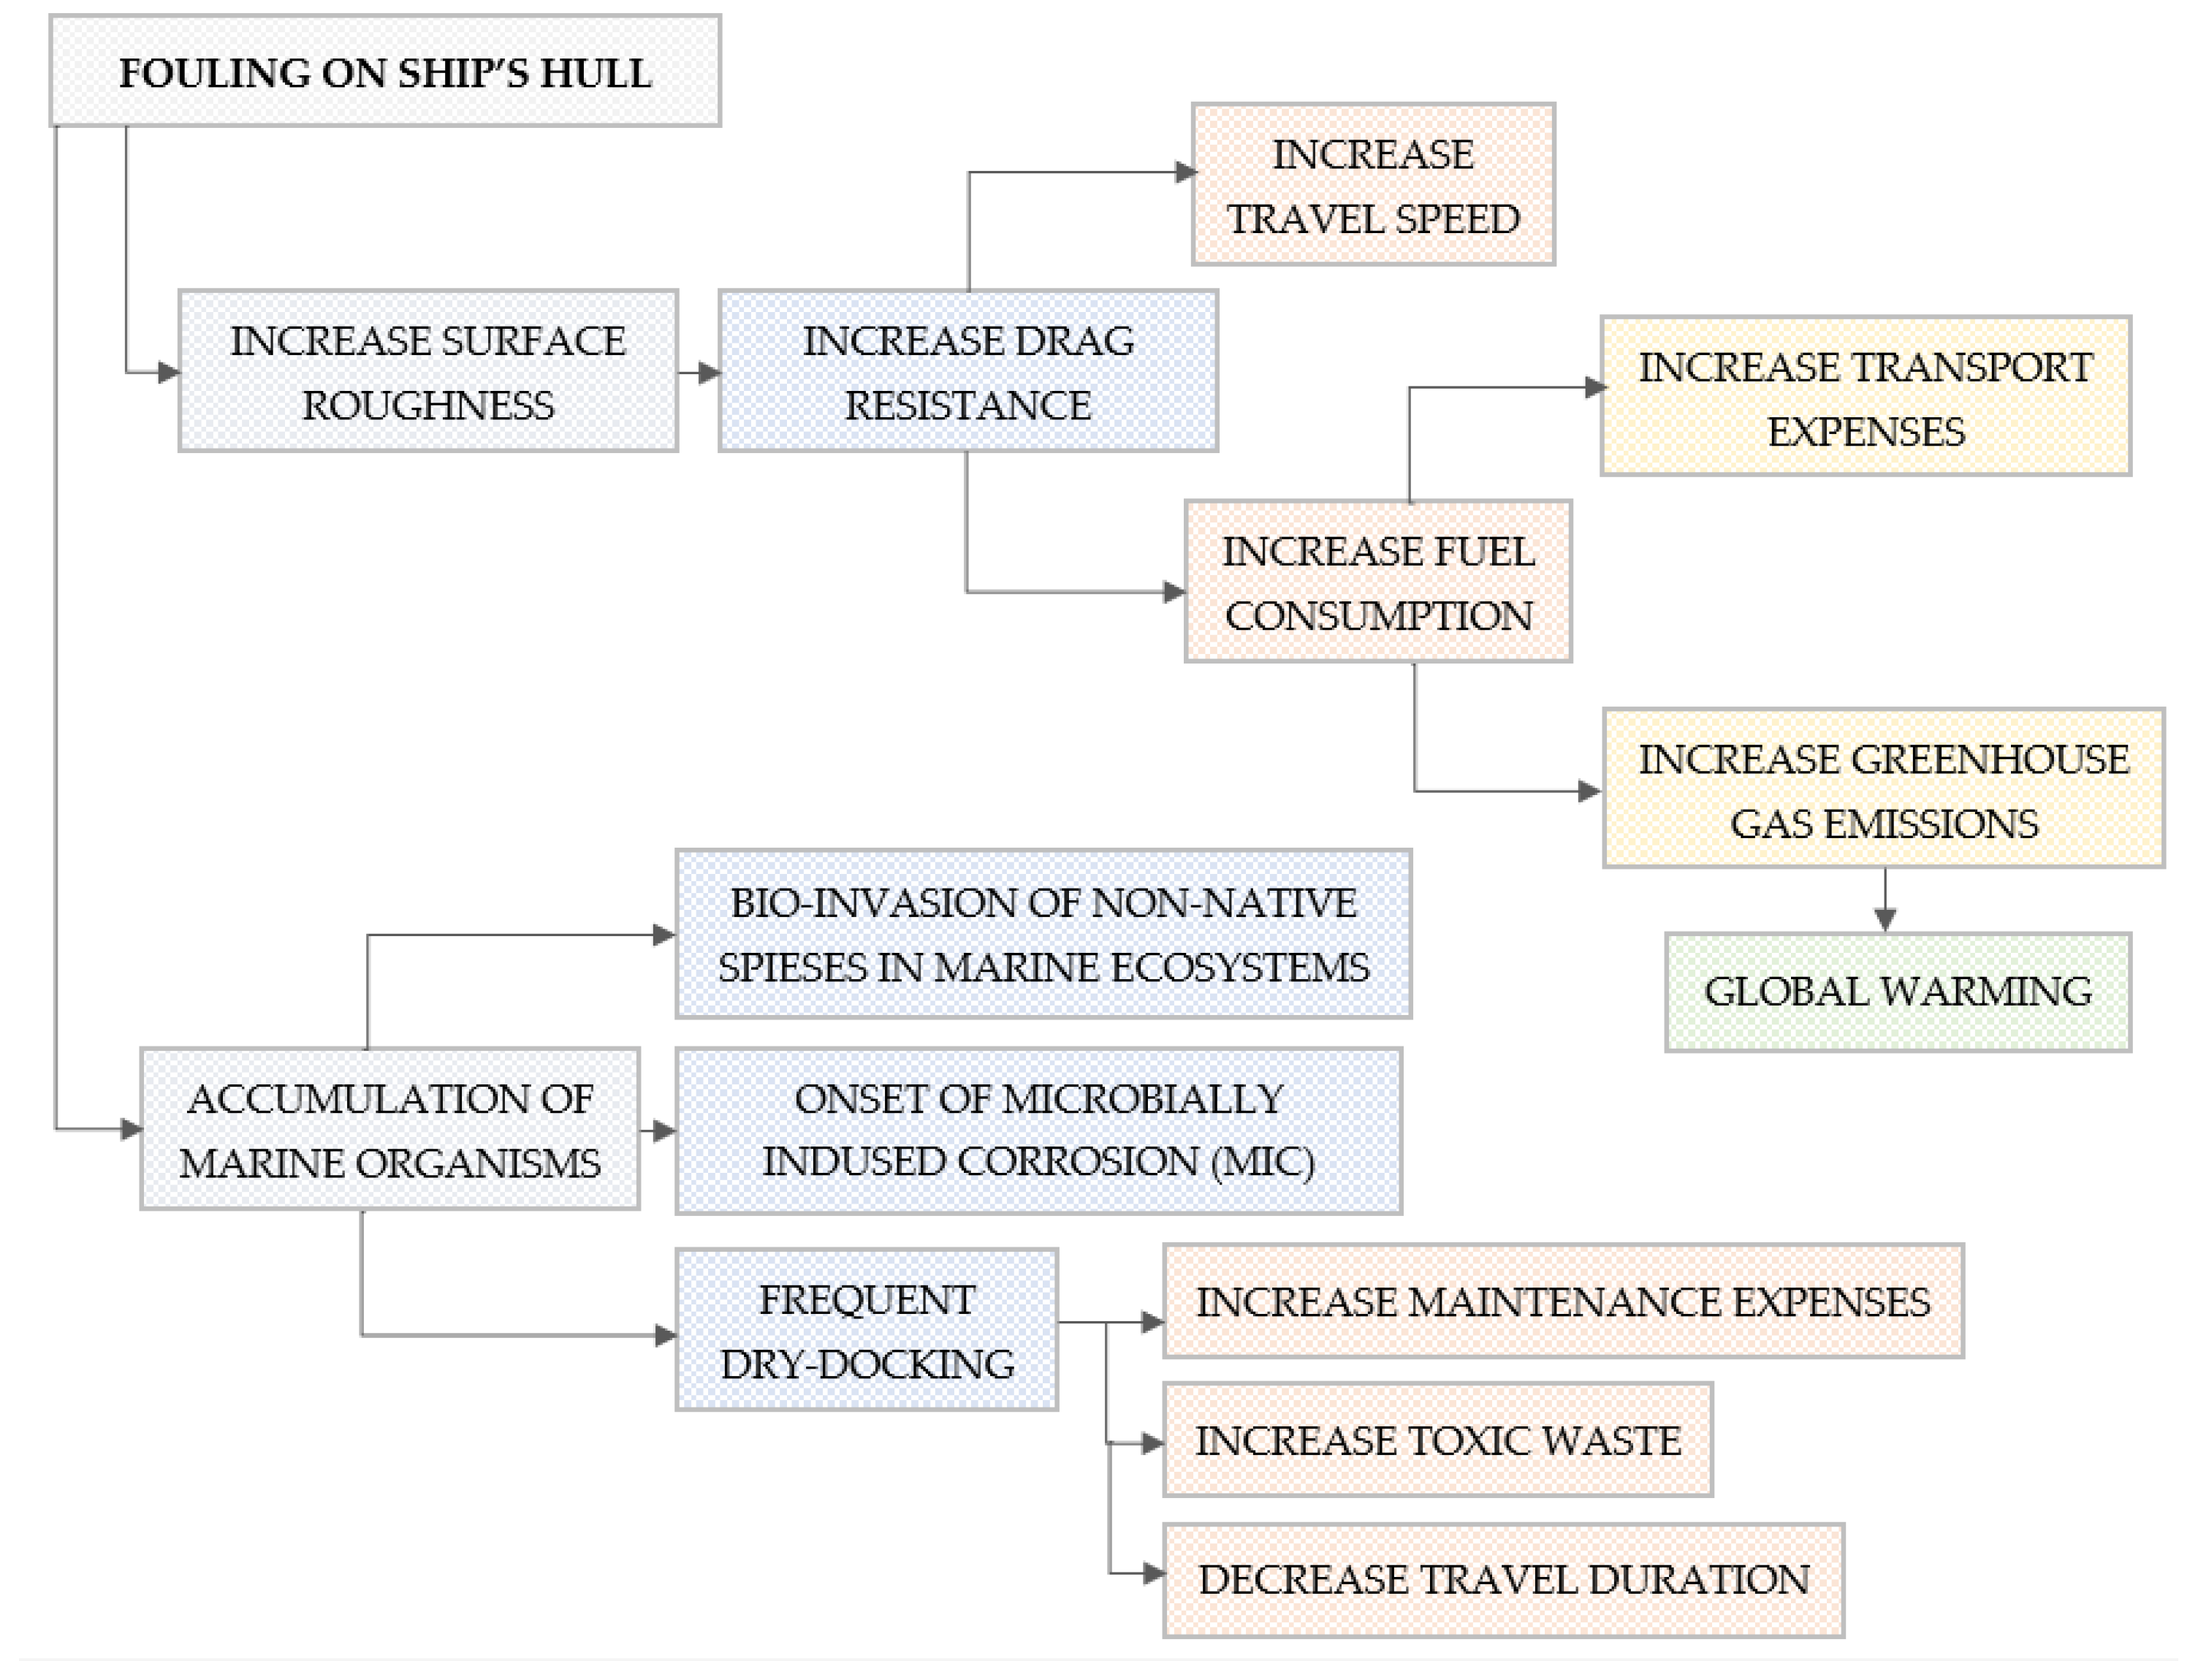
Protecting a submerged surface from marine biofouling has been essential since antiquity and is relevant today [2,3,9,10,11,12,13,14,15,16,17,18]. Although the criteria for an optional antifouling coating have differed across historical periods, the fundamental aspect of the operational effectiveness of an antifouling paint has remained consistent over time. Biological deposition of fouling onto surfaces, whether in motion or static in the marine environment, is linked to considerable impacts. Specifically, the biofouling of a ship’s hull has significant economic and environmental repercussions (Figure 1).

Figure 1.
Impact of biological contamination on ship hulls.
As illustrated in Figure 1, biofouling (marine organisms like algae, barnacles, and mussels) increases surface roughness [19,20], leading to greater hydrodynamic drag [21,22,23]. As a result, maintaining a steady ship speed may necessitate increased fuel consumption [24]. For big commercial vessels, this can result in annual fuel expenses ranging from hundreds of thousands to millions of dollars. Using more can cause higher greenhouse gas (CO2, NOX, and SOX) emissions [25]. Vessels lose speed due to fouling, which can affect schedules, reduce cargo throughput, and disrupt logistics chains, affecting operational efficiency [26].
In addition to an increase in operating costs, maintenance costs rise, as ships need to be dry-docked more often for hull cleaning and recoating [12,27,28]. Some antifouling paints release biocides (e.g., copper, zinc, organotins) which harm marine life because persistent chemicals accumulate in food chains and degrade water quality [29]. It is worth noting that underwater hull cleaning can release fouling organisms and paint particles, especially if carried out without containment [12,30].
Finally, hull fouling is a major vector for invasive marine species, often more impactful than ballast water. Invasive organisms disrupt local ecosystems, outcompete natives, and damage fisheries and aquaculture [31].
Table 2 delineates the principal antifouling technologies for ship hulls, categorized by historical periods, accompanied by a succinct discussion of each technology, along with its respective merits and disadvantages [2,3,10].
Table 2.
Temporal progression of antifouling technologies for ship hulls.
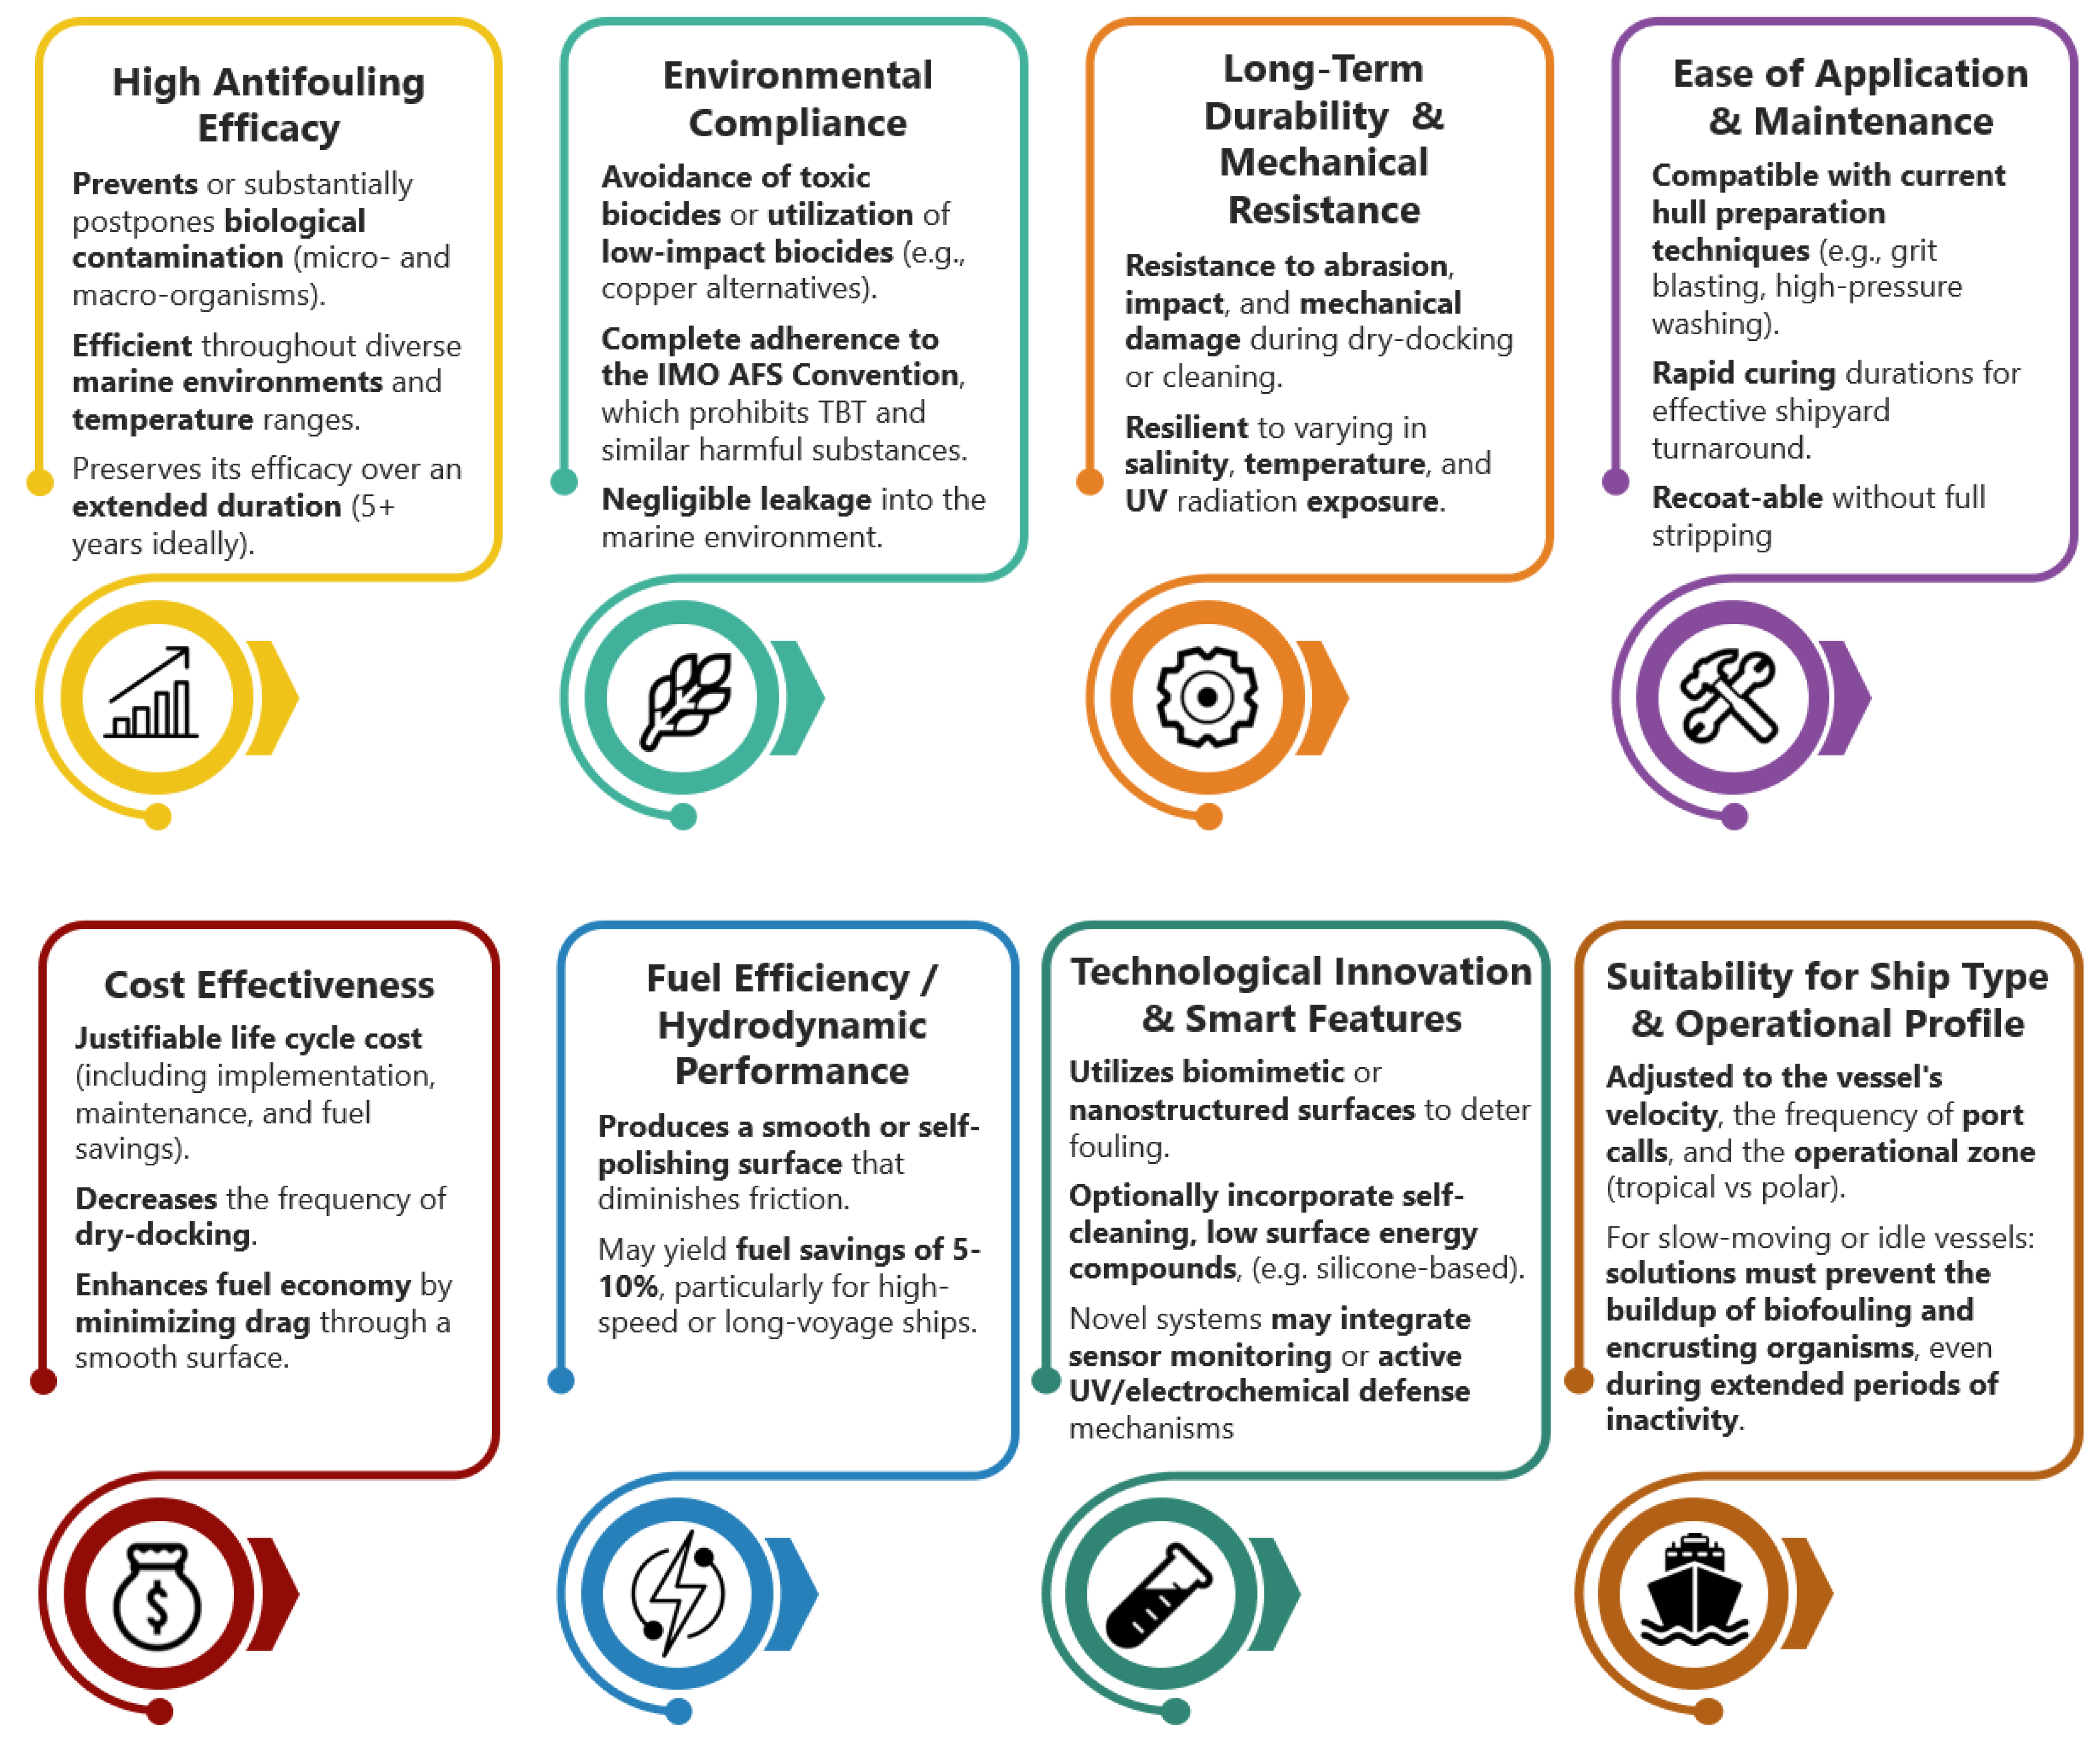
The transition from wooden to metallic materials in ship hulls, the implementation of environmentally sustainable regulations concerning the composition of hull coatings (such as the prohibition of TBT-based coatings), and contemporary operational performance standards have influenced the market and research into antifouling protection for ship hulls, necessitating the advancement of antifouling technologies that satisfy particular specifications and criteria (Figure 2) [12,50].
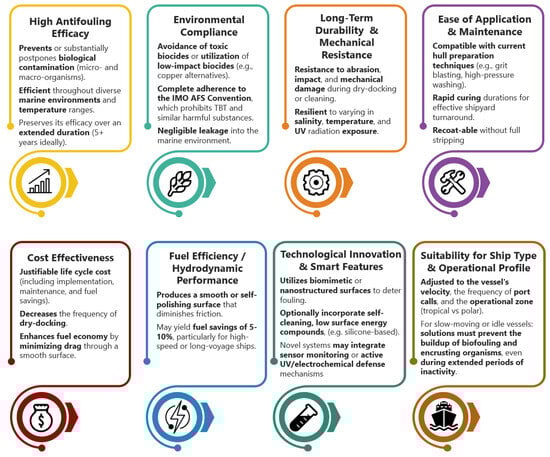
Figure 2.
Contemporary criteria for an optimal antifouling coating.
Since 2000 [2,15,17,32,34], there has been a transition from harmful substances to non-toxic, ‘smart’ surfaces and self-cleaning antifouling systems, which, while diminishing the environmental impact, elevate their costs and technological intricacy. This study develops a non-biocidal, fouling-resistant, and amphiphilic nanostructured antifouling coating. Table 2 classifies the coating as an advanced, multifunctional antifouling technology. This work also investigates the behavior of the antifouling coating under laboratory and real-time static immersion conditions, in light of the urgent need to combat biofouling and the scientific community’s requirement for comprehensive research to develop new, effective, and environmentally sustainable antifouling coatings for ship hulls.
To achieve this objective, naval steel samples were coated with an antifouling coating and underwent laboratory immersion tests in artificial seawater (ASW), as well as static exposure in a location within Greek waters. The laboratory immersion tests in ASW were conducted for 30 days, whereas field immersion tests in natural seawater were executed over a 6-month period. At various time intervals, the immersed samples were extracted, and the mass variations in the samples submerged in artificial seawater were measured. Additionally, the efficacy of the coating was assessed through visual inspection of the in situ immersed panels. This study aimed to assess the corrosion resistance and antifouling performance of the AF coating.
2. Materials and Methods
2.1. Coating Preparation
2.1.1. Synthesis of Magnetite (Fe3O4) Nanoparticles (Comp. A)
Iron pentacarbonyl (Fe(CO)5) was introduced into a hexane solution within a glass flask at a volume ratio of 8:1. The flask was sealed and heated to 50 °C for 2 h to synthesize iron ene-acarbonyl (Fe2(CO)9) at the bottom. After the hexane evaporated, exposure to sunlight over three days produced a brown Fe2(CO)9 precipitate. Fe2(CO)9 served as an iron precursor for the creation of magnetite nanoparticles via its complexation with β-cyclodextrin (β-CD). Precisely, 100 mg of Fe2(CO)9 was dissolved in 5 mL of ethanol in a dry flask, with gentle stirring to prevent decomposition. In a separate flask, 500 mg of β-CD was dissolved in 25 mL of warm distilled water (40 °C) with continuous stirring until the solution clarified. The Fe2(CO)9/ethanol solution was gradually introduced dropwise into the aqueous β-CD solution. The complexation reaction was conducted under continuous agitation at approximately 40 °C for a duration of 2 to 3 h. To improve the host–guest interaction, the mixture was subjected to sonication for 30 min. The resultant system, following suitable purification to eliminate contaminants and any residual un-complexed β-CD from the prior complexation process, was filtered and dried. A clean, complexed system was introduced into a 250 mL three-necked spherical flask containing 1.2 mL of dodecanediol and heated to 100 °C while stirring for 30 min. Following the addition of 2.88 mL of oleic acid, the solution was subjected to reflux for one hour. The solution’s color progressively turned black. Subsequent to the flow-through operation, the system was cooled to ambient temperature, and the synthesized nanoparticles were flocculated and precipitated with the addition of ethanol, which promotes aggregation and enhances the precipitation of the resultant magnetite (γ-Fe2O3) nanoparticles. The magnetic nanoparticles were retrieved from the spherical flask using a powerful permanent magnet and subsequently rinsed multiple times with an ethanol solution. Subsequent to collection, the nanoparticles were dispersed in hexane.
Figure 3 depicts the basic stages involved in the preparation of the magnetic nanoparticles, as discussed above.
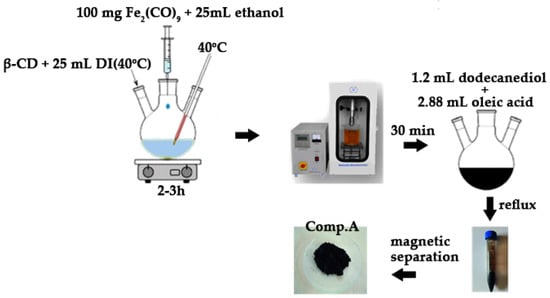
Figure 3.
Visual flowchart of magnetite (Comp. A) synthesis.
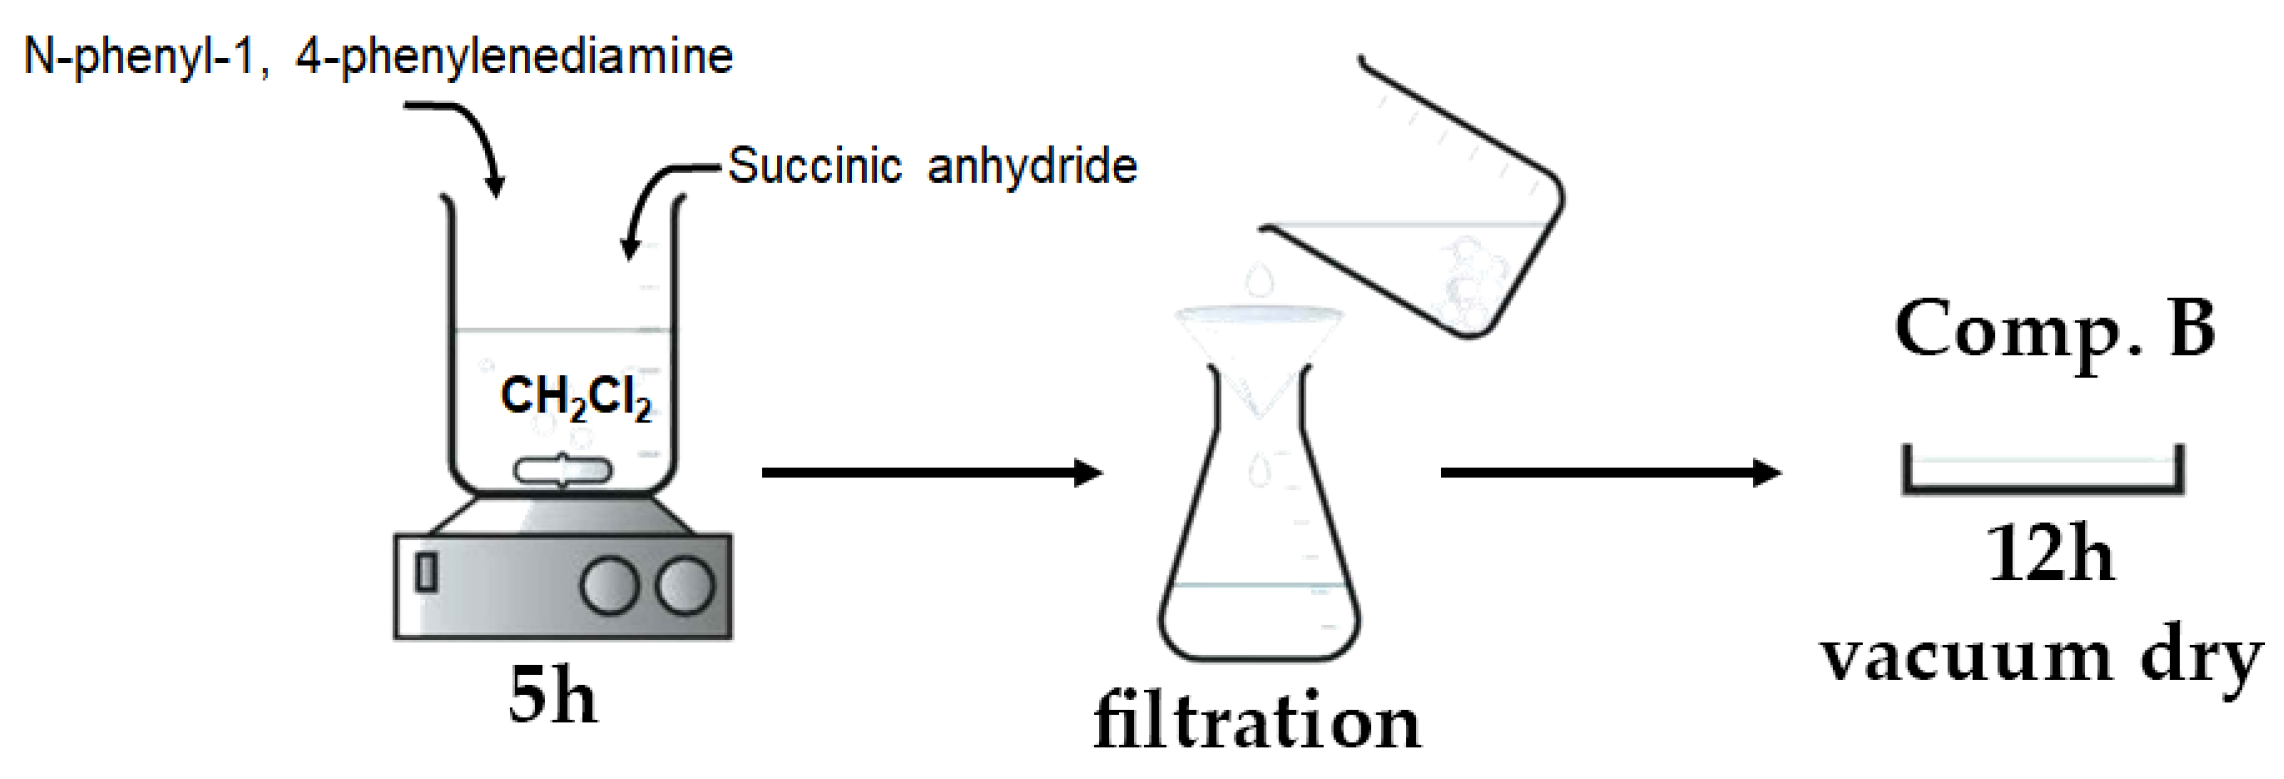
2.1.2. Synthesis of the Aniline–Carboxylic Acid Dimer (C6H5NH2-COOH Dimer) (Comp. B)
A total of 50 mL of dichloromethane (CH2Cl2) was introduced into a 100 mL three-necked round-bottom flask. Subsequently, 0.9 g of N-phenyl-1,4-phenylenediamine (C6H5NHC6H4NH2) and 0.5 g of succinic anhydride ((CH2CO)2O) were introduced into the flask at ambient temperature while maintaining continuous stirring. Stirring persisted until a pale gray precipitate was generated (about 5 h). Following the filtration of the solution, the precipitate was rinsed with diethyl ether until the filtrate turned colorless. The product underwent vacuum drying for 12 h at ambient temperature.
Figure 4 depicts the basic stages involved in the preparation of the aniline–carboxylic acid dimer, as discussed above.
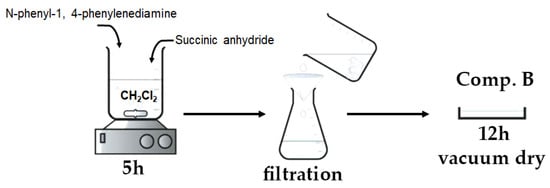
Figure 4.
Visual flowchart of aniline–carboxylic acid dimer synthesis.
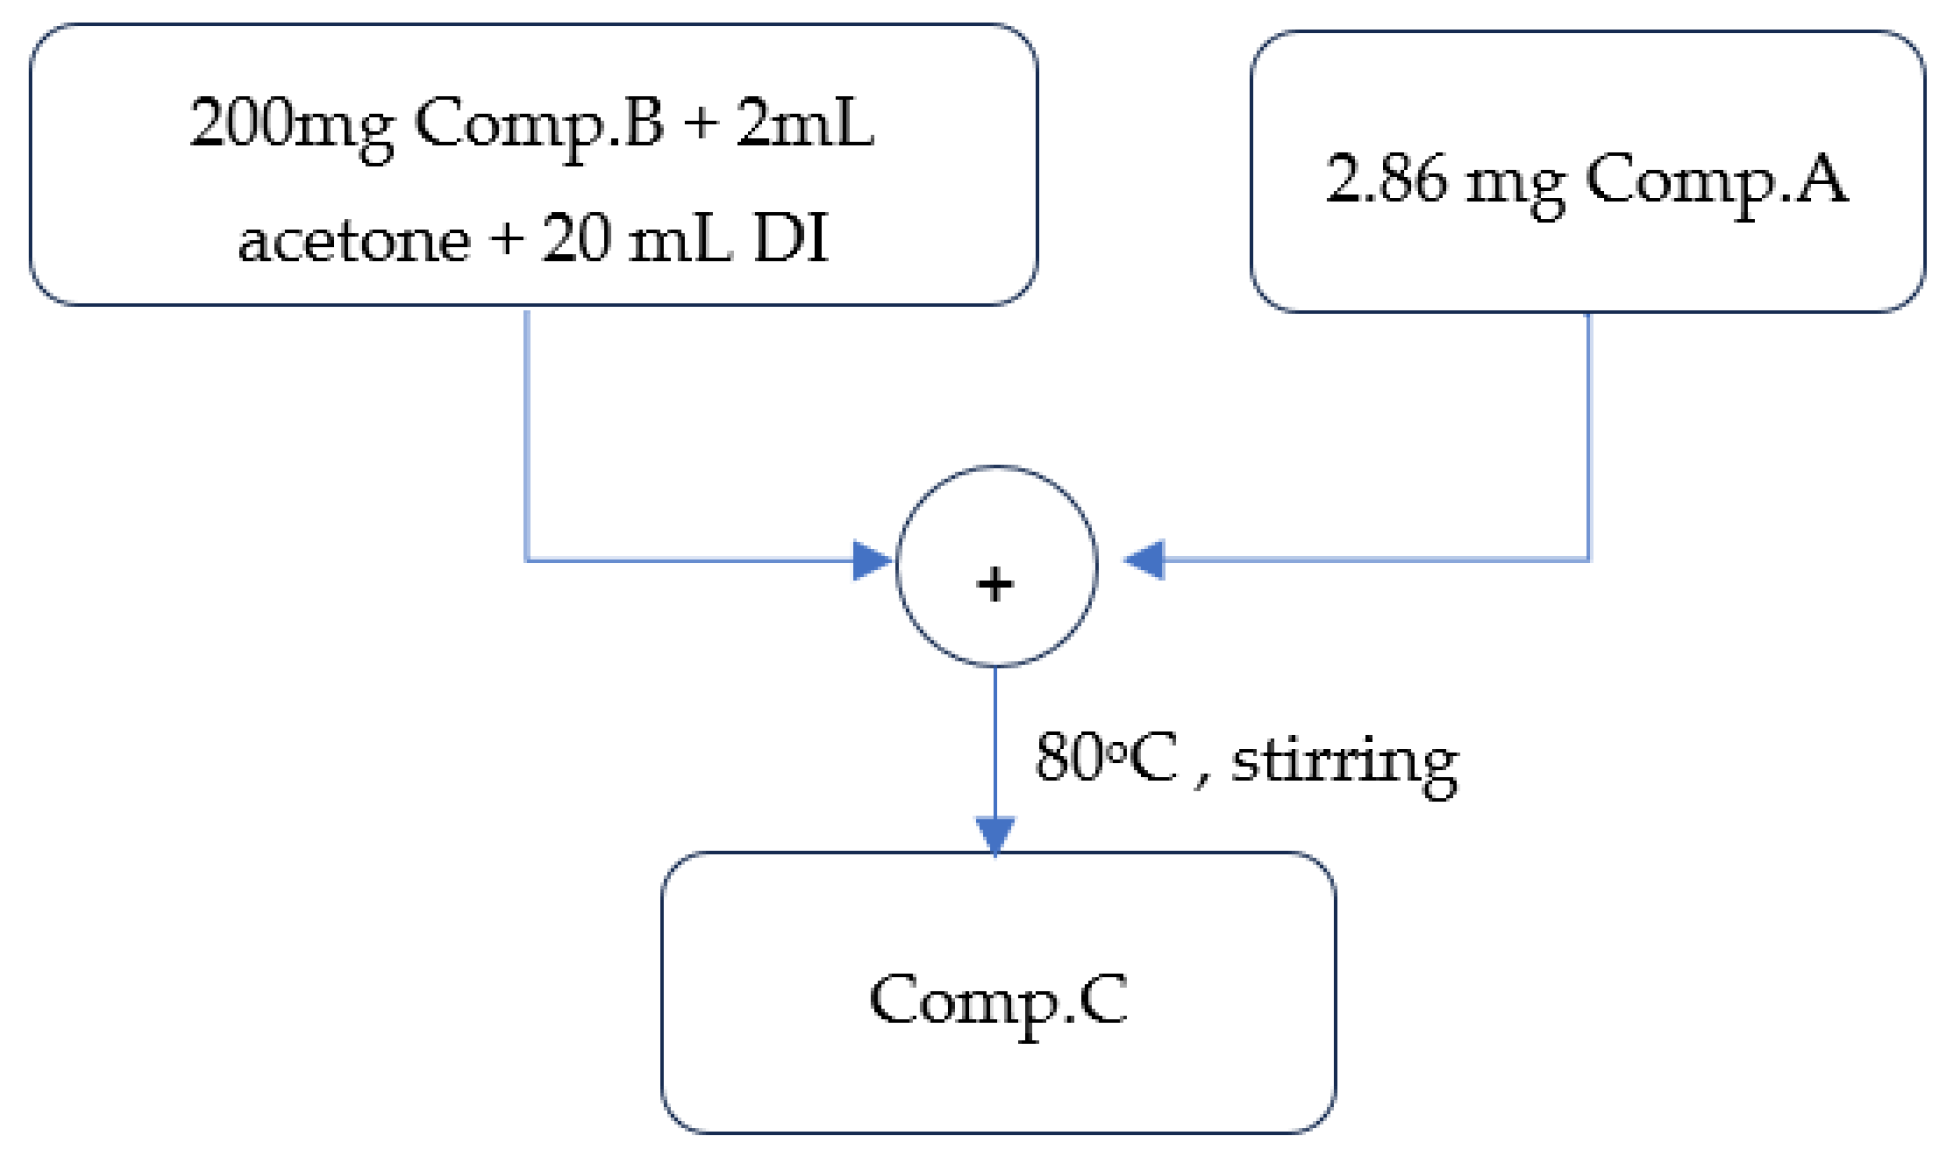
2.1.3. Synthesis of the Aniline–Magnetite Monomer (Comp. C)
A total of 200 mg of Comp. B was solubilized in 2 mL of acetone and 20 mL of water. To this solution, 2.86 mg of Comp. A was incorporated under continuous vigorous stirring at 80 °C for approximately 1 h. The stable suspension was gradually cooled to ambient temperature and subsequently cleaned with acetone and ethanol in succession.
Figure 5 depicts the basic stages involved in the preparation of the aniline–magnetite monomer, as discussed above.
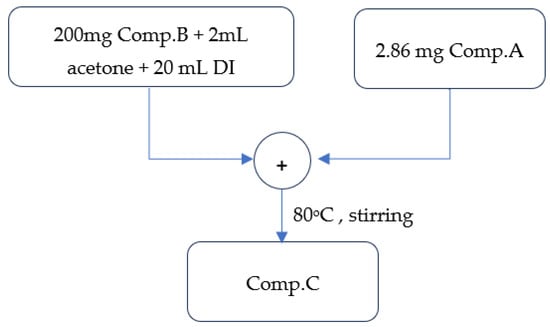
Figure 5.
Visual flowchart of aniline–magnetite monomer synthesis.
2.1.4. Synthesis of Polyaniline (PAni) Nanorods Integrated with Magnetite (Fe3O4) Nanoparticles (Comp. D)
A total of 40 mL of 0.1 M HCl solution was introduced into a 100 mL beaker, followed by the dispersion of 500 mg of Comp. C, while the solution was continuously stirred at 0 °C. Then, 500 mg of aniline was added to the aforementioned suspension. An acid solution containing 122 mg of ammonium persulfate (APS) in 40 mL of 0.1 M HCl was added dropwise to the system over 10 min; the mixture was agitated for 4 h, and the resultant precipitate was filtered. The precipitate was sequentially washed three times with distilled water and methanol. The items underwent vacuum drying at 50 °C for 24 h.
Figure 6 depicts the basic stages involved in the preparation of PAni/Fe3O4 nanocomposite, as discussed above.
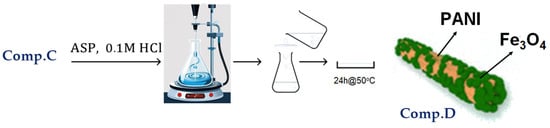
Figure 6.
Visual flowchart of PAni/Fe3O4 nanocomposite synthesis.
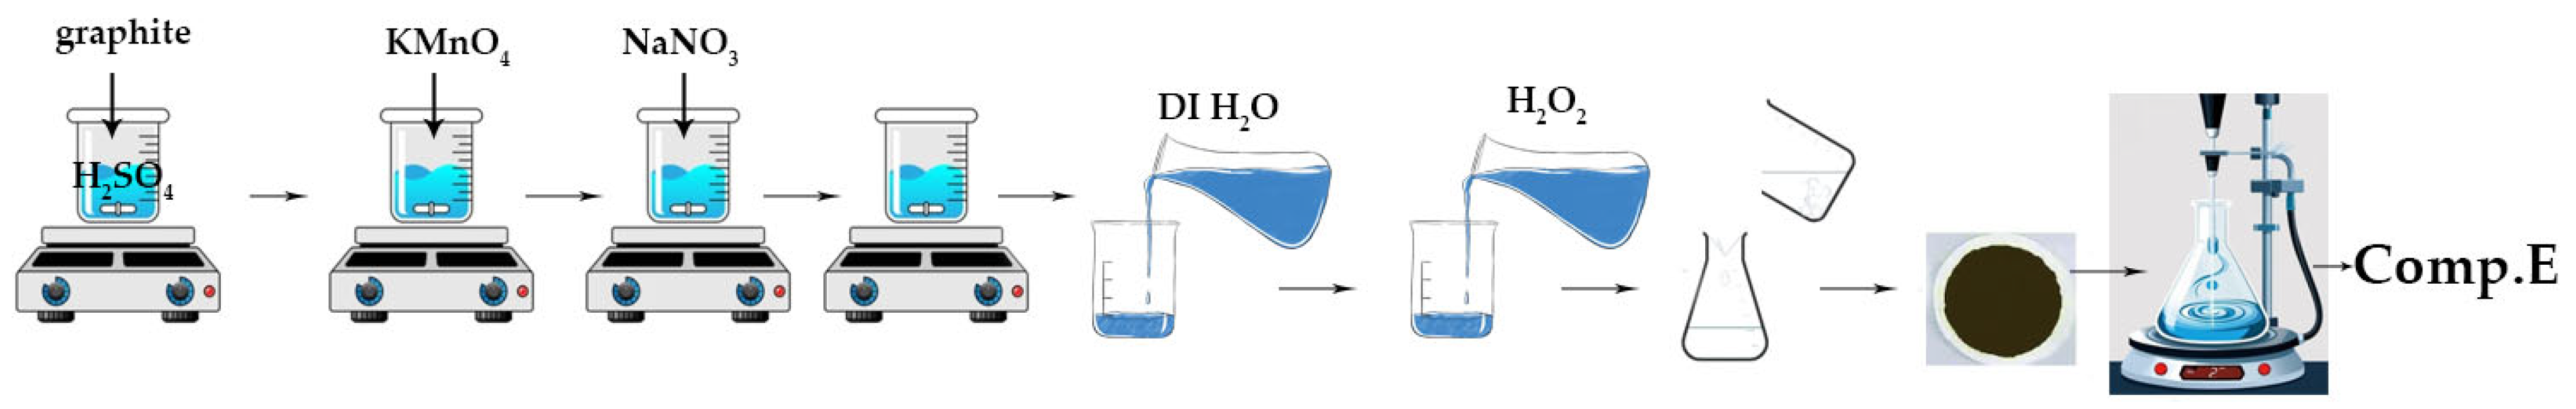
2.1.5. Synthesis of Graphene Oxide (GO) Sheets (Comp. Ε)
A 1000 mL volumetric flask holding 50 mL of 98% H2SO4 was combined with graphite flakes and NaNO3 at a 1:1 weight ratio. The mixture was maintained in an ice bath at 0–2 °C with constant stirring for 30 min. After 30 min, 6 g of KMnO4 was introduced meticulously and gradually to maintain the reaction temperature below 15 °C. The ice bath was eliminated, and the mixture was stirred at 40 °C. The mixture was stirred for 48 h to provide a viscous brown paste, which was subsequently diluted through the gradual addition of 100 mL of water in a dropwise manner. The reaction temperature was elevated to 100 °C, and an additional 210 mL of water was incorporated into the solution while maintaining continuous stirring to dilute the mixture further. Ultimately, 12 mL of H2O2 was included to produce a yellow solution. The combination underwent purification using washing and centrifugation with 10% HCl and deionized water, respectively, for ten consecutive cycles.
Figure 7 depicts the basic stages involved in the preparation of GO, as discussed above.
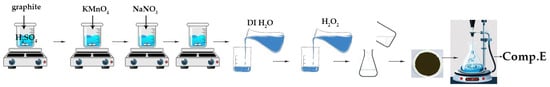
Figure 7.
Visual flowchart of graphene oxide synthesis.
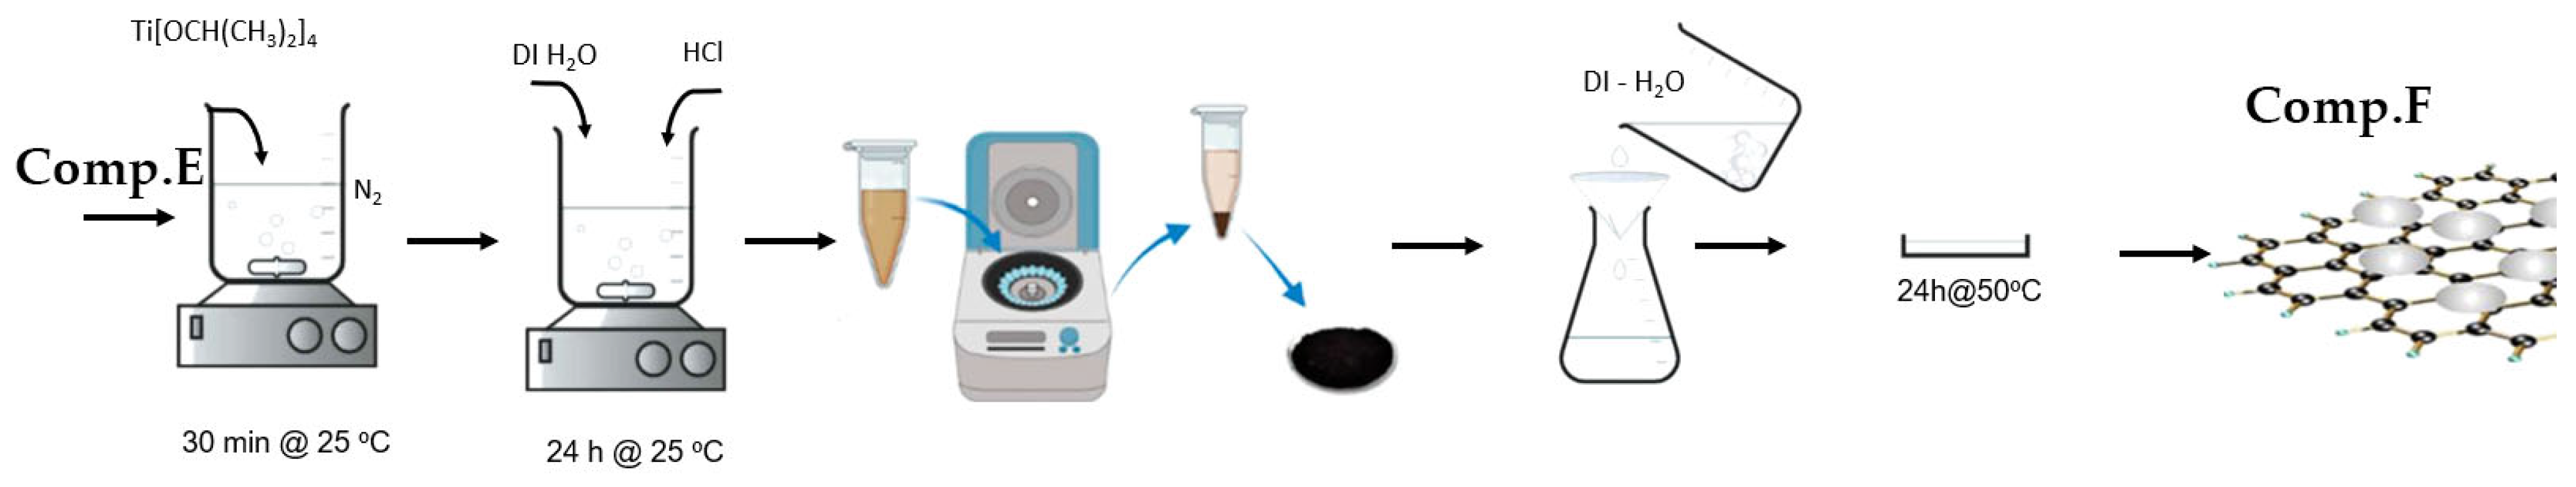
2.1.6. Modified Graphene Oxide (GO) Sheets with Titania (TiO2) (Comp. F)
Briefly, 9 mg of Comp. E was disseminated into 60 mL of ethanol via ultrasonication for 60 min. After 1 h, 1.5 mL of Ti[OCH(CH3)2]4 was included. The amalgamation was stirred at ambient temperature for 30 min. Subsequently, 15 mL of distilled water and 0.5 mL of 1 M HCl were incrementally added, and the solution was agitated in a nitrogen atmosphere for 24 h at ambient temperature. The product underwent centrifugation and was subsequently cleaned with distilled water to eliminate any residues. The nanocomposite was subsequently dried at 80 °C in a convection oven.
Figure 8 depicts the basic stages involved in the preparation of the GO/TiO2 nanocomposite, as discussed above.
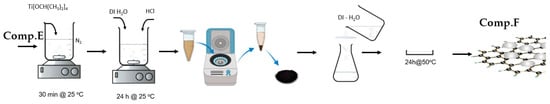
Figure 8.
Visual flowchart of GO/TiO2 nanocomposite synthesis.
2.1.7. Synthesis of the Antifouling Coating (AF Coating)
The final formulation of the suggested antifouling coating includes a 1:2 ratio mixture of Comp. D and Comp. F in water-soluble resin (nonionic poly ethylene oxide, PEO), along with the incorporation of additives.
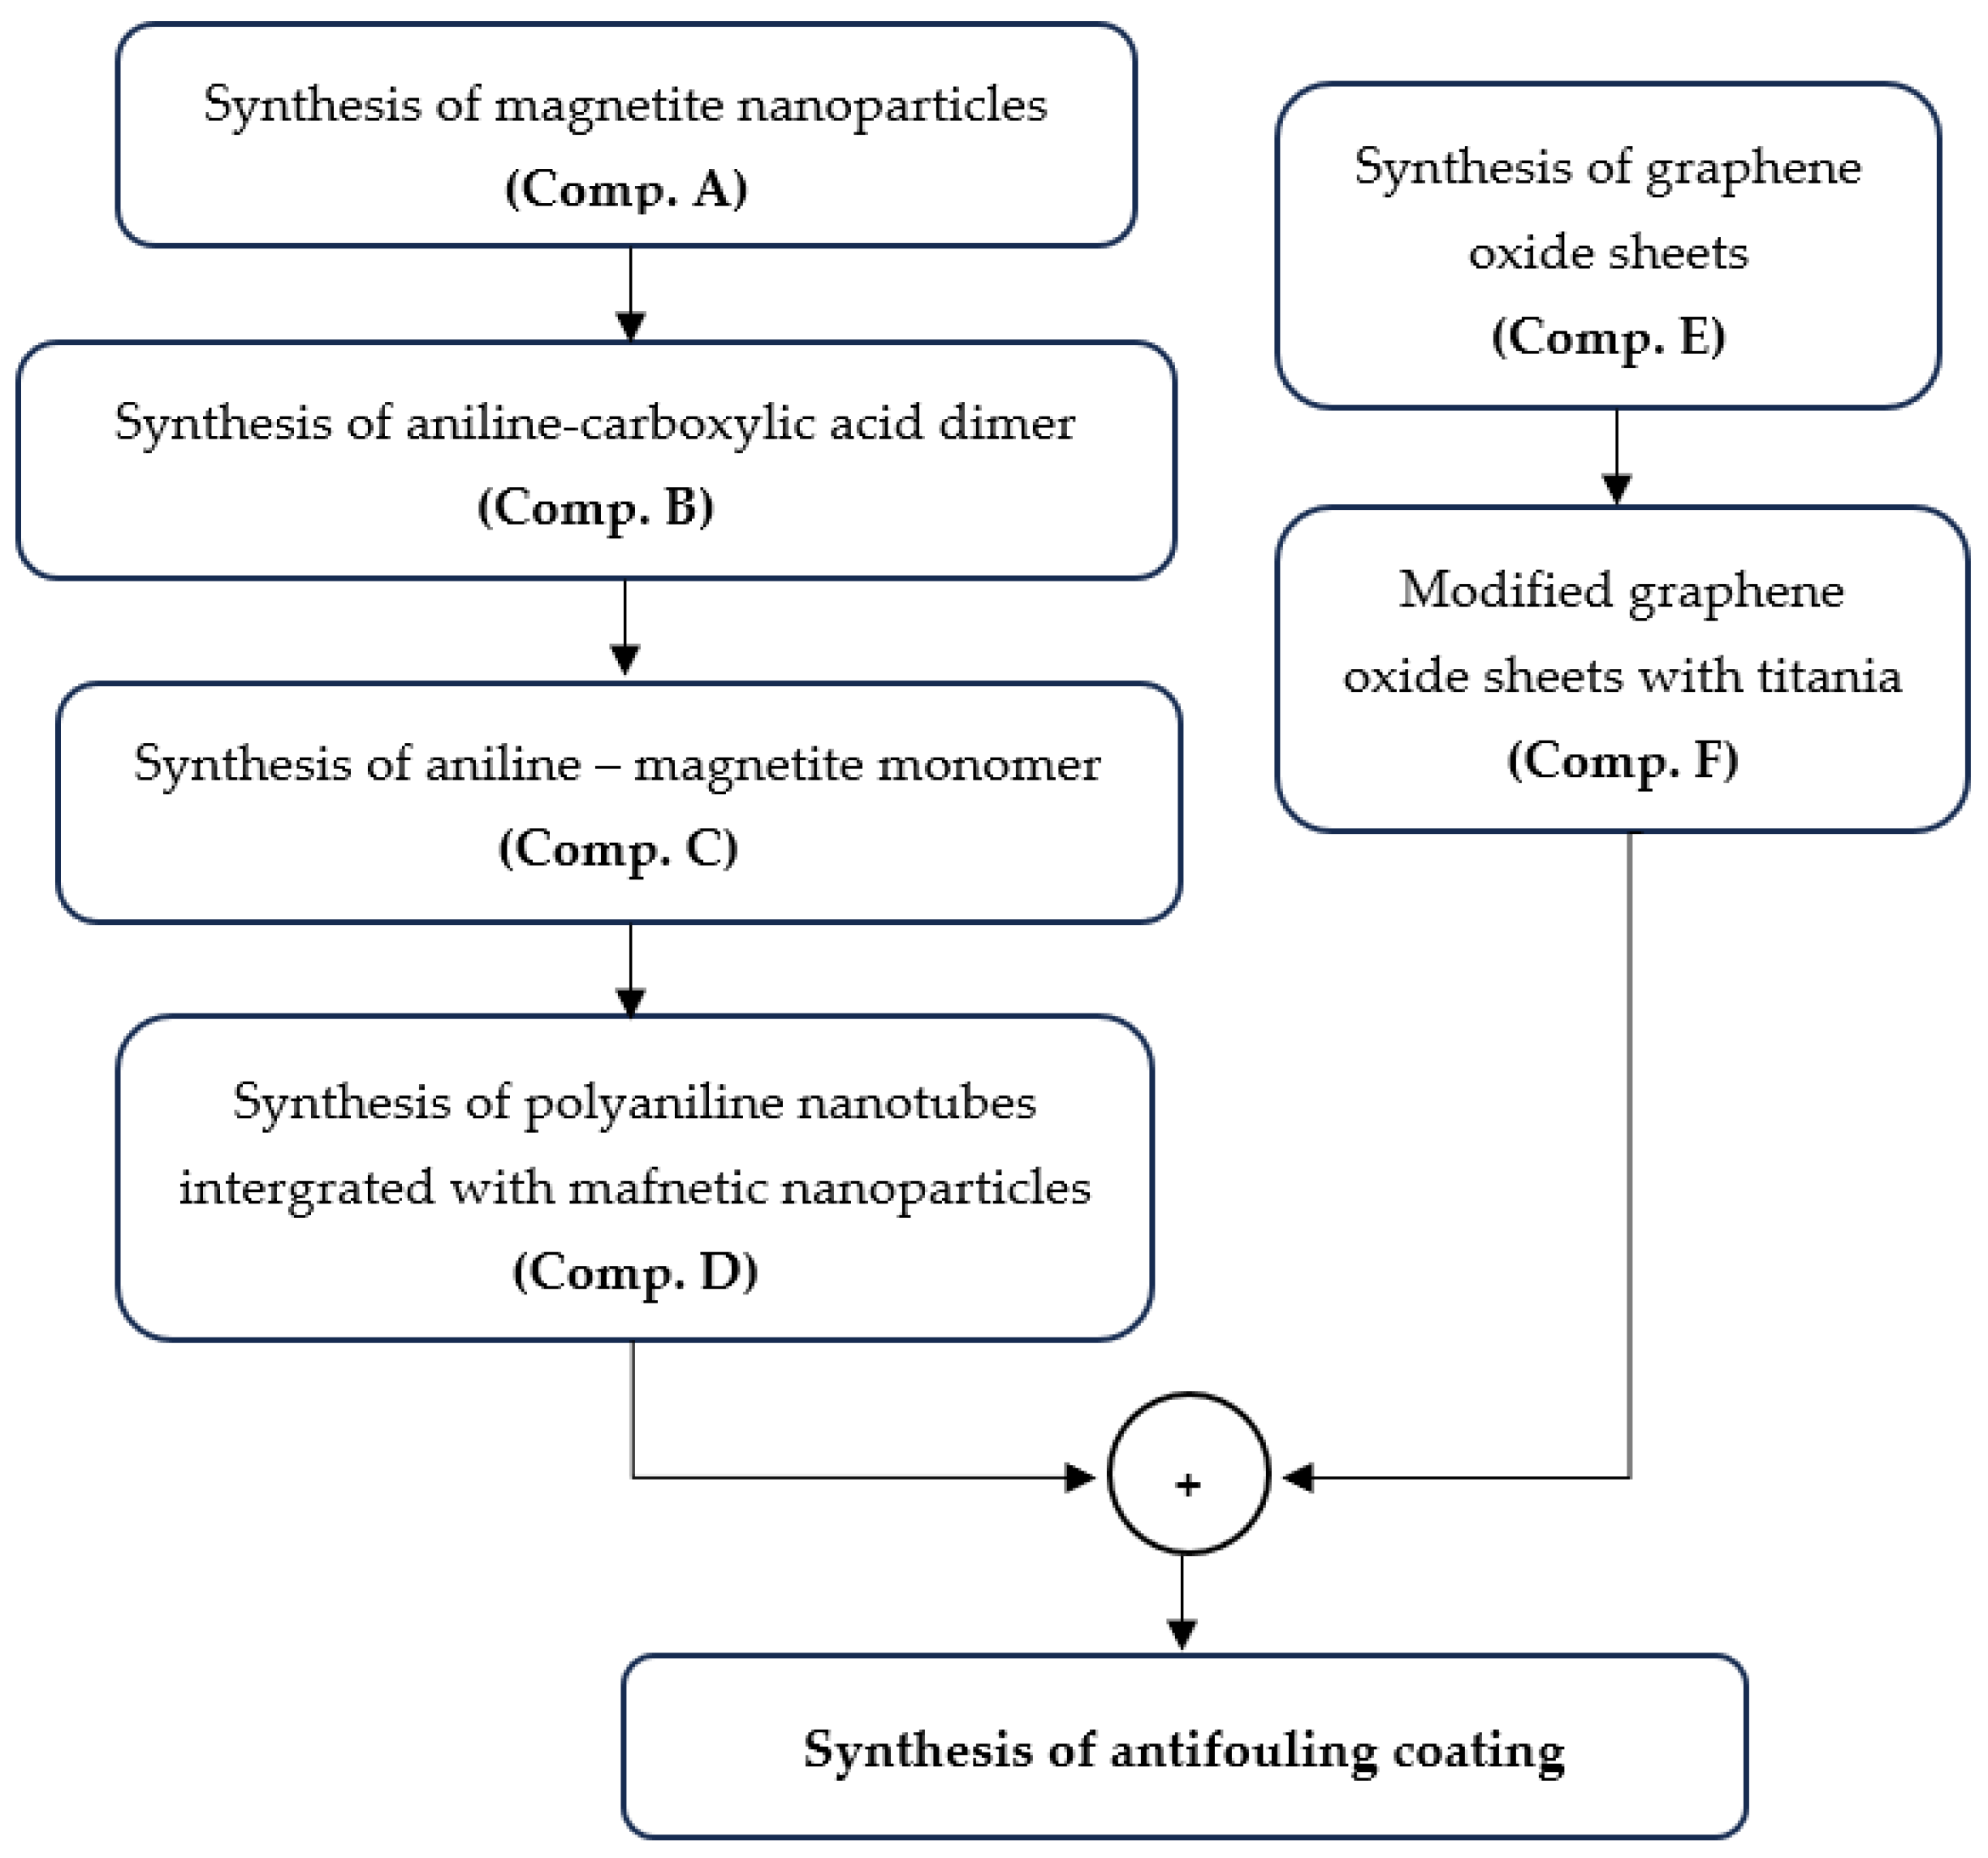
Figure 9 illustrates a simplified flowchart of the synthesis process for the antifouling coating.
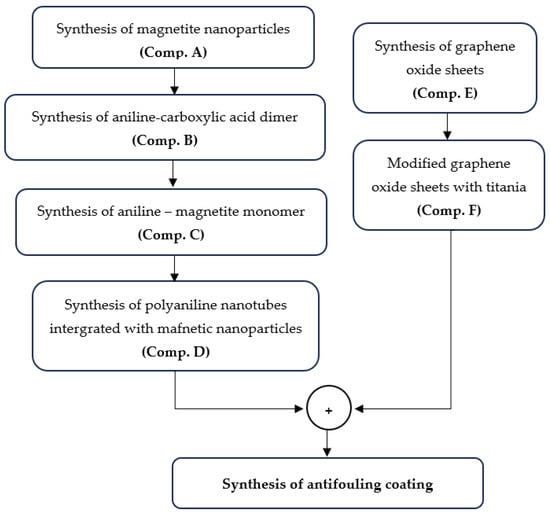
Figure 9.
A simplified flowchart of the synthesis process for the antifouling coating.
2.2. Characterization of the Coating
Various analytical techniques were applied to examining the microstructure, chemical composition, and physical properties of the antifouling coatings. To examine the morphological and elemental characteristics of the produced synthesized PAni/Fe3O4 and GO/TiO2 nanocomposites, a JEOL JSM-6490LV scanning electron microscope (SEM, JEOL, Tokyo, Japan) was utilized. Bright-field pictures were acquired using a JEOL 2100 HR Transmission Electron Microscope (TEM, JEOL, Tokyo, Japan) at an accelerating voltage of 80 kV. The spectroscopic analysis of the samples was conducted utilizing Fourier Transform Infrared Spectroscopy (FTIR) on Bruker 27 IR equipment (Bruker, Athens, Greece). The conductivity of the antifouling coating was assessed using an Atomic Force Microscope (AFM, Zurich Instrument, Zurich, Switzerland) fitted with an extended Tunneling Atomic Force Microscopy (TUNA) module.
2.3. Panel Preparation
In this study, coupons of AH36 naval steel were used for the corrosion tests, and the elemental content of the material was evaluated using the X-Ray Fluorescence (XRF) technique (Malvern Panalytical GmbH, Kassel, Germany). The results are presented in Table 3.
Table 3.
The chemical composition of the naval steel coupons used during laboratory corrosion tests.
Samples of naval steel (AH36) measuring 10L cm × 20W cm and 2 mm in thickness were lightly sanded and subsequently cleaned with deionized water and ethanol. Subsequently, two layers of AF paint were manually applied to them, omitting any primer coating. After the application of the AF paint, the samples were dried at ambient temperature.
The coated naval steel samples underwent laboratory immersion testing in artificial seawater (ASW) and static exposure at a location in Greek waters. The laboratory immersion testing in artificial saltwater was conducted for 30 days, while the in situ immersion tests in natural seawater were carried out throughout a 6-month field study. Measurements of the mass changes in the samples submerged in artificial seawater were performed at intervals of 0, 1, 5, 10, 20, and 30 days. Visual inspections of the in situ submerged panels were performed at intervals of 0.5, 1, 2, 3, 4, 5, and 6 months to evaluate the efficacy of the coating.
2.4. Laboratory Immersion Tests in Artificial Seawater
2.4.1. Corrosion Tests
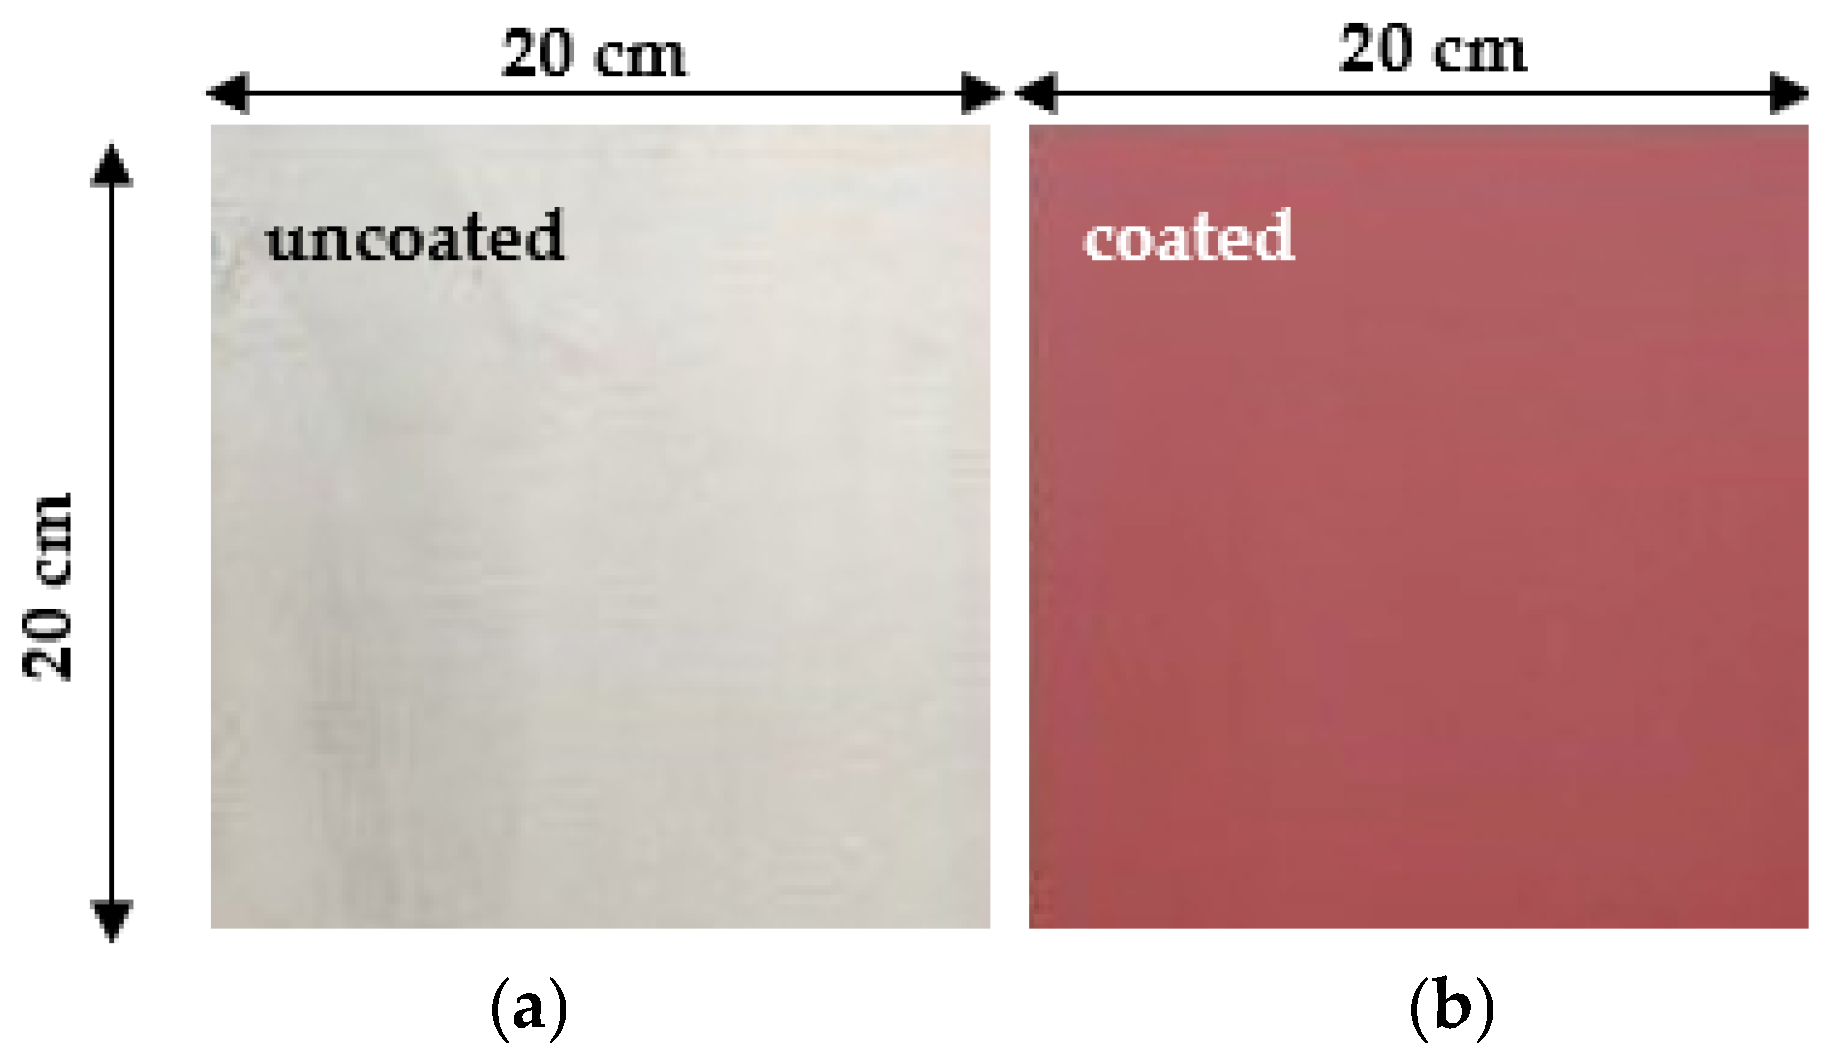
This work examines corrosion testing of uncoated (Figure 10a) and coated (Figure 10b) naval steel specimens under static immersion in artificial seawater (ASW). A total of 10 coupons (5 uncoated and 5 coated samples) were created for the laboratory immersion testing, with the particular dimensions indicated in Figure 10. Prior to the corrosion test, the surface of the coated and uncoated naval steel samples was cleaned to remove any oxidizing substances and contaminants. Each specimen was subsequently weighed thrice using an analytical scale, and the mean of the three weights was recorded as the specimen’s weight prior to corrosion (Wi in g).
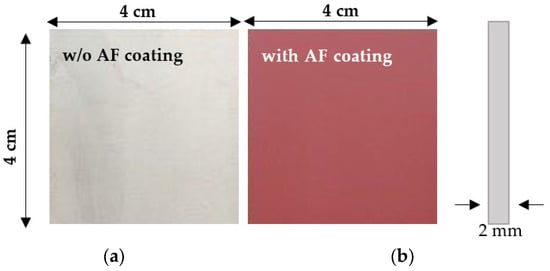
Figure 10.
Samples of naval steel (a) before and (b) after coating with the antifouling coating.
The artificial seawater (ASW) utilized in the experiment was prepared in accordance with ASTM D1141-52 [51]. The chemical composition of the synthesized ASW complied with the specifications detailed in Table 4.
Table 4.
The chemical composition of the artificial seawater.
Specimens were categorized based on their immersion durations in the ASW, assigned numbers, and thereafter organized into groups within containers containing ASW. Five containers of ASW were employed, each containing identical volumes and compositions of ASW. Each container contained two steel coupons (one uncoated and one coated coupon) submerged for different durations—1, 5, 10, 20, and 30 days—resulting in five experimental groups. The specifics of the laboratory immersion experiments in ASW are listed in Table 5.
Table 5.
The details of the laboratory corrosion tests.
2.4.2. Characterization Methods for Immersed Samples in ASW
Upon the completion of the immersion period for the samples in each group (one coated and one uncoated) in the ASW, they were meticulously removed from their containers. The corrosion product morphology of the specimens was examined using the SEM, without the removal of the corrosion products. Each specimen was subsequently cleansed of the corrosion products and weighed thrice; the mean of these three weights was recorded as the weight of the specimen post-corrosion (Wf in g).
The disparity between the initial (Wi) and final (Wf) weights can be utilized to ascertain the weight loss ratio (WL), a quantitative approach to assessing corrosion [52]. The formula for determining WL is represented by Equation (1).
where WL (%) denotes the specimen’s percentage weight loss ratio, Wi represents the weight prior to corrosion (g), and Wf signifies the weight subsequent to corrosion (g).
The thickness reduction technique refers to the amount of thickness loss per unit surface area of a material during a given time period, which is commonly denoted by the corrosion rate (CR). The methodology for evaluating the corrosion rate using the weight variation in the examined sample is detailed elsewhere [53]. The CR can be calculated using the formula below:
where CR is the average corrosion rate (mm/year); A represents the surface area of the specimen undergoing corrosion (mm2); t signifies the time of the corrosion process (day); and ρ is the specimen’s density (7.85 g/cm3).
The water contact angles of the coated samples subjected to static laboratory immersion tests in ASW were evaluated using a contact angle goniometer (DSA 10-MK2). The coated samples were dried under ambient conditions prior to the measurements being performed. Deionized water was dropped onto distinct locations on the coated surface, and the contact angles were recorded at 30 s intervals over a duration of 180 s. The average values from three measurements were calculated and recorded.
2.5. In Situ Immersion Tests
2.5.1. Exposure Sites and Immersion Times
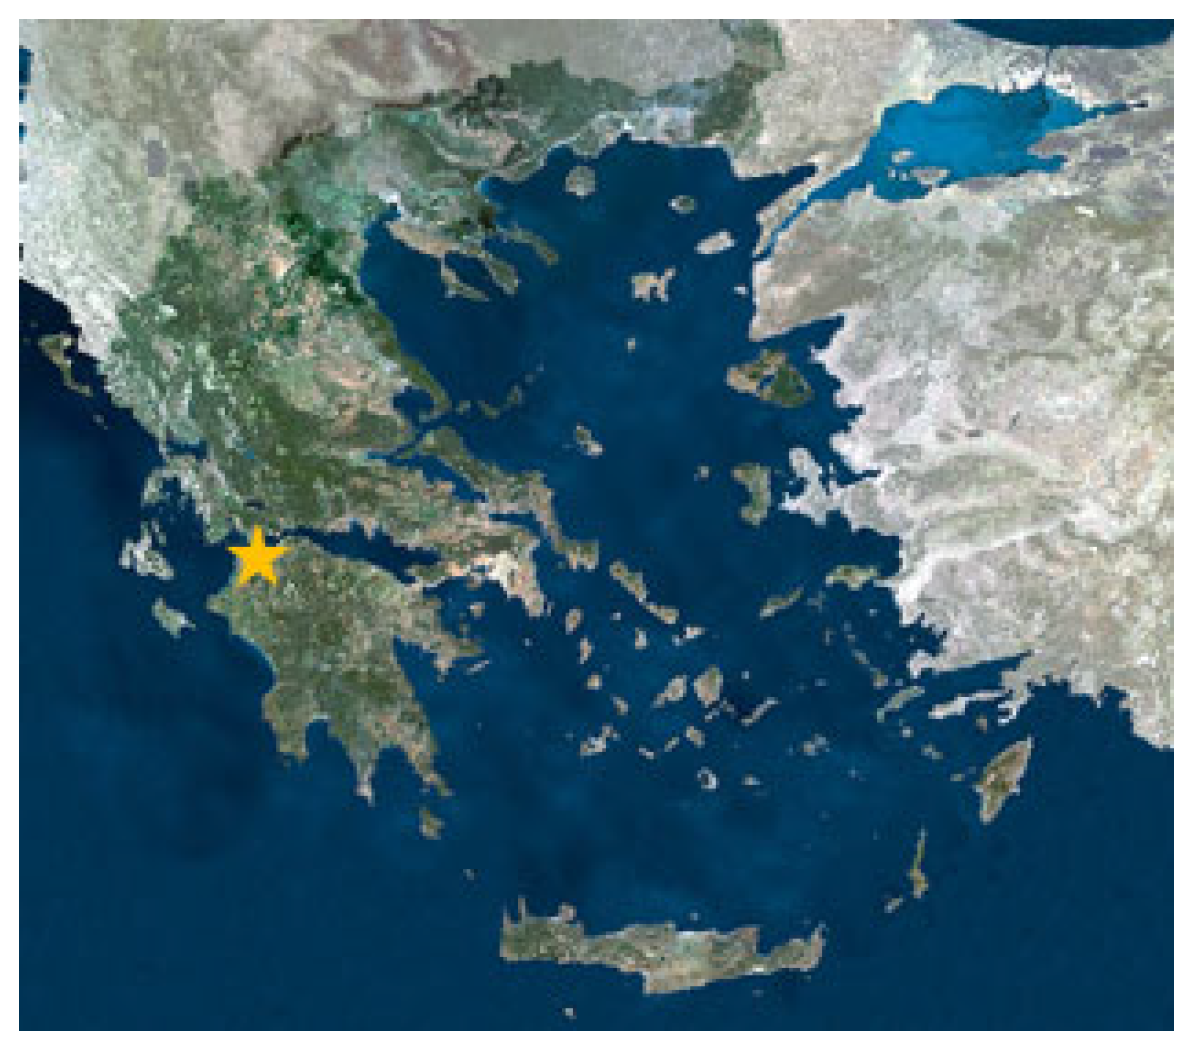
At the end of November 2024, one uncoated and seven coated steel samples with the dimensions shown in Figure 11 were submerged at a depth of roughly 1 m in natural seawater for varying immersion durations of 0.5, 1, 2, 3, 4, 5, and 6 months. The selected location was next to the coastlines of Patras (Figure 12).
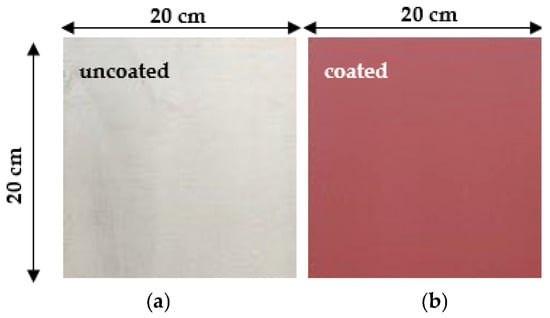
Figure 11.
The samples of naval steel (a) before and (b) after coating with the antifouling coating for in situ corrosion experiments.
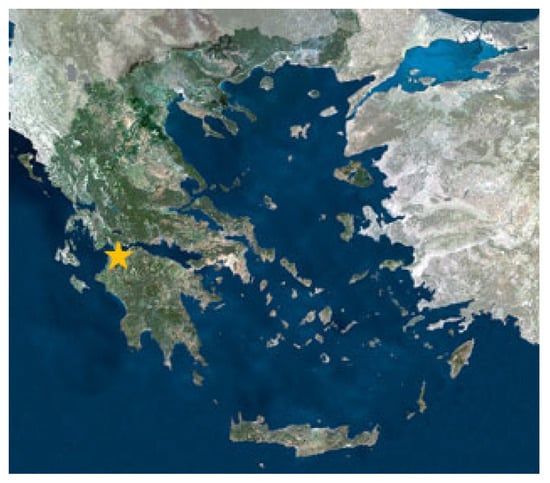
Figure 12.
A map of Greece showing the location selected for this study (yellow star points the position of Patra’s Sea).
2.5.2. Characterization Methods for Immersed Samples in Natural Sea Water
Visual inspection of the coated and uncoated samples, taking into account the effects of edge effects, resulted in the determination of the percentage of the exposed surface covered by foulants. This study used SEM images to estimate the micro- and macro-fouling percentages, integrating an image analysis with understanding the fouling types [54]. Image-Pro Analyzer was used to enhance contrast and minimize noise, in order to determine the area proportion of micro-fouling (tiny particles, biofilm texture) and macro-fouling (bigger structures) from the isolated fouling zone [55].
3. Results
3.1. Characterization of the Antifouling Coating
Figure 13 illustrates the FTIR spectra of the magnetite (Fe3O4) and the polyaniline/magnetite (PAni/Fe3O4) nanocomposite.
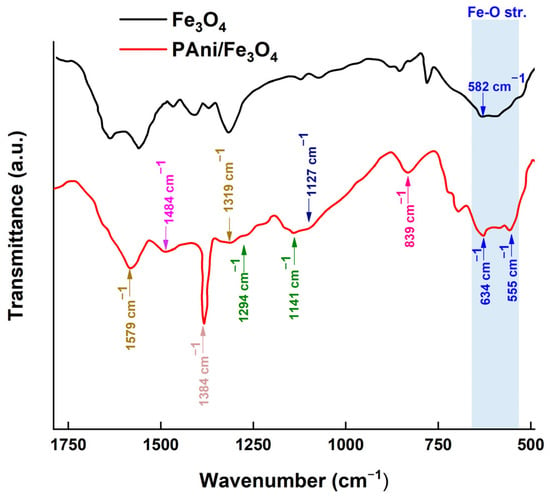
Figure 13.
The FTIR spectrum of the magnetite (Fe3O4) and polyaniline/magnetite (PANI/Fe3O4) nanocomposite.
Characteristic peaks of polyaniline are found at 1564–1571 cm−1 (C=C stretching of the quinoid rings), 1485–1477 cm−1 (C=C stretching of benzenoid rings), 1294–1300 cm−1 (C-N stretching vibrations), and 850–700 cm−1 (C-H out-of-plane bending vibrations of rings 1,4 and 1,2, respectively). The peaks at 839 cm−1, 1141 cm−1, 1294 cm−1, 1319 cm−1, 1384 cm−1, 1484 cm−1, and 1579 cm−1 are ascribed to the existence of polyaniline (PAni) within the nanocomposite. The peak at 839 cm−1 was specifically ascribed to the out-of-plane C-H deformation in the 1,4-benzoate ring (B). The peaks at 1141 cm−1 and 1294 cm−1 correspond to the C-N vibration of a secondary aromatic amine. The peak at 1319 cm−1 is ascribed to the C=N vibrational mode (-N=quinoid=N-). The peak at 1384 cm−1 is ascribed to the C−N+ vibration of polyaniline (N-benzenoid-N). The peak at 1484 cm−1 corresponds to the C=C vibration of the B ring (benzenoid ring), whereas the peak at 1579 cm−1 is attributed to the C=N vibration of the Q ring (quinoid ring). The peak at 582 cm−1 is the principal characteristic peak of the Fe-O stretching vibrations in magnetite (Fe3O4) nanoparticles [56]. The existence of this peak signifies the development of iron oxide. The PAni/Fe3O4, nanocomposite exhibits Fe-O stretching vibrations, evidenced by peaks at 555 cm−1 and 634 cm−1 [57]. The aforementioned data demonstrate the successful development of the nanocomposite.
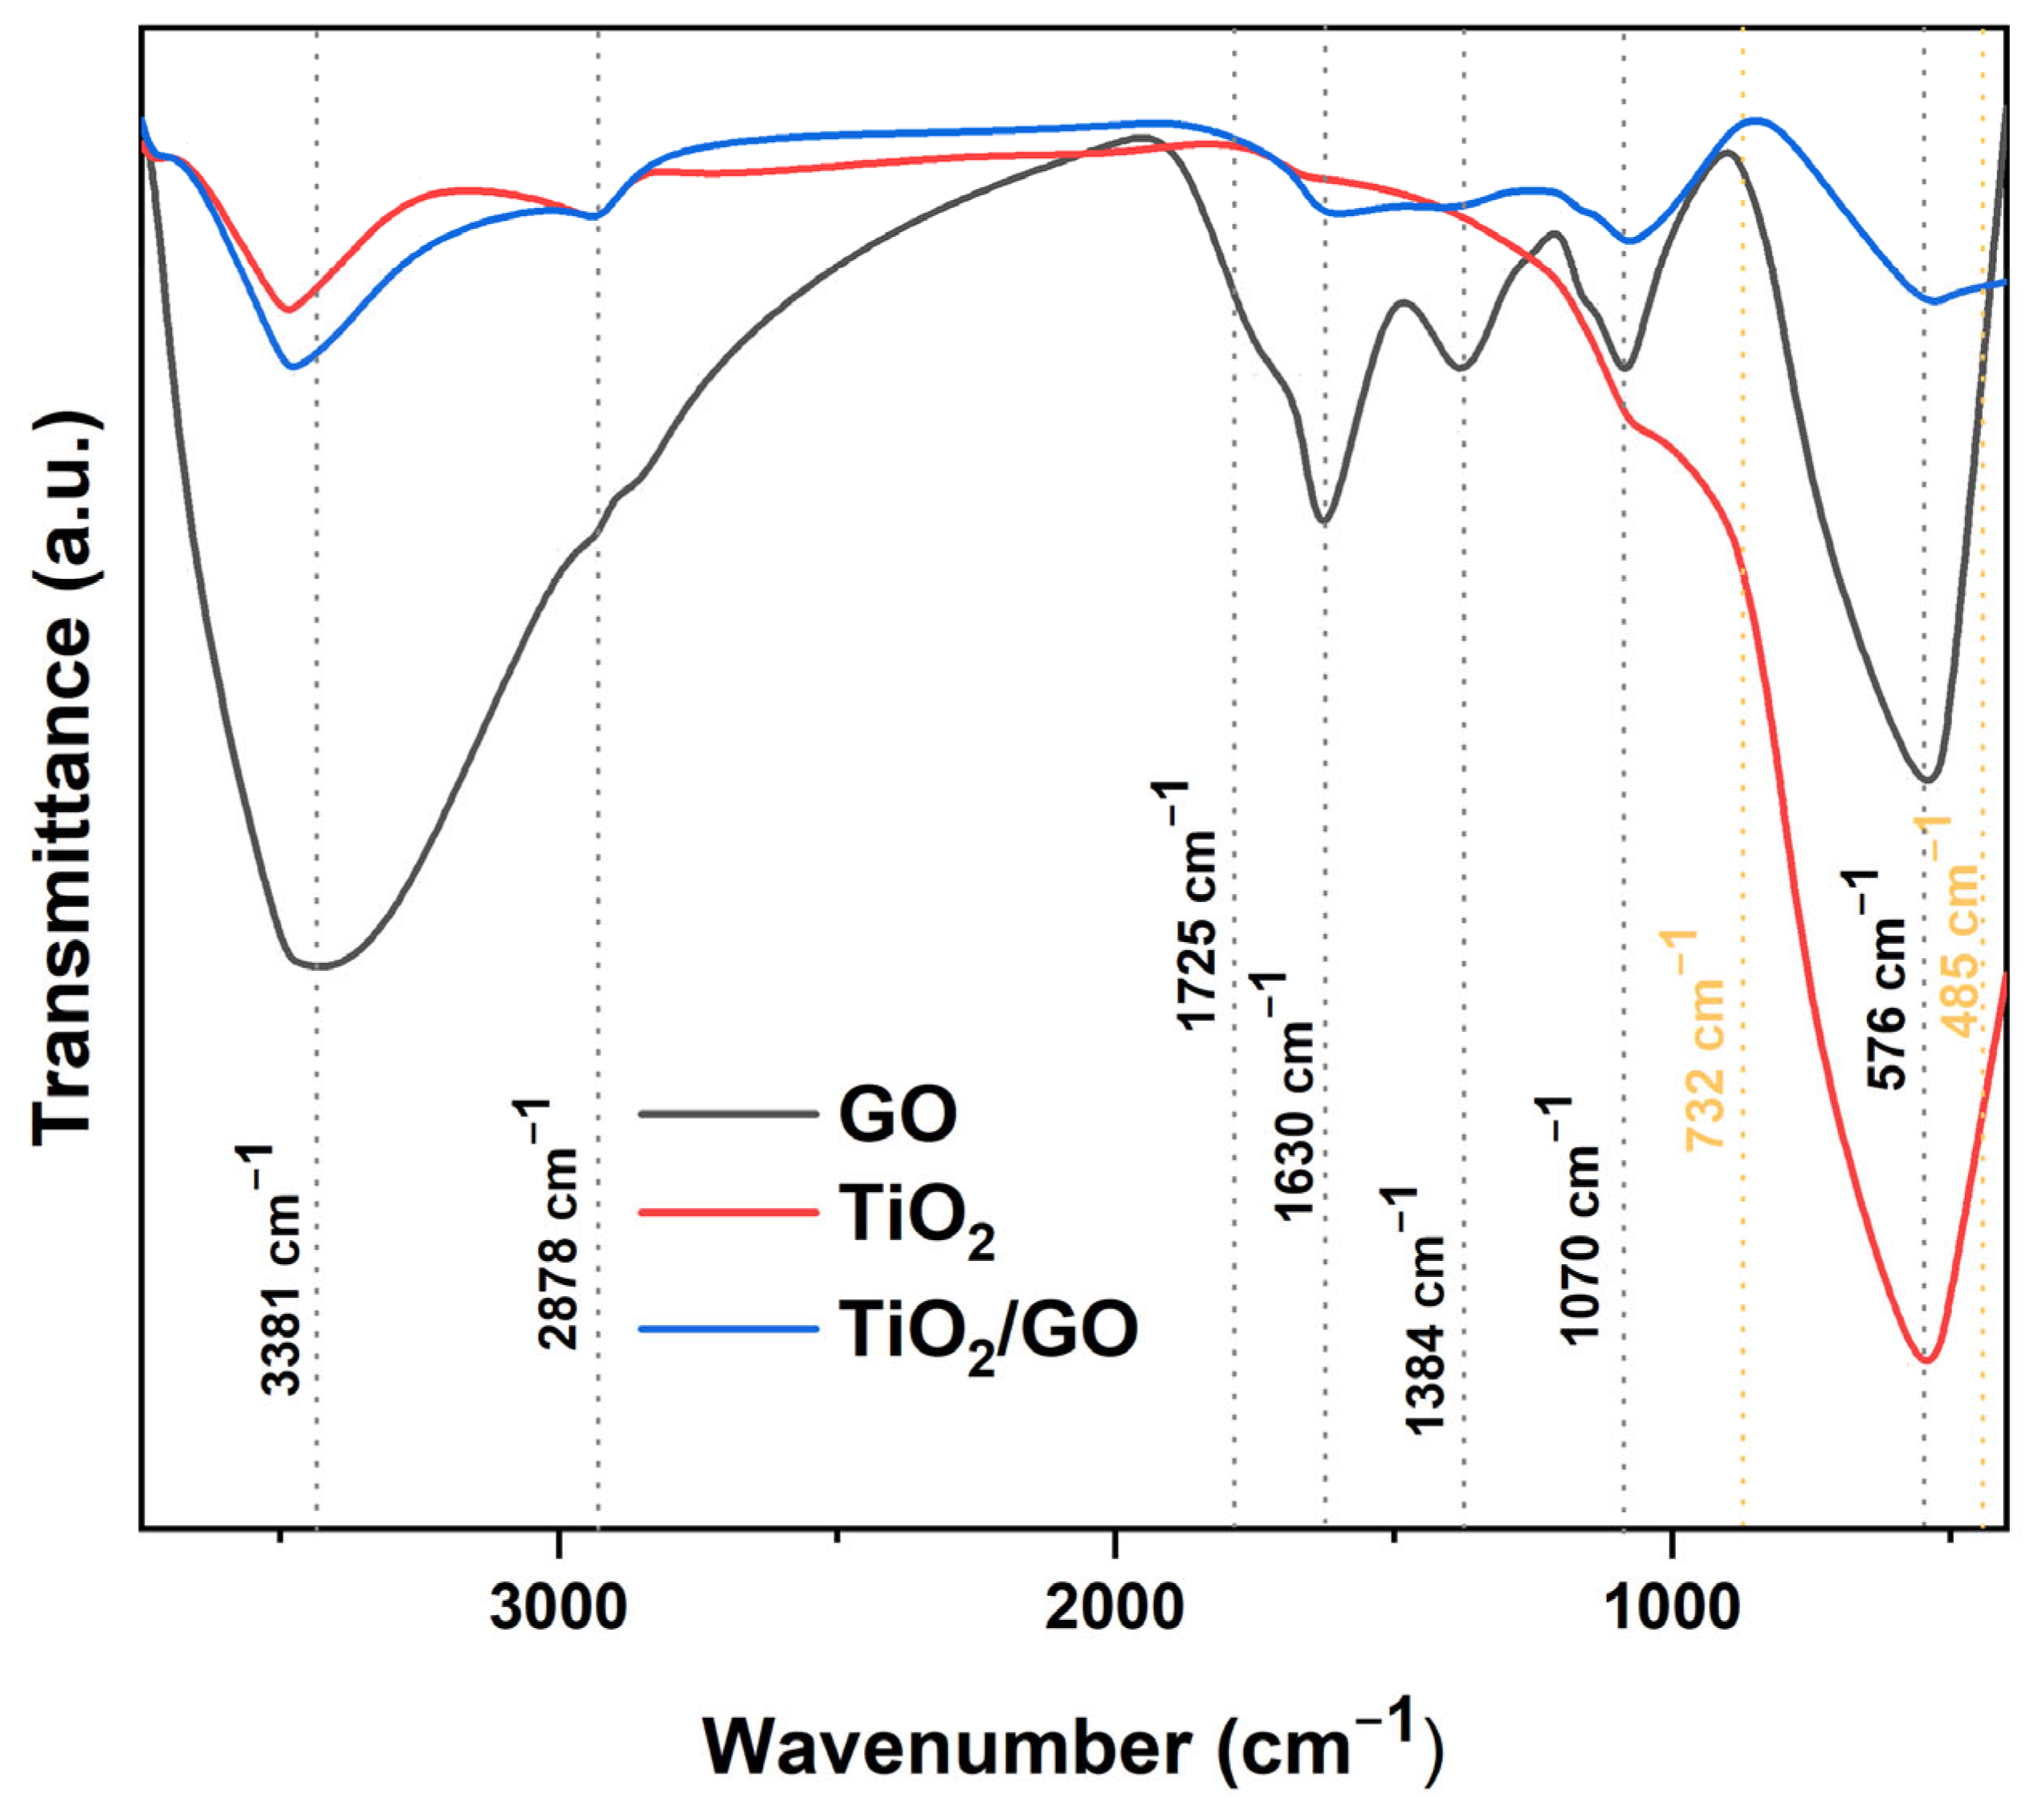
Figure 14 illustrates the FTIR spectra of graphene oxide (GO), titanium dioxide (TiO2), and titania-modified graphene oxide (GO/TiO2), within a wavenumber range of 400–3750 cm−1. The FTIR spectrum of graphene oxide (GO) indicates the presence of many oxygen-containing functional groups inside the material. The pronounced absorption peaks at 576 cm−1 and 1070 cm− are indicative of C-O-C stretching bond vibrations. The signal at around 1384 cm−1 corresponds to the bending of the carboxyl (-COOH) group. An absorption peak at approximately 1630 cm−1 is attributed to C=C vibration. The peaks at 1725 cm−1 and 3381 cm−1 correspond to the vibrations of the carboxyl (-COOH) and hydroxyl (-OH) functional groups, respectively. The presence of these suggests that graphene oxide comprises carboxyl groups (-COOH), which may serve as anchoring sites for titania (TiO2). The peaks at 485 cm−1 και 732 cm−1 correspond to the O-Ti-O bond in anatase (ΤιO2). The results indicate the effective synthesis of modified graphene oxide with titania (GO/TiO2).
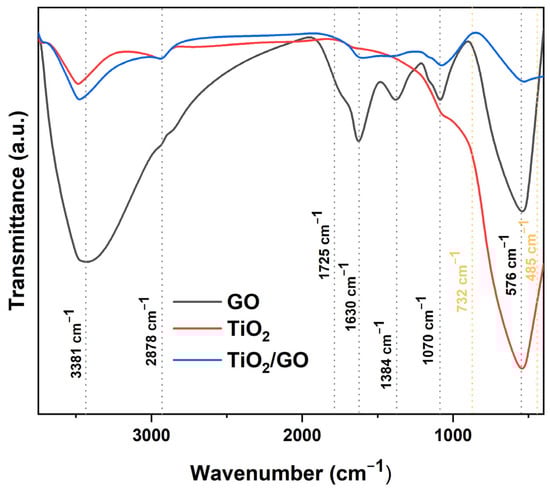
Figure 14.
The FTIR spectrum of graphene oxide (GO), titanium dioxide (TiO2), and the titania-modified graphene oxide (GO/TiO2) nanocomposite.
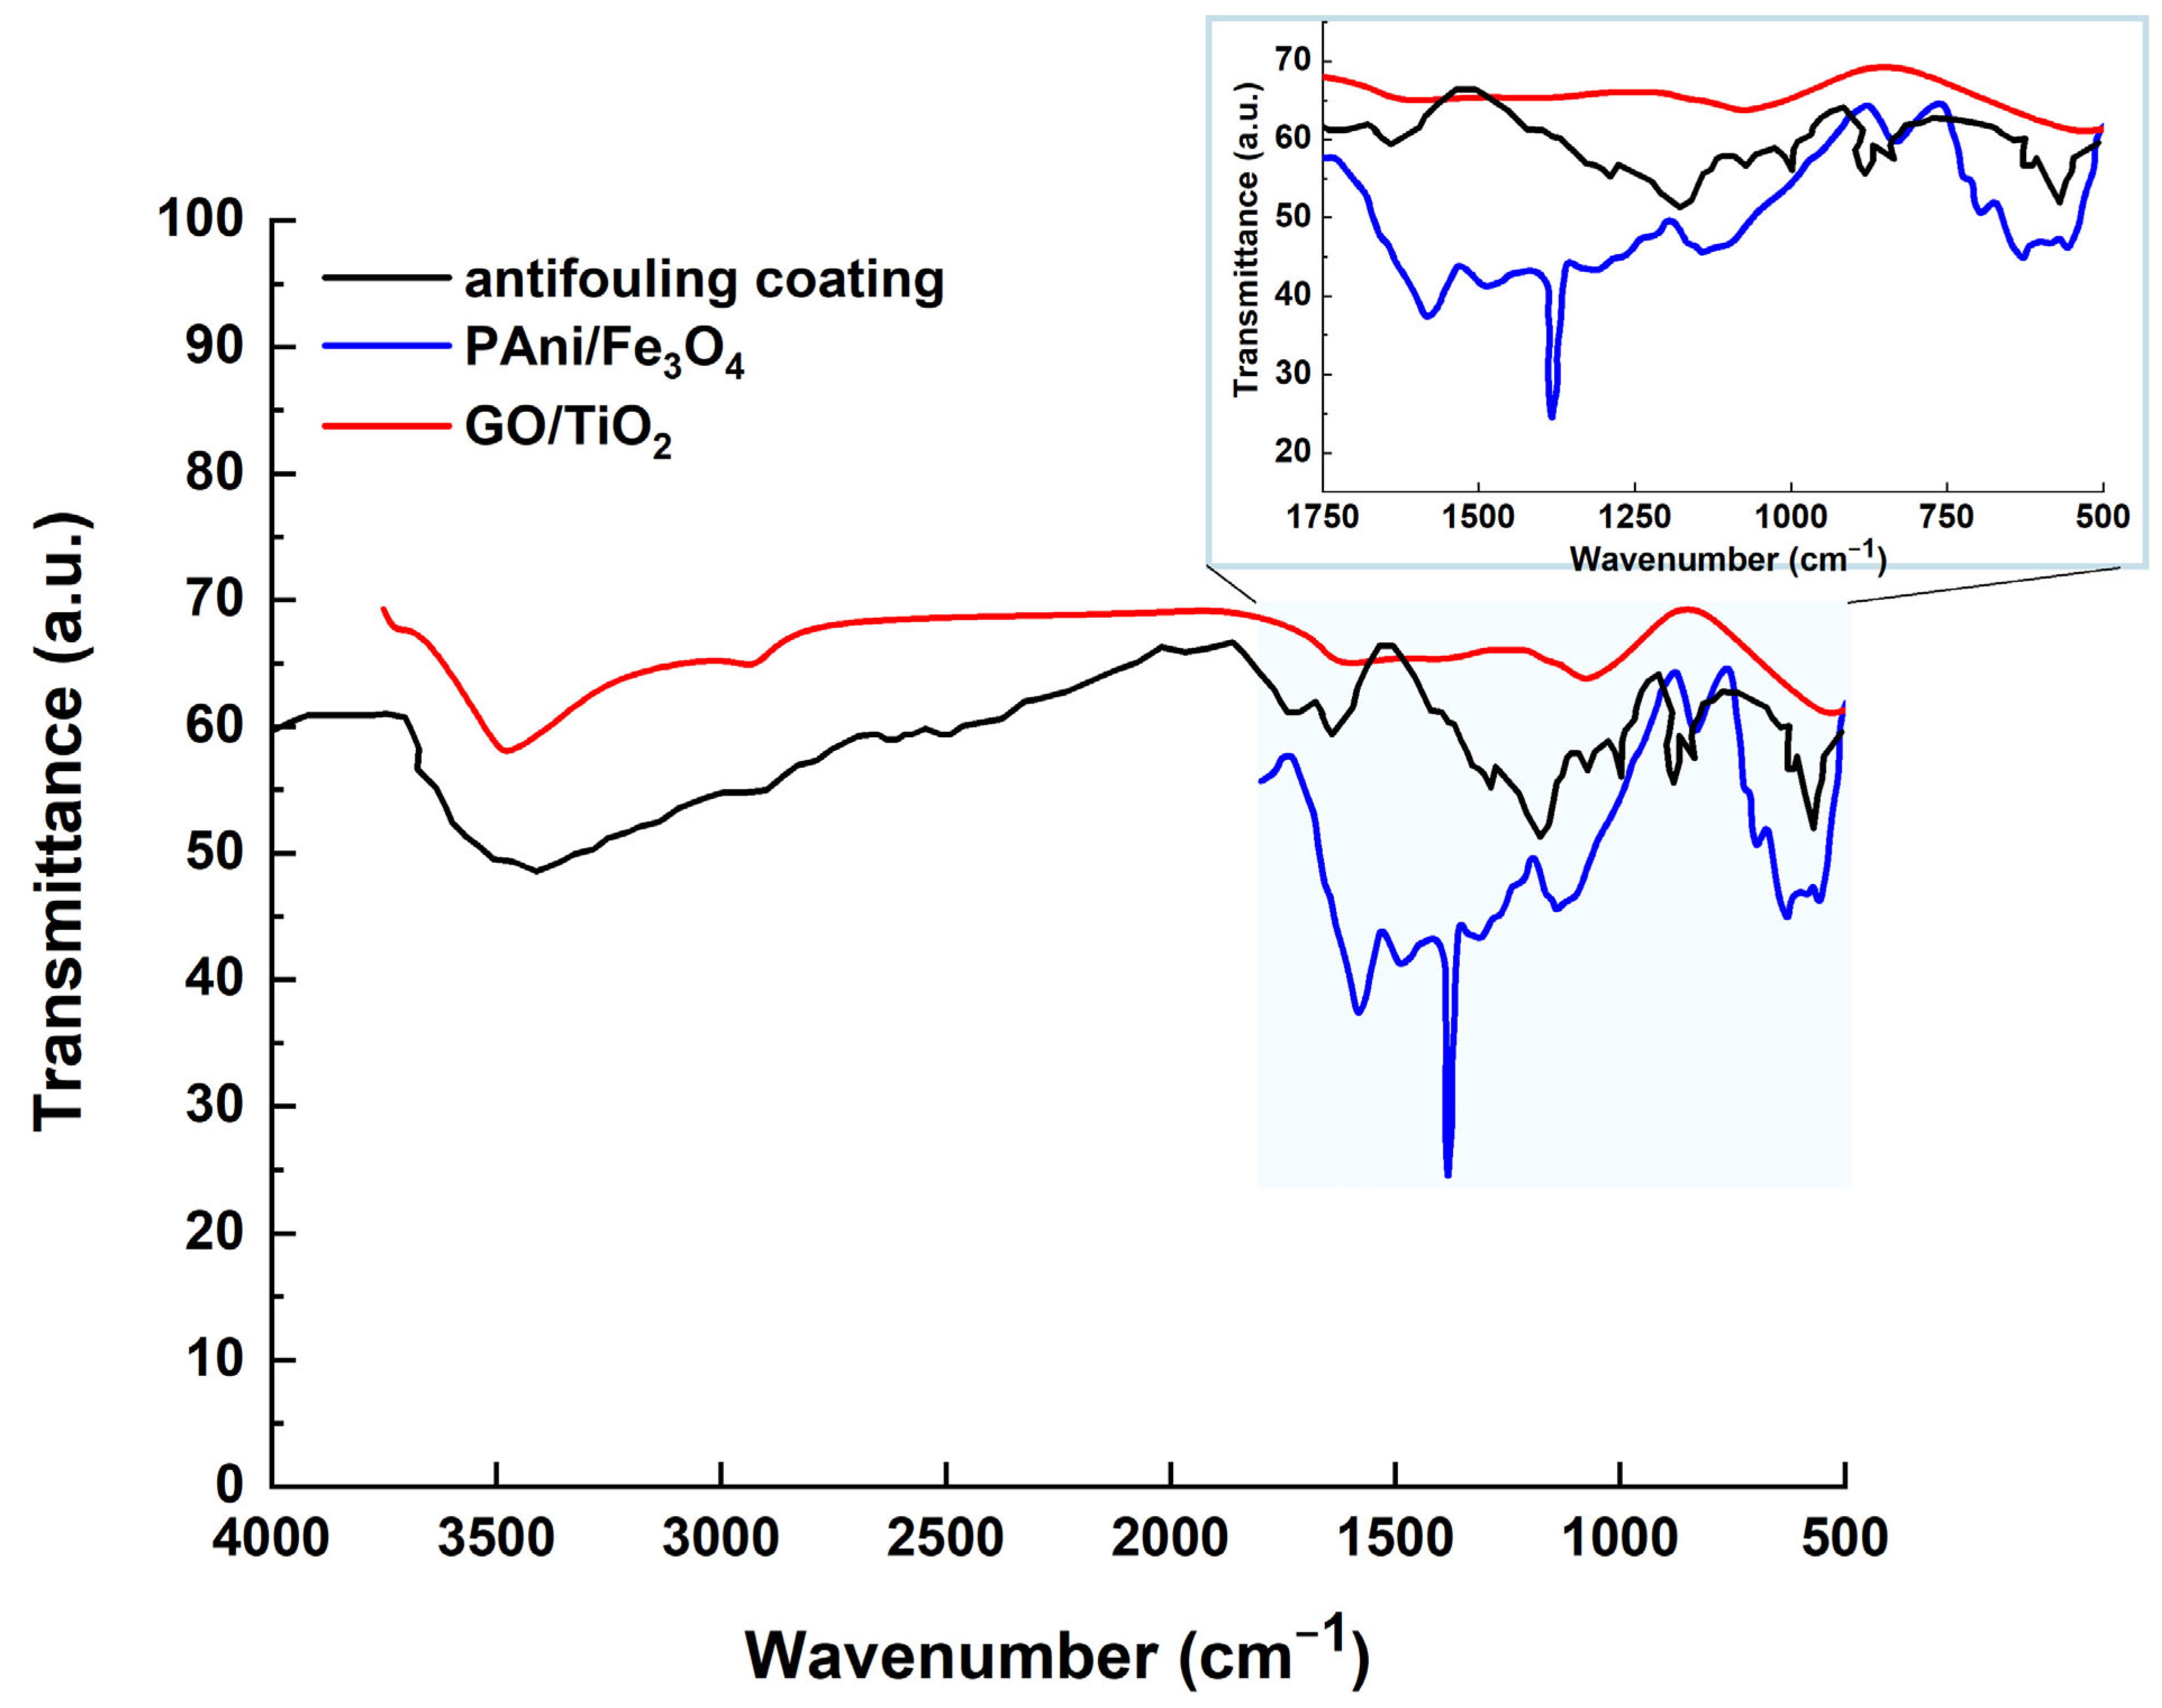
Figure 15 compares the FTIR spectra of the antifouling coating to those of PAni/Fe3O4 and GO/TiO2. The peaks at 1480 cm−1 and 1572 cm−1 are caused by C=C stretching in the benzenoid and quinoid rings of PAni, respectively. The peak centered at 841 cm−1 is attributable to C–H out-of-plane bending vibrations, which may validate para-substitution in the aromatic rings of PAni. The peak at 1298 cm−1 is caused by the C–N stretching (the secondary aromatic amine) of PAni. The peak at 1231 cm−1 is caused by C–N+ stretching (the polaronic structure of PAni). The higher intensity of the C–N+ peak shows that Fe3O4 increases the protonation of PAni, which enhances the conductivity. The FTIR peaks at 1130 cm−1 and 1140 cm−1 indicate C–H in-plane bending (quinoid =C–H) and greater conductivity of the antifouling coating due to delocalized charge. The peak at 630 cm−1 confirms the presence of Fe3O4 via the Fe–O bond, corresponding to the stretching vibration of the magnetite phase. A peak at 730 cm−1 may indicate a chemical relationship between PAni and Fe3O4, caused by Fe–O–C or Fe–O–N linkage. The broadening in the PAni peaks (e.g., quinoid/benzenoid bands) indicates charge transfer between PAni and Fe3O4. The peak at 1070 cm−1 indicates the C–O stretching vibration of the alkoxy groups (-C–O) in GO. The peak at 1220 cm−1 confirms the presence of epoxy groups of GO via the C–O–C stretching vibration. The FTIR peak at 1387 cm−1 is caused by the C–O–H bending vibration of the hydroxyl in GO. The peak at 1630 cm−1 is due to the C=C stretching (unoxidized graphitic domains) of GO, while the peak at 1725 cm−1 is due to the C=O stretching of GO’s carboxylic acid (-COOH). The peak at 3381 cm−1 is caused by the O–H stretching vibration of the hydroxyl (-OH) groups of GO. The FTIR peaks at 536 cm−1 and 571 cm−1 are the Ti–O–Ti stretching vibrations of TiO2 (the anatase phase). The shift in GO’s oxygen-functional peaks (such as C=O or O–H) shows the partial reduction of GO during TiO2 deposition and the bonding between the Ti and GO oxygen groups. Here, graphene oxide (GO) is modified with titania nanoparticles.
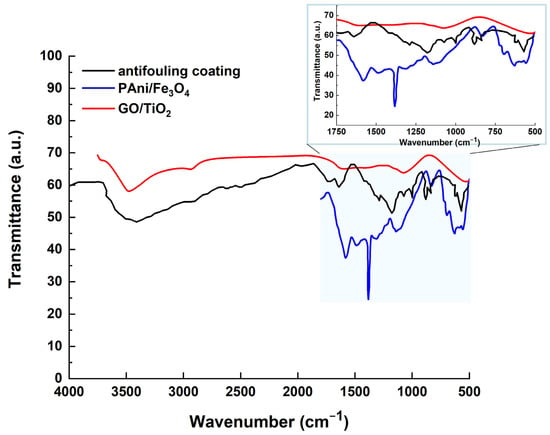
Figure 15.
The FTIR spectrum of the antifouling coating, compared with the FTIR spectra of PAni/Fe3O4 and GO/TiO2.
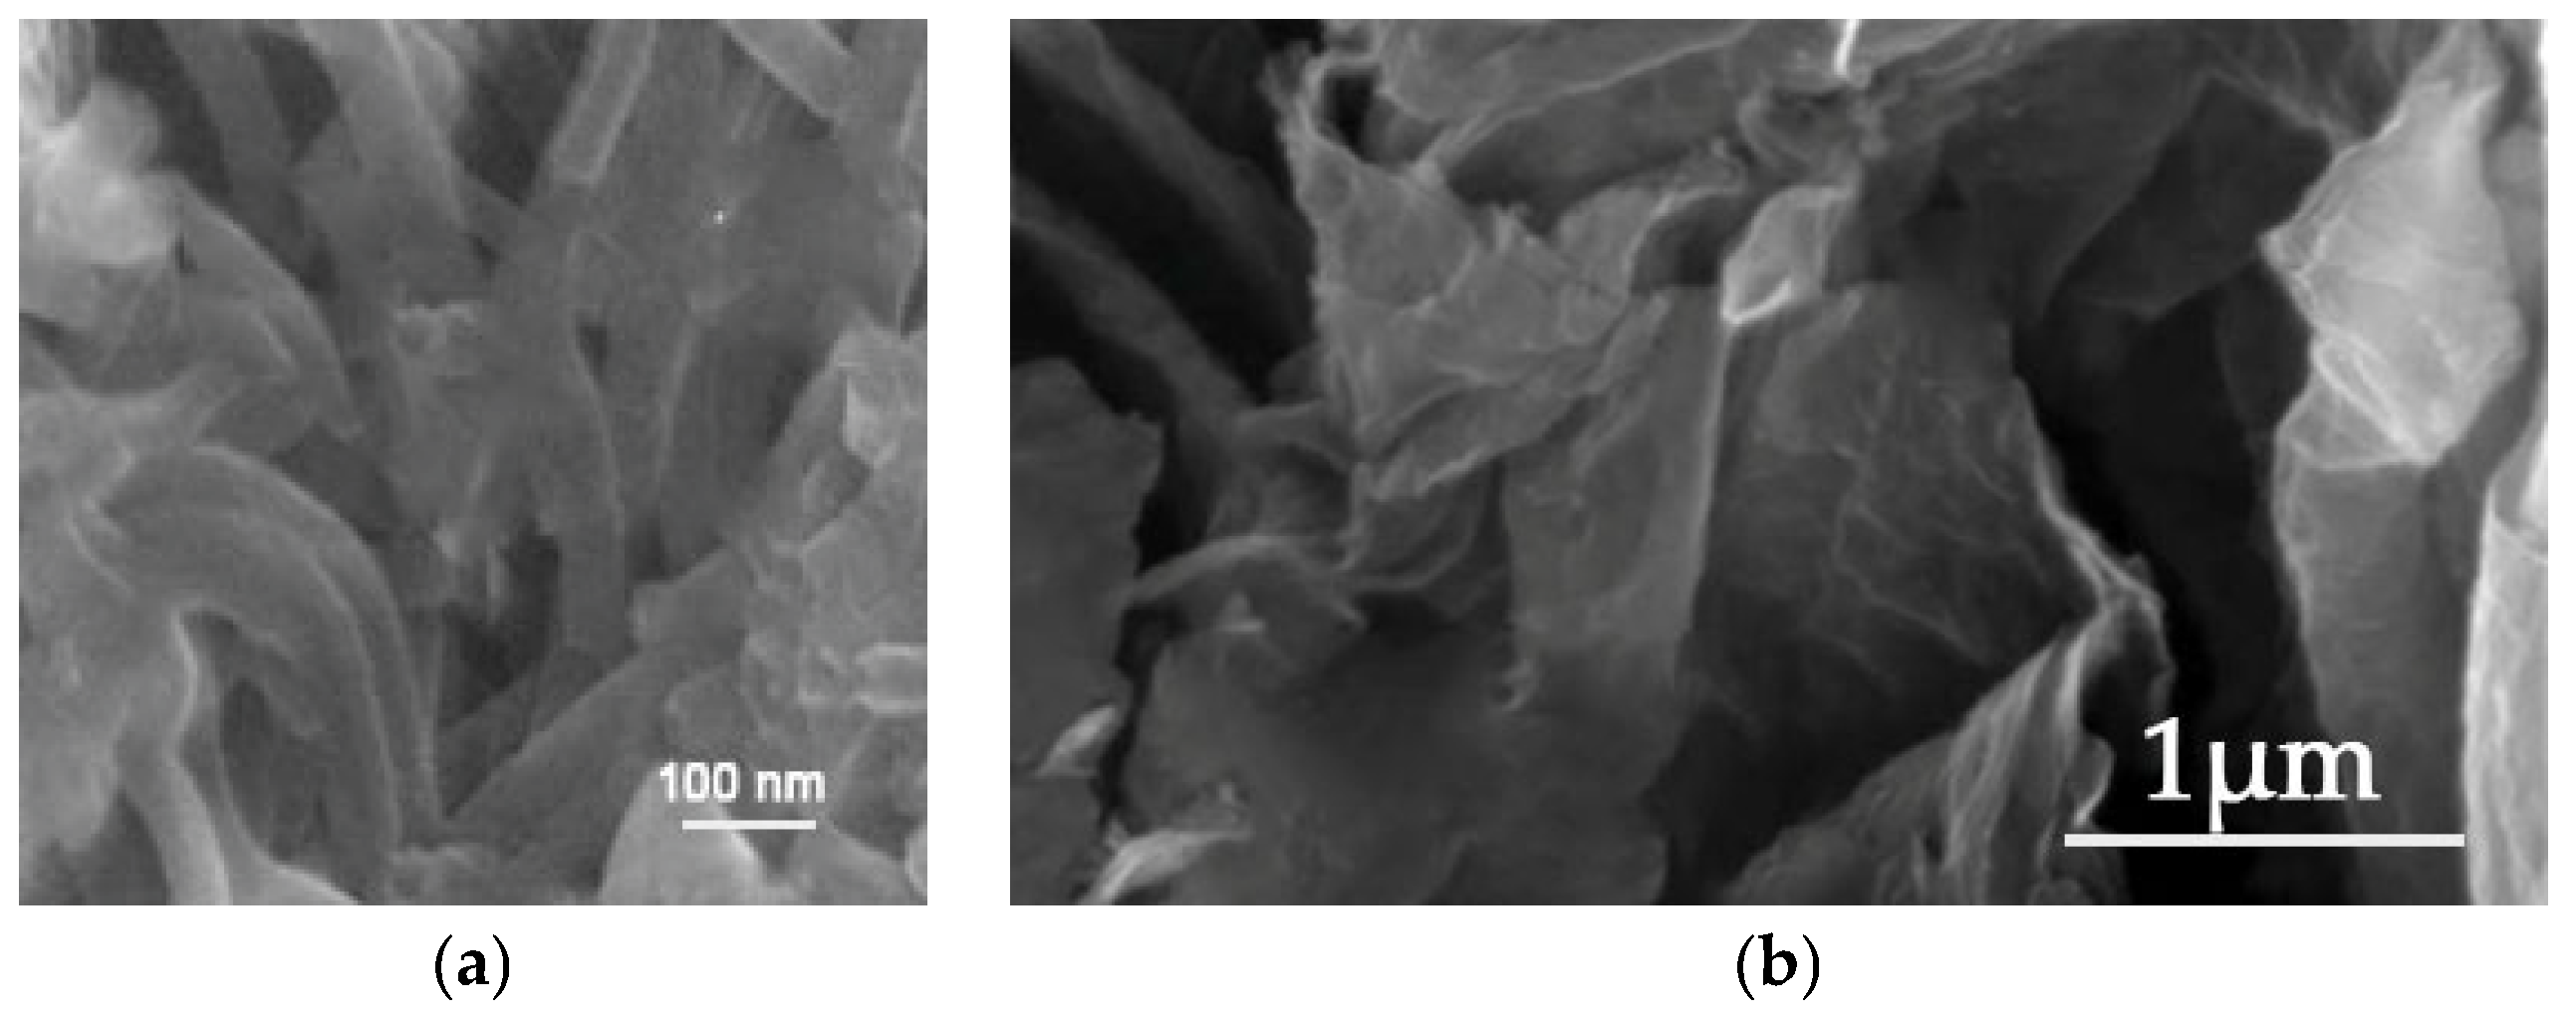
The analysis of the SEM micrographs revealed that the PAni/Fe3O4 nanocomposite displays distinct nanorod structures, out-of-lane oriented with a variable average diameter (Figure 16a), whereas the GO/TiO2 nanocomposite demonstrates an irregular, randomly oriented leaf-like morphology characterized by pronounced folds resulting from entrapped titania formations (Figure 16b).
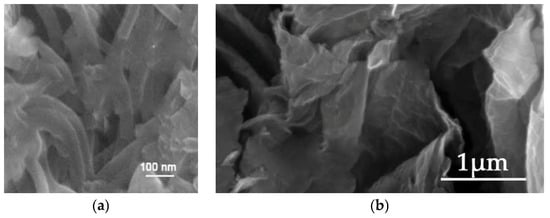
Figure 16.
SEM images of (a) PAni/Fe3O4 nanocomposite and (b) GO/TiO2 nanocomposite.
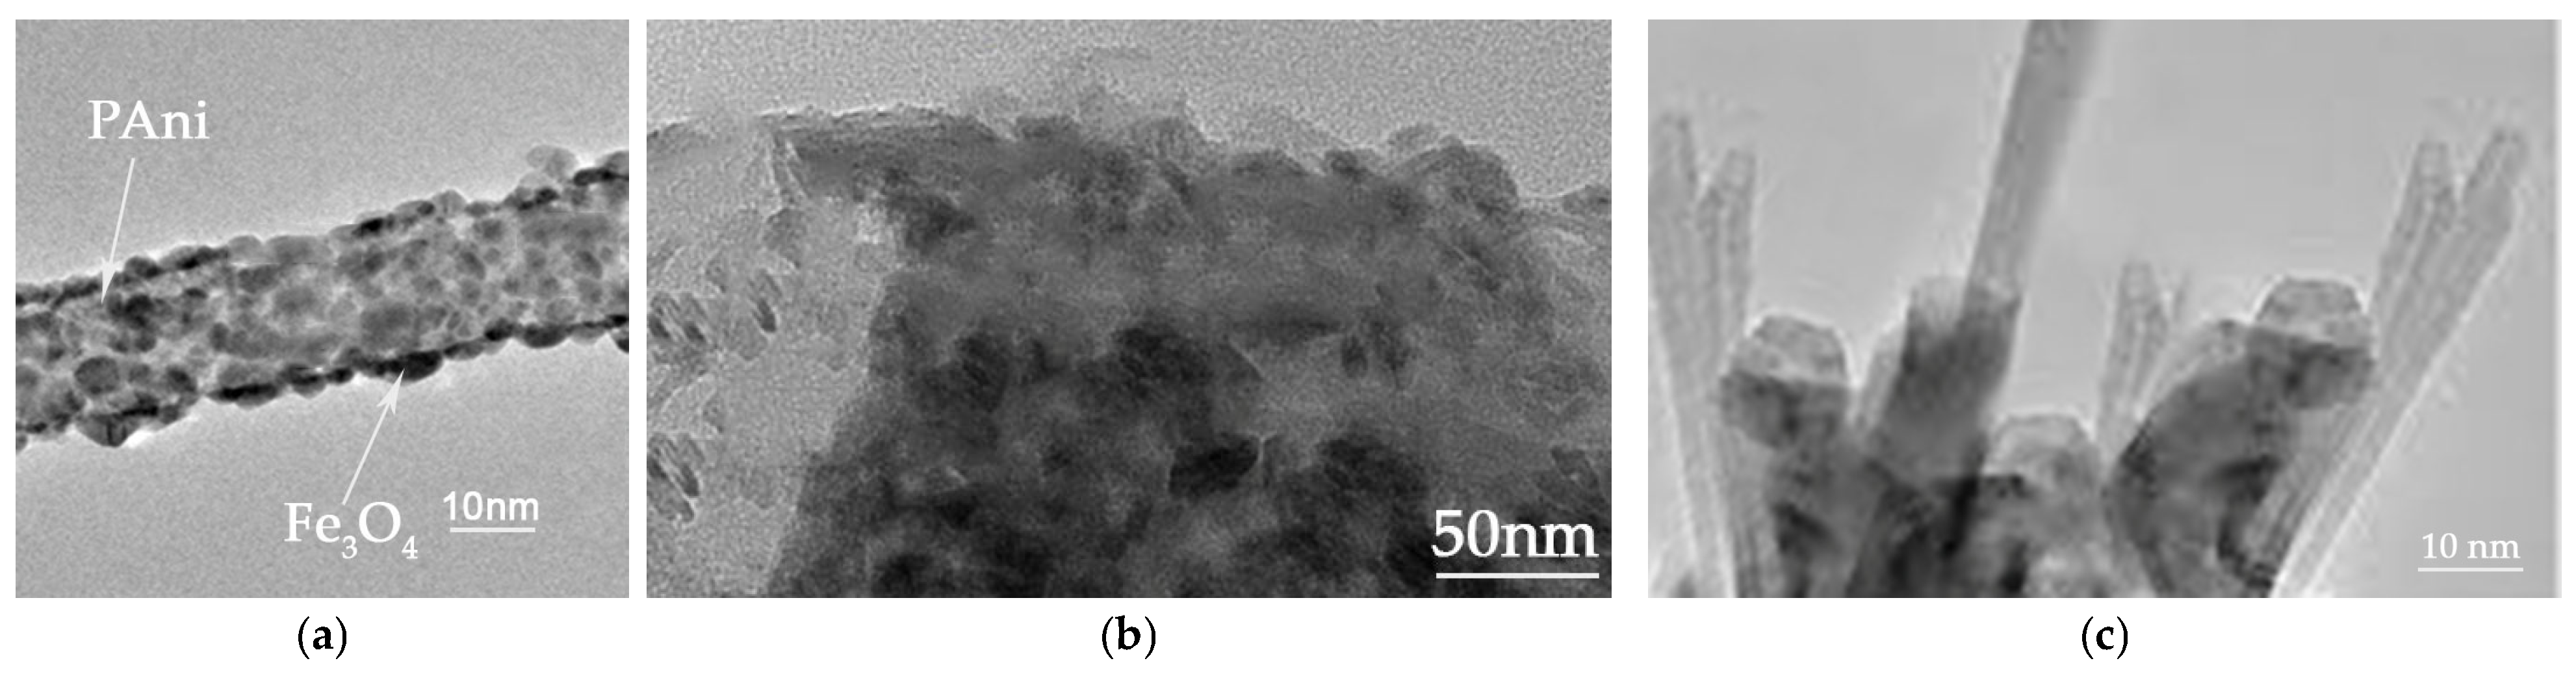
The bright-field TEM images confirm the distinct nanorod structure of polyaniline adorned with magnetite nanoparticles (Figure 17a). The propensity for the average diameter of the magnetite nanoparticles to increase, owing to aggregation on the surface of PANI rods, is a direct result of their elevated surface tension, attributed to their spherical morphology and diminutive size. The GO/TiO2 nanocomposite exhibits a stratified structure of GO, with TiO2 present as rod-shaped nanoparticles (Figure 17b). The antifouling coating displays the horizontal alignment of the GO/TiO2 nanocomposite and the out-of-plane alignment of the PAni/Fe3O4 nanorods.
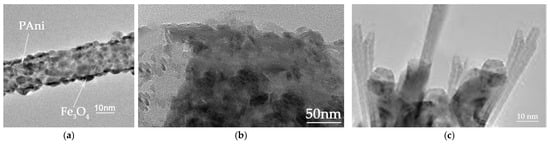
Figure 17.
Bright-field ΤΕΜ images of (a) PAni/Fe3O4 nanocomposite; (b) GO/TiO2 nanocomposite; and (c) antifouling coating.
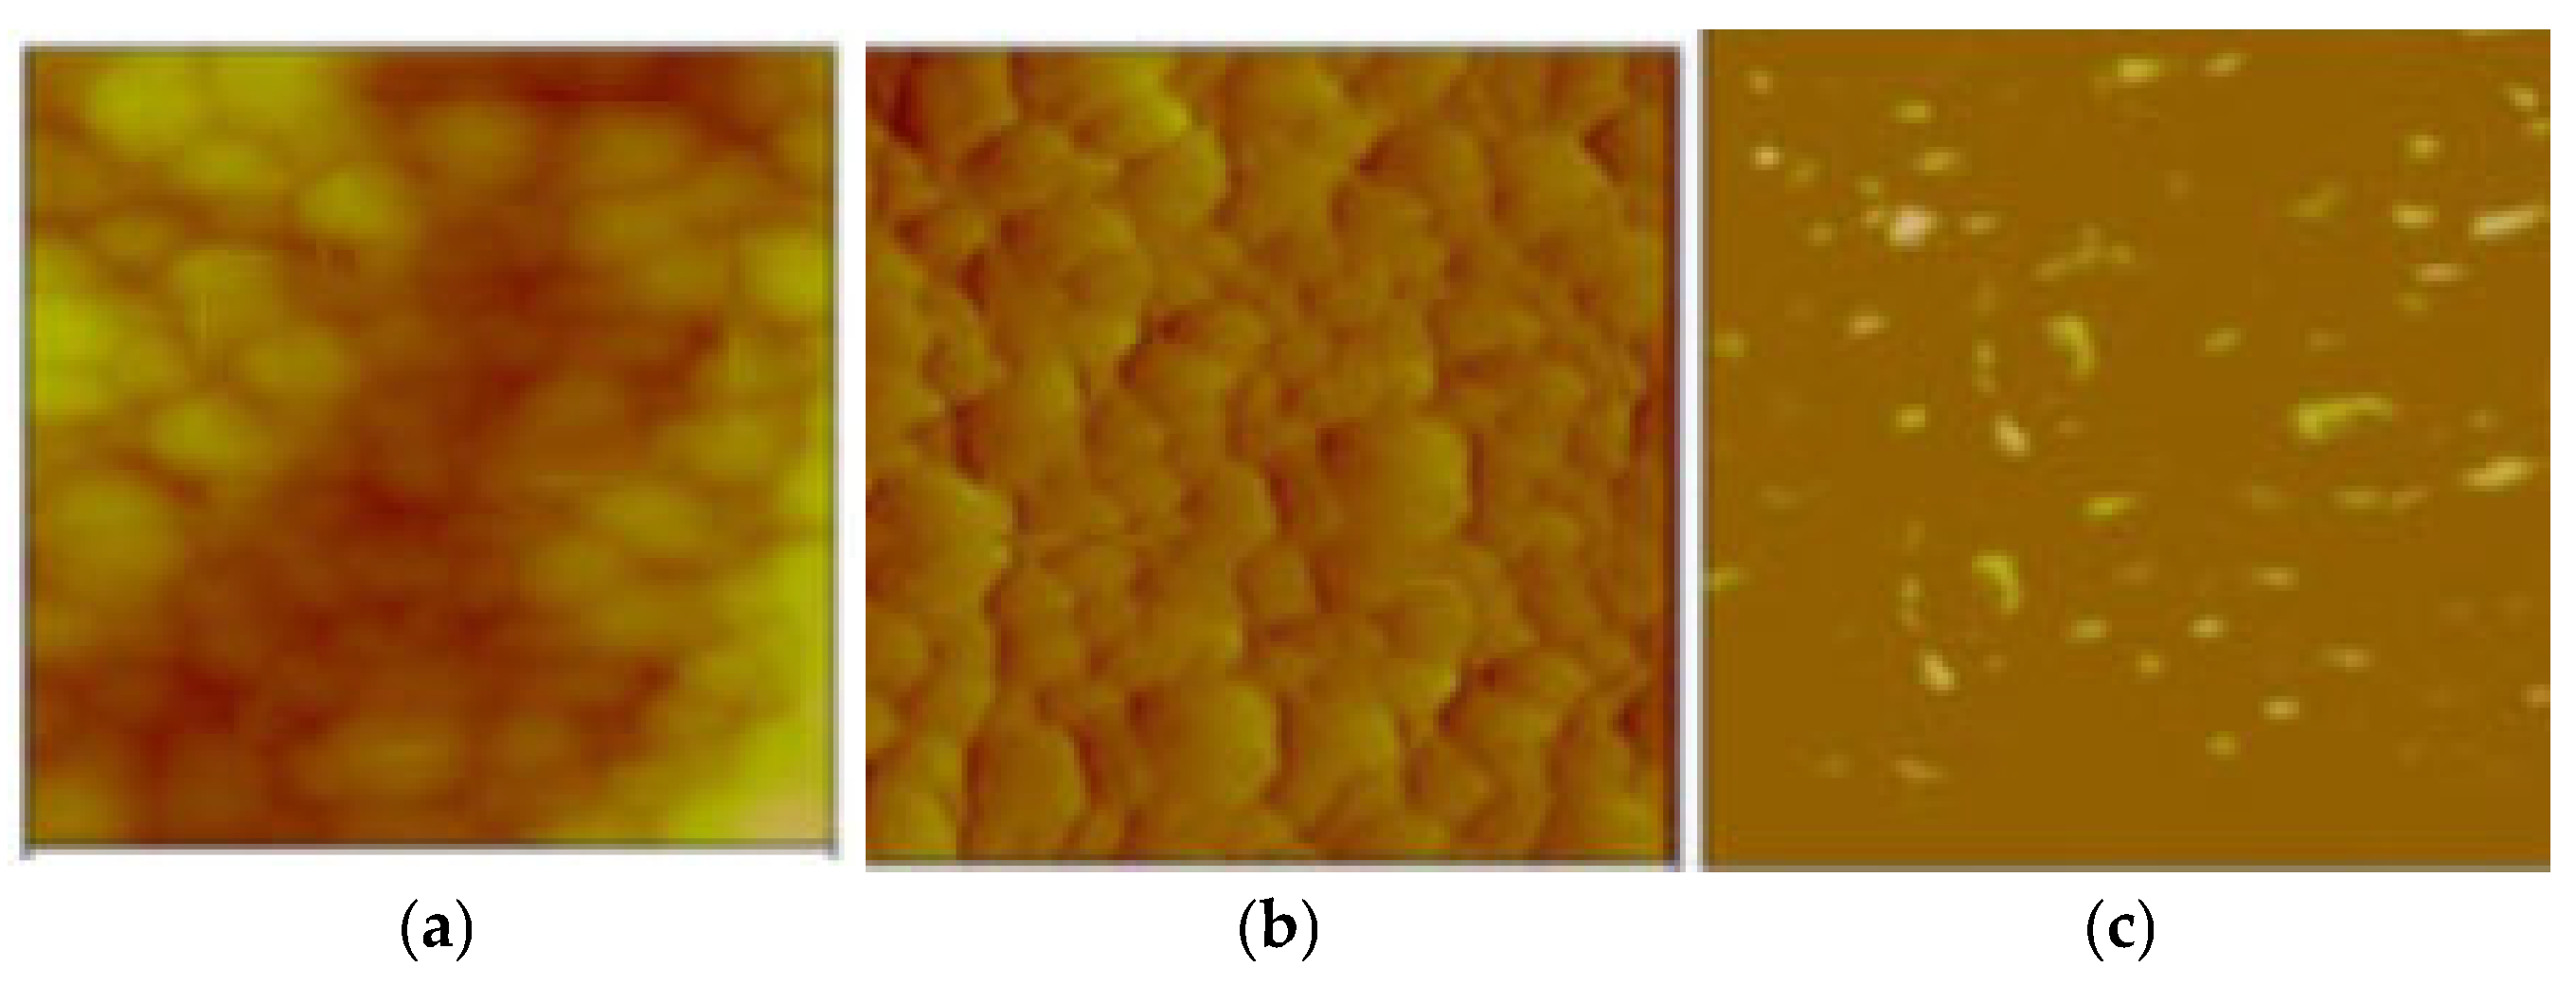
The integrated analysis of the topographic relief morphology (Figure 18b) and electrical charge flow (Figure 18c) in the overburden was documented through conductive AFM (c-AFM) measurements (Figure 18a), confirming a surface current flow on the paint (Figure 18c). The existing light spots in Figure 18c predominantly appear at the edges of the cavities of the surface protrusions, facilitating efficient electron transport along the antifouling coating.

Figure 18.
(a) Conductive AFM mapping of the antifouling coating; (b) a topography image; and (c) the current map at a 10 mV DC sample bias.
The assessment of the DC conductivity of the nanocomposites (PAni/Fe3O4 and GO/TiO2) and the antifouling coating (Figure 19) confirms a three-dimensional conductivity distribution. PAni-GO interactions significantly reduce the longitudinal conductivity, thereby increasing its anisotropy. These results indicated that the mobility of the charge carriers was attributable to the interconnectivity and interactions among the polyaniline polymer chains in the out-of-plane direction. The evolution of longitudinal conductivity is attributed to graphene oxide.
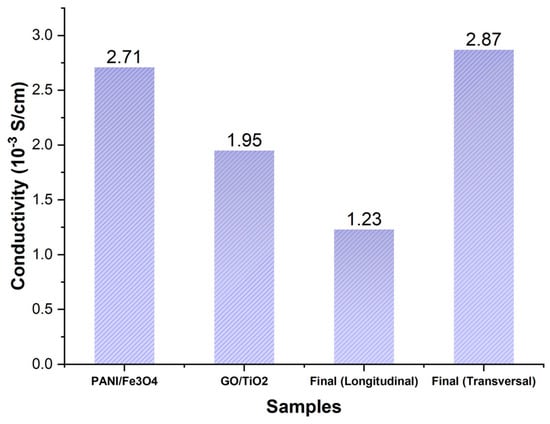
Figure 19.
Direct current conductivity measurements of PAni/Fe3O4, GO/TiO2, and antifouling coating.
3.2. Laboratory Corrosion Tests of the Antifouling Coating
Figure 20 presents SEM images of the surfaces of samples from the five groups subjected to static immersion measurements in ASW. The steel specimens coated with an antifouling coating exhibited preliminary signs of corrosion products after 5 days of continuous exposure to artificial seawater, whereas the uncoated specimens corroded after merely one day in artificial seawater. During the extended duration of ASW immersion for the coated samples, the initial corrosion product stains expanded without entirely obscuring the coating’s surface, even after 30 days of exposure. Conversely, following 10 days of immersion, the corrosion product aggregates had entirely enveloped the surface of the steel in the uncoated sample. Extended static immersion in ASW results in the substantial accumulation of irregular network corrosion products and notable topographical relief on the corroded surfaces of the uncoated naval steel samples.
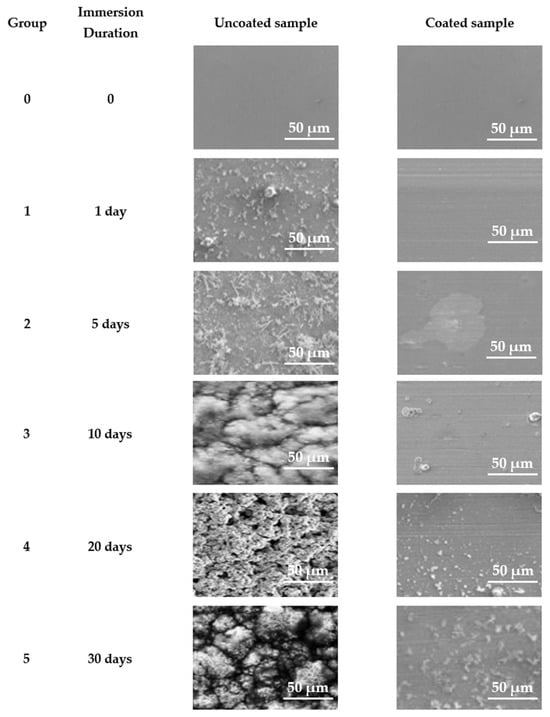
Figure 20.
SEM micrographs of samples examined in laboratory static immersion tests in ASW.
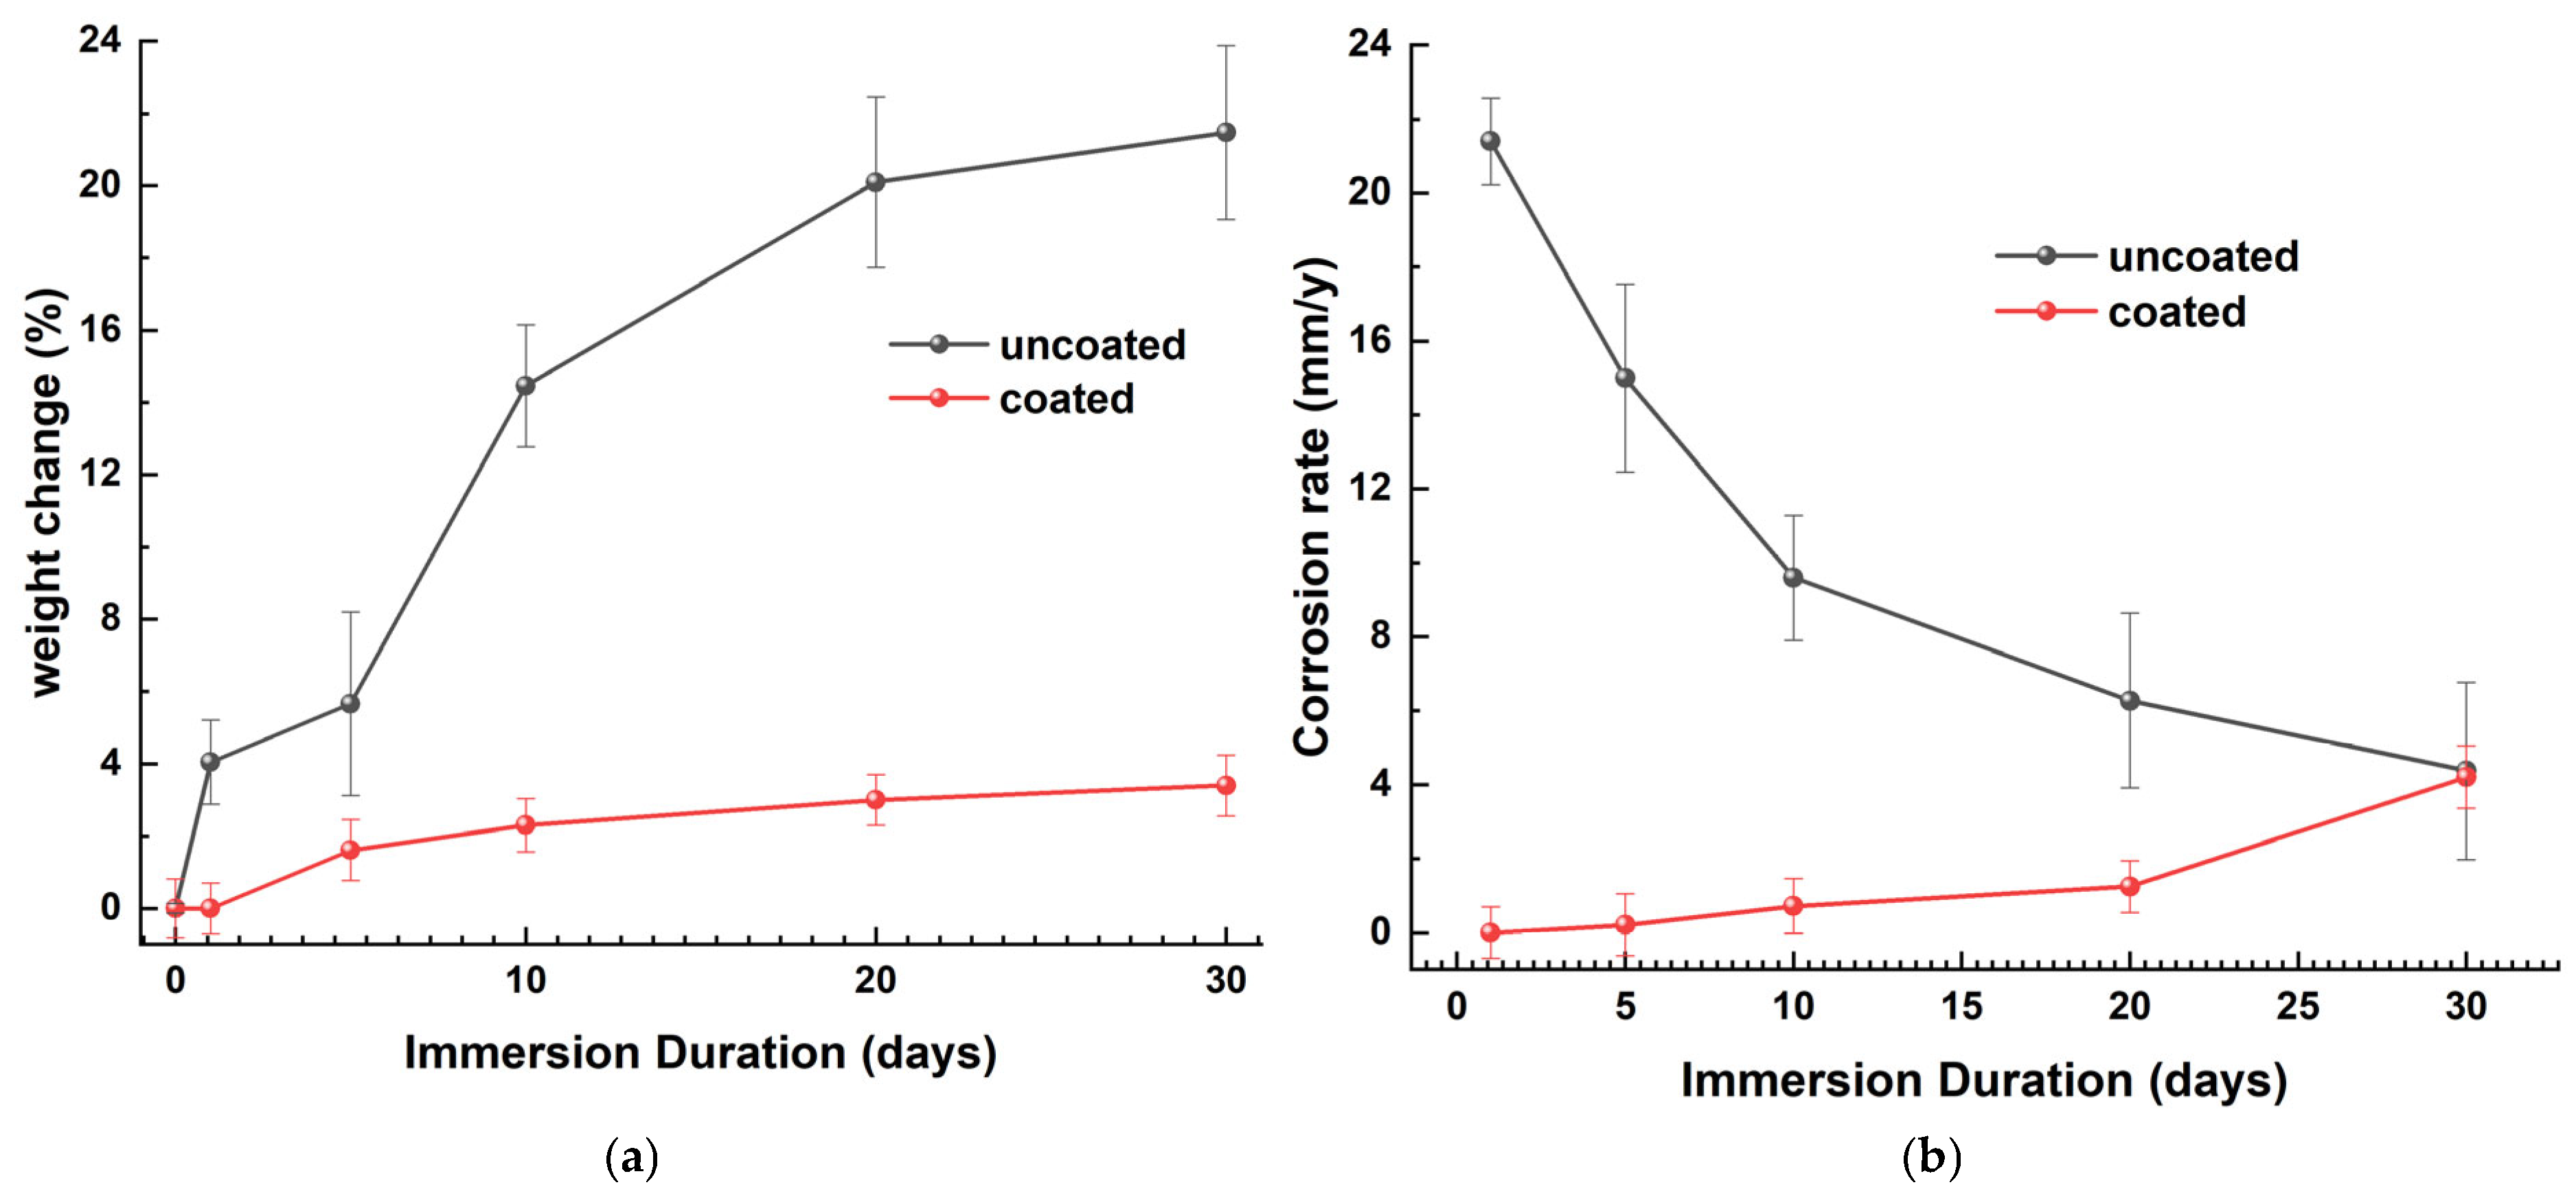
Figure 21a is a graphical representation of the percentage change in weight (WL) relative to the immersion time. WL was determined using Equation (1). The uncoated samples exhibit a significant reduction in metal mass during the initial days of immersion, followed by a gradual increase. After 10 days of immersion, this has nearly stabilized, suggesting that the corrosion layer functions as a protective barrier on the naval steel. The coated specimens exhibit a notable reduction in their mass variation, which continues after 20 days of immersion in ASW.
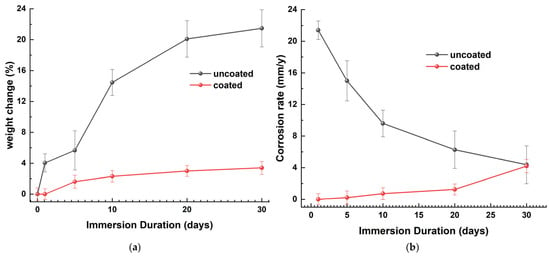
Figure 21.
The (a) percentage weight loss and (b) corrosion rate as a function of the immersion time in ASW for coated and uncoated naval steel samples.
The corrosion rate (CR) was calculated using Equation (2). The CR curve of uncoated naval steel, plotted against the immersion time (Figure 21b), indicates that the corrosion rate diminishes exponentially over time. The immersion of the steel samples in ASW induces destructive, non-vertical surface corrosion at a rate of 21.1 mm/y. With an extended immersion duration, the surface coverage rate increases, and the corrosion thickness intensifies, leading to a reduction in the corrosion rate from 15.9 mm/y to 6.4 mm/y. Upon complete corrosion of the steel surface and stabilization of the corrosion product’s thickness, the corrosion rate exhibits a marginal decline of 4.2 m/y. Nonetheless, it remains capable of inflicting surface damage owing to the existence of micro- and macro-cavities.
The specimen featuring the antifouling coating exhibits, as illustrated by the graph in Figure 21b, a superior corrosion resistance on the surface of the naval steel. Until the 10th day of immersion, the minimal mass alteration yields a corrosion rate of zero; subsequently, for up to 30 days in ASW, the corrosion rate remains exceedingly low and nearly constant.
Figure 22 illustrates the variations in the thickness, roughness, and water contact angle (WCA) of the antifouling coating as a function of the duration in ASW. Following 30 days of immersion, it was observed that the average thickness of the coating had a minor reduction of 6%, indicating the excellent hydrolytic stability of the structure. The reduction in the water contact angle was ascribed to the elevation in the average surface roughness and the dissolution of the resin in artificial seawater, concurrently revealing hydrophilic titania.
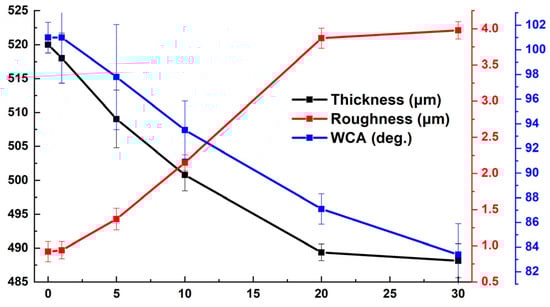
Figure 22.
The variation in the thickness, roughness, and water contact angle (WCA) of the coating as a function of duration in ASW.
3.3. In Situ Corrosion Tests of the Antifouling Coating
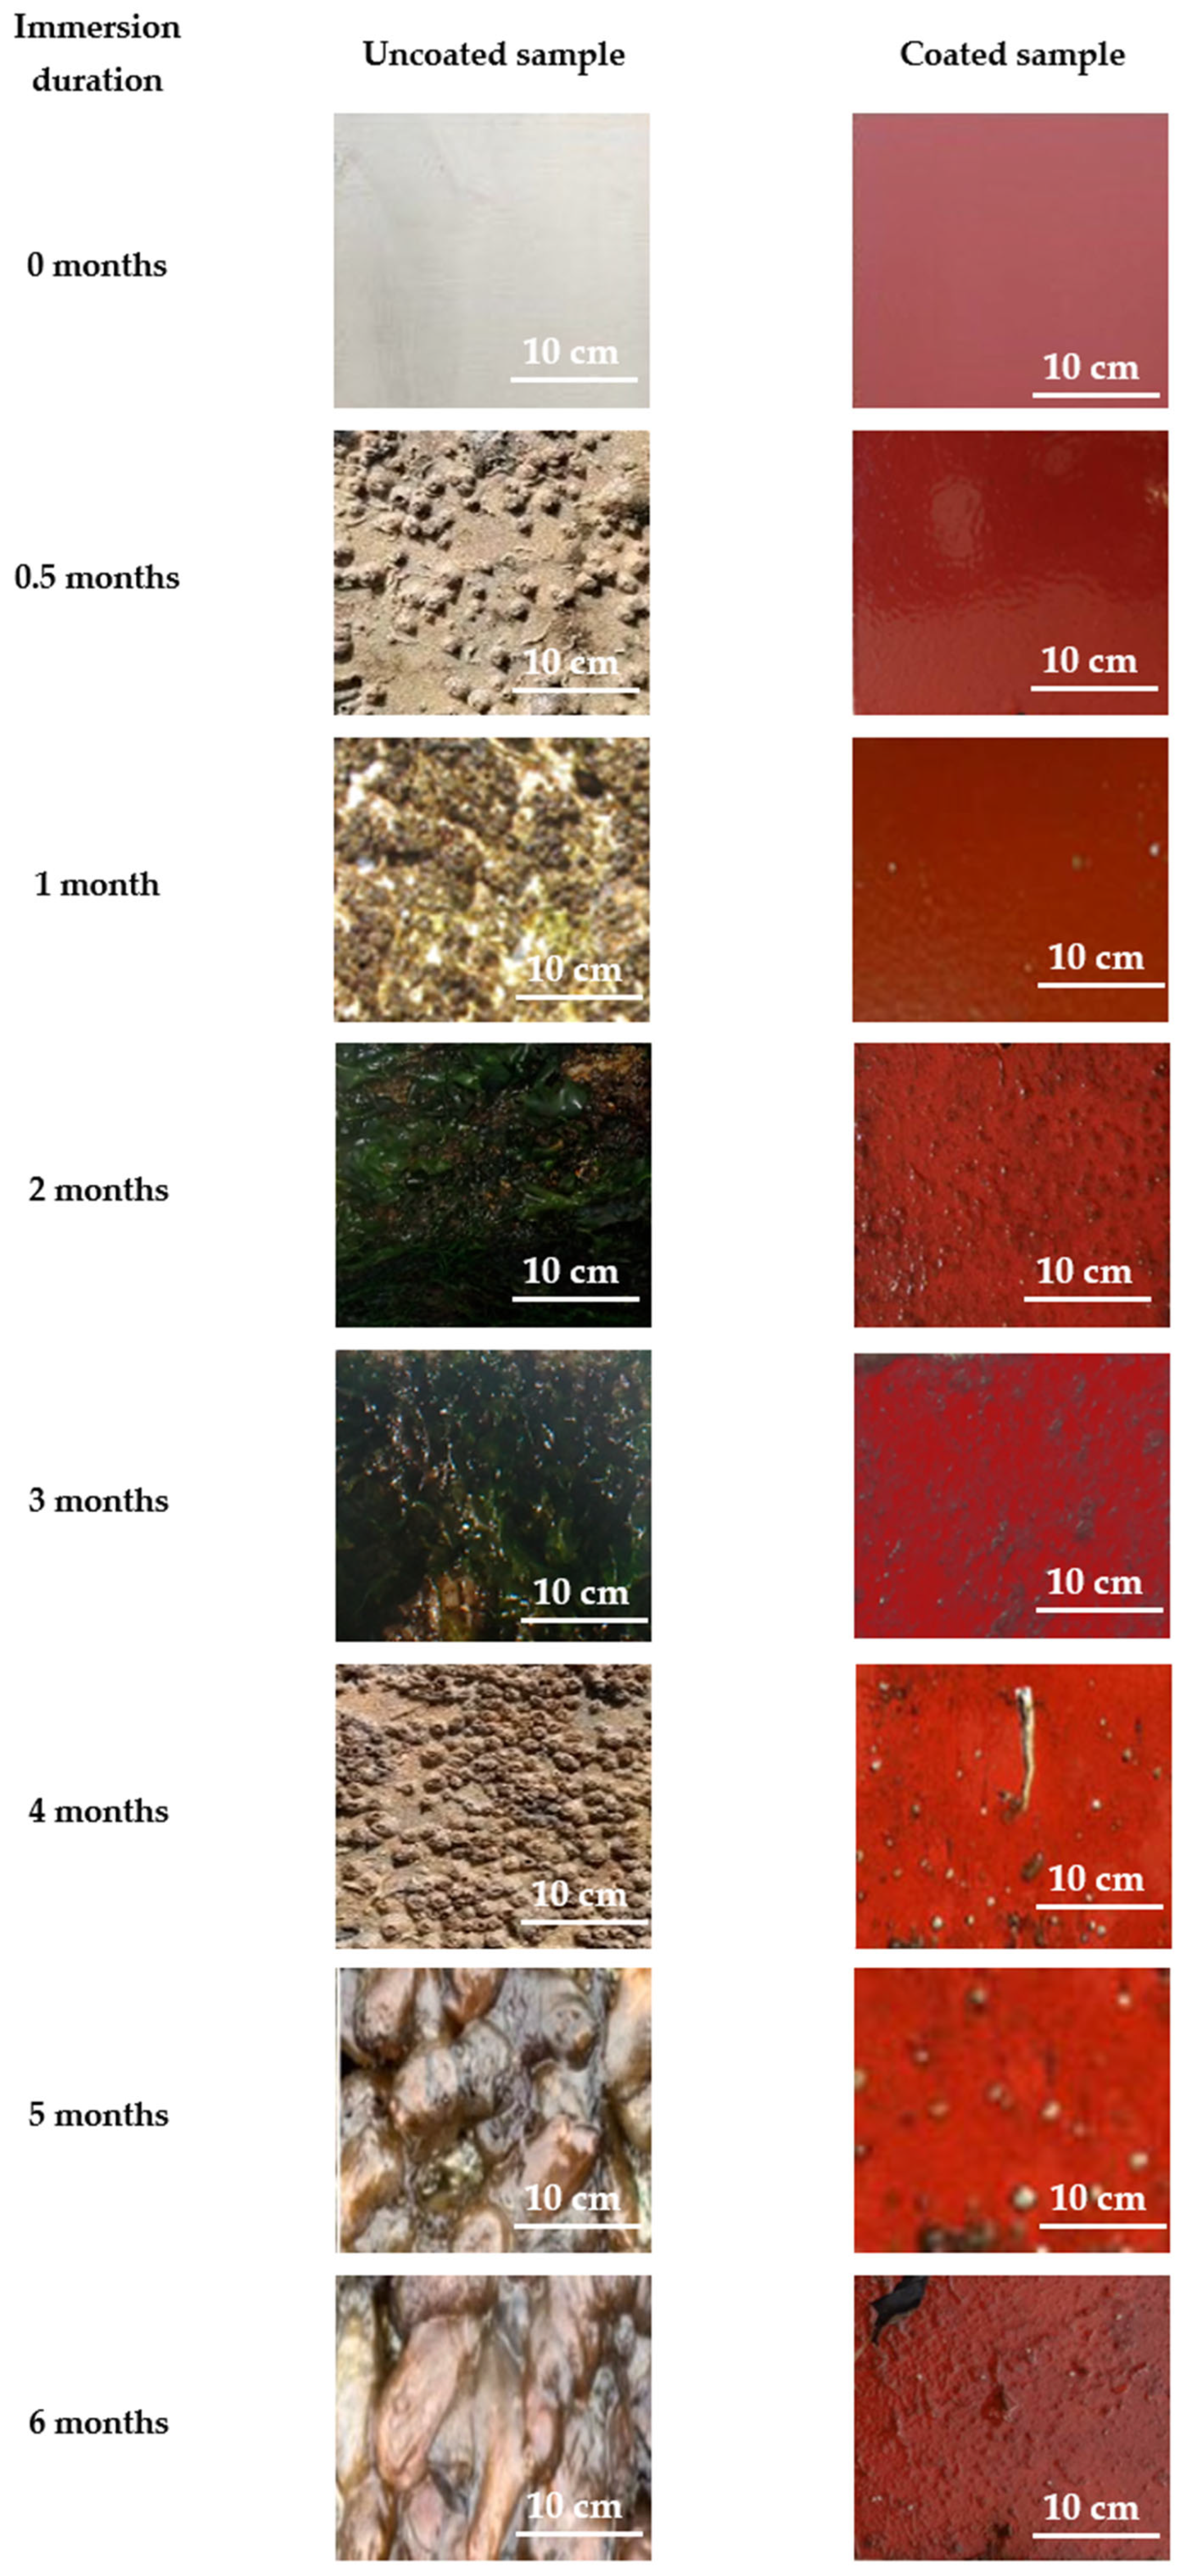
Figure 23 presents representative digital images of the surfaces of the samples submerged in the sea environment of Patras for 6 months.
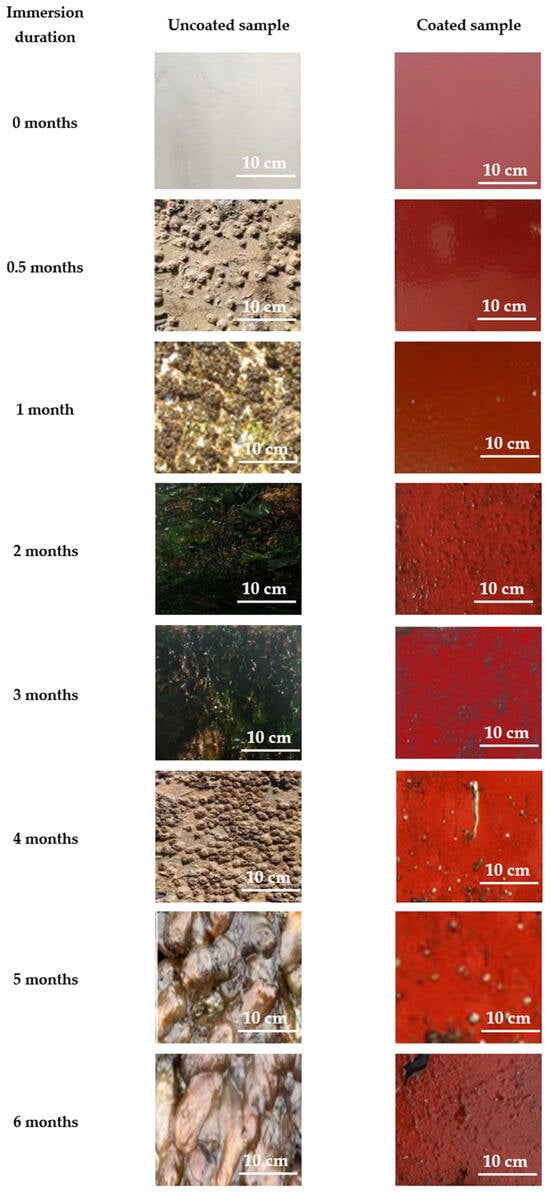
Figure 23.
Indicative digital photographs of coated and uncoated naval steel panels submerged in the seawater at Patra.
The macroscopic visual study distinctly demonstrates the superiority of the antifouling coating compared to the non-coated samples since micro-fouling (silt, slime, and algal spores) is apparent after two months of exposure to seawater. Table 5 provides a qualitative assessment of the colonization species according to the immersion duration. Table 6 features a color scheme that visually represents the degree of fouling, from red (severe fouling) to green (low fouling).
Table 6.
A qualitative evaluation of colonization species based on the duration of exposure for coated and untreated naval steel specimens (The color scheme visually represents the degree of fouling, from red (severe fouling) to green (low fouling); Χ: not presented and √: presented).
As highlighted by the color coding in Table 6, the commonality of foulants developed in the uncoated naval steel samples was distinguished by the early presence of macro-fouling at all locations. In contrast, the antifouling coating successfully prevented the adhesion or growth of the macro-foulants observed in the corresponding uncoated samples.
Regarding the general behavior of the uncoated samples, the dominant organisms in terms of their surface coverage of the uncoated samples were tunicates, bryozoans, and branching, algal, and spiny algae, while hard-shelled organisms were observed in all cases after the eighth week of immersion. After the second month of exposure to seawater, the photographs reveal few visual differences between sites.
In the coated specimens, successful inhibition of macro-colonization and the majority of the micro-foulants is observed up to the second month of immersion in the respective marine environment. Under long immersion times, the coating could not prevent soft micro-fouling. However, the number of micro-fouling organisms observed was low. It appears that the coating is an effective biocide against slime mold, as its presence is neither noticeable nor extensive, even after 6 months of immersion.
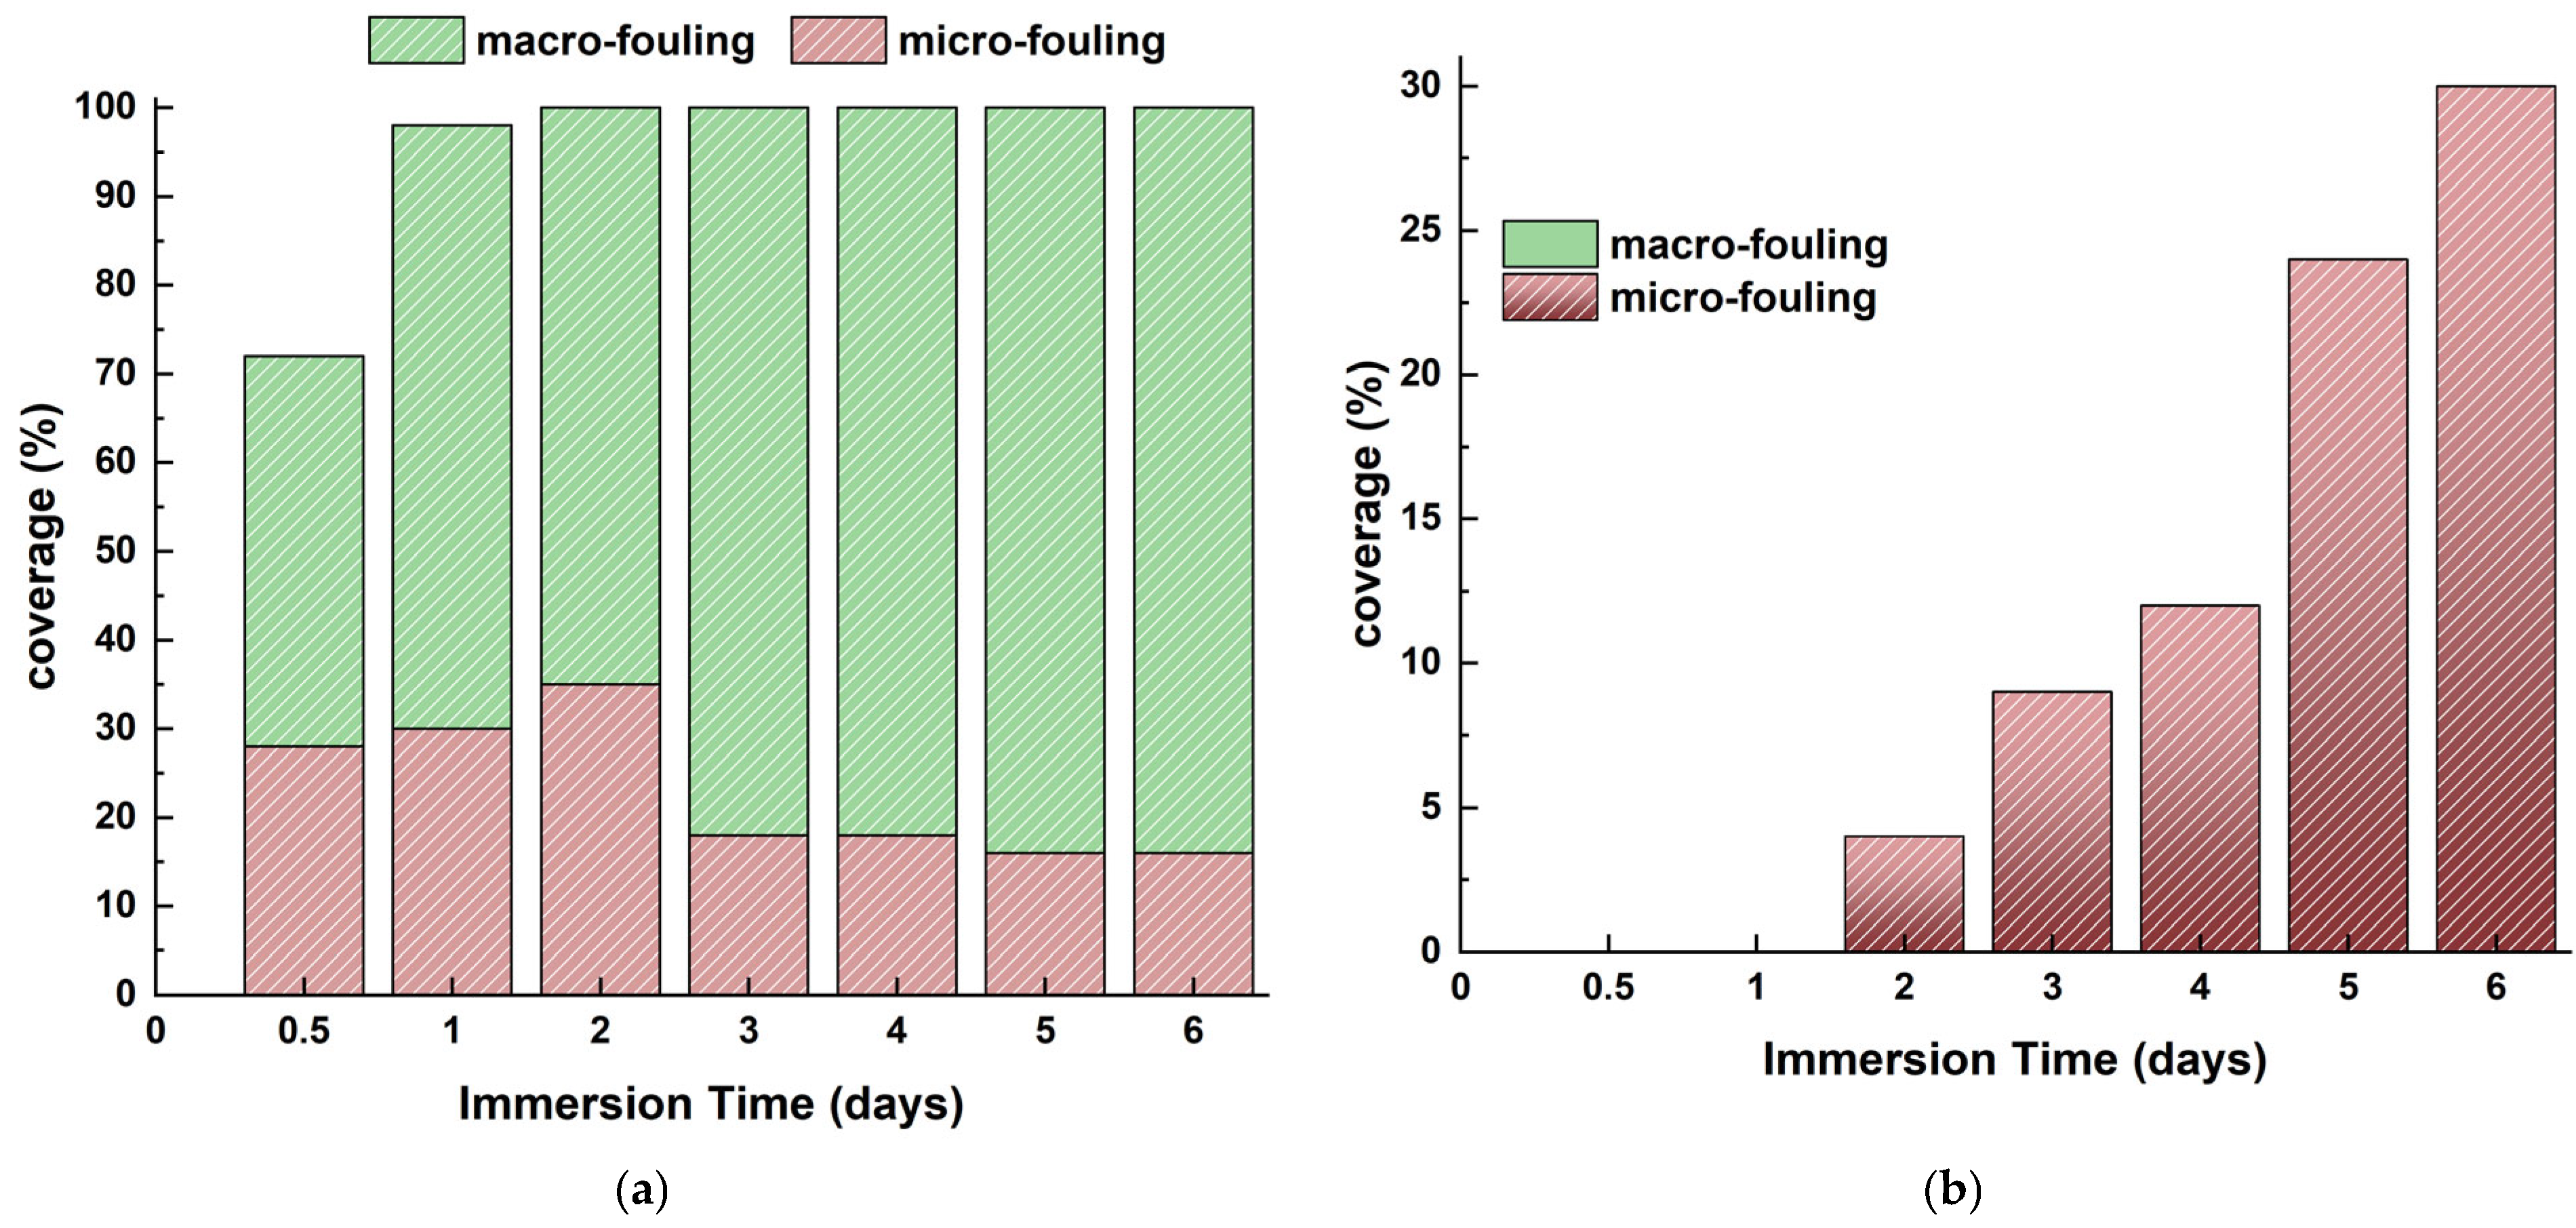
Figure 24 estimates the coverage percentages for micro- and macro-organisms associated with marine biofouling (micro or macro) with the antifouling coating. The coating successfully inhibited micro-fouling for the initial 2 months of immersion. All coated steel samples exhibited the presence of both incipient and advanced slime beginning from the 2 months of immersion. Its coverage does not surpass 30% of the surface following 6 months of residence.
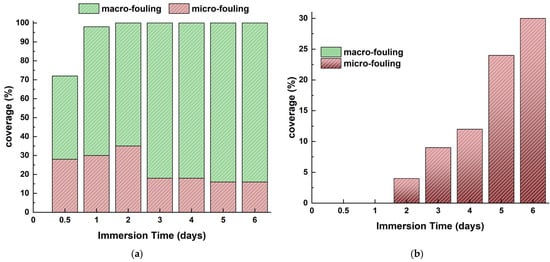
Figure 24.
Micro- and macro-fouling on (a) uncoated and (b) coated naval steel samples submerged in the sea at Patras.
4. Discussion
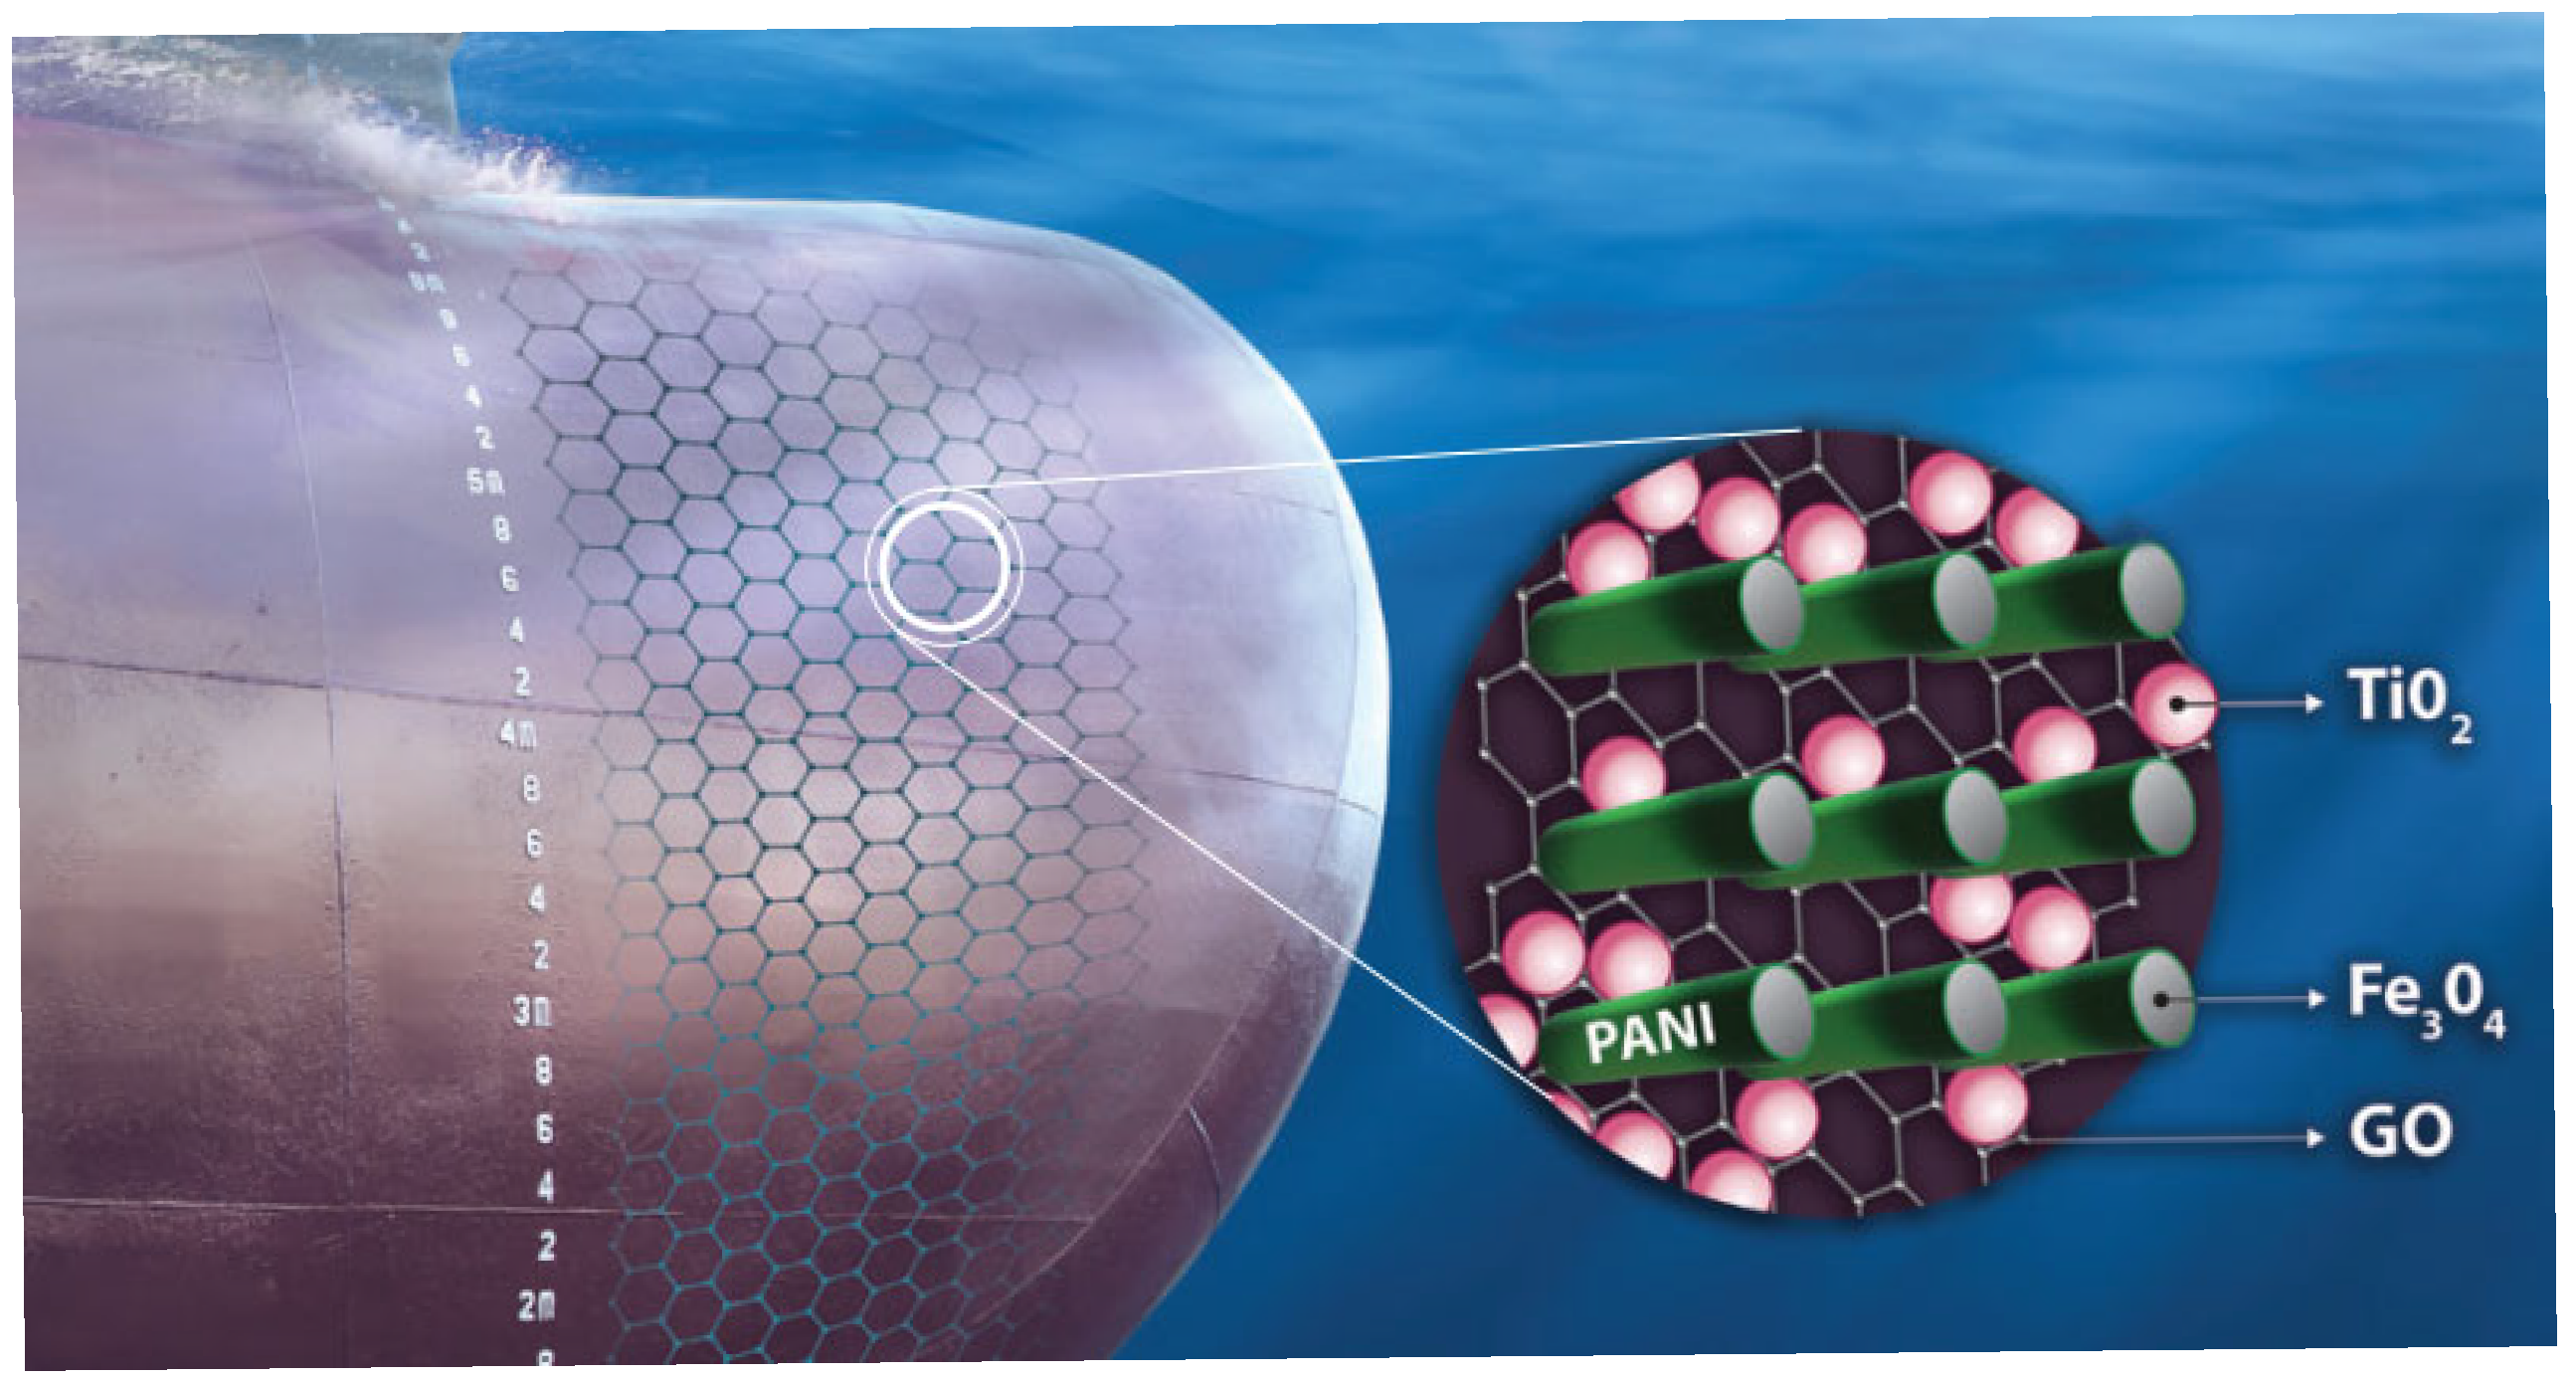
The present study produced an antifouling dispersion coating to safeguard ship hulls from corrosion and fouling. Because the matrix contains a water-soluble resin, the coating can be classified as water-soluble. The coating’s protective capability relies on the synergistic interaction of conductive nanocomposites exhibiting electrical anisotropy, specifically conductive polyaniline (PAni) nanorods externally decorated with magnetite (Fe3O4) nanoparticles, which are oriented perpendicular to the plane established by graphene oxide (GO) sheets modified with titanium dioxide (TiO2) nanoparticles (Figure 25).

Figure 25.
A graphical visual representation of the antifouling coating’s structure.
The PAni nanorods were initially modified with magnetite nanoparticles (Figure 13 and Figure 17) that could readily be oriented in an out-of-plane configuration (Figure 10). The conductivity of the PAni/Fe3O4 nanocomposite (Figure 19) improved the out-of-plane conductivity of the antifouling layer (Figure 19).
The antifouling properties of the coating were augmented by the incorporation of graphene oxide (GO) sheets into the coating matrix. GO sheets prevent biological fouling due to their elevated conductivity (Figure 19). Moreover, GO sheets confer mechanical strength to the matrix [58]. GO is modified with photocatalytically active TiO2 (Figure 14 and Figure 19). Thus, the visible light adsorbed onto the surface of the coating facilitates the formation of antifouling H2O2, which swiftly decomposes into H2O and O2, rendering it environmentally benign [59]. TiO2 absorbs light, forming electron–hole pairs (TiO2 + hvvisible → e− + h+) [60]. These react with water and oxygen to produce reactive oxygen species, including hydroxyl radicals (•OH) (h+ + H2O → •OH + H+) and superoxide anions (O2•−) (e− + O2 → O2•− → H2O2) [61]. Hydrogen peroxide is a mild oxidizing chemical that destroys bacterial cell membranes and DNA; affects biofilm formation; and inhibits algae and microbe attachment [62,63]. Furthermore, H2O2 decomposes into H2O and O2 (2H2O2 → 2H2O + O2), leaving no toxic residues, and is healthy for marine ecosystems [64].
Photocatalytic effects predominantly manifested in the laboratory tests using static immersion with adequate light, rather than in the experiments utilizing natural seawater, due to insufficient light penetration at a depth of 1 m when the samples (coated and untreated) were submerged. In this instance, the incorporation of TiO2 enhanced the conductivity of the PAni nanorods, as it is established that doping PAni with HCl or combining it with specific nanostructured materials, such as TiO2, markedly enhances its conductivity and electrochemical reversibility over extended durations [65].
The electrical conductivity of the antifouling coating might be important, especially when it is employed as an advanced functional antifouling system. Specifically, the τo electroactive antifouling coating combines conductive polymers (like polyaniline) with conductive nanomaterials (graphene oxide and Fe3O4), which self-generate charges in response to environmental stimuli and establish pathways for electron flow [66,67,68]. The randomly distributed conductivity (Figure 18 and Figure 19) refers to a randomly generated electric field that interferes with the electrostatic interactions between microbial cells and a coated surface [69,70]. Many microbes use extracellular polymeric molecules to adhere, which are frequently negatively charged [71]. The electric field repels or destabilizes these charges, rendering adhesion energetically undesirable [71,72]. Even if initial attachment occurs, the electric field damages the microorganisms’ cell membrane potential (micro-electroporation effects) and inhibits the formation of extracellular polymeric substances, preventing biofilm matrix development [73,74,75]. Thus, with an imbalance in the distribution of the “smart” coating, localized electric fields are generated, disrupting biofilm formation and reducing microorganismal adhesion. The antifouling coating’s conductivity, along with its hydrophobicity (WCA > 90°) and photocatalytic activity (the presence of anatase), provides multi-modal antifouling properties.
Table 7 presents a comparative comparison of conductive antifouling coatings, with emphasis on their processes, effectiveness, and practical factors.
Table 7.
Comparison table of conductive antifouling coatings.
According to Table 6, PAni-based systems (pure or composites) excel for both anticorrosion and antifouling, but their level of conductivity must be balanced. PEDOT is chemically stable but not as widely studied as PAni in antifouling. Cu2O/PANI hybrids reduce the copper release (important for environmental regulations) while maintaining antifouling action. The antifouling coating investigated in the present study introduces photocatalytic activity and structural barriers, offering high-performance antifouling under nano-scale contact.
The specified configuration of PAni/Fe3O4 and GO/TiO2 nanocomposites (Figure 25) significantly mitigates the issue of biological contamination (Figure 23 and Figure 24b). Following 30 days of static exposure to artificial conditions (Figure 20) and 6 months of immersion in natural seawater (Figure 23), the coating retains its adhesion to the steel substrate, exhibiting no surface delamination. The lack of porosity in the coating (Figure 20) enhances the efficacy of corrosion prevention (reduced corrosion rates) relative to that for the uncoated specimen in both the laboratory and field tests. In contrast to previous anticorrosive coatings, no primer layer or topcoat exists between the steel and the anticorrosion coating to improve the adherence and bolster the coating’s corrosion resistance [87].
To assess the efficacy of the antifouling coating in preventing or retarding the corrosion process for submerged naval steel specimens, the inhibition efficiency (ΙΕ%) parameter is implemented. IE% is defined as the ratio of the difference in weight between the uncoated and coated specimens to the weight of the uncoated specimen. The outcomes of the durations of immersion in ASW evaluated are displayed in Table 8.
Table 8.
The inhibition efficiency (IE%) values for the antifouling coating.
The elevated inhibitory efficiency (%) of the coating verifies that the coating layer functions as a protective film, isolating the surface of the naval steel from the corrosive medium (seawater). The extremely low corrosion rates demonstrated by the coating during the 30-day experimental immersion period confirm this. Consequently, the antifouling coating functions as a corrosion-resistant layer on naval steel in a saline solution. The corrosion efficacy of the coating mostly results from the presence of oxygen and nitrogen atoms, as well as aromatic rings, the presence of which is verified by an FTIR analysis (Figure 13, Figure 14 and Figure 15).
The initial phases of colonization in real saltwater conditions are inhibited due to the elevated in-plane conductivity caused by the modified GO sheets (Figure 20 and Figure 23). The photocatalytically active TiO2 enhances the anti-corrosion properties of the in-plane coating (Figure 20). The water contact angles of the coating demonstrate hydrophobic behavior, resulting in reduced inter-wettability, which hinders micro-foulants from effectively wetting the coating surface (Figure 23). The resulting electrostatic anisotropy simultaneously improves the charge diffusion mechanisms, so constraining electrostatic attractions and inhibiting the primary adsorption of bacteria and microorganisms via their negatively charged outer membrane (Figure 23). Consequently, as the coating undergoes self-polishing (Figure 22) via the gradual dissolution of the resin, a segment of the modified PAni nanorods is revealed, rendering out-of-plane conductivity increasingly significant. Colonization is now successfully managed through the direct interaction of microorganisms with the PAni nanorods. This establishes a secondary antifouling defense zone predicated on fouling-release characteristics, so augmenting the basic antifouling attributes of the coating.
The results from in situ immersion demonstrate that the coating functions as an efficient barrier with low permeability to the steel surface, displaying exceptional durability for naval steel over a prolonged duration.
5. Conclusions
This research created a water-soluble antifouling coating to safeguard ship hulls from corrosion and fouling. The protective efficacy of the coating depends on the synergistic interaction of conductive nanocomposites, particularly conductive polyaniline (PAni) nanorods externally decorated with magnetite (Fe3O4) nanoparticles and GO sheets modified with titanium dioxide (TiO2) nanoparticles. The PAni/Fe3O4 nanocomposite is oriented perpendicular to the plane formed by the GO/TiO2.
The PAni/Fe3O4 nanocomposite enhances the out-of-plane conductivity of the antifouling layer. The coating’s antifouling properties are enhanced by including graphene oxide (GO) sheets into the matrix, which minimize biological fouling owing to their high conductivity and mechanical robustness. The photocatalytically active TiO2 modifies GO, promoting the production of antifouling H2O2, which rapidly decomposes into H2O and O2, making it environmentally safe.
The designated configuration of the PAni/Fe3O4 and GO/TiO2 nanocomposites substantially reduces biological contamination and improves the effectiveness of corrosion prevention. The coating maintains its adhesion to the steel substrate over 30 days of static exposure to artificial circumstances and 6 months of immersion in natural saltwater. The corrosion efficacy of the coating is mostly attributed to the presence of oxygen and nitrogen atoms, together with aromatic rings.
The coating impedes the earliest stages of colonization in natural saltwater conditions due to the increased in-plane conductivity resulting from the altered GO sheets. The photocatalytically active TiO2 augments the anticorrosion characteristics of the in-plane coating, enhancing the charge diffusion mechanisms and obstructing the initial adsorption of germs and pathogens due to their negatively charged outer membrane. As the coating experiences self-polishing through gradual degradation of the resin, a portion of the modified PAni nanorods is exposed, rendering out-of-plane conductivity increasingly important. This creates a supplementary antifouling defensive zone informed by contaminant release characteristics, enhancing the fundamental antifouling properties of the coating.
6. Patents
There is one patent resulting from the work reported in this manuscript: WO2024224120A1, Electrically anisotropic antifouling coatings, BFP Advanced Technologies, 2024.
Author Contributions
Conceptualization: P.V. and N.D.P.; methodology: P.V. and N.D.P.; investigation: P.V.; data curation: P.P.F. and P.V.; writing—original draft preparation: P.V. and P.P.F.; supervision: N.D.P.; project administration: P.V. and N.D.P.; funding acquisition, N.D.P. All authors have read and agreed to the published version of the manuscript.
Funding
This research was co-financed by the European Regional Development Fund of the European Union and Greek national funds through the Operational Program Competitiveness, Entrepreneurship, and Innovation, under the call RESEARCH—CREATE—INNOVATE (project code: T2EDK-00868).
Data Availability Statement
The data presented in this study are available on request from the corresponding author.
Acknowledgments
The authors acknowledge the precious help and technical assistance from their colleagues working at the Nanotechnology processes for solar energy conversion and environmental protection lab of INN/NCSRD.
Conflicts of Interest
Author Nikolaos D. Papadopoulos was employed by the BFP Advanced Technologies G.P. The remaining authors declare that the research was conducted in the absence of any commercial or financial relationships that could be construed as a potential conflict of interest.
Abbreviations
The following abbreviations are used in this manuscript:
| PAni | polyaniline |
| GO | graphene oxide |
| TBT | tributyltin |
| SPC | Self-Polishing Coating |
| ASW | artificial seawater |
| AF | antifouling |
| β-CD | β-cyclodextrin |
| APS | ammonium persulfate |
| PEO | poly ethylene oxide |
| SEM | Scanning Electron Microscopy |
| TEM | Transmission Electron Microscope |
| FTIR | Fourier Transform Infrared Spectroscopy |
| TUNA | Tunneling Atomic Force Microscopy |
| XRF | X-Ray Fluorescence |
| Wi | the weight of the specimen prior-corrosion |
| Wf | the weight of the specimen post-corrosion |
| WL | weight loss |
| c-AFM | conductive AFM |
| WCA | water contact angle |
| IE | inhibition efficiency |
References
- Caruso, G. Microbial Colonization in Marine Environments: Overview of Current Knowledge and Emerging Research Topics. JMSE 2020, 8, 78. [Google Scholar] [CrossRef]
- Li, L.; Hong, H.; Cao, J.; Yang, Y. Progress in Marine Antifouling Coatings: Current Status and Prospects. Coatings 2023, 13, 1893. [Google Scholar] [CrossRef]
- Clare, A.S.; Rittschof, D.; Gerhart, D.J.; Maki, J.S. Molecular Approaches to Nontoxic Antifouling. Invertebr. Reprod. Dev. 1992, 22, 67–76. [Google Scholar] [CrossRef]
- Vuong, P.; McKinley, A.; Kaur, P. Understanding Biofouling and Contaminant Accretion on Submerged Marine Structures. Npj Mater. Degrad. 2023, 7, 50. [Google Scholar] [CrossRef]
- Cirillo, A.; Tomaiuolo, G.; Guido, S. Membrane Fouling Phenomena in Microfluidic Systems: From Technical Challenges to Scientific Opportunities. Micromachines 2021, 12, 820. [Google Scholar] [CrossRef]
- Martín-Rodríguez, A.J.; Babarro, J.M.F.; Lahoz, F.; Sansón, M.; Martín, V.S.; Norte, M.; Fernández, J.J. From Broad-Spectrum Biocides to Quorum Sensing Disruptors and Mussel Repellents: Antifouling Profile of Alkyl Triphenylphosphonium Salts. PLoS ONE 2015, 10, e0123652. [Google Scholar] [CrossRef] [PubMed]
- Weber, F.; Esmaeili, N. Marine Biofouling and the Role of Biocidal Coatings in Balancing Environmental Impacts. Biofouling 2023, 39, 661–681. [Google Scholar] [CrossRef]
- Vinagre, P.A.; Simas, T.; Cruz, E.; Pinori, E.; Svenson, J. Marine Biofouling: A European Database for the Marine Renewable Energy Sector. JMSE 2020, 8, 495. [Google Scholar] [CrossRef]
- Yebra, D.M.; Kiil, S.; Dam-Johansen, K. Antifouling Technology—Past, Present and Future Steps towards Efficient and Environmentally Friendly Antifouling Coatings. Prog. Org. Coat. 2004, 50, 75–104. [Google Scholar] [CrossRef]
- Champ, M.A. A Review of Organotin Regulatory Strategies, Pending Actions, Related Costs and Benefits. Sci. Total Environ. 2000, 258, 21–71. [Google Scholar] [CrossRef]
- Selim, M.S.; Shenashen, M.A.; El-Safty, S.A.; Higazy, S.A.; Selim, M.M.; Isago, H.; Elmarakbi, A. Recent Progress in Marine Foul-Release Polymeric Nanocomposite Coatings. Prog. Mater. Sci. 2017, 87, 1–32. [Google Scholar] [CrossRef]
- Chambers, L.D.; Stokes, K.R.; Walsh, F.C.; Wood, R.J.K. Modern Approaches to Marine Antifouling Coatings. Surf. Coat. Technol. 2006, 201, 3642–3652. [Google Scholar] [CrossRef]
- Dafforn, K.A.; Lewis, J.A.; Johnston, E.L. Antifouling Strategies: History and Regulation, Ecological Impacts and Mitigation. Mar. Pollut. Bull. 2011, 62, 453–465. [Google Scholar] [CrossRef]
- Satasiya, G.; Kumar, M.A.; Ray, S. Biofouling Dynamics and Antifouling Innovations: Transitioning from Traditional Biocides to Nanotechnological Interventions. Environ. Res. 2025, 269, 120943. [Google Scholar] [CrossRef]
- Railkin, A.I. Marine Biofouling, 1st ed.; CRC Press: Boca Raton, FL, USA, 2003; ISBN 978-0-203-50323-2. [Google Scholar]
- Terlizzi, A.; Fraschetti, S.; Gianguzza, P.; Faimali, M.; Boero, F. Environmental Impact of Antifouling Technologies: State of the Art and Perspectives. Aquat. Conserv. 2001, 11, 311–317. [Google Scholar] [CrossRef]
- Omae, I. General Aspects of Tin-Free Antifouling Paints. Chem. Rev. 2003, 103, 3431–3448. [Google Scholar] [CrossRef] [PubMed]
- Wahl, M. Marine Epibiosis. I. Fouling and Antifouling: Some Basic Aspects. Mar. Ecol. Prog. Ser. 1989, 58, 175–189. [Google Scholar] [CrossRef]
- Sahoo, B.N.; Thomas, P.J.; Thomas, P.; Greve, M.M. Antibiofouling Coatings for Marine Sensors: Progress and Perspectives on Materials, Methods, Impacts, and Field Trial Studies. ACS Sens. 2025, 10, 1600–1619. [Google Scholar] [CrossRef]
- Jin, H.; Wang, J.; Tian, L.; Gao, M.; Zhao, J.; Ren, L. Recent Advances in Emerging Integrated Antifouling and Anticorrosion Coatings. Mater. Des. 2022, 213, 110307. [Google Scholar] [CrossRef]
- Papadopoulos, N.D.; Vourna, P.; Falara, P.P.; Koutsaftiki, P.; Xafakis, S. Dual-Function Coatings to Protect Absorbent Surfaces from Fouling. AIMSMATES 2023, 10, 981–1003. [Google Scholar] [CrossRef]
- Schultz, M.P.; Walker, J.M.; Steppe, C.N.; Flack, K.A. Impact of Diatomaceous Biofilms on the Frictional Drag of Fouling-Release Coatings. Biofouling 2015, 31, 759–773. [Google Scholar] [CrossRef]
- Schultz, M.P. Effects of Coating Roughness and Biofouling on Ship Resistance and Powering. Biofouling 2007, 23, 331–341. [Google Scholar] [CrossRef]
- Falara, P.P.; Papadopoulos, N.D.; Vourna, P. Microstructure and Performance of Antibiofouling Coatings on High-Strength Steel Substrates Immersed in the Marine Environment. Micro 2022, 2, 277–294. [Google Scholar] [CrossRef]
- Paz-Villarraga, C.A.; Castro, Í.B.; Fillmann, G. Biocides in Antifouling Paint Formulations Currently Registered for Use. Environ. Sci. Pollut. Res. 2022, 29, 30090–30101. [Google Scholar] [CrossRef]
- Papadopoulos, N.; Vourna, P.; Falara, P.; Vourna, P. A Modern Approach Towards Efficient Antifouling Coating Technologies. Nanotechnol. Adv. Mater. Sci. 2023, 6, 1–4. [Google Scholar] [CrossRef]
- Banerjee, I.; Pangule, R.C.; Kane, R.S. Antifouling Coatings: Recent Developments in the Design of Surfaces That Prevent Fouling by Proteins, Bacteria, and Marine Organisms. Adv. Mater. 2011, 23, 690–718. [Google Scholar] [CrossRef]
- Farkas, A.; Degiuli, N.; Martić, I. An Investigation into the Effect of Hard Fouling on the Ship Resistance Using CFD. Appl. Ocean. Res. 2020, 100, 102205. [Google Scholar] [CrossRef]
- Byrnes, T.A.; Dunn, R.J.K. Boating- and Shipping-Related Environmental Impacts and Example Management Measures: A Review. JMSE 2020, 8, 908. [Google Scholar] [CrossRef]
- Liu, P.; Zhang, H.; Fan, Y.; Xu, D. Microbially Influenced Corrosion of Steel in Marine Environments: A Review from Mechanisms to Prevention. Microorganisms 2023, 11, 2299. [Google Scholar] [CrossRef] [PubMed]
- Davidson, I.C.; Smith, G.; Ashton, G.V.; Ruiz, G.M.; Scianni, C. An Experimental Test of Stationary Lay-up Periods and Simulated Transit on Biofouling Accumulation and Transfer on Ships. Biofouling 2020, 36, 455–466. [Google Scholar] [CrossRef] [PubMed]
- Shi, X.; Liang, H.; Li, Y. Review of Progress in Marine Anti-Fouling Coatings: Manufacturing Techniques and Copper- and Silver-Doped Antifouling Coatings. Coatings 2024, 14, 1454. [Google Scholar] [CrossRef]
- Sarkar, P.K.; Pawar, S.S.; Rath, S.K.; Kandasubramanian, B. Anti-Barnacle Biofouling Coatings for the Protection of Marine Vessels: Synthesis and Progress. Environ. Sci. Pollut. Res. 2022, 29, 26078–26112. [Google Scholar] [CrossRef]
- Nurioglu, A.G.; Esteves, A.C.C.; De With, G. Non-Toxic, Non-Biocide-Release Antifouling Coatings Based on Molecular Structure Design for Marine Applications. J. Mater. Chem. B 2015, 3, 6547–6570. [Google Scholar] [CrossRef]
- Hu, P.; Xie, Q.; Ma, C.; Zhang, G. Silicone-Based Fouling-Release Coatings for Marine Antifouling. Langmuir 2020, 36, 2170–2183. [Google Scholar] [CrossRef]
- Xie, L.; Hong, F.; He, C.; Ma, C.; Liu, J.; Zhang, G.; Wu, C. Coatings with a Self-Generating Hydrogel Surface for Antifouling. Polymer 2011, 52, 3738–3744. [Google Scholar] [CrossRef]
- Liang, H.; Shi, X.; Li, Y. Technologies in Marine Antifouling and Anti-Corrosion Coatings: A Comprehensive Review. Coatings 2024, 14, 1487. [Google Scholar] [CrossRef]
- Poornima Vijayan, P.; Formela, K.; Saeb, M.R.; Chithra, P.G.; Thomas, S. Integration of Antifouling Properties into Epoxy Coatings: A Review. J. Coat. Technol. Res. 2022, 19, 269–284. [Google Scholar] [CrossRef]
- Maan, A.M.C.; Hofman, A.H.; De Vos, W.M.; Kamperman, M. Recent Developments and Practical Feasibility of Polymer-Based Antifouling Coatings. Adv. Funct. Mater. 2020, 30, 2000936. [Google Scholar] [CrossRef]
- Romeu, M.J.; Mergulhão, F. Development of Antifouling Strategies for Marine Applications. Microorganisms 2023, 11, 1568. [Google Scholar] [CrossRef] [PubMed]
- Ryan, E.; Turkmen, S.; Benson, S. An Investigation into the Application and Practical Use of (UV) Ultraviolet Light Technology for Marine Antifouling. Ocean. Eng. 2020, 216, 107690. [Google Scholar] [CrossRef]
- Selim, M.S.; Hamouda, H.I.; Fatthallah, N.A.; Mostafae, M.S.; Higazy, S.A.; Shabana, S.; EL-Saeed, A.M.; Hao, Z. Advanced Bioinspired Superhydrophobic Marine Antifouling Coatings. In Superhydrophobic Coating—Recent Advances in Theory and Applications; IntechOpen: London, UK, 2023; ISBN 978-0-85466-281-4. [Google Scholar]
- Mamman, R.O.; Johnson, T.; Weerakkody, T.; Lamuta, C. Fouling Release Mechanism of an Octopus-Inspired Smart Skin. Adv. Funct. Mater. 2024, 34, 41. [Google Scholar] [CrossRef]
- Niu, W.; Qian, J.; Wang, X.; Liang, C.; Cui, L.; Tian, H.; Liaw, P.K. Research Progress of Self-Healing Coatings on Ships Against Biological Pollution: A Review. Coatings 2025, 15, 486. [Google Scholar] [CrossRef]
- Guo, R.; Tan, Y.; Fang, M.; Li, L.; Chen, Q.; Qin, W.; Liu, N.; Mo, Z. Multifunctional Superhydrophobic Coatings with Self-Cleaning and Anti-Fouling Properties for Corrosion Protection of Metals. Surf. Interfaces 2024, 50, 104476. [Google Scholar] [CrossRef]
- Nahum, Y.; Gross, N.; Cerrone, A.; Matouš, K.; Nerenberg, R. Effect of Biofilm Physical Characteristics on Their Susceptibility to Antibiotics: Impacts of Low-Frequency Ultrasound. Npj Biofilms Microbiomes 2024, 10, 70. [Google Scholar] [CrossRef] [PubMed]
- Kunlasubpreedee, P.; Tobino, T.; Nakajima, F. Influence of High-Frequency, Low-Voltage Alternating Electric Fields on Biofilm Development Processes of Escherichia coli and Pseudomonas aeruginosa. Water 2023, 15, 3055. [Google Scholar] [CrossRef]
- Liu, G.; Yuan, Z.; Incecik, A.; Leng, D.; Wang, S.; Li, Z. A New Biomimetic Antifouling Method Based on Water Jet for Marine Structures. Proc. Inst. Mech. Eng. Part M J. Eng. Marit. Environ. 2020, 234, 573–584. [Google Scholar] [CrossRef]
- Simion, D.; Postolache, F.; Fleacă, B.; Fleacă, E. AI-Driven Predictive Maintenance in Modern Maritime Transport—Enhancing Operational Efficiency and Reliability. Appl. Sci. 2024, 14, 9439. [Google Scholar] [CrossRef]
- Kim, H.-J. Strategic Actions for Sustainable Vessel Hull Coatings in Line with the UN SDGs. Jamet 2021, 45, 231–242. [Google Scholar] [CrossRef]
- D 1141-52; Standard Specifications for Substitute Ocean Water. ASTM International: West Conshohocken, PA, USA, 1960; pp. 398–399ISBN 978-0-8031-6884-8.
- ASTM G31-72-; Standard Practice for Laboratory Immersion Corrosion Testing of Metals. ASTM International: West Conshohocken, PA, USA, 2004.
- Vourna, P.; Papadopoulos, N.D.; Falara, P.P.; Hristoforou, E. Barkhausen Noise Emission of Naval Steel: The Impact of Seawater Corrosion Coverage and Depth. NDT E Int. 2025, 151, 103319. [Google Scholar] [CrossRef]
- Vourna, P.; Falara, P.P.; Hristoforou, E.V.; Papadopoulos, N.D. Corrosion and Antifouling Behavior of a New Biocide-Free Antifouling Paint for Ship Hulls Under Both Artificially Simulated and Natural Marine Environment. Materials 2025, 18, 3095. [Google Scholar] [CrossRef] [PubMed]
- Media Cybernetics. Image-Pro® Discovery: The Enhanced Image Analysis Solution from the Image-Pro Family. Available online: https://www.digitalimagingsystems.co.uk/pdfs/image-pro-discovery.pdf (accessed on 15 July 2025).
- Bui, Q.M.; Vu, T.Q.; Vuong, X.T.; Nguyen, V.D.; Nguyen, L.T.N.; Le, H.T.; Nguyen, H.T.H.; Nguyen, V.P. Removal of Fluoroquinolone Antibiotics by Chitosan–Magnetite from Aqueous: Single and Binary Adsorption. Processes 2023, 11, 2396. [Google Scholar] [CrossRef]
- Abdullah, T.A.; Juzsakova, T.; Rasheed, R.T.; Salman, A.D.; Sebestyen, V.; Domokos, E.; Sluser, B.; Cretescu, I. Polystyrene-Fe3O4-MWCNTs Nanocomposites for Toluene Removal from Water. Materials 2021, 14, 5503. [Google Scholar] [CrossRef]
- Wan, Z.; Li, J.; Yang, D.; Hou, S. Microstructural and Mechanical Properties Characterization of Graphene Oxide-Reinforced Ti-Matrix Composites. Coatings 2022, 12, 120. [Google Scholar] [CrossRef]
- Lin, C.-Y.; Chen, Y.-C. Effects of Heterogeneous Sulfated Acid Photocatalysts and Irradiation of Ultraviolet Light on the Chemical Conversion and Characteristics of Antifreeze from Bioglycerol. Processes 2024, 12, 383. [Google Scholar] [CrossRef]
- Haque, F.; Blanchard, A.; Laipply, B.; Dong, X. Visible-Light-Activated TiO2-Based Photocatalysts for the Inactivation of Pathogenic Bacteria. Catalysts 2024, 14, 855. [Google Scholar] [CrossRef]
- Kusiak-Nejman, E.; Morawski, A.W. TiO2/Graphene-Based Nanocomposites for Water Treatment: A Brief Overview of Charge Carrier Transfer, Antimicrobial and Photocatalytic Performance. Appl. Catal. B Environ. 2019, 253, 179–186. [Google Scholar] [CrossRef]
- Papa, L.; Mezzapesa, F.P.; Volpe, A.; Gaudiuso, C.; Ancona, A. Bacterial Adhesion Eradication and Biofilm Inhibition through Laser Surface Texturing. Appl. Mater. Today 2025, 45, 102801. [Google Scholar] [CrossRef]
- Dawan, J.; Zhang, S.; Ahn, J. Recent Advances in Biofilm Control Technologies for the Food Industry. Antibiotics 2025, 14, 254. [Google Scholar] [CrossRef] [PubMed]
- Shi, X.; Zhang, R.; Sand, W.; Mathivanan, K.; Zhang, Y.; Wang, N.; Duan, J.; Hou, B. Comprehensive Review on the Use of Biocides in Microbiologically Influenced Corrosion. Microorganisms 2023, 11, 2194. [Google Scholar] [CrossRef]
- Ansari, M.O.; Mohammad, F. Thermal Stability of HCl-doped-polyaniline and TiO2 Nanoparticles-based Nanocomposites. J. Appl. Polym. Sci. 2012, 124, 4433–4442. [Google Scholar] [CrossRef]
- Fazli-Shokouhi, S.; Nasirpouri, F.; Khatamian, M. Polyaniline-Modified Graphene Oxide Nanocomposites in Epoxy Coatings for Enhancing the Anticorrosion and Antifouling Properties. J. Coat. Technol. Res. 2019, 16, 983–997. [Google Scholar] [CrossRef]
- Guo, Y.; Qi, Y.; Zhang, C.; Zhang, S.; Zhang, Z. The Effect of Conductive Polyaniline on the Anti-Fouling and Electromagnetic Properties of Polydimethylsiloxane Coatings. Polymers 2023, 15, 2944. [Google Scholar] [CrossRef]
- Baldissera, A.F.; Miranda, K.L.D.; Bressy, C.; Martin, C.; Margaillan, A.; Ferreira, C.A. Using Conducting Polymers as Active Agents for Marine Antifouling Paints. Mater. Res. 2015, 18, 1129–1139. [Google Scholar] [CrossRef]
- Torbati, M.; Mozaffari, K.; Liu, L.; Sharma, P. Coupling of Mechanical Deformation and Electromagnetic Fields in Biological Cells. Rev. Mod. Phys. 2022, 94, 025003. [Google Scholar] [CrossRef]
- Gall, I.; Herzberg, M.; Oren, Y. The Effect of Electric Fields on Bacterial Attachment to Conductive Surfaces. Soft Matter 2013, 9, 2443. [Google Scholar] [CrossRef]
- Flemming, H.-C.; Van Hullebusch, E.D.; Little, B.J.; Neu, T.R.; Nielsen, P.H.; Seviour, T.; Stoodley, P.; Wingender, J.; Wuertz, S. Microbial Extracellular Polymeric Substances in the Environment, Technology and Medicine. Nat. Rev. Microbiol. 2025, 23, 87–105. [Google Scholar] [CrossRef] [PubMed]
- Costa, O.Y.A.; Raaijmakers, J.M.; Kuramae, E.E. Microbial Extracellular Polymeric Substances: Ecological Function and Impact on Soil Aggregation. Front. Microbiol. 2018, 9, 1636. [Google Scholar] [CrossRef]
- Sadeghzadeh, R.; Rafieian, F.; Keshani, M.; Salehi, Z.; Jafari, S.M. Novel Strategies to Control the Biofilm Formation by Pseudomonas aeruginosa in the Food Industry. Future Foods 2024, 10, 100481. [Google Scholar] [CrossRef]
- Ciarolla, A.A.; Lapin, N.; Williams, D.; Chopra, R.; Greenberg, D.E. Physical Approaches to Prevent and Treat Bacterial Biofilm. Antibiotics 2023, 12, 54. [Google Scholar] [CrossRef]
- Freebairn, D.; Linton, D.; Harkin-Jones, E.; Jones, D.S.; Gilmore, B.F.; Gorman, S.P. Electrical Methods of Controlling Bacterial Adhesion and Biofilm on Device Surfaces. Expert Rev. Med. Devices 2013, 10, 85–103. [Google Scholar] [CrossRef]
- Hou, J.; Liu, S.; Jiang, X.; Waterhouse, G.I.N.; Zhang, Z.-M.; Yu, L. Polyaniline/Graphite Carbon Nitride Composite Coatings with Outstanding Photo-Induced Anodic Antifouling and Antibacterial Properties under Visible Light. Prog. Org. Coat. 2021, 154, 106203. [Google Scholar] [CrossRef]
- Zhang, Q.; Liu, X.; Jiang, Y.; Xiao, F.; Wang, W.; Duan, J. Graphene Research Progress in the Application of Anticorrosion and Antifouling Coatings. Crystals 2025, 15, 541. [Google Scholar] [CrossRef]
- Cai, K.; Zuo, S.; Luo, S.; Yao, C.; Liu, W.; Ma, J.; Mao, H.; Li, Z. Preparation of Polyaniline/Graphene Composites with Excellent Anti-Corrosion Properties and Their Application in Waterborne Polyurethane Anticorrosive Coatings. RSC Adv. 2016, 6, 95965–95972. [Google Scholar] [CrossRef]
- Li, B.; Sun, D.; Li, B.; Tang, W.; Ren, P.; Yu, J.; Zhang, J. One-Step Electrochemically Prepared Graphene/Polyaniline Conductive Filter Membrane for Permeation Enhancement by Fouling Mitigation. Langmuir 2020, 36, 2209–2222. [Google Scholar] [CrossRef]
- Yu, F.; Camilli, L.; Wang, T.; Mackenzie, D.M.A.; Curioni, M.; Akid, R.; Bøggild, P. Complete Long-Term Corrosion Protection with Chemical Vapor Deposited Graphene. Carbon 2018, 132, 78–84. [Google Scholar] [CrossRef]
- Zinggeler, M.; Schär, S.; Kurth, F. Printed Antifouling Electrodes for Biosensing Applications. ACS Appl. Mater. Interfaces 2022, 14, 56578–56584. [Google Scholar] [CrossRef]
- Subtil, E.L.; Gonçalves, J.; Lemos, H.G.; Venancio, E.C.; Mierzwa, J.C.; dos Santos de Souza, J.; Alves, W.; Le-Clech, P. Preparation and Characterization of a New Composite Conductive Polyethersulfone Membrane Using Polyaniline (PANI) and Reduced Graphene Oxide (rGO). Chem. Eng. J. 2020, 390, 124612. [Google Scholar] [CrossRef]
- Hui, N.; Sun, X.; Niu, S.; Luo, X. PEGylated Polyaniline Nanofibers: Antifouling and Conducting Biomaterial for Electrochemical DNA Sensing. ACS Appl. Mater. Interfaces 2017, 9, 2914–2923. [Google Scholar] [CrossRef]
- Baldanzi, S.; Vargas, I.T.; Armijo, F.; Fernández, M.; Navarrete, S.A. Experimental Assessment of a Conducting Polymer (PEDOT) and Microbial Biofilms as Deterrents and Facilitators of Macro-Biofouling: Larval Settlement of the Barnacle Notobalanus flosculus (Darwin, 1854) from Central Chile. J. Mar. Sci. Eng. 2021, 9, 82. [Google Scholar] [CrossRef]
- Yang, S.; Zhu, S.; Hong, R. Graphene Oxide/Polyaniline Nanocomposites Used in Anticorrosive Coatings for Environmental Protection. Coatings 2020, 10, 1215. [Google Scholar] [CrossRef]
- Nicola, F.D.; Castrucci, P.; Scarselli, M.; Nanni, F.; Cacciotti, I.; Crescenzi, M.D. Super-Hydrophobic Multi-Walled Carbon Nanotube Coatings for Stainless Steel. Nanotechnology 2015, 26, 145701. [Google Scholar] [CrossRef] [PubMed]
- Chen, Q.; Zhang, Z.; Qi, Y. Construction of a Novel Environmentally-Friendly Long-Term Antifouling Coating with a Double-Layer Structure Regulated by Phenylmethyl Silicone Oil and Verification of the Static Antifouling Performance of the Coating. Surf. Interfaces 2025, 56, 105519. [Google Scholar] [CrossRef]


Disclaimer/Publisher’s Note: The statements, opinions and data contained in all publications are solely those of the individual author(s) and contributor(s) and not of MDPI and/or the editor(s). MDPI and/or the editor(s) disclaim responsibility for any injury to people or property resulting from any ideas, methods, instructions or products referred to in the content. |
© 2025 by the authors. Licensee MDPI, Basel, Switzerland. This article is an open access article distributed under the terms and conditions of the Creative Commons Attribution (CC BY) license (https://creativecommons.org/licenses/by/4.0/).