
A Study on Large Electric Vehicle Fires in a Tunnel: Use of a Fire Dynamics Simulator (FDS)


Abstract
1. Introduction
2. Materials and Methods
2.1. Pyrosim and FDS
- Conservation of mass
- Conservation of Momentum (Newton’s Second Law)
- Conservation of Energy (First Law of Thermodynamics)
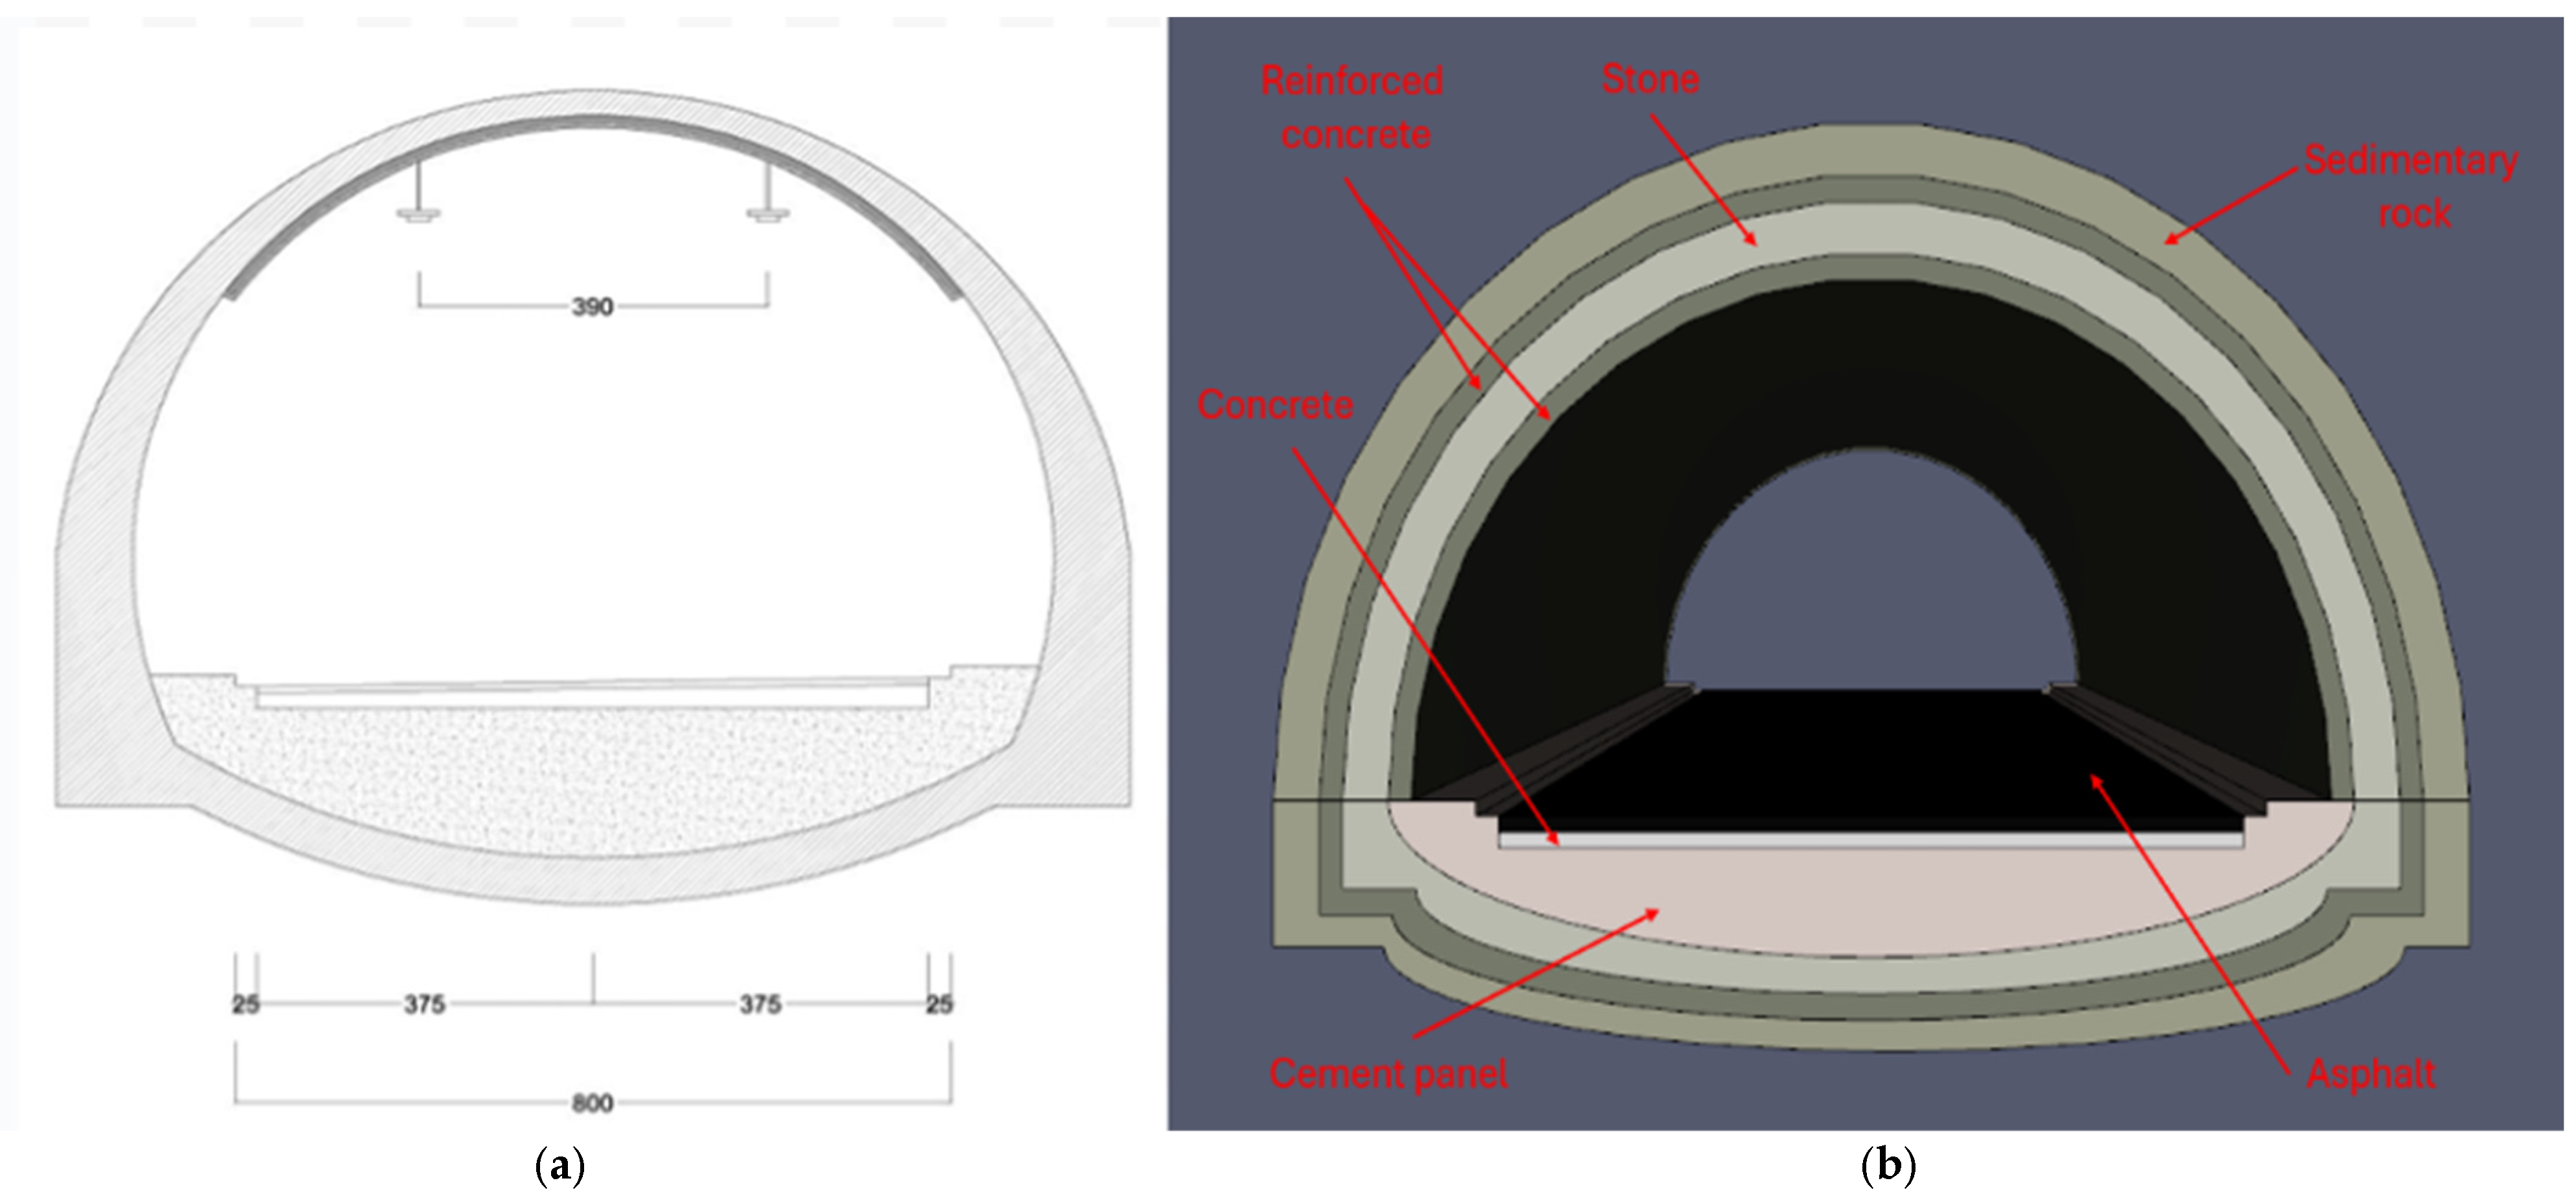
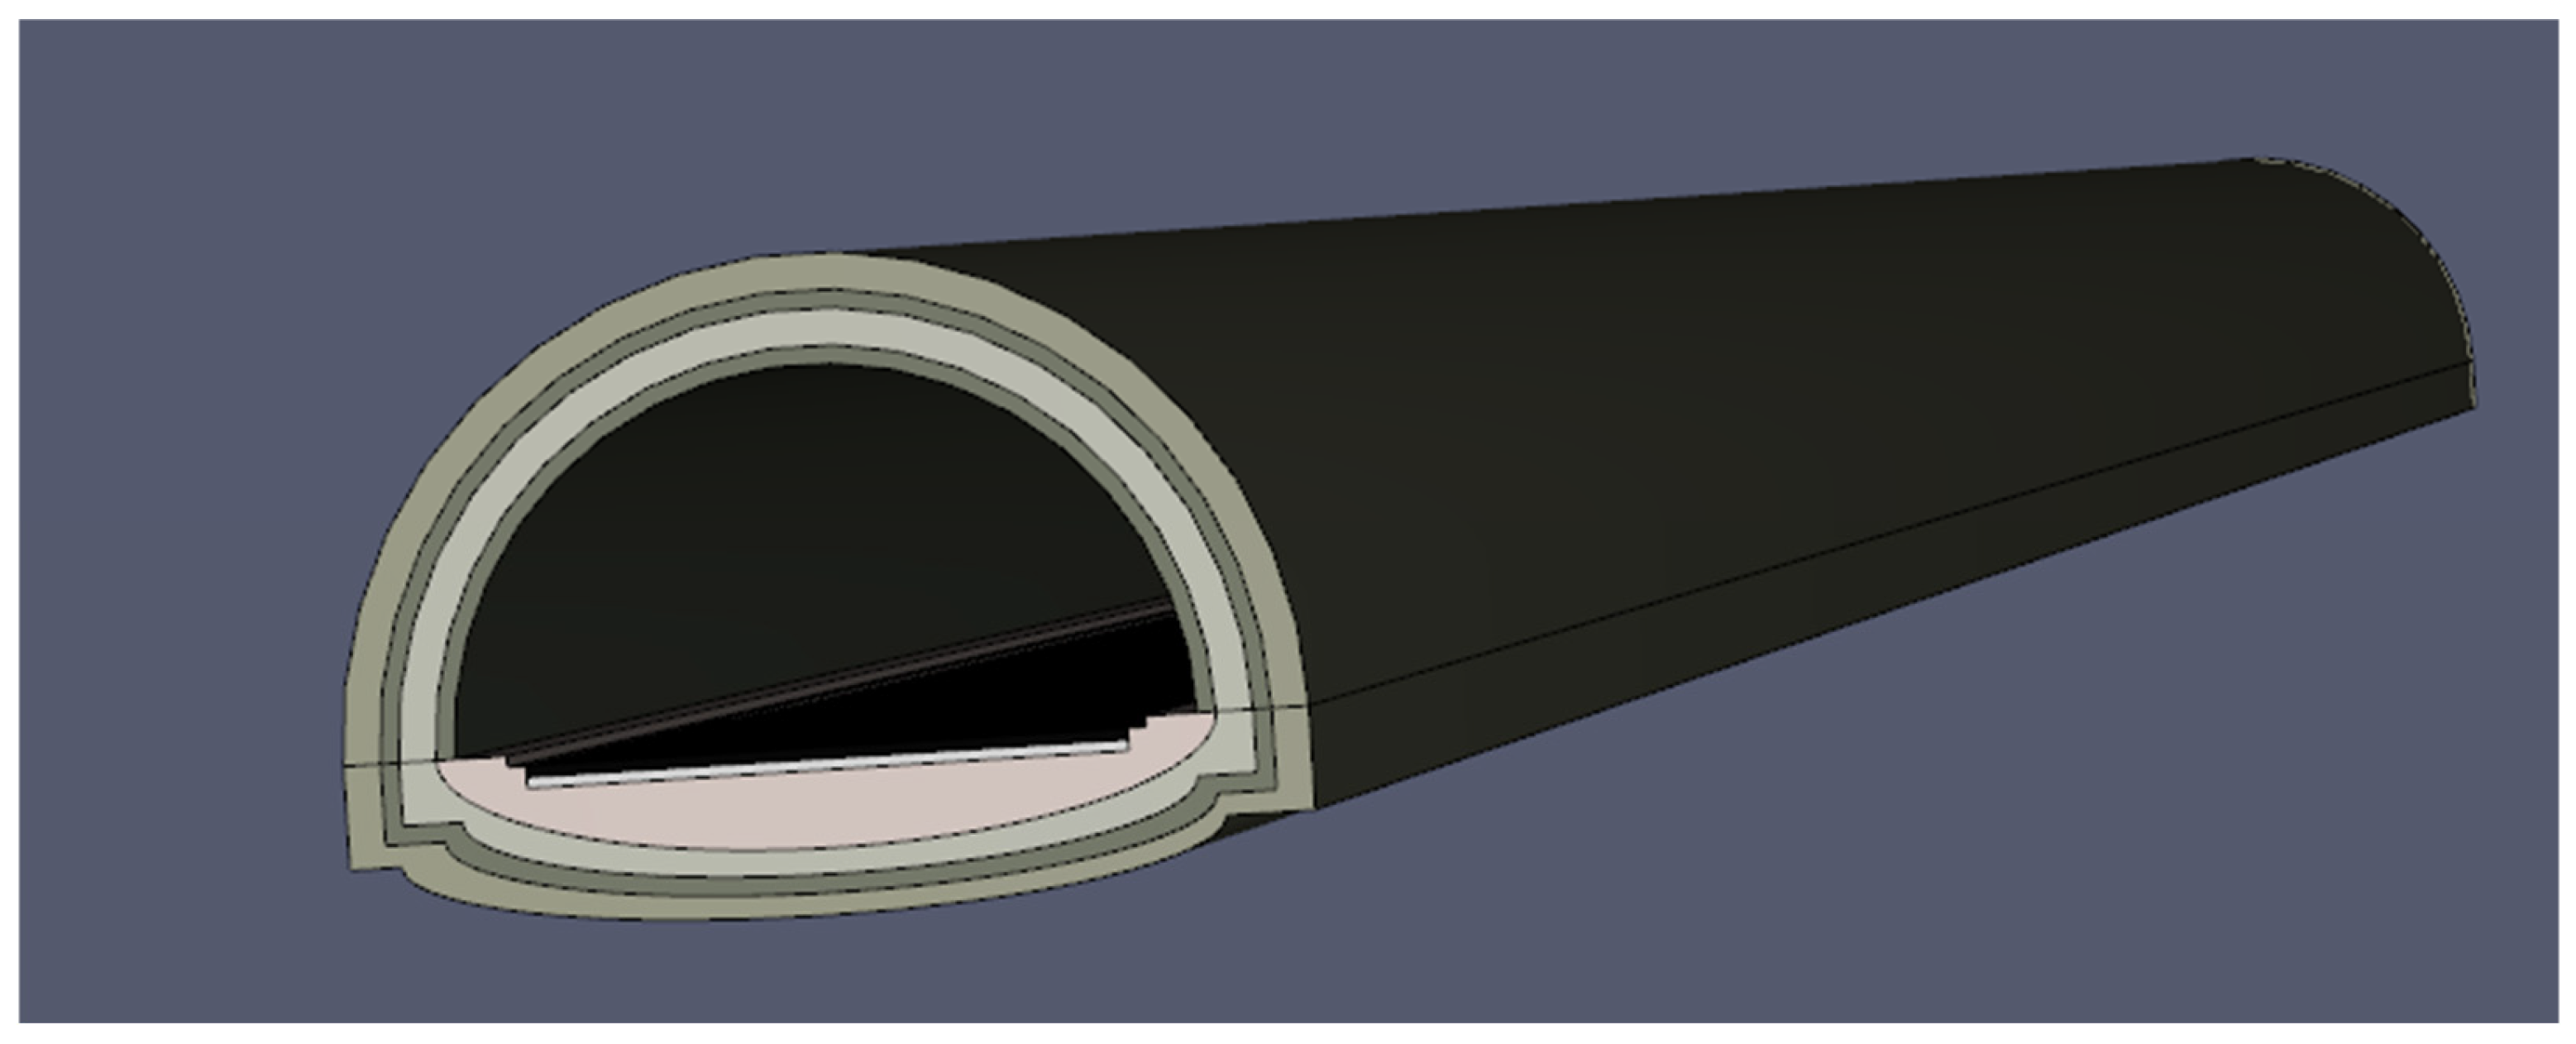
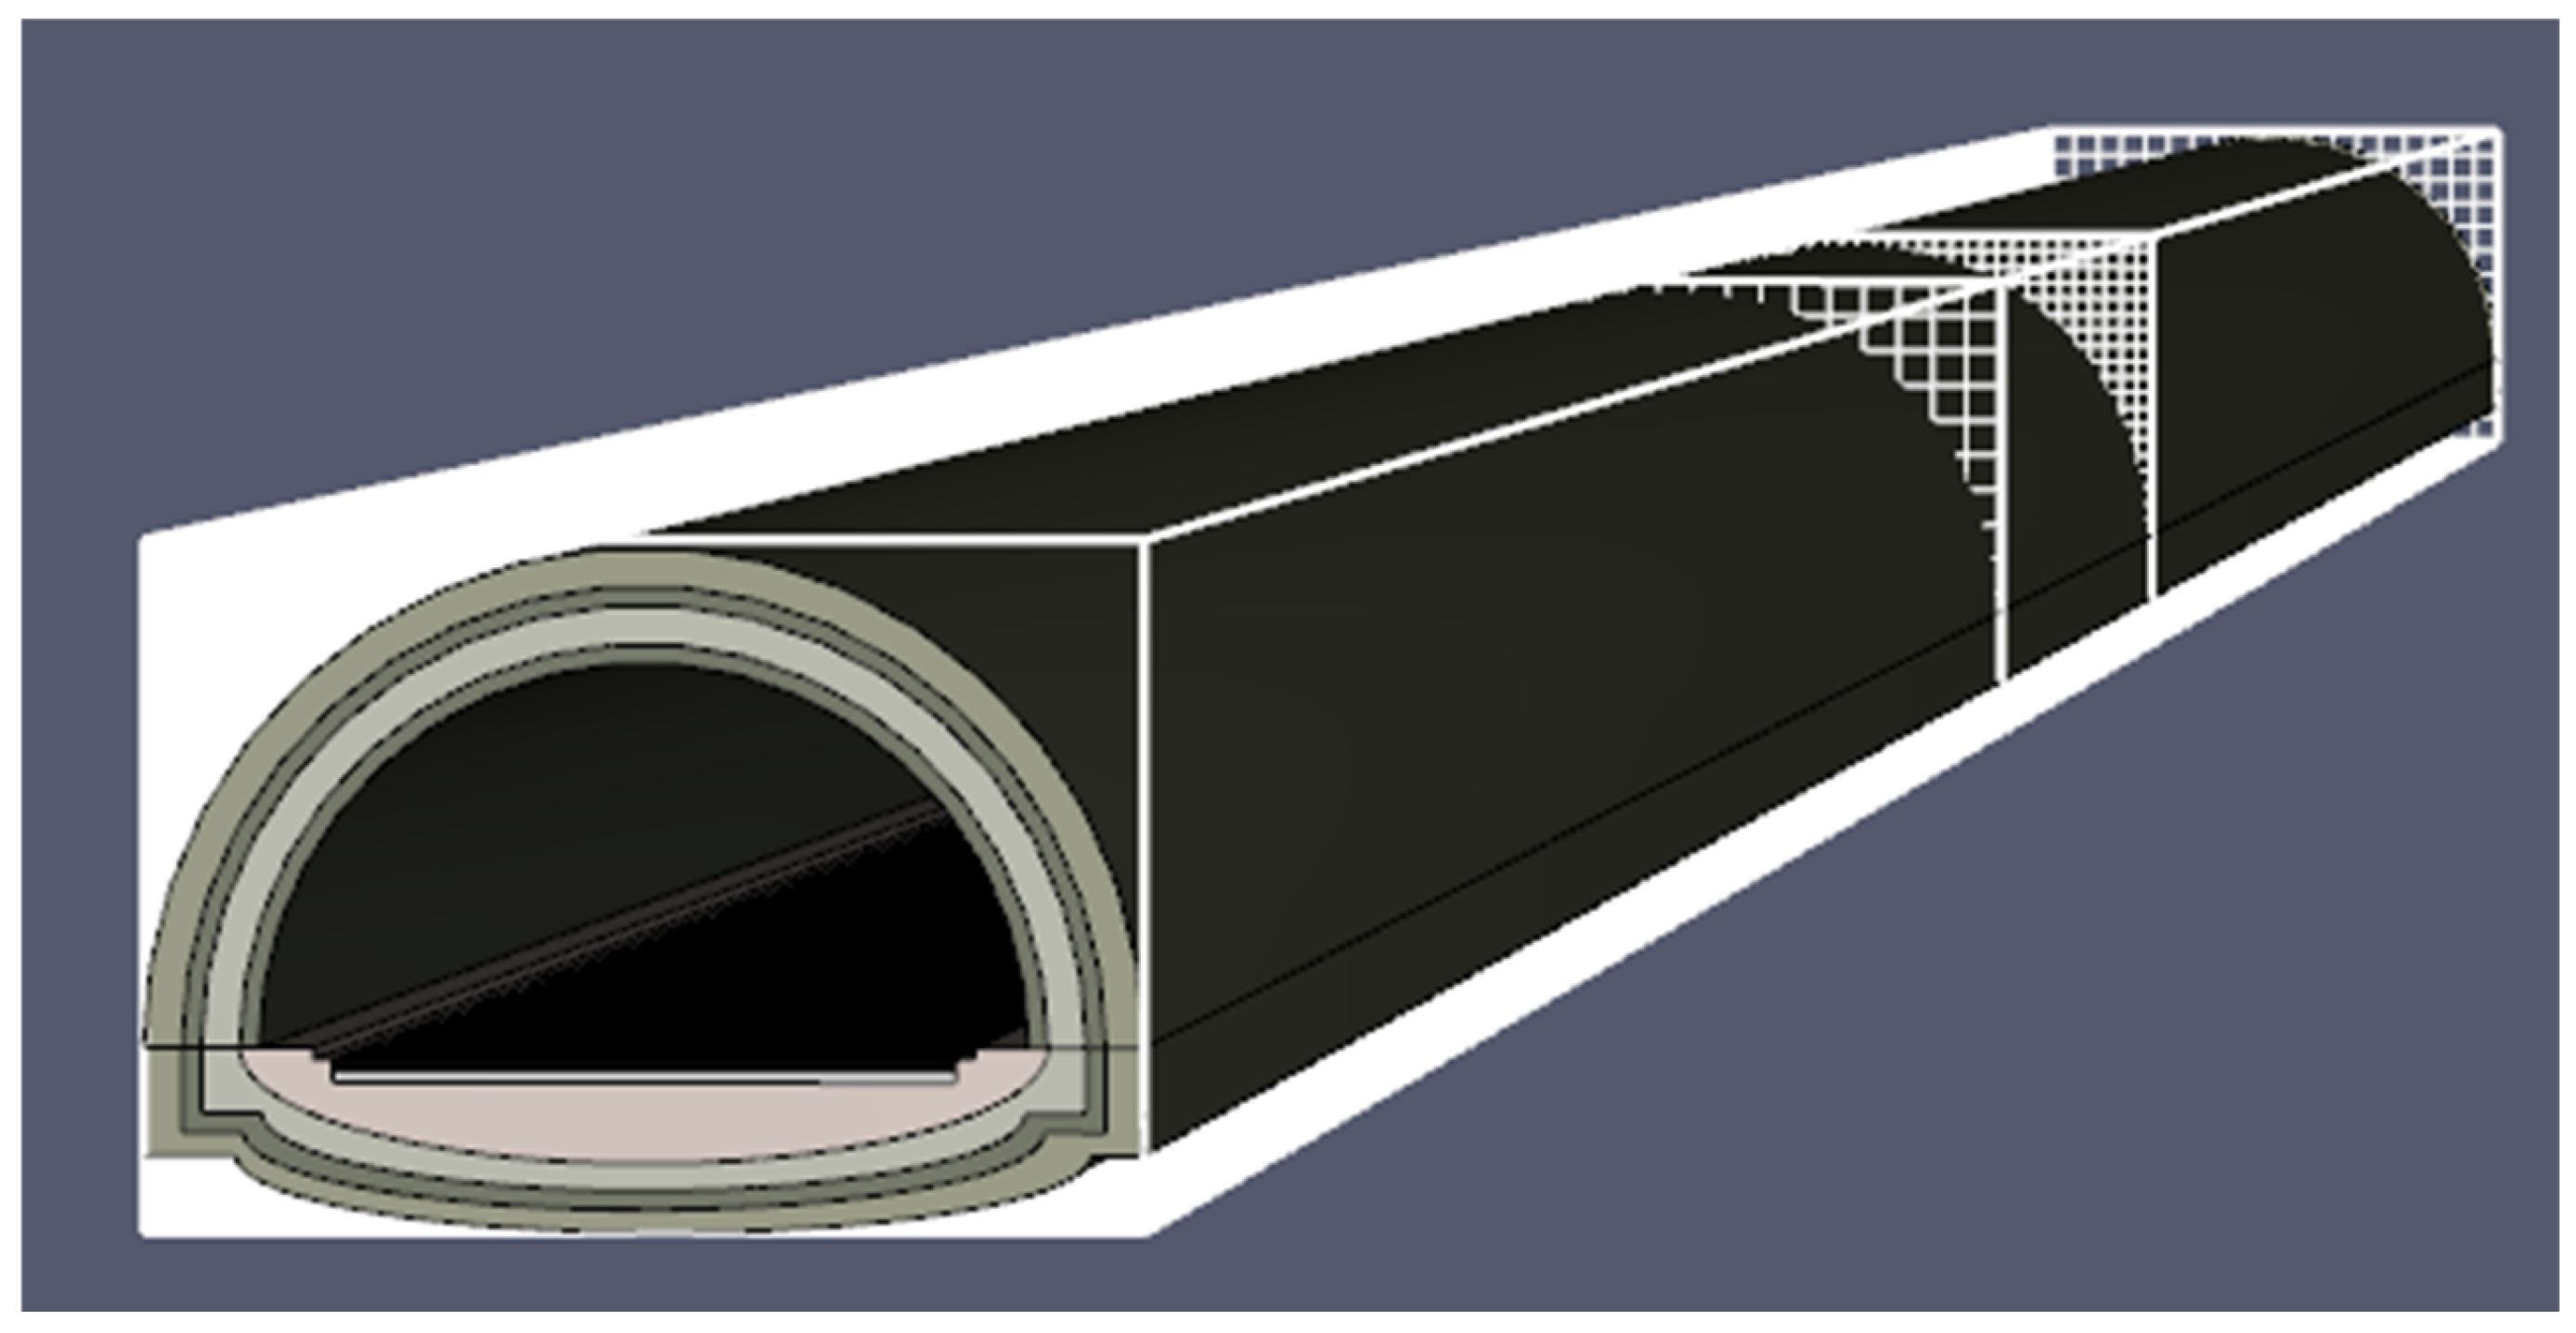
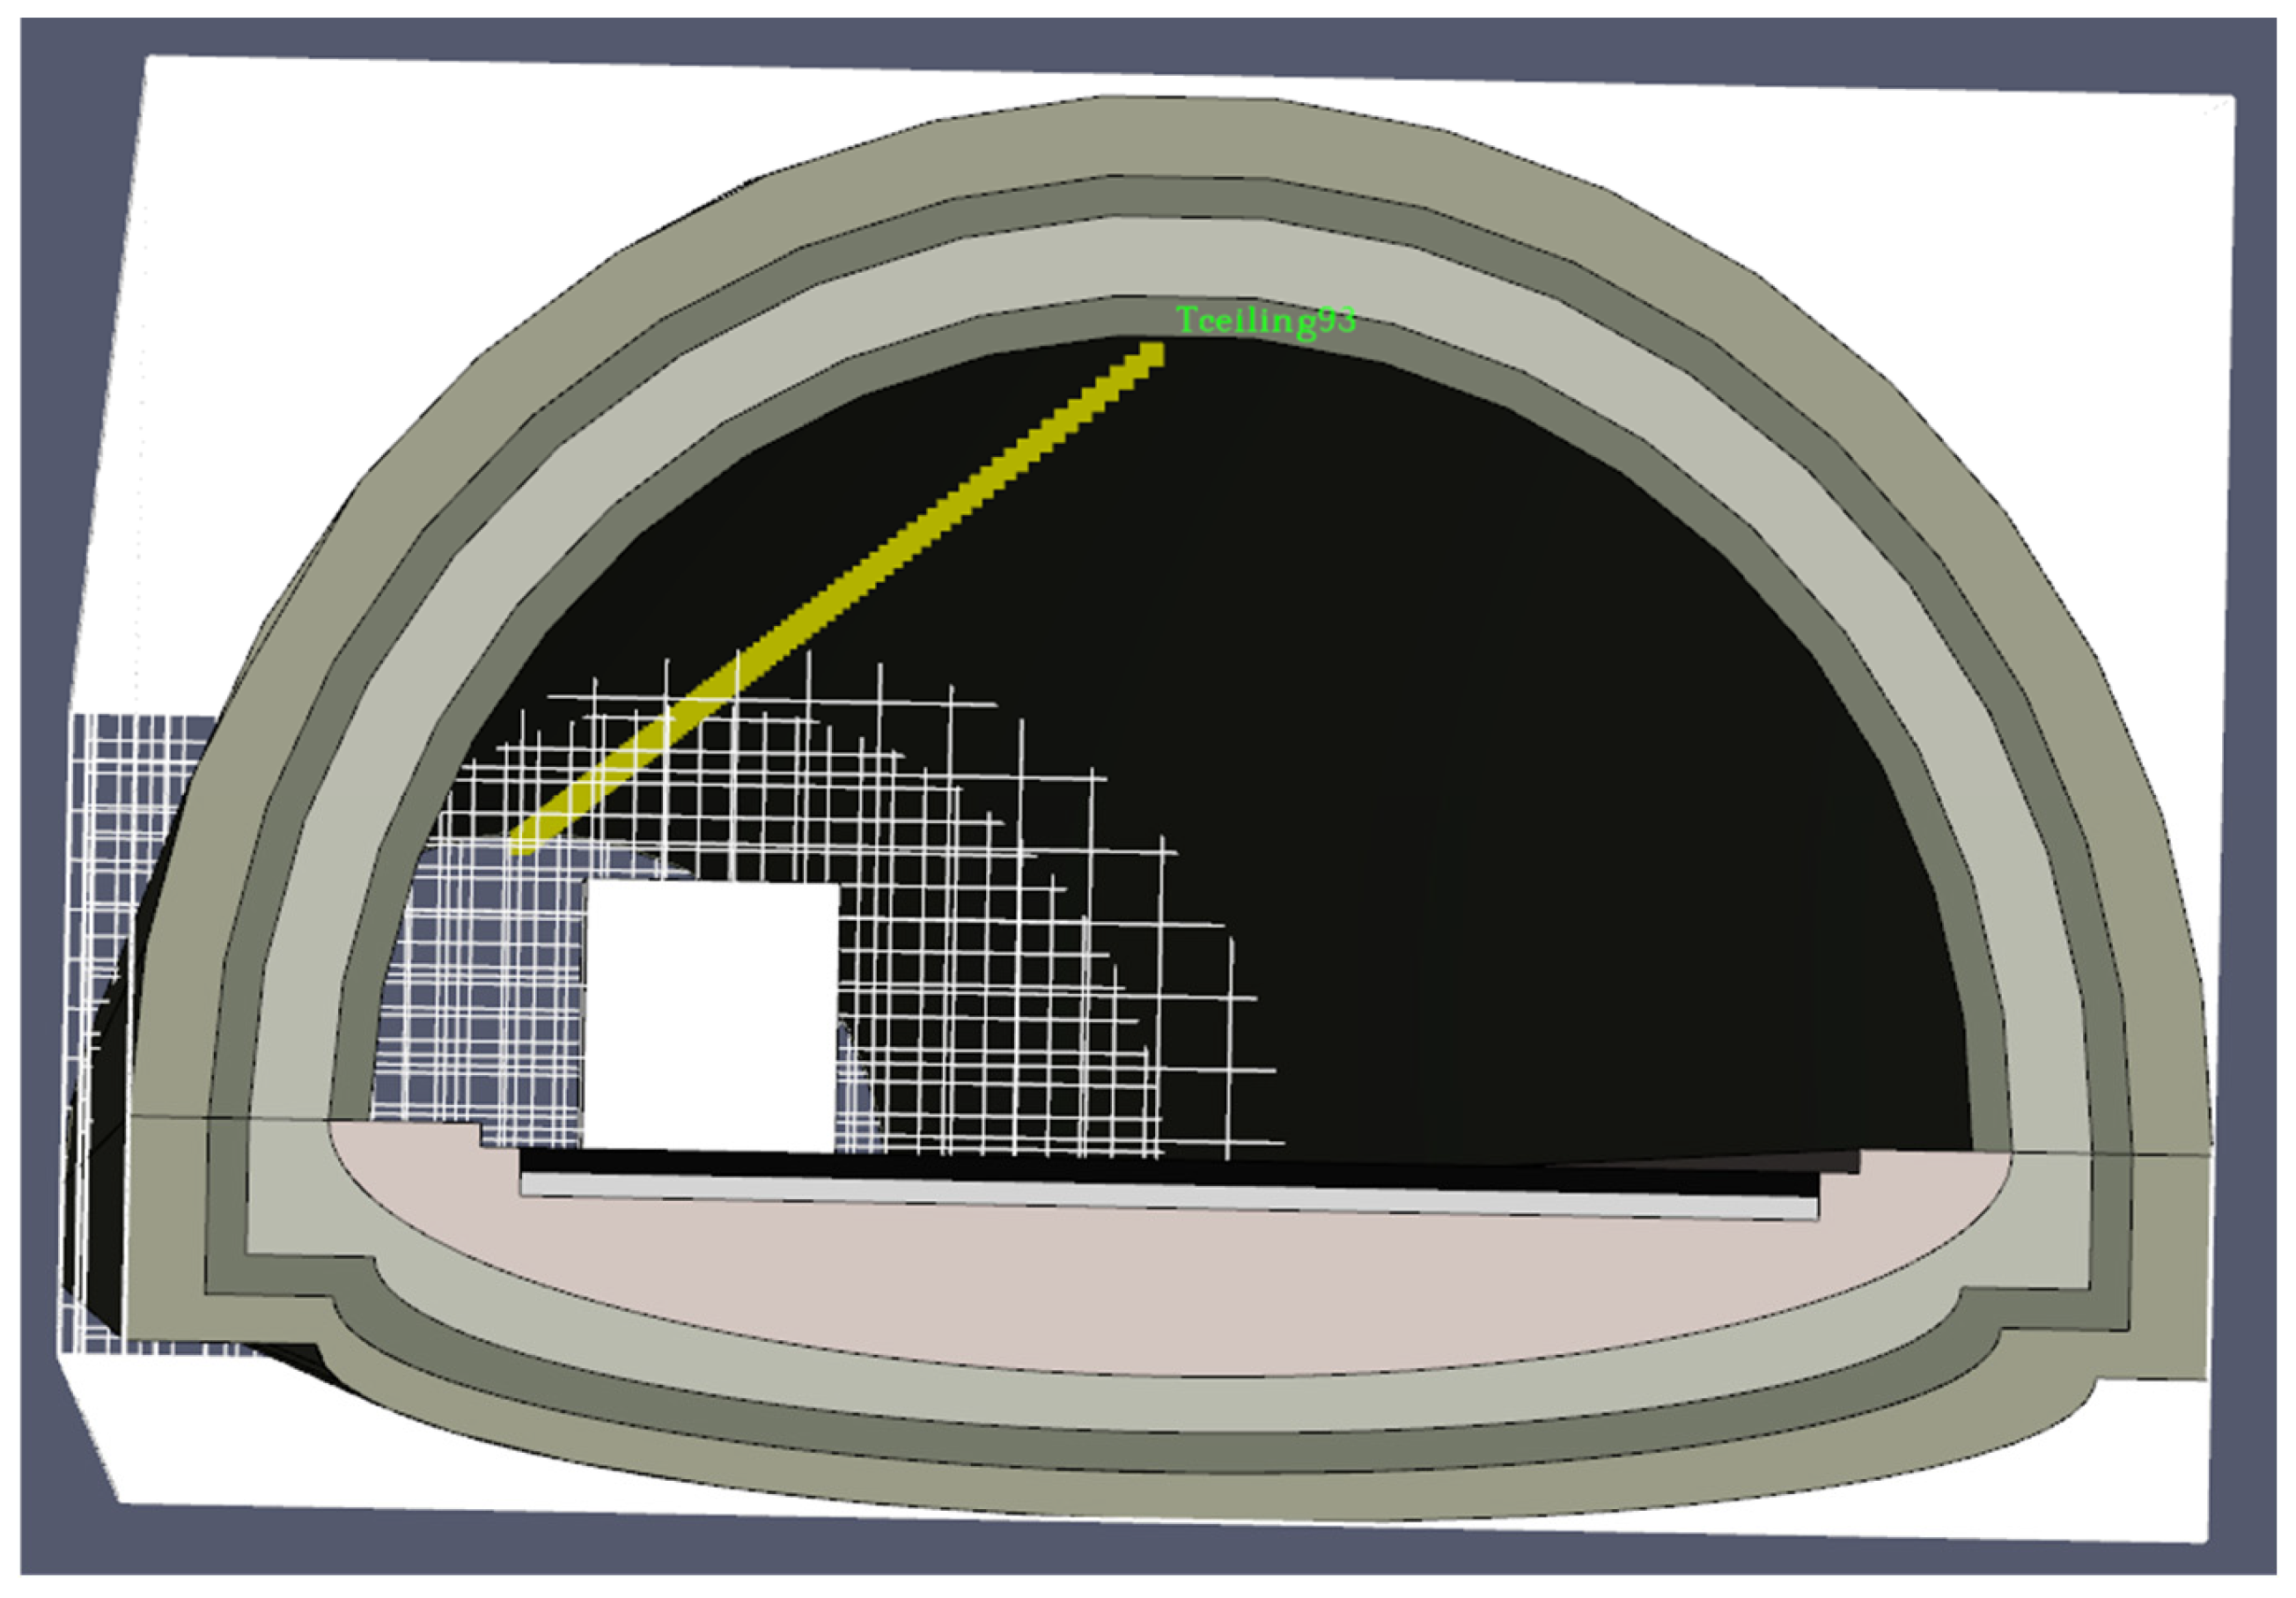
2.2. Tunnel Geometry
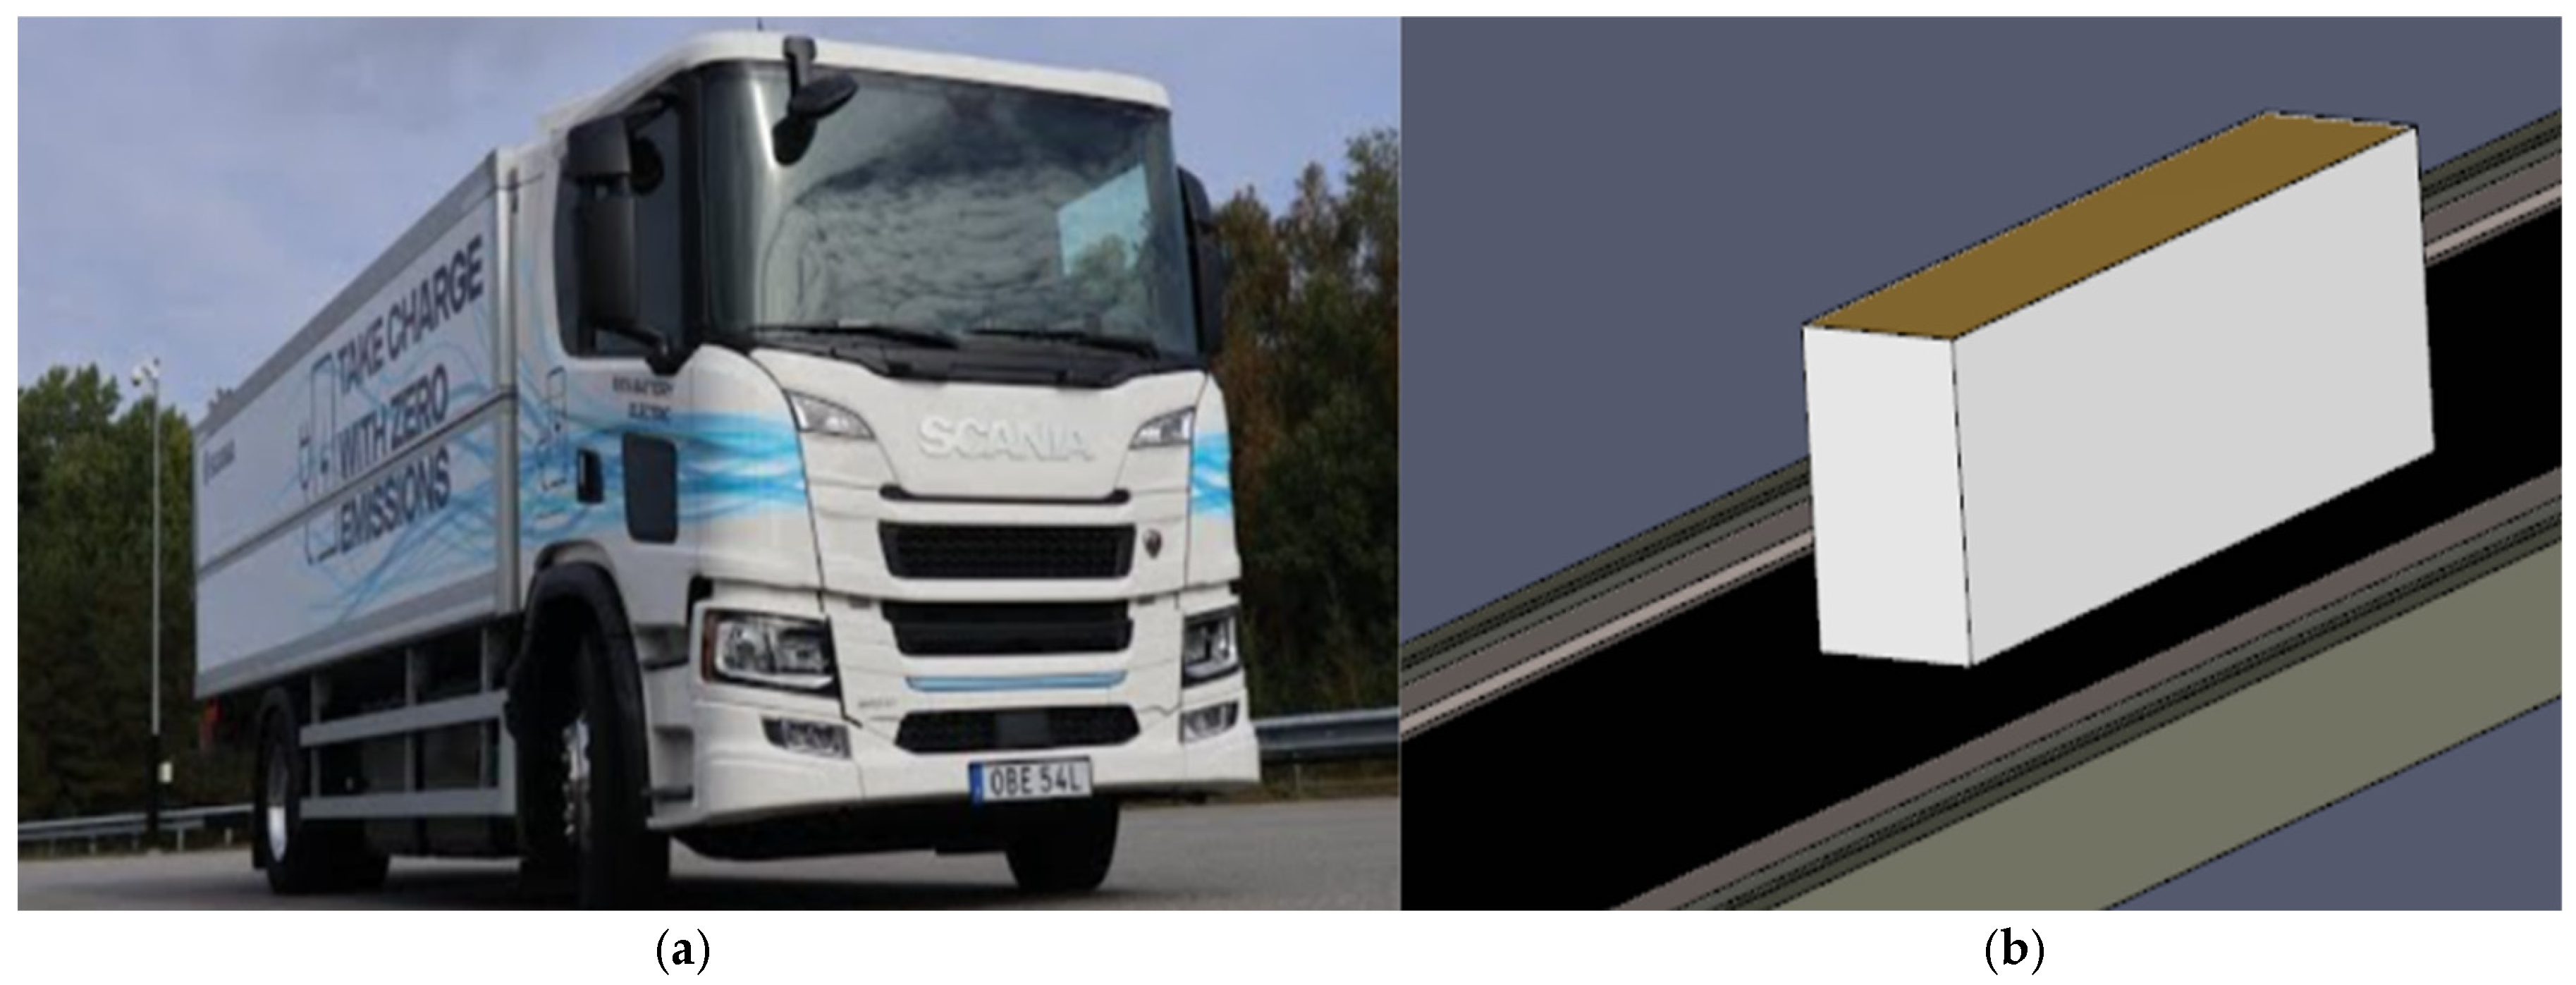
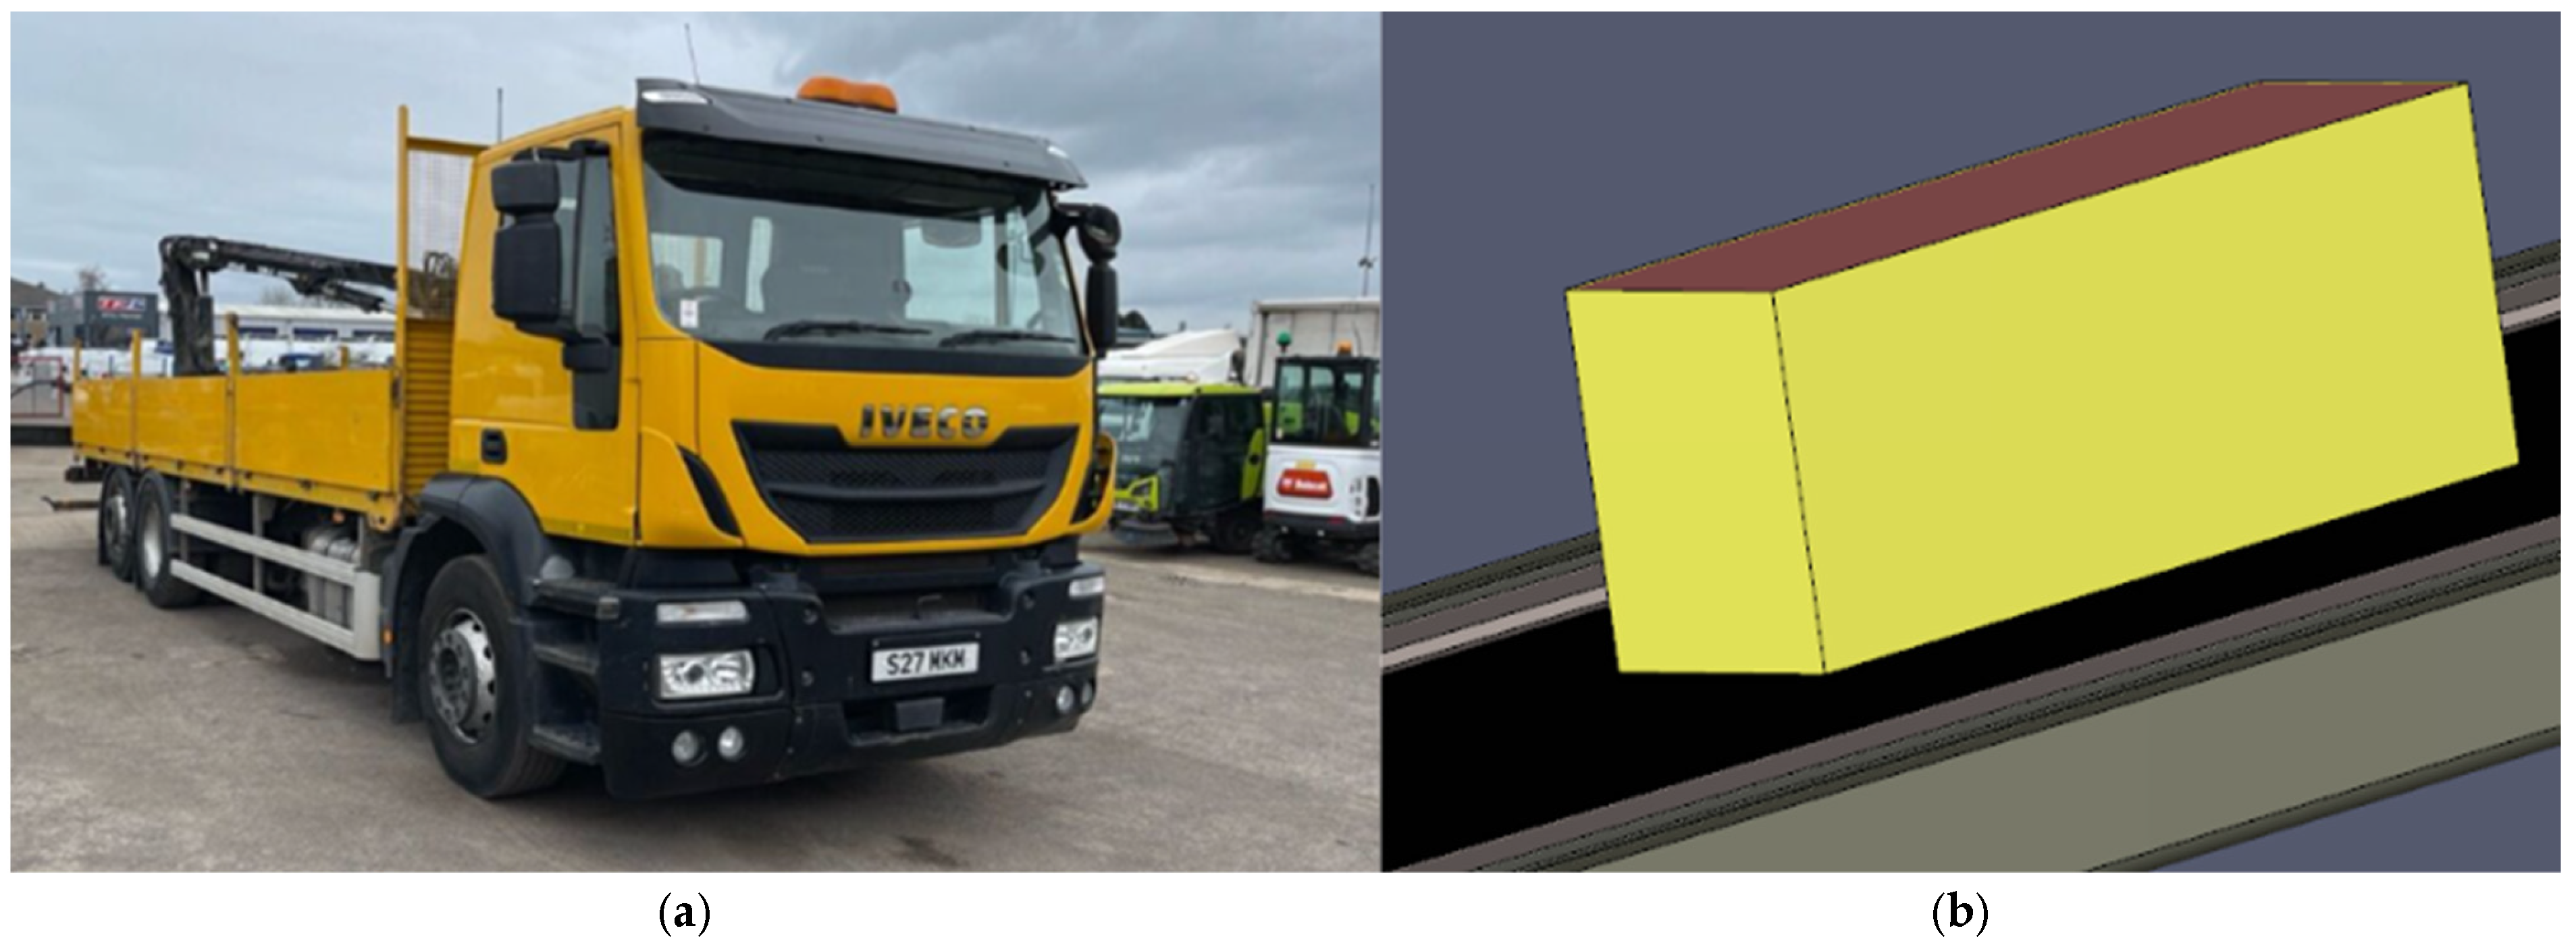
2.3. Vehicles
2.4. HRRPUA and Ramp-Up Time
2.5. Mesh
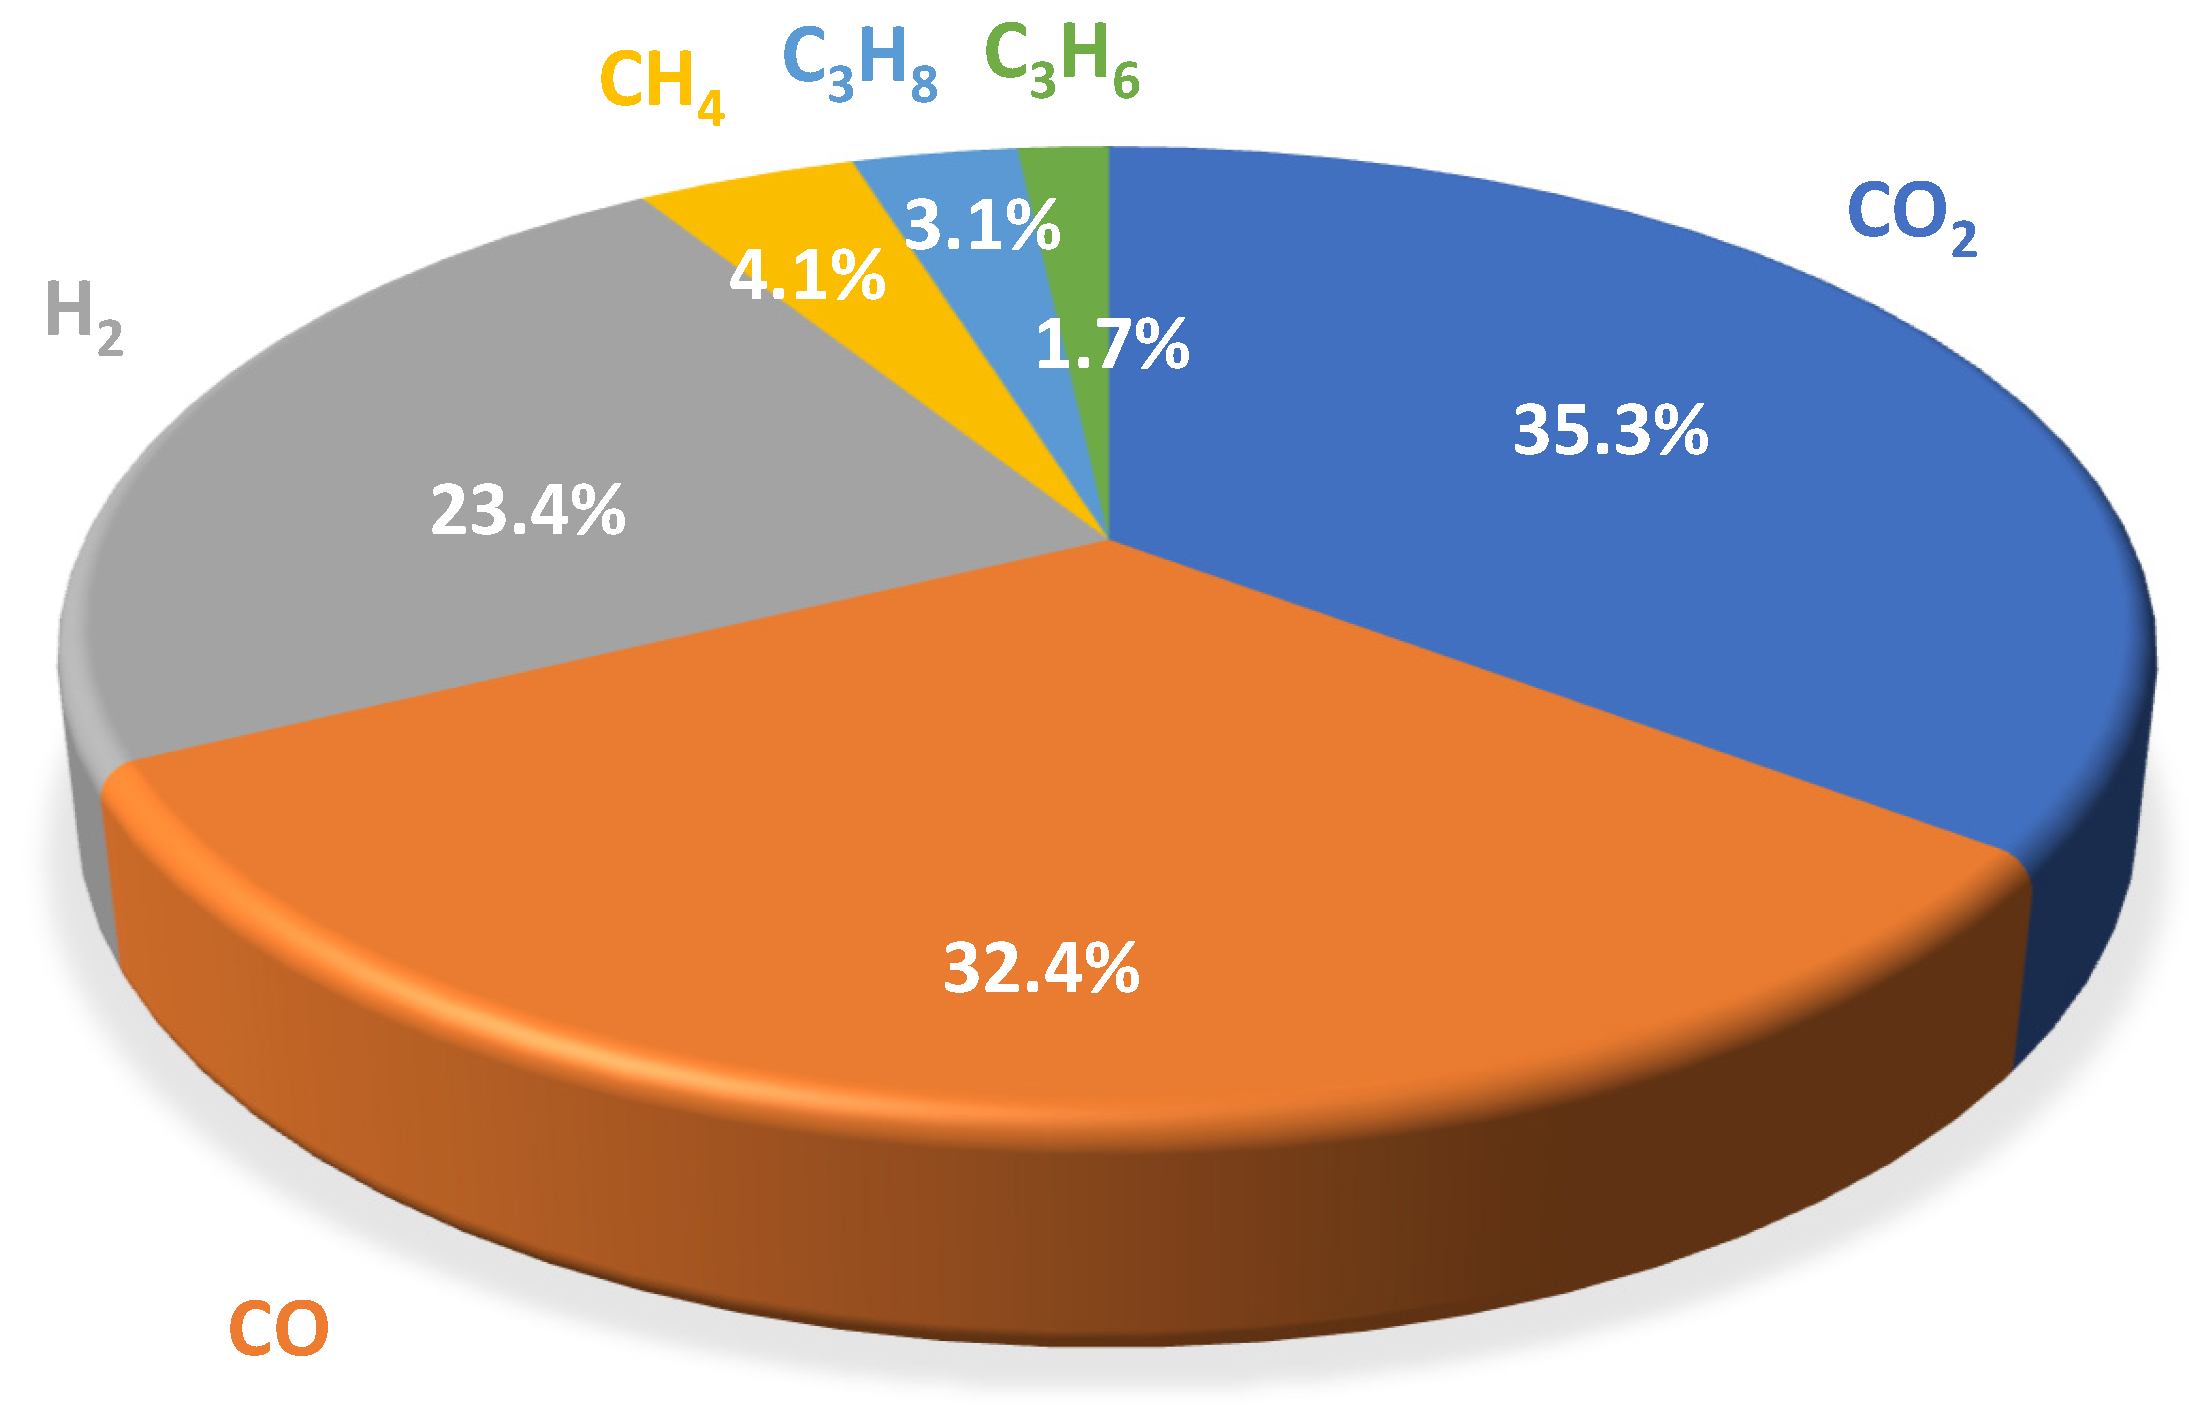
2.6. Combustion Reaction
2.7. Ambient Boundary Conditions and Simulation Time
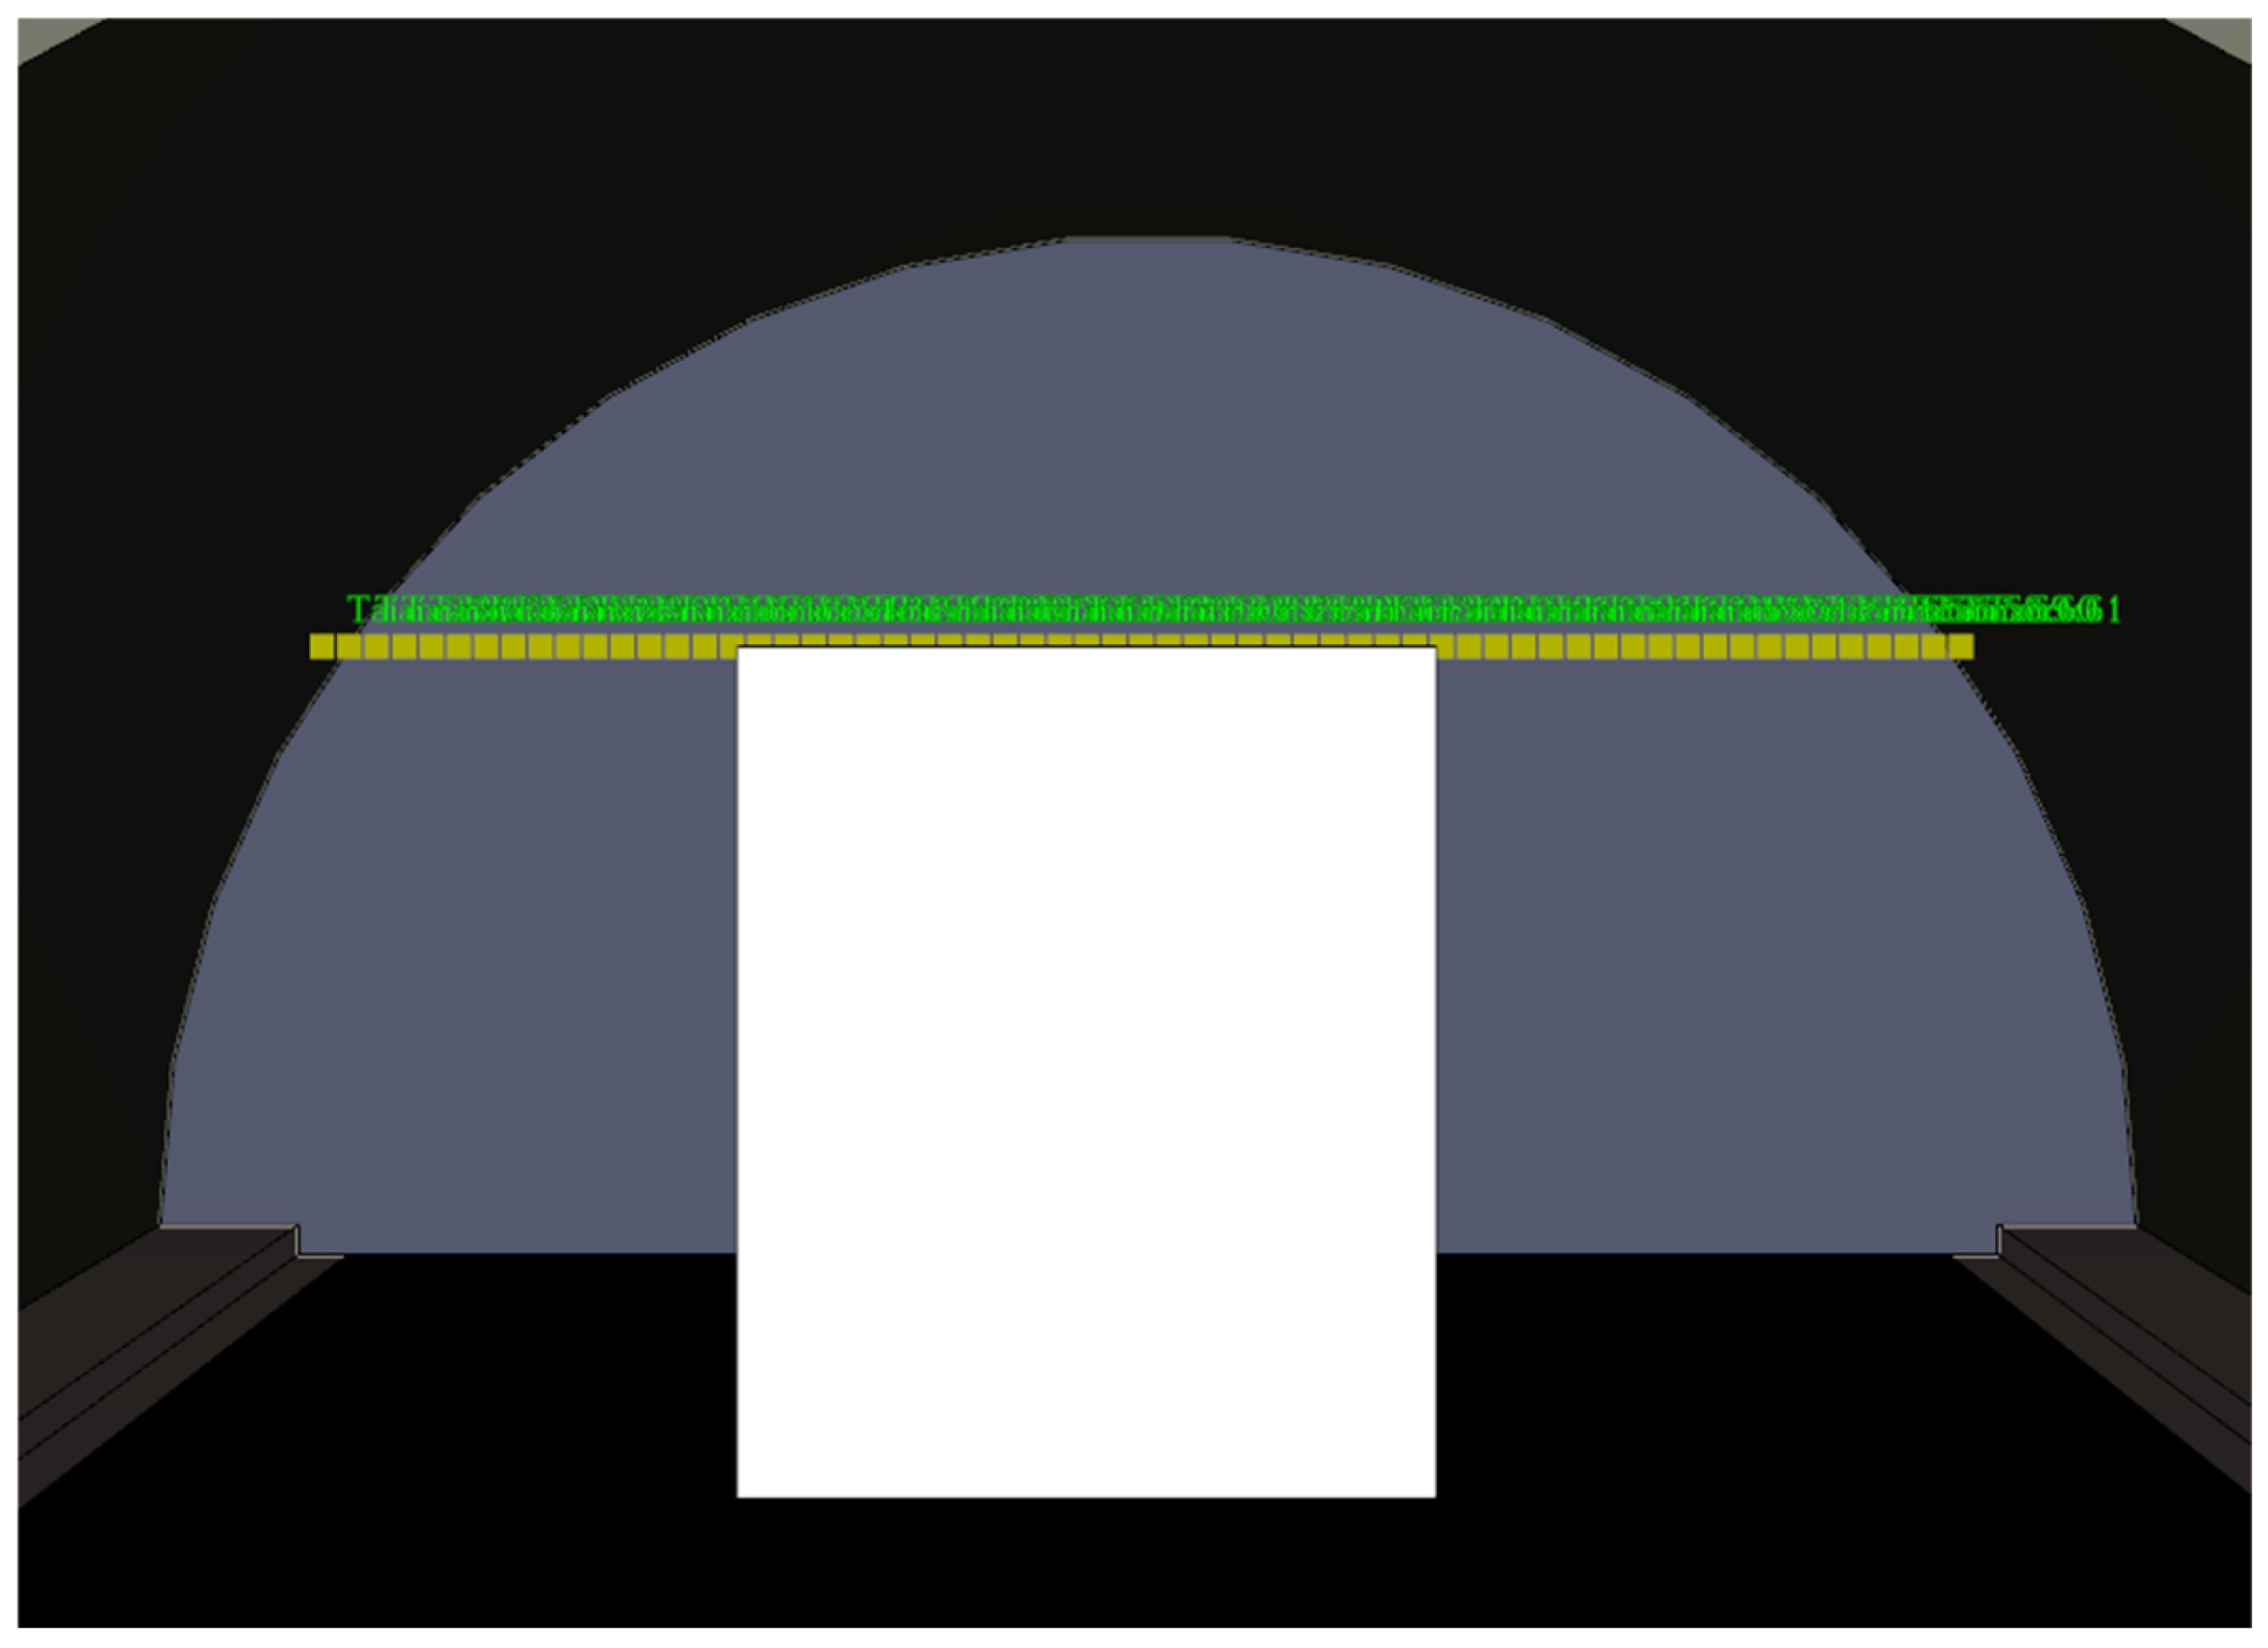
2.8. Devices
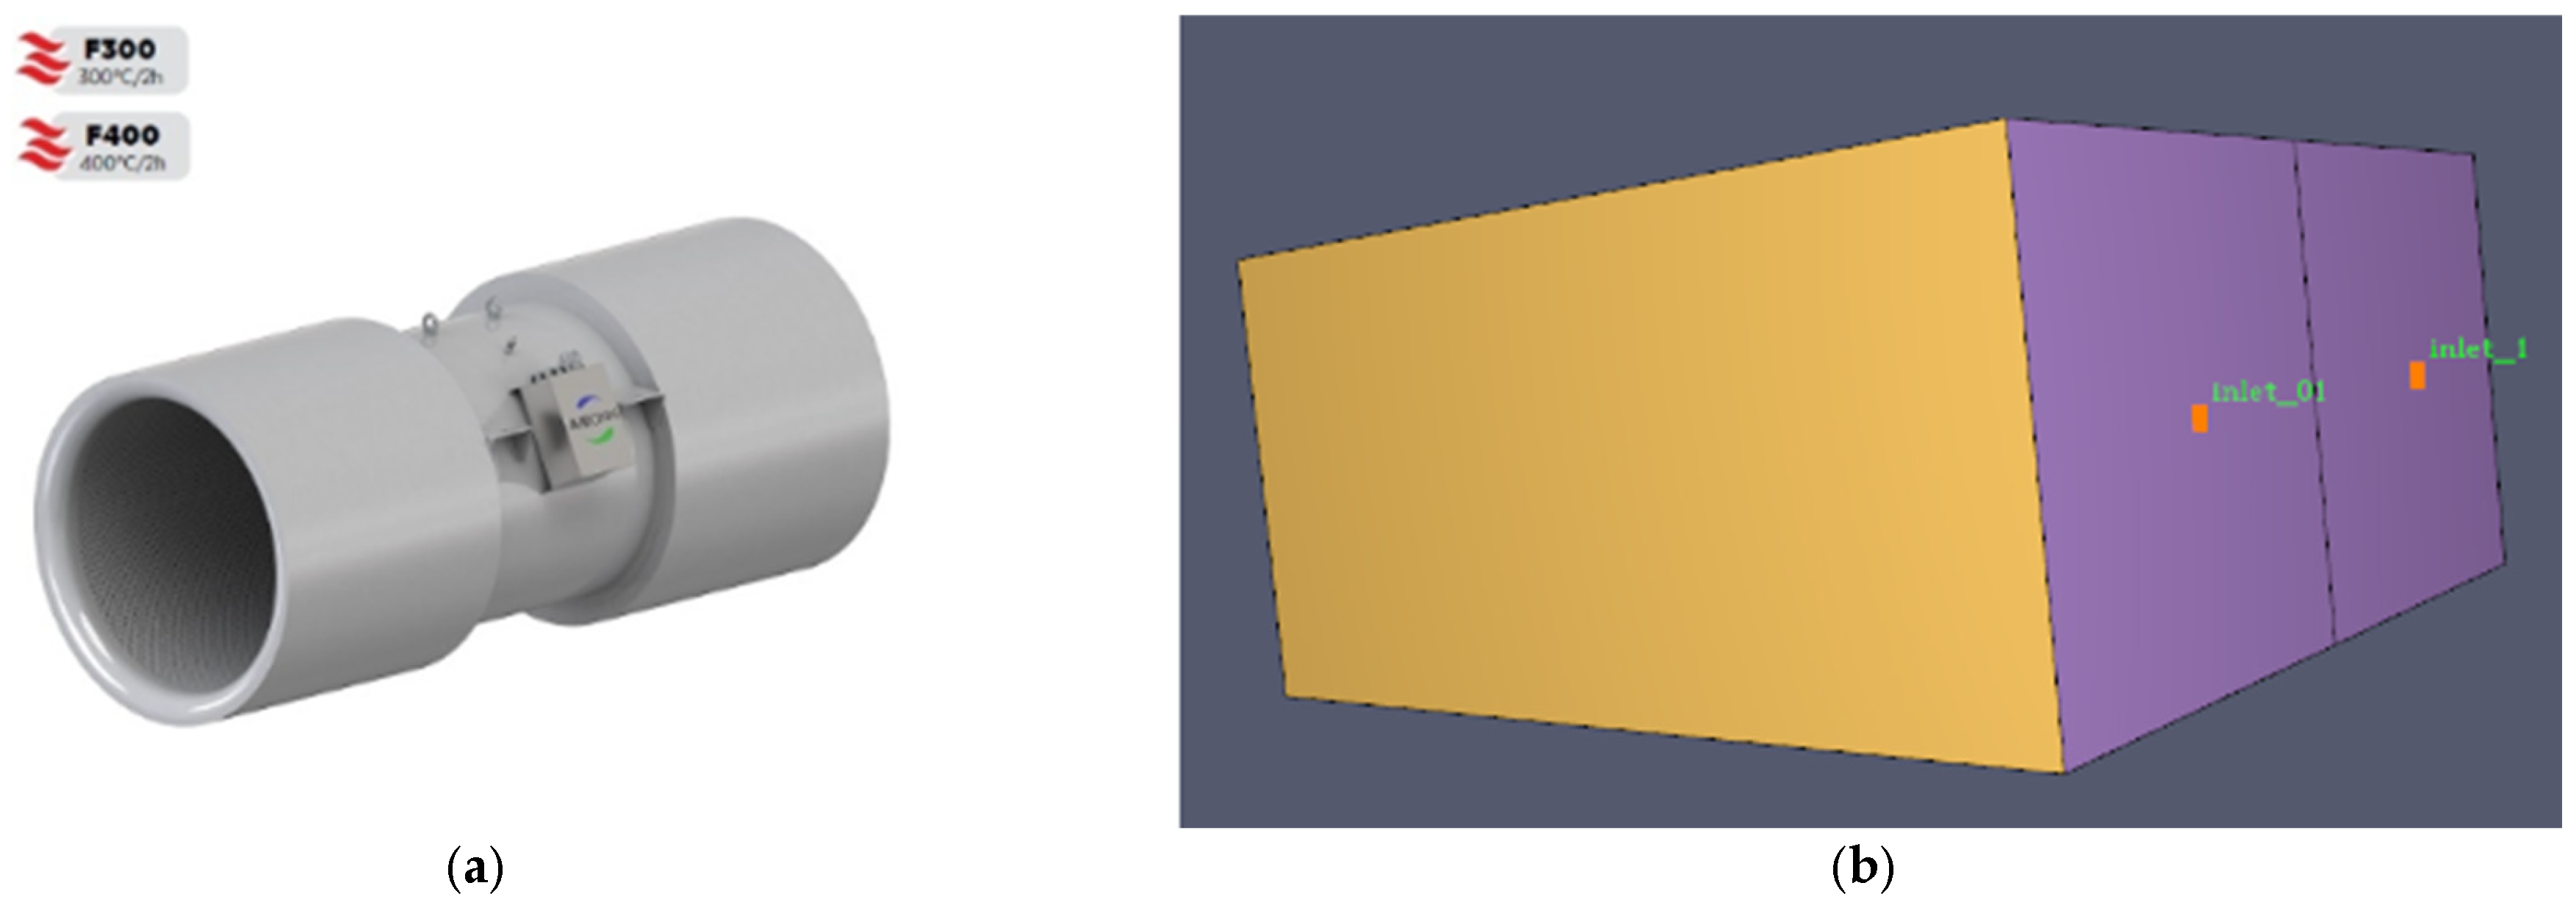
2.9. Longitudinal Mechanical Ventilation
3. Results
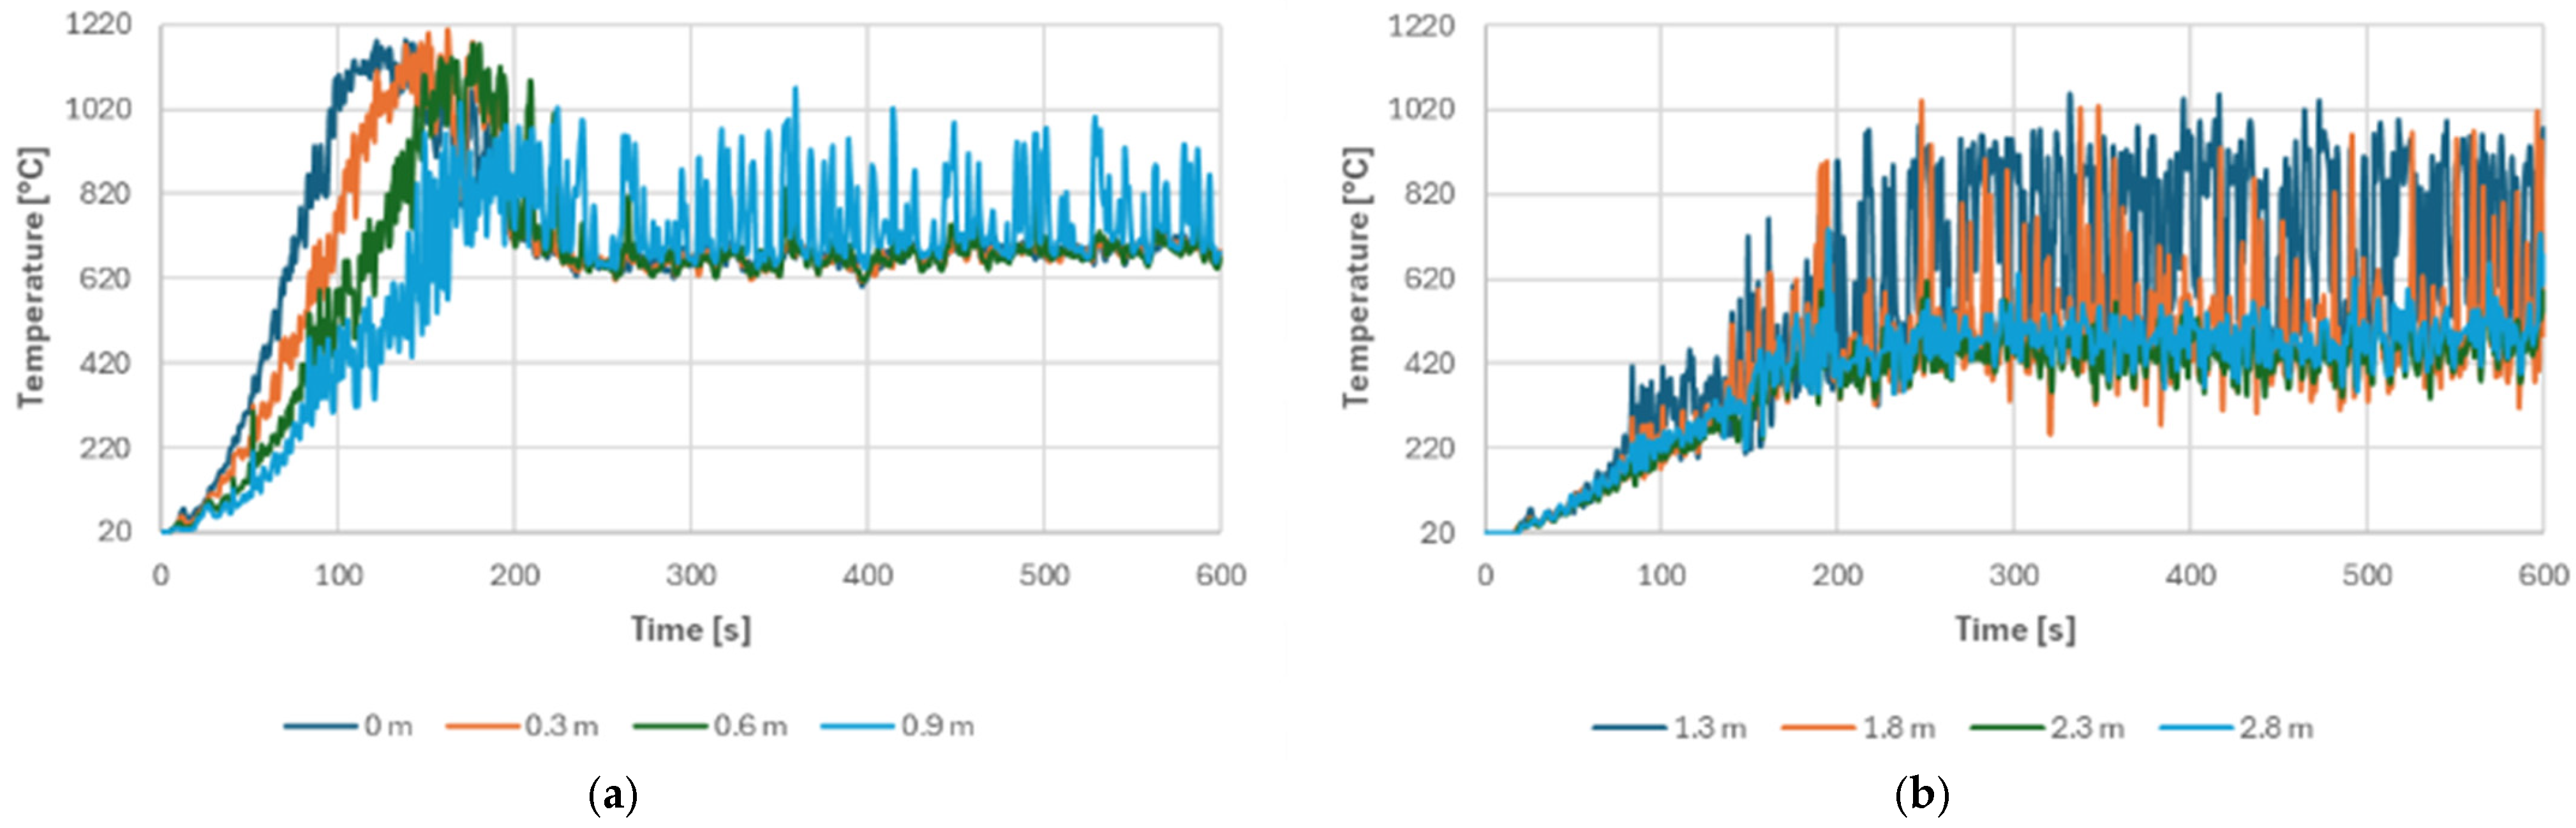
3.1. SCANIA
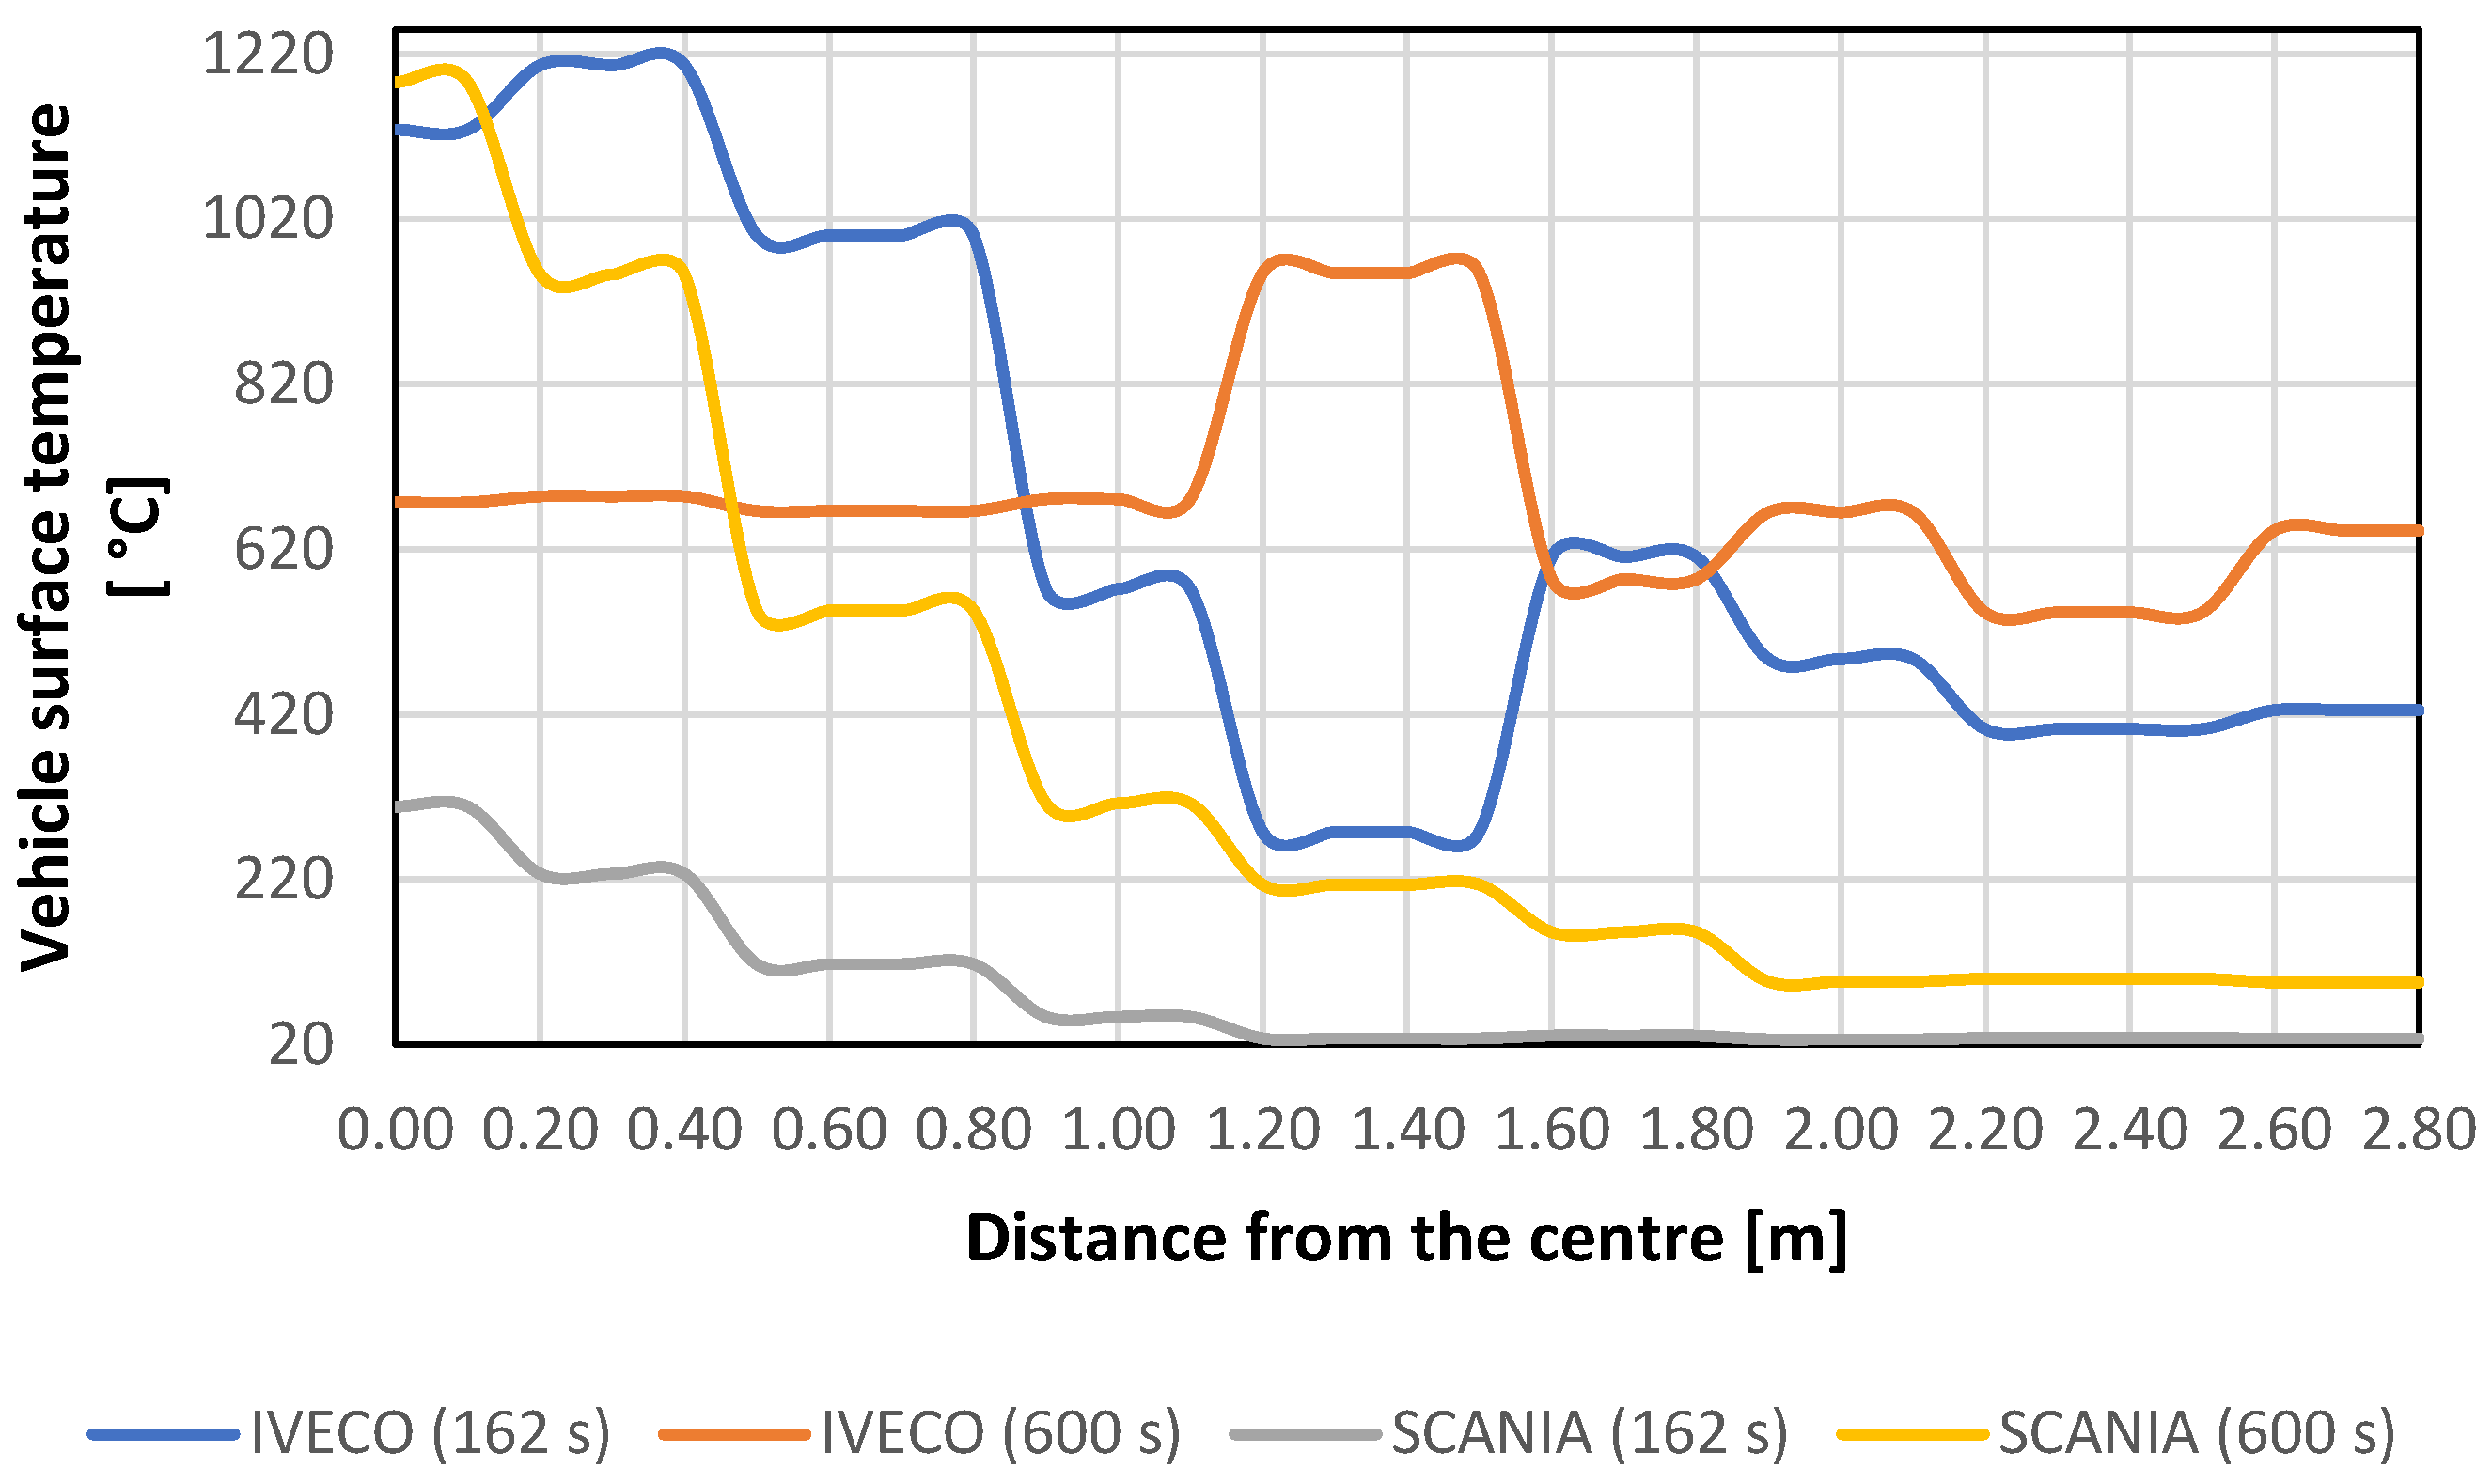
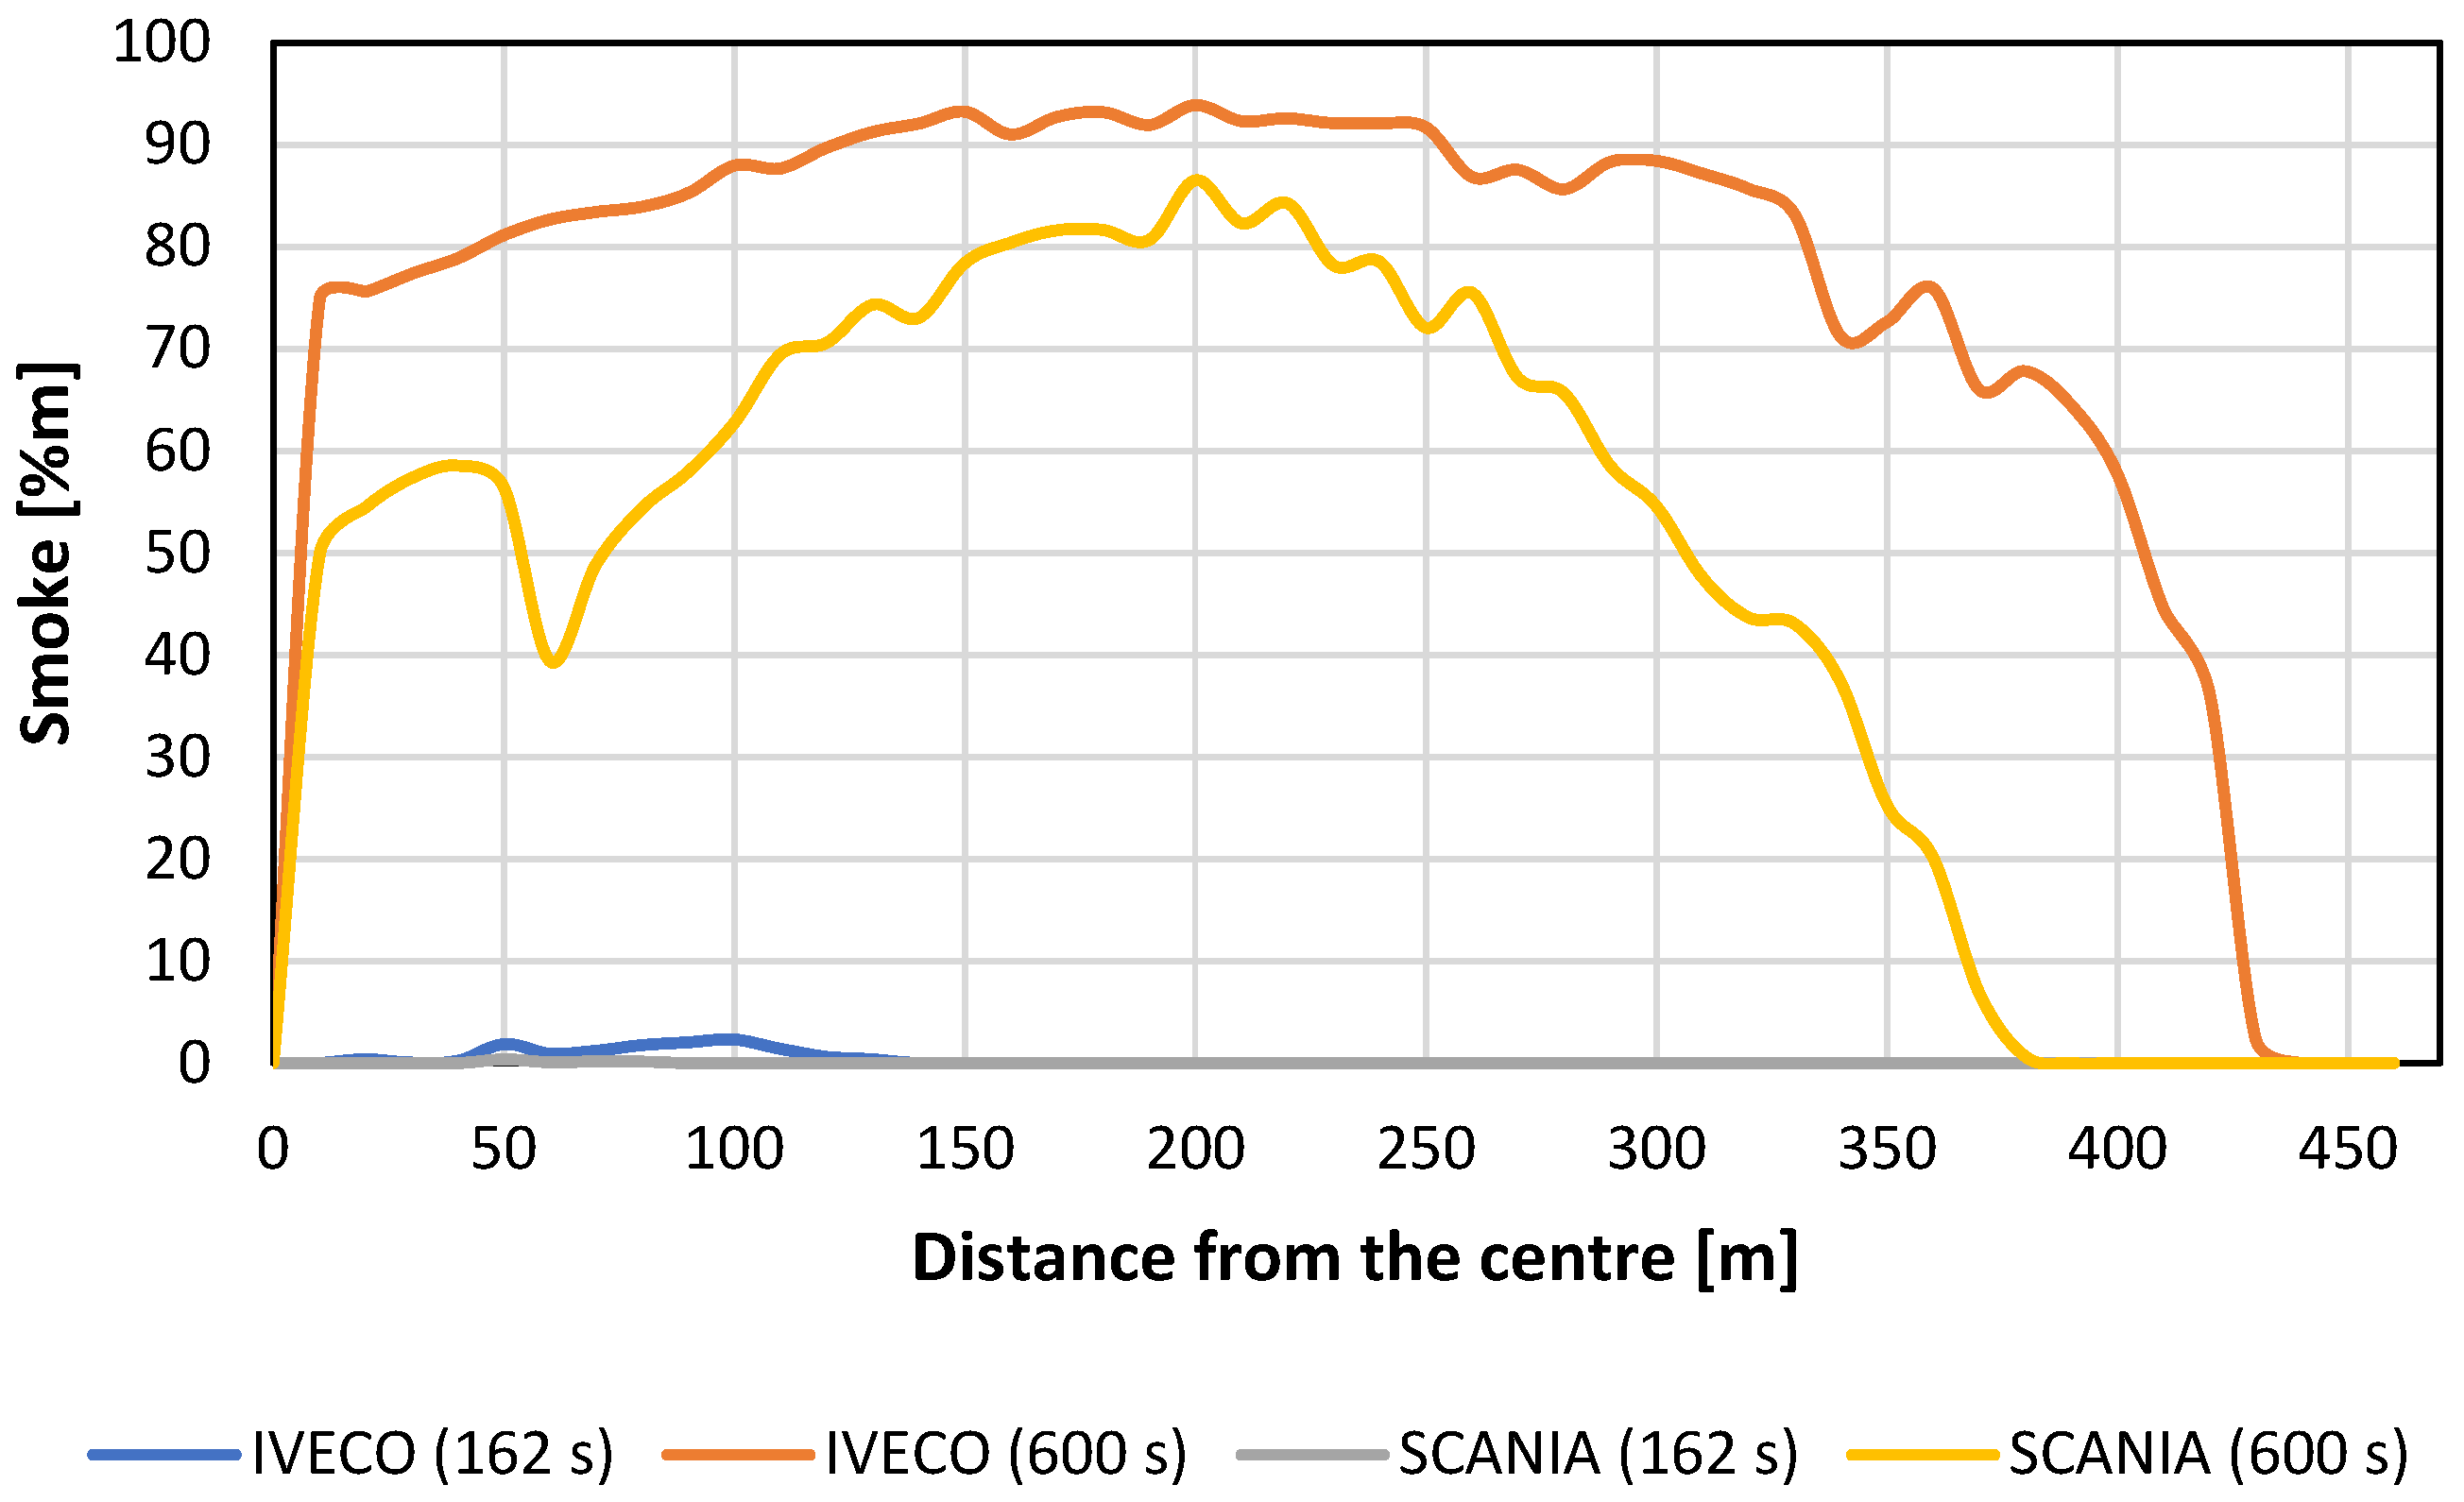
3.2. Comparison Between the SCANIA and the IVECO
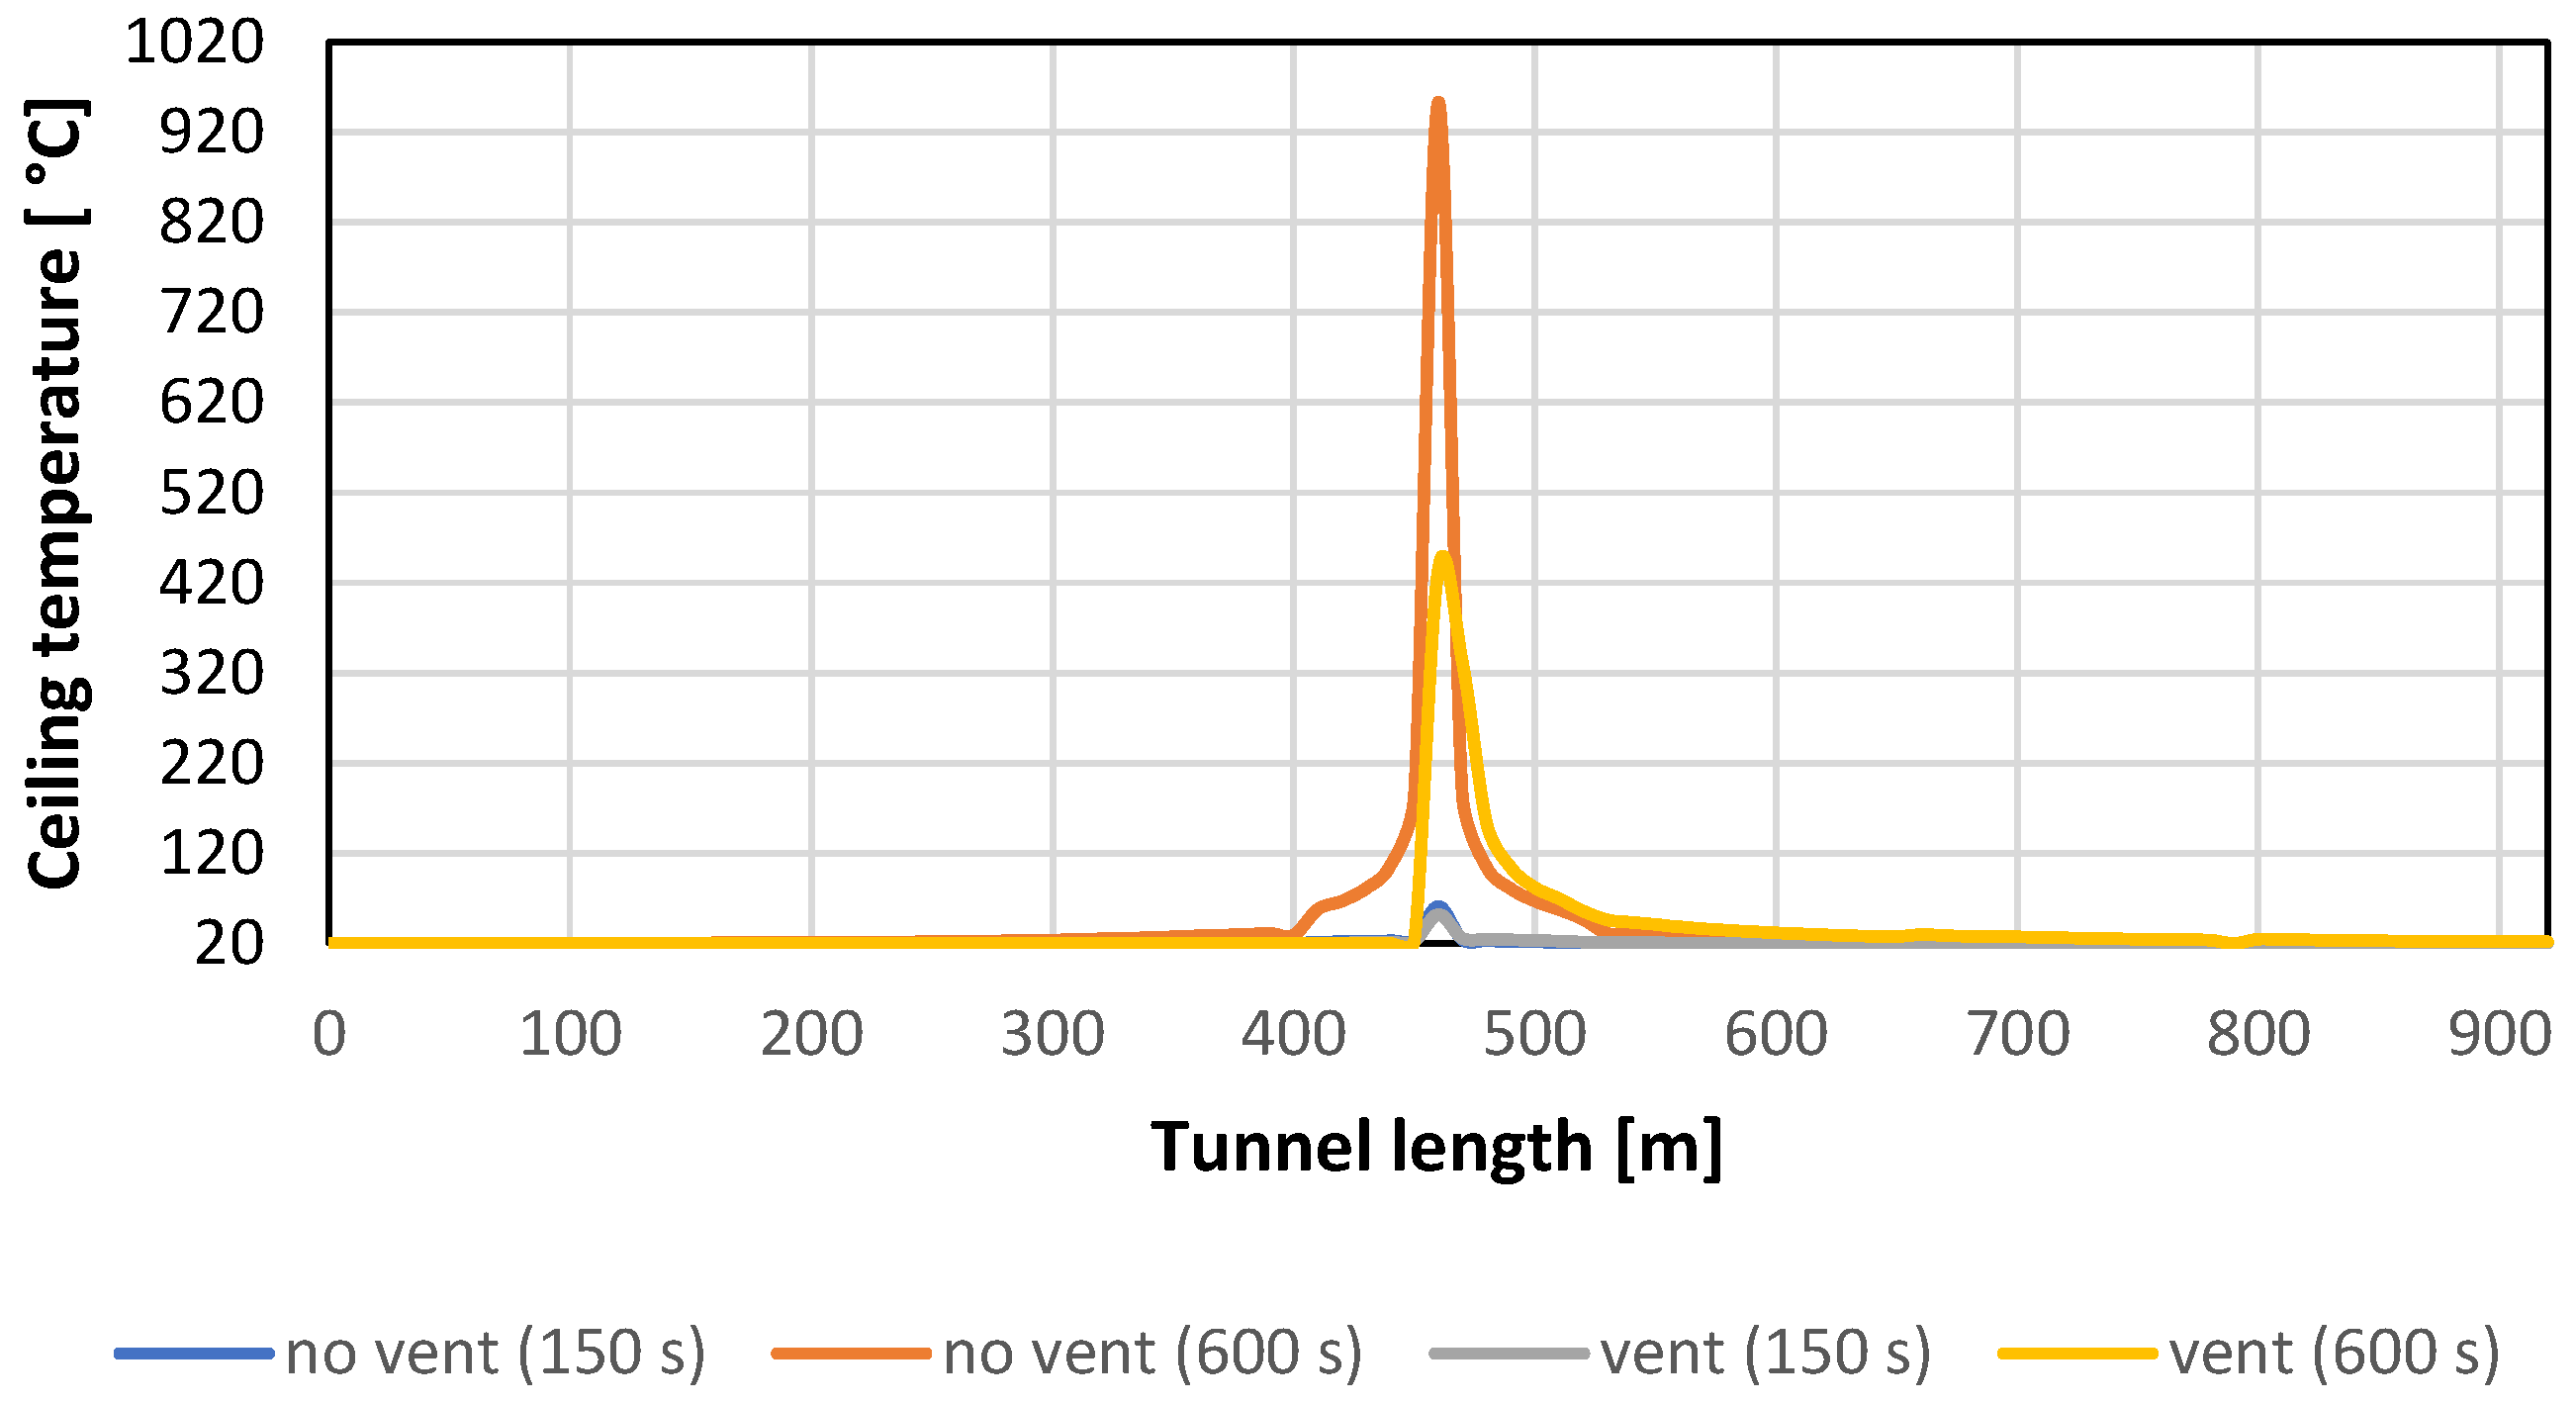
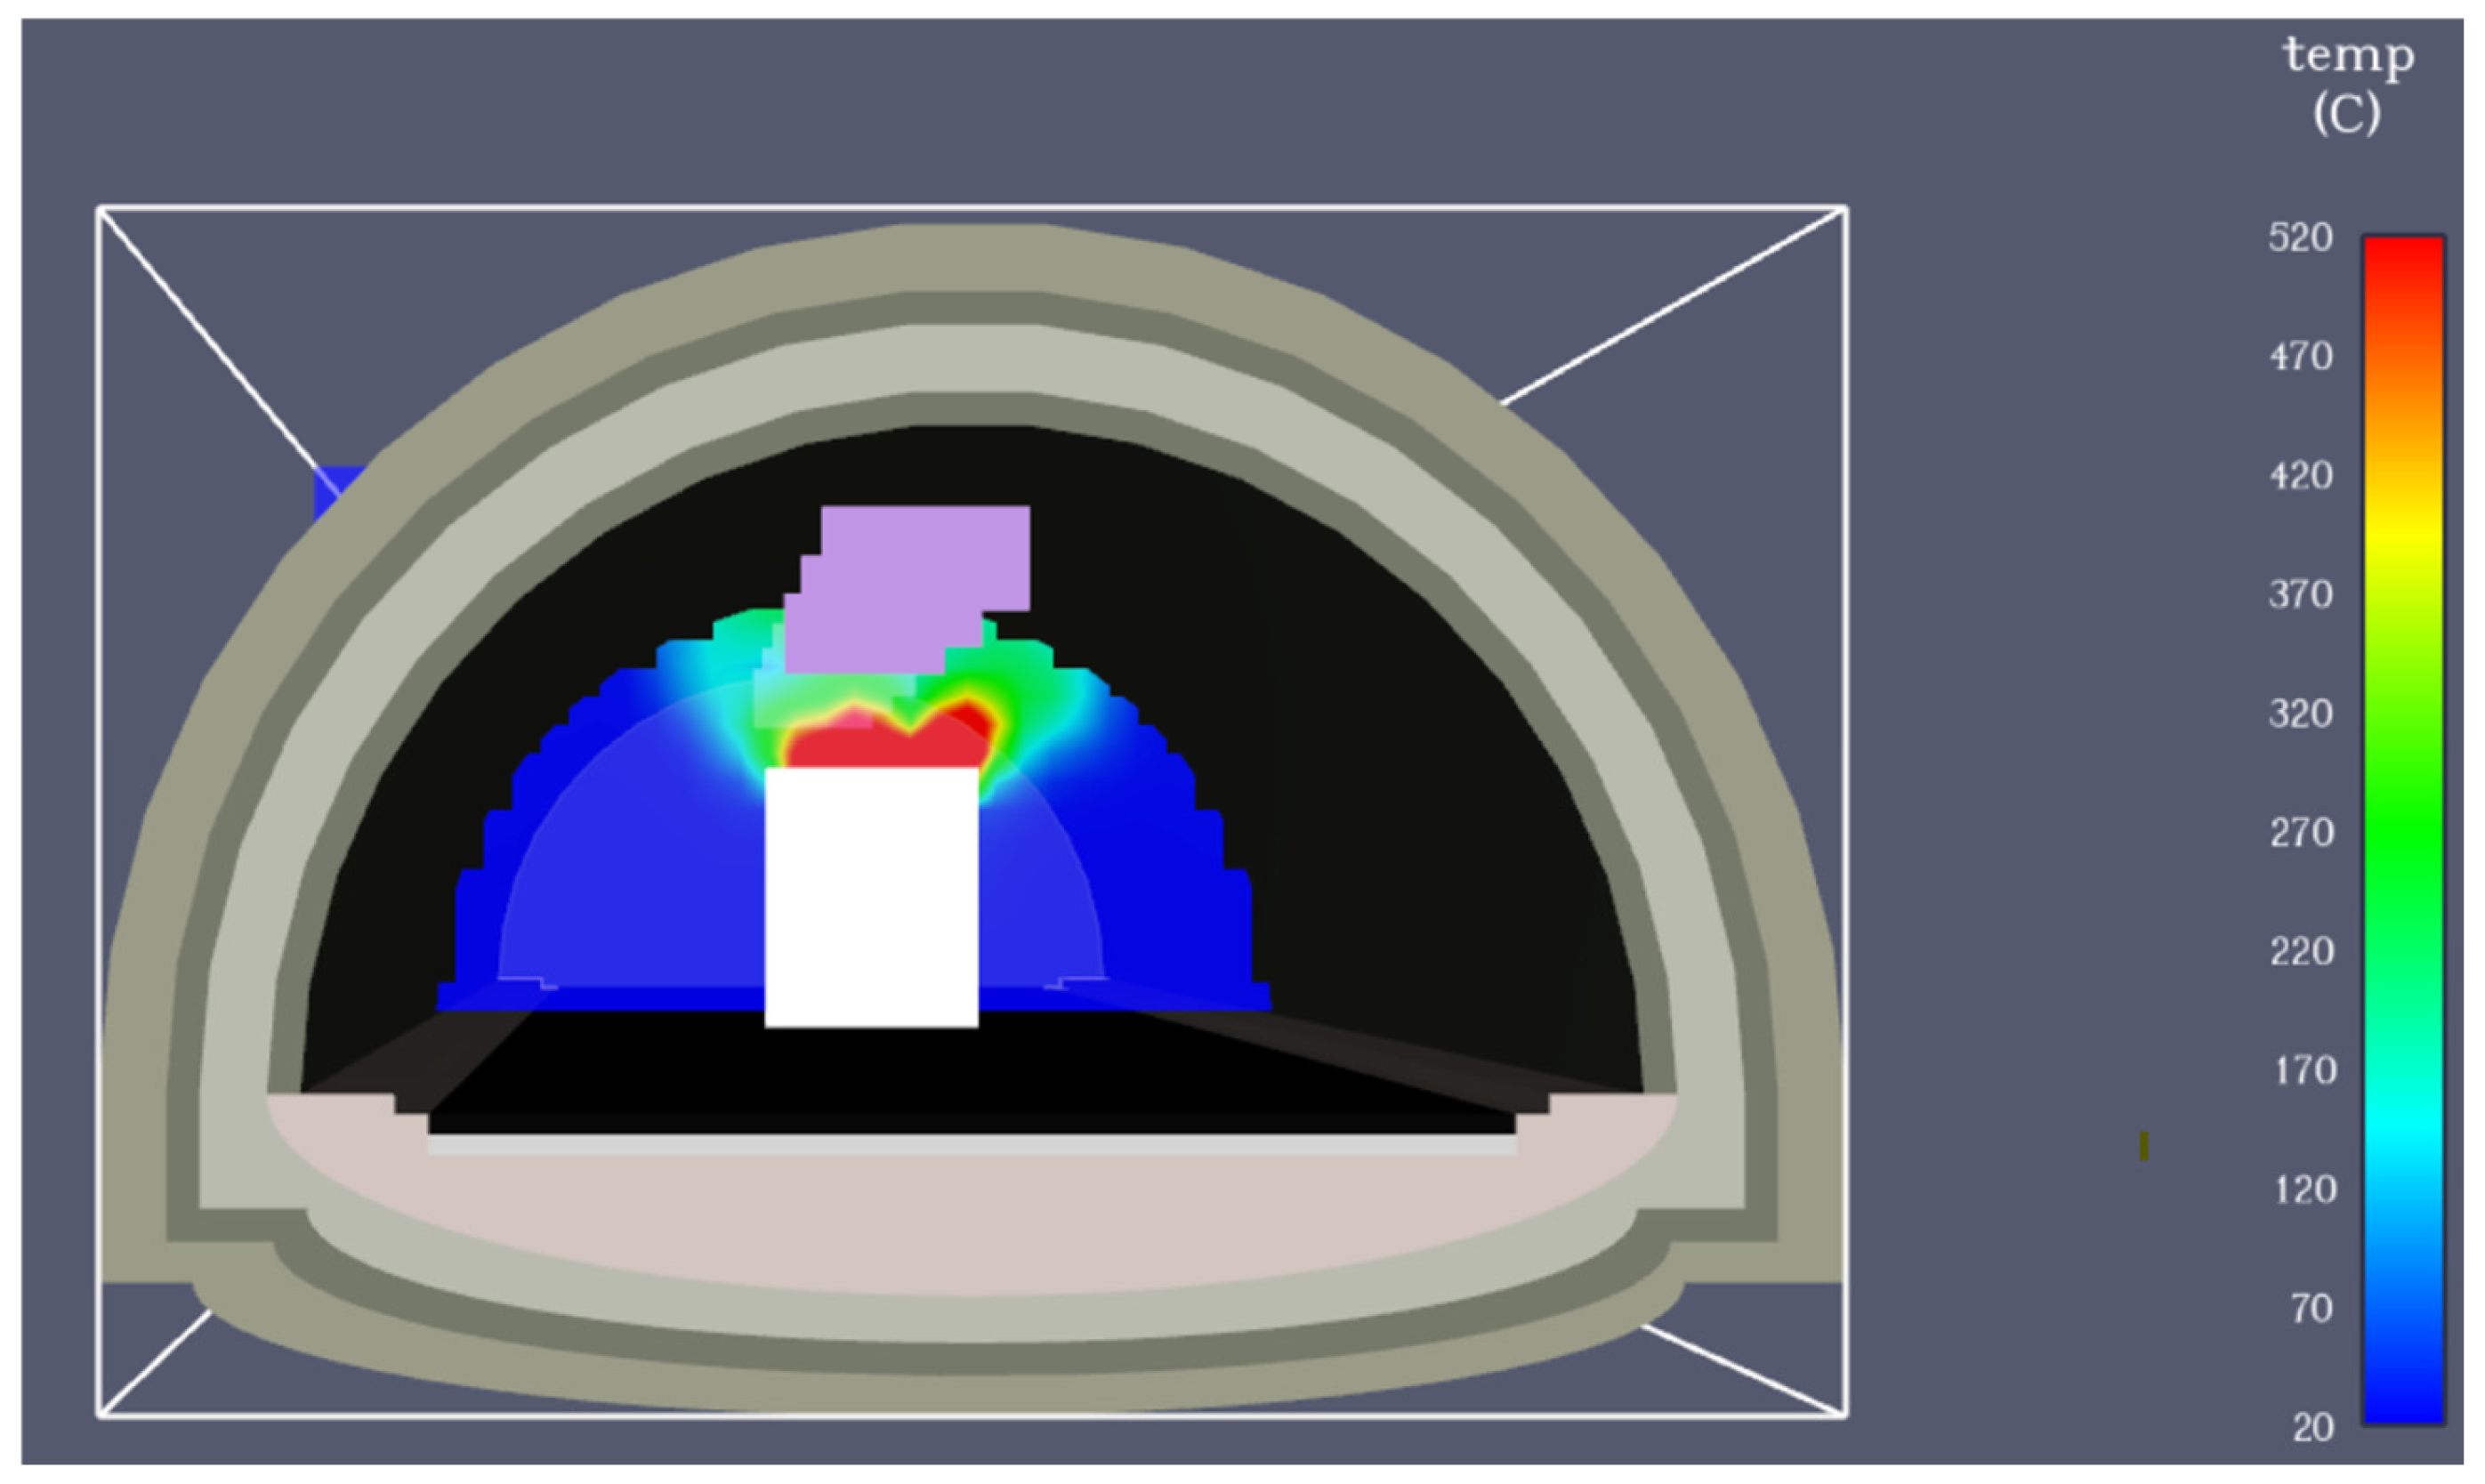
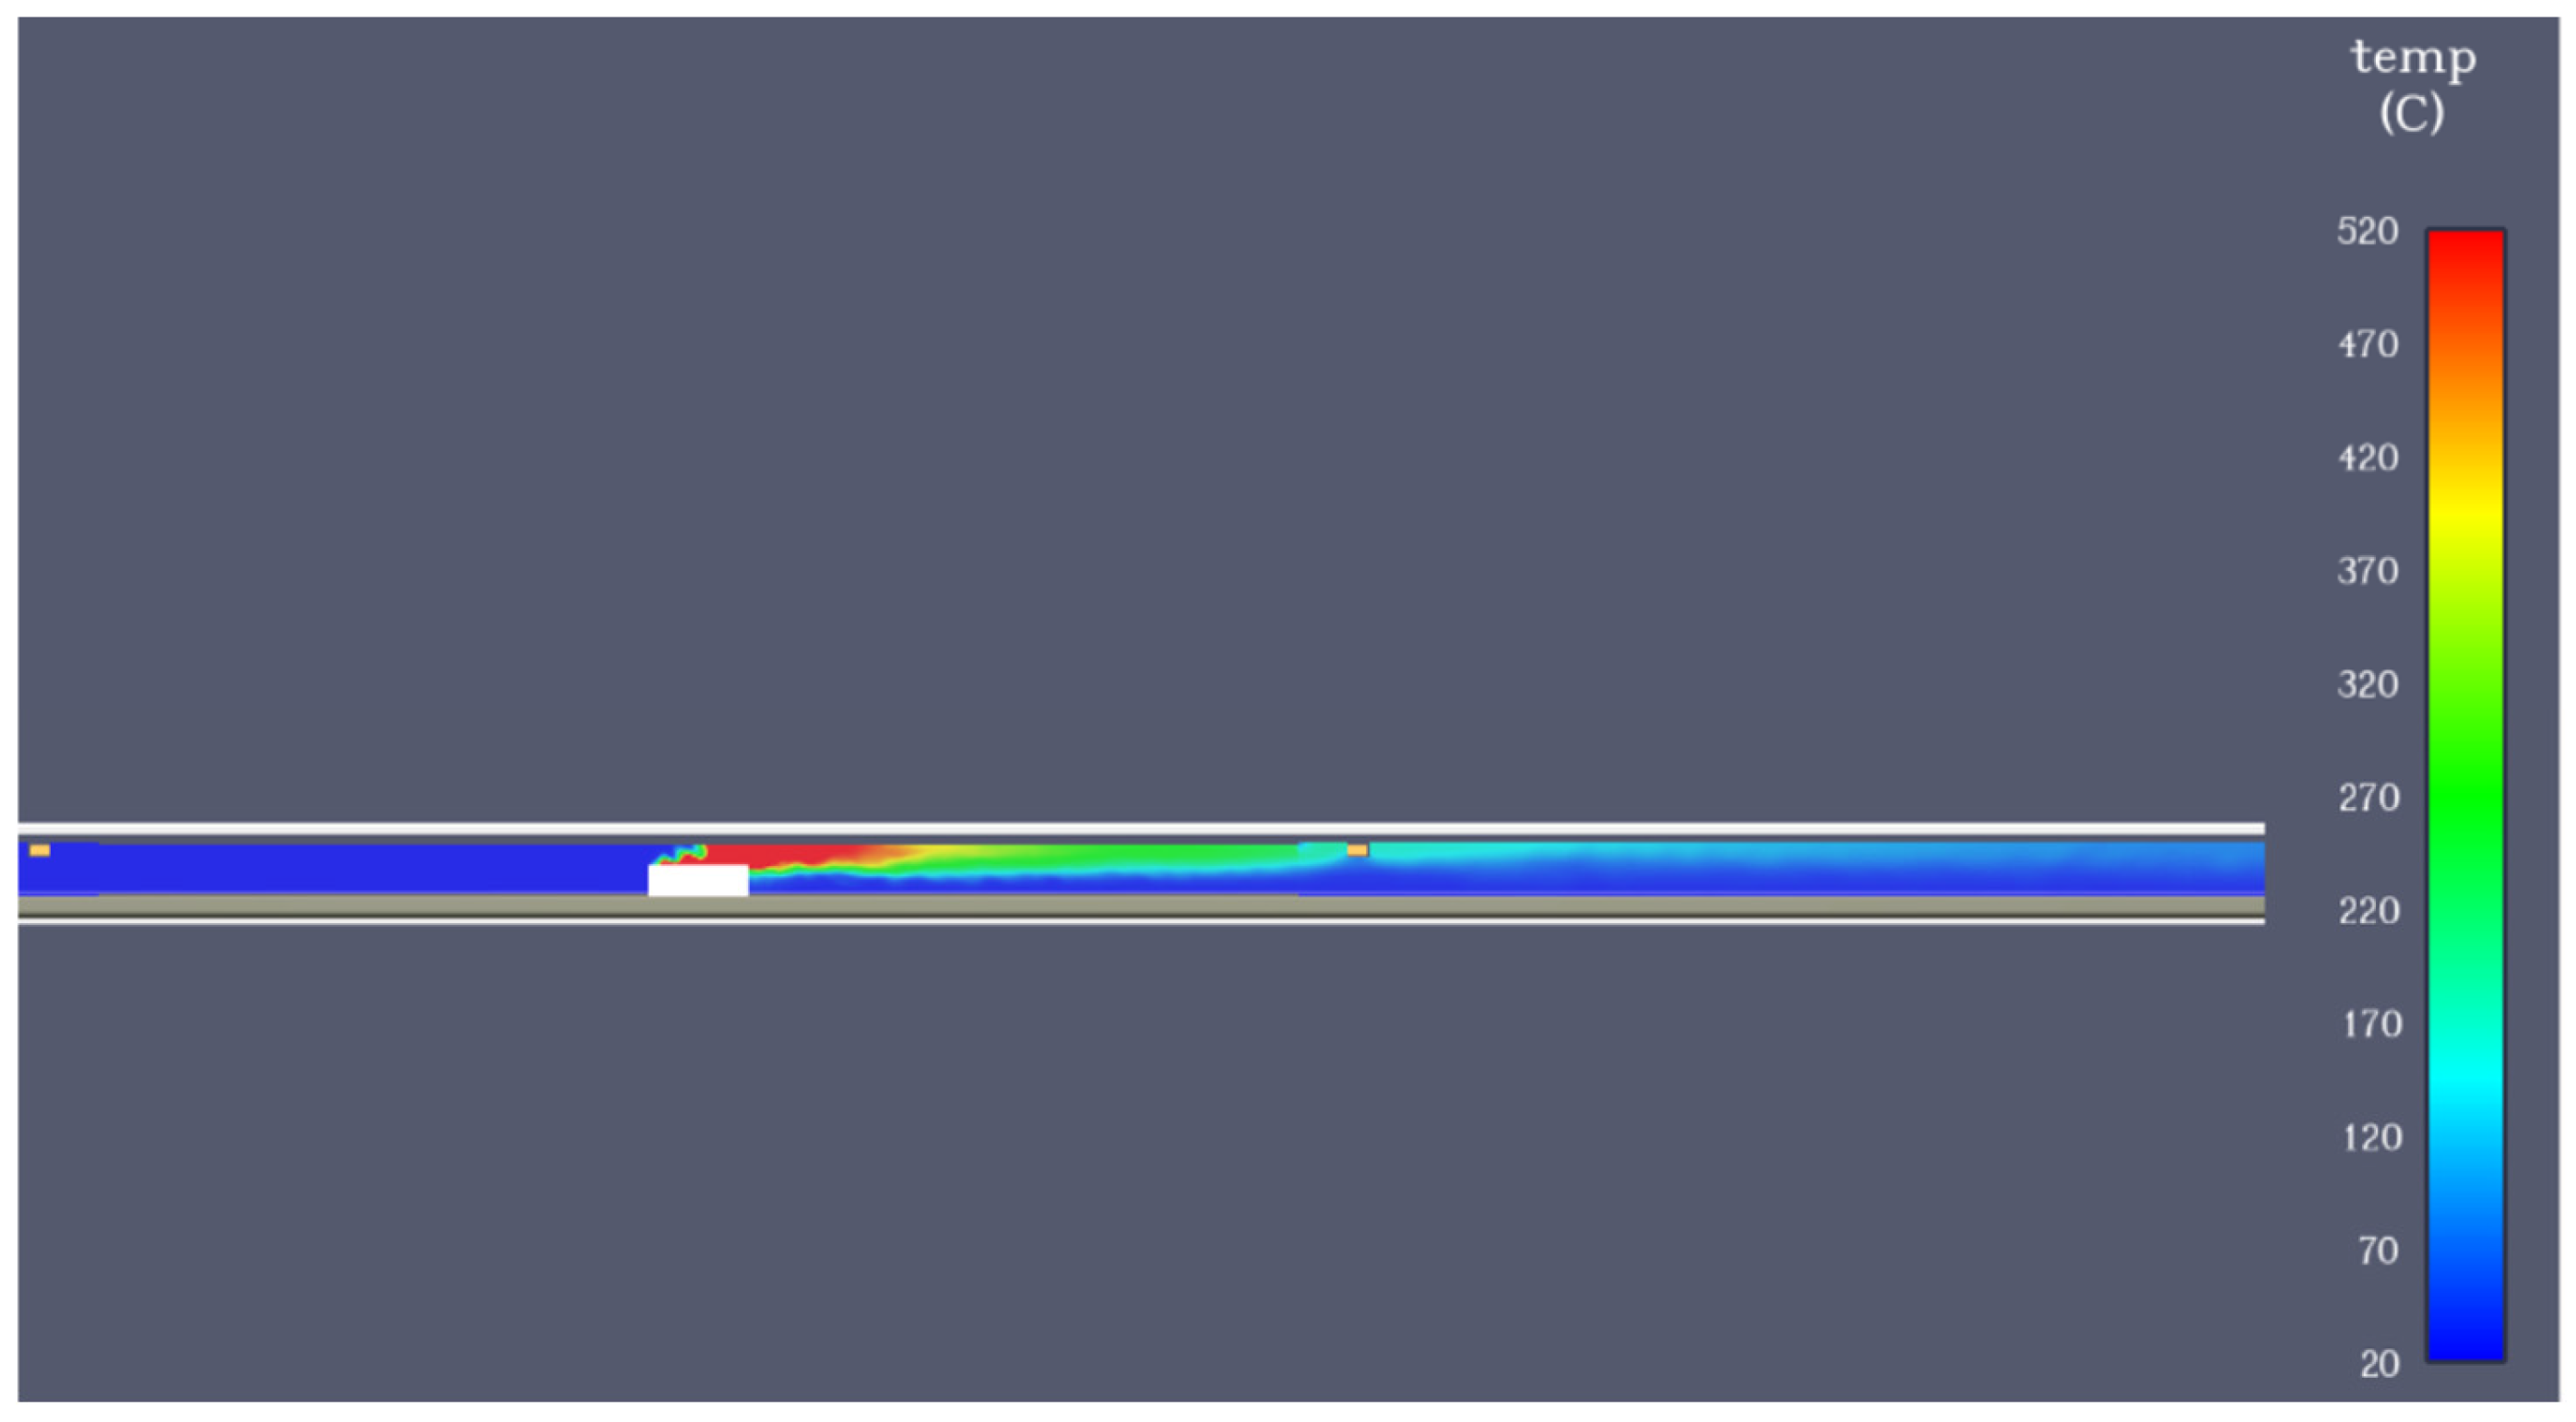
3.3. SCANIA with Fans
4. Discussion
5. Conclusions
Author Contributions
Funding
Data Availability Statement
Conflicts of Interest
Nomenclature
| Symbol | Unit | Description |
| HGV | Heavy Good Vehicle | |
| BEV | Battery Electric Vehicle | |
| ICEV | Internal Combustion Engine Vehicle | |
| FDS | Fire Dynamics Simulator | |
| HRR | kW | Heat Release Rate |
| PM | ppmv | Particulate Matter in ppm by volume |
| SO2 | ppmv | Sulphur Dioxide |
| NOx | ppmv | Nitrogen Oxides |
| EV | Electric Vehicle | |
| GHG | Greenhouse Gas | |
| EU | European Union | |
| WTW | Well-To-Wheel | |
| IEA | International Energy Agency | |
| CFD | Computational Fluid Dynamics | |
| CAD | Computer Aided Drafting | |
| BIM | Building Information Modelling | |
| IFC | Industry Foundation Classes | |
| PHEV | Plug-in Hybrid Electric Vehicle | |
| VLES | Very Large Eddy Simulation | |
| NMC | Lithium Nickel–Manganese–Cobalt Oxides | |
| HRRPUA | kW/m2 | Heat Release Rate Per Unit Area |
| NFPA | National Fire Protection Association | |
| PIARC | World Road Association—Association Internationale Permanente des Congrès de la route (AIPCR) | |
| CO2 | kg/kgfuel | Carbon Dioxide |
| CO | kg/kgfuel | Carbon Monoxide |
| H2 | kg/kgfuel | Hydrogen |
| C3H8 | kg/kgfuel | Propane |
| CH4 | kg/kgfuel | Methane |
| C3H6 | kg/kgfuel | Propylene |
| g/cm3 | Density | |
| s | Time | |
| m/s | Velocity | |
| kg/s/m3 | Net Heat Flux | |
| Pa | Pressure | |
| m/s2 | Acceleration | |
| N | External Force | |
| N/m2 | Stress Tensor | |
| J/kg | Enthalpy | |
| W/m3 | Heat Per Unit Volume | |
| W/m3 | Energy for evaporation | |
| W/m2 | Heat Flux | |
| W/m3 | Dissipative function | |
| Aburner | m2 | Burner area |
| EB | Wh | Battery capacity |
| m | Characteristic Fire Diameter | |
| kW | HRRmax of the battery | |
| kg/m3 | Air density | |
| kJ/kg·K | Specific heat | |
| K | Ambient temperature | |
| kJ/kg | Heat of combustion | |
| kg | Mass of the battery | |
| kJ | Energy released | |
| m | Tunnel height | |
| m | Tunnel width | |
| kg/m3 | Density of the ambient | |
| m | Backlayering length | |
| Pa | Total loss | |
| Pa | Inlet loss | |
| Pa | Wall friction loss | |
| Pa | Flow direction loss | |
| Pa | Flow area loss | |
| Pa | Orifice’s loss | |
| Pa | Outlet loss | |
| Pa | Buoyancy loss | |
| Pa | Meteorological loss | |
| m3/s | Flow rate | |
| At | m2 | Cross-section area |
| c | m/s | Air velocity |
| P | kW | Power of the ventilation system |
References
- Alanazi, F. Electric Vehicles: Benefits, Challenges, and Potential Solutions for Widespread Adaptation. Appl. Sci. 2023, 13, 6016. [Google Scholar] [CrossRef]
- Helmers, E.; Marx, P. Electric cars: Technical characteristics and environmental impacts. Environ. Sci. Eur. 2012, 24, 14. [Google Scholar] [CrossRef]
- Saleh, M.A.S. The Future Trend of E-Mobility in Terms of Battery Electric Vehicles and Their Impact on Climate Change: A Case Study Applied in Hungary. Am. J. Clim. Change 2024, 13, 83–102. [Google Scholar] [CrossRef]
- IEA. Global EV Outlook 2024; IEA: Paris, France, 2024. [Google Scholar]
- Sun, W.; Wang, B.; Wang, Z. Thermal Runaway and Thermal Management of Lithium-Ion Power Batteries in New Energy Vehicles. Highlights Sci. Eng. Technol. 2024, 112, 152–159. [Google Scholar] [CrossRef]
- Casey, N. Fire incident data for Australian road tunnels. Fire Saf. J. 2019, 111, 102909. [Google Scholar] [CrossRef]
- Bai, J.; Liao, H.; Xia, Y. Study on Fire Accidents in Tunnels. IOP Conf. Ser. Mater. Sci. Eng. 2020, 741, 012095. [Google Scholar] [CrossRef]
- Li, A.; Abpeikar, S.; Wang, M.; Frankcombe, T.; Ghodrat, M. An integration framework based on deep learning and CFD for early detection of lithium-ion battery thermal runaway. Appl. Therm. Eng. 2025, 274, 126460. [Google Scholar] [CrossRef]
- Held, M.; Tuchschmid, M.; Zennegg, M.; Figi, R.; Schreiner, C.; Mellert, L.D.; Welte, U.; Kompatscher, M.; Hermann, M.; Nachef, L. Thermal runaway and fire of electric vehicle lithium-ion battery and contamination of infrastructure facility. Renew. Sustain. Energy Rev. 2022, 165, 112474. [Google Scholar] [CrossRef]
- Ministry of Infrastructure and Transport of the Italian Government Direttiva CE numero 2004/54/CE del 29/04/2004 | Ministero delle Infrastrutture e dei Trasporti, MIT.gov. Available online: https://www.mit.gov.it/normativa/direttiva-ce-numero-200454ce-del-29042004 (accessed on 25 March 2025).
- McGrattan, K.B. Fire Dynamics Simulator (Version 4): Technical Reference Guide; National Institute of Standards and Technology: Gaithersburg, MD, USA, 2006. [Google Scholar] [CrossRef]
- Codescu, S.; Chisacof, A.; Anghel, I.; Panaitescu, V. Environmental Consequences and Risk Factors After a Fire in a Road Tunnel. Politeh. Univ. Buchar. 2014, 2, 37–43. [Google Scholar]
- Mazzini, V. Progetto Della Sicurezza Analisi Di Rischio. Soc. Autostrada Tirrenica PA 2015, 64. Available online: https://www.tirrenica.it/sites/default/files/2022-04/PE_DS_GN00_00_AR_001_B.pdf (accessed on 28 March 2025).
- Autodesk Autodesk Revit. Funzionalità del Software Revit. Available online: https://www.autodesk.com/it/products/revit/features (accessed on 25 January 2025).
- Material Properties | Website about Elements and Materials, Material Properties. Available online: https://material-properties.org/ (accessed on 28 March 2025).
- The Engineering Toolbox Solids—Specific Heats. Available online: https://www.engineeringtoolbox.com/specific-heat-solids-d_154.html (accessed on 28 March 2025).
- Point Veterinaire Italie. Emissivity Table. Available online: https://www.pointvet.it/web/media/libri_pvi/Tab_emissivita.pdf (accessed on 18 September 2013).
- Camion Elettrici: La soluzione Scania, Scania Italia. Available online: https://www.scania.com/it/it/home/soluzioni-elettriche-scania.html (accessed on 15 January 2025).
- IVECO Group. IVECO Stralis AS260S43Y/PT. 10/03. Available online: https://www.google.com/url?sa=t&source=web&rct=j&opi=89978449&url=https://www.iveco.com/altra-it/Documents/Configurator/Brochure/Stralis_IT.pdf&ved=2ahUKEwid-cztveWOAxXxi_0HHc6rMVsQFnoECBUQAQ&usg=AOvVaw15qI9Rx1xJoFOH0X3U-92b (accessed on 18 February 2025).
- SCANIA. Life Cycle Assessment of Distribution Vehicles Battery Electric vs. Diesel Driven. 6 May 2021. Available online: https://www.scania.com/content/dam/group/press-and-media/press-releases/documents/Scania-Life-cycle-assessment-of-distribution-vehicles.pdf (accessed on 17 February 2025).
- Bhutada, G. The Key Minerals in an EV Battery, Elements by Visual Capitalist. Available online: https://elements.visualcapitalist.com/the-key-minerals-in-an-ev-battery/ (accessed on 13 January 2025).
- The Engineering Toolbox. Metals—Specific Heats. Available online: https://www.engineeringtoolbox.com/specific-heat-metals-d_152.html (accessed on 28 March 2025).
- Raza, H.; Li, S. The impact of battery electric bus fire on road tunnel. In Expanding Underground—Knowledge and Passion to Make a Positive Impact on the World, 1st ed.; CRC Press: London, UK, 2023; pp. 3280–3288. [Google Scholar] [CrossRef]
- Lecocq, A.; Bertana, M.; Truchot, B.; Marlair, G. Comparison of the fire consequences of an electric vehicle and an internal combustion engine vehicle. In Proceedings of the International Conference on Fires in Vehicles—FIVE 2012, Chicago, IL, USA, 27–28 September 2012; pp. 183–194. [Google Scholar]
- NFPA NFPA 502, Standard for Road Tunnels, Bridges, and Other Limited Access Highways (2020). Available online: https://www.nfpa.org/product/nfpa-502-standard/p0502code/nfpa-502-standard-for-road-tunnels-bridges-and-other-limited-access-highways-2020/50220pdf (accessed on 15 January 2025).
- Lönnermark, E.A.; Ingason, H. Proceedings from the Third International Symposium on Tunnel Safety and Security; SP Sveriges Provnings-Och Forskningsinstitut: Borås, Sweden, 2008. [Google Scholar]
- Wang, Z.; Zhu, K.; Hu, J.; Wang, J. Study on the fire risk associated with a failure of large-scale commercial LiFePO4/graphite and LiNix Coy Mn1−x−y O2 /graphite batteries. Energy Sci. Eng. 2019, 7, 411–419. [Google Scholar] [CrossRef]
- Cheong, M.K.; Spearpoint, M.J.; Fleischmann, C.M. Design fires for vehicles in road tunnels. In Proceedings of the 7th International Conference on Performance-Based Codes and Fire Safety Design Methods, Auckland, New Zealand, 16–18 April 2008; pp. 229–240. [Google Scholar]
- Verification and Validation of Selected Fire Models for Nuclear Power Plant Applications: Fire Dyna, NRC Web. Available online: https://www.nrc.gov/reading-rm/doc-collections/nuregs/staff/sr1824/v7/index.html (accessed on 15 January 2025).
- McGrattan, K.B.; Forney, G.P. Fire Dynamics Simulator (Version 4): User’s Guide; National Institute of Standards and Technology: Gaithersburg, MD, USA, 2004. [Google Scholar] [CrossRef]
- Caliendo, C.; Genovese, G.; Russo, I. Risk Analysis of Road Tunnels: A Computational Fluid Dynamic Model for Assessing the Effects of Natural Ventilation. Appl. Sci. 2020, 11, 32. [Google Scholar] [CrossRef]
- Shen, H.; Wang, H.; Li, M.; Li, C.; Zhang, Y.; Li, Y.; Yang, X.; Feng, X.; Ouyang, M. Thermal Runaway Characteristics and Gas Composition Analysis of Lithium-Ion Batteries with Different LFP and NCM Cathode Materials under Inert Atmosphere. Electronics 2023, 12, 1603. [Google Scholar] [CrossRef]
- Betiha, M.A.; Rabie, A.M.; Ahmed, H.S.; Abdelrahman, A.A.; El-Shahat, M.F. Oxidative desulfurization using graphene and its composites for fuel containing thiophene and its derivatives: An update review. Egypt. J. Pet. 2018, 27, 715–730. [Google Scholar] [CrossRef]
- Date, A.W. Analytic Combustion: With Thermodynamics, Chemical Kinetics and Mass Transfer; Cambridge University Press: Cambridge, UK, 2011. [Google Scholar]
- Fuels—Higher and Lower Calorific Values. The Engineering Toolbox. Available online: https://www.engineeringtoolbox.com/fuels-higher-calorific-values-d_169.html (accessed on 13 January 2025).
- Sturm, P.; Fößleitner, P.; Fruhwirt, D.; Galler, R.; Wenighofer, R.; Heindl, S.F.; Krausbar, S.; Heger, O. Fire tests with lithium-ion battery electric vehicles in road tunnels. Fire Saf. J. 2022, 134, 103695. [Google Scholar] [CrossRef]
- BMW Group. BMW Group Vehicle Footprint—BMW i5 eDrive40, 8 May 2024. Available online: https://www.google.com/url?sa=t&source=web&rct=j&opi=89978449&url=https://www.bmwgroup.com/content/dam/grpw/websites/bmwgroup_com/responsibility/downloads/en/2025/BMW_Vehicle_Footprint_i5_eDrive40_EN_31FK.pdf&ved=2ahUKEwjFhbvTvuWOAxV7lf0HHfl3El8QFnoECBkQAQ&usg=AOvVaw354-3d0vrcjNTzChKy6Tdn (accessed on 17 February 2025).
- Toyota. Specifiche Tecniche del Nuovo Toyota bZ4X | Toyota, Toyota IT. Available online: https://www.toyota.it/gamma/bz4x/specifiche-tecniche (accessed on 13 January 2025).
- National Fire Protection Association; Society of Fire Protection Engineers. SFPE Handbook of Fire Protection Engineering, 3rd ed.; National Fire Protection Association: Quincy, MA, USA, 2022; Society of Fire Protection Engineers: Bethesda, MD, USA, 2022. [Google Scholar]
- Wang, K.; Hu, J.; Chen, R.; Wang, J. A Study on the Evacuation of an Extra-Long Highway Tunnel Fire—A Case Study of Chengkai Tunnel. Sustainability 2023, 15, 4865. [Google Scholar] [CrossRef]
- Idelchik, I.E. Flow Resistance: A Design Guide for Engineers; Routledge: New York, NY, USA, 2017. [Google Scholar] [CrossRef]
- EdilNamAdmin. Stima Analitica Curva RHR—Approfondimento Antincendio. Available online: https://www.edilizianamirial.it/stima-analitica-curva-rhr/ (accessed on 13 January 2025).
- Kang, S.; Kwon, M.; Yoon Choi, J.; Choi, S. Full-scale fire testing of battery electric vehicles. Appl. Energy 2023, 332, 120497. [Google Scholar] [CrossRef]
- Aironn. Tunnel Fans. Available online: https://www.aironn.com.tr/en/products/jet-fans/tunnel-fans (accessed on 13 January 2025).
- Li, D.; Zhu, G.; Zhu, H.; Yu, Z.; Gao, Y.; Jiang, X. Flame spread and smoke temperature of full-scale fire test of car fire. Case Stud. Therm. Eng. 2017, 10, 315–324. [Google Scholar] [CrossRef]
- Jiang, X.; Zhu, G.; Zhu, H.; Li, D. Full-scale Experimental Study of Fire Spread Behavior of Cars. Procedia Eng. 2018, 211, 297–305. [Google Scholar] [CrossRef]
- Okamoto, K.; Watanabe, N.; Hagimoto, Y.; Chigira, T.; Masano, R.; Miura, H.; Ochiai, S.; Satoh, H.; Tamura, Y.; Hayano, K.; et al. Burning behavior of sedan passenger cars. Fire Saf. J. 2009, 44, 301–310. [Google Scholar] [CrossRef]
- Cui, Y.; Liu, J.; Cong, B.; Han, X.; Yin, S. Characterization and assessment of fire evolution process of electric vehicles placed in parallel. Process Saf. Environ. Prot. 2022, 166, 524–534. [Google Scholar] [CrossRef]
- AITES. Structural Fire Protection for Road Tunnels. Available online: https://about.ita-aites.org/publications/wg-publications/1512/structural-fire-protection-for-road-tunnels (accessed on 16 July 2025).
- PIARC. Impact on Outside Air Quality | Road Tunnels Manual—World Road Association (PIARC). Available online: https://tunnelsmanual.piarc.org/en/operation-and-maintenance-environmental-issues/impact-outside-air-quality (accessed on 15 January 2025).


| Materials | Density ρ [kg/m3] | Thermal Conductivity k [W/mK] | Specific Heat Cp [kJ/kg·K] | Emissivity ε [-] |
|---|---|---|---|---|
| Stone | 2400 | 2.4 | 0.95 | 0.93 |
| Reinforced concrete | 2400 | 1.6 | 0.653 | 0.94 |
| Concrete | 2280 | 1.8 | 1.04 | 0.9 |
| Asphalt | 2100 | 0.756 | 1.67 | 0.98 |
| Cement panel | 2000 | 1.4 | 0.78 | 0.54 |
| Sedimentary rock | 2000 | 1.75 | 0.95 | 0.92 |
| Vehicle | Length [mm] | Width [mm] | Height [mm] | Engine Type | Battery Type | Installed Capacity [kWh] | Capacity [Ah] | Number of Batteries |
|---|---|---|---|---|---|---|---|---|
| SCANIA 25 P BEV | 9965 | 2550 | 3109 | Permanent magnet synchronous | Lithium ions | 300 | 50 | 9 |
| IVECO Stralis AS 260 | 9848 | 2550 | 3731 | 4-stroke with direct injection | Fulmen lead calcium | 170 | 2 |
| Materials | SCANIA 25 P BEV Percentage | IVECO Stralis AS 260 Percentage |
|---|---|---|
| Steel | 48% | 57% |
| Cast iron | 18% | 22% |
| Aluminium | 7.0% | 5.0% |
| Cells | 13% | |
| Non-ferrous metals (copper) | 2.0% | 1.9% |
| Operating fluids (coolant, engine oil, …) | 0.3% | 1.0% |
| Polymers | 9.6% | 11.0% |
| Special metals (palladium) | 0.1% | 0.1% |
| Other materials (glass) | 2.0% | 2.0% |
| Mineral | Composition of the Cell | Percentage | SCANIA Percentage of Total |
|---|---|---|---|
| Graphite | Anode | 28.10% | 3.65% |
| Aluminium | Cathode, Casing, and Collectors | 18.90% | 2.46% |
| Nickel | Cathode | 15.70% | 2.04% |
| Copper | Collectors | 10.80% | 1.40% |
| Steel | Casing | 10.80% | 1.40% |
| Manganese | Cathode | 5.40% | 0.70% |
| Cobalt | Cathode | 4.30% | 0.56% |
| Lithium | Cathode | 3.20% | 0.42% |
| Iron | Cathode | 2.70% | 0.35% |
| Material | Density ρ [kg/m3] | Thermal Conductivity k [W/mK] | Specific Heat cp [kJ/kg·K] | Emissivity ε [-] |
|---|---|---|---|---|
| Steel | 7500 | 22 | 0.502 | 0.79 |
| Aluminium | 2700 | 200 | 0.88 | 0.1 |
| Cobalt | 8900 | 100 | 0.42 | 0.93 |
| Iron | 7840 | 73 | 0.46 | 0.82 |
| Cast Iron | 7200 | 50 | 0.502 | 0.3 |
| Graphite | 2200 | 1600 | 0.72 | 0.9 |
| Lithium | 530 | 84.7 | 3.56 | 0.9 |
| Manganese | 7200 | 7.82 | 0.48 | 0.79 |
| Nickel | 8900 | 65 | 0.44 | 0.92 |
| Palladium | 12,020 | 71.8 | 0.244 | 0.15 |
| Polymer | 1000 | 15 | 1.67 | 0.9 |
| Copper | 8960 | 395 | 0.387 | 0.65 |
| Coolant | 1000 | 0.4 | 1.43 | 0.93 |
| Glass | 2200 | 1 | 0.677 | 0.85 |
| Vehicles | Peak HRR [MW] | Time to Peak HRR [min] |
|---|---|---|
| Passenger car | 5–10 | 0–54 |
| Multiple passenger car | 10–20 | 10–55 |
| Bus | 25–34 | 7–14 |
| Heavy goods truck | 20–200 | 7–48 |
| Vehicles | HRRmax PIARC [MW] | HRRmax French [MW] | HRRmax NFPA [MW] |
|---|---|---|---|
| 1 small passenger car | 2.5 | ||
| 1 large passenger car | 5 | 5 | |
| 2–3 passenger cars | 8 | 8 | |
| Van | 15 | 15 | |
| Bus | 20 | 20 | |
| HGV | 20–30 | 30 | 20–30 |
| Tanker | 100 | 200 | 100 |
| Vehicle | HRRmax [kW] | Burner Area [m2] | HRRPUA [kW/m2] | t [s] |
|---|---|---|---|---|
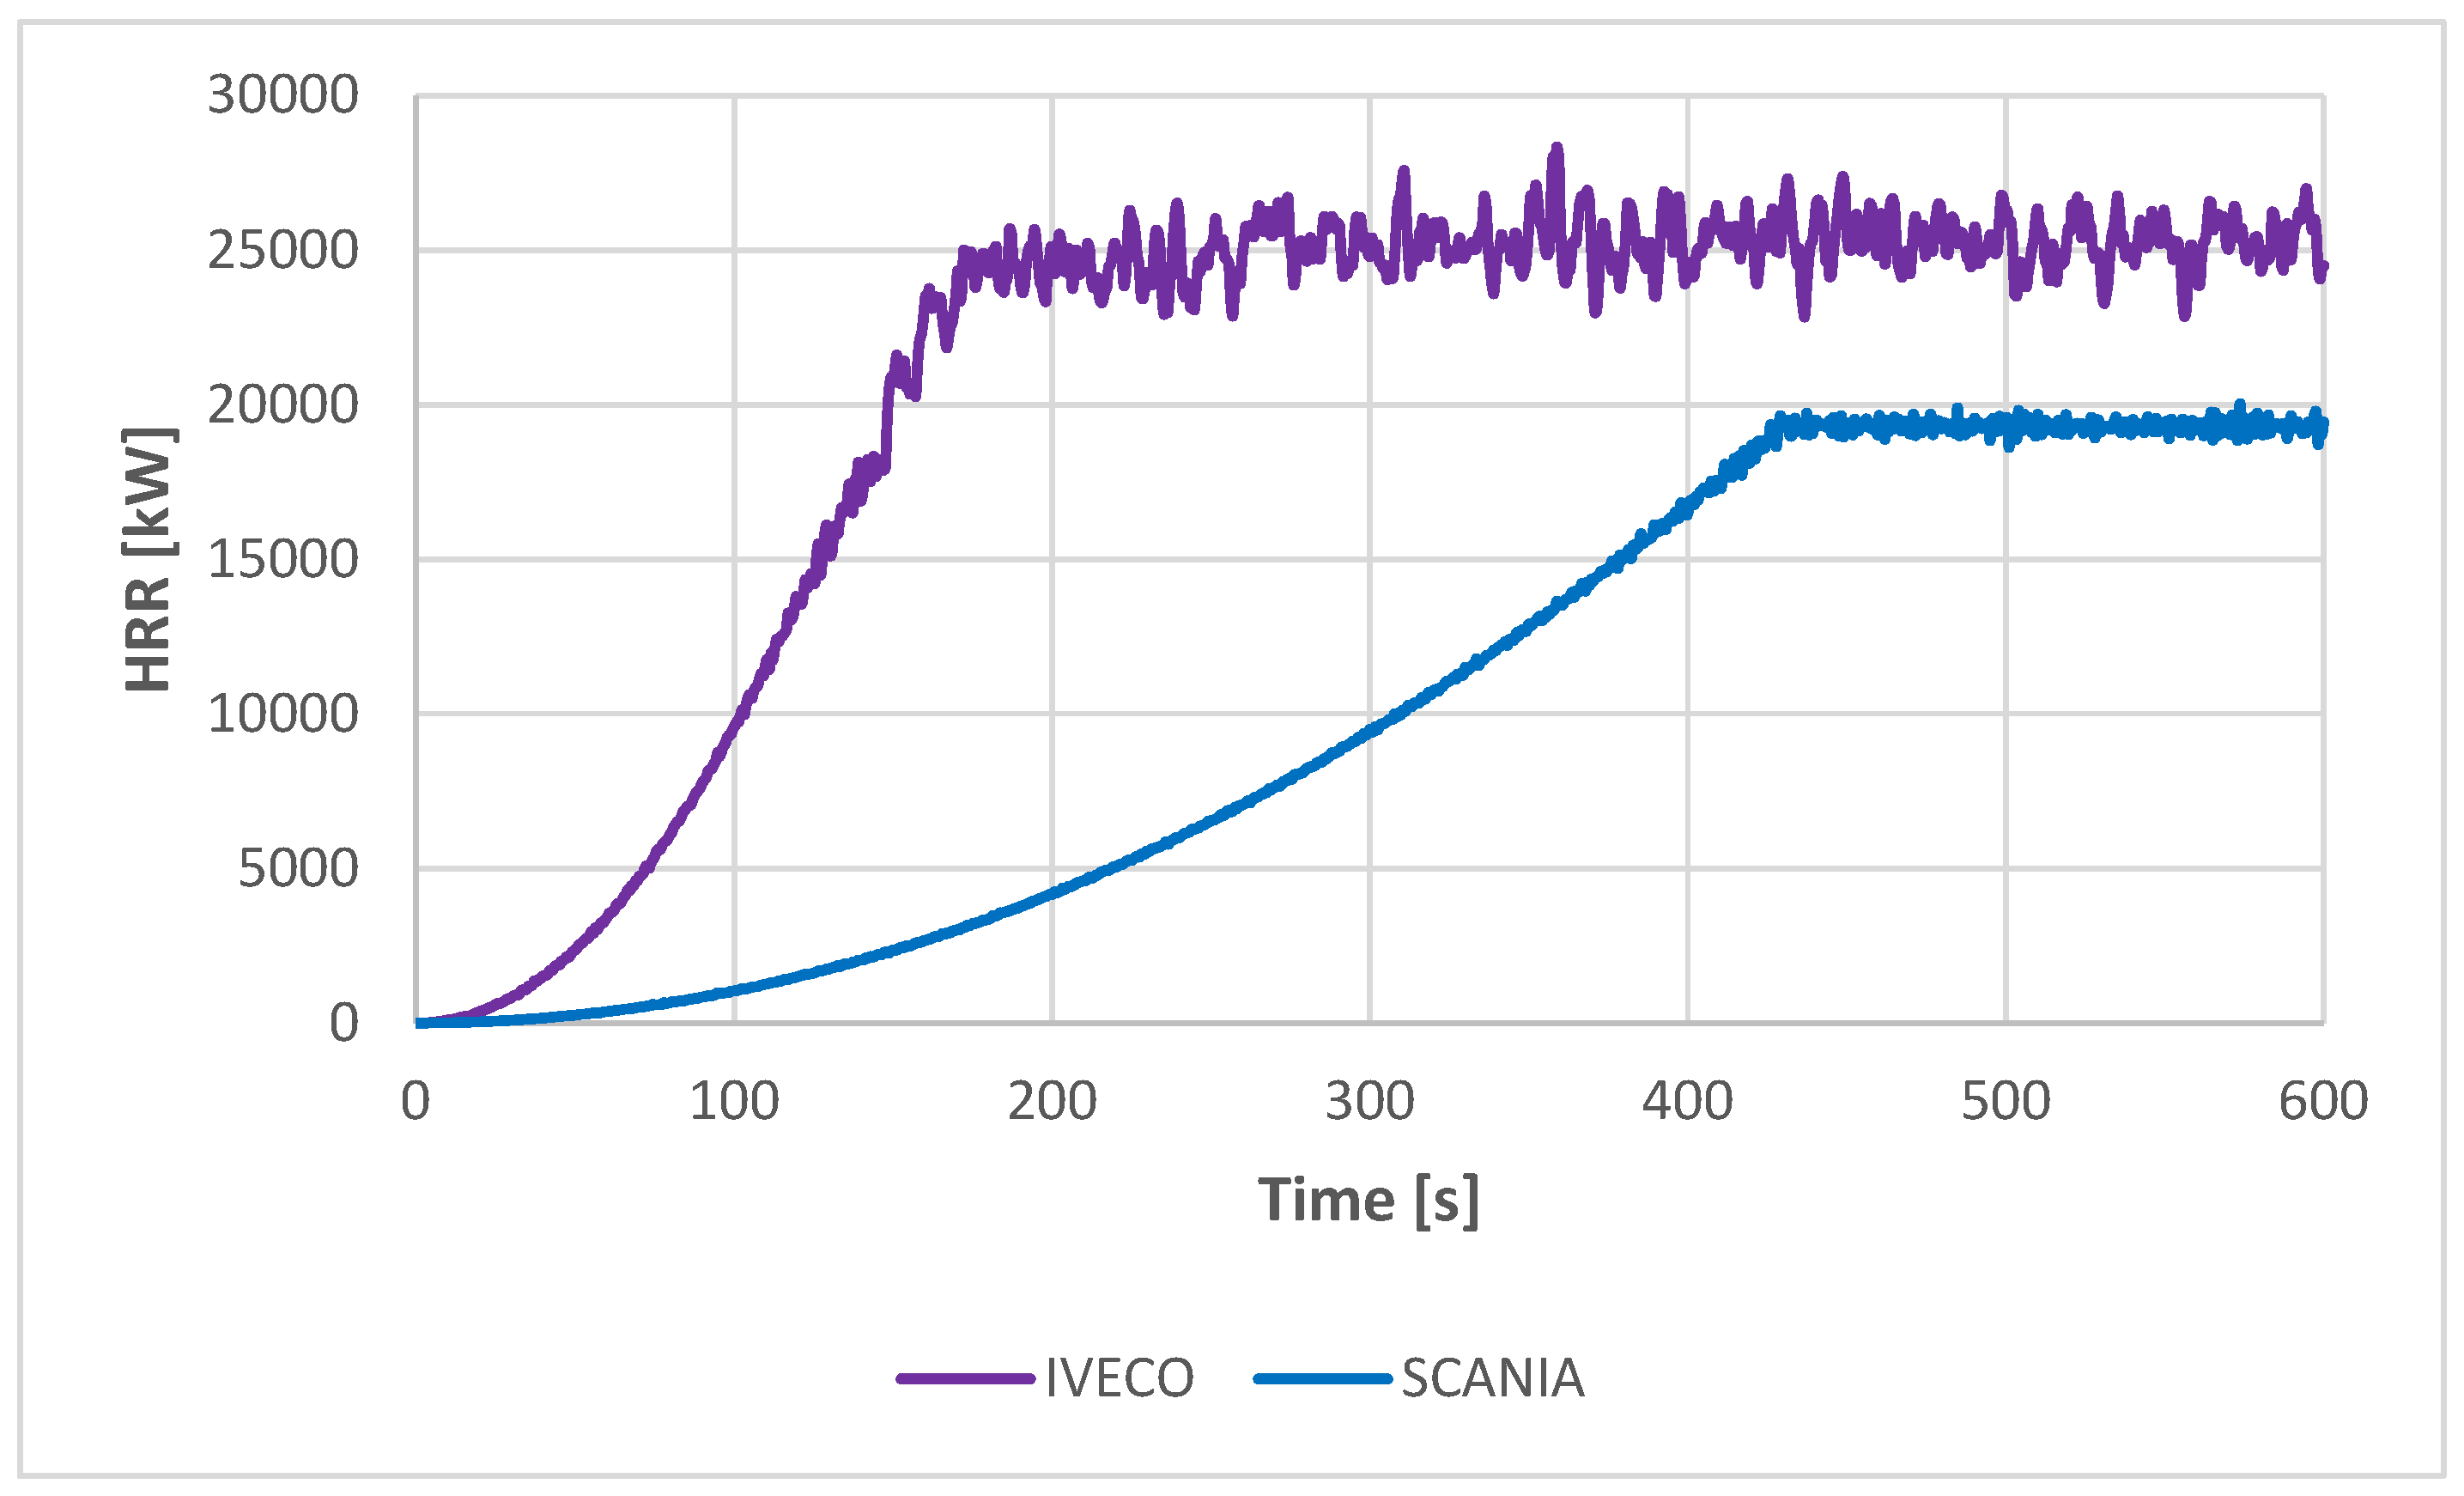
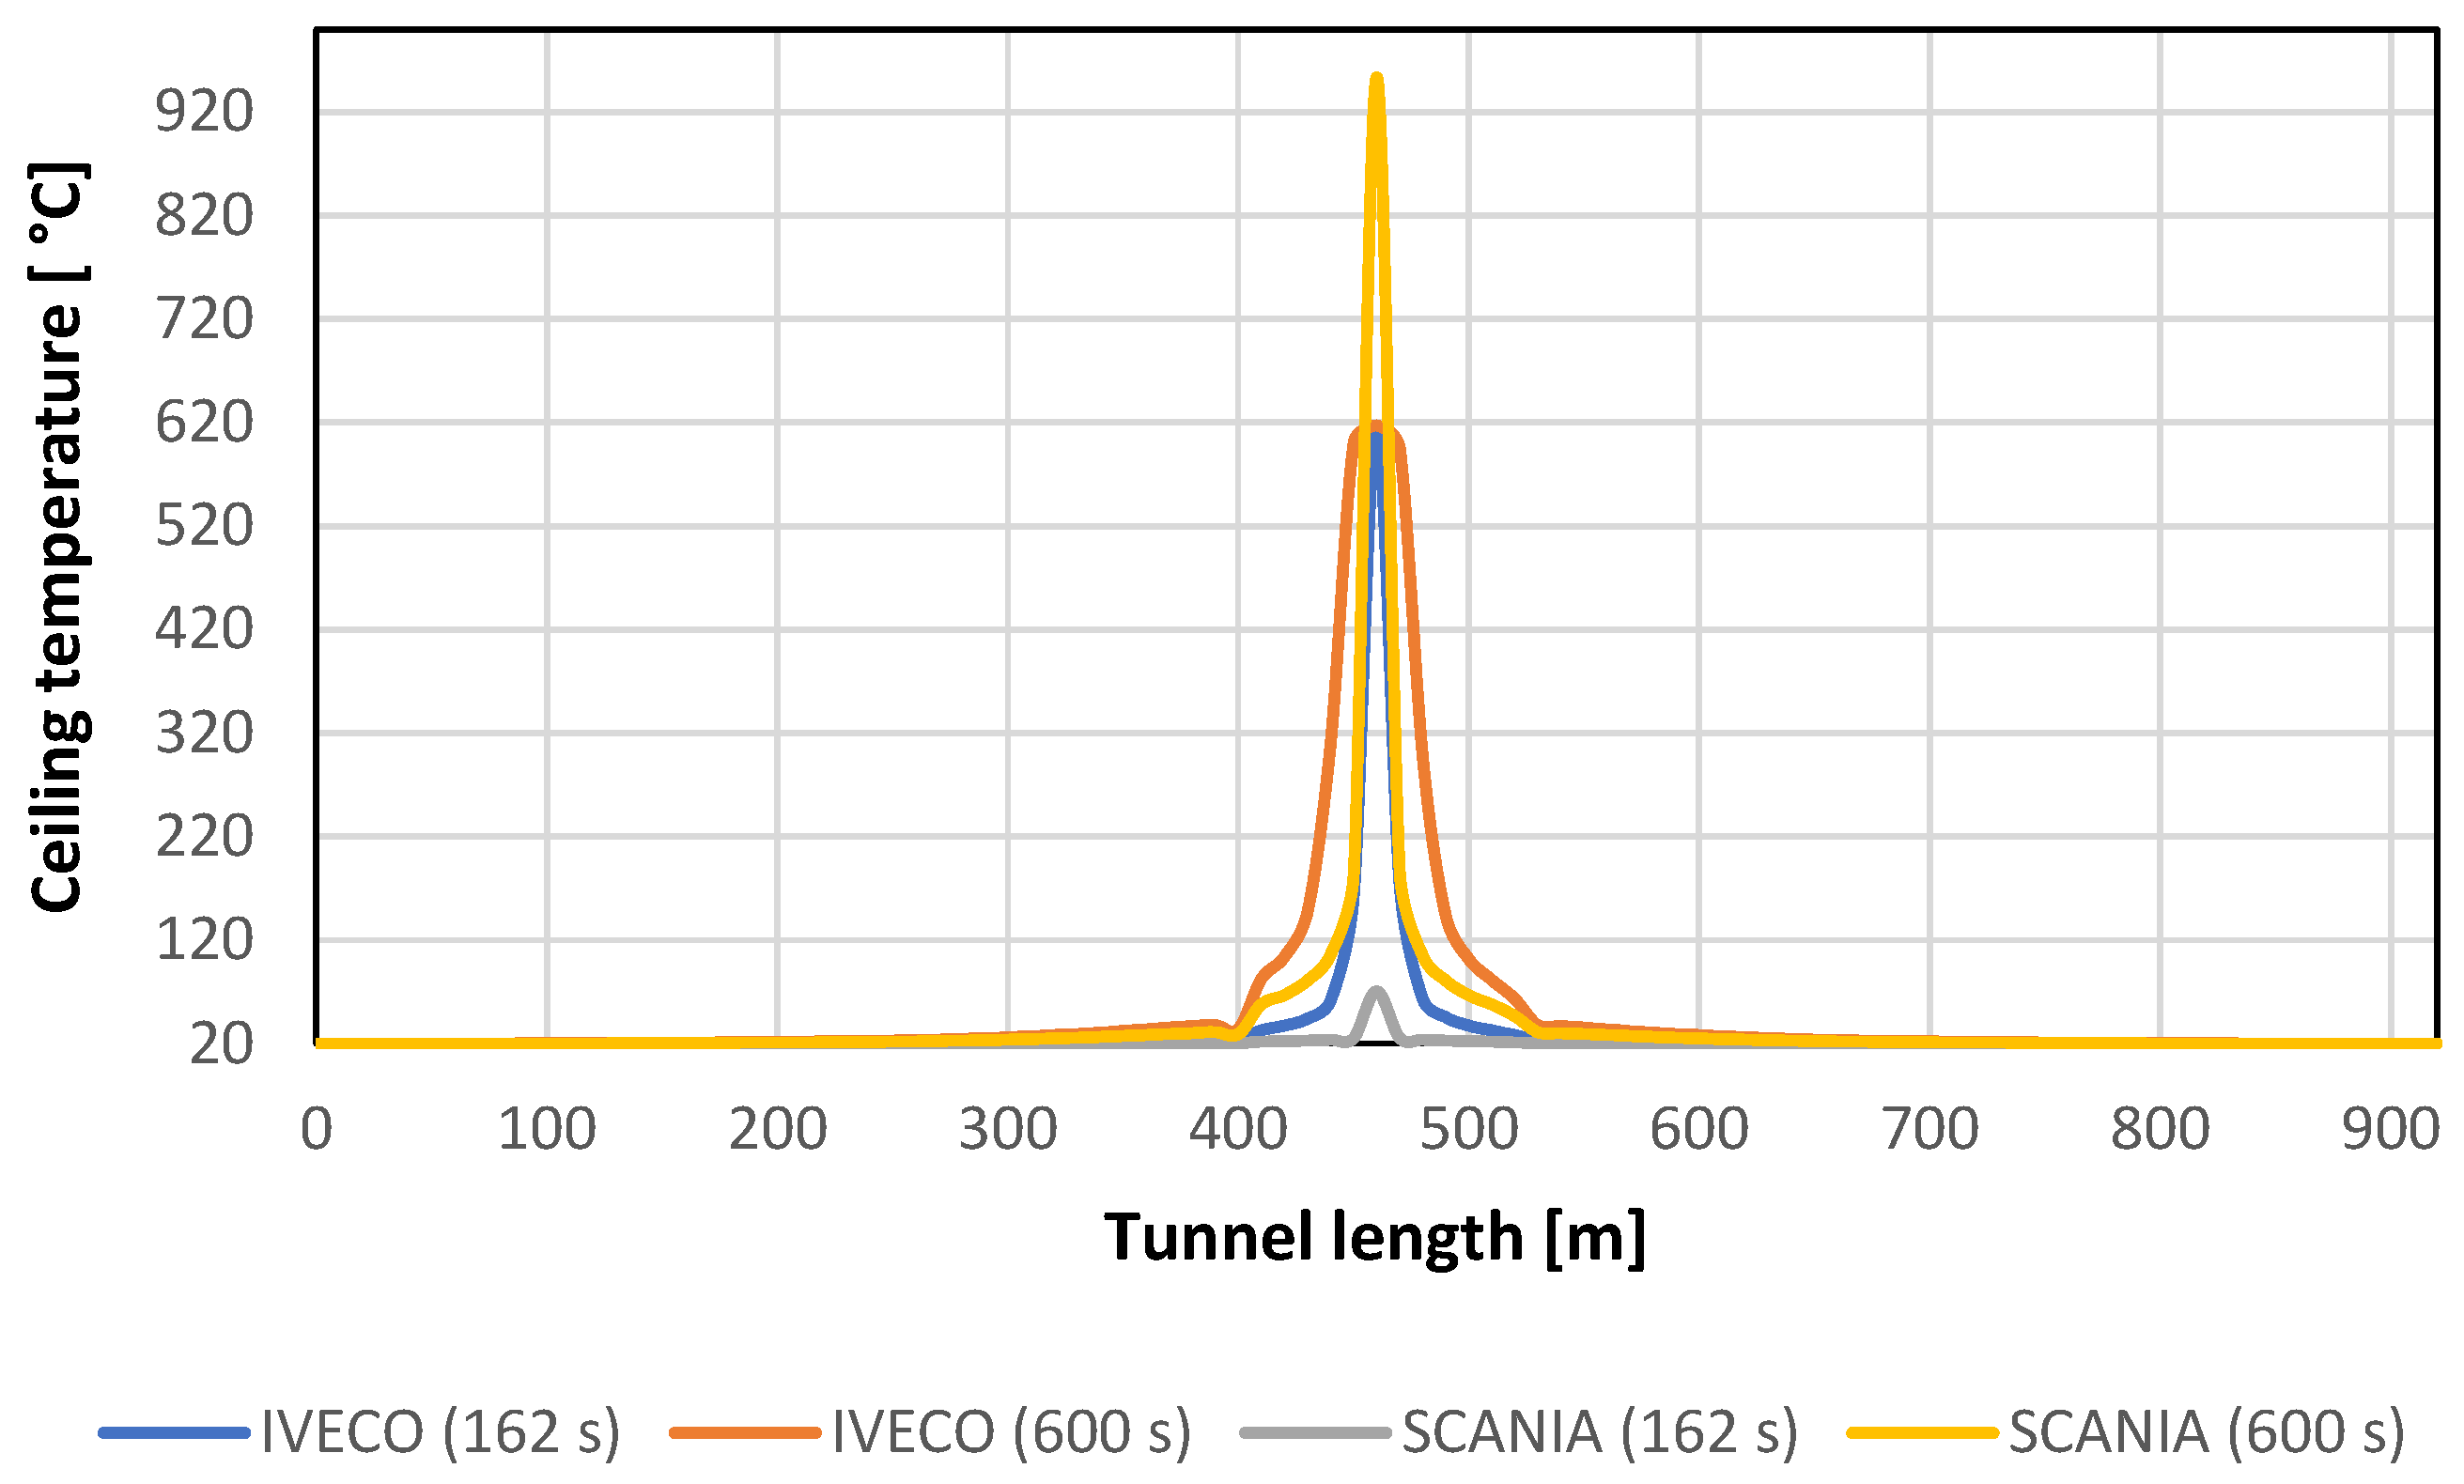
| SCANIA-EV | 20,866 | 25.41 | 821.16 | 429 |
| IVECO-ICEV | 27,082 | 25.11 | 1078.43 | 162 |
| Vehicle | Q [kW] | D* [m] | Mesh D*/5 [m] | Mesh D*/10 [m] | Mesh D*/20 [m] |
|---|---|---|---|---|---|
| SCANIA | 20,866 | 3.23 | 0.65 | 0.32 | 0.16 |
| IVECO | 27,082 | 3.59 | 0.72 | 0.36 | 0.18 |
| Mesh | Tunnel Length Section [m] | Cell Size Δx [m] | Total Number of Cells |
|---|---|---|---|
| Mesh 1 | 0–400 | 0.7 | 141,037 |
| Mesh 2 | 400–520 | 0.35 | 337,896 |
| Mesh 3 | 520–920 | 0.7 | 141,037 |
| Type of Fuel | Chemical Composition | Specific Heat at 20 °C | Density | Vaporisation Temperature | Melting Temperature | Vaporisation Heat | Formation Enthalpy |
|---|---|---|---|---|---|---|---|
| Diesel fuel | C12H23 | 1900 kJ/kg·K | 850 kg/m3 | 210 °C | −8.1 °C | 326 kJ/kg | 6700 kJ/mol |
Disclaimer/Publisher’s Note: The statements, opinions and data contained in all publications are solely those of the individual author(s) and contributor(s) and not of MDPI and/or the editor(s). MDPI and/or the editor(s) disclaim responsibility for any injury to people or property resulting from any ideas, methods, instructions or products referred to in the content. |
© 2025 by the authors. Licensee MDPI, Basel, Switzerland. This article is an open access article distributed under the terms and conditions of the Creative Commons Attribution (CC BY) license (https://creativecommons.org/licenses/by/4.0/).
Share and Cite
Dessì, R.; Fruhwirt, D.; Papurello, D. A Study on Large Electric Vehicle Fires in a Tunnel: Use of a Fire Dynamics Simulator (FDS). Processes 2025, 13, 2435. https://doi.org/10.3390/pr13082435
Dessì R, Fruhwirt D, Papurello D. A Study on Large Electric Vehicle Fires in a Tunnel: Use of a Fire Dynamics Simulator (FDS). Processes. 2025; 13(8):2435. https://doi.org/10.3390/pr13082435
Chicago/Turabian StyleDessì, Roberto, Daniel Fruhwirt, and Davide Papurello. 2025. "A Study on Large Electric Vehicle Fires in a Tunnel: Use of a Fire Dynamics Simulator (FDS)" Processes 13, no. 8: 2435. https://doi.org/10.3390/pr13082435
APA StyleDessì, R., Fruhwirt, D., & Papurello, D. (2025). A Study on Large Electric Vehicle Fires in a Tunnel: Use of a Fire Dynamics Simulator (FDS). Processes, 13(8), 2435. https://doi.org/10.3390/pr13082435