Article

Research on Automatic Detection Method of Coil in Unmanned Reservoir Area Based on LiDAR

1
Design and Research Institute Co., Ltd., University of Science and Technology Beijing, Beijing 100083, China
2
National Engineering Research Center of Flat Rolling Equipment, University of Science and Technology Beijing, Beijing 100083, China
3
Beijing Economic and Technological Development Zone, Beijing Polytechnic University, No. 9, Liangshuihe 1st Street, Beijing 100176, China
4
Xiangtan Hualing Yunchuang Digital Technology Co., Ltd., No. B0105013, Building A2, Yuetang International Trade City, Furong Road, Hetang Street, Yuetang District, Xiangtan 411100, China
*
Author to whom correspondence should be addressed.
Processes 2025, 13(8), 2432; https://doi.org/10.3390/pr13082432
Submission received: 2 June 2025 / Revised: 12 July 2025 / Accepted: 26 July 2025 / Published: 31 July 2025

Abstract

The detection of coils in reservoir areas is part of the environmental perception technology of unmanned cranes. In order to improve the perception ability of unmanned cranes to include environmental information in reservoir areas, a method of automatic detection of coils based on two-dimensional LiDAR dynamic scanning is proposed, which realizes the detection of the position and attitude of coils in reservoir areas. This algorithm realizes map reconstruction of 3D point cloud by fusing LiDAR point cloud data and the motion position information of intelligent cranes. Additionally, a processing method based on histogram statistical analysis and 3D normal curvature estimation is proposed to solve the problem of over-segmentation and under-segmentation in 3D point cloud segmentation. Finally, for segmented point cloud clusters, coil models are fitted by the RANSAC method to identify their position and attitude. The accuracy, recall, and F1 score of the detection model are all higher than 0.91, indicating that the model has a good recognition effect.

1. Introduction

Under the call of “intelligent manufacturing”, the Chinese steel industry is beginning to incorporate intelligence and automation, and, as important transportation equipment in intelligent reservoir areas, unmanned cranes need to have accurate environmental perception ability [1]. With the rapid development of LiDAR technology and in-depth study of LiDAR data processing, LiDAR systems capable of active high-precision point cloud acquisition have become important sensors for unmanned intelligent systems to perceive the environment. In general, 3D reconstruction based on 2D LiDAR mainly includes point cloud registration, calibration, data preprocessing, point cloud segmentation, and target recognition [2]. Regarding the aspect of point cloud registration, the commonly used SLAM algorithms for LiDAR are as follows: EKF-SLAM [3], Fast SLAM [4], Gmapping [5], Hector-Slam [6], Cartographer [7], and LOAM [8] and its improved algorithm [9]. Regarding point cloud segmentation, 3D point cloud segmentation is the basis of target recognition. Shuya Liu et al. proposed a RANSAC segmentation method based on the weight of the point cloud density to fit the section center of an equidistant tunnel and used the curve-fitting method based on least-squares optimization to obtain the measured curve of the tunnel [10]. According to the spatial distribution of steel coils, Wenyue Tan et al. restored the arc surface parameter equation for steel coils and obtained the spatial coordinates of the cylinder centers of steel coils according to the number of point cloud of vehicle-mounted steel coils scanned by LiDAR [11]. Baoqing Guo et al. proposed a region-growing segmentation algorithm based on the principle of normal consistency and used the viewpoint feature histogram (VFH) to distinguish the 3D point cloud features of different objects [12].
In the research on automatic detection of high-line coils in warehouse areas based on 2D LiDAR, although technologies such as point cloud stitching, calibration, preprocessing, segmentation, and recognition have been applied to a certain extent, there are still some research gaps: Existing methods have insufficient point cloud stitching accuracy and calibration robustness in complex warehouse environments (such as dense stacking of high-line coils, partial occlusion, lighting changes, and ground dust interference), which easily lead to cumulative errors. Regarding issues such as sparse point cloud and uneven noise distributions caused by the arc-shaped surfaces of high-line coils, there is a lack of specialized preprocessing strategies, making it difficult to balance denoising effects and feature preservation. Point cloud segmentation algorithms have a weak ability to distinguish boundaries between high-line coils and the surrounding environment (such as shelves and ground) and are prone to over-segmentation or under-segmentation, especially in irregular stacking scenarios. The target recognition stage mostly relies on single-feature matching, resulting in limited generalized recognition ability for high-line coils with different specifications and postures. Moreover, there is no end-to-end optimization scheme from point cloud processing to accurate target detection. These gaps make it difficult for existing technologies to meet the requirements of industrial applications in terms of detection efficiency and accuracy under complex working conditions in actual warehouse areas, highlighting an urgent need for further research breakthroughs.
In this experiment, the scanning plane of a 2D LiDAR is perpendicular to the horizontal plane, and the scanning plane of the LiDAR is moved by the movement of an unmanned crane. Then, combined with the point-cloud registration method of the LOAM series algorithm, a high-precision, 3D point cloud image is constructed with gray bus sensor information from the unmanned crane as an odometer. At the same time, VFH distribution statistics and three-dimensional point cloud curvature estimation are used to describe the characteristics of coil clusters, which solves the problem of under-segmentation and over-segmentation in the process of clustering. Finally, the cylinder model of the coil is fitted by the RANSAC method, and coil target recognition is realized.
The remainder of this paper is organized as follows: Section 2 presents a detailed literature review of research on point cloud processing; Section 3 introduces the methodology of coil target recognition in reservoir areas; in Section 4, the segmentation results of the experimental point cloud processing are analyzed in detail; and, finally, Section 5 provides the conclusions and outlines future work.

2. Related Work

2.1. Segmentation

The process of dividing a point cloud into clusters composed of similar objects is called clustering. The algorithms for clustering and segmentation of point-cloud often include region growth segmentation, DBSCAN clustering, k-means clustering, and so on [13]. Growth segmentation gradually incorporates points in the neighborhood that meet the criteria in the same region based on preset similarity criteria (such as normal vector angle, curvature, spatial distance, etc.), forming a continuous surface or object. However, the settings of similarity criteria (such as thresholds) in this method rely on experience, making parameter adjustment complex. Moreover, when processing a large-scale point cloud, it requires repeated retrieval of neighborhood points, resulting in high time costs. K-means clustering is a distance-based clustering method. By presetting the number of clusters K, it iteratively optimizes the cluster centers to minimize the sum of squared distances from points within a cluster to the center. Nevertheless, the method is not suitable for clusters with non-convex or irregular shapes (only capable of segmenting approximately spherical clusters) and is sensitive to noise and outliers (outliers can significantly affect the calculation of cluster centers). According to the research object and application scenario of the paper, it is more appropriate to select the density-based clustering method (DBSCAN clustering).
The DBSCAN clustering method based on spatial density of point cloud is adopted [14], which has the advantage of fast clustering speed and can effectively deal with spatial clustering of noise points and normal arbitrary shape. Based on the concepts of density reachability and density connection, the method defines the point cloud cluster as the set of maximum density connected objects based on density reachability; that is, a cluster is a nonempty subset of data object set, which satisfies the following conditions:
(1)
Connectivity: For any two points p, qC, C stands for class cluster. Let P and Q be connected with respect to the density of parameters ε and MinPts, and ε is the neighborhood radius, Minpts is the minimum number of objects in the neighborhood of ε when point p is the core object;
(2)
Maximality: For any two points p, q, if pC, and q is reachable from p with respect to the density of parameters ε and MinPts, then qC.

2.2. Feature Extraction

Through the segmentation and clustering of point cloud, the 3D point cloud is divided into different clusters. Through the subsequent point cloud feature extraction, the point cloud clustering is analyzed to identify different targets.
Point feature histogram (PFH), by analyzing the interaction between the normal direction of the target point and all adjacent points, attempts to capture the best normal change in the point cloud to describe the spatial characteristics of the sample, but its calculation speed is slow and the real-time performance is poor [15]. Fast point feature histogram (FPFH) reduces the computational complexity of PFH by simplifying the query process of PFH neighborhood points [16], but still retains most of the recognition features of PFH. Viewpoint feature histogram (VFH) is derived from FPFH [17], which adds viewpoint variables while maintaining feature scale invariance to distinguish different poses. By calculating the histogram between the view direction and each normal, the view related feature components are calculated, which means the view related high-dimensional components are added to the FPFH. For the same 3D point cloud, there is only one VFH descriptor, and the number of PFH and FPFH descriptors is the same as the number of input points, which means VFH is more suitable for global description and FPFH is more suitable for local description.
Therefore, the VFH feature vectors are used to describe different point cloud clusters and to analyze the similarity of VFH feature vectors of the same kind of objects and the difference in VFH feature vectors of different kinds of objects, which can be used as the basis for subsequent recognition and classification. VFH includes an extended FPFH component to describe the surface shape and a view direction dependent component. For the calculation of the extended FPFH component, P is a cluster of point cloud with the centroid of C, the angle component between the normal vector n j and the vector p j c of the target point p j is described by Equation (1), and the distribution of the three angle components of p j and other points in the neighborhood are calculated, forming extended FPFH component calculation. For the calculation of the view direction correlation component, the point pair composed of the current view and other points are taken as the calculation units. The centroid C of point cloud P and viewpoint v p form a vector v p c , while the angle between the unit normal vector n j and the unit normal vector v p c estimated by all the points p j and its neighboring points are calculated as the statistical component of histogram view correlation.
α = a r c c o s   ( v · n j ) φ = a r c c o s   ( v · p j c p j c ) θ = a r c t a n   ( w · n j , u · n j )

3. Methodology

Assume that the scanning plane of the LiDAR is perpendicular to the ground. In the paper, firstly, the two-dimensional point cloud is spliced into three-dimensional point cloud through the coordinate interpolation of the unmanned crane; then, the three-dimensional point cloud is transformed into the world coordinate system o w x w y w z w through the calibration of external reference, the point cloud data is preprocessed to divide the region of interest and eliminate outliers. The point cloud is then segmented by DBSCAN clustering, VFH statistical histogram analysis, and FPFH statistical histogram analysis. Finally, RANSAC cylinder model fitting is carried out for the segmented coils point cloud, as is shown in Figure 1.

3.1. Three-Dimensional Point Cloud Construction

At present, the mainstream 3D laser point cloud images are established by LOAM and its improved method. By selecting and matching edge feature points and plane feature points, the point to line and point to plane nonlinear least squares problems between different frames are constructed to realize point cloud registration and loop detection. In the paper, a gray bus coordinate interpolation method is used to improve the accuracy of LiDAR detection and the polar coordinate data in the LiDAR coordinate system o l x l y l z l is converted into rectangular coordinate system by using Equation (2), where r is the depth information of the target point, θ is the scanning angle information of the target point, x w k and x w k + 1 are the gray bus value of the two adjacent moments of the point, and N is the total number of laser points when the unmanned crane moves from x w k to x w k + 1 .
x l = r c o s θ y l = r s i n θ z l = x w k + 1 x w k i N + x w k

3.2. Preprocessing of Point Cloud Data

Due to the influence of equipment accuracy, operator experience, object surface laser reflectivity, and other factors, some noise points often appear in point cloud data. Therefore, as the first step of point cloud processing, point cloud filtering can remove outliers, compress data, smooth data, etc. The commonly used point cloud filtering algorithms include direct filtering, voxel filtering, statistical filtering, conditional filtering, and radius filtering [18]. The direct filtering is used to set a fixed coordinate axis to filter the range, leaving the point cloud in the range; the voxel filtering uses the bounding box to voxel the point cloud, so as to realize the downsampling without destroying the geometric structure of the point cloud itself. Statistical filtering is used to calculate the average distance d w k between the target point and its adjacent k points, and it is considered that the distance between different points accords with Gaussian distribution by counting the distance mean μ and variance σ of global points and removing the point cloud with low distribution probability, as shown in Formula (3). Because conditional filtering and radius filtering often need to set fixed filtering conditions, the robustness is often poor. In the paper, after the region of interest is selected by direct filtering, voxel filtering is used to compress smooth data, and finally statistical filter is used to remove outliers. Figure 2a shows the 3D point cloud containing noise points before filtering, and Figure 2b shows the effect diagram after filtering.
p d w k < 1 μ 3 σ μ + 3 σ 1 σ 2 π · e 1 2 ( d w k μ σ ) 2 d x

3.3. External Parameter Calibration of LiDAR

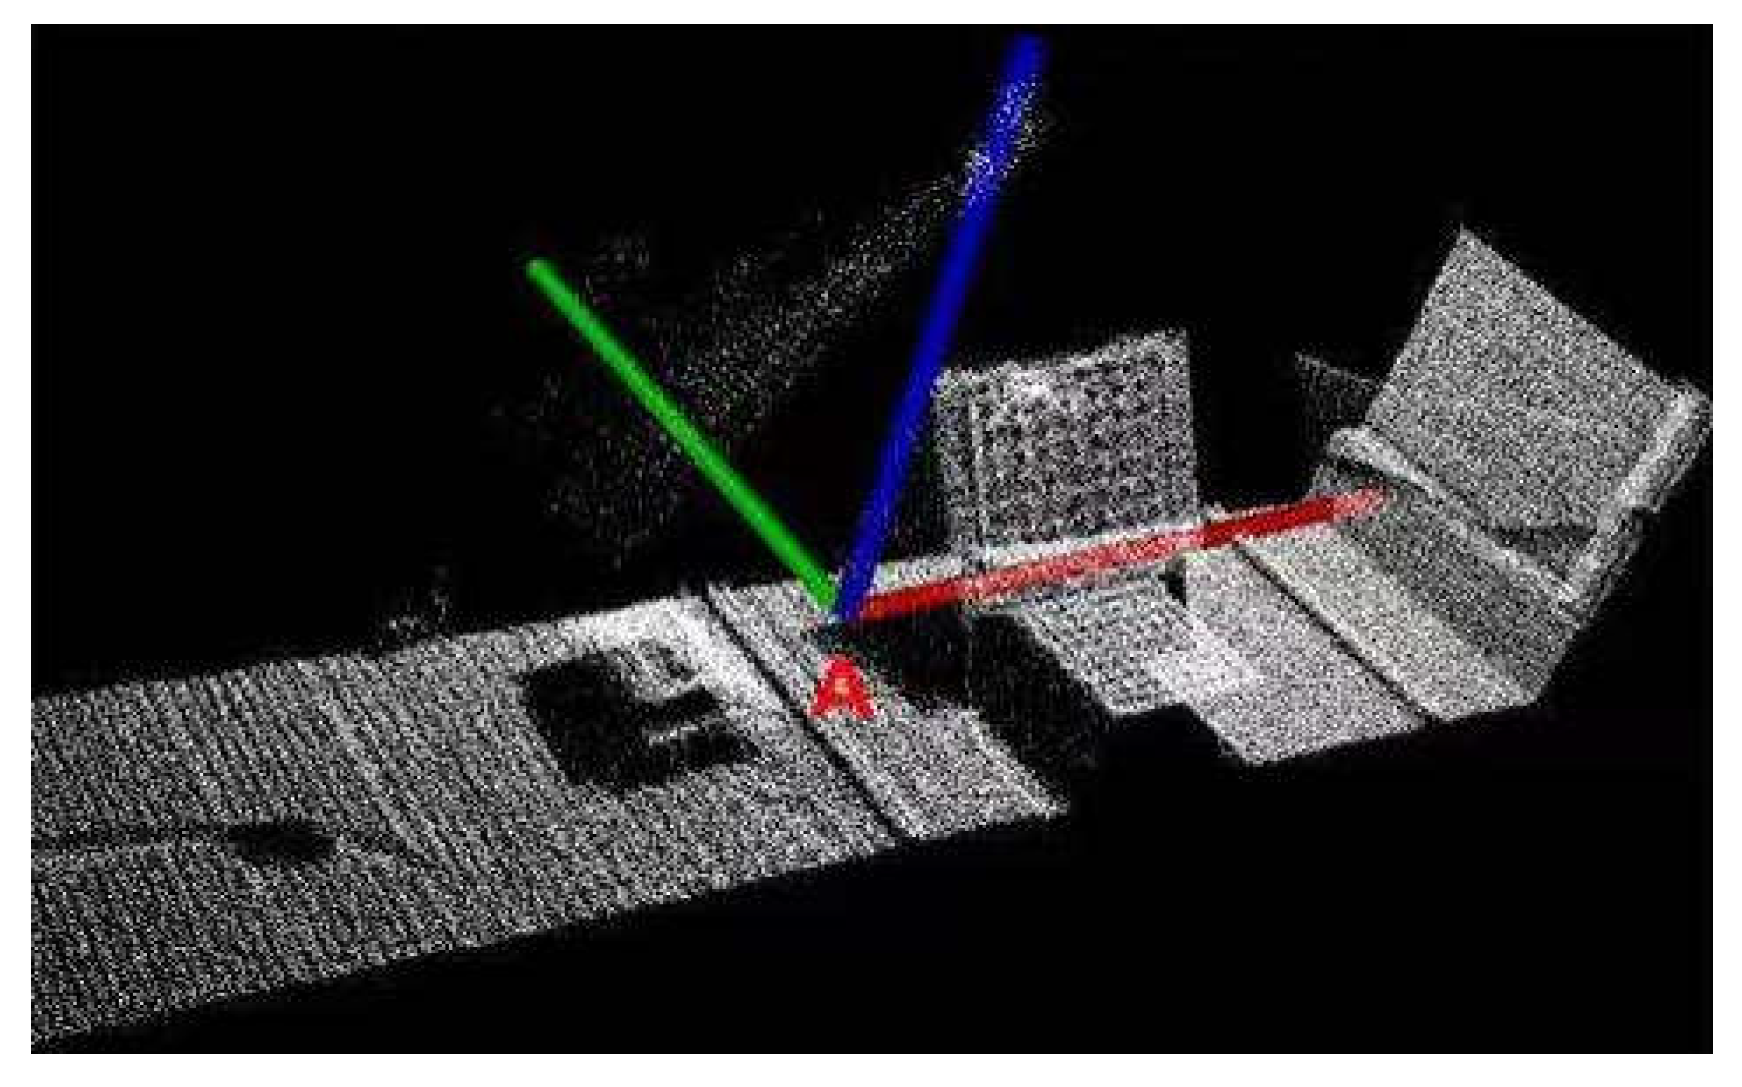
In the experiment, the calibration plate is placed on the ground obliquely, and the projection of the normal vector of the plane of the calibration plate on the horizontal plane is parallel to x w direction. After the LiDAR dynamically scans the calibration plate and its surrounding environment with the unmanned crane, a three-dimensional point cloud is generated according to Equation (2). After a series of preprocessing for the LiDAR point cloud, the ground point cloud is selected, and the ground plane equation and calibration plate equation are obtained by fitting the plane model with the RANSAC method. The transformation matrix T 1 and T 2 are obtained to transform the LiDAR coordinate system o l x l y l z l to the world coordinate system o w x w y w z w , so that the 3D point cloud can be generated from 2D LiDAR data in the case of dynamic scanning, according to Equations (4) and (5). As shown in Figure 2, the 3D point cloud map is generated when the LiDAR dynamically scans the reservoir area with the unmanned crane.
x 1 y 1 z 1 1 = T 1 x l y l z l 1 = 1 0 0 c o s θ x 0 0 s i n θ x 0 0 s i n θ x 0 0 c o s θ x 0 0 1 c o s θ y 0 0 1 s i n θ y 0 0 0 s i n θ y 0 0 0 c o s θ y 0 0 1 1 0 0 1 0 0 0 0 0 0 0 0 1 t z 0 1 x l y l z l 1
x w y w z w 1 = T 2 x 1 y 1 z 1 1 = c o s θ z s i n θ z s i n θ z c o s θ z 0 0 0 0 0 0 0 0 1 0 0 1 1 0 0 1 0 t x 0 t y 0 0 0 0 1 0 0 1 x 1 y 1 z 1 1
In order to reduce the calibration error, the plane equation of the calibration plate is iteratively calculated. On the basis of Equation (5), the ground plane equation is continued to be fitted and the transformation matrix T 2 is calculated. On the basis of T 2 , the left multiplication transformation matrix T 2 is continued. The above process is iteratively repeated until the angle θ x t 2 between the normal direction and x w axis direction of the plane equation of the calibration plate is less than the threshold e t 2 , which is shown in Equation (6).
T 2 = T 2 · T 2 θ x t 2 = a r c c o s   ( A b A b 2 + B b 2 + C b 2 )

3.4. Ground Filtering

In the generated 3D point cloud map, because of the huge number of ground points, the calculation efficiency will be reduced. At the same time, because of the adhesion between ground objects and ground point cloud, the accuracy of target classification and recognition will be reduced. Therefore, extracting and filtering ground points can improve the calculation speed and reduce the amount of calculation, and improve the efficiency and accuracy of the Method [19], as shown in Figure 3; Figure 3a,b are the 3D point cloud before and after ground filtering.

3.5. Segment

When clustering point cloud data, over-segmentation or under-segmentation is often caused by the selection of clustering methods and thresholds. The clustering and segmentation methods of a point cloud usually include region growth segmentation, DBSCAN clustering, k-means clustering, etc. Due to the irregular geometry of the coils and the change in the normal direction, the region growth method based on the normal often suffers from over-segmentation [20]. After adopting the DBSCAN clustering method and debugging threshold, the clustering result of point cloud is shown in Figure 4, and the number of points in each cluster is shown in Table 1.

3.5.1. VFH Feature Extraction

The extended FPFH component and view direction component are arranged as VFH statistical variables. The curves on the abscissa [1, 45], [46, 90], and [91, 135] are the angle histograms of α, φ, and θ of the extended FPFH component, respectively; the curves on the abscissa [136, 315] correspond to the view direction component histograms.
Because the abscissa [1, 45] of the VFH corresponds to the change in the normal vector of the first dimension target points and the surrounding points, the pedestrian point cloud is similar to a plane with smaller curvature, so the change in the normal vector of the pedestrian point cloud in the first dimension is smaller, and the distribution of the VFH of the pedestrian point cloud in the interval [1, 45] is more concentrated, so that the maximum value is larger. And the curvature of coils point cloud changes greatly, so the coils point cloud is more stable, and the normal vector of the cloud in the first dimension changes greatly, which means the corresponding VFH distribution is relatively scattered in the [1, 45] interval, and the maximum value is small.
Through the analysis and processing of the above VFH feature histogram, the class clusters of different objects are extracted [21]. For different kinds of object clusters, the FPFH component can be used for differentiation, and for the same kind of object clusters, a visual angle component can be utilized to achieve distinction.

3.5.2. Segmentation of Point Cloud with Multiple Coils

For multiple coils point cloud clusters, before fitting the single coil point cloud, we need to identify their adhesion and divide the multiple coils point cloud clusters into several single coil clusters.
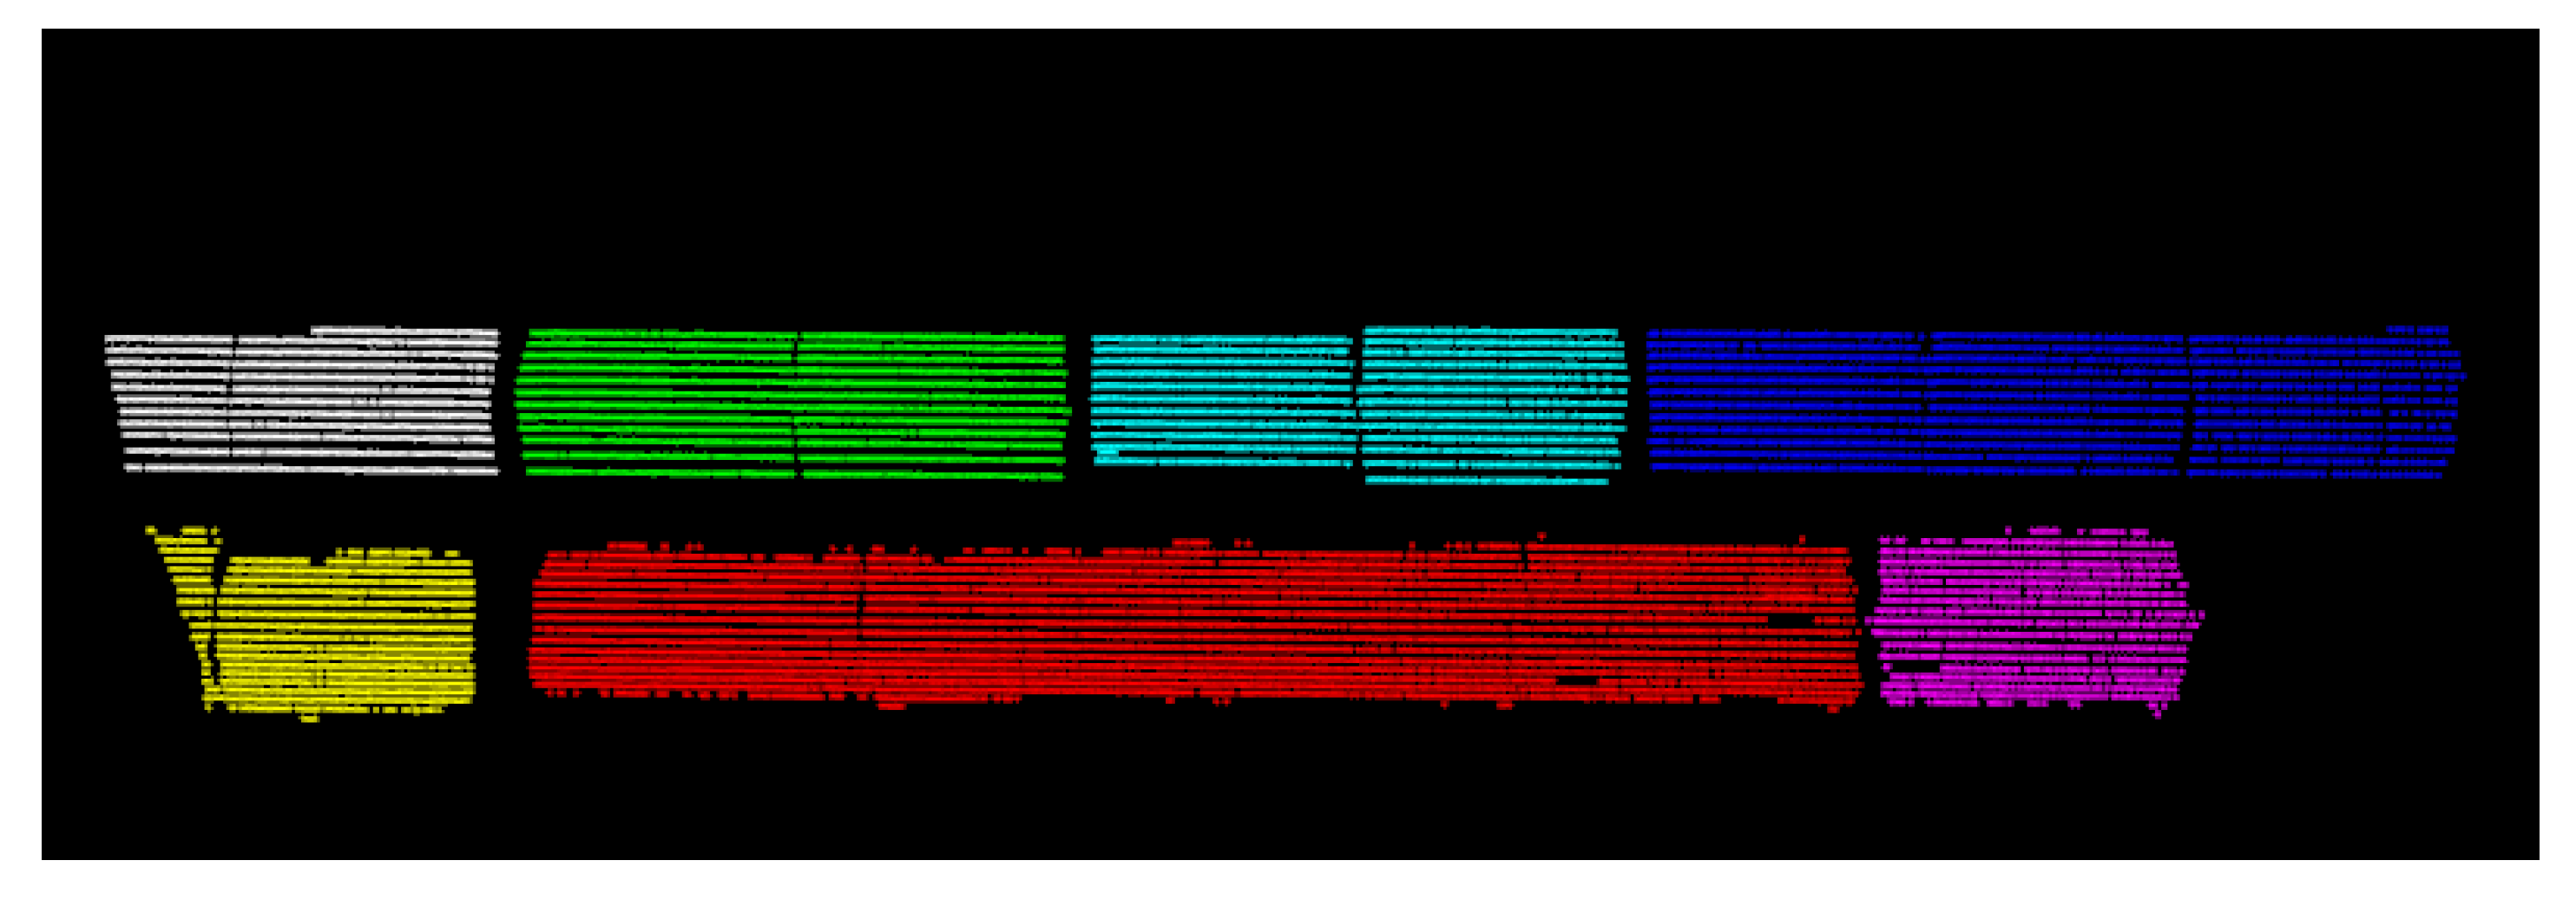
For the data detected from the coils placed in the reservoir area, the key point is to separate the point cloud of the coils placed compactly; as shown in Figure 5, different point cloud clusters are represented by different colors. The scattered coils point cloud clusters can be easily separated, and the coils placed compactly will seriously interfere with the subsequent coils model fitting, resulting in wrong coil position and shape measurement results.
We focus on the analysis of the local geometric features of the point cloud of the coils’ adhesion. For the extraction of local geometric features, there are many methods, such as the analysis method based on PFH and FPFH, Harris corner detection, key point detection based on voxel filtering and SIFT, SURF, ISS, and so on. Among them, the Harris corner detection method needs to estimate the normal of each point and calculate the covariance matrix, so the whole process is time-consuming [22]; the key point detection method based on voxel filtering is too direct and not representative; and the key point detection method based on SIFT [23], SURF [24], ISS, and other methods will fluctuate for the irregular coils, resulting in the instability of the results. The PFH method is more comprehensive for the description of local point cloud. However, because each point needs to query all its neighborhood points and calculate the histogram, the computational complexity is O(k) under the condition of k neighborhood, which will greatly reduce the computational efficiency of the algorithm. Therefore, FPFH with higher computational speed is commonly used as the local description method of point cloud.
FPFH describes the change in the normal of -e point cloud neighborhood [25]. We find that the curvature changes in the coils at the adhesion point are obviously larger. Because φ describes the angle change in normal of the point cloud neighborhood and the neighborhood points, we regard a small neighborhood of the point cloud as a surface to estimate the normal. Therefore, the change of the value of φ at the center of the line coil is smaller and the corresponding partition in the interval is smaller, while the distribution is more concentrated and the maximum value is larger. However, the change of φ value at the coil adhesion is larger, the distribution in the corresponding interval is more dispersed, and the maximum value is smaller.
Because of the instability of the coil point cloud, we need to further segment the point cloud on the basis of FPFH analysis, so we use curvature estimation to reflect the concave convex degree of the model surface. PCA analysis based on a covariance matrix can reflect the distribution of 3D point cloud [26] and then be used to calculate the normal vector corresponding to the 3D point cloud to estimate its curvature.
The curvature of the point cloud is analyzed based on the normal estimation to find the conglutination of the coils. For clusters less than 2 m in length, they directly enter the cylinder fitting stage; and for clusters with a length of more than 2 m, the split point is near the coils adhesion. For example, within the range of 1~2 m from the start point of the coil, PCA analysis was carried out for each point in this point cloud, with the 3D covariance matrix of the point cloud calculated near each point, as shown in Equation (7). K n u m is the number of neighborhood points when point p i estimates normal, p ¯ represents the three-dimensional centroid in the neighborhood, μ j is the j characteristic value of the covariance matrix, and v j is the j eigenvector. For the point cloud region, the eigen vector corresponding to the minimum eigenvalue calculated by covariance matrix is the estimated normal vector. When calculating the normal vector, the appropriate scale should be selected according to the use scene.
C = 1 K n u m i = 1 K n u m p i p ¯ · p i p ¯ T , C · v j = μ j · v j , j 0 ,   1 ,   2
For the three eigenvectors calculated from the covariance matrix of 3D point cloud, let μ 0 be its normal vector, μ 1 and μ 2 describe the distribution of data points in the neighborhood on the tangent plane, and the curvature H i of the point cloud model can be approximated by the curvature variation σ i , as shown in Equation (8).
σ i = μ 0 μ 0 + μ 1 + μ 2
By FPFH analysis, we can find the adhesion area of the coils, segment the adhesion area accurately by curvature analysis, and then divide the point cloud of multiple coils into some single coil point cloud.

3.5.3. Model Fitting

For 3D point cloud model fitting, a template matching method and RANSAC fitting method are often used [27]. The template matching method builds a database of feature description vectors of similar models, and uses KD-tree to speed up the query of the nearest model in the feature description vector space as the model fitting result. However, due to the instability of the surface shape of the coils, it is easier for the template matching method to make mistakes. At the same time, the template matching method needs a lot of data, which will reduce the efficiency of the algorithm; the fitting method based on RANSAC sets a model type in advance and iteratively selects the model parameters with the most points in the model until the end of the algorithm, when the upper limit of the number of iterations or the number of points threshold is qualified; this method does not need a lot of data as the database search range and the amount of calculation are smaller in the paper. The cylinder is used as the target model of coil fitting.

4. Results

4.1. Test System

At present, the cost of 3D LiDAR is high and its data volume is larger. By installing the 2D LiDAR under the cab of the unmanned crane and combining the gray bus information when the unmanned crane moves, the 3D point cloud map is constructed. The system hardware includes a 2D LiDAR, LiDAR mounting bracket, calibration board, industrial control computer, and unmanned crane, as shown in Figure 6.
The 2D LiDAR is installed on the LiDAR mounting bracket, and the LiDAR mounting bracket is fixed under the unmanned crane maintenance platform. There is a calibration board in the reservoir area. The dynamic scanning calibration board of single line LiDAR is calibrated to obtain the external parameters of LiDAR relative to the world coordinate system. The position and attitude transformation are carried out to convert the point cloud of the LiDAR coordinate system to the world coordinate system. The 3D point cloud of the reservoir area is generated by combining the gray bus information of the unmanned crane and pose transformation of the LiDAR, as shown in Figure 7.

4.2. Data Analysis

VFH analysis is carried out on the scanned coils point cloud and pedestrians point cloud. The cluster composed of the multiple coils point cloud and its VFH are shown in Figure 8a,b. The cluster composed of single coil point cloud and its VFH are shown in Figure 8c,d. The three pedestrian point cloud clusters with different poses and their VFH are shown in Figure 8e–j. Figure 8k shows all the point cloud clusters and their VFH, which are composed of different groups color representation.
It can be found that the peak value of components in the interval [1, 45] corresponding to the VFH of the coil cluster is below 30, and the peak value of components in the interval [1, 45] corresponding to the VFH of other clusters is above 30, which can be used as the basis for distinguishing the coil clusters from other clusters. At the same time, in the VFH corresponding to different pedestrian clusters, the FPFH component curve distribution is relatively similar, but the statistical components related to the viewpoint are quite different, which can be used to distinguish pedestrians with different positions and attitudes.
Due to the requirements of the on-site process flow of the unmanned crane, it is preferred if the top coils are hoisted and the outer diameter of the coils are within 1~1.3 m, so only point cloud clusters of the top coils are left through the elevation range. Starting from the height of 7 m, the window with the range of 0.5 m can slide to calculate the number of points contained in point cloud cluster under the current window. If it is larger than the threshold range of 300, the point cloud in the window is saved by direct filtering, and the point cloud of the top coils can be extracted. As shown in Figure 9, in the multi-layer coils point cloud in Figure 9a, the top coils point cloud cluster in Figure 9b is extracted, and the extracted point cloud only contains the upper part of the coils. For the case of coil cluster adhesion in the y w direction, DBSCAN clustering with a distance threshold of 0.1 m is adopted to distinguish the coils in different columns.
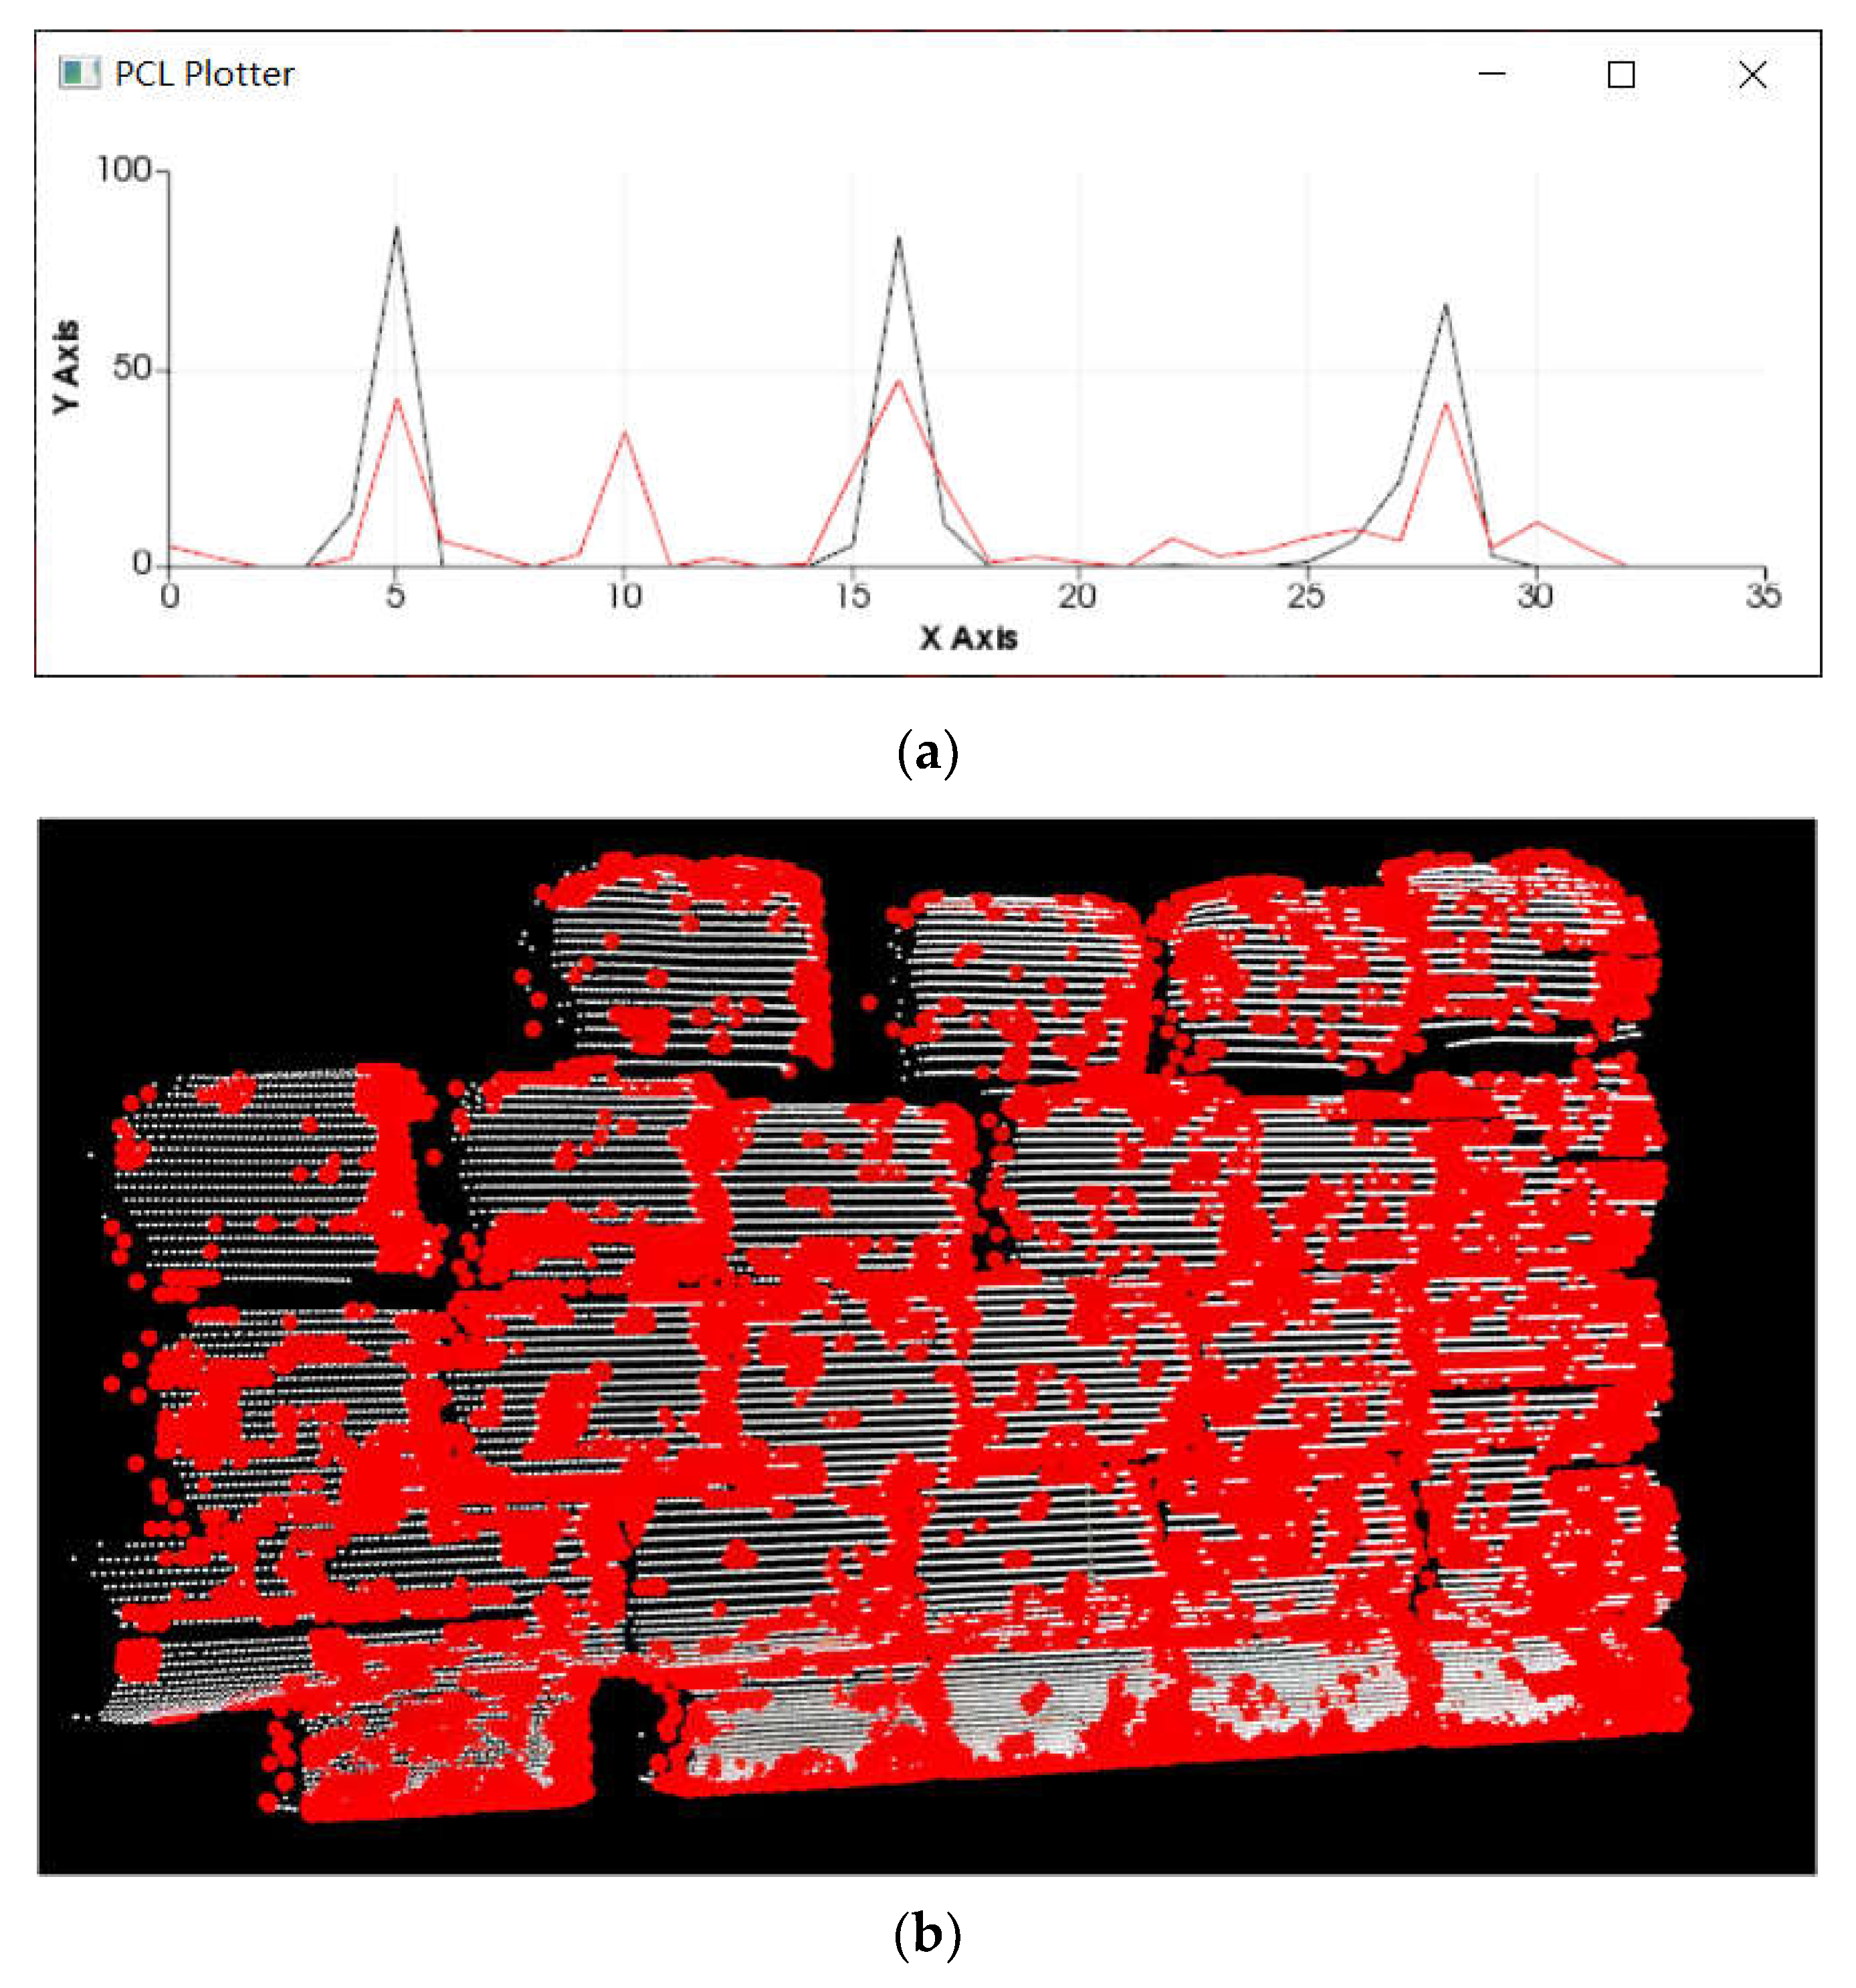
By analysing the FPFH at the edge of coils and the center of coils, it can be found that for [14, 18] the components in the interval, the peak value in this interval at the edge of the coils is less than 60, and the peak value in the section at the center of the coils is greater than 60. As shown in Figure 10, the red curve in Figure 10a is the FPFH at the edge of coils, the black curve is the FPFH at the center of coils, and Figure 10b shows that the points with peak values less than 60 in the interval of the FPFH located in [14, 18] are marked with red. It can be seen that the points on the edge of the coils have been marked.
In the segmentation based on FPFH, some points that do not belong to the edge of the coils are also marked, but each coil point cloud retains most of its own points, which means this error will not have a great impact on the subsequent recognition.
Curvature analysis is conducted near the adhesion of coils. By screening the minimum value of the top 50 points with the largest curvature, the cloud of adhesion points can be separated. The segmentation results are shown in Figure 11.

4.3. Classified Evaluation

The segmentation process of coils adhesion is similar to a binary classification process. In binary classification problems, TP stands for the number of positive classes predicted as positive classes; TN stands for the number of negative classes predicted as negative classes; FP stands for the number of negative classes predicted as positive classes; FN stands for the number of positive classes predicted as negative classes. We calculated the true positive (TP), true negative (TN), false positive (FP), and false negative (FN) indexes of the experimental results. On this basis, we calculated the F1 score of the classification results as the systematic evaluation index after weighting the accuracy rate and recall rate, as shown in Formula (9).
F β = ( 1 + β 2 ) P R β 2 p + r , F β [ 0 ,   1 ]
In Formula (9), P and R represent accuracy rate and recall rate, respectively, and β is the weight of adjusting P and R; when β = 1, the weights of P and R are equal, so the F1 score is often used as the comprehensive evaluation index of the system:
F 1 = 2 P R P + R
The evaluation of the identification results of coils is shown in Table 2.
Therefore, the following can be seen from the data in Table 2:
P = T P T P + F P
R = T P T P + F N
F 1 = 2 P R P + R
A high precision rate means that if something is identified as positive, it is definitely positive. A high recall rate means that all positive cases can be identified. F1 comprehensively considers both precision and recall. As can be seen from Equations (11)–(13), P = 0.913, R = 0.931, and F1 = 0.922, and from the calculation results, the classification performance of the model is good.

5. Conclusions

The paper proposes a coil target recognition algorithm based on 2D LiDAR dynamic scanning, which addresses the issues of point cloud stitching accuracy and calibration robustness in complex warehouse environments, such as dense stacking of coils, partial occlusion, illumination changes, and ground dust interference. Aiming at problems like uneven noise distribution on the arc surface of coils, a point cloud preprocessing strategy is adopted to balance denoising effects and feature preservation. In response to the weak ability to distinguish boundaries between high coils and the surrounding environment, optimization of point cloud segmentation algorithm is implemented to solve the problem of over-segmentation or under-segmentation that is prone to occur in scenarios with densely stacked coils. Ultimately, an end-to-end optimization scheme from point cloud processing to accurate target detection is formed.
The results show that the method can effectively generate 3D map of reservoir area and recognize coils with different positions and attitudes, and has high segmentation accuracy. The research methods and related scenarios in the paper can be well integrated into the management systems of steel production warehouses or logistics transfer warehouses, and have significant supporting effects and practical significance for realizing automatic inventory counting, automatic warehousing, and automatic loading. However, the proposed algorithm still needs to be improved. Firstly, the thresholds of DBSCAN clustering, VFH analysis, and curvature analysis need to be adjusted according to different application scenarios, and the adaptive threshold algorithm should be put forward for subsequent improvement. Finally, the interpolation method should be improved to improve the accuracy of 3D reconstruction.

Author Contributions

Conceptualization, Y.L. and M.L.; methodology, X.L. and X.Z.; investigation, X.Z. and J.Y.; data curation, X.Z. and D.X.; writing—original draft preparation, X.Z. and Y.L.; writing—review and editing, M.L. and X.L.; visualization, X.Z., X.L. and D.X.; project administration, Y.L. and M.L. All authors have read and agreed to the published version of the manuscript.

Funding

This work was supported in part by the National Key Research and Development Program of China under Grant 2024YFB3312100.

Data Availability Statement

The data presented in this study are available upon request from the corresponding author.

Conflicts of Interest

Yang Liu was employed by the Design and Research Institute Co., Ltd., and Junqi Yuan was employed by the Xiangtan Hualing Yunchuang Digital Technology Co., Ltd. The remaining authors declare that the research was conducted in the absence of any commercial or financial relationships that could be construed as a potential conflict of interest.

References

  1. Fu, M.X.; Wang, J.Q.; Wang, Q.; Sun, L.; Ma, Z.Z.; Zhang, C.Y.; Guan, W.Q.; Li, W. Material recognition and location system with cloud programmable logic controller based on deep learning in 5G environment. Chin. J. Eng. 2023, 45, 1666–1673. [Google Scholar] [CrossRef]
  2. Miao, R.K.; Liu, X.Y.; Pang, Y.J.; Lang, L.Y. Design of a mobile 3D imaging system based on 2D LIDAR and calibration with Levenberg–Marquardt optimization algorithm. Front. Phys. 2022, 10, 993297. [Google Scholar] [CrossRef]
  3. Riisgaard, S. SLAM for Dummies: A Tutorial Approach to Simultaneous Localization and Mapping; University of Bristol: Bristol, UK, 2012. [Google Scholar]
  4. Montemarlo, M. FastSLAM: A Factored Solution to the Simultaneous Localization and Mapping Problem. In Proceedings of the Theaaai National Conference on Artificial Intelligence, American Association for Artificial Intelligence, Edmonton, AB, Canada, 28 July–1 August 2002. [Google Scholar]
  5. Grisetti, G.; Stachniss, C.; Burgard, W. Improved Techniques for Grid Mapping with Rao-Blackwellized Particle Filters. IEEE Trans. Robot. 2007, 23, 34–46. [Google Scholar] [CrossRef]
  6. Kohlbrecher, S.; Stryk, O.V.; Meyer, J.; Klingauf, J. A flexible and scalable SLAM system with full 3D motion estimation. In Proceedings of the IEEE International Symposium on Safety, Kyoto, Japan, 1–5 November 2011. [Google Scholar]
  7. Olson, E.B. Real-time correlative scan matching. In Proceedings of the IEEE International Conference on Robotics & Automation, Kobe, Japan, 12–17 May 2009. [Google Scholar]
  8. Shan, T.; Englot, B. LeGO-LOAM: Lightweight and Ground-Optimized Lidar Odometry and Mapping on Variable Terrain. In Proceedings of the 2018 IEEE/RSJ International Conference on Intelligent Robots and Systems (IROS), Madrid, Spain, 1–5 October 2018. [Google Scholar]
  9. Cormen, T.H.; Leiserson, C.E.; Rivest, R.L.; Stein, C. Introduction to Algorithms, 3rd ed.; MIT Press: Cambridge, MA, USA, 2009. [Google Scholar]
  10. Liu, S.Y.; Xu, J.M.; Lv, D.N. Tunnel segmentation and deformation detection method based on measured point cloud data. Tunn. Constr. (Chin. Engl.) 2021, 41, 531–536. [Google Scholar]
  11. Tan, Y.Y. Design and Implementation of Coil Loading and Unloading Automatic Positioning System Based on Point Cloud Data. Master’s Thesis, Chongqing University, Chongqing, China, 2017. [Google Scholar]
  12. Guo, B.Q.; Yu, Z.J.; Zhang, N.; Zhu, L.Q.; Gao, C.G. 3D point cloud segmentation and classification recognition algorithm for railway scene. J. Instrum. 2017, 38, 2103–2111. [Google Scholar]
  13. Li, Y.; Wang, C. Artificial Intelligence Point Cloud Processing and Deep Learning Algorithms; Beihang University Press: Beijing, China, 2024. [Google Scholar]
  14. Hasan, M.; Hanawa, J.; Goto, R.; Fukuda, H.; Kuno, Y.; Kobayashi, Y. Person Tracking Using Ankle-Level LiDAR Based on Enhanced DBSCAN and OPTICS. IEEJ Trans. Electr. Electron. Eng. 2021, 16, 778–786. [Google Scholar] [CrossRef]
  15. Radu, B.; Blodow, N.; Márton, Z.-C.; Beetz, M. Aligning Point Cloud Views Using Persistent Feature Histograms. In Proceedings of the 2008 IEEE/RSJ International Conference on Intelligent Robots and Systems (IROS), Nice, France, 22–26 September 2008. [Google Scholar]
  16. Lv, W.H.; Guo, H.; Rao, Q.; Hou, Z.; Li, S.; Qiu, S.; Fan, X.; Wang, H. Body Dimension Measurements of Qinchuan Cattle with Transfer Learning from LiDAR Sensing. Sensors 2019, 19, 5046. [Google Scholar] [CrossRef] [PubMed]
  17. Chen, Z.H.; Pan, B.P. Research on Key Technology of Water Robot Avoiding Collision Based on Improved VFH Algorithm. J. Phys. Conf. Ser. 2021, 1820, 012064. [Google Scholar] [CrossRef]
  18. Han, X.F.; Jin, J.S.; Wang, M.J.; Jiang, W.; Gao, L.; Xiao, L. A review of algorithms for filtering the 3D point cloud. Signal Process. Image Commun. 2017, 57, 103–112. [Google Scholar] [CrossRef]
  19. Yadav, M.; Khan, P.; Singh, A.K.; Lohani, B. An automatic hybrid method for ground filtering in mobile laser scanning data of various types of roadway environments. Autom. Constr. 2021, 126, 103681. [Google Scholar] [CrossRef]
  20. Wei, Z.Y.; Jiang, T.; Hu, Z.Y.; Zhao, T.C. Orbit environment identification based on orbit environment characteristics. J. Chang. Univ. Technol. (Nat. Sci. Ed.) 2020, 43, 66–71. [Google Scholar]
  21. Zhang, R.B.; Guo, Y.S.; Chen, Y.H.; Li, T.M.; Liu, X.G. Urban intersection target recognition technology based on roadside lidar. Sens. Microsyst. 2020, 39, 32–35. [Google Scholar]
  22. Wang, X.M.; Huang, W.; Zhang, B.X.; Wei, J.Z.; Zhang, X.X.; Lv, Q.F.; Jiang, H.B. Real Time Integral Time Estimation Method for Inter Frame Corner Matching. Infrared Laser Eng. 2021, 5, 20200492. [Google Scholar] [CrossRef]
  23. Zahra, H.; Hamed, A.; Azar, M. Image matching based on the adaptive redundant keypoint elimination method in the SIFT algorithm. Pattern Anal. Appl. 2021, 24, 669–683. [Google Scholar]
  24. Xu, Q.W.; Tang, Z.M.; Yao, Y.Y. Research on image mosaic based on improved surf algorithm. J. Nanjing Univ. Technol. 2021, 45, 171–178. [Google Scholar]
  25. Peng, W.; Wei, L.; Ming, Y. Point cloud registration algorithm based on the volume constraint. J. Intell. Fuzzy Syst. 2019, 38, 197–206. [Google Scholar] [CrossRef]
  26. Xu, Y.; Chi, Y.D.; Wu, B.Q.; Liu, A.Q.; Wang, J.Q. Research on face recognition technology based on PCA algorithm. Inf. Technol. Inf. 2021, 34–37. [Google Scholar] [CrossRef]
  27. Yi, Z.H.; Wang, H.; Duan, G.; Wang, Z. An Airborne LiDAR Building-Extraction Method Based on the Naive Bayes–RANSAC Method for Proportional Segmentation of Quantitative Features. J. Indian Soc. Remote Sens. 2020, 49, 393–404. [Google Scholar] [CrossRef]
Figure 1. Overall flow chart.
Processes 13 02432 g001
Figure 2. Statistical filtering result chart.
Processes 13 02432 g002
Figure 3. Pass through filtering.
Processes 13 02432 g003
Figure 4. DBSCAN segmentation(The green point cloud represents a coil, the red point cloud represents a stacked layer of coils, and the blue point cloud and green point cloud each represent a human).
Processes 13 02432 g004
Figure 5. Coils adhesion point cloud (Different colors refer to different point cloud clusters).
Processes 13 02432 g005
Figure 6. System architecture diagram.
Processes 13 02432 g006
Figure 7. Coordinate transformation (The three lines of different colors in the figure represent the world coordinate system).
Processes 13 02432 g007
Figure 8. VFH of different point cloud clusters.
Processes 13 02432 g008
Figure 9. Extraction of top coils point cloud.
Processes 13 02432 g009
Figure 10. Segmentation result based on FPFH. (a) FPFH at the edge of the coil and the center of the coil (The red curve is the FPFH histogram at the edge of the line roll and the black curve is the FPFH histogram at the center of the line roll). (b) The points where the peak value of the FPFH within the interval [14, 18] is less than 60; this is marked in red.
Processes 13 02432 g010
Figure 11. Segmentation results of line roll adhesion (Each different color represents a segmented coil).
Processes 13 02432 g011
Table 1. The number of points in point cloud of different kinds of objects.
CloudHuman1Human2One CylinderCylinders
points
number
513795238667,984
Table 2. Segmentation result analysis.
Predicted as AdhesionForecast for CentralSum
Actually adhesion957102
Actually central5914
Sum10016116
Disclaimer/Publisher’s Note: The statements, opinions and data contained in all publications are solely those of the individual author(s) and contributor(s) and not of MDPI and/or the editor(s). MDPI and/or the editor(s) disclaim responsibility for any injury to people or property resulting from any ideas, methods, instructions or products referred to in the content.