Article

From Shale to Value: Dual Oxidative Route for Kukersite Conversion

Laboratory of Industrial Chemistry, Department of Chemistry and Biotechnology, Tallinn University of Technology, Ehitajate tee 5, 19086 Tallinn, Estonia
*
Author to whom correspondence should be addressed.
Processes 2025, 13(8), 2421; https://doi.org/10.3390/pr13082421
Submission received: 7 July 2025 / Revised: 26 July 2025 / Accepted: 28 July 2025 / Published: 30 July 2025

Abstract

The increasing need for sustainable valorization of fossil-based and waste-derived materials has gained interest in converting complex organic matrices such as kerogen into valuable chemicals. This study explores a two-step oxidative strategy to decompose and valorize kerogen-rich oil shale, aiming to develop a locally based source of aliphatic dicarboxylic acids (DCAs). The method combines air oxidation with subsequent nitric acid treatment to enable selective breakdown of the organic structure under milder conditions. Air oxidation was conducted at 165–175 °C using 1% KOH as an alkaline promoter and 40 bar oxygen pressure (or alternatively 185 °C at 30 bar), targeting 30–40% carbon conversion. The resulting material was then subjected to nitric acid oxidation using an 8% HNO3 solution. This approach yielded up to 23% DCAs, with pre-oxidation allowing a twofold reduction in acid dosage while maintaining efficiency. However, two-step oxidation was still accompanied by substantial degradation of the structure, resulting in elevated CO2 formation, highlighting the need to balance conversion and carbon retention. The process offers a possible route for transforming solid fossil residues into useful chemical precursors and supports the advancement of regionally sourced, sustainable DCA production from unconventional raw materials.

1. Introduction

Kerogen, the organic component of oil shale, represents a huge, underutilized hydrocarbon source comprising of complex organic structures. It is surprising that the direct chemical conversion of kerogen has not yet been implemented and has remained understudied, although its deposits can be found in more than 30 countries worldwide [1,2]. The traditional method of utilizing oil shale has been its combustion for energy production and its processing by pyrolysis at 400–500 °C to extract oil [3,4,5]. Shale oil production is currently limited to a small number of countries due to environmental deliberations. New alternative methods are needed to significantly shift the paradigm of oil shale utilization [6,7,8]. Kerogen has a high carbon content and a unique macromolecular structure that makes it a promising candidate for the production of valuable chemicals [9,10,11,12].
In order to produce value-added products from oil shale, the kerogen matrix must be cleaved, for instance, by introducing additional oxygen. So far, most studies on kerogen oxidation have focused on its structure determination [9,13,14,15,16], not chemical production. Oxidation of Estonian oil shale—kukersite—with nitric acid is one of the few approaches studied in the 1960s–1980s to obtain aliphatic dicarboxylic acids (DCAs) with the aim of their actual industrial production [17,18]. DCAs are essential base chemicals also in modern industry due to their versatile applications in polymers, lubricants, and biodegradable plastics [19,20,21]. Studies in the 1980s led to a pilot unit that used highly pre-concentrated oil shale (with a kerogen content of 90%) and included a cascade of four reactors operating at 140 °C [17]. The authors stated that the yield of DCAs was around 26% per organic matter. Another approach, initially studied in Russia, was air oxidation. A bubble column was used to cleave kerogen, but clogging issues arose, and the process yielded an isomerically rich mixture of dicarboxylic acids [22,23,24]. Table 1 provides a summary of the different oxidation methods that have been tested on kukersite oil shale.
The authors of this study investigated the possibility of using wet air oxidation (WAO) conditions for the production of DCAs from oil shale [27,28,29]. The results in batch systems demonstrated that the partial degradation of the kerogen skeleton occurs within one hour at temperatures ≥ 165 °C using oxygen pressures of ≥10 bar. It should be kept in mind that both factors, namely temperature and oxidant pressure, are critical for the effective destruction of kerogen. Below 165 °C, no significant changes occur, while at ≥250 °C, uncontrolled thermal decomposition is likely to begin [28,30]. The same applies to pressure: below 10 bar, oxygen insertion is unlikely, whereas above 40 bar, rapid and uncontrolled overoxidation of the organic matter occurs [29]. The amount of DCA never increased over 14% from initial kerogen, indicating a need for further optimization.
The authors also modeled kerogen oxidation at 175 °C under closed conditions [11] and proposed a reaction mechanism for the formation of dicarboxylic acids from kerogen [8]. The results obtained support the hypothesis that kerogen degradation begins with the oxidation of resorcinol units and the formation of CO2 and lower-chain monocarboxylic acids. However, due to the high structural complexity of kerogen, it is not possible to define a complete reaction mechanism; the model only allows us to suggest the most probable types of reactions involved. It was also observed that the dissolution of organic matter (previously referred to as soluble organic matter) almost doubles when the reactions are carried out with the addition of 1% KOH or K2CO3 [26]. The general parameters of the reactor (material, shape, and mixing) and the kerogen concentration also have a significant influence on the final yield of DCAs [31,32].
Previous studies [8,28,29] led to the hypothesis that applying WAO for the initial solubilization of kerogen, followed by nitric acid oxidation, could increase the overall yield of DCAs. This is because the free radical mechanism would be depleted, minimizing the destruction of already-formed DCAs. As a second step, nitric acid can oxidize the partially degraded kerogen fragments into smaller oxygenated compounds, including dicarboxylic acids, as demonstrated in [29]. Furthermore, the oxidation of partially degraded kerogen requires less nitric acid, resulting in milder oxidation conditions and reduced oxidant consumption. This approach is analogous to the process of adipic acid production, which involves a two-step oxidation procedure: initial air oxidation with low conversion (4–10% [33,34]), followed by a nitric acid oxidation with high conversion at 95% [35,36,37].
To the best of the authors’ knowledge, no previous studies have investigated the two-step oxidation of kukersite kerogen (Figure 1). Kukersite was selected due to its local significance, extensively studied structure, and its suitability as a model material for investigating the oxidative valorization of Type I and Type II oil shales. The aim of this study is to assess whether this approach could be useful in reducing the required quantity of HNO3 as an oxidant while maintaining an acceptable yield of DCA. Secondly, the study investigates whether such approach could simplify kerogen processing and lower key operational parameters and how it would affect undesired CO2 formation. First, the oxidation of kerogen was studied in aqueous media with a continuous oxygen supply. Then, in separate experiments, the partially solubilized kerogen was oxidized using dilute nitric acid solutions.

2. Materials and Methods

The initial raw material used in this study was native oil shale sourced from Kiviõli Keemiatööstus, Ida-Virumaa, Estonia. The native oil shale had an initial organic carbon content of 32.6% and was ground to below 100 µm prior to beneficiation (in Supporting Information (SI), Table S1 and Photo S1). For beneficiation, carbonate minerals—quantified as inorganic carbon (4.5%, in Supporting Information, Table S2)—were removed using a 30% formic acid solution in excess. The decarbonation process was carried out in batch with 12 kg of raw oil shale to ensure a consistent starting material for all experiments (details in Supporting Information). The chemical composition of the enriched oil shale, which was used in oxidation experiments, is presented in Table 2. Additional elemental composition data and their comparison with native oil shale are provided in the Supporting Information, in Tables S2 and S3.
After the oxidation, the dicarboxylic acid concentrations were quantified by using capillary electrophoresis—an Agilent 7100 CE System (Agilent Technologies, Waldbronn, Germany) equipped with DAD. Analytes were detected with indirect UV at 380 nm. Analysis was carried out using fused-silica capillaries (Agilent Technologies) with an I.D. of 50 μm, O.D. of 350 μm, and total length of 70 cm (effective length 61.5 cm). The BGE contained 15 mM maleic acid and 0.002% HDMB at pH 11 in Milli-Q water. The sample was injected hydrodynamically by applying a pressure of 50 mbar for 8 s. Separations were performed at 25 °C at a voltage of −25 kV. “C in volatiles” corresponds to sum of carbon calculated from the measured concentrations of acetic acid (AA) and formic acid (FA) before the evaporation (Equation (1)). As after the evaporation, their concentration was below detection; they are called volatiles.
Elemental analysis was performed using a Vario MACRO CHNS analyser (Elementar Analysensysteme GmbH, Hesse, Germany). The C, S, and N content in the residue (denoted as “C, S, or N in residual”) corresponds to the elemental analysis results obtained from the dried solid oxidation residue and is expressed as a fraction of the initial concentration of each element in the untreated material (Equation (2)). The C, S, and N content in dissolved organics (denoted as “C in diss. organics”) corresponds to the elemental analysis results of the dried mass, obtained by evaporating the aqueous phase to dryness until a constant mass is achieved, and is expressed as a fraction of the initial concentration of each element in the untreated material (Equation (3)).
C   i n   v o l a t i l e s = ( m A A   a n d   F A , ( g ) · C m o l a r   m a s s   r a t i o ,   ( % ) ) ( m f e e d   O S d · T O C f e e d   O S   t o t a l ,   ( % ) ) · 100 % ,
C   i n   r e s i d u a l = ( m r e s i d u a l   O S d , ( g ) · C r e s i d u a l   O S t o t a l ,   ( % ) ) ( m f e e d   O S d · T O C f e e d   O S   t o t a l ,   ( % ) ) · 100 % ,
C   i n   d i s s .   o r g a n i c s = ( m d i s s . o r g a n i c s d , ( g ) · C d i s s .   o r g a n i c s t o t a l ,   ( % ) ) ( m f e e d   O S d · T O C f e e d   O S t o t a l ,   ( % ) ) · 100 %
Oxidation with air (WAO): The experimental setup was similar to that described in previous work [29]. However, this time, the oxygen flow regime was used, thereby simulating a characteristic of continuous processing. The air flow rate was set to 1.5 L/min, controlled by a needle valve. The designated pressure in the reactor was maintained by a backpressure valve. In addition, the initial oil shale concentration in the solution was increased to 100 g/L to yield more dissolved organics-rich aqueous phase. The reactor was filled at a ratio of 2/5 or 1/2, where 20 g of enriched shale was added to 200 mL of distilled water.
Oxidation with nitric acid: The experiments were conducted in a modified Parr reactor equipped with an acid-resistant titanium lining and a bottom-mounted magnetic stirrer. A temperature of 120–140 °C was used [17,18], and the reaction time was limited to 30 min to prevent overoxidation (see Supporting Information section Step 2 for explanation). Time zero (t0) was recorded when the mixture reached desired temperature. Mixing speed was kept at 1000 rpm, and the nitric acid concentration was adjusted to 7.5–8.0%wt (unless stated otherwise). The amount of HNO3 was based on the molar ratio of nitric acid to organic carbon, kept below 1 to limit excess nitrate in solution and to facilitate subsequent separation of DCAs. In cases where the entire air oxidation mixture was used without pre-concentration, a sample was taken to assess oxidation depth and organic content before adding HNO3 and continuing the reaction.
All key experiments were performed in triplicate, and the results are presented as average values with a maximum deviation of ±5%. Reproducibility was ensured by homogenizing the raw material and using a 20 g sample size for each run.

3. Results and Discussion

3.1. Step 1—Partial Dissolution of Organic Matter by WAO

3.1.1. C, N, and S Balance in Solution Without Added Base

Initial experiments were carried out to evaluate the suitability of the oxygen flow regime and the potential reaction time. From the solution without a basic additive, three samples were taken at different time intervals at two different temperatures, and the resulting carbon balance is presented in Table 3 (see also Supporting Information Figure S1 and Table S4).
The data showed that in the absence of a base, increasing the reaction time significantly enhanced the formation of “C in volatiles” and “gaseous C” (as CO2), while the carbon content in the oxidation residue decreased. However, changes in the carbon content of dissolved organics were small, never exceeding 7%, indicating a rapid over-oxidation of dissolved material during the process. This result confirmed that kerogen oxidation in neutral or acidic environments (as the pH decreases during the experiment) is ineffective in increasing the dissolved organics content. It also became evident that a one-hour reaction time is too long, resulting in excessive CO2 (65–67% of initial carbon) emissions at both temperatures. Therefore, in subsequent experiments, the reaction time was limited to 30 min to prioritize dissolved organics formation over full kerogen conversion.
In addition to carbon transfer from solid phase to aqueous and gas phases, a similar migration behavior was observed for sulfur. Thus, after oxidation, 70–80% of the initial sulfur was detected in the dissolved phase (Table 4). It was observed that the transfer between solid and aqueous phase occurred relatively fast, with most of the sulfur dissolving already in the beginning of the process. The sulfur content in the solid residue decreased with increasing reaction time and higher oxidation temperatures.
A similar trend was observed for nitrogen (data in Supporting Information, Table S5), with 80–90% of the initial nitrogen detected in dissolved form after oxidation. However, no clear temperature- or time dependencies were observed, likely due to the low initial nitrogen content (0.06–0.18%), which made accurate quantification of nitrogen challenging. Nevertheless, these findings support the well-known concept that organic sulfur and nitrogen are transformed into sulfates and nitrates or ammonia in the WAO process [39,40].

3.1.2. C, N, S Balance in Basic Solution

Similar experiments were carried out in basic conditions, with 1% KOH in solution as a base (similarly as described in [28]). KOH concentration was kept low to allow subsequent acid treatment and to prevent carbonate formation from CO2 release during the reaction. The reaction time was set to 30 min. With these parameters fixed, the experiments aimed to determine the optimal temperature and oxygen pressure (Table 5).
The data revealed that in a basic solution, the amount of dissolved carbon formed from kerogen is significantly higher. It was also confirmed that an increase in pressure by 10 bar significantly increased the carbon conversion to the liquid phase and to CO2 (up to 44%). Similarly, a 10 °C decrease in temperature led to a notable reduction in organic carbon conversion, the “dissolved C”, and CO2 formation.
When comparing the results obtained in a neutral environment (Table 3, No. 2) with the experiment conducted in 1% KOH (Table 5, No. 3), the carbon levels in the gaseous phase were similar, indicating that the oxidation depth under given conditions was the same. Also, the differences in the carbon contents in the residual oil shale were low. The amount of “dissolved C”, however, was more than twice as high in a basic solution compared to a neutral solution. It was also confirmed that less than 5% of the dissolved carbon originated from carbonates, indicating minimal CO2 dissolution and confirming kerogen oxidation as the primary carbon source. In addition, the amount of “volatile C” (acetic acid and formic acid) decreased three times with KOH, indicating a smaller extent of overoxidation.
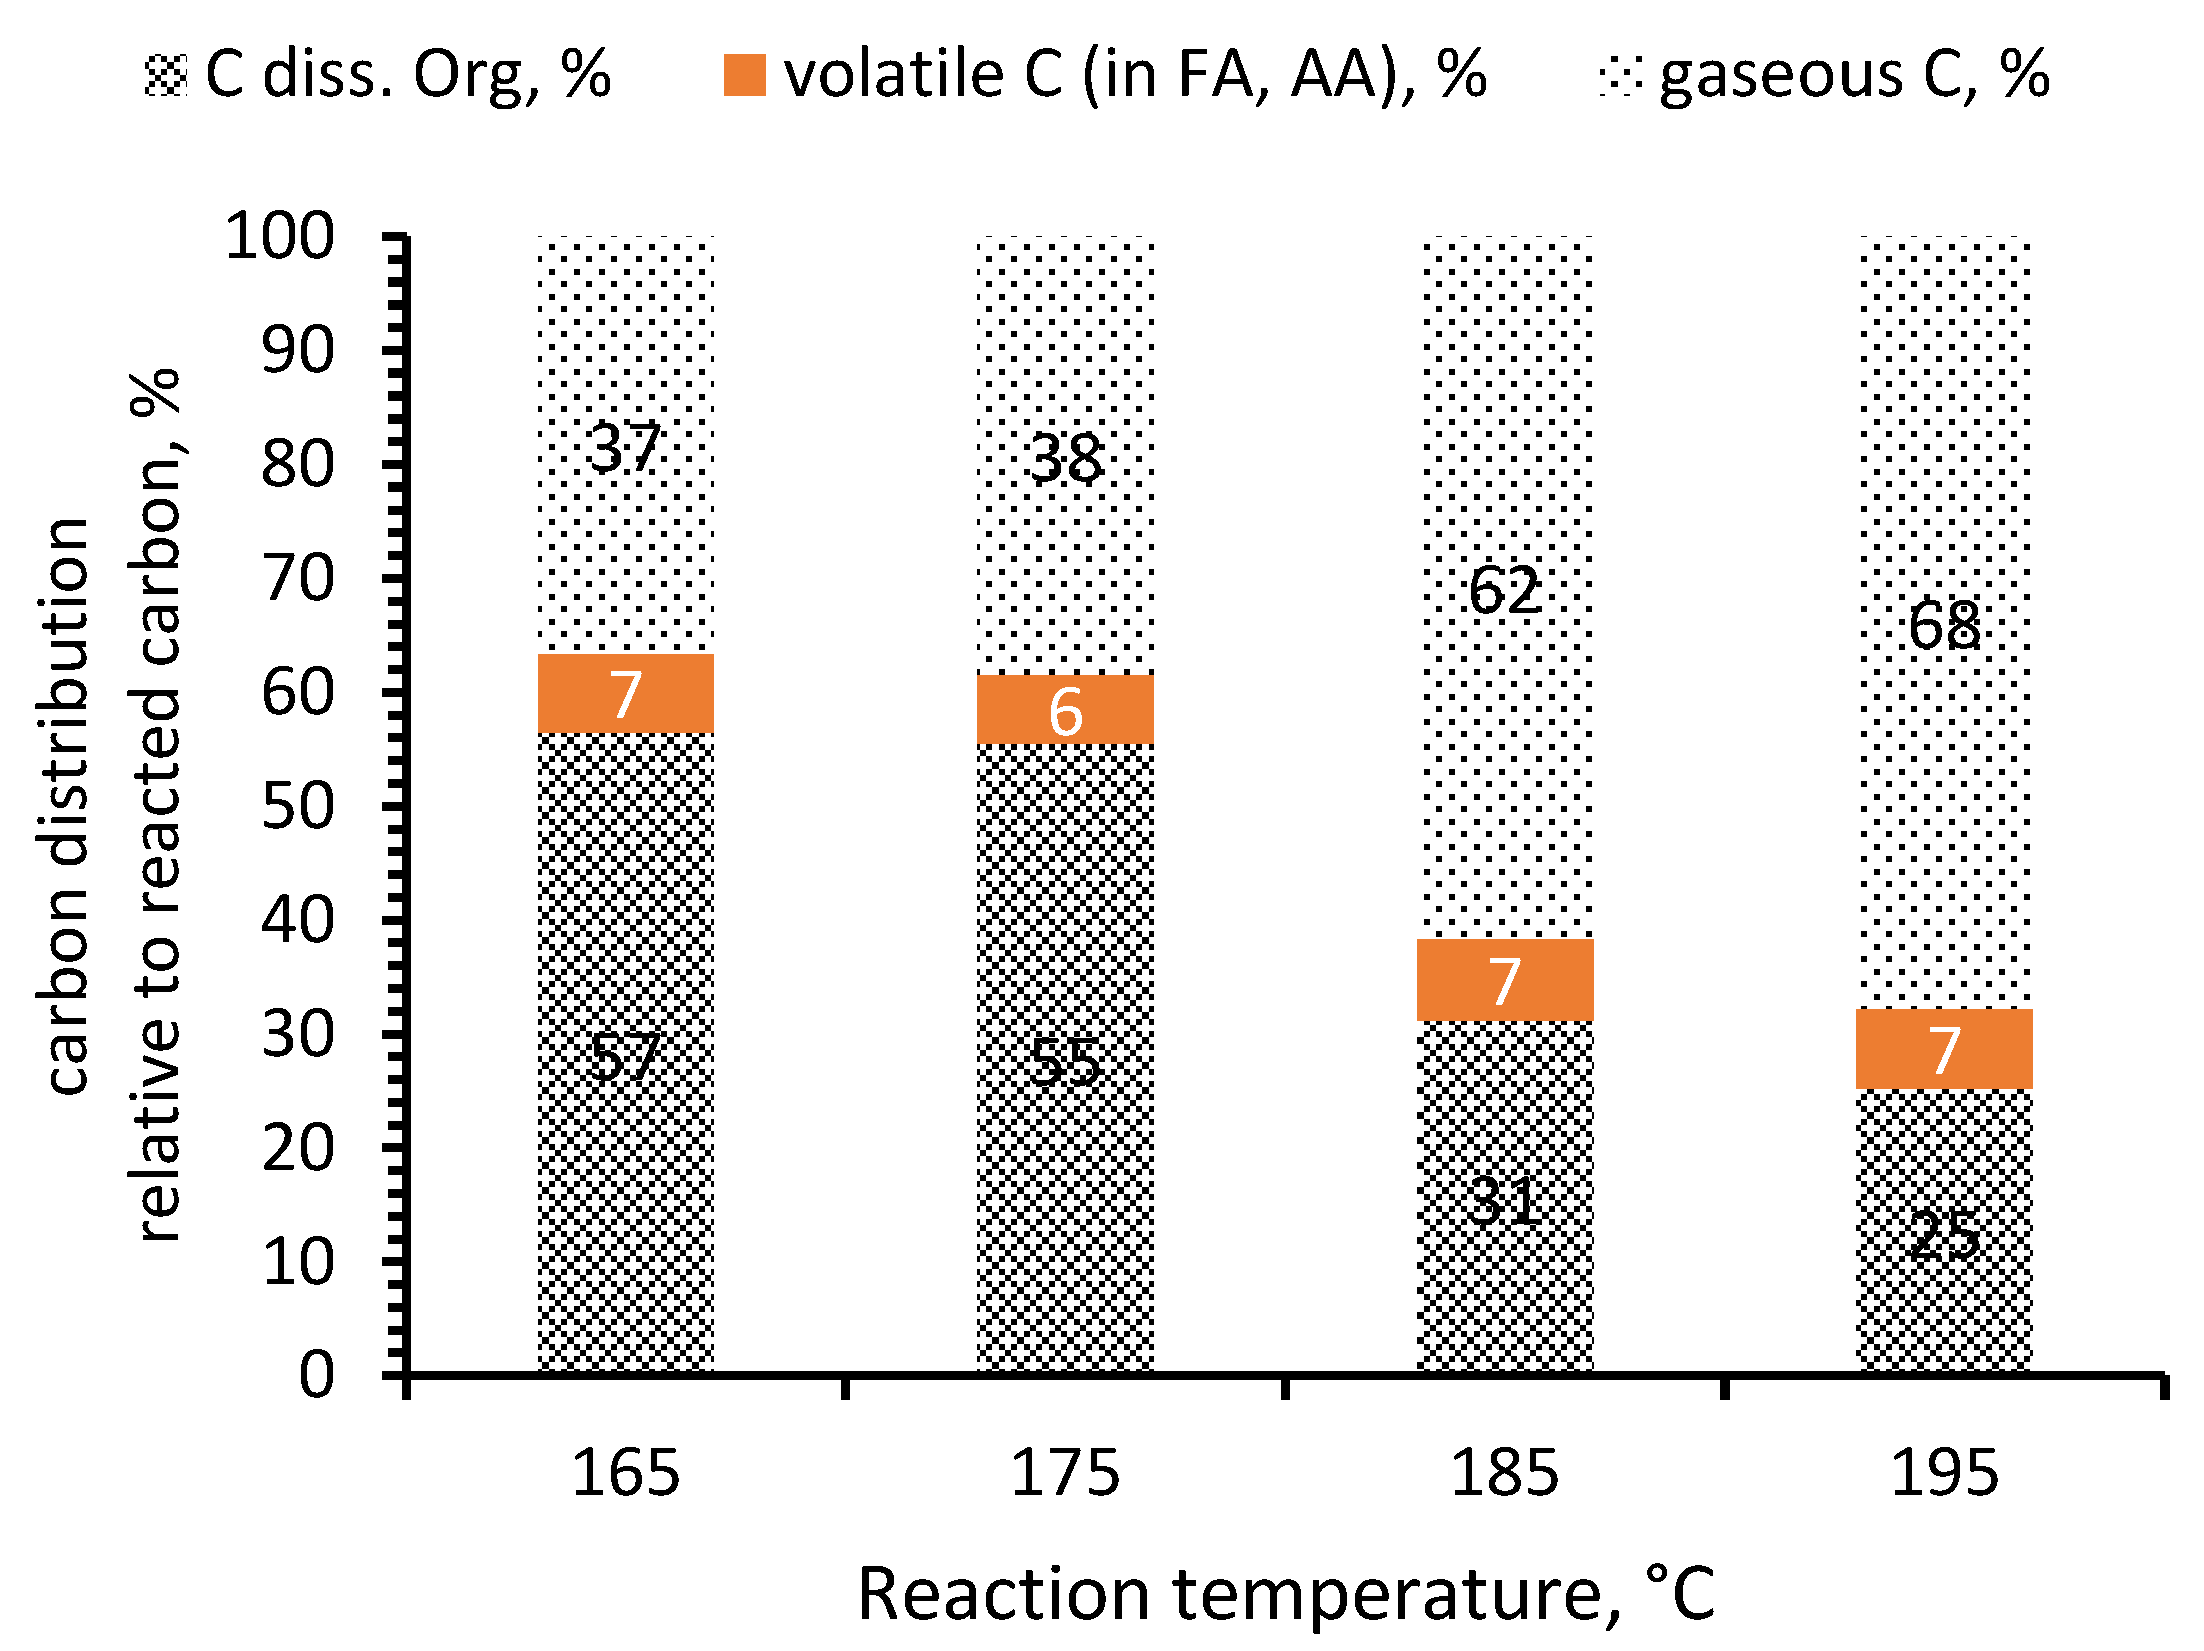
Additionally, Figure 2 shows the carbon distribution relative to reacted carbon, not total carbon input, to better reflect carbon distribution among different phases. It shows that at 185 °C, only about 1/3 of the reacted carbon was present in the aqueous phase, even though the highest amount of “dissolved C” per gram of oil shale was obtained under these conditions (Table 5, No. 3). At lower temperatures, nearly 2/3 of the reacted carbon was exhibited in the dissolved organic fraction. Similarly, the amount of CO2 (“gaseous C”) was much higher at higher temperatures (up to 68% per reacted carbon). The amount of “volatile C” remained constant across the tested temperature range. These results suggest that 165 °C or 175 °C favors more efficient carbon incorporation into organics. However, total carbon dissolution is lower at these temperatures, resulting in more diluted products compared to 185 °C. Moreover, a large amount of unreacted kerogen presents a challenge, as we showed previously [27], in that it reacts poorly in the second air oxidation step.
The results on the air oxidation of sulfur and nitrogen in basic media indicate that a substantial amount of both elements remained in the solid residue after oxidation (Table 6). This result is considerably different from that obtained in neutral conditions (Table 4). The increased sulfur and nitrogen content in the solid residue may indicate either suppressed oxidation in basic conditions or the formation of insoluble oxidation products. Sulfates were also quantified by CE in the aqueous phase (see Supporting Information, Figure S2 and Table S6), but nitrogen quantification was still limited by method sensitivity—any NO3 or NH3 formed was likely below detection limits. No gaseous nitrogen- or sulfur-containing byproducts were observed (see Supporting Information, Figure S3).

3.2. Step 2—Further Oxidation of Organic Matter by Nitric Acid

3.2.1. Oxidation of Dissolved Organics from WAO

Initial experiments focused on oxidizing only the “dissolved organic” fraction with nitric acid. While a homogeneous phase is preferred for simpler design and milder conditions, the fraction was too dilute for effective HNO3 oxidation—only 2.5 wt% dissolved material was obtained under optimal WAO conditions. Thus, the dissolved organics were separated from the solid phase by centrifugation and concentrated by evaporating water until the dry matter content reached 20–25%wt (further concentration was not possible due to partial precipitation of the organic material). In subsequent experiments, this concentrated solution of “dissolved organics” with 22–32%wt organic carbon in its dry matter was used (Table 7). To the solution of dissolved organics, 0.3–0.5 mol equivalents of HNO3 per dissolved carbon were added, resulting in a 12–13% HNO3 solution. The oxidation was performed at 120–140 °C for 0.5 h (see Supporting Information Figure S4 for explanation).
As shown in Table 7, oxidation more than doubled the resulting DCA concentration, with succinic acid showing the largest increase (from 2 to 6 mg/g or 10 to 19 mg/g). Glutaric acid yields also increased, while changes in other diacids were minor. The oxidation yield was also affected by temperature, remaining low at lower temperatures (~3% of the total raw material) even though the mixture contained sufficient amount of dissolved carbon material and oxidant. Higher temperature together with more extensive oxidation in Step 1 led to improved nitric acid oxidation, but the best result (15.4%) was still unsatisfactory, as similar yields are achievable with WAO alone [28]. The results indicate that further oxidation of dissolved organics with HNO3 can increase the DCA yield; however, the method has clear limitations: the need for pre-concentration before the second step, insufficient overall yield per unit of added kerogen, and the generation of large amounts of partially oxidized solid residue. Due to these limiting factors, this approach was considered impractical and was not pursued further.

3.2.2. Oxidation of Whole Reaction Mixture (Solid + Dissolved) from WAO

Table 8 presents the results of the experiments where the whole mixture, both the solid and dissolved fractions, was transferred to nitric acid oxidation without any pre-concentration.
As can be seen from Table 8, the total DCA yield after air oxidation ranged from a few percent up to 6%; therefore, the aqueous phase (dissolved organics) entering to the Step 2 was highly diluted. Subsequent oxidation with HNO3 consistently increased DCA yields regardless of its initial concentration. DCA yields reached up to 23% when referenced to initial carbon input before air oxidation and up to 28% when calculated based on carbon content after air oxidation. Short-chain DCAs (C4–C5) clearly dominated, as shown by the high proportion of succinic and glutaric acids relative to the total DCA content ((C4-C5)/DCA). The final product also contained 0.2–0.5%wt acetic acid, corresponding to 3–7% of the initial carbon (marked as AA/C). Formic acid was likely degraded to CO2 during the process, as evidenced by the disappearance of its peak in CE electropherogram (see Supporting Information, Figure S5). Depending on the acid dosage and carbon input, residual nitrate levels ranged between 1 and 4% (Table 8, c(HNO3)end), indicating that in some cases (e.g., sample H), the crude reaction mixture had a nearly balanced HNO3/DCA weight ratio (about 1.3), which is favorable for further downstream processing. Overall, these results suggest that O2 oxidation in Step 1 induced significant fragmentation of the kerogen structure, promoting further oxidation in Step 2, even though part of the organic matter remained water-insoluble after the first step.
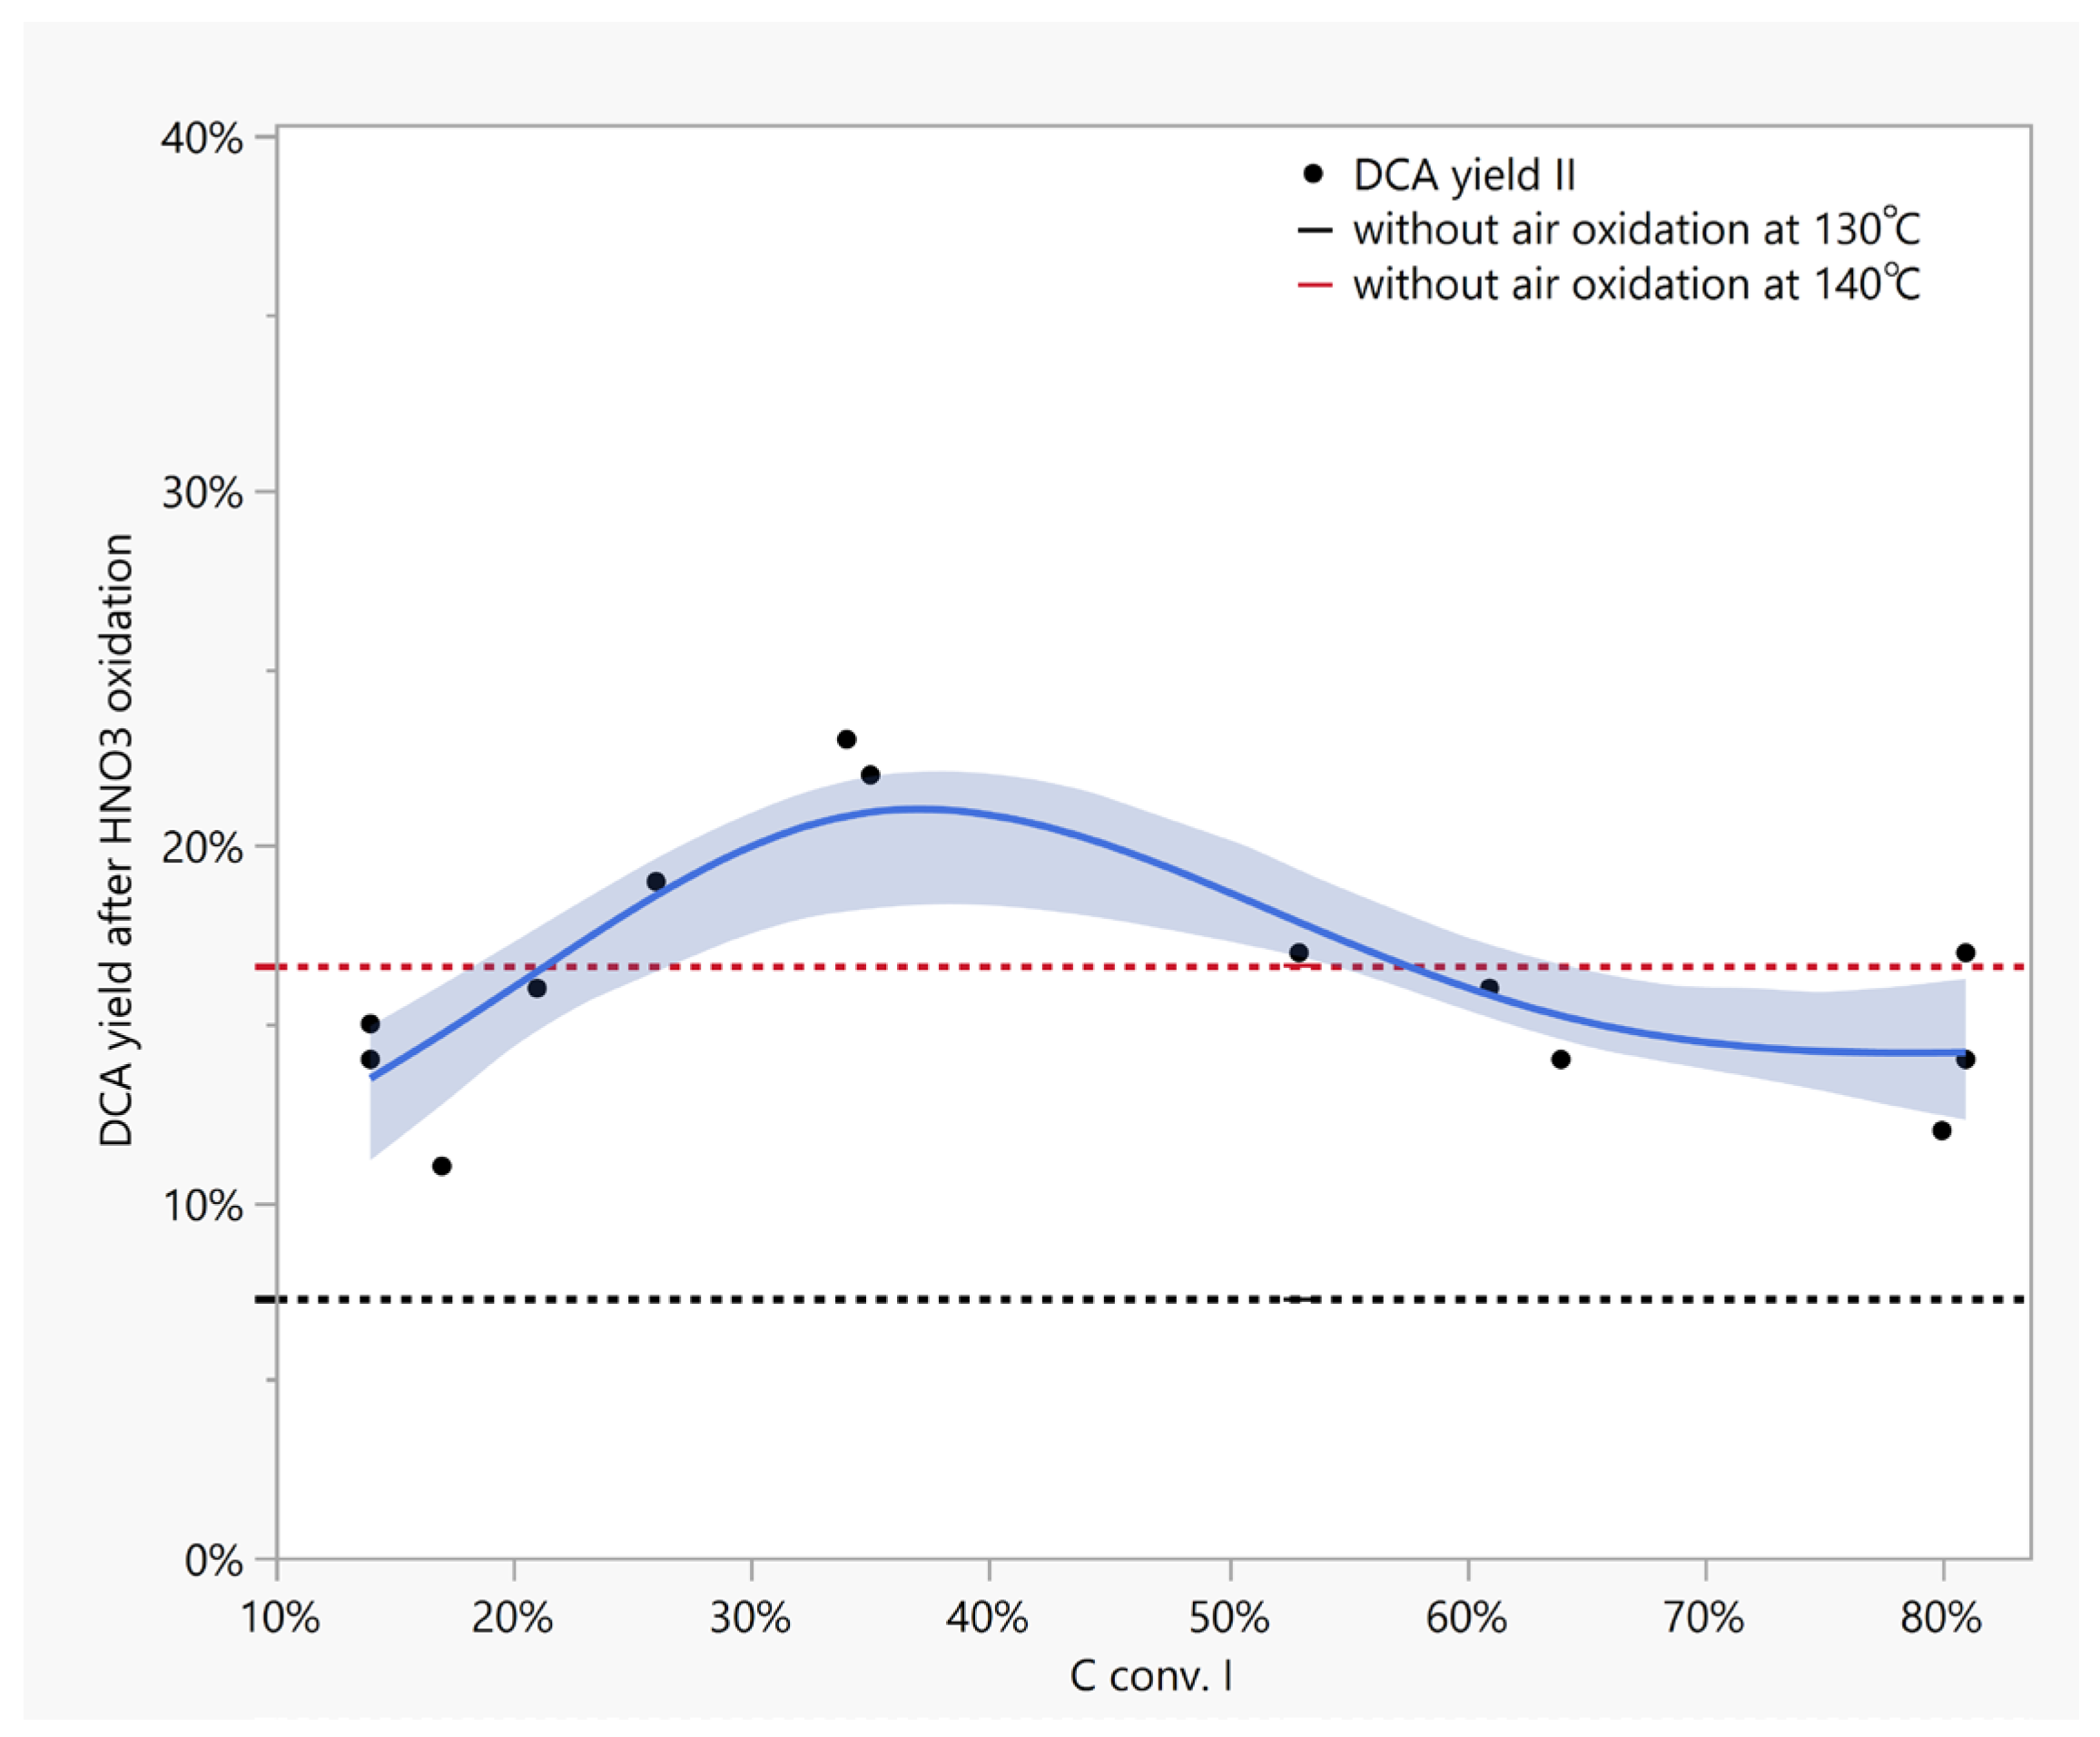
Next, the effect of oxidation depth (i.e., carbon conversion) of Step 1 on the DCA yield after Step 2 was studied at constant nitric acid concentration (Figure 3). Yields of 12–17% were observed at both high (>60%) and low (≤20%) carbon conversion levels. The highest DCA yields (19–23%) were achieved at an oxidation depth of 30–40%, indicating a correlation between DCA yield and the degree of air oxidation. Compared to the control experiment conducted without air oxidation and under identical HNO3 conditions (HNO3/C = 0.5 mol/mol, c(HNO3) = 7–8%wt), the DCA yields from the two-step approach were higher, confirming the benefit of the air oxidation step. The observed DCA yield can also be considered very similar to that reported in previous studies (~26%, [17]) that employed much more aggressive oxidation conditions (HNO3/C > 1 mol/mol, c(HNO3) ≥ 30%wt). This demonstrates that the two-step approach can significantly reduce the required amount of nitric acid, thereby also decreasing the formation of environmentally hazardous residues.
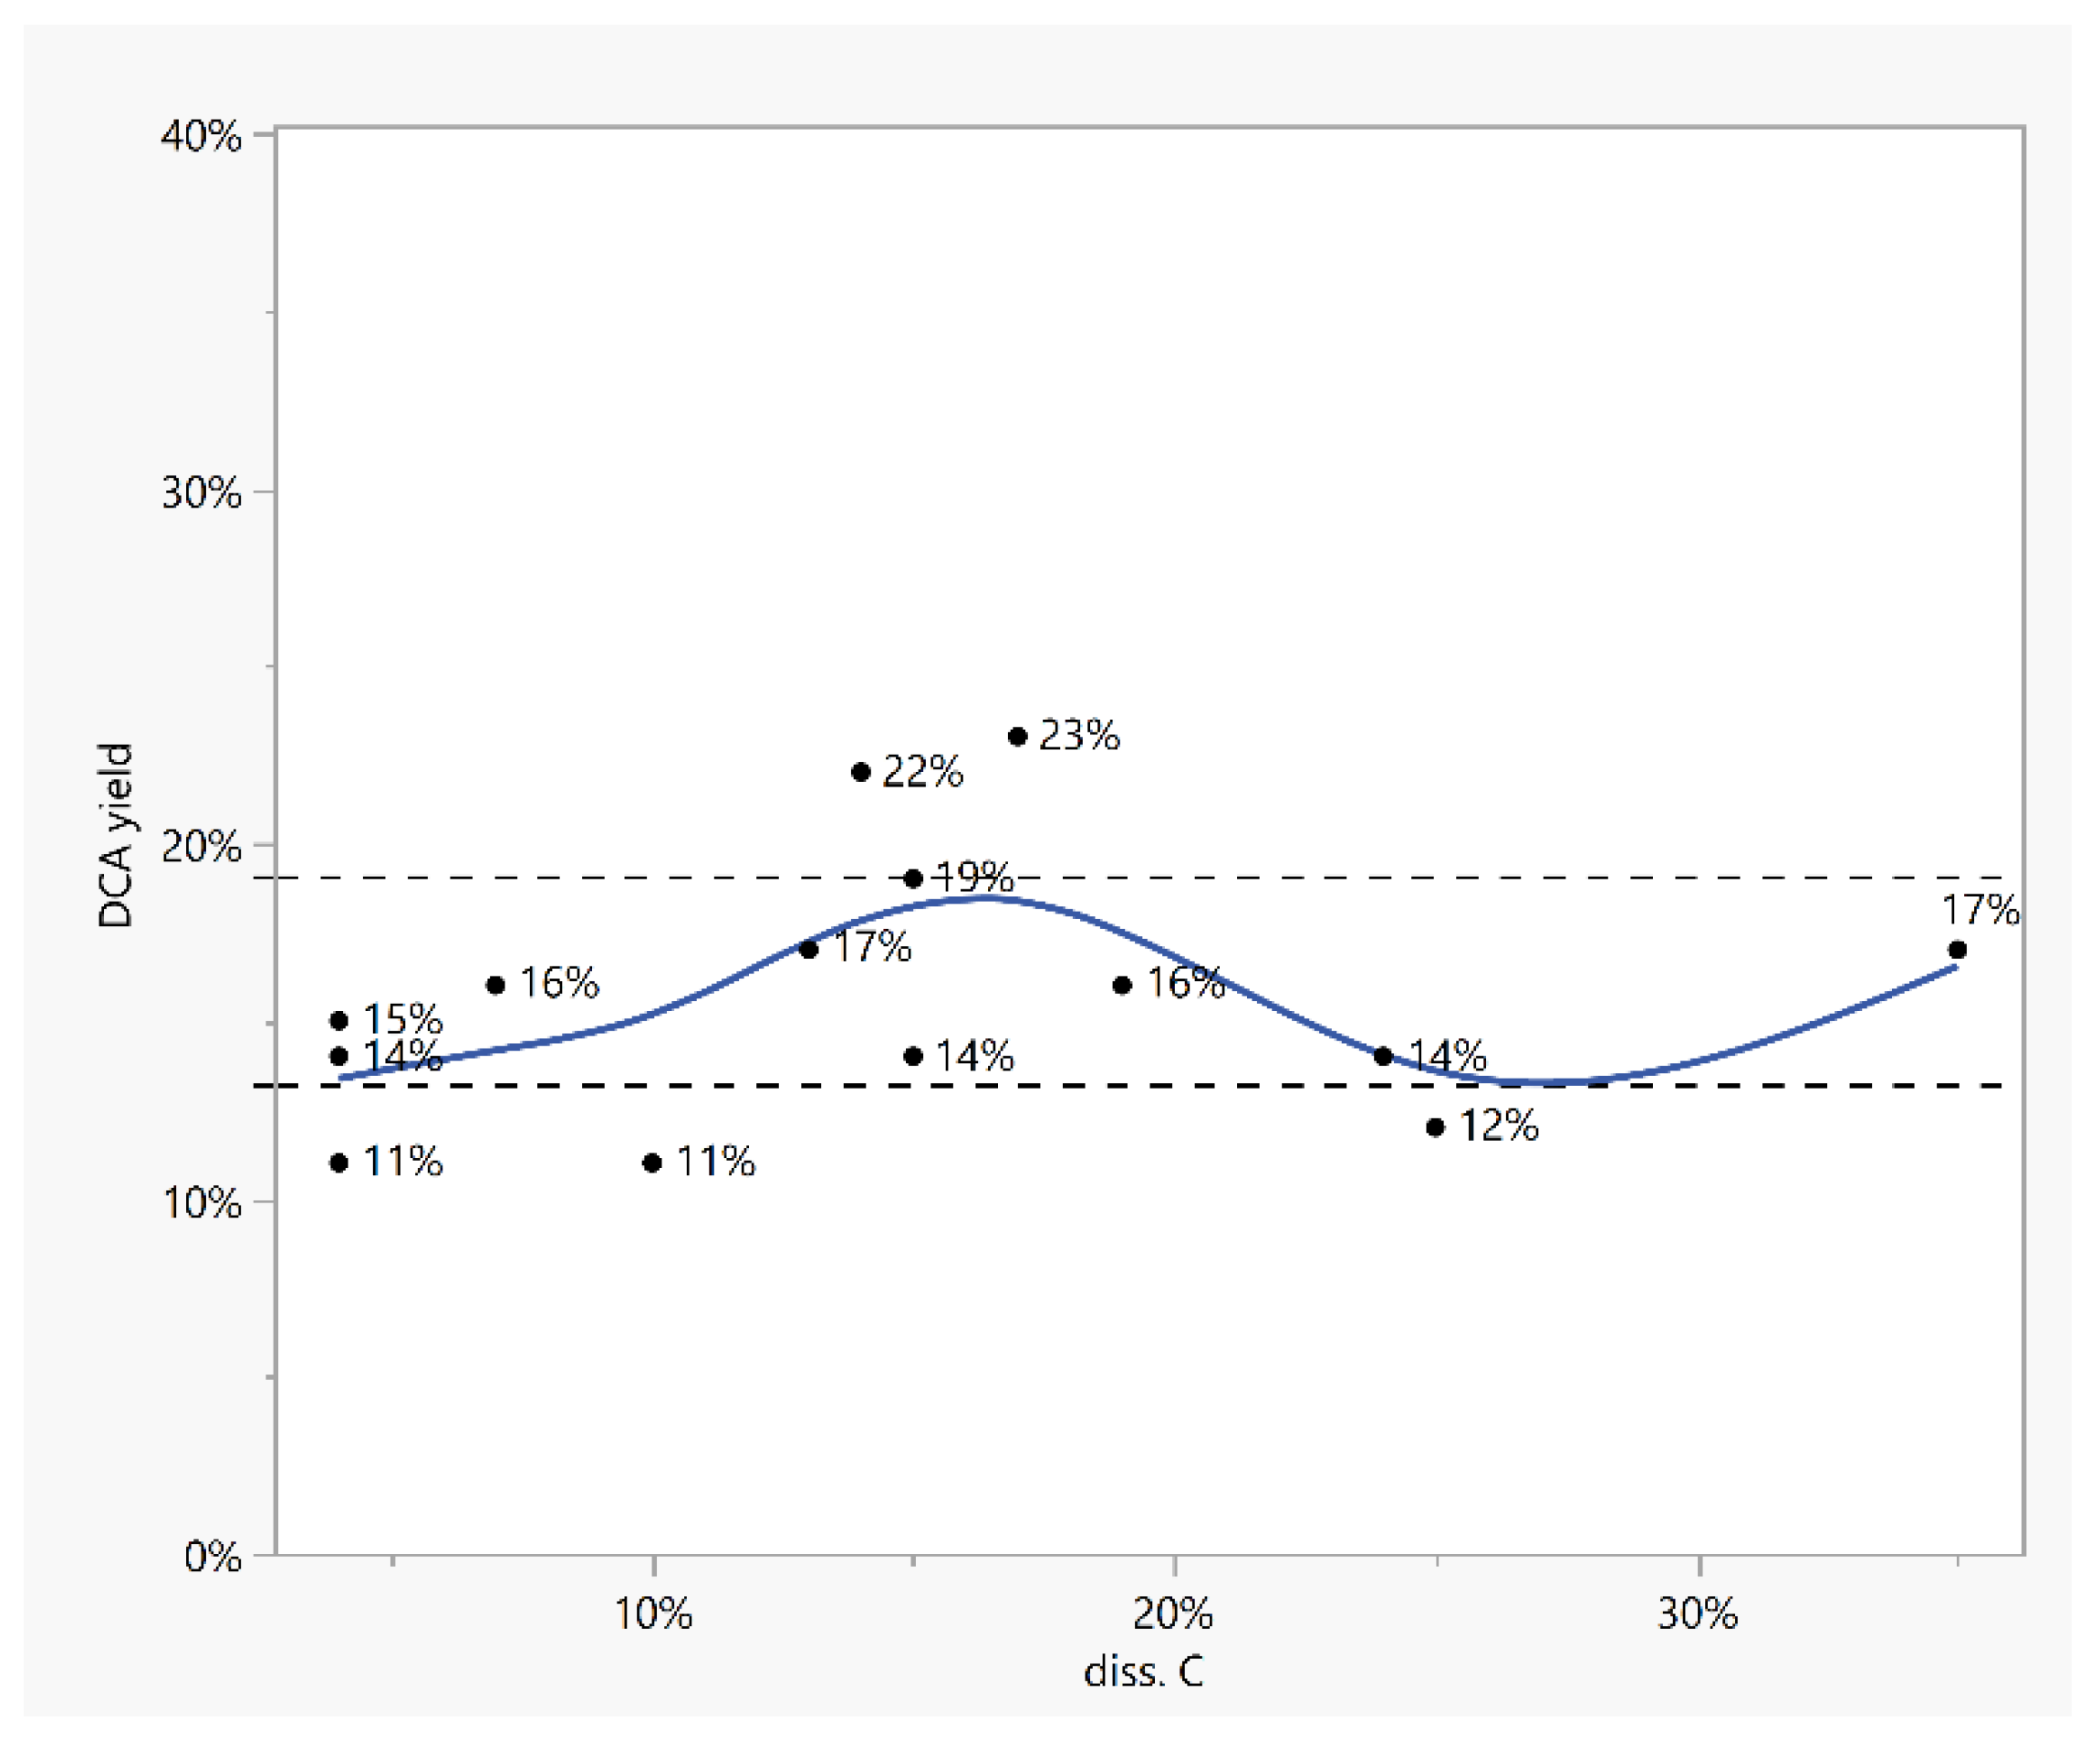
It was also observed that regardless of the amount of carbon dissolved during air oxidation (ranging from 4% to 35%), the DCA yields after the second oxidation remained mostly within the range of 13–19%, with no clear trend (Figure 4). This contrasts with the results presented in Table 7. It is likely that the partially oxidized, undissolved kerogen balances the DCA yield. Thus, despite differences in air oxidation conditions, the partially oxidized material obtained appears to have similar reactivity, leading to uniform behavior during nitric acid oxidation.
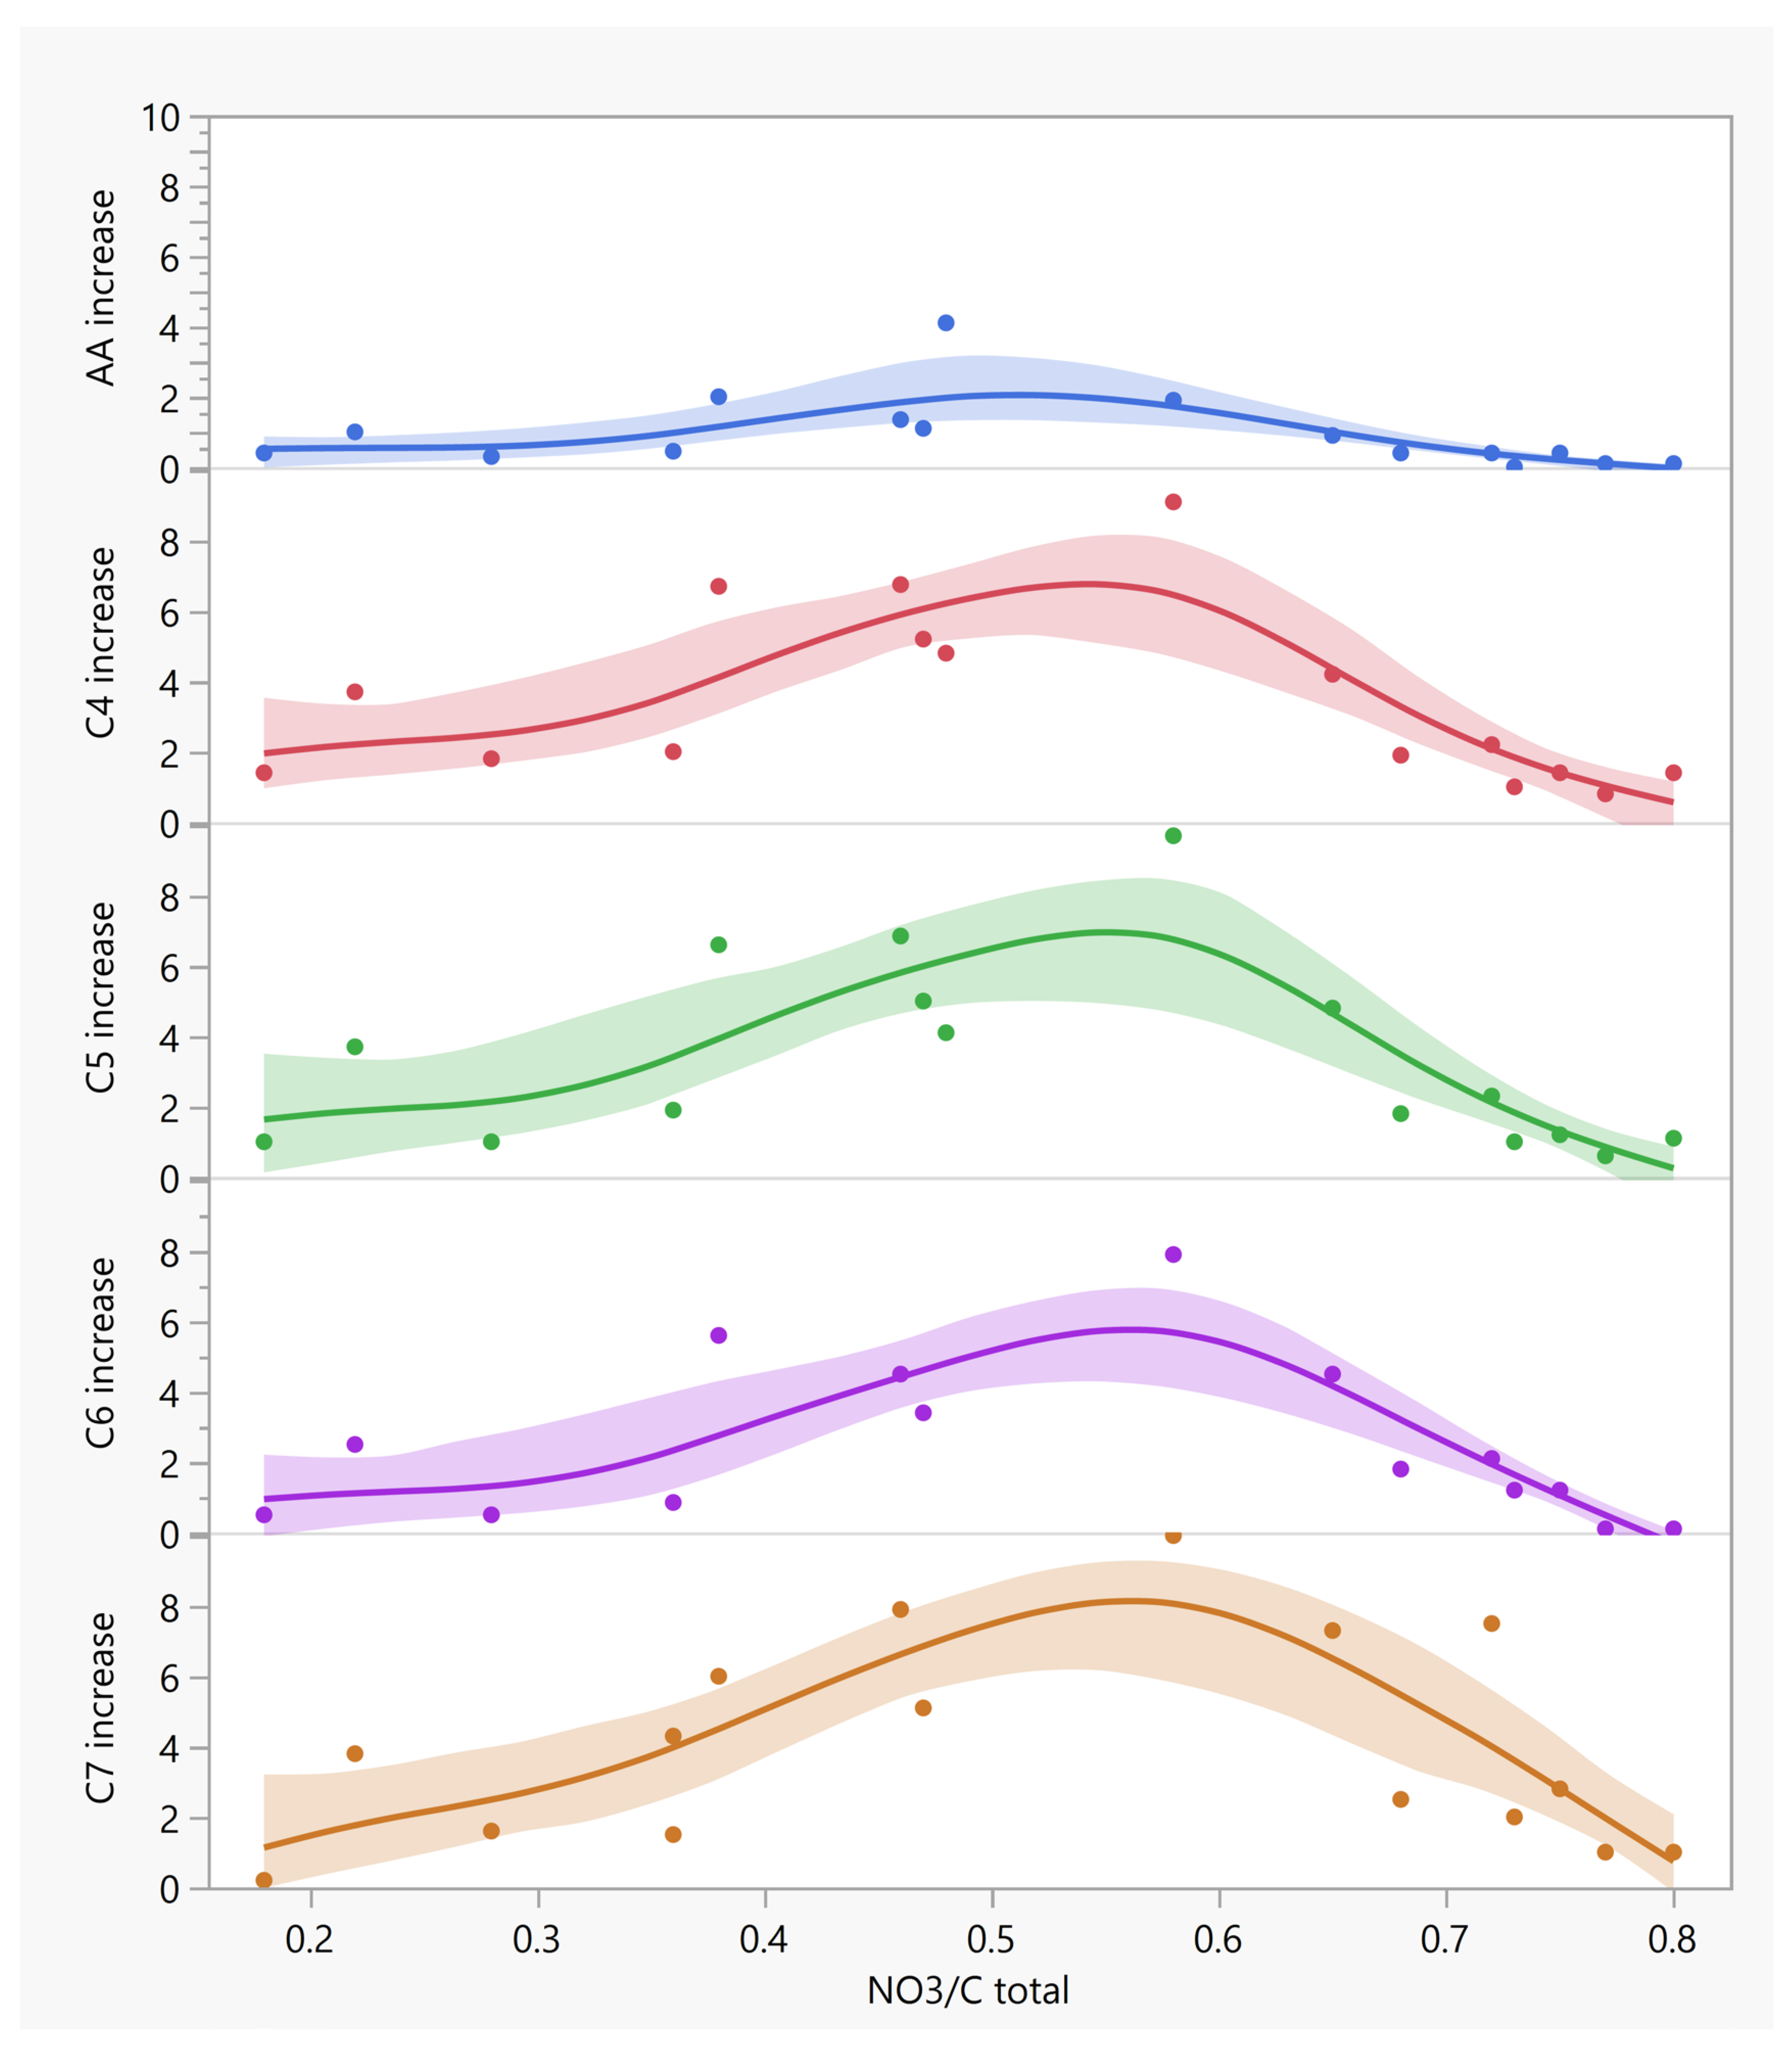
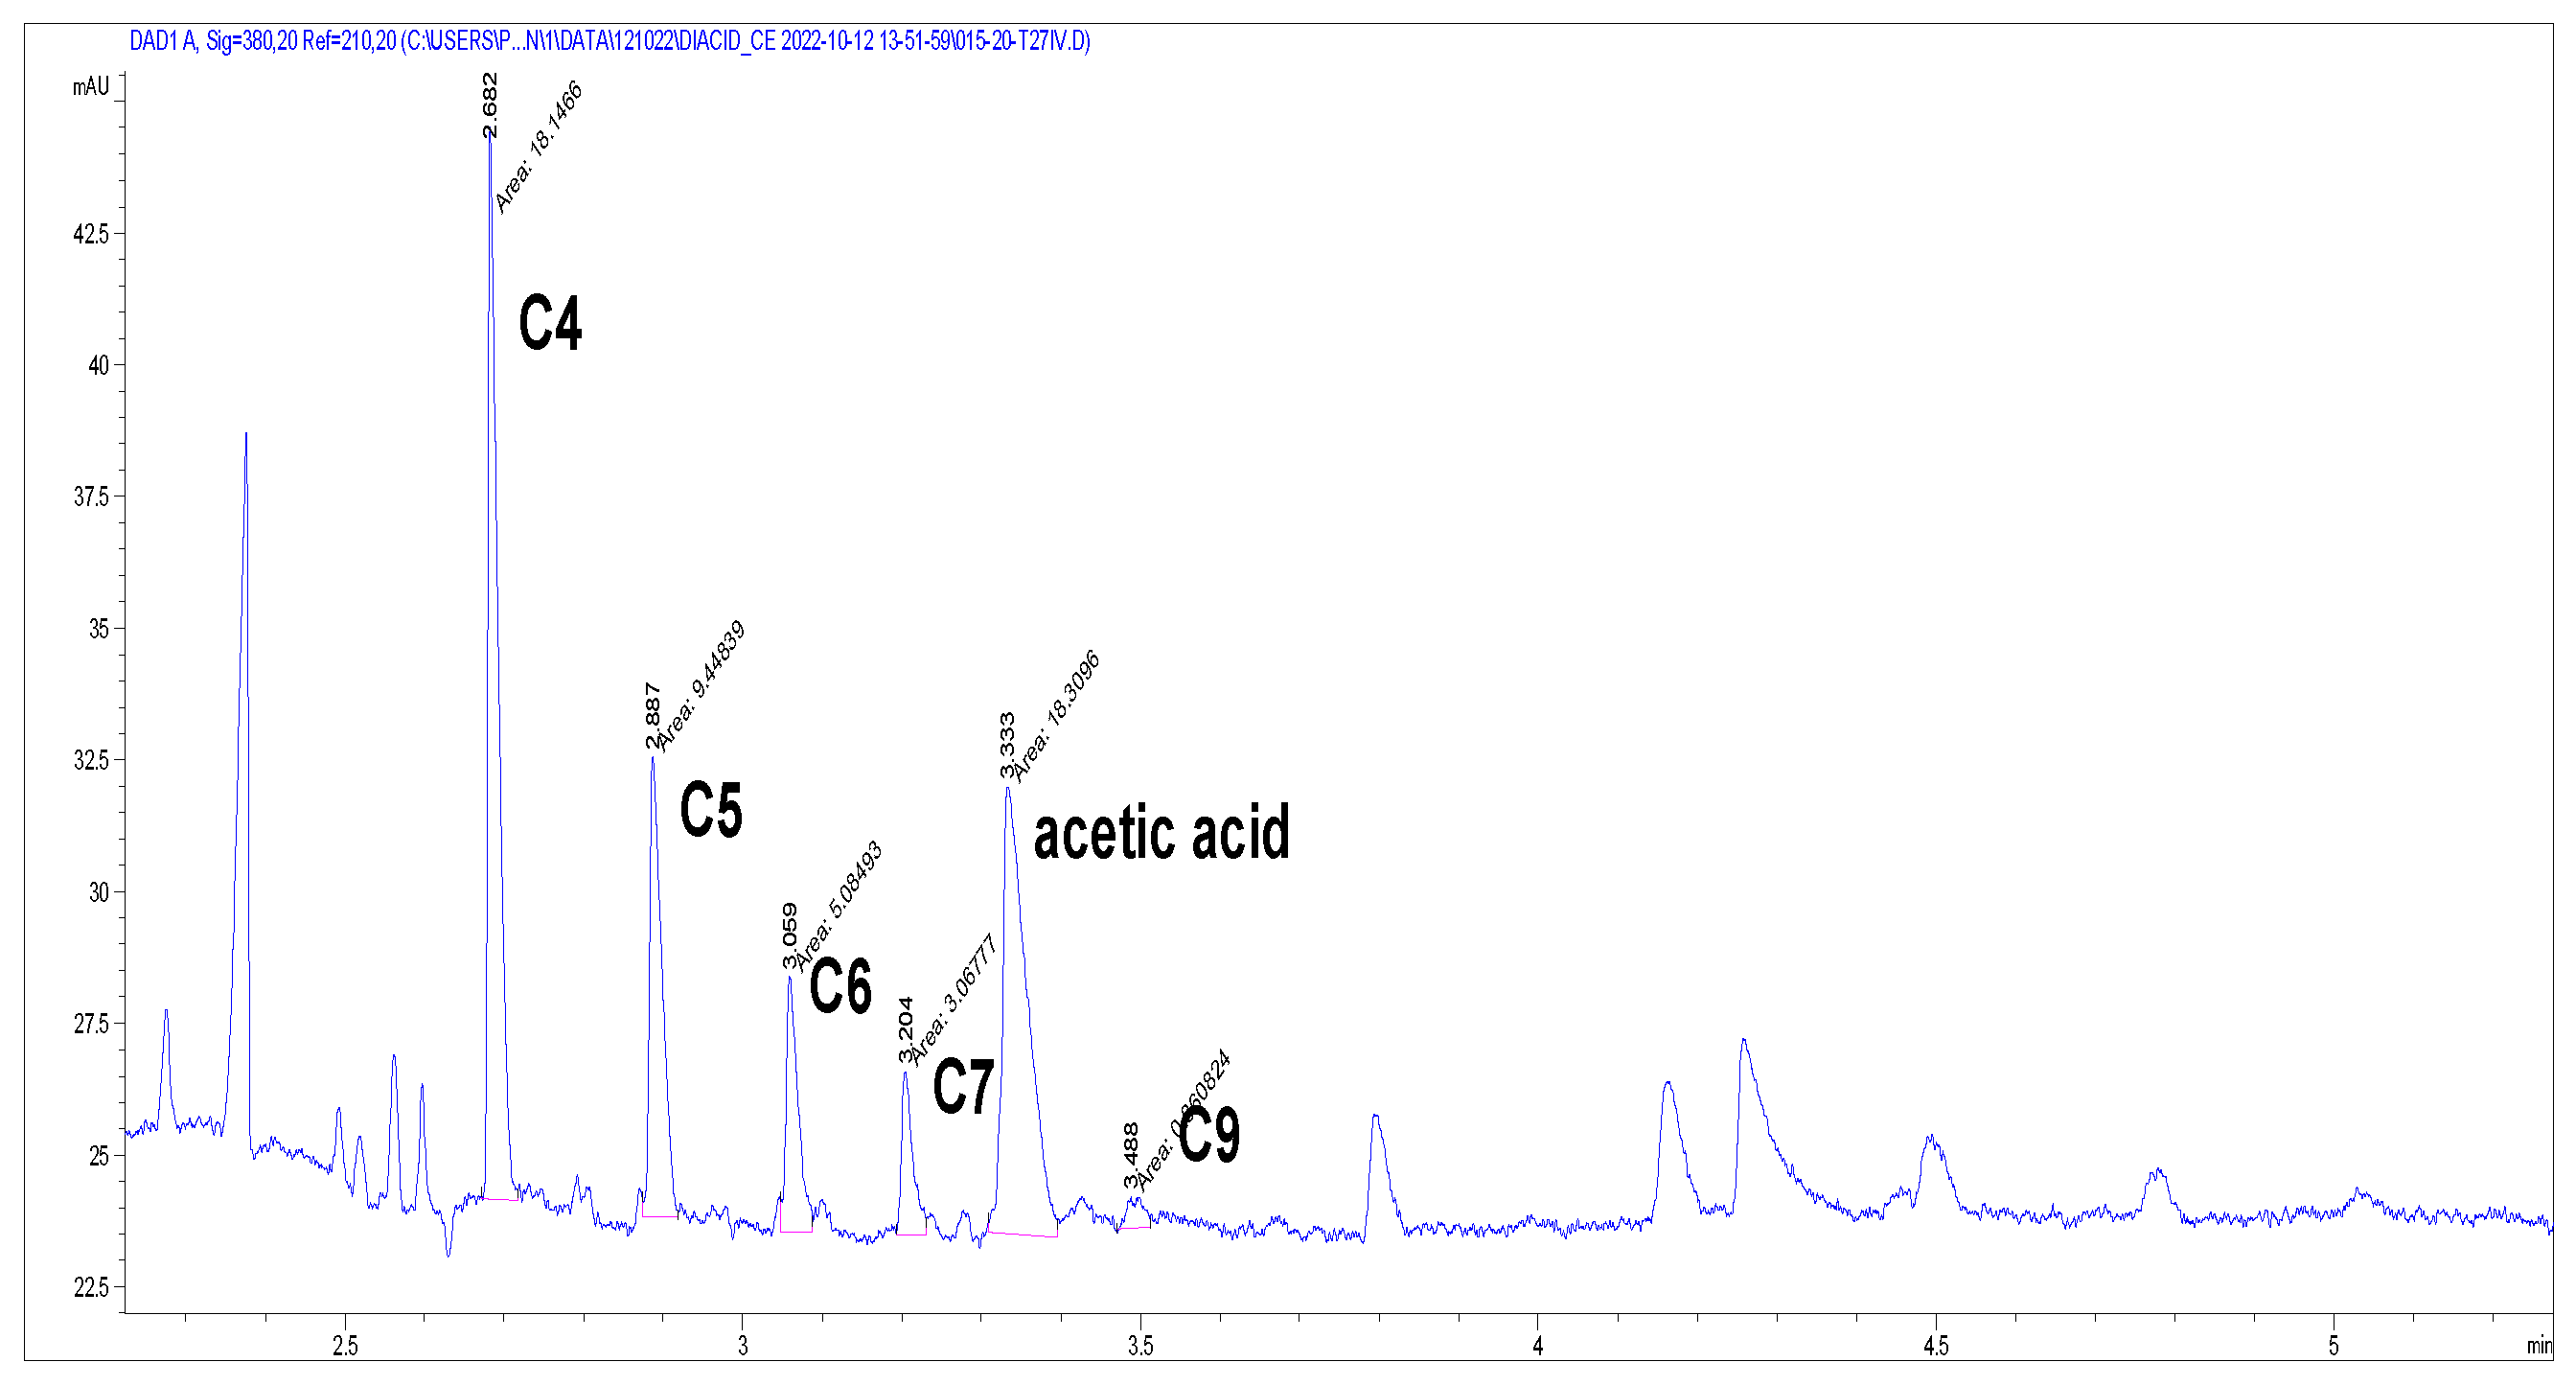
It was also evaluated whether the data showed a trend between the HNO3/C ratio and DCA formation, considering each DCA individually (Figure 5). The most significant change was observed in the HNO3/C range of 0.5–0.6, indicating that under the applied conditions, higher excess levels of HNO3 are unnecessary and may cause partial degradation of the formed DCAs. A similar though less pronounced trend was observed for acetic acid. An example of the electropherogram obtained from capillary electrophoresis analysis of the reaction mixture can be seen in Figure 6 (see also Supporting Information, Figure S5 and Tables S7 and S8).
The corresponding carbon balance (Table 9) supports the trends observed above. In the experiments yielding the highest DCAs amounts during HNO3 oxidation, organic carbon conversion reached up to 84%. However, only a modest C fraction (19–23%) was incorporated into the dissolved organics. The targeted dicarboxylic acids (C4–C8) accounted for roughly half of the dissolved organic content, with the remainder consisting of isomers, monocarboxylic acids, and tricarboxylic acids [28] (see also Supporting Information, Table S9, Photo S2, and Figures S6 and S7). Additionally, 4% of organic carbon was converted into acetic acid. As a result, 52–62% of the initial carbon was released as CO2 or other volatile compounds over the course of the two-oxidation step. This suggests that applying O2 oxidation as a pre-treatment for HNO3 oxidation still lacks sufficient selectivity, resulting in significant carbon losses as CO2 and limiting its suitability for carbon-efficient processing. However, it is important to note that these are preliminary results combining two very straightforward oxidation methods without the use of any catalysts. Introducing more selective oxidation conditions could potentially reduce CO2 formation and improve overall efficiency, for example, by testing well-known catalysts from WAO processes (e.g., Fe- or Cu-based systems [41,42]) and from nitric acid oxidation (e.g., V, Co, or Mn compounds [35,43]). These could contribute to lowering CO2 emissions through better control over the oxidation pathways.

4. Conclusions

In this study, a two-step oxidative process for oil shale degradation into DCAs was investigated, potentially offering milder and more environmentally acceptable conditions compared to conventional oil shale processing methods, which typically require significantly higher temperatures and yield less selective products. This study describes a process that proceeds in aqueous media with diluted nitric acid and avoids the use of organic solvents or extreme thermal conditions for DCAs production. DCAs are indispensable for the manufacture of polyesters, polyamides, and different high-performance materials.
The highest DCA yields in the two-step process were obtained when the entire crude mixture from the O2 oxidation (Step 1) with 30–40% carbon conversion was used. Efficient air oxidation (Step 1) required the following conditions: use of 1% KOH solution with a reaction time of 30 min, temperature of 165–175 °C at 40 bar pO2, or alternatively 185 °C at 30 bar pO2. In the best-performing experiment, a 23% DCA yield was achieved when the above-mentioned air oxidation step was followed by nitric acid oxidation using an 8% HNO3 solution, with a HNO3/C molar ratio of 0.5–0.6 (Step 2). Air oxidation enabled a two-fold reduction in both nitric acid dosage and concentration, indicating improved process efficiency. The crude product consisted primarily of short-chain DCAs, which was a result of overoxidation; this also led to an increased CO2 formation.
This study represents the first attempt to establish a sequential two-step oxidation strategy combining air oxidation and HNO3 treatment for the conversion of kerogen-type organic matter. Oxidation is an effective method to degrade the large molecular structure of kerogen into small molecules by taking advantage of the structural characteristics of kerogen. It demonstrates that the approach may be used in order to produce valuable oxidation products—particularly dicarboxylic acids—from oil shale (kukersite), provided that CO2 emissions are effectively mitigated. Further optimization could enhance process efficiency and support the development of sustainable, high-value chemical applications from oil shale.

Supplementary Materials

The following supporting information can be downloaded at https://www.mdpi.com/article/10.3390/pr13082421/s1. Table S1. Particle size distribution of the native oil shale (OS) after grounding; Photo S1. Grounded native oil shale; Table S2. Chemical compositions of native oil shale (I OS) and enriched oil shale (II OS); Table S3. The elemental composition of native oil shale (I OS) and enriched oil shale (II OS); Figure S1. CE electropherogram of reaction mixture (aqueous phase) from WAO of oil shale without added base; Table S4. Organic acids quantified in the aqueous phase of the reaction mixture according to Figure S1; Table S5. Nitrogen balance in reaction without a base; Figure S2. CE electropherogram of reaction mixture (aqueous phase) from WAO of oil shale in 1 KOH%; Table S6. Compounds quantified in the aqueous phase of the reaction mixture according to Figure S2; Figure S3. GC-TCD spectrum of gas evolved during WAO of oil shale in 1% KOH; Figure S4. Time-dependent yield of DCAs and the content of longer-chain acids determined using 30% nitric acid (3 mol. eq. excess per kerogen carbon) on non-pre-oxidized kukersite oil shale in separate experiments at 140 °C; Figure S5. CE electropherograms of reaction mixture after Step 2, HNO3 oxidation; Table S7. Compounds quantified in the aqueous phase of the reaction mixture according to Figure S5; Table S8. DCA changes after first and second HNO3 oxidation of the whole reaction mixture (solid + dissolved organics); Table S9. Content of DCAs after extraction with diethyl ether and concentration of the organic phase; Photo S2. The color of the extract of the reaction mixture, Figure S6. ESI-HRMS spectrum of the extracted reaction mixture after two-step oxidation; Figure S7. The FTIR spectrum of extracted reaction mixture after two-step oxidation.

Author Contributions

Conceptualization, K.K. and M.L.; methodology, K.K., V.Ö.K., and J.M.U.; software, K.M. and V.Ö.K.; validation, A.S., E.S., and B.M.; formal analysis, K.M. and T.K.; investigation, K.K., E.S., A.S., B.M., K.M., and T.K.; resources, K.K. and B.M.; data curation, K.K. and J.M.U.; writing—original draft preparation, K.K.; writing—review and editing, K.K., B.M., M.L., and M.K.; visualization, K.K. and V.Ö.K.; supervision, K.K. and M.L.; project administration, K.K.; funding acquisition, K.K. and M.L. All authors have read and agreed to the published version of the manuscript.

Funding

This research was funded by the European Union and Estonian Research Council via project TEM-TA128, supported by the Ministry of Education and Research Centers of Excellence grant TK228 (Center of Excellence in the Circular Economy for Strategic Mineral and Carbon Resources) and by the Tallinn University of Technology.

Data Availability Statement

The original contributions presented in the study are included in the article; further inquiries can be directed to the corresponding author.

Acknowledgments

The authors acknowledge Kerogen OÜ and Kiviõli Keemiatööstus for providing the necessary amount of raw material (oil shale) and for participating in topic-related discussions. The authors also acknowledge their colleagues from the Department of Chemistry and Biotechnology, the Department of Energy Technology, and the Department of Geology. Special thanks are extended to the colleagues from the Industrial Chemistry Laboratory at Tallinn University of Technology.

Conflicts of Interest

The authors declare no conflicts of interest. The funders had no role in the design of the study; in the collection, analyses, or interpretation of data; in the writing of the manuscript; or in the decision to publish the results.

Abbreviations

The following abbreviations are used in this manuscript:
AAAcetic acid
C4Succinic acid
C5Glutaric acid
C6Adipic acid
C7Pimelic acid
C8Suberic acid
C9Azelaic acid
Cresidual OSCarbon in residual oil shale mass after oxidation
Cdiss.organicsCarbon in dissolved organics after oxidation
CmolarmassratioCarbon content based on the molar mass ratio of the compound
CtotalTotal carbon measured using an elemental analyzer
C conv.Carbon conversion
DCADicarboxylic acid
FAFormic acid
mdDry mass
mfeed OSMass of initial oil shale (reaction feed)
mdiss.organicsMass of dissolved organics
OMOrganic matter
OSOil shale
TOCTotal organic carbon
TICTotal inorganic carbon
WAOWet air oxidation

References

  1. Dyni, J.R. Geology and resources of some world oil-shale deposits. Oil Shale 2003, 20, 193–252. [Google Scholar] [CrossRef]
  2. World Energy Council. World Energy Resources. 2016. Available online: https://www.worldenergy.org/assets/images/imported/2016/10/World-Energy-Resources-Full-report-2016.10.03.pdf (accessed on 1 June 2025).
  3. Raukas, A.; Punning, J.M. Environmental problems in the Estonian oil shale industry. Energy Environ. Sci. 2009, 2, 723–728. [Google Scholar] [CrossRef]
  4. Shu, Y.; Liu, B.; Zhang, H.; Zhou, A.; Zhang, S.; Shi, Z.; Hu, Z.; Wang, X. Process design and optimization on upgrading and utilization of ultra-high-quality oil shale by pyrolysis. Fuel 2025, 390, 134675. [Google Scholar] [CrossRef]
  5. Han, X.; Kulaots, I.; Jiang, X.; Suuberg, E.M. Review of oil shale semicoke and its combustion utilization. Fuel 2014, 126, 143–161. [Google Scholar] [CrossRef]
  6. Liu, K.; Qi, H.; Wang, Z.; Liu, B.; Wang, Y.; Zhang, Z.; Zhang, H.; Yang, R.; Jiang, L.; Ostadhassan, M. The organic matrix: An in-depth review of kerogen and its significance. Fuel 2025, 397, 135493. [Google Scholar] [CrossRef]
  7. Liu, Y.-J.; Wang, Q.; Xu, C.; Zhang, R.-Z.; Hou, C.-X.; Hu, W.-J.; Lu, T.; Liang, Y.-H. Exploring the mechanism of alkali-oxygen oxidation of Yilan oil shale to carboxylic acids using a combined experimental and theoretical method. Chem. Phys. 2025, 595, 112737. [Google Scholar] [CrossRef]
  8. Mets, B.; Kaldas, K.; Uustalu, J.M.; Lopp, M. The Lille-Blokker model—An excellent tool to describe the structure of kukersite. Oil Shale 2023, 40, 234–243. [Google Scholar] [CrossRef]
  9. Bajc, S.; Amblès, A.; Largeau, C.; Derenne, S.; Vitorović, D. Precursor biostructures in kerogen matrix revealed by oxidative degradation: Oxidation of kerogen from estonian kukersite. Org. Geochem. 2001, 32, 773–784. [Google Scholar] [CrossRef]
  10. Lille, Ü.; Heinmaa, I.; Pehk, T. Molecular model of Estonian kukersite kerogen evaluated by 13C MAS NMR spectra. Fuel 2003, 82, 799–804. [Google Scholar] [CrossRef]
  11. Mets, B.; Lopp, M.; Uustalu, J.M.; Muldma, K.; Niidu, A.; Kaldas, K. A two-step model for assessing the potential of shale-derived chemicals by oxidation of kukersite. Oil Shale 2023, 40, 344–362. [Google Scholar] [CrossRef]
  12. Vandenbroucke, M.; Largeau, C. Kerogen origin, evolution and structure. Org. Geochem. 2007, 38, 719–833. [Google Scholar] [CrossRef]
  13. Blokker, P.; van Bergen, P.; Pancost, R.; Collinson, M.E.; de Leeuw, J.W.; Damste, J.S.S. Sinninghe Damste. The chemical structure of gloeocapsomorpha prisca microfossils: Implications for their origin. Geochim. Cosmochim. Acta 2001, 65, 885–900. [Google Scholar] [CrossRef]
  14. Barakat, A.O.; Yen, T.F. Kerogen structure by stepwise oxidation. Use of sodium dichromate in glacial acetic acid. Fuel 1987, 66, 587–593. [Google Scholar] [CrossRef]
  15. Robinson, W.E. Origin and Characteristics of Green River Oil Shale. In Developments in Petroleum Science; Yen, T.F., Chilingarian, G.V., Eds.; Elsevier: Amsterdam, The Netherlands, 1976; Volume 3, Chapter 4; pp. 61–79. [Google Scholar]
  16. Durand, B. Sedimentary organic matter and kerogen. Definition and quantitative importance of kerogen. In Kerogen; Edistions Technip: Paris, France, 1980. [Google Scholar]
  17. Veski, R.; Veski, S. Aliphatic dicarboxylic acids from oil shale organic matter–historic review. Oil Shale 2019, 36, 76–95. [Google Scholar] [CrossRef]
  18. Fomina, A.; Pobul, L.; Degtereva, Z.; Veski, R.; Kirret, O.; Nikopensius, I.; Männik, A.; Pärn, A.; Poom, A.; Murumets, K.; et al. Method for Processing Caustobilites of Sapropelite Type with Oxidizer. Australian Patent Application No. 1973052367, 22 August 1974. Available online: https://ipsearch.ipaustralia.gov.au/patents/1973052367 (accessed on 1 June 2025).
  19. Gobin, M.; Loulergue, P.; Audic, J.-L.; Lemiègre, L. Synthesis and characterisation of bio-based polyester materials from vegetable oil and short to long chain dicarboxylic acids. Ind. Crops Prod. 2015, 70, 213–220. [Google Scholar] [CrossRef]
  20. Nakayama, Y.; Matsu-Ura, T.; Tanaka, R.; Shiono, T.; Hino, S.; Kawasaki, N.; Yamano, N.; Nakayama, A.; Tezuka, R.; Tanaka, K. Biodegradable thermoplastic elastomers synthesized from C7–C10 aliphatic dicarboxylic acids, 2-methyl-1,3-propanediol, and L-lactide. Polym. Degrad. Stab. 2024, 229, 110978. [Google Scholar] [CrossRef]
  21. Wang, Z.; Yan, J.; Wang, T.; Zai, Y.; Qiu, L.; Wang, Q. Fabrication and properties of a bio-based biodegradable thermoplastic polyurethane elastomer. Polymers 2019, 11, 1121. [Google Scholar] [CrossRef]
  22. Proskurjakov, V.A.; Soloveichik, Z.V. Oxidation of oil shale by atmospheric oxygen. 1. Oxidation of an aqueous-alkaline suspension of Gdov shale in an autoclave. Tr. Vsesoj. N.I.Instituta po Pererab. i Issl. Topl. 1961, 10, 64–80. (In Russian) [Google Scholar]
  23. Proskurjakov, V.A.; Soloveichik, Z.V. Oxidation of oil shale by atmospheric oxygen. 2. Oxidation of Gdov shales with continuous air supply. Tr. Vsesoj. N.I.Instituta po Pererab. i Issl. Topl. 1961, 10, 81–90. (In Russian) [Google Scholar]
  24. Proskurjakov, V.A.; Yakovlev, V.I.; Kudrjukov, O.I. Oxidation of oil shale by atmospheric oxygen. 3. Oxidation of common oil shales. Tr. Vsesoj. N.I.Instituta po Pererab. i Issl. Topl. 1962, 11, 20–27. (In Russian) [Google Scholar]
  25. Fomina, A.S.; Pobul, L. The deriving of dibasic aliphatic acids from a new raw material. Acad. Sci. Est. SSR 1957, 6, 190–198. [Google Scholar]
  26. Degtereva, Z.; Fomina, A. Production of Dibasic Acids C4-C10 from Oil Shale Kukersite. Acad. Sci. Est. SSR 1959, 8, 122–136. [Google Scholar]
  27. Kaldas, K. Wet Air Oxidation of Oil Shale. Ph.D. Thesis, Tallinn University of Technology, Tallinn, Estonia, 2021. [Google Scholar]
  28. Kaldas, K.; Preegel, G.; Muldma, K.; Lopp, M. Wet Air Oxidation of Oil Shales: Kerogen Dissolution and Dicarboxylic Acid Formation. ACS Omega 2020, 5, 22021–22030. [Google Scholar] [CrossRef]
  29. Kaldas, K.; Niidu, A.; Preegel, G.; Uustalu, J.M.; Lopp, M. Aspects of kerogen oxidative dissolution in subcritical water using oxygen from air. Oil Shale 2021, 38, 199–214. [Google Scholar] [CrossRef]
  30. Kann, J.; Raukas, A.; Siirde, A. About the gasification of kukersite oil shale. Oil Shale 2013, 30, 283–293. [Google Scholar] [CrossRef]
  31. Debellefontaine, H.; Crispel, S.; Reilhac, P.; Périé, F.; Foussard, J.N. Wet air oxidation (WAO) for the treatment of industrial wastewater and domestic sludge. Design of bubble column reactors. Chem. Eng. Sci. 1999, 54, 4953–4959. [Google Scholar] [CrossRef]
  32. Debellefontaine, H.; Foussard, J.N. Wet air oxidation for the treatment of industrial wastes. Chemical aspects, reactor design and industrial applications in Europe. Waste Manag. 2000, 20, 15–25. [Google Scholar] [CrossRef]
  33. Van De Vyver, S.; Román-Leshkov, Y. Emerging catalytic processes for the production of adipic acid. Catal. Sci. Technol. 2013, 3, 1465–1479. [Google Scholar] [CrossRef]
  34. Pohorecki, R.; Bałdyga, J.; Moniuk, W.; Podgórska, W.; Zdrójkowski, A.; Wierzchowski, P.T. Kinetic model of cyclohexane oxidation. Chem. Eng. Sci. 2001, 56, 1285–1291. [Google Scholar] [CrossRef]
  35. Li, G.; Liu, S.; Dou, X.; Wei, H.; Shang, M.; Luo, Z.; Su, Y. Synthesis of adipic acid through oxidation of K/A oil and its kinetic study in a microreactor system. AIChE J. 2020, 66, e16289. [Google Scholar] [CrossRef]
  36. Castellan, A.; Bart, J.C.J.; Cavallaro, S. Industrial production and use of adipic acid. Catal. Today 1991, 9, 237–254. [Google Scholar] [CrossRef]
  37. Castellan, A.; Bart, J.C.J.; Cavallaro, S. Synthesis of adipic acid via the nitric acid oxidation of cyclohexanol in a two-step batch process. Catal. Today 1991, 9, 285–299. [Google Scholar] [CrossRef]
  38. Väli, E.; Valgma, I.; Reinsalu, E. Usage of Estonian Oil Shale. Oil Shale 2008, 25, 101. [Google Scholar] [CrossRef]
  39. Mishra, V.S.; Mahajani, V.V.; Joshi, J.B. Wet Air Oxidation. Ind. Eng. Chem. Res. 1995, 34, 2–48. [Google Scholar] [CrossRef]
  40. Oliviero, L.; Barbier, J.; Duprez, D. Wet air oxidation of nitrogen-containing organic compounds and ammonia in aqueous media. Appl. Catal. B Environ. 2003, 40, 163–184. [Google Scholar] [CrossRef]
  41. Arena, F.; Italiano, C.; Raneri, A.; Saja, C. Mechanistic and kinetic insights into the wet air oxidation of phenol with oxygen (CWAO) by homogeneous and heterogeneous transition-metal catalysts. Appl. Catal. B Environ. 2010, 99, 321–328. [Google Scholar] [CrossRef]
  42. Sales, F.G.; Maranhão, L.C.A.; Filho, N.M.L.; Abreu, C.A.M. Kinetic evaluation and modeling of lignin catalytic wet oxidation to selective production of aromatic aldehydes. Ind. Eng. Chem. Res. 2006, 45, 6627–6631. [Google Scholar] [CrossRef]
  43. Luo, X.; Zhan, J.; Mei, Q.; Zhang, S. Selective oxidative upgrade of waste polystyrene plastics by nitric acid to produce benzoic acid. Green Chem. 2023, 25, 6717–6727. [Google Scholar] [CrossRef]
Figure 1. Schematic representation of the two-step oxidation process investigated in this study.
Processes 13 02421 g001
Figure 2. Distribution of carbon between phases (percentage from reacted carbon).
Processes 13 02421 g002
Figure 3. The relationship between DCA yield after nitric acid oxidation (Step 2) and oxidation depth (carbon conversion) after air oxidation (Step 1). Conditions in Step 2: 140 °C, 30 min, c(HNO3) = 7.5–8%. Spline smoothing was applied in JMP (JMP®, Version 18. SAS Institute Inc., Cary, NC, USA, 1989–2025) to show variable relationships. Black dashed line: control at 130 °C and red dashed line: control at 140 °C, both without prior air oxidation.
Processes 13 02421 g003
Figure 4. The relationship between dissolved carbon (1st step) on DCA yield after Step 2. Conditions in Step 2: 140 °C, 30 min, c(HNO3) = 7.5–8%. A spline-based smoothing function of JMP program (JMP®, Version 18. SAS Institute Inc., Cary, NC, USA, 1989–2025) was used to visualize the relationship between variables. Dashed lines mark the most representative value range.
Processes 13 02421 g004
Figure 5. DCA changes over HNO3 amount in nitric acid oxidation. “Increase” refers to the change in the concentration of an acid in the solution relative to its initial concentration. A spline smoother with bootstrap confidence intervals was used in the JMP program to illustrate the relationship between the variables.
Processes 13 02421 g005
Figure 6. An example of the electropherogram obtained from capillary electrophoresis analysis of the reaction mixture. The main peaks (C4–C9) correspond to dominant dicarboxylic acids, while minor peaks are attributed to monocarboxylic acids and possible isomers.
Processes 13 02421 g006
Table 1. Previous oxidations of Kukersite.
Oxidation MethodDCA wt% Per KerogenOther Acids a
KMnO4 [9,25][25] 60% of DCA raw mixture
[9] 21% of C4–C10 (max at C8)
[25] Volatile, viscous, and solid acids
[9] 40% total acids; 1% CA C14–C18; 10% tri- and tetracarboxylic acids C6–C18; 2.4% aromatic acids
RuO4 [13]C5–C14 (max at C9); no yield determinedCA and oxo-CA C7–C18;
2-methyl DCA C5–C19 and tri-CA C12–C20 (max at C17)
HNO3 [17,18,26][26] Up to 43% C4–C10 with 65% of HNO3 (lab); [17,18] 26% C4–C10 in pilot plant (max at C5–C7)≈80% of kerogen was soluble in acid; 1:1 water-soluble and solid oxygenated products
O2 [22,23,24]Up to 20% C4–C100.5–5% volatile acids and 10–50% solid high-molecular-weight acids
a CA refers to other carboxylic acids; oxo-CA refers to carboxylic acids containing a keto-group.
Table 2. Chemical composition of the enriched oil shale (OS) used as starting material, %wt.
OM 1CtotalHNSTIC 2TOC 3
5843.85.60.12.80.743.0
1 OM—organic matter content, calculated from the measured calorific value, MJ/kg [38] (see Supporting Information for details); 2 TIC—total inorganic carbon; 3 TOC—total organic carbon.
Table 3. Carbon balance in WAO reaction without a base 1.
No.T, °CpO2,
bar
Time, hC in
Residual, %wt
C in Diss. Organics, %wtC in
Volatiles, %wt
Gaseous C 2, %
1185400.255651127
2185400.54071439
3185401672265
4195400.255651029
5195400.5315954
6195401652267
1 Reaction conditions: kerogen 100 g/L in 200 mL water, oxygen flow regime; 2 value calculated by difference.
Table 4. Sulfur balance in reaction without a base 1.
No.T, °CpO2, barTime, hS in Residual, %wtS in Diss. Organics, %wt
1185400.252370
2185400.51081
3185401477
4195400.251773
5195400.51278
6195401887
1 Reaction conditions: kerogen 100 g/L in 200 mL water, oxygen flow regime.
Table 5. C balance in basic solution 1.
NoT, °CpO2, barC in Residual, %wtC in Diss. Organics, %wtC in Volatiles, %wtGaseous C, % 2
118520707.41.512
2185305715.52.725
3185402922.05.144
4175406817.92.013
5165407415.01.810
1 Reaction conditions: 0.5 h, in 1% KOH solution, kerogen 100 g/L in 200 mL water, oxygen flow regime; 2 value calculated by difference.
Table 6. S and N balance in basic media 1.
No.T, °CpO2,
bar
S in Residual, %wtS in Diss. Organics, %wtN in Residual, %wtN in Diss. Organics, %wt
11852044563339
21853036574344
31854020822264
41754032513952
51654040494645
1 Reaction conditions: 0.5 h, in 1% KOH solution, kerogen 100 g/L in water, oxygen flow regime.
Table 7. Nitric acid oxidation of dissolved organics.
Feed from Step 1
Tbl/NoDry Matter 1, %wtC in Dry Matter, %Yield 2, %C4, mg/gC5, mg/gC6, mg/gC7,
mg/g
Σ DCA, mg/g
4./122221.42.41.50.804.7
4./323327.29.95.32.31.418.9
Step 2 i.e., HNO3 oxidation
Tbl/No-Exp.HNO3 ox.
T, °C/t, h
HNO3, mol eq. 3yield, %C4,
mg/g
C5, mg/gC6, mg/gC7,
mg/g
Σ DCA, mg/gFinal 4 HNO3, mg/g
4./1-A120/0.250.53.16.02.81.10.510.462.4
4./1-B120/0.50.53.36.42.81.10.410.748.0
4./3-C140/0.250.3512.115.66.63.21.127.158.4
4./3-D140/0.50.3515.419.28.43.31.232.545.4
1 Dry matter content—concentration of dissolved organics after water evaporation; 2 yield per initial amount of kerogen added in step 1; 3 mol equivalents of HNO3 added per dissolved carbon, resulting in initial c(HNO3) = 12 %wt and c(HNO3) = 13 %wt; 4 final HNO3 amount in reaction mixture after completion.
Table 8. Oxidation of whole reaction mixture (solid + dissolved) from WAO.
EFGHI
Feed from Step 1Tbl/No4./24./24./44./44./3
DCA yield, %wt442.62.66
C conv., %434332.432.471
Step 2 i.e.,
HNO3 ox.
HNO3, mol eq. 10.30.70.30.50.7
c(HNO3)initial, %58588
c(HNO3)end, %0.62.40.61.14.4
DCA yield 2, %wt122282314
DCA yield 3, %wt1828102828
(C4-C5)/DCA, %9176858187
AA/C, %73545
C conv. 4, %5984598874
Conditions for Step 2: 140 °C and 0.5 h; 1 mol equivalents of HNO3 added per carbon (solid + dissolved) entering Step 2; 2 yield per initial carbon in starting kerogen before Step 1; 3 yield per carbon in feed (solid and liquid phase) after Step 1; 4 carbon conversion after Step 2.
Table 9. Carbon balance after HNO3 oxidation from different air-oxidized batches 1.
1. Step
Tbl./No
2. Step
HNO3/C
c(HNO3), %C in
Residual, %wt
C in Diss.
Organics, %wt
C in
Volatiles, %wt
Gaseous C 2, %
4./40.581823455
4./50.582919349
4./30.781622359
1 Reaction conditions in Step 2: 0.5 h, 140 °C; 2 value calculated by difference.
Disclaimer/Publisher’s Note: The statements, opinions and data contained in all publications are solely those of the individual author(s) and contributor(s) and not of MDPI and/or the editor(s). MDPI and/or the editor(s) disclaim responsibility for any injury to people or property resulting from any ideas, methods, instructions or products referred to in the content.