Abstract
Low glycemic index (GI) cookie bars were prepared with soft wheat flour substituted with 10–50% soybean flour and 10–50% resistant starch. The effects of increased levels of soybean flour and resistant starch on the quality of low glycemic index cookie bars were investigated (i.e., moisture, cookie spread, texture (breaking force), surface color, and in vitro starch digestibility). It was found that increasing soybean flour substitution increased the breaking force, moisture, protein content, and yellowish color of the low GI cookie bars but decreased the cookie bar spread and the lightness of the cookie bars (p < 0.05). The addition of soybean flour and resistant starch by up to 50% did not significantly change the in vitro starch digestibility of the cookie bars. The overall acceptability of the cookie bars was lower when the soybean flour blend went beyond 10%. When soft wheat flour in the cookie bar formulation was replaced at the following levels (10%, 30%, and 50%) by resistant starch, the cookie spread and lightness of the cookie bars increased but the breaking force was decreased along with the yellowish color (p < 0.05). When resistant starch was combined with soft wheat flour at levels of up to 50%, this significantly increased the content of total dietary fiber and spread ratio of cookie bars. Sensorial analysis showed that resistant starch presence had an acceptable impact on overall acceptability of the low GI cookie bars. Resistant starch represents a viable dietary fiber source when substituted for 50% of soft wheat flour in formulations. While this substitution may result in increased spread ratio and decreased crispness in cookie bars, the addition of 10% soybean flour can mitigate these textural changes.
1. Introduction
Low glycemic index (GI) foods have been shown to have benefits in improving metabolic control of hyperlipidemia in type 2 diabetes patients and healthy subjects [1]. The glycemic index describes the effect of a standard amount of carbohydrate in a food on postprandial blood glucose response compared with a standard food portion, usually 50 g white bread or glucose [2]. The rate of digestion or absorption of carbohydrates in a food is important to people with diabetes, and may benefit from avoiding foods that precipitate too great a rise, or too rapid a fall, in blood glucose. The rate and amount of carbohydrate digestion can affect many physiological functions which, in turn, have diverse effects on health, including the maintenance of appropriate blood glucose levels. These effects may induce satiety [3], reduce insulin resistance in foods [4], decrease serum triacylglycerol concentration [5], and reduce colorectal cancer risks [6].
The glycemic index was negatively associated with total dietary fiber [7], protein [8], and to a lesser degree, fat [9]. Dietary fiber plays an important role in the prevention of diseases of various crop sources [10]. Increased dietary fiber consumption could be accomplished by altering dietary habits, increasing the intake of fiber-fortified foods, fiber supplements, and high-fiber foods. Fiber enrichment of common foods has the benefit of requiring fewer dietary style changes for the fast food- and convenience food-eating population [11].
Soybean (Glycine max) has, since ancient times, been one of the important nutritional crops. Asian people consume more than 20–80 g of soy foods every day [12]. In recent years, soy-containing foods have been gaining popularity in the Western diet, mainly due to the health-promoting benefits of soybeans. The U.S. Food and Drug Administration (US FDA) has allowed the food industry to make the health claim, “soy protein combined with a diet low in saturated fat and dietary cholesterol may reduce the risk of coronary heart disease” on products containing more than 6.25 g of soy protein per serving [13]. Soybeans contain protein (38%), oil (18%), soluble carbohydrate (15%), fiber (15%), and minor nutrition components [14]. Few people are allergic to soy proteins [15]. A variety of health-beneficial constituents, such as antioxidants and isoflavones, unsaturated fatty acids, saponins, glycinin, and β-sitosterol, are also found in soybeans. Clinical trials have demonstrated that consuming large amounts of soybean products is negatively correlated with cardiovascular diseases and cancer [16].
Cookies are one of the most popular snack foods due to their high acceptability, long shelf-life, and extreme convenience. There has been a trend to develop cookie products containing soy protein. Moreover, resistant starch (RS), a fraction of the starch which is not rapidly digested in the small intestine and may be digested in the large intestine, contributes to a low glycemic response [17]. Resistant starch is typically quantified as part of the total dietary fiber (TDF) by the Prosky Method [18]. Resistant starch can be subdivided into five categories: RS1 (physically inaccessible starch), RS2 (resistant granules), RS3 (retrograded starch), RS4 (physically or chemically modified starch), and RS5 (starch–lipid complexes); these are also known as type I, II, III, IV, and V starches [19]. RS3 is the most resistant starch category and consists primarily of retrograded amylose produced during the cooling of gelatinized starch [20]. RS3 is stable in normal heat processing and could be used as a substitute ingredient in a wide variety of conventional food products. Most cookie products contain high amounts of sugar and fat. Consumers are seeking healthy cookies or snacks with low glycemic index when they are starving and do not have time to eat a real meal. Ready-to-eat cookie bars are a good choice to maintain blood glucose but not increase it too much. However, much less work has been carried out on the effects of soy flour and resistant starch on the quality of low glycemic index cookie bars. Therefore, the present work was undertaken.
2. Materials and Methods
2.1. Raw Materials
Soft wheat flour (12% moisture, 8% protein) was obtained from Lie Hwa Industrial Corporation (Taipei, Taiwan). Sucrose was provided by Taiwan Sugar Corporation (Tainan, Taiwan). Resistant starch (Fibersym 70) was purchased from Gemfont Corporation (Taipei, Taiwan). Soy flour (12% moisture, 35% protein, 15% fat, 10% dietary fiber) and eggs were purchased from the Li Chun Egg Products (Taoyuan City, Taiwan). Shortening (anhydrous milk fat) was provided by Uni-President Enterprises Corporation (Tainan, Taiwan).
2.2. Analytical Methods
The soy flour, soft wheat flour, whole wheat flour, resistant starch, and cookie bars were analyzed for their moisture (AACC method 44-01), ash (AACC method 08-01), crude protein (AACC method 46-12), fat (AACC method 30-25), and crude fiber (AACC method 30-10) content using standard methods [21]. Dietary fiber was determined using AOAC method 978.20 [22]. Crude fiber was performed according to AOAC methods [22]. Water-holding capacity (WHC) was analyzed according to the method described by Rodrigez-Ambriz et al. [23], with slight modifications. Twenty-five milliliters of distilled water was added to 1 g dry sample in a test tube, and shaken at room temperature for 20 min. The tubes were centrifuged at 1356× g (3500 rpm) for 15 min and then the supernatant was decanted. The residue was weighed and the WHC calculated as g water per g dry sample [23].
Color values (L, a, and b) were obtained by a Color Analyzer (TC-180 MK II, Tokyo Denshoku Co., Ltd., Tokyo, Japan). Results are expressed as a tri-stimulus value (L: lightness scale 100 = pure white; 0 = black), a value (red −a = greenness, +a = redness), and b value (yellow −b = blueness, +b = yellowness) of the Hunter color scale. A white standard plate (X = 93.28; Y = 95.12; Z = 113.14) was used for calibration. The whiteness index = 100 − ((100 − L)2 + a2 + b2)1/2 of the cookie bars was calculated. The color difference ΔE = [(ΔL)2 + (Δa)2 + (Δb)2]1/2 where ΔL = Lsample − Lcontrol; Δa = asample − acontrol; Δb = bsample − bcontrol. Five measurements on the top surface of the cookie bars were taken and reported as an average.
2.3. Cookie Bar Preparation
The control cookie bar formulation contained the following ingredients at the indicated levels: soft wheat flour, 200 g; sucrose, 60 g; shortening (anhydrous milk butter, Uni-President, Tainan, Taiwan), 80 g; and whole eggs, 50 g. Shortening was mixed with sugar in a mixer with a paddle attachment (Kitchen Aid) for 30 s at low speed and then for 2 min at medium speed until a cream was formed; whole eggs were gradually added to the cream for 1 min at medium speed. The flour was sifted and mixed for 4 min at low speed. The dough was divided into 30 g aliquots and manually molded into a rectangular shape (35 × 50 × 15 mm), using a 15 mm high frame.
The 10%, 30%, and 50% of soft wheat flour used were replaced with soy flour or resistant starch. The cookie bars were transferred onto the baking pans and baked in a circulation oven at 170 °C (top)/125 °C (bottom) for 16 min. The cookie bars were cooled to room temperature for 40 min and stored in plastic boxes prior to analysis. The width (W), length (L), and stack height (T) of six cookie bars were calculated according to AACC method 10-53 [21].
2.4. Properties of Cookie Bars
The texture of the cookie bars was measured using a TA-XT2 Texture Analyzer (Model TA-XT2, Stable Micro Ltd., Haslemere, UK) and a “measure force in compression” test was carried out with a sharp blade cutting probe. The analyzer was set at a “return to start” cycle, a speed of 10 mm/s, and a distance of 20 mm. A force–penetration distance diagram was taken for every test. Measurements were conducted 6 times and the results are expressed as mean values. Breaking force and the work of cutting of the cookie bars were estimated by the maximum breaking force (g) and the value of breaking force multiplied by the cutting point curve, respectively.
The in vitro starch digestibility of the cookie bars (0.1 g) was measured following the method described by Dhingra and Jood [24] by using 1 U alpha-D-glucosidase from yeast (Sigma G-5003, St. Louis, MO, USA) and 25 U alpha-amylase from porcine pancreas (Sigma A-3176) in 5 mL phosphate buffer (pH 6.7) incubated at 37 °C for 2 h. Liberated reducing sugar was determined colorimetrically by employing a dinitro-salicylic acid reagent [25].
Sensory analysis of the cookie bars was conducted by a fifteen-member trained panel who were employees of the food processing plant. Sensory attributes of cookie bar appearance, sweetness, hardness, flavor, and overall acceptance were rated on a 0–8 intensity scale where 0 = lowest score and 8 = highest score. In a preliminary training session, the fifteen panelists defined the important attributes of commercial cookie bars, selected the type of hedonic scale, and were trained to define the intensity terms for each attribute. The panelists were trained to judge sweetness and hardness intensity of commercial cookie bars in formulated cookie bars. Once the panelists were familiar with the appearance, flavor, and hardness attributes, they were asked to evaluate three commercially available cookie bar products, which all claimed to be low GI cookie bars. Total calories were in the range of 417 to 494 Kcal/100 g. Protein was in the range of 8.75 to 16 g/100 g. Total fat was in the range of 15 to 27 g/100 g. Total carbohydrate was in the range of 39.3 to 66.7%. Dietary fiber was in the range of 2.9% to 11.3% on their nutrition labels.
Samples were covered and identified by a three-digit random code and kept in plastic boxes before evaluation. Commercial cookie bars were evaluated for their appearance, flavor, sweetness, hardness, and overall acceptance using a hedonic 8-point scale (0 = extremely dislike, 4 = neither like nor dislike, 8 = extremely like). Panelists evaluated the cookie bars in a controlled testing area and were instructed to rinse their mouths with water between samples to minimize any residual effect. All cookie bar sensory evaluation in this research followed the Human Subjects Research Act. Ingredients used for preparing cookie bars were all food-grade. The sensory evaluation for cookie bar samples was classified as no risk. Consent information was obtained from all panelists who ate cookie bars for sensory evaluation. Panelists were given a detail information sheet before participating in this study. They were asked to read the consent information and signed the statement. The panelists could quit the study at any time if they did not feel well. Panelists signed written informed consent to publish this manuscript. All of the data are expressed as the mean of fifteen determinations. The panelists concerned with the commercial cookie bar test were recruited to undertake the sensory evaluation of the low GI cookie bar test. Each panelist evaluated 5 samples in a one-day session. Each panelist evaluated test samples using an intensity score sheet developed by the same panel. For each sample, panelists first judged appearance and flavor intensity. Three cookie bars were presented to evaluate the sweetness and hardness attributes. Then the sensory overall acceptance was evaluated.
2.5. Statistical Analysis
The results presented are based on the analysis of at least three repetition samples of cookie bars and the average of five measurements of each sample for each parameter. All of the results were tested using ANOVA. The difference between means at a 5% significance level (p < 0.05) was determined using Duncan’s multiple range tests. Linear correlations of different functional properties and the test data were determined by Pearson’s correlation at a significance level of 0.05. All statistical analyses were performed using the SPSS program version 12.0 (SPSS Inc., Chicago, IL, USA).
3. Results
The composition of resistant starch, soy flour, and soft wheat flour is shown in Table 1. The soy flour had a high protein and crude fiber content. The substitution of soft wheat flour with soy flour greatly improved the level of quality protein and dietary fiber in the low glycemic index cookies. Based on the water-holding capacity data shown in Table 1, soy flour was more effective in binding water than the soft wheat flour and resistant starch (p < 0.05). The effect of substituting soft wheat flour with soy flour and resistant starch on moisture levels and the cookie bar spreads is given in Table 2.

Table 1.
Proximate composition a of resistant starch, soy flour, and soft wheat flour.
Table 2.
Effect of substitution with soy flour and resistant starch on moisture and geometry of cookie bars.
The effect of soft wheat flour replaced with soy flour on the textural properties of the cookie bars is shown in Table 3. The maximum force required to snap the cookie bars increased with the addition of soy flour. The amount of soy flour used to replace soft wheat flour in the cookie bars significantly affected the texture of the cookie bars, as evidenced by the maximum breaking force and the work required to break the cookie bars. This was in accordance with previous studies that observed the effect of protein on the breaking strength of the cookie bars.
Table 3.
Effect of substitution with soy flour and resistant starch on textural characteristics of the cookie bars.
The top surface color of the cookie bars had lower lightness (L), reddish coloration (a), and whiteness index as the amount of soy flour increased in the formulation (Table 4). The b value of the top surface of the cookie bars made with blends containing increasing amounts of soy flour increased significantly. Every increment in the amount of soft wheat flour replacement resulted in cookie bars with a significantly more intense top surface color.
Table 4.
Effect of substitution with soybean flour and resistant starch on the top surface color of the cookie bars.
Starch digestibility (in vitro) of the control cookie bar and the soft wheat flour substituted with soy flour and resistant starch cookie bars are presented in Table 5. The in vitro starch digestibility did not show a significant decrease (p > 0.05) at the 50% level in the cookie bars made from soy flour replaced by soft wheat flour (32.57 mg glucose released/g sample) compared with cookie bars containing sucrose (42.37 mg glucose released/g sample).
Table 5.
Effect of substitution with soy flour and resistant starch on the release of glucose (reducing sugar) in vitro starch digestibility of cookie bars.
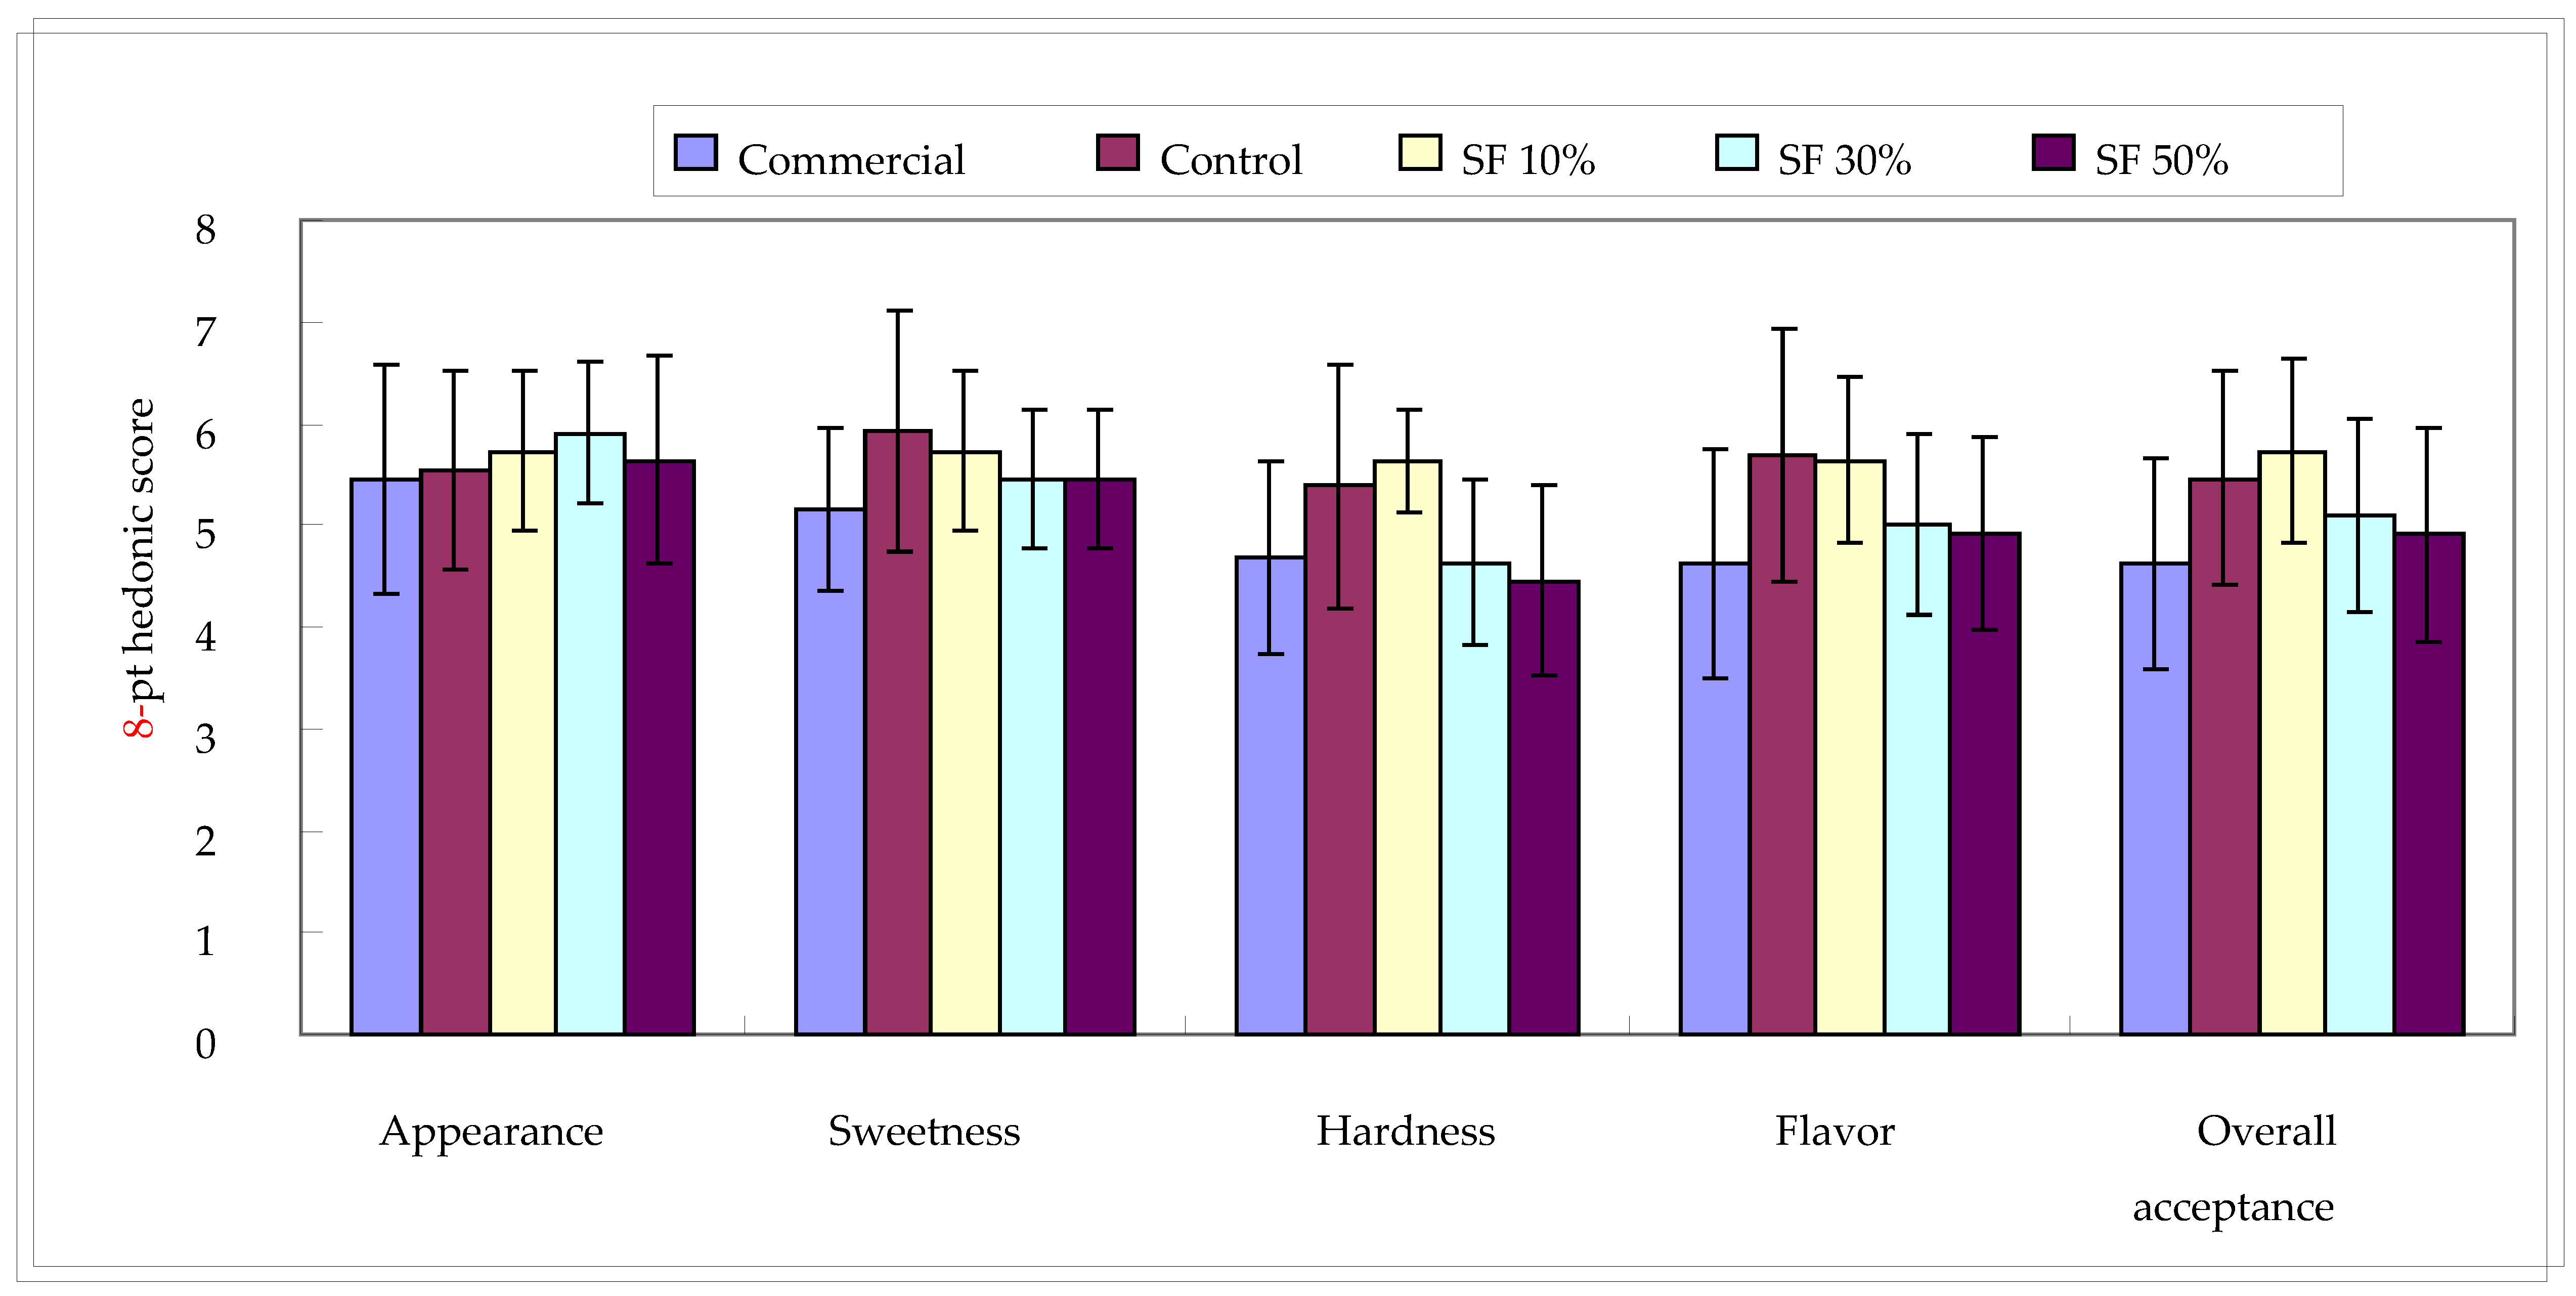
The cookie bars substituted with added 50% resistant starch and 10% soybean flour received acceptable scores from the taste panelists (Figure 1 and Figure 2). Cookie bars containing 10% soy flour and up to 50% resistant starch, demonstrated a low glycemic response, and could provide more choice of low GI snacks to the consumer in the cookie industry.
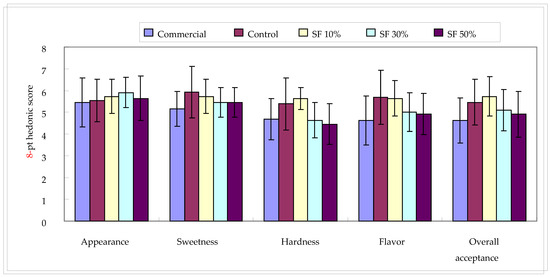
Figure 1.
Sensory evaluation of low GI cookie bars substituted with soy flour (SF) in eight-point hedonic score. Data are mean value of fifteen panelists.
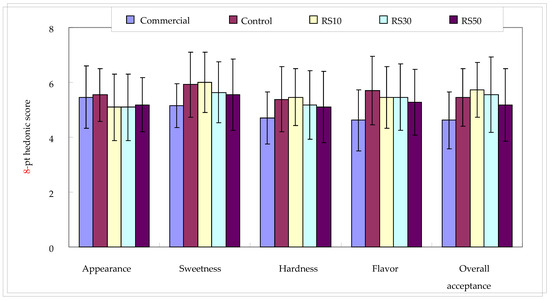
Figure 2.
Sensory evaluation of low GI cookie bars substituted with resistant starch (RS) in eight-point hedonic score. Data are mean value of fifteen panelists.
4. Discussion
Lysine is the first limiting amino acid in soft wheat flour but not in soy flour. When soft wheat flour was mixed with soy flour, the quality score and amount of the composite proteins and crude fiber was found to be much higher than in the conventional cookie recipe [26]. Resistant starch is low in protein and is usually quantified as part of the total dietary fiber (>70%). It typically remains undigested until it is somewhat fermented in the colon: the metabolism of RS occurs 5–7 h after eating [27], compared to traditionally gelatinized starch in cookies which is digested almost immediately. Incorporating RS into low GI cookies would benefit diabetics and health subjects by lowering blood glucose and prolonging satiety.
Singh and Mohamed [28] reported, using Farinograph curves, that flour substitution with soy protein isolates resulted in higher water absorption. Our results were in agreement with Zhou et al. [29] who reported that the greater the protein content, the greater the level of water absorption. Aleem Zaker et al. [30] also reported crumbly and dried dough with 20% and 30% substitution of wheat flour with only soy flour.
The spread of the cookie is mainly influenced by two factors: gravitational flow and expansion of the dough by leavening [31]. The rate of flow of various types of dough is mainly affected by the viscosity of the dough, as gravity is mostly constant. As more of the water is held by the soy flour, less water is accessible to dissolve the soluble ingredients, and as a result the viscosity is higher and the cookie spreads less. Therefore, high-quality cookie flour should not absorb water well [32]. Soy flour has a higher fiber content, protein content, and water-holding capacity and it absorbs more water than soft wheat flour does (Table 1), which decreases the moisture absorbed by sucrose and soft wheat starch. It also decreases the degree of starch gelatinization and mitigates the cookie bar spread ratio; consequently, the incorporation of soy flour also significantly increases the moisture content of the cookie bar (Table 2). Cookie bars containing a high portion of soy flour (poor-quality flour) spread at a slower rate and can support their own weight against structural collapse under gravitational force. Therefore, the thickness of the cookie bar increased with the addition of soy flour while the length and width of cookie bar decreased (Table 2). In a study conducted by Lee and Inglett [33], shortening was replaced with jet-cooked oat bran to reduce caloric content in cookies. Their findings indicated that this substitution resulted in a decrease in both the spread ratio and diameter of the cookies, while simultaneously increasing the height of the baked product.
Both soft wheat flour and resistant starch had similar water-holding capacities (Table 1), whereas the moisture content of the cookie bars did not show any significant differences when soft wheat flour was replaced with resistant starch (Table 2). Zoulias et al. [34] reported that cookies showed a substantial increase in diameter after baking due to low gluten content and the strength of the soft wheat flour, which formed a collapsible film instead of an elastic network. Cookies expanded followed by a collapse during baking, while the elastic network exhibited an elastic shrinkage after expansion and therefore no abrupt increase in diameter. A higher flow rate was observed for 50% resistant starch replacing soft wheat flour due to the lower viscosity of the relevant dough and was attributed to low gluten content and the strength of the composite dough (Table 2).
McWatters et al. [35] reported that the harder texture of the cookies was due to the increased protein content. Nogueira and Steel [36] claimed composite flours form dough with more hydrophilic sites, and therefore compete for free water in the cookie dough. Increasing the water content in proportion to water absorption could result in better mixing of the dough and a harder cookie texture with less cookie spread. The addition of soy flour to replace soft wheat flour generally resulted in significant (p < 0.05) increases in maximum breaking force. The pressure required to cut the cookies was defined as the maximum breaking force either at the point where the slope of the curve changed suddenly or at the first peak on the force deformation curve. The cutting point was estimated as the distance between the first touch of the probe on the cookie surface and the failure point. Current results showed that soy flour could impart a firm yet brittle texture to the cookie structure. This effect can likely be attributed to the denaturation of soy protein during the baking process, resulting in a firm, crisp texture. In contrast, cookie bars made from soft wheat flour exhibit a different consistency due to the partial gelatinization of wheat starch.
The maximum breaking force required to snap the cookie bars markedly decreased with the addition of resistant starch up to levels of 30% (Table 3). The softer texture of the composite cookie bars substituted with resistant starch was due to the decreased protein content and less interaction during dough development and baking.
Tang and Liu [37] declared that the darker crust color may be due to the Maillard reaction between protein and reducing sugars. The color of the top surface of cookie bars followed a reverse trend, as the lightness and whiteness index of the cookie bars were substituted by the increasing amount of resistant starch (Table 4). The cookie bar with sucrose addition after baking had higher b value compared with that of the cookie bar with sucrose addition. And the E between the cookie bars with and without sucrose addition was 3.51, which indicated that consumers might be able to tell the color difference between these two products. This might have been due to the addition of sucrose generating more Maillard reaction after baking and making the b value was higher and the L value lower (Table 4). However, the addition of soy flour increased the b values of cookie bars and decreased the L values and whiteness index of the cookie bars. And the E between cookie bar with 50% soy flour substituted and the control cookie bar with sucrose addition was 7.03, which indicated that consumers might find it easy to tell the color difference between these sample. The substitution of resistant starch significantly increased the L values and whiteness index, and it decreased the b values of cookie bars. This is because the color of resistant starch is white. All Es of the groups of cookie bars with addition of resistant starch, compared to the control cookie bar with sucrose addition, were higher than 4, which indicated the consumers could easily tell the color difference between these products.
Dhingra and Jood [24] also reported low starch digestibility in whole-wheat bread (42.8 mg maltose released/g sample) substituted with soybean flour or defat soybean flour, which is similar to that of the control cookie bar. Upon blending with soy flours, the in vitro starch digestibility of the fat and protein content in the cookie bar increased dramatically while starch digestibility decreased slightly (p > 0.05). This could be a result of some factors such as the presence and activity of non-digestible components of soybean such as phytic acid, polyphenols, amylase, and trypsin inhibitors [37]. Holm et al. [38] suggested that protein might encapsulate starch and hinder the enzyme accessibility [38]. Jenkins et al. [39] also reported that protein–starch interactions in wheat bread could reduce the total digestibility of starch and the glycemic response. However, there was no significant difference in the in vitro starch digestibility of soy flour- and resistant starch-substituted cookie bars at different levels (p > 0.05). Low starch digestibility of soy flour- and resistant starch-substituted cookie bars and whole wheat cookie bar was observed in this experiment compared with digestibility of commercial low GI cookie bars (164.33 mg maltose released/g sample) and white bread (267.37 mg maltose released/g sample). In vitro starch digestion methodologies have been implemented as an alternative to in vivo starch digestion assessments, which represent resource-intensive procedures requiring substantial human subject participation and are influenced by various individual-specific factors [40]. Starch classifications have been established based on digestion kinetics and extent, comprising three distinct categories: rapidly digested starch, slowly digested starch, and resistant starch [40]. The starch digestibility of the control cookie bar in this study was not significantly different to that of cookies made of soft wheat flour substituted with 50% soy flour and 50% resistant starch, but lower than that of commercial low GI cookie bars and white bread (Table 5).
Compared to the control group, no significant difference was found in all sensory attributes in cookie bars that had replacement soy flour levels of up to 50%. However, all attributes of cookie bars increased on increasing the level of soy flour up to the 10% level, indicating better attribute rating, and thereafter it decreased at 30% and 50% levels of replacement. Panelists claimed the beany flavor could be identified but it was still acceptable with levels of up to 50% of soy flour. Dhingra and Jood [24] reported that the beany flavor mainly came from the soy flour. The cookie bar texture score also decreased with an increase in the substitution of soy flour for soft wheat flour compared with the control cookie bar. Among the five cookie bar samples (Figure 1), maximum overall acceptance was located at 10% level of soy flour replacement. Increasing fiber amounts has frequently resulted in decreased spread values and undesirable changes in sensory properties of cookies [41]. The addition of resistant starch up to 30% reduced the hardness value of the cookie bars and increased the cookie bar spreads (Table 2). This effect may be attributed to the substitution of resistant starch, which diluted the gluten content in the soft wheat flour used for cookie bars. Consequently, this substitution resulted in a significant reduction in breaking force (Table 3) and an increase in both the length and width dimensions of the cookie bars (Table 2). The results of starch digestibility were negatively correlated with breaking point (p < 0.05), thickness (p < 0.01), and work of breaking (p < 0.05) of cookie bars. It indicated that the compact structure of cookie bars influenced the starch digestibility, although all samples were ground before the test. This might explain why the starch digestibility of cookie bars in this study was higher than that of commercial low GI cookie bars and white bread (Table 5).
5. Conclusions
This study demonstrates that soybean flour and resistant starch have good functional properties with soft wheat flour and can improve the nutritional and sensorial characteristics of low glycemic index cookie bars. It may be concluded that low glycemic index cookie bars substituted with soybean flour, up to a 10% level, are sensory and nutritionally acceptable. Soybean flour could increase protein content and make the texture crispy and harder by decreasing the spread ratio of cookie bars. When resistant starch was combined with soft wheat flour up to 50%, this significantly increased the content of total dietary fiber and cookie bar spread in low GI cookie bar products, and their texture became less crispy. The low GI cookie bar recipe was suggested by substituting soft wheat flour with 10% soy flour and 50% resistant starch to increase the cookie bar qualities. The cookie bars containing 15% sucrose could be substituted with maltitol to decrease the calorie and hardness of the low GI cookie bars in the future.
Author Contributions
Conceptualization, W.-C.S., J.-S.T. and H.-T.V.L.; methodology, J.-S.T., H.-T.V.L. and G.-L.Y.; formal analysis, G.-L.Y.; writing—original draft preparation, J.-S.T. and H.-T.V.L.; writing—review and editing, W.-C.S.; investigation, W.-C.S. and H.-T.V.L.; resources, W.-C.S. All authors have read and agreed to the published version of the manuscript.
Funding
The authors are appreciative of the financial support provided by the Center of Excellence for the Oceans, National Taiwan Ocean University.
Data Availability Statement
The original contributions presented in this study are included in the article. Further inquiries can be directed to the corresponding author.
Acknowledgments
All authors would like to thank the Center of Excellence for the Oceans of National Taiwan Ocean University, which financed this experiment.
Conflicts of Interest
The authors declare no conflicts of interest.
References
- Vlachos, D.; Malisova, S.; Lindberg, F.A.; Karaniki, G. Glycemic index (GI) or glycemic load (GL) and dietary interventions for optimizing postprandial hyperglycemia in patients with T2 diabetes: A review. Nutrients 2020, 12, 1561. [Google Scholar] [CrossRef]
- Meng, H.; Matthan, N.R.; Ausman, L.M.; Lichtenstein, A.H. Effect of prior meal macronutrient composition on postprandial glycemic responses and glycemic index and glycemic load value determinations. Am. J. Clin. Nutr. 2017, 106, 1246–1251. [Google Scholar] [CrossRef]
- Holesh, J.E.; Aslam, S.; Martin, A. Physiology, Carbohydrates. In StatPearls; StatPearls Publishing: Treasure Island, FL, USA, 2023. [Google Scholar]
- Parker, A.; Kim, Y. The effect of low glycemic index and glycemic load diets on hepatic fat mass, insulin resistance, and blood lipid panels individual with nonalcoholic fatty liver disease. Meta. Syndr. Relat. Disord. 2019, 17, 389–396. [Google Scholar] [CrossRef] [PubMed]
- Volek, J.S.; Fernandez, M.L.; Feinman, P.D.; Phinney, S.D. Dietary carbohydrate restriction induces a unique metabolic state positively affecting atherogenic dyslipidemia, fatty acid partitioning, and metabolic syndrome. Prog. Lipid Res. 2008, 47, 307–318. [Google Scholar] [CrossRef]
- Fawaid As’ad, M.R.; Sari, G.M.; Othman, Z.; Herawati, L. The combination of intermittent caloric restriction and moderate-intensity interval training in decreasing blood glucose and CRP levels with a high glycemic index diet. Kuwait J. Sci. 2022, 49, 1–11. [Google Scholar] [CrossRef]
- Zhou, Z.; Ye, F.; Lei, L.; Zhou, S.; Zhao, G. Fabricating low glycaemic index foods: Enlightened by the impacts of soluble dietary fibre on starch digestibility. Trends Food Sci. Technol. 2022, 122, 110–122. [Google Scholar] [CrossRef]
- Pineli, L.d.O.; Botelho, R.B.A.; Zandonadi, R.P.; Solorzano, J.L.; de Oliveira, G.T.; Reis, C.E.G.; Teixeira, D.d.S. Low glycemic index and increased protein content in a novel quinoa milk. LWT-Food Sci. Technol. 2015, 63, 1261–1267. [Google Scholar] [CrossRef]
- Basset-Sagarminaga, J.; Roumans, K.H.M.; Havekes, B.; Mensink, R.P.; Peters, H.P.F.; Zock, P.L.; de Mutsert, R.; Boren, J.; Lindeboon, L.; Schrauwen, P.; et al. Replacing foods with a high-glycemic index and high in saturated fat by alternatives with a low glycemic index and low saturated fat reduces hepatic fat, even in isocaloric and macronutrient matched conditions. Nutrients 2023, 15, 735. [Google Scholar] [CrossRef]
- Rodriguez, R.; Jimenez, A.; Fernandez-Bolanos, J.; Guillen, R.; Heredia, A. Dietary fibre from vegetable products as source of functional ingredients. Trends Food Sci. Technol. 2006, 17, 3–15. [Google Scholar] [CrossRef]
- Xu, X.; Zhang, X.; Sun, M.; Li, D.; Hua, M.; Miao, X.; Su, Y.; Chi, Y.; Wang, J.; Niu, H. Optimization of mixed fermentation conditions of dietary fiber from soybean residue and the effect on structure, properties and potential biological activity of dietary fiber from soybean residue. Molecules 2023, 28, 1322. [Google Scholar] [CrossRef]
- Rizzo, G.; Baroni, L. Soy, soy foods and their role in vegetarian diets. Nutrients 2018, 10, 43. [Google Scholar] [CrossRef] [PubMed]
- Food and Drug Administration. 21 CFR part 101. Food labeling: Health claims: Soy protein and coronary heart disease. Fed. Reg. 2017, 82, 50324. [Google Scholar]
- Van Ee, J.H. Soy constituents: Modes of action in low-density lipoprotein management. Nutr. Rev. 2009, 67, 222–234. [Google Scholar] [CrossRef]
- Wiederstein, M.; Baumgartner, S.; Lauter, K. Soybean (Glycine max) allergens—A Review on an Outstanding Plant Food with Allergenic Potentia. ACS Food Sci. Technol. 2023, 3, 363–378. [Google Scholar] [CrossRef]
- Zhang, M.; Wang, L.; Chen, L.; Yin, B.; Song, Y. Is phytoestrogen intake associated with decreased risk of prostate cancer? A systematic review of epidemiological studies based on 17,546 cases. Andrology 2016, 4, 745–756. [Google Scholar] [CrossRef]
- Jia, H.; Ren, F.; Liu, H. Development of low glycemic index food products with wheat resistant starch: A review. Carbohydr. Polym. 2025, 361, 123637. [Google Scholar] [CrossRef]
- Maningat, C.C.; Seib, P.A.; Bassi, S.D. Resistant starch is typically quantified as part of the total dietary fibre (TDF) by the Prosky Method. Cereal Foods World 2013, 58, 252–263. [Google Scholar] [CrossRef]
- Dobranowski, P.A.; Stintzi, A. Resistant starch, microbiome, and precision modulation. Gut Microbes 2021, 13, 1926842. [Google Scholar] [CrossRef]
- Sajilata, M.G.; Singhal, R.S.; Kulkarni, P.R. Resistant starch—A review. Compr. Rev. Food Sci. Food Saf. 2006, 5, 1–17. [Google Scholar] [CrossRef]
- American Association of Cereal Chemists (AACC). Approved Methods of the AACC, 8th ed.; Method 44-01, Method 08-01, Method 46-12, Method 30-25; The Association: St. Paul, MN, USA, 1990. [Google Scholar]
- Association of Official Analytical Chemists (AOAC). Official Methods of Analysis; Method 978.20; Association of Official Analytical Chemists: Washington, DC, USA, 1995. [Google Scholar]
- Rodriguez-Ambriz, S.L.; Islas-Hernandez, J.J.; Agama-Acevedo, E.; Tovar, J.; Bello-Perez, L.A. Characterization of fiber-rich powder prepared by liquefaction of unripe banana flour. Food Chem. 2008, 107, 1515–1521. [Google Scholar] [CrossRef]
- Dhingra, S.; Jood, S. Organoleptic and nutritional evaluation of wheat breads supplemented with soybean and barley flour. Food Chem. 2001, 77, 479–488. [Google Scholar] [CrossRef]
- Singh, U.; Khedekar, M.S.; Jambunathan, R. Studies on desi and kabuli chickpea cultivars. The level of amylase inhibitors, level of oligosaccharides and in vitro starch digestibility. J. Food Sci. Technol. 1982, 47, 510. [Google Scholar]
- Adeyeye, S.A.O. Quality Evaluation and Acceptability of Cookies Produced From Rice (Oryza glaberrima) and Soybeans (Glycine max) Flour Blends. J. Culin. Sci. Technol. 2020, 18, 54–66. [Google Scholar] [CrossRef]
- Muir, J.G.; Lu, Z.X.; Young, G.P.; Cameron-Smith, D.; Collier, G.R.; O’Dea, K. Resistant starch in the diet increases breath hydrogen and serum acetate in human subjects. Am. J. Clin. Nutr. 1995, 61, 792–799. [Google Scholar] [CrossRef]
- Singh, M.; Mohamed, A. Influence of gluten-soy protein blends on the quality of reduced carbohydrates cookies. LWT-Food Sci. Technol. 2007, 40, 353–360. [Google Scholar] [CrossRef]
- Zhou, J.; Liu, J.; Tang, X. Effects of whey and soy protein addition on bread rheological property of wheat flour. J. Texture Stud. 2018, 49, 38–46. [Google Scholar] [CrossRef]
- Aleem Zaker, M.D.; Genitha, T.R.; Syed, I.H. Effects of defatted soy flour incorporation on physical, sensorial and nutritional properties of biscuits. J. Food Process Technol. 2012, 3, 100149. [Google Scholar] [CrossRef]
- HadiNezhad, M.; Butler, F. Effect of flour type and dough rheological properties on cookie spread measured dynamically during baking. J. Cereal Sci. 2009, 49, 38–46. [Google Scholar] [CrossRef]
- Hoseney, R.C.; Rogers, D.E. Mechanism of sugar functionality in cookies. In The Science of Cookie and Cracker Production; Faridi, H., Ed.; Chapman and Hall: New York, NY, USA, 1994; pp. 203–205. [Google Scholar]
- Lee, S.; Inglett, G.E. Rheological and physical evaluation of jet-cooked oat bran in low calorie cookies. Int. J. Food Sci. Technol. 2006, 41, 553–559. [Google Scholar] [CrossRef]
- Zoulias, E.I.; Piknis, S.; Oreopoulou, V. Effect of sugar replacement by polyols and acesulfame-K on properties of low-fat cookies. J. Sci. Food Agric. 2000, 80, 2049–2056. [Google Scholar] [CrossRef]
- McWattewrs, K.H.; Ouedraogo, J.B.; Resurreccion, V.A.; Hung, Y.C.; Phillips, R.D. Physical and sensory characteristics of sugar cookies containing a mixture of fonio (Digitaria exilis) and cowpea (Vigina unguiculata) flours. Int. J. Food Sci. Technol. 2003, 38, 403–410. [Google Scholar] [CrossRef]
- Nogueira, A.C.; Steel, C.J. Protein enrichment of biscuits: A review. Food Rev. Int. 2018, 34, 796–809. [Google Scholar] [CrossRef]
- Tang, X.; Liu, J. A comparative study of partial replacement of wheat flour with whey and soy protein on rheological properties of dough and cookie quality. J. Food Qual. 2017, 2618020. [Google Scholar] [CrossRef]
- Holm, J.; Hagander, B.; Bjorck, I.; Eliasson, A.C.; Lundquist, I. The effect of various thermal processes on the glycemic response to whole grain wheat products in humans and rats. J. Nutr. 1989, 119, 1631–1638. [Google Scholar] [CrossRef]
- Jenkins, D.J.A.; Thorne, M.J.; Wolever, T.M.S.; Jenkins, A.L.; Rao, A.V.; Thompson, L.U. The effect of starch-protein interaction in wheat on the glycemic response and rate of in vitro digestion. Am. J. Clin. Nutr. 1987, 45, 946–951. [Google Scholar] [CrossRef] [PubMed]
- Dona, A.C.; Pages, G.; Gilbert, R.G.; Kuchel, P.W. Digestion of starch: In vivo and in vitro kinetic models used to characterise oligosaccharide or glucose release. Carbohydr. Polym. 2010, 80, 599–617. [Google Scholar] [CrossRef]
- Uysal, H.; Bilgicli, N.; Elgun, A.; Ibanoglu, S.; Herken, E.N.; Demir, M.K. Effect of dietary fiber and xylanase enzyme addition on the selected properties of wire-cut cookies. J. Food Eng. 2007, 78, 1074–1078. [Google Scholar] [CrossRef]

Disclaimer/Publisher’s Note: The statements, opinions and data contained in all publications are solely those of the individual author(s) and contributor(s) and not of MDPI and/or the editor(s). MDPI and/or the editor(s) disclaim responsibility for any injury to people or property resulting from any ideas, methods, instructions or products referred to in the content. |
© 2025 by the authors. Licensee MDPI, Basel, Switzerland. This article is an open access article distributed under the terms and conditions of the Creative Commons Attribution (CC BY) license (https://creativecommons.org/licenses/by/4.0/).