Abstract
Considering the serious hazard of respiratory dust in underground coal mines and the low efficiency of traditional dust-reduction technology, this study optimizes the atomisation parameters of the gas–liquid two-phase flow nozzle through numerical simulation and experimental testing, and designs an on-board dust-reduction system. Based on the Fluent software (version 2023 R2), a flow field model outside the nozzle was established, and the effects of the air supply pressure, gas-phase inlet velocity, and droplet mass flow rate on the atomisation characteristics were analyzed. The results show that increasing the air supply pressure can effectively reduce the droplet particle size and increase the range and atomisation angle, and that the dust-reduction efficiency is significantly improved with the increase in pressure. The dust-reduction efficiency reached 69.3% at 0.6 MPa, which was the economically optimal operating condition. Based on the parameter optimization, this study designed an annular airborne gas–liquid two-phase flow dust-reduction system, and a field test showed that the dust-reduction efficiency of this system could reach up to 86.0%, which is 53.5% higher than that of traditional high-pressure spraying, and that the dust concentration was reduced to less than 6 mg/m3. This study provides an efficient and reliable technical solution for the management of underground coal mine dust and guidance for promoting the development of the coal industry.
1. Introduction
At present, coal is still the main source of energy in China. The number of existing coal miners in China is large, and the coal industry is also one of the most frequent areas of safety accidents in China [1]. Coal dust is generated in many aspects of coal mining and is highly susceptible to explosions [2]. With underground ventilation, the probability of explosion accidents is relatively reduced, but coal dust explosion accidents that occur underground due to unauthorized operation are common [3]. In China, the incidence and number of deaths of pneumoconiosis caused by coal dust are among the highest in the world, seriously endangering the physical and mental health of patients.
Currently, domestic and international experts have conducted numerous studies on dust control in coal mine shafts, proposing various dust-suppression methods, including pre-water injection into coal bodies, dust collectors, and spray dust-suppression technology. However, the research on gas–liquid two-phase flow spray dust-suppression technology remains relatively limited [4,5,6]. Traditional high-pressure spray technology, due to its larger droplet size, struggles to effectively capture respirable dust, with an overall dust suppression efficiency that is generally below 50% [7]. Field test data show that conventional high-pressure spraying achieves a dust-suppression efficiency of only 32.5% to 43.0% at underground driver positions, and it has high energy consumption and limited coverage, failing to meet the requirements for efficient dust-suppression [8,9].
In contrast, gas–liquid two-phase flow spray technology uses high-speed gas flow to break down droplets, producing micro-fine droplets that significantly enhance the process’s dust capture efficiency. This technology utilises high-speed gas flow to impact water flow, which promotes fine water atomisation and forms micro-fine water mist, thereby achieving superior dust-suppression effects. Additionally, this technology can improve high-temperature and high-humidity environments and effectively suppress explosion risks, thereby offering broad application prospects. Through systematic research and application, gas–liquid two-phase flow spray dust-suppression technology has the potential to become an important means of enhancing coal mine safety and improving working environments [10,11].
Senecal et al. [12] theoretically investigated the effect of the fluid viscosity and surface tension on the nozzle water mist breaking effect. Lan et al. [13] conducted an experimental study on spray characteristics and found that Nukiyama–Tanasawa distribution can better fit the spray droplet size in testing. Jobehdar et al. [14] developed a new type of nozzle, and the results of the study showed that the new nozzle outperformed the standard nozzle in terms of liquid cross-flow. Singh et al. [15] found that it is important to consider temperature fluctuations in the design of nozzles to avoid the formation of gas hydrates. Lee et al. [16] applied water mist nozzles to extinguish fires, to study the effect of the horizontal distance from the source of fire on the effectiveness of fire extinguishing. Brykov et al. [17] found out from experimental studies that, compared to the ideal gas flow, and in contrast to the unsteady supplied nozzle, qualitative models of gas dynamics and thermal processes show the displacement of the nozzle shock wave towards the nozzle outlet in an over-expanded nozzle flow. Sun et al. [18] proposed a specially designed separator for measuring the separation of gas–liquid two-phase flow, and the study provides a valuable guide to the measurement of the flow velocity in multiphase flow. Tan Min et al. [19], through the study of the atomisation characteristics of water mist in the flow field outside the nozzle, revealed the binding effect of the airflow on the water mist, as well as the change in particle size and velocity of the water mist in the workspace, and determined the specific range in which the maximum atomized particle size occurs. Wang Pengfei, Liu Ronghua et al. [7,8,9,20,21,22], to improve the efficiency of dust reduction in underground coal mines and to improve the operating environment of coal mines, studied the relationship between the relevant influencing factors and the effect of dust reduction and came up with the relationship between the spraying pressure, water consumption, and roadway wind speed and the dust-reduction efficiency of the nozzles in underground coal mines. Guan Yuming, Han Yongjing et al. [23] analysed the change rule of the droplet size in the nozzle outflow field under different atomisation parameter configurations through numerical simulation and obtained the best atomisation parameters. Xue Wentao, Hou Maosen et al. [24] simulated the dust generation and migration process of coal mine transfer point through the test platform, and found that the dust in the transfer area was mainly respiratory dust. They also concluded that the best dust-reduction effect was achieved under the condition that the nozzle was 0.85 m away from the top of the dust source point. Akbari et al. [25] found that DQMOM was the most efficient coupled solution method. The key parameters of the fluidized bed reactor were observed using coupled computational fluid dynamics and group equilibrium equations. The effect of the wall roughness on the particle dynamics of gas-solid flow in separated and channeled flow states was investigated through numerical simulation and phase Doppler particle velocimetry experiments [26].
This study focuses on the application and optimisation of the gas–liquid two-phase flow spray dust-reduction technology, and explores the optimal dust-reduction parameters through a combination of simulation and experimentation to ascertain the impacts of underground coal mine dust on workers’ health and production safety. In this study, software was used to construct a geometric model of the flow field outside the nozzle, and numerical simulations were performed on key parameters, such as the gas-phase inlet velocity and mass flow rate. The atomisation characteristics were verified by combining the changes in the air and water pressure, and a test platform for the dust-reduction efficiency was built to analyse the influence of different parameters on the effect of dust reduction, to clarify the optimal gas–water ratio. Simultaneously, based on the atomisation mechanism of gas–liquid two-phase flow, a design of an annular airborne dust-reduction system was proposed for the first time, and the nozzle arrangement was optimized to significantly improve the system performance.
2. Model Building and Simulation Setup
2.1. Mathematical Modelling
2.1.1. Mathematical Model of Continuous Phase Turbulence
We analysed the flow characteristics of the nozzle outside the gas–liquid two-phase flow field by using the realizable k-ε equation in the SIMPLEC algorithm for continuous-phase air numerical simulation. This was done after conducting continuous-phase medium convergence and adding the discrete-phase gas–liquid two-phase flow jet source. Since the Mach number of the downhole gas flow was much less than 0.3 in this study, the gas density change rate < 0.5% is consistent with the conditions in compressible fluid. That is, in Eulerian coordinates, the continuous-phase air medium in this paper is set as an incompressible fluid, and the Realizable k-ε equation is used to describe the overall state.
Continuous equation:
In the formula, is the velocity vector, ρ is the gas density, and t is the time.
Momentum equation:
In the formula, is the stress tensor:
Time averaging the continuity equation, Equation (1), and the momentum equation, Equation (2), yields the Reynolds average continuity equation and the Reynolds average momentum equation.
Reynolds average continuity equation:
Reynolds average momentum equation:
In the formula, is the Reynolds stress tensor, which needs to be closed by a turbulence model.
The Reynolds stress introduces unknowns and needs to be closed by turbulence models. Using the hypothesis, it is correlated to the turbulent kinetic energy k and the average velocity gradient:
In the formula, is the turbulent viscosity; is the turbulent flow energy.
The equation for k is as follows:
The ε equation:
In the formula, xi, xj are x, y, and z direction coordinates (i ≠ j), m; ui, uj are the x, y, z direction velocity (i ≠ j), m/s; ρ is the gas density, kg/m3; is the laminar viscosity coefficient, Pa-s; k is the turbulence kinetic energy, m2/s2; ε is the turbulence dissipation rate, m2/s3; C1ε, C2ε, Cμ are constants, and their values are 1.44, 1.92, 0.09; is the turbulent equation Prandtl number of k, which is 1.0; is the turbulence equation Prandtl number of ε, which is 1.3; Gk is the turbulent kinetic energy generated by the laminar velocity change; Gb is the turbulent kinetic energy generated by the buoyancy; YM represents the fluctuations caused by turbulent transition diffusion. Since the continuous phase gas is an incompressible gas, this term is taken as 0; is the turbulent kinetic energy viscosity coefficient, and its equation is expressed as follows:
The above equation allows us to obtain the following:
In the formula, A0 is a constant, generally 4.04, and is the rotation rate tensor of with the angular velocity at a given set of rotation coordinates.
Therefore, the expression of the governing equation of the realizable k-ε model is as follows:
In the formula, the terms are the transient term, the convection term, the diffusion term, and the generalized source term S.
2.1.2. Discrete-Phase Mathematical Models
In the discrete phase (DPM) model, data on the interaction of particles with the air are obtained by operations. The trajectory of water mist particles is tracked using Fluent’s random orbit model. The water mist particles are subjected to a variety of forces such as gravity, buoyancy, and drag as they move through the lane, and the basic equations of particle motion are expressed as follows:
In the formula, mp is the mass of the discrete-phase unit particle, kg; Ip is the inertial phase of the discrete-phase unit particle; is the continuous-phase force on the discrete-phase droplet particles, N; is the rotational moment acting on the discrete-phase particles, N-m; d is the diameter of the discrete-phase droplet particles, m; is the velocity of the discrete-phase droplet particles, m/s; is the gas velocity of the continuous phase, m/s.
2.1.3. Selection Basis and Comparative Verification of Turbulence Model
In this paper, a realizable k-ε model is adopted, which has higher adaptability to the strong vortex tensile effect of the nozzle jet, and can more accurately capture the turbulence characteristics in high-speed swirls. In terms of atomisation diffusion prediction, the error is reduced by 15–20% compared with the standard k-ε model. At the same time, the improved turbulence equation effectively avoids the negative value of turbulent kinetic energy in the high-speed flow field, and has better numerical stability.
Under the same mesh and boundary conditions, the performance of the standard and realizable k-ε models is compared through pre-experiments, as shown in Table 1. The standard model underestimated the atomisation angle by 13.7% due to the constant , and the numerical divergence occurred in the center of the nozzle. The realizable k-ε model exhibits a significantly improved prediction accuracy due to employing a dynamic , with a maximum error of <5%. This verifies that it is suitable for gas–liquid two-phase high-speed jet simulation.

Table 1.
Pre-experimental comparison of turbulence model (gas phase inlet velocity 150 m/s, droplet mass flow rate 0.06 kg/s).
2.2. Geometrical Modelling
2.2.1. Geometrical Models
Fluent software provides five atomizing nozzle models: flat, pressure cyclone, target, air-assisted, and bubble, which can be used to study the variation in the flow field outside the nozzle. Among them, the air-atomized nozzle was selected for this study because of its excellent atomisation effect and similarity to the gas–liquid two-phase flow nozzle in coal mines. SpaceClaim 2023 R2 software was used to establish the external flow field model of the air-assisted atomizing nozzle, and the position of the spray centre was locally encrypted. The external flow field was simplified as a cylinder with a diameter of 1 m and a height of 2 m, and the nozzle was located at the centre of the bottom surface, as shown in Figure 1.
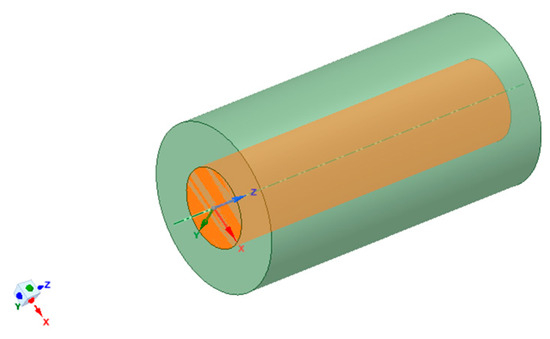
Figure 1.
Geometry of the external flow field of the atomising nozzle model.
2.2.2. Grid Division
Owing to the special characteristics of the flow field outside the nozzle, it is necessary to encrypt the geometric model as a whole and locally encrypt the central region. Using Fluent’s own meshing software, the model was divided by the meshing method, and the locally encrypted area of the outflow field was divided into a tetrahedrons 0.02 m body mesh, while the other areas were divided into a 0.05 m body mesh. The jet inlet and outlet of the outflow field and the jet wall were named. The number of generated meshes was 745,138, and the average mass was 0.931, which met the requirement of computational convergence. The mesh division of the nozzle external flow field model is shown in Figure 2.
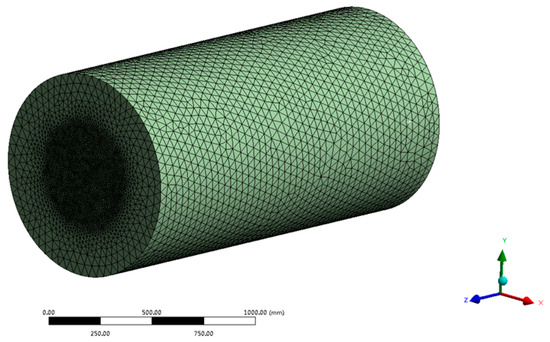
Figure 2.
Mesh model.
2.3. Mesh Verification
2.3.1. Irrelevance Verification
To verify the irrelevance grid, multiple sets of grid quantities were used for verification, and the specific verification data were plotted as a line graph, as shown in Figure 3.
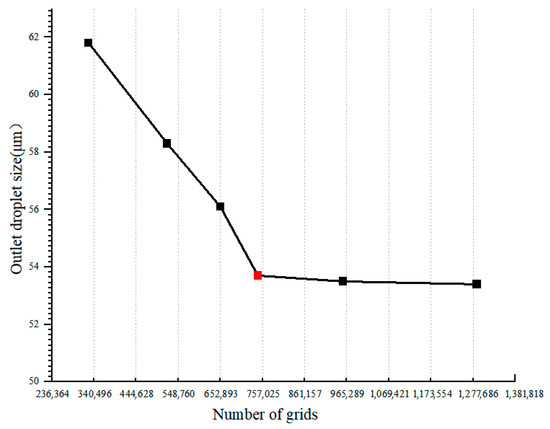
Figure 3.
Grid irrelevance verification.
When the number of grids reached 745,138, the change rate of the droplet size at the outlet was <0.5%, which met the requirement of engineering accuracy. It is sufficiently shown that, when the number of grids reaches this value and above, the simulation results are not significantly affected by the grid division, showing good grid-independence.
2.3.2. Reliability Verification
The mesh quality is a key factor that affects the reliability of numerical simulation, which is directly related to the calculation accuracy. In order to ensure the reliability of the simulation results, it is required to comprehensively evaluate the key indexes such as the mesh orthogonal quality, aspect ratio, distortion, and smoothness. The evaluation of the results is shown in Table 2.
Table 2.
Mesh evaluation results.
As can be seen from the results, the generated mesh meets the requirements of numerical simulation, and the high-quality mesh provides a reliable basis for the subsequent simulation, ensuring the accuracy and stability of the system simulation results.
2.4. Parameter Setting
Based on the actual parameters of gas–liquid two-phase flow provided by a mine and the pre-experimental treatment, the test range of the gas–liquid ratio is to set 1.2:1~1.6:1, and the atomisation angle is set to 25°. Since 100 m/s is the critical Weber number threshold for fragmentation droplets and 150 m/s is the economic boundary, the gas-phase inlet velocity is set as either 100 m/s or 150 m/s.
In the simulation calculation, the model was imported into the Fluent numerical simulation software, and the parameters of the calculation model, boundary conditions, and discrete-phase parameters were set sequentially. The specific settings are listed in Table 3.
Table 3.
Parameter settings.
3. Numerical Simulation of Water Mist Particle Atomisation in Outflow Field
Before the spray field simulation, the steady-state calculation of the gas phase flow field was carried out, and, after convergence, the DPM model was launched to simulate the change in the external flow field of the gas–liquid two-phase flow, with a focus on the analysis of the nozzle atomisation characteristics, the distribution of droplet sizes in each cross-section, and exploring the key parameters that affect the particle size.
3.1. Nozzle Atomisation Analysis at Different Moments
To further derive the effect of different atomisation parameters of the air atomisation nozzle on the external flow field of the nozzle, the number of particle beams in the simulation was set to 100, the mass flow rates of the droplets were set to 0.06 kg/s and 0.08 kg/s, and the gas-phase inlet velocities was set to 100 m/s and 150 m/s, respectively, and the external flow field spraying was observed at different moments after the spray source started spraying, as shown in Figure 4.
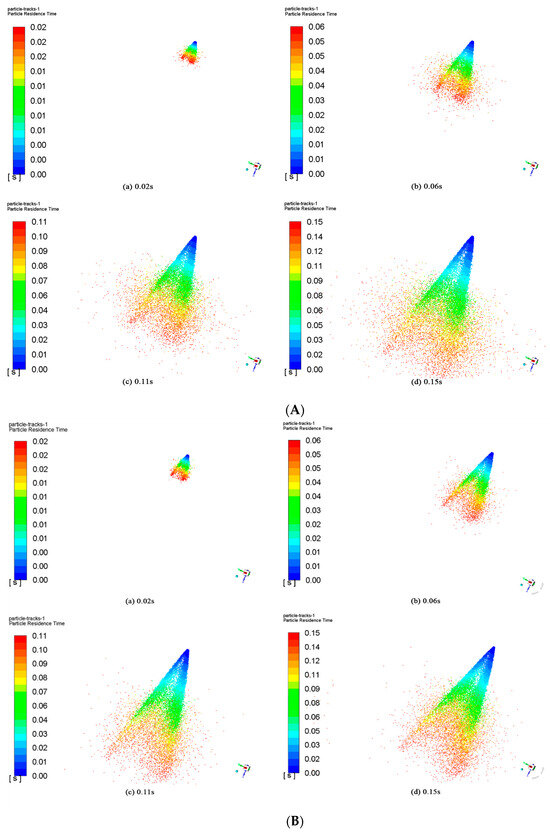
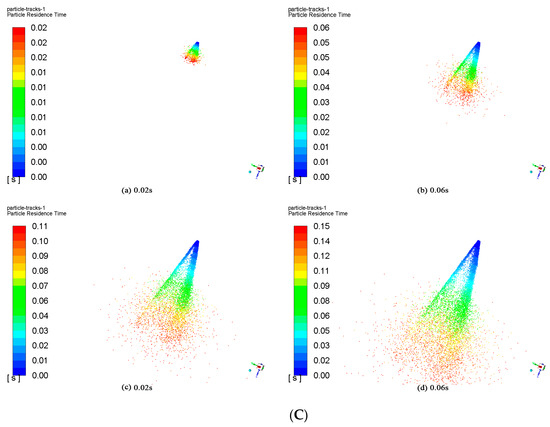
Figure 4.
Nozzle atomisation states for different inlet velocities and mass flow rates: (A) 100 m/s, 0.06 kg/s; (B) 100 m/s, 0.08 kg/s; (C) 150 m/s, 0.06 kg/s.
From Figure 4A,B, it can be seen that the atomisation pattern of the nozzle is conical spraying and that the range of the spray field expands with time. When the inlet velocity is 100 m/s and the mass flow rate is 0.06 kg/s, it reaches a better atomisation state at 0.15 s. When the mass flow rate was increased to 0.08 kg/s and the remaining parameters were kept constant, the outflow field achieved better atomisation at 0.11 s. It was revealed that increasing the mass flow rate of the droplets can promote atomisation. Increasing the mass flow rate of the gas–liquid two-phase flow droplets can accelerate the liquid-phase flow rate and increase the initial velocity of the droplets, allowing them to traverse the spray area more quickly and reach the ideal atomisation state. From Figure 4A,C, it can be seen that, when the inlet velocity is increased to 150 m/s and the rest of the parameters are unchanged, the smooth flow outside the nozzle reaches a better atomisation state in 0.15 s, which shows that changing the gas-phase inlet velocity does not affect the formation time of the atomisation state.
Figure 4C shows that the central zone of atomisation is less effective because part of the liquid stream is sprayed directly without sufficient mixing with the gas, which results in uneven atomisation. Increasing the gas-phase velocity enhances the droplet fragmentation and reduces the particle size and mass, thereby decreasing the inertia and particle concentration in the centre zone.
Numerical simulation was carried out on the following four spray states of the nozzle, and the average particle size data were extracted and counted, the results of which are shown in Figure 5.
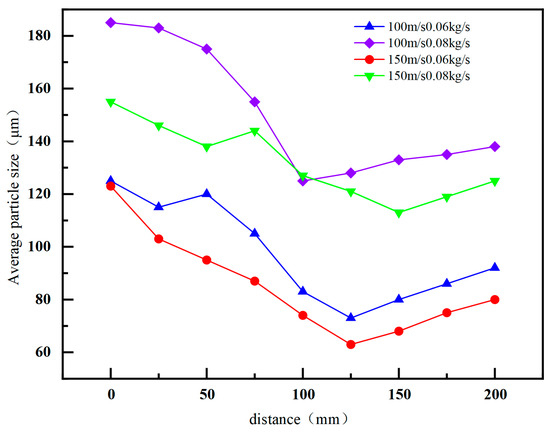
Figure 5.
Droplet size distribution under different atomisation states.
The average particle size of the droplets decreased and then increased with an increasing injection distance. When keeping the gas phase velocity at 100 m/s, the liquid mass flow rate increases from 0.06 kg/s to 0.08 kg/s, the average particle size increases by 53.1 μm, which accelerates the droplet movement and reduces the gas–liquid relative velocity due to the increase in the mass flow rate, and the atomisation effect deteriorates. When the mass flow rate was kept constant, the gas-phase velocity increased from 100 m/s to 150 m/s and the average particle size decreased, which indicated that increasing the gas–liquid relative velocity is beneficial to droplet atomisation.
3.2. Droplet Velocity Analysis Under Different Atomisation States
To observe the change in the velocity of the external flow field of the droplets in different spray states, the velocity distribution of the external flow field at 0.02 s, as well as that at 0.11 s, was derived, as shown in Figure 6.
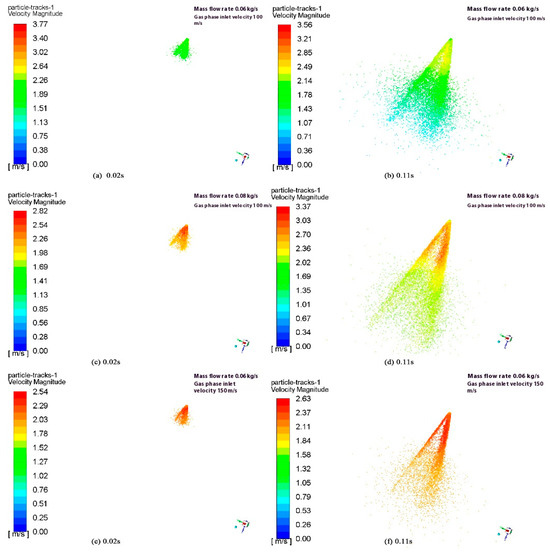
Figure 6.
Velocity field distribution of droplets under different atomisation states.
Figure 6 shows that keeping the gas phase velocity constant while increasing the nozzle mass flow rate increases the average droplet velocity from 2.2 m/s to 2.36 m/s, which increases the kinetic energy and results in faster jetting. The comparison in Figure 3 shows that, when the mass flow rate is kept constant, the gas-phase velocity is increased from 100 m/s to 150 m/s, and the droplet velocity is increased from 2.2 m/s to 2.32 m/s. In summary, the droplet velocity is positively correlated with the mass flow rate and gas-phase inlet velocity, and the enhancement of either parameter accelerates the droplet motion.
The dynamic pressure of the droplet specifically refers to the pressure generated by the motion of droplets due to their own kinetic energy. Its physical essence is the impact force when droplets strike an object, which differs from the fluid static pressure. Dynamic pressure exists only in the direction of droplet motion and is a crucial driving force for dust capture. The calculation formula for this metric is as follows:
In the formula, is the dynamic pressure of droplet, Pa; is the droplet density, kg/m3; is the droplet velocity, m/s.
Through the comparative study of the characteristics of droplet dynamic pressure and fluid static pressure, a comparative analysis framework is constructed, as shown in Table 4, which illustrates the core logic of selecting the droplet dynamic pressure as a reference [27,28].
Table 4.
Comparative analysis of droplet dynamic pressure and hydrostatic pressure.
In this study, the droplet dynamic pressure was selected as the core basis and, because of its strong coupling characteristics with the dynamic atomisation process, it is more suitable for downhole high-speed gas–liquid two-phase flow dust removal scenarios. The results show that the dynamic pressure directly affects the droplet particle size and dust capture efficiency. An increase in the gas phase velocity can significantly reduce the droplet size and improve the dust removal efficiency, while the dynamic pressure regulation model and the realizable k-ε turbulence model can accurately characterize the droplet trajectory, and the simulation errors of these models are much lower than that of the static pressure model.
To observe the variation in the droplet dynamic pressure under different working conditions (Case A: 0.06 kg/s mass flow rate, 100 m/s gas inlet velocity; Case B: 0.08 kg/s mass flow rate, 100 m/s gas inlet velocity; Case C: 0.06 kg/s mass flow rate, 150 m/s gas inlet velocity), the centre and edge axes of the external flow field were selected for comparison and the variation curves of the droplet dynamic pressure on the corresponding reference line were derived, as shown in Figure 7 and Figure 8.
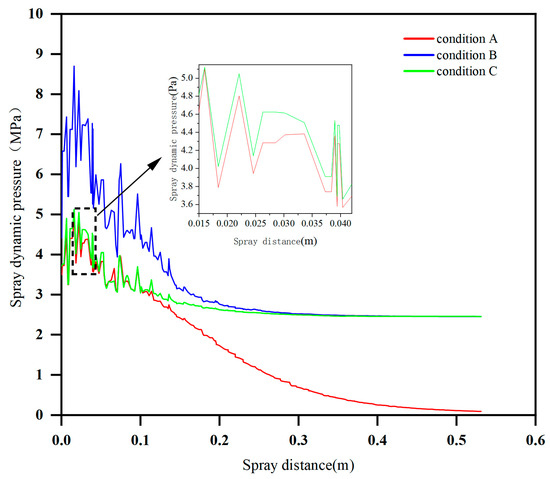
Figure 7.
Variation in dynamic pressure of the droplet at the centre axis of the flow field outside the nozzle under different working conditions.
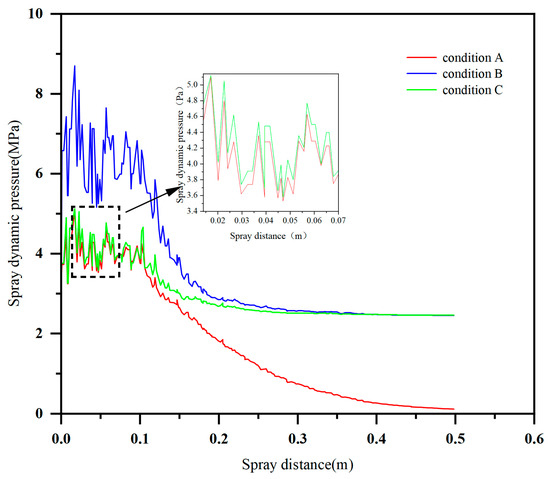
Figure 8.
Variation in droplet dynamic pressure at nozzle edge axis under different working conditions.
As can be seen in Figure 7 and Figure 8, the droplet dynamic pressure of the nozzle under different working conditions shows a tendency to increase and then decrease and stabilize, but there are obvious differences between the central axis and the edge axis. The peak dynamic pressure in the central axis appears earlier and fluctuates more smoothly; the peak value of condition B is the highest, 8.65 MPa, and the peak values of conditions A and C are similar, approximately 5.1 MPa; the peak dynamic pressure in the edge axis is observed a little later (approximately 0.017 m), there are more peaks and more violent fluctuations in the range of 0.1 m, and the average dynamic pressure and droplet velocity are generally higher than those of the central axis. This difference is mainly due to the larger flow rate at the edge of the spray opening, and the droplets being less affected by the air resistance in this scenario; the droplet velocity in the centre region is also more significantly affected by the resistance. Increasing the gas-phase inlet velocity while maintaining the mass flow rate resulted in a slower decay of the kinetic pressure and higher velocities at the edge of the droplet. While maintaining the gas-phase velocity, increasing the mass flow rate increased the kinetic pressure and velocity in the front section, both of which contributed to the enhancement of the kinetic energy of the droplets in the outflow field of the nozzle, although the edge axis exhibited stronger velocity fluctuations and overall kinetic activity.
4. Experiments on Dust-Reduction Efficiency of Gas–Liquid Two-Phase
4.1. Nozzle Droplet Atomisation Characterisation
4.1.1. Effect of Air Supply Pressure on Nozzle Flow Characteristics
According to the experimental test requirements for building the corresponding test bench, the water supply pressure was set to 0.5 MPa and the air supply pressure, in a range from 0.2 MPa to 0.7 MPa for several measurements, was used to record the nozzle under different air supply pressure water consumption and air consumption settings, as well as to plot the point line graph, as shown in Figure 9.
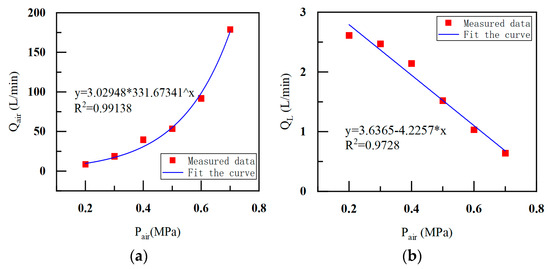
Figure 9.
Effect of air supply pressure on nozzle flow rate: (a) gas consumption; (b) water consumption.
As shown in Figure 9, when the water supply pressure was constant, the nozzle air and water consumption showed a significant correlation with the air supply pressure. As the air supply pressure increased, the nozzle air consumption increased exponentially, whereas the nozzle water consumption decreased linearly. The experiments verified the characteristics of the numerical simulation, wherein the droplet concentration decreased when the gas-phase inlet velocity of the gas–liquid two-phase flow nozzle was increased.
4.1.2. Effect of Air Supply Pressure on Macro-Atomisation Characteristics
The water supply pressure of the nozzle was maintained at 0.5 MPa and the air supply pressure was adjusted to 0.2, 0.3, 0.4, 0.5, 0.6, and 0.7 MPa, with an air compressor being used to photograph the outflow field patterns under different air supply conditions. The atomisation angle and range of the nozzle were calculated using the Fiji-image J version 2.9.0 software, as shown in Table 5. The morphology of the outflow field under different air supply pressures is depicted in Figure 10.
Table 5.
Variation in atomisation angle and range of gas–liquid two-phase flow nozzles under different air supply pressures.
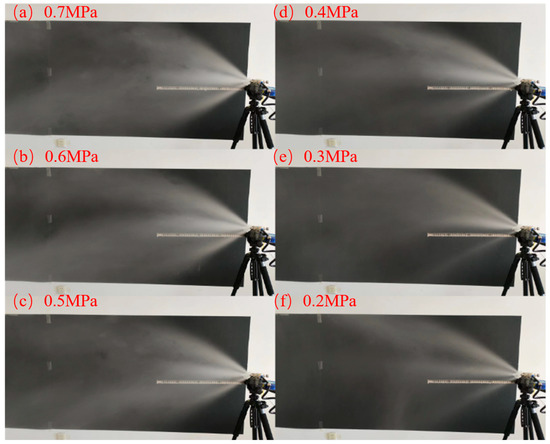
Figure 10.
Changes in the morphology of the outflow field at different air supply pressures.
As shown in Table 5, the atomisation angle and range of the nozzle increased overall with an increasing air supply pressure, with a maximum range of 112.466 cm and a maximum spray angle of 72.899°. When the air supply pressure was less than 0.4 MPa, the atomisation angle and range increased rapidly. When the pressure was more than 0.4 MPa, the atomisation angle stabilised at approximately 70° but fluctuated because, after the gas–liquid flow rate ratio tended to be close to the optimal state, continuing to increase the air supply pressure destroyed the equilibrium, resulting in the gas–liquid flow rate ratio being close to 0, which in turn affected the atomisation angle.
Figure 10 shows that, with a decrease in the air supply pressure, the concentration of droplets in the outflow field decreases, the spray morphology becomes conical, and the concentration of droplets at the edge position is significantly higher than that at the centre position, which verifies the reasonableness of the numerical simulation results.
4.1.3. Effect of Air Supply Pressure on Droplet Size
Observing Figure 11 and Figure 12, it can be observed that, while keeping the water supply pressure constant at 0.5 MPa, when the gas supply pressure is increased in increments of 0.1 MPa, starting from 0.2 MPa, the gas pressure increases, the peak frequency of the droplet volume frequency gradually shifts toward a smaller droplet size, and the growth rate of the cumulative volume also increases with the increase in gas supply pressure. This verified the simulation results, which showed that an increase in the gas-phase inlet velocity resulted in smaller droplet diameters. This indicates that, when using this nozzle for spraying, maintaining a constant water supply pressure while increasing the gas supply pressure can reduce the droplet diameter in the external flow field of the nozzle. This characteristic can be utilised in subsequent dust-suppression experiments.
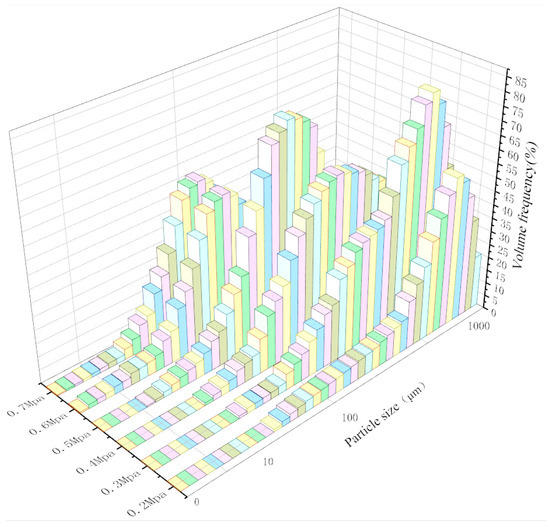
Figure 11.
Frequency of droplet volume in the flow field outside the nozzle at different air supply pressures.
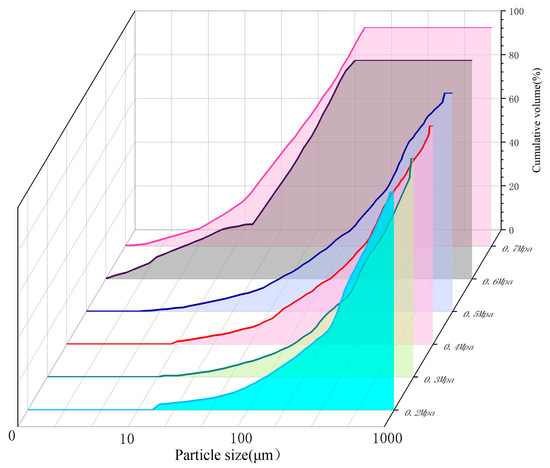
Figure 12.
Accumulated volume of droplets in the flow field outside the nozzle at different air supply pressures.
4.2. Gradient Analysis of Dust-Reduction Efficiency
A new simulation test system was built to simulate the dust-reduction process in different states, such as dust production, spraying, and ventilation, in the comprehensive excavation face of the coal mine, as shown in Figure 13.
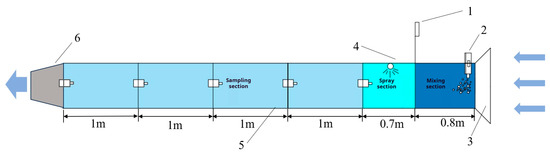
Figure 13.
Layout of the dust self-settling test setup. In the figure, 1 is the center console, 2 is the electric powder sprayer, 3 is the air inlet, 4 is the gas-liquid two-phase flow nozzle, 5 is the dust concentration meter, and 6 is the dust bag.
Five measurement points were arranged axially in the 5.5 m simulated roadway, with a sampling flow of 20 L/min and a time of 3 min. The dust source was respiratory coal dust with D50 = 1.40 μm. The wind speed of the roadway was adjusted to 2.2 m/s, which had little influence and was close to the actual situation of the working face of the Shenmu Coal Mine. The dust concentration at each measurement point was determined using a dust meter.
For this test, D50 = 1.40 μm coal dust was used as the dust source material, and its particle size distribution is shown in Table 6. After analysis, the particle size of more than 99.5% of the coal dust was determined to be less than 7.00 μm; therefore, the dust could be used as respiratory dust in this test.
Table 6.
Characteristic parameters of coal dust particle size.
Adjust the wind speed of the simulated roadway to 2.2 m/s, measure the exhaled dust concentration at different measurement points in the roadway several times, and collate the changes in dust concentration at measurement points 1–5 in Table 7.
Table 7.
Changes in respiratory dust concentration at each measurement point under different sampling conditions (unit: mg/m3).
From Table 7, it can be seen that the respiratory dust concentration was 96.31 mg/m3 at 1.5 m from the dust source point, and decreased to 79.81 mg/m3 at 3.5 m, which is a decrease of 17.13%. This shows that, in the range of 1.5–3.5 m, most of the dust is still suspended in the air, and only part of it settles or adheres to the inner wall of the roadway. The concentration at 4.5 m rises again because the turbulence of the dust-trapping belt causes the settled dust to be raised twice. The concentration of dust at 5.5 m was 83.90 mg/m3, with a settlement rate of 12.89%, which shows that most of the dust had not yet settled effectively.
4.3. Analysis of the Effect of Air Supply Pressure on Nozzle Dust-Reduction Efficiency
A simulation lane was established, which was divided into mixing, spraying, and sampling sections. The dust was the same as that used in the gravity settling experiment. The dust concentration meter was arranged at a distance of 0.7–4.5 m from the air inlet, and the height of the base plate was 0.3 m. The water supply pressure was 0.5 MPa, and the air supply pressures were 0.2, 0.3, 0.4, 0.5, 0.6, and 0.7 MPa. The concentration was calculated by weighing the dust mass before and after spraying.
The sampling flow rate was set to 20 L/min, the sampling time was 3 min, and the air velocity of the roadway was maintained at 2.2 m/s. The first sampling took place before the spray was turned on, and the sampling under different air supply pressures is shown in Table 8.
Table 8.
Air–liquid two-phase spray respiratory dust sampling results.
The dust sampling results were measured to derive the rate of dust reduction for the respiratory dust at different air supply pressures at each sampling point.
The formula for calculating the dust-reduction rate is as follows:
In the formula, η is the dust-reduction rate of the dust, %; Cb is the dust concentration at the measurement point before spraying, mg/m3; Ca is the dust concentration at the measurement point after spraying, mg/m3.
The trend of the dust-reduction efficiency of the respiratory dust at different measurement points with different air supply pressures is shown in Figure 14. The dust-reduction rate can be calculated using Equation (20), and the trend of the dust-reduction efficiency at different air supply pressures is shown in Figure 15.
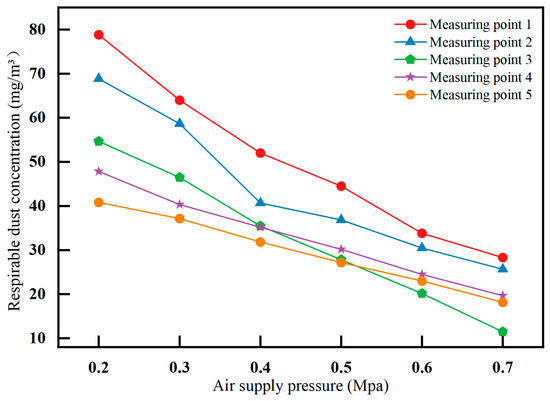
Figure 14.
Variation in respiratory dust concentration with air supply pressure at different measurement points.
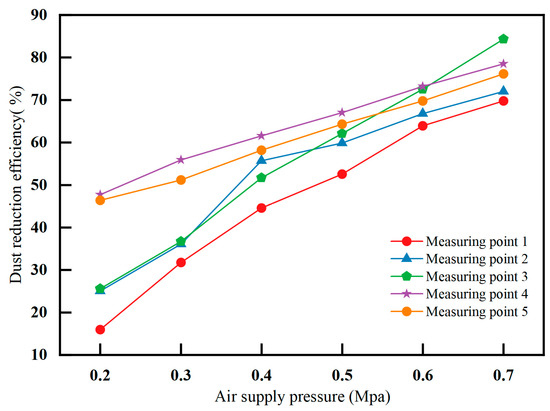
Figure 15.
Variation in dust-reduction efficiency with air supply pressure at different measurement points.
The respiratory dust concentration inside the simulation test tunnel decreased with an increase in the air supply pressure, and the dust-reduction efficiency of the gas–liquid two-phase flow nozzle sprays at different measurement points increased with an increase in the air supply pressure. As shown in Figure 13, the dust-reduction efficiency of the gas–liquid two-phase flow nozzle increased with an increasing air supply pressure, and the highest dust-reduction efficiency was achieved when the air supply pressure was 0.7 MPa. The air supply pressure had a greater impact on the droplet size of the spray field, and the greater the pressure, the smaller the droplet size and the higher the dust-reduction efficiency. Between 0.3 MPa and 0.6 MPa, the dust-reduction efficiency gradually increased, reaching 69.26% at 0.6 MPa. When the air supply pressure reached 0.7 MPa, the dust-reduction efficiency reached 76.17%. Therefore, in coal mines, the spray air supply pressure should be moderate, and 0.6 MPa is the best choice, as it can improve the dust-reduction efficiency and economy of the machine.
Table 9 shows the quantitative analysis results of the energy consumption system under different air supply pressures. Under comprehensive conditions, it can be seen that 0.6 MPa is the best choice for the air supply pressure.
Table 9.
Energy consumption and economic analysis of the system under different gas supply pressures.
5. Downhole Test Validation and Optimization
5.1. Measurement of Dust Concentration on Site
The respiratory dust concentration test was carried out on the road face of a mine in Shenmu, and fixed-point measurements were used to set up measurement points on the road face. The measuring point at the driver’s position was 5 m away from the face, and the measuring points on the return side of the road were arranged every 10 m; thus, a total of six measuring points were arranged to study the variation in dust concentration at different locations on the road.
According to the arrangement shown in Figure 16, the respiratory dust concentration before and after high-pressure spraying was measured at each measurement point, three repeated measurements were taken for each measurement point, and the average of the three measurements was taken as the measured value, as shown in Table 10.
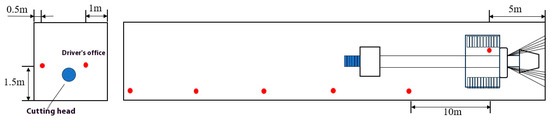
Figure 16.
Specific measurement point layout for road faces.
Table 10.
Measurement of respiratory dust concentration in two conditions at the road face.
The data on the respiratory dust concentration before and after the spraying were collated and calculated to obtain the dust-reduction rate at different measurement points after high-pressure spraying, as shown in Figure 17.
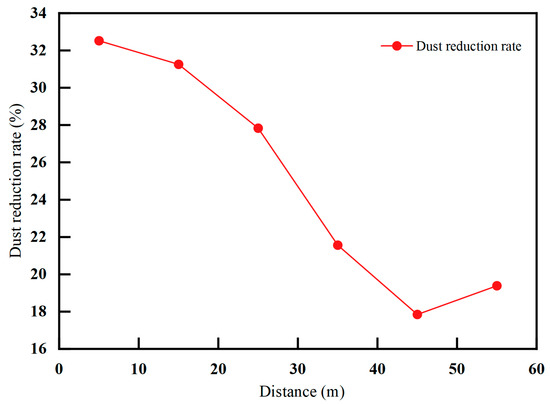
Figure 17.
Variation in dust-reduction rate of high-pressure spraying on exhaled dust at each measuring point of the integrated excavation face.
After the high-pressure spraying of the synthesis digging face, the respiratory dust settling rate decreases with increases in the distance from the headland, and the dust-reduction rate is the highest at 5 m, 32.52%, and the lowest at 45 m, 17.84%. Although the high-pressure spray can reduce the dust concentration, the dust-reduction rate is low, and the reasons for this are as follows: the water mist particle size is large, the ability to capture dust is limited, there is an increase in distance attenuation, the spray coverage is small, and it is easy for fine dust to escape, which affects the effect of dust reduction.
5.2. Site Humidity and Temperature Measurement
Nine equidistant measuring points were arranged in the fully mechanised excavation face to monitor temperature and humidity changes in real time. When the comprehensive excavator works stably, the position is marked, and each measuring point is measured synchronously, The sampling time is 1 s, each sampling is conducted 10 times, and the measurement results are repeated 5 times. The measurement results are shown in Figure 18.
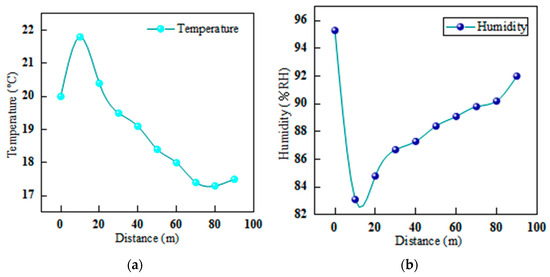
Figure 18.
Temperature and humidity changes in the working face of the complex tunnelling area: (a) temperature change; (b) humidity change.
From Figure 18a, it can be seen that the temperature in the 10 m range of the headface rises rapidly during the operation of general-purpose excavation under the influence of the cutting of the headface and the activities of the personnel. After the high-pressure spraying system is activated, the fine mist droplets fill the roadway, spread with the wind flow, and take away the heat through evaporation, so that the temperature first rises and then decreases. As shown in Figure 18b, the humidity of the roadway exhibited a trend of low and then high values. The spraying system significantly improved the headway’s humidity, and the fog droplets diffused with the wind flow, which resulted in a short-lived decrease in humidity; however, the purifying water curtain continued to replenish the fog droplets, so that the humidity gradually increased.
5.3. Optimisation of On-Board Gas–Liquid Two-Phase Flow Dust-Reduction System
The test of the respiratory dust concentration in the working face of the comprehensive excavation shows that the main dust point is the cutting head of the comprehensive excavator, which generates a large amount of dust owing to its crushing effect on the coal body and the fact that the traditional nozzles have a limited dust removal effect on respiratory dust. The spray dust-reduction system designed in this section is targeted at the dust-producing area of the cutting head, with the aim of reducing the dust concentration in this area, isolating the spread of dust, reducing the impact on the driver and the return side of the wind, and realising the full coverage of fine water mist, with the specific coverage shown in Figure 19.
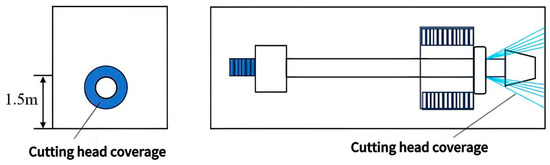
Figure 19.
Schematic diagram of spray coverage outside the cutting head of the integrated excavation face.
The gas–liquid two-phase flow spray dust removal system designed in this study uses precise calculations to reasonably select the installation height of the nozzle h and its installation position in relation to the hewing head to realise the overall coverage of the dust-producing points at the cutting head within the effective range of the gas–liquid two-phase flow spray, as shown in Figure 20.
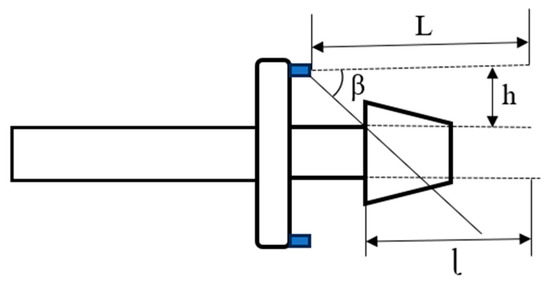
Figure 20.
Schematic diagram of the installation of the nozzle of the head.
In the formula, L is the range of the gas–liquid two-phase flow nozzle, mm; β is 1/2 of the atomisation angle of the gas–liquid two-phase flow nozzle; l is the sum of the length of the heddle head and the range reserved for spraying.
According to the macroscopic atomisation characteristic test of the nozzle detailed in Section 4, the selected gas–liquid two-phase flow nozzle had an average atomisation range of 1200 mm and an atomisation angle of 75°. The numerical simulation results in Section 4 show that the atomisation concentration and spray dynamic pressure in the second half of the nozzle were lower than those in the first half. To ensure the dust-reduction effect, a 200 mm spray range was reserved in the front section of the cutting head to ensure the dust-reduction efficiency of the nozzle. The atomisation effect of a single nozzle and its installation position are illustrated in Figure 21.
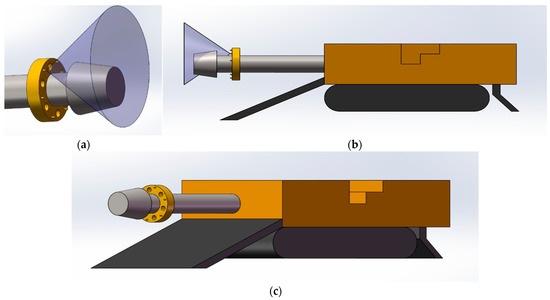
Figure 21.
Schematic of spray coverage with a single nozzle: (a) partial enlargement; (b) main view of coverage; (c) schematic diagram of installation location.
Based on the coverage of a single nozzle, six nozzles were estimated to be required for complete head coverage. Therefore, an annular on-board gas–liquid two-phase flow dust-reduction system was designed to ensure full coverage of the dust-producing area at the cut-off position. A schematic of the ring-shaped on-board dust-reduction system is shown in Figure 22.
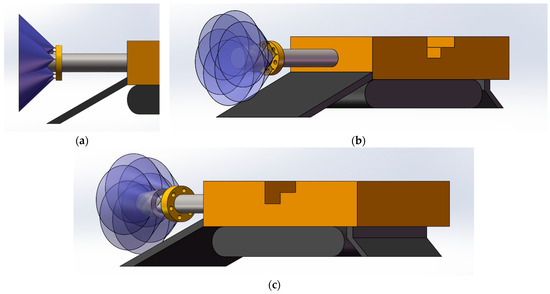
Figure 22.
Schematic of the atomisation range of an annular on-board gas–liquid two-phase flow nozzle: (a) main view; (b) left front view; (c) right front view.
By optimising the on-board annular gas–liquid two-phase flow spraying device, the system can realise the full wrapping of the cutting area of the head and ensure that the position of the head is in the effective dust-reduction area of the annular on-board spraying device to realise the effective capture of respiratory dust.
The onboard gas–liquid two-phase flow ring spray system mainly includes a control box body, high-pressure gas–liquid two-phase hose, gas–liquid two-phase flow nozzles, and anti-smashing device. Six nozzles were fixed on the cutting head cantilever of the IMM using a fixing device that was tightly fitted to the cantilever, as shown in Figure 23.
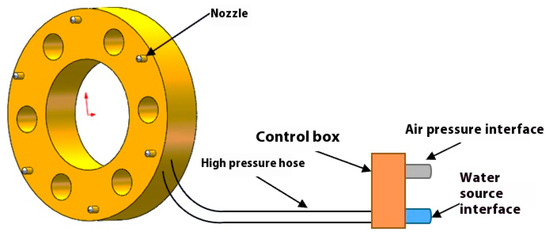
Figure 23.
Schematic diagram of the composition of the onboard annular gas–liquid two-phase flow dust-reduction system for the integrated excavation face.
The onboard nozzle used for the system was the same type of gas–liquid two-phase flow nozzle as in the previous test. The nozzle has the characteristics of high pressure resistance and corrosion prevention, the average spray angle is 75°, and the spray pattern is a fan. According to the test, when the nozzle’s gas–water flow ratio is 1.4:1, the dust-reduction efficiency can reach more than 62%, which is the optimal efficiency. The diameter of the onboard ring-shaped high-intensity spray equipment is 728 mm, and the box is made of 10 mm special steel, which has the function of anti-smashing and dropping and has good adaptability with the cantilever of the optimising excavator, which has high reliability and effectively protects the gas–liquid two-phase flow nozzles.
Based on comparative analysis of the field measurement data, Table 11 shows the performance difference between the gas–liquid two-phase spray and the conventional high-pressure spray technology.
Table 11.
Comparison of the performance of the annular airborne system with that of traditional high-pressure spraying.
5.4. Airborne Gas–Liquid Two-Phase Flow System Applications
According to the dust test method described in the previous section, after the installation of an airborne ring dust-reduction system in a mine in Shenmu, the respiratory dust distribution at each measurement point was examined and compared with the dust-reduction effect of the original high-pressure spray nozzle in the mine to evaluate the on-site dust removal effect of the system. The changes in the dust concentration at each measurement point are shown in Figure 24.
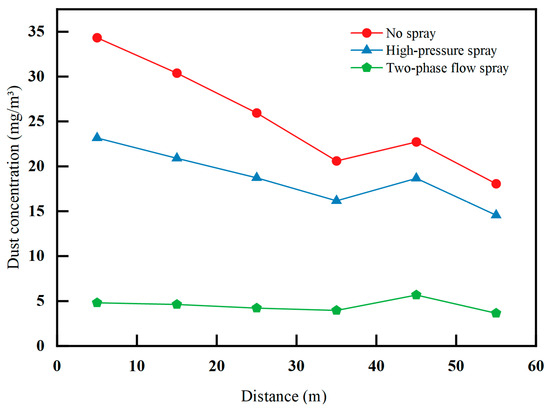
Figure 24.
Variation in dust concentration at each measurement point before and after spraying of gas–liquid two-phase flow.
Figure 24 shows that, after the use of an annular airborne gas–liquid two-phase flow dust-reduction system, the dust concentration at each measurement point of the roadway was significantly reduced, and the overall trend of the dust concentration gradually decreased with increases in the distance, with the lowest value being 3.64 mg/m3 and the maximum value being 5.81 mg/m3, which is significantly lower than that when the dust-reduction measures were not used. The main reasons for this are as follows: the gas–liquid two-phase flow atomisation system reduces the droplet particle size and improves the capture efficiency; after the addition of gas-phase fluid, the droplet crushing is more adequate, the number of micro-fine droplets increases, and the probability of collision with dust increases, which allows the accurately designed spraying device to completely cover the dust-producing point of the cut-off head and improve the dust-reducing efficiency. Figure 25 shows a comparison of the dust-reduction efficiency between the high-pressure spray and gas–liquid two-phase fluid spray.
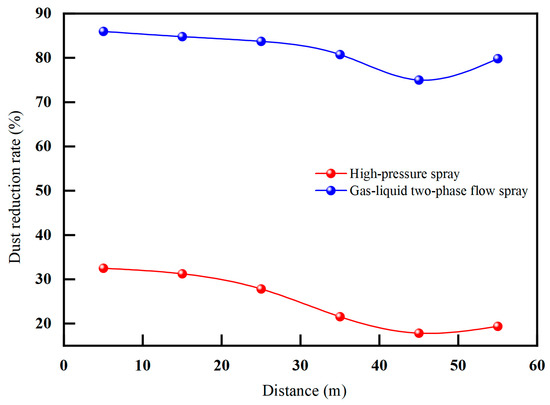
Figure 25.
Comparison of dust-reduction rate between air–liquid two-phase flow spray and high-pressure spray.
Figure 25 shows that the dust-reduction rate of the gas–liquid two-phase flow spray is significantly higher than that of the high-pressure spray, with the highest dust-reduction rate reaching 85.99 percent, which is 53.47 percent higher than that of the high-pressure spray, which reached 32.52 percent. The lowest dust-reduction rate is 75 percent, which, compared with the high-pressure spray, which is 21.56 percent, represents an increase of 53.44 percent. The average dust-reduction rate is 81.68 percent, an increase of 56.61 percent. A comparison of the measurement points shows that the gas–liquid two-phase flow spray can effectively control the respiratory dust concentration in the position of the cutting head of the IMM.
6. Conclusions
- The atomisation effect of the gas–liquid two-phase flow nozzle was significantly affected by the gas supply pressure, gas phase inlet velocity, and droplet mass flow rate. Improving the air supply pressure can reduce the droplet size and increase the atomisation range and angle; however, the gas–liquid flow ratio must be controlled to avoid fluctuations in the atomisation angle. Increasing the gas-phase inlet velocity enhanced the droplet fragmentation efficiency and reduced the droplet concentration in the central region, and increasing the mass flow rate shortened the atomisation time;
- The experimental results showed that the air supply pressure was positively correlated with the dust-reduction efficiency. When the air supply pressure increased from 0.2 MPa to 0.7 MPa, the dust-reduction efficiency of the respiratory dust increased from 47.2% to 76.2%. Among the tested air supply pressures, 0.6 MPa was the economically optimal working condition, with which the dust-reduction efficiency reached 69.3%, which is a balance between efficiency and energy consumption. In addition, the reduction in droplet size enhances the capture ability of fine dust, and the synergistic effect of inertial collision and diffusion is the key to improving efficiency;
- To address the dust-producing characteristics of the cutter head of the IMD, a ring-shaped on-board gas–liquid two-phase flow system was designed to achieve full coverage of the dust-producing area using a six-nozzle ring layout. Field tests show that the highest dust-reduction rate of the optimized system reaches 86.0%, which is 53.5% higher than the efficiency of traditional high-pressure spraying, and that the concentration of dust at each measurement point is reduced to less than 6 mg/m3, which significantly improves the working environment. By adjusting the air–water ratio and anti-shock design, the system was made to be highly reliable and adaptable, and can thus provide technical support for underground dust suppression;
- This study primarily investigated the impact of the supply pressure on the nozzle dust removal efficiency; however, it had certain limitations. This study did not systematically explore the effects of different coal dust particle sizes, dust concentrations, or coal types on the dust removal efficiency, nor did it address the interference of mist droplet evaporation and secondary dust resuspension on mist droplet trajectories under high humidity conditions. Although the results indicated that the system performed well in conventional mine tunnels, complex mine environments may limit the model’s applicability. Future research should focus on systematic studies of coal dust with multiple particle sizes and comprehensively analyse the interactive effects of humidity and airflow to enhance the engineering application value of the model in complex environments.
Author Contributions
Conceptualization, J.W.; Software, X.H. and S.L.; Validation, X.H.; Formal analysis, X.H.; Investigation, X.H.; Resources, S.L.; Writing—original draft, X.H.; Writing—review & editing, S.L.; Supervision, J.W.; Project administration, J.W.; Funding acquisition, J.W. All authors have read and agreed to the published version of the manuscript.
Funding
This research was funded by The National Natural Science Foundation of China grant No. 51974232.
Data Availability Statement
The original contributions presented in the study are included in the article; further inquiries can be directed to the corresponding author.
Conflicts of Interest
The authors declare no conflict of interest.
References
- Yuan, L.; Zhang, P.S. Development status and outlook of geological safeguard technology for precision coal mining. J. Coal 2019, 44, 2277–2284. [Google Scholar]
- Jing, G.; Peng, L.; Ban, T. Study on the propagation characteristics and injury of methane coal dust coupled explosion. Chin. J. Saf. Sci. 2022, 32, 72–78. [Google Scholar]
- Sun, J.-P.; Fan, W.-Q. Video image based method for gas and coal dust explosion sensing alarm and explosion source determination. Ind. Min. Autom. 2020, 46, 1–4. [Google Scholar]
- Li, D.; Sui, J.; Liu, G.; Zhao, Z. Current status and development direction of coal mine dust hazard prevention and control technology in China. Min. Saf. Environ. Prot. 2019, 46, 1–7. [Google Scholar]
- Xu, M.; Fang, Q.; Hu, T.; Wang, J. Hazards of respiratory dust and countermeasures for prevention and control in synthesis mining and comprehensive excavation working face of Sangshuping coal mine. Coal Mine Saf. 2017, 48, 171–174. [Google Scholar]
- Wang, J.; Zheng, L. Coal mine dust occupational hazard monitoring technology and its development trend. Coal Sci. Technol. 2017, 45, 119–125. [Google Scholar]
- Wang, P.; Liu, R.; Wang, H.; Chen, S.; Tan, X.; Gou, S. Experimental study on atomisation characteristics of air-water spray in coal mine. J. Coal 2017, 42, 1213–1220. [Google Scholar]
- Wang, P.; Liu, R.; Tang, M.; Zhang, W.; Gui, Z. Experimental study on the influencing factors of spraying dust reduction in coal mines. J. Saf. Environ. 2015, 15, 62–67. [Google Scholar]
- Wang, P.; Tan, X.; Liu, R.; Wang, H.; Li, Y.; Tian, C. Influence of outlet diameter on atomisation characteristics and dust reduction performance of internally mixed air atomising nozzles. J. China Coal Soc. 2018, 43, 2823–2831. [Google Scholar]
- Ai, X.; Cai, X.; Chen, J.; Ding, G.; Guan, S.; Ji, Y. The characteristics of gas-liquid dispersive mixing and microbubble generation in turbulent adjustable jet flow field. J. Dispers. Sci. Technol. 2024, 45, 1307–1318. [Google Scholar] [CrossRef]
- Fang, X.; Jiang, B.; Yuan, L.; Liang, Y.; Ren, B.; Tao, W.; Li, X. Experimental Study on Atomization Characteristics of Gas–Liquid Two-Phase Flow Nozzle and Its Dust Removal Effect. Materials 2022, 15, 565. [Google Scholar] [CrossRef]
- Senecal, P.K.; Schmidt, D.P.; Nouar, I.; Rutland, C.J.; Reitz, R.D.; Corradini, M.L. Modeling high-speed viscous liquid sheet atomization. Int. J. Multiph. Flow 1999, 25, 79–99. [Google Scholar] [CrossRef]
- Lan, Z.; Zhu, D.; Tian, W.; Su, G.; Qiu, S. Experimental study on spray characteristics of pressure-swirl nozzles in pressurizer. Ann. Nucl. Energy 2014, 63, 215–227. [Google Scholar] [CrossRef]
- Jobehdar, M.H.; Siddiqui, K.; Gadallah, A.H.; Chishty, W.A. Bubble formation process from a novel nozzle design in liquid cross-flow. Int. J. Heat Fluid Flow 2016, 61, 125–138. [Google Scholar] [CrossRef]
- Singh, J.; Croce, D.; Zerpa, L.E.; Partington, B.; Gamboa, J. Experimental evaluation of nozzles to mitigate liquid loading in gas wells. J. Nat. Gas Sci. Eng. 2019, 65, 248–256. [Google Scholar] [CrossRef]
- Lee, J.; Moon, J. Numerical analysis of the effect of horizontal distance between a water mist nozzle and ignition source on reduction in heat release rate. Ann. Nucl. Energy 2020, 144, 107–127. [Google Scholar] [CrossRef]
- Brykov, N.A.; Emelyanov, V.N.; Karpenko, A.G.; Volkov, K.N. Flows of real gas in nozzles with unsteady local energy supply. Comput. Math. Appl. 2021, 81, 702–724. [Google Scholar] [CrossRef]
- Sun, Y.; Zhu, X.; Huang, W.; Liang, F.; Bian, J. Simulation and experimental investigation on gas-liquid two-phase flow separation behaviours in multitube T-Junction separator. Flow Meas. Instrum. 2022, 85, 102166. [Google Scholar] [CrossRef]
- Tan, M. Characteristics of a new type of internally mixed gas-water atomising nozzle. Sci. Technol. Inf. 2010, 94, 59–73. [Google Scholar]
- Wang, P.; Tan, X.; Liu, R.; Wang, H.; Li, Y.; Tian, C. Influence of water supply pressure on atomisation characteristics and dust reduction effect of air-water spray. J. Appl. Basic Eng. Sci. 2018, 26, 1348–1359. [Google Scholar]
- Wang, P.F.; Liu, R.H.; Gui, Z.; Gou, S.X.; Shu, W.; Tan, X.H. Theoretical study on atomisation characteristics and dust reduction efficiency of air-water spray in coal mine. J. China Coal Soc. 2016, 41, 2256–2262. [Google Scholar]
- Liu, R.; Zhu, B.; Wang, P.; Shi, Y.; Gao, R.; Wu, G. Mechanism of ventilation and dust control by double radial cyclone shielding in a comprehensive excavation face. J. China Coal Soc. 2021, 46, 3902–3911. [Google Scholar]
- Guan, Y.; Han, Y.; Huang, S.; Han, X. Simulation study on the effect of air atomising nozzle on glue atomisation. Mech. Des. Manuf. 2022, 98, 86–90. [Google Scholar]
- Xue, W.; Hou, M.; Huo, Z.; Fan, Y.; Hao, J.; Yang, W.; Song, X.; Tu, Q. Experimental study on the effect of air-water spraying on dust reduction at the transfer point of belt conveyor. Coal Mine Saf. 2022, 53, 14–19. [Google Scholar]
- Akbari, V.; Borhani, T.N.G.; Shamiri, A.; Shafeeyan, M.S. Computational fluid dynamics modelling of gas-solid fluidised bed reactor, Influence of numerical and operating parameters. Exp. Comput. Multiph. Flow 2024, 6, 85–125. [Google Scholar] [CrossRef]
- Zhou, L.; Zhang, X.; Yu, Y. Experimental and numerical studies on the wall-roughness effect to particle dynamics in various gas-particle flows. Exp. Comput. Multiph. Flow 2024, 6, 387–394. [Google Scholar] [CrossRef]
- Zhang, B.; Zhang, Y.; Zhu, C.; Qian, L. Experimental Study on Aerodynamic Breakup of Silicone Oil-Water Composite Droplets. Mech. Pract. 2025, 47, 529–538. [Google Scholar]
- Song, J.; Zhou, W.; Shang, W.; Li, H.; Li, J.; Liu, J. Recent advances on fragmentation and evaporation of droplets in airflow. Chin. J. Theor. Appl. Mech. 2024, 56, 3371–3393. [Google Scholar]
Disclaimer/Publisher’s Note: The statements, opinions and data contained in all publications are solely those of the individual author(s) and contributor(s) and not of MDPI and/or the editor(s). MDPI and/or the editor(s) disclaim responsibility for any injury to people or property resulting from any ideas, methods, instructions or products referred to in the content. |
© 2025 by the authors. Licensee MDPI, Basel, Switzerland. This article is an open access article distributed under the terms and conditions of the Creative Commons Attribution (CC BY) license (https://creativecommons.org/licenses/by/4.0/).