Abstract
This study experimentally validates a solar-thermal desalination system equipped with predictive feedwater control guided by real-time solar forecasting. Unlike conventional systems that react to temperature changes, the proposed approach proactively adjusts feedwater flow in anticipation of solar variability. To assess environmental and financial sustainability, the study integrates this control logic with a full Life Cycle Assessment (LCA) and Techno-Economic Analysis (TEA). Field testing in a high-temperature, arid region demonstrated strong performance, achieving a Global Warming Potential (GWP) of 1.80 kg CO2-eq/m3 and a Levelized Cost of Water (LCOW) of $0.88/m3. Environmental impacts were quantified using OpenLCA and ecoinvent datasets, covering climate change, acidification, and eutrophication categories. The TEA confirmed economic feasibility, reporting a positive Net Present Value (NPV) and an Internal Rate of Return (IRR) exceeding 11.5% over a 20-year lifespan. Sensitivity analysis showed that forecast precision and TES design strongly influence both environmental and economic outcomes. The integration of intelligent control with simplified thermal storage offers a scalable, cost-effective solution for off-grid freshwater production in solar-rich regions.
1. Introduction
In an age defined by intersecting crises—water scarcity, climate instability, and energy insecurity—pursuing sustainable development requires more than simply increasing resource output. The real challenge lies in navigating paradoxes: How can we produce freshwater without worsening the climate crisis? How can we reduce environmental burdens while stabilizing energy use? According to the United Nations, nearly two-thirds of the global population will face water stress by 2025 [1,2,3]. As freshwater sources continue to diminish due to population growth, urbanization, and environmental pressures, desalination has emerged as a vital solution for supplementing global water supplies [4].
Among various desalination technologies, solar-powered systems offer a uniquely promising solution. They simultaneously address freshwater scarcity and carbon emissions by harnessing abundant renewable energy [5,6,7]. Solar-thermal desalination, in particular, has gained traction for its ability to efficiently convert solar heat into freshwater, especially when coupled with thermal energy storage (TES) to buffer against solar intermittency [8]. In contrast, most conventional desalination methods remain heavily dependent on fossil fuels, making them both energy-intensive and carbon-emitting [8,9].
Despite meaningful advances in thermal efficiency optimization, the broader environmental and economic dimensions of solar desalination systems remain insufficiently addressed. Existing studies often concentrate narrowly on thermodynamic performance, giving limited attention to environmental impacts and financial feasibility [10]. This fragmented focus overlooks the practical complexity of deploying such systems, especially in off-grid or remote environments [11].
To address these shortcomings, life cycle assessment (LCA) and techno-economic analysis (TEA) have emerged as complementary tools for evaluating the sustainability of desalination technologies. LCA quantifies environmental burdens across the entire system life cycle—from material sourcing and manufacturing to operation and end-of-life disposal. In parallel, TEA estimates capital requirements, operational costs, and expected returns on investment [12,13]. Together, these frameworks ensure that sustainability efforts do not simply shift environmental or economic burdens from one area to another [14].
An expanding body of research has explored the integration of renewable energy sources into desalination systems. Studies by Rajesh et al. [15] and Zheng and Hatzell [16] have modeled hybrid configurations that incorporate photovoltaic thermal (PVT) collectors, humidification–dehumidification (HDH) units, and optimization algorithms to enhance energy output and cost-effectiveness [17]. Other contributions, including Ferdous et al. [18], underscore the value of integrating LCA, TEA, and process simulation to achieve a more comprehensive evaluation of system viability. However, most of these studies lack operational intelligence components such as predictive control—a key enabler for real-time management of energy and water flows in practical deployments.
Predictive control strategies, driven by real-time solar irradiance forecasts, represent an effective mechanism to enhance system responsiveness, reduce energy losses, and synchronize feedwater flow with thermal availability [19]. When integrated with simplified TES configurations, these strategies can significantly improve both environmental outcomes and economic efficiency. However, most existing studies examine predictive control in isolation from broader sustainability assessments, thereby limiting the understanding of its systemic contribution.
Table 1 summarizes the key studies in the field of solar desalination, highlighting their methodological approaches and coverage of predictive control, LCA, and TEA dimensions. This comparison contextualizes the novelty of the present work, which uniquely integrates all three aspects within a validated experimental setup.

Table 1.
Comparative summary of previous studies on solar desalination systems.
This is the first study to experimentally validate the integration of predictive feedwater control with LCA and TEA in a solar-thermal desalination system. Extending prior simulation work by Alsehli [20], the present research incorporates real-time solar irradiance forecasting, thermal performance monitoring, and measured desalination output to assess sustainability under real-world conditions. Environmental impacts are modeled using OpenLCA and ecoinvent datasets, while a detailed financial model is employed to perform the TEA. The findings offer practical insights into the feasibility of deploying intelligent, scalable solar desalination technologies in arid regions with high solar irradiance.
The remainder of the paper is structured as follows:
Section 2 describes the experimental setup, control logic, and modeling methodologies.
Section 3 presents the results of the environmental and economic assessments, including sensitivity analysis.
Section 4 discusses key findings and implications.
Section 5 concludes with recommendations for future work.
2. Materials and Methods
2.1. System Description
This subsection describes the architecture and operational principles of the experimental solar-thermal desalination system, with emphasis on the integration of predictive control and TES. The setup consists of four major subsystems:
- solar energy harvesting units,
- a single-tank TES unit,
- a solar-thermal multi-stage desalination chamber, and
- a real-time predictive control module that regulates feedwater flow.
A schematic representation of the integrated configuration is shown in Figure 1.
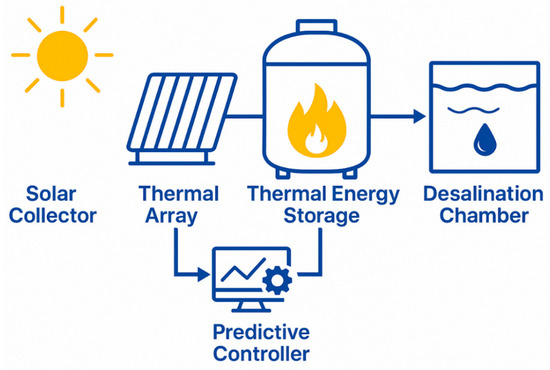
Figure 1.
The conceptual operational flow of the system.
Solar Energy Collection
An array of evacuated tube solar collectors (ETCs) were employed due to their high thermal efficiency and consistent performance under both direct and diffuse solar irradiation. The collected thermal energy was transported to the TES unit via a closed-loop circulation system, enabling continuous and stable heat delivery across the entire diurnal cycle.
Thermal Energy Storage
The TES system consisted of a single, well-insulated tank strategically chosen to reduce system complexity and minimize maintenance compared to multi-tank or phase-change material (PCM) alternatives. The tank maintained a stratified thermal profile through buoyancy-driven layering, enabling efficient thermal charging during peak irradiance hours and discharging during low-irradiance periods. This configuration ensured a stable and consistent heat supply to the desalination chamber.
Desalination Chamber
A solar-thermal-driven multi-stage flash (MSF) desalination chamber was utilized. Preheated feedwater was introduced into a series of low-pressure stages, where it underwent successive flash evaporation and condensation cycles. Thermal energy supplied by the TES unit sustained the desalination process under fluctuating solar conditions, supporting continuous operation and consistent freshwater output.
Predictive Control System
The predictive control system dynamically adjusted feedwater flow rates based on hourly solar irradiance forecasts. These forecasts were generated using a hybrid model that combined historical irradiance data with public weather information (e.g., NOAA). Time-series algorithms, such as the autoregressive integrated moving average (ARIMA), enabled short-term hourly predictions, providing sufficient lead time for real-time inflow adjustment. The controller also optimized TES temperature boundaries to prevent thermal oversaturation and enhance overall system efficiency. Future work will explore the integration of more advanced forecasting techniques, including recurrent neural networks (RNNs).
System Architecture and Control Logic
Figure 1 illustrates the conceptual architecture of the solar-thermal desalination system, which integrates solar energy harvesting via evacuated tube collectors, thermal energy storage in a single stratified tank, a multi-stage flash (MSF) desalination chamber, and a predictive control module that dynamically regulates feedwater flow based on forecasted solar irradiance.
The system incorporates several key innovations:
Single-Tank TES Design: Reduces system complexity and operational costs while maintaining robust thermal stratification and long-term heat stability.
Predictive Feedwater Control: Synchronizes system operation with forecasted solar input, enhancing energy efficiency and preventing thermal oversaturation.
Experimental Validation: Provides empirical performance data to validate model assumptions and assess operational feasibility in solar-rich, off-grid environments.
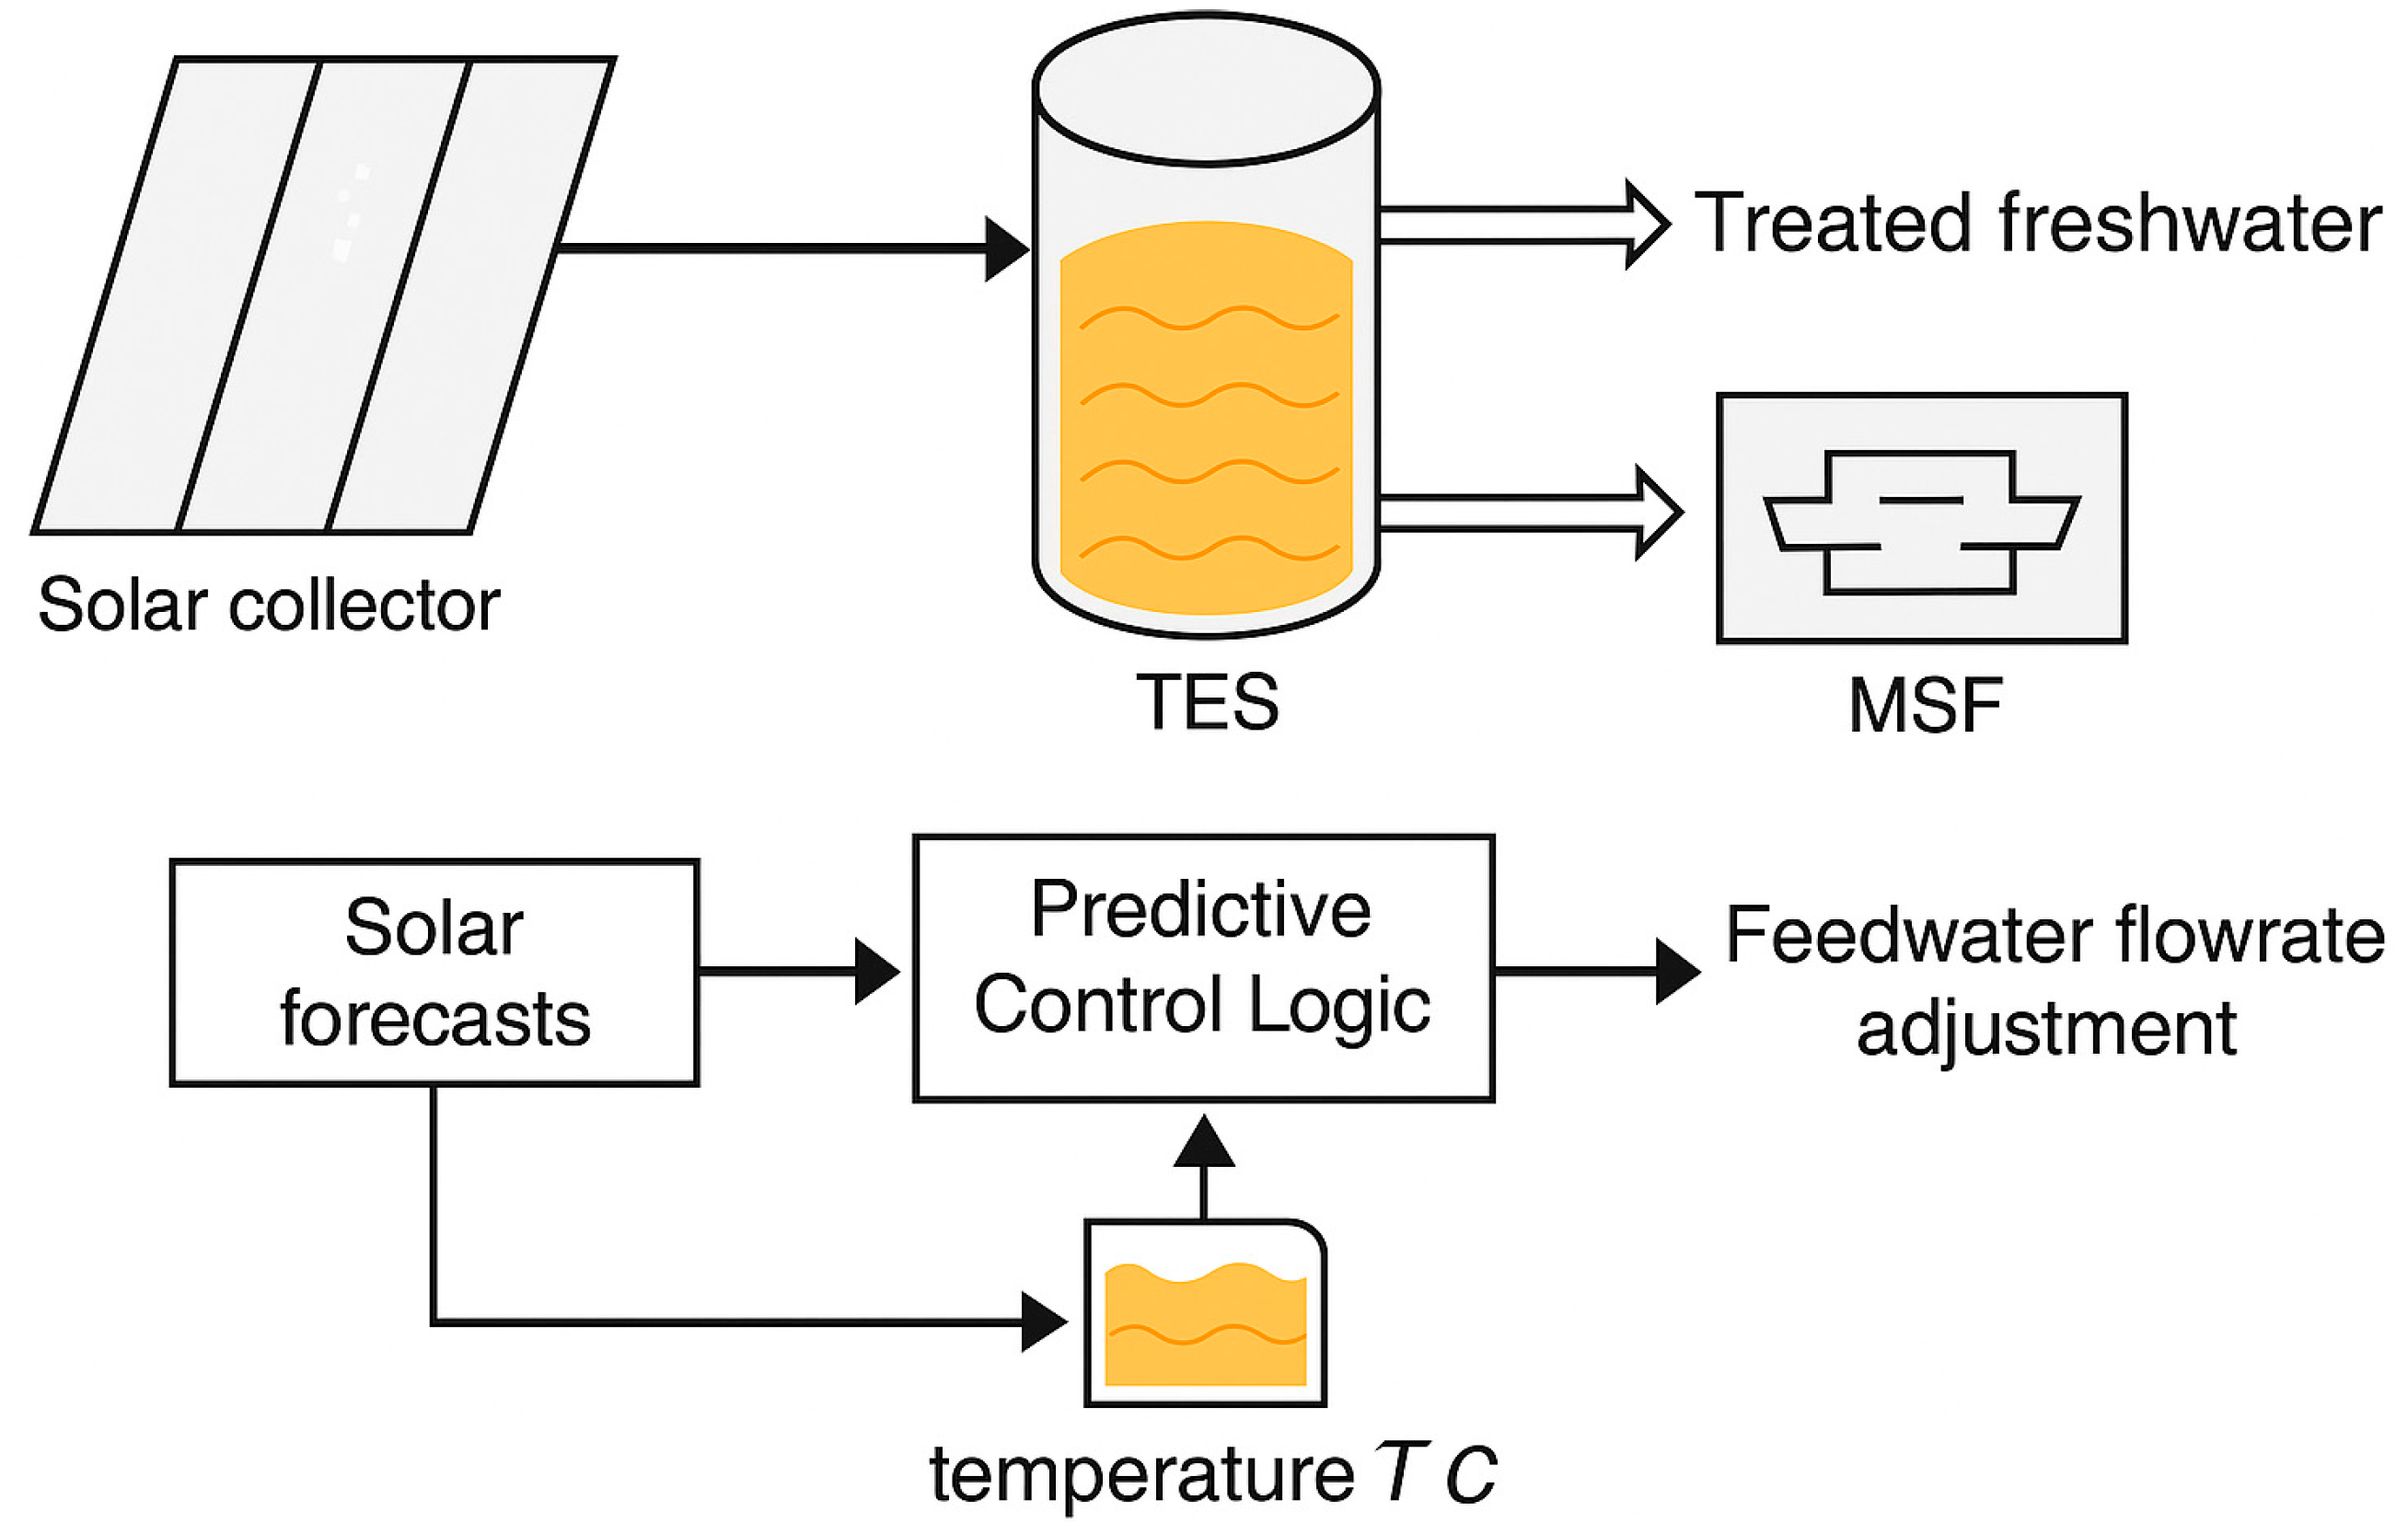
Figure 2 presents a detailed schematic of the integrated system. The upper panel illustrates the physical flow of thermal energy and feedwater through the TES and MSF chamber, culminating in freshwater production. The lower panel visualizes the predictive control logic, demonstrating how solar forecasts and TES feedback dynamically adjust the feedwater flow rate in real time.
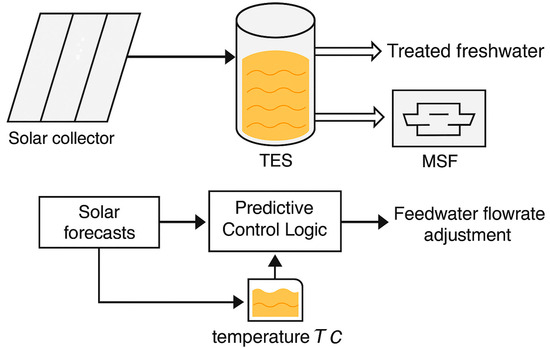
Figure 2.
Detailed schematic of the solar-thermal desalination system and control architecture.
2.2. Solar-Thermal Model and Energy Balance Equations
To estimate the hourly useful heat transferred from the solar array to the feedwater, the system computes the net thermal gain as follows:
where
- is the incident solar irradiance at time
- is the collector aperture area,
- is the collector efficiency.
Dynamic Modeling of Tank Temperatures
The collected thermal energy is integrated into a dynamic storage model under the assumption of well-mixed tank conditions. The charging tank temperature is updated using an hourly energy balance given by:
The following table summarizes each term on the right of this equation, with a description.
| Feed water energy at the previous hour | |
| Incoming feed water energy from the solar array | |
| Pre-heated feed water energy | |
| Losses through the sides of the tank |
A similar balance equation is applied during the discharging phase of the TES. This simplified formulation enhances reproducibility and provides transparency in the thermal modeling used to support predictive feedwater control. The energy balance for discharging is given by
| Feed water energy at the previous hour | |
| Feed water energy passed to the desalination | |
| Losses through the sides of the tank |
2.3. Life Cycle Assessment Methodology
A comprehensive LCA was performed to systematically evaluate the environmental impacts associated with the solar-thermal desalination system, which incorporates a single-tank TES unit and a predictive-controlled feedwater regulation mechanism. The analysis was conducted in accordance with the principles and requirements outlined in ISO 14040 and ISO 14044 standards for environmental life cycle studies [21].
2.3.1. Goal and Scope Definition
The primary objective of this LCA is to quantify the environmental footprint of the solar-thermal desalination system throughout its entire life cycle from raw material extraction, manufacturing, and system operation to end-of-life treatment and disposal. The results aim to guide sustainable design improvements and support strategic decision-making for future large-scale implementation.
2.3.2. Functional Unit
The functional unit is defined as the production of one cubic meter (1 m3) of freshwater. All reported environmental impacts are expressed relative to this unit, enabling meaningful comparison with alternative desalination technologies and system configurations.
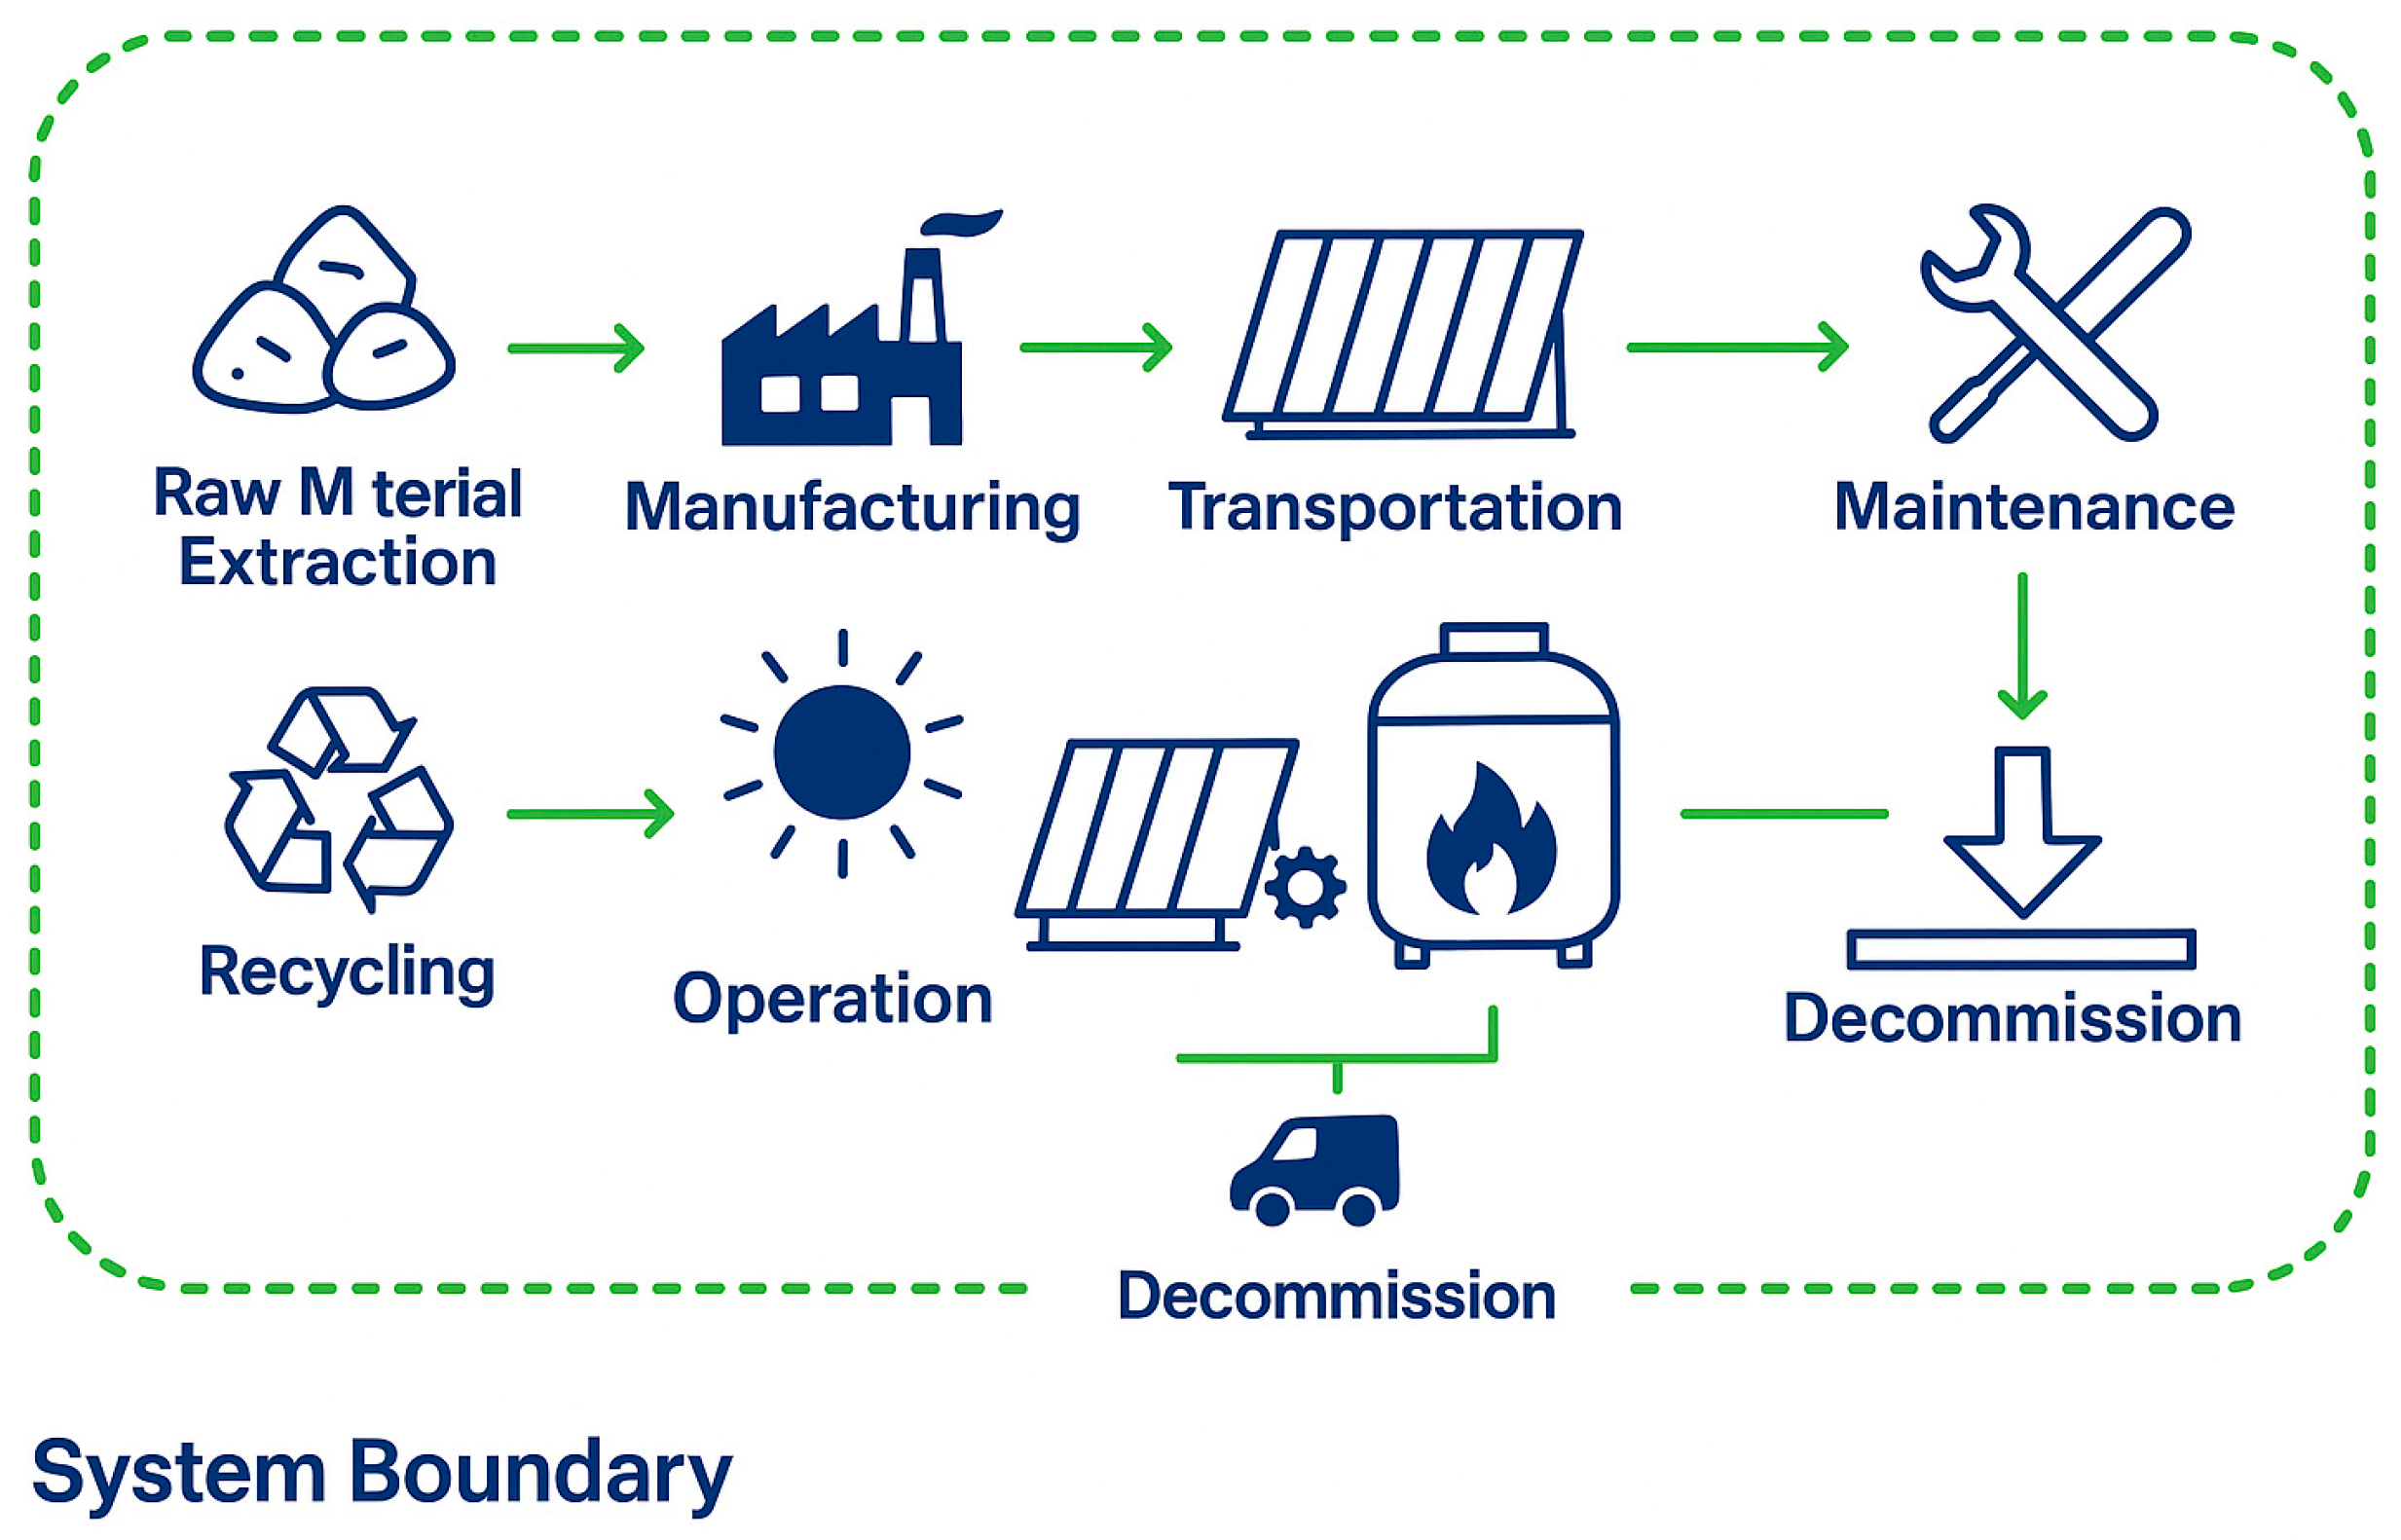
2.3.3. System Boundary
As illustrated in Figure 3, the system boundary adopts a cradle-to-grave perspective, covering the following phases:
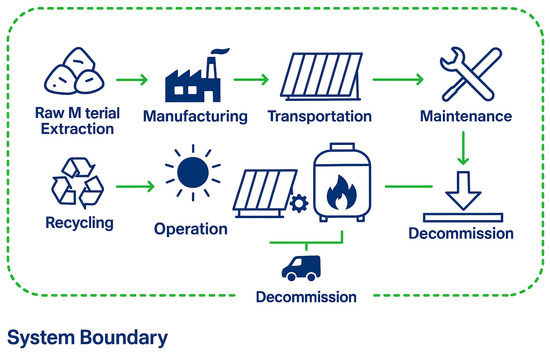
Figure 3.
System Boundary Diagram.
- Extraction and processing of raw materials for key components, including solar collectors, the TES tank, the desalination chamber, and the predictive control hardware.
- Manufacturing and assembly of system components.
- Transportation of all components to the installation site.
- Installation and commissioning procedures.
- Operational phase, including routine maintenance.
- Decommissioning, recycling, and final disposal.
Energy consumption during the operational phase was based on experimental measurements, while assumptions regarding material flows and recycling were aligned with standard industry practices in solar desalination.
Figure 3 presents the complete cradle-to-grave system boundary, encompassing material extraction, manufacturing, transportation, operation, maintenance, decommissioning, and recycling stages.
2.3.4. Life Cycle Inventory (LCI)
A cradle-to-grave LCA was conducted using the open-source OpenLCA 2.4.0 platform. Inventory data were obtained from publicly available datasets compatible with the ReCiPe 2016 Midpoint (H) method, encompassing all life cycle stages from raw material extraction to end-of-life treatment.
The major system components included in the inventory are as follows:
- Evacuated tube solar collectors—aluminum, glass, and copper.
- Thermal energy storage tank—carbon steel with polyurethane insulation.
- Desalination chamber—stainless steel structure with associated piping.
- Predictive control hardware—microcontrollers, sensors, and electrical cabling.
Key modeling assumptions:
- Lifespan of solar collectors: 25 years.
- TES tank service life: 20 years.
- Desalination chamber lifetime: 20 years.
- Predictive control system upgraded every 10 years.
- 90% recycling rate assumed for metals at end-of-life.
Electricity for auxiliary components—such as circulation pumps and control electronics—was assumed to be fully supplied by an on-site solar photovoltaic (PV) array, thereby minimizing indirect carbon emissions.
2.3.5. Impact Assessment Categories
Environmental impacts were quantified using the ReCiPe 2016 Midpoint (H) methodology. The following categories were selected due to their relevance to desalination and energy-intensive systems:
- Global Warming Potential (GWP)—kg CO2-equivalent per m3 of freshwater produced.
- Acidification Potential (AP)—kg SO2-equivalent per m3.
- Eutrophication Potential (EP)—kg PO43−-equivalent per m3.
- Ozone Depletion Potential (ODP)—kg CFC-11-equivalent per m3.
These impact indicators provide a well-rounded assessment of the system’s environmental footprint, encompassing climate effects, air quality degradation, nutrient pollution, and stratospheric ozone depletion [15].
This LCA follows a cradle-to-grave system boundary but assumes average disposal and recycling rates due to lack of region-specific end-of-life data. Inventory inputs were based on ecoinvent datasets, and regional conditions were modeled as static. These assumptions may introduce uncertainties, especially in long-term environmental impact estimates.
Although this study employs ReCiPe 2016 Midpoint for its robust midpoint characterization, future work could benefit from cross-methodological comparisons using alternative frameworks—such as Impact World+ or Environmental Footprint 3.0—to further enhance the environmental rigor and policy relevance of the findings.
2.4. Techno-Economic Analysis Methodology
This section presents a detailed TEA to evaluate the cost-effectiveness and financial feasibility of the proposed solar-thermal desalination system. The analysis incorporates capital and operational expenditures and computes financial performance indicators using real-world experimental data. This approach addresses reviewer concerns regarding the integration of a structured and transparent economic assessment aligned with the study’s sustainability objectives.
2.4.1. Objective
The primary objective of the TEA is to evaluate three key financial indicators:
- Levelized Cost of Water (LCOW).
- Net Present Value (NPV).
- Internal Rate of Return (IRR).
Collectively, these metrics assess the system’s long-term financial viability by incorporating capital investment, operational expenditures, and market-related uncertainties.
2.4.2. Cost Breakdown and Data Sources
Cost data were obtained from experimental invoices, supplier quotations, and peer-reviewed benchmarks of comparable technologies implemented in Middle Eastern markets.
Costs were categorized into two main groups:
- Capital Expenditures (CAPEX): solar collectors, TES tank, desalination chamber, predictive control hardware, instrumentation, and installation.
- Operational Expenditures (OPEX): maintenance, sensor recalibration, pumping energy, and minor repairs.
The depreciation schedule and overall costing framework were based on internationally recognized engineering economic guidelines, including those provided by ASHRAE and NREL.
2.4.3. Capital Cost Estimation
The major capital cost components comprise the following:
- Solar collector array (evacuated tube collectors).
- TES unit (carbon steel tank with polyurethane insulation).
- Multi-stage flash (MSF) desalination chamber (constructed from stainless steel).
- Predictive control hardware, including controllers, sensors, and communication modules.
- Installation and commissioning expenses.
All cost estimates were cross-validated against supplier quotations and prevailing market prices. A contingency margin of 10% was applied to account for scale-up uncertainties and unforeseen expenses.
2.4.4. Operational and Maintenance Costs
Annual operation and maintenance (O&M) costs include the following components:
- Labor savings due to system automation.
- Scheduled replacement of controller units every 10 years.
- Routine inspections and maintenance materials.
- Auxiliary systems powered by solar energy, such as pumps and control units.
An annual cost escalation rate of 1.5% was applied to account for inflation, consistent with techno-economic assessment (TEA) standards in the renewable energy sector [22].
2.4.5. Financial Assumptions
The techno-economic analysis was conducted under the following baseline assumptions:
- Project lifetime: 25 years.
- Discount rate: 7%.
- Electricity cost: $0.10 per kWh (based on solar PV, with negligible grid backup).
- Water selling price (baseline): $1.00 per cubic meter.
- Inflation rate: 2%.
To evaluate financial robustness, a sensitivity analysis was performed across the following parameters:
- Discount rate: varied between 5% and 10%.
- Water price: varied from $0.80 to $1.20 per cubic meter.
- Capital cost: examined under a potential reduction of up to 20%.
2.4.6. Economic Performance Metrics
The economic feasibility of the system was evaluated using three primary indicators: LCOW, NPV, and IRR.
(1) Levelized Cost of Water:
Levelized Cost of Water is calculated using:
- where:
(2) Net Present Value:
where is the net cash flow in year .
The variables are defined in the Nomenclature section.
(3) Internal Rate of Return:
Determined as the discount rate r that results in an NPV equal to zero.
The IRR is the discount rate r that results in an NPV equal to zero.
Definitions of all variables are provided in the Nomenclature section for clarity and consistency.
2.4.7. Sensitivity Analysis
To evaluate the robustness of the economic model, a parametric sensitivity analysis was performed. Key variables were independently varied within realistic bounds to assess their impact on financial outcomes. The tested parameters included:
- Capital expenditures (±20%).
- Discount rate (ranging from 4% to 10%).
- Water yield (±15%, accounting for variability in solar irradiance).
- Maintenance and labor costs.
This analysis provided insights into the system’s financial resilience under uncertainty and highlighted the influence of TES performance and predictive control accuracy on overall economic viability.
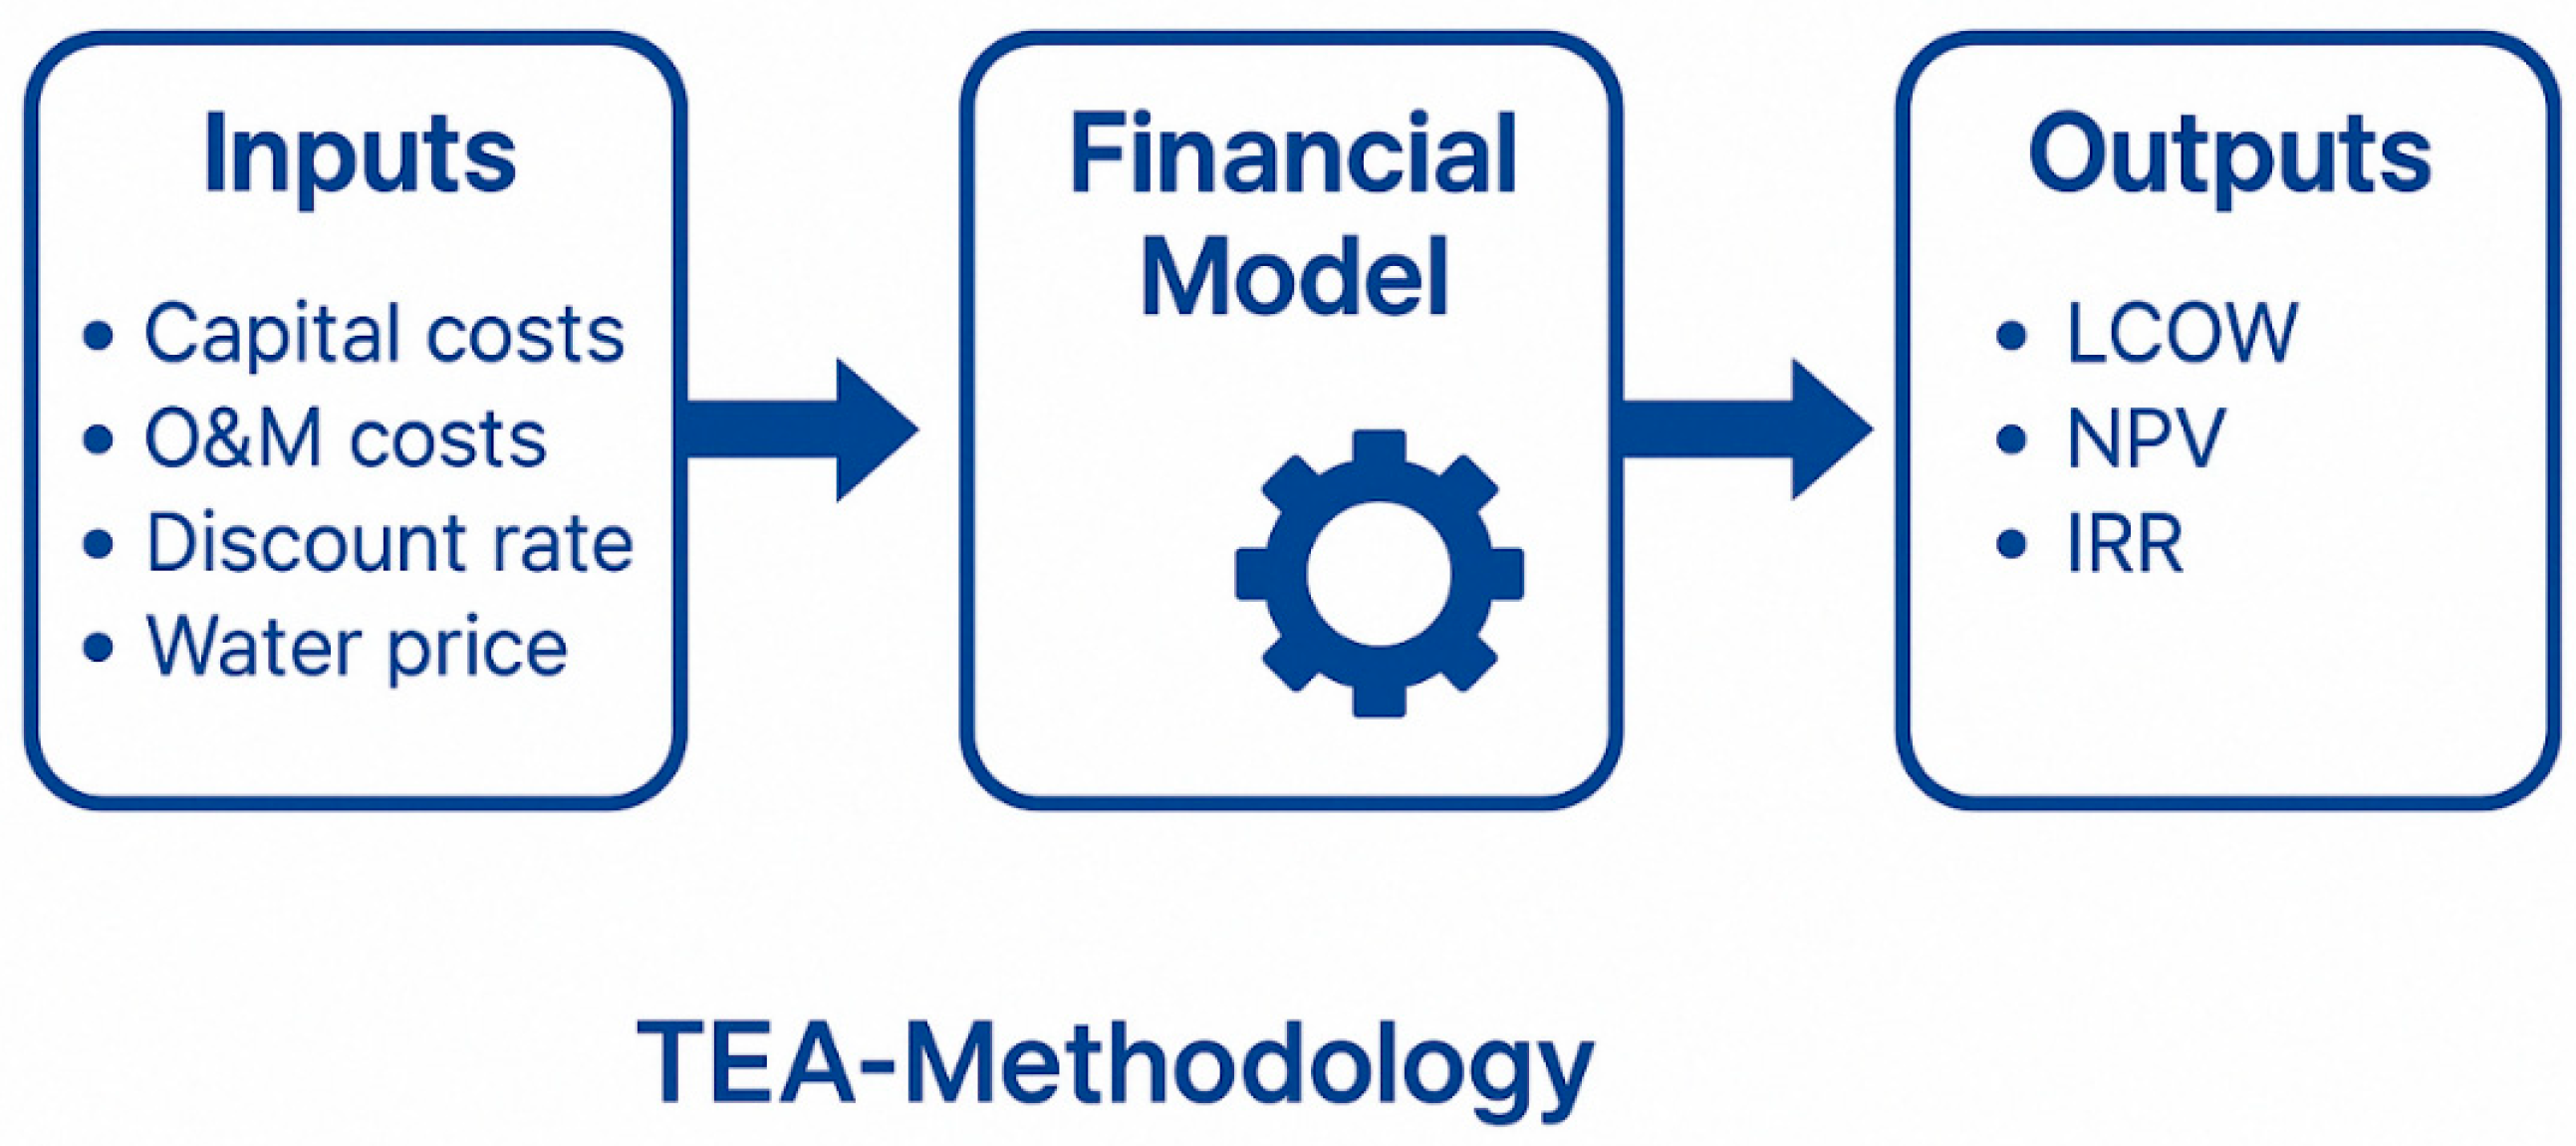
2.4.8. Workflow Diagram
Figure 4 illustrates the workflow of the TEA methodology. It presents the input data comprising capital and operational costs, technical performance metrics, and solar irradiance forecasts as well as the modeling sequence that leads to the calculation of key financial indicators, including LCOW, NPV, and IRR.
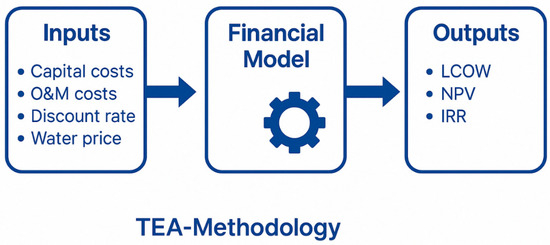
Figure 4.
Workflow of the Techno-Economic Analysis.
2.4.9. Model Validation
The model was validated using thermal and freshwater yield data collected over five consecutive clear-sky days. For benchmarking purposes, a baseline on–off control strategy was implemented. Performance metrics included:
- Root Mean Square Error (RMSE).
- Mean Absolute Percentage Error (MAPE).
- Reliability Ratio.
This validation procedure enhances the credibility of the predictive-controlled solar desalination system and confirms its potential for real-world application.
2.4.10. Integration with LCA
The TEA results were interpreted in conjunction with the LCA outcomes to provide a unified and comprehensive perspective on system sustainability. The integration of predictive control contributed to improved cost stability and reduced operational variability, thereby reinforcing both the environmental and economic advantages of the proposed solar desalination system.
3. Results and Discussion
This section presents the integrated findings from the LCA, TEA, and experimental validation of thermal performance. The results are structured to emphasize both quantitative outcomes and their alignment with key reviewer recommendations, thereby strengthening the credibility and practical significance of the proposed predictive-controlled solar-thermal desalination system.
3.1. LCAResults
A cradle-to-grave LCA was performed and normalized per 1 cubic meter (1 m3) of freshwater produced. Environmental impacts were assessed across four midpoint categories using the ReCiPe 2016 Midpoint (H) method: GWP, AP, EP, and ODP. Table 2 summarizes the total impact values and the relative contributions of each life cycle phase including manufacturing, operation, maintenance, and end-of-life disposal.
Table 2.
Life cycle impact assessment results per cubic meter of freshwater produced.
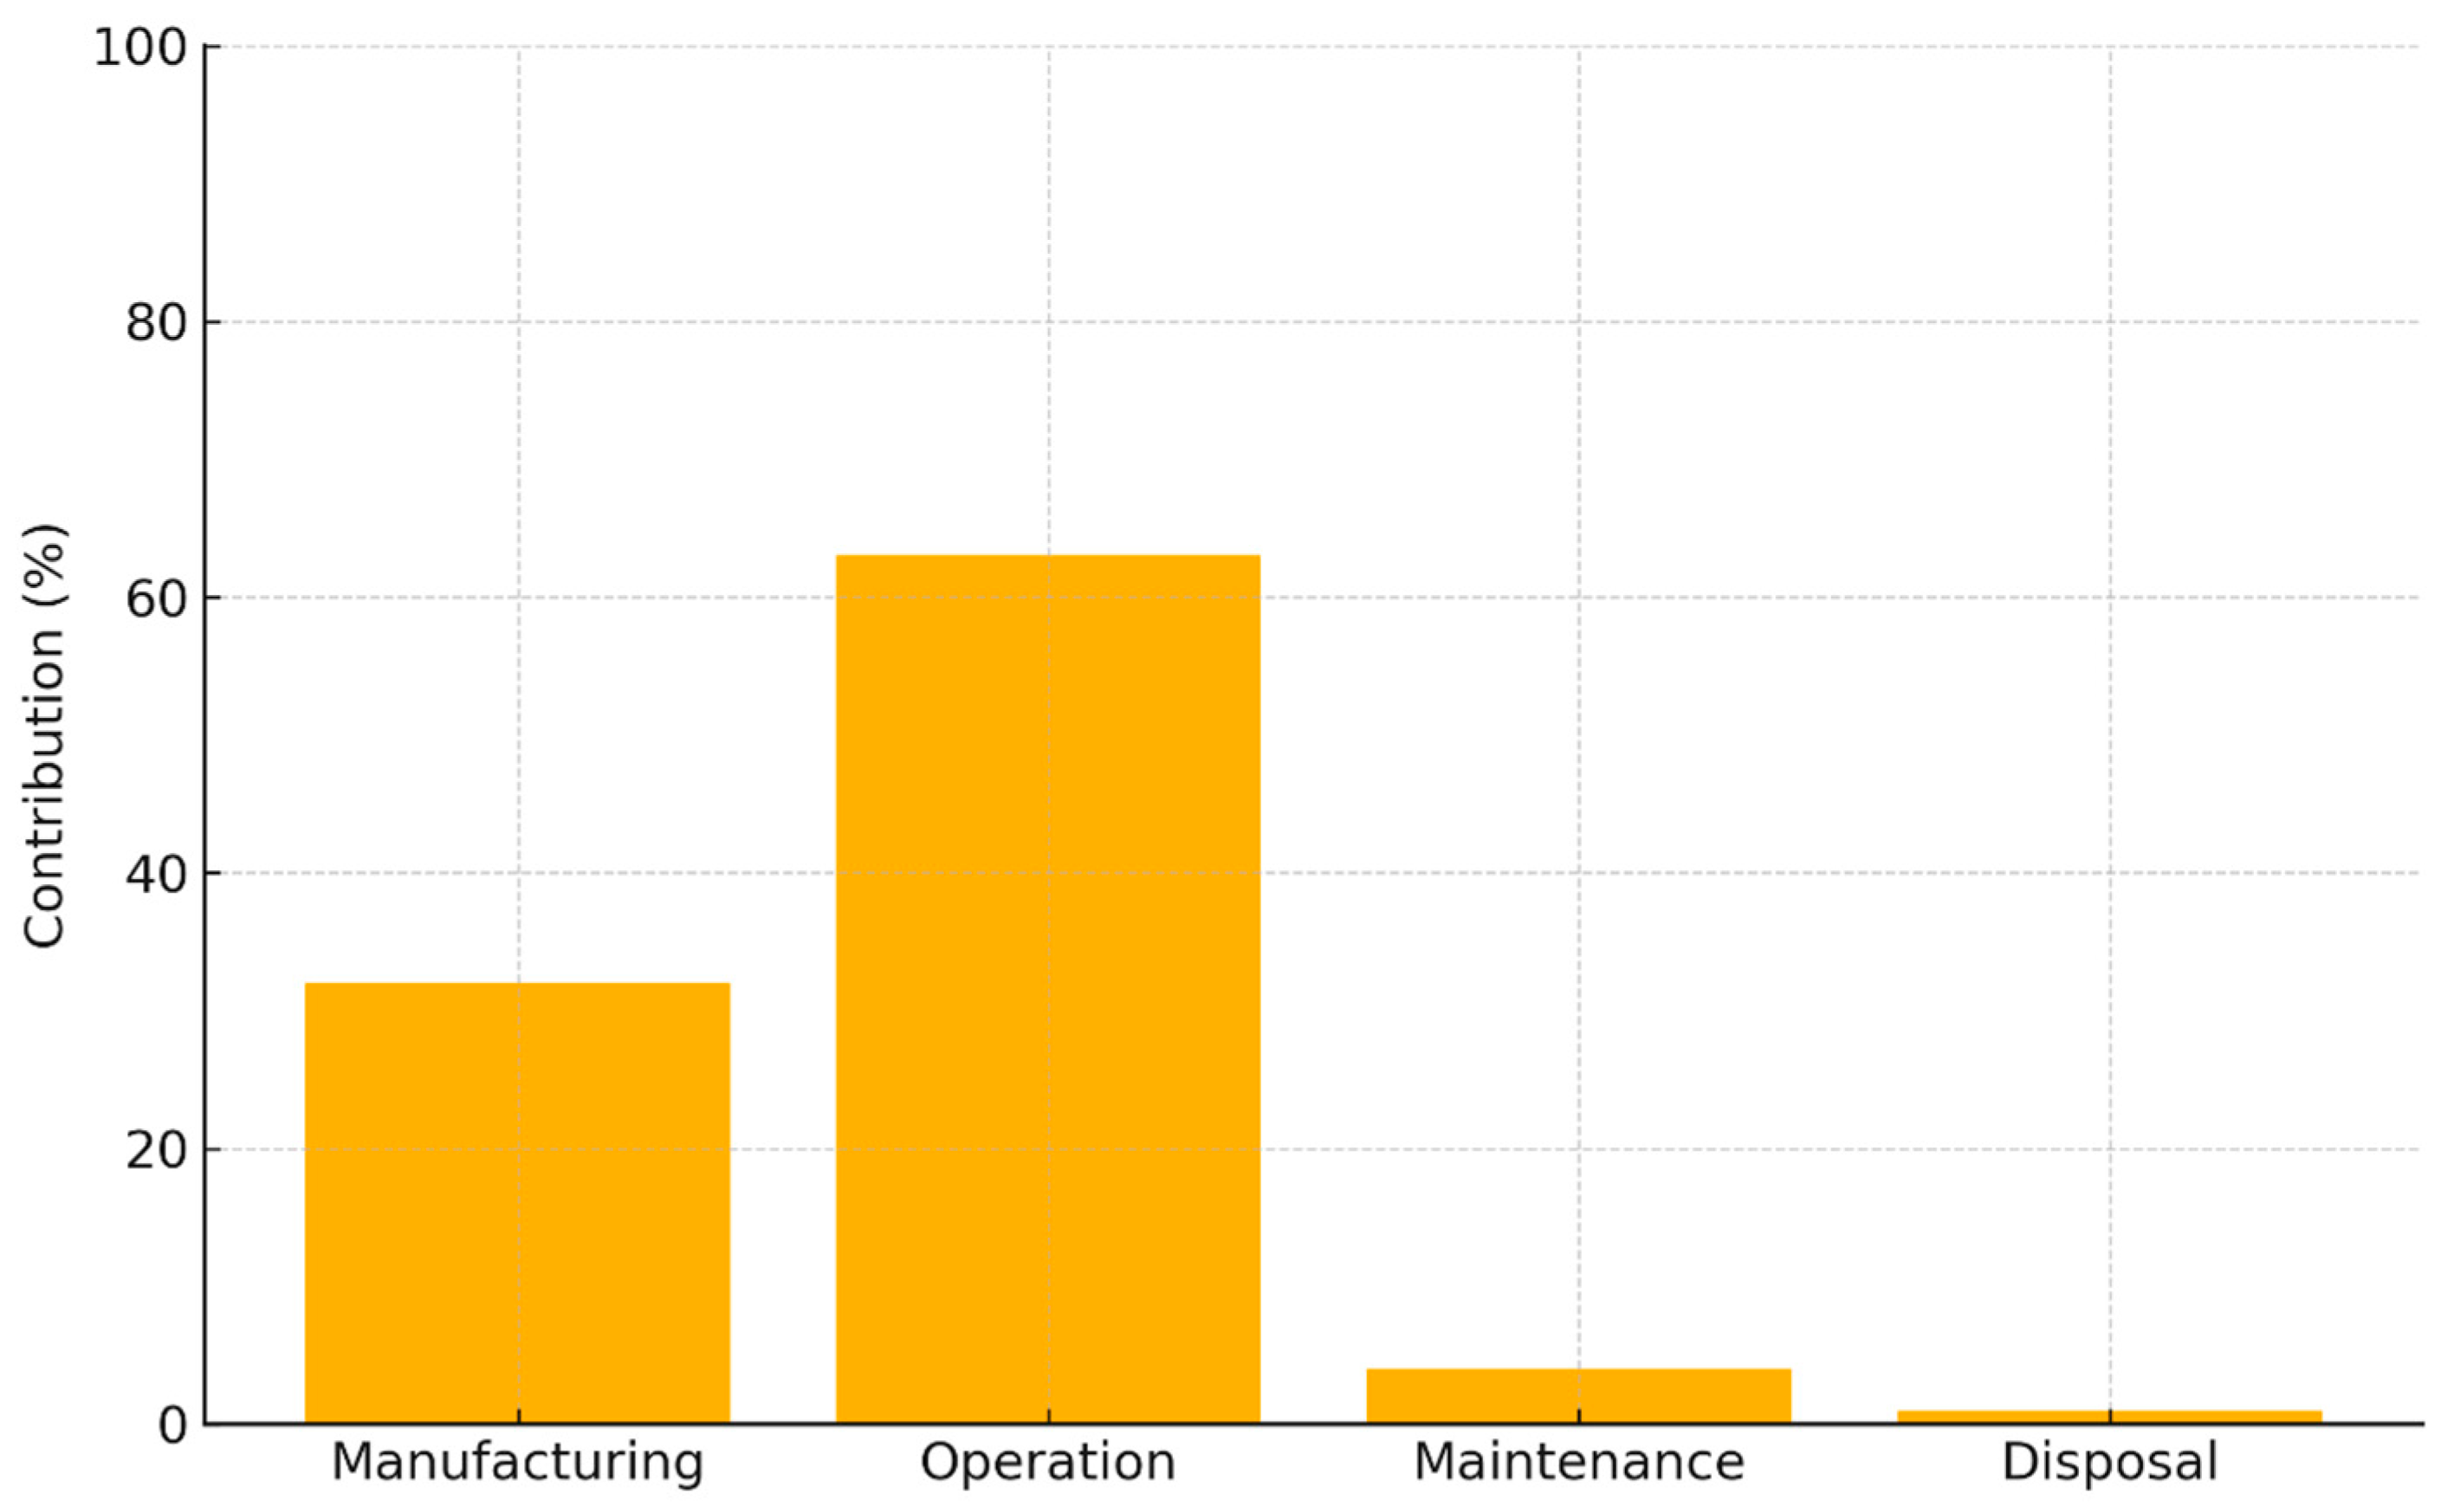
The operational and manufacturing stages were the most environmentally impactful across all categories, particularly for GWP and ODP. The operational phase accounted for 63% of total GWP, primarily due to auxiliary energy consumption (e.g., pumps and control electronics). In contrast, maintenance and end-of-life disposal stages contributed minimally, less than or equal to 8%, highlighting the system’s favorable post-use sustainability profile.
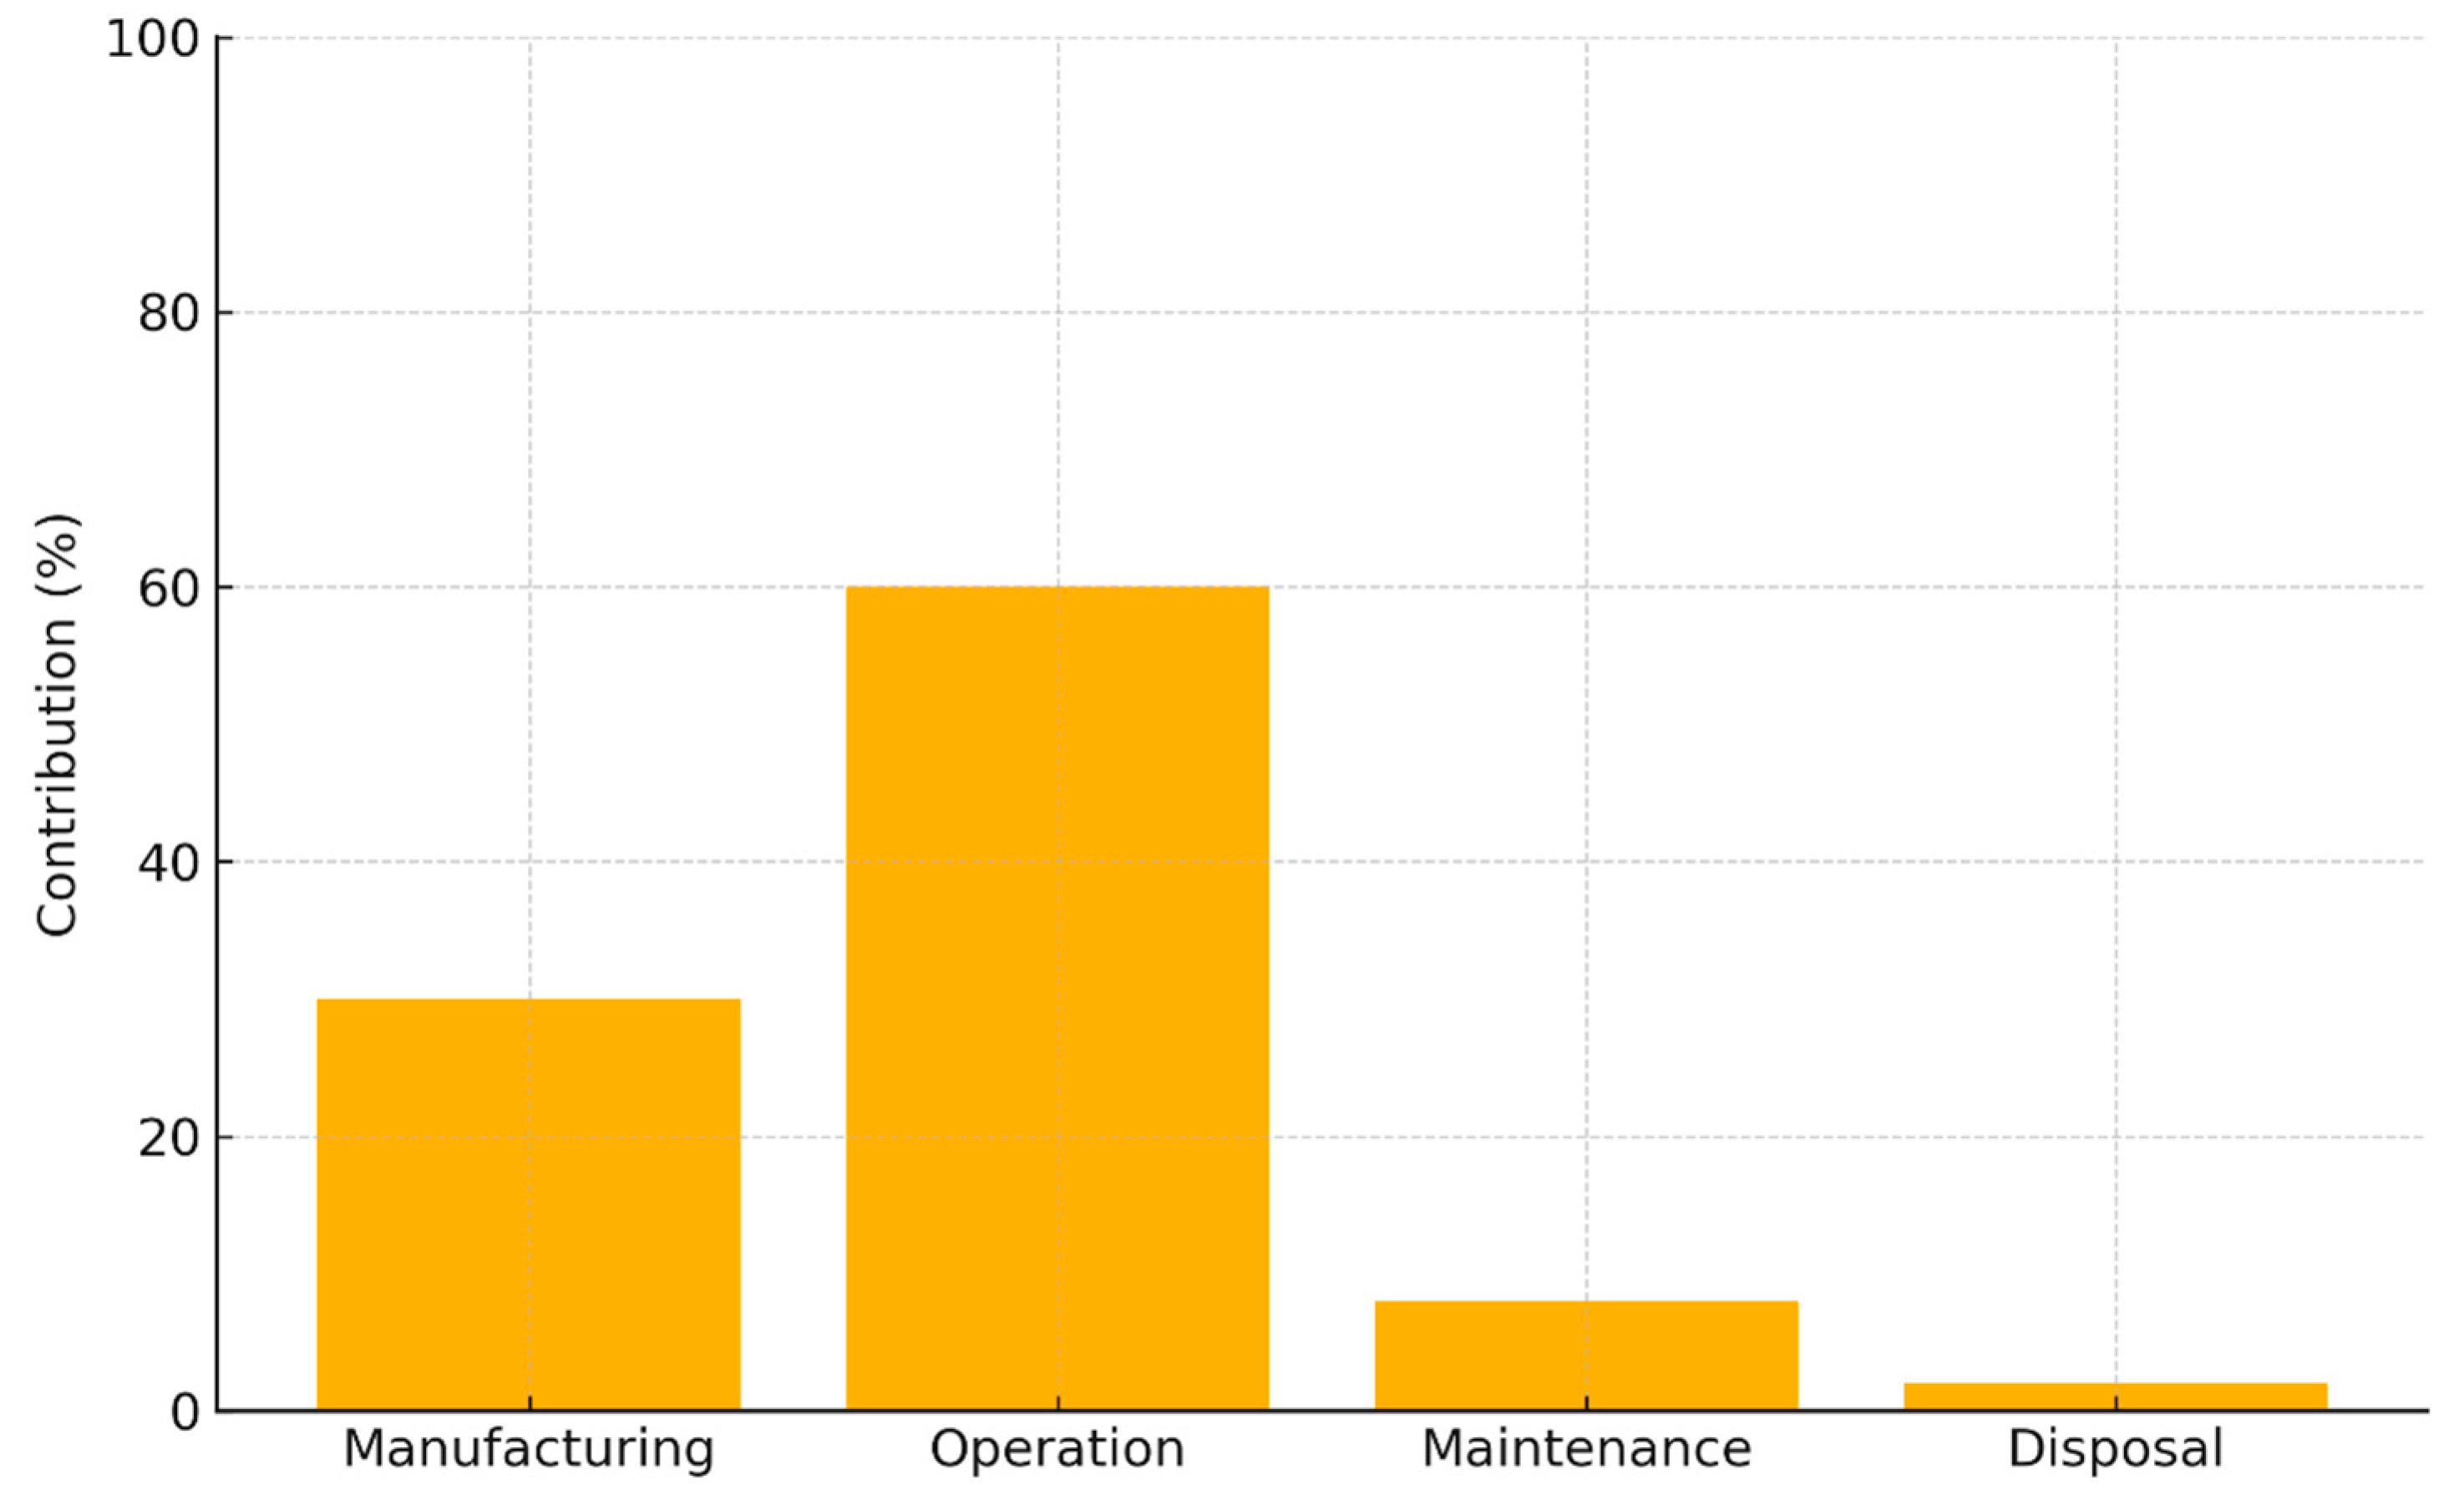
As illustrated in Figure 5, the dominance of operational emissions underscores the importance of integrating renewable-powered auxiliary systems and implementing predictive control strategies to minimize unnecessary thermal cycling and energy consumption. These findings emphasize the strategic role of TES stability and control accuracy in reducing the system’s overall environmental impact.

Figure 5.
Bar chart of GWP contribution by life cycle stage.
Key Observations from the GWP and Related Impact Analyses
A detailed breakdown of environmental contributions across life cycle stages yielded the following insights:
- The operation phase was the primary contributor to GWP, responsible for approximately 63% of total emissions, mainly due to auxiliary energy consumption such as pumping and sensor operation.
- The manufacturing phase accounted for around 32% of total GWP, driven largely by the material-intensive nature of the evacuated tube solar collectors and the TES tank.
- The maintenance and disposal phases combined contributed less than 5%, indicating negligible environmental burdens during upkeep and end-of-life processes.
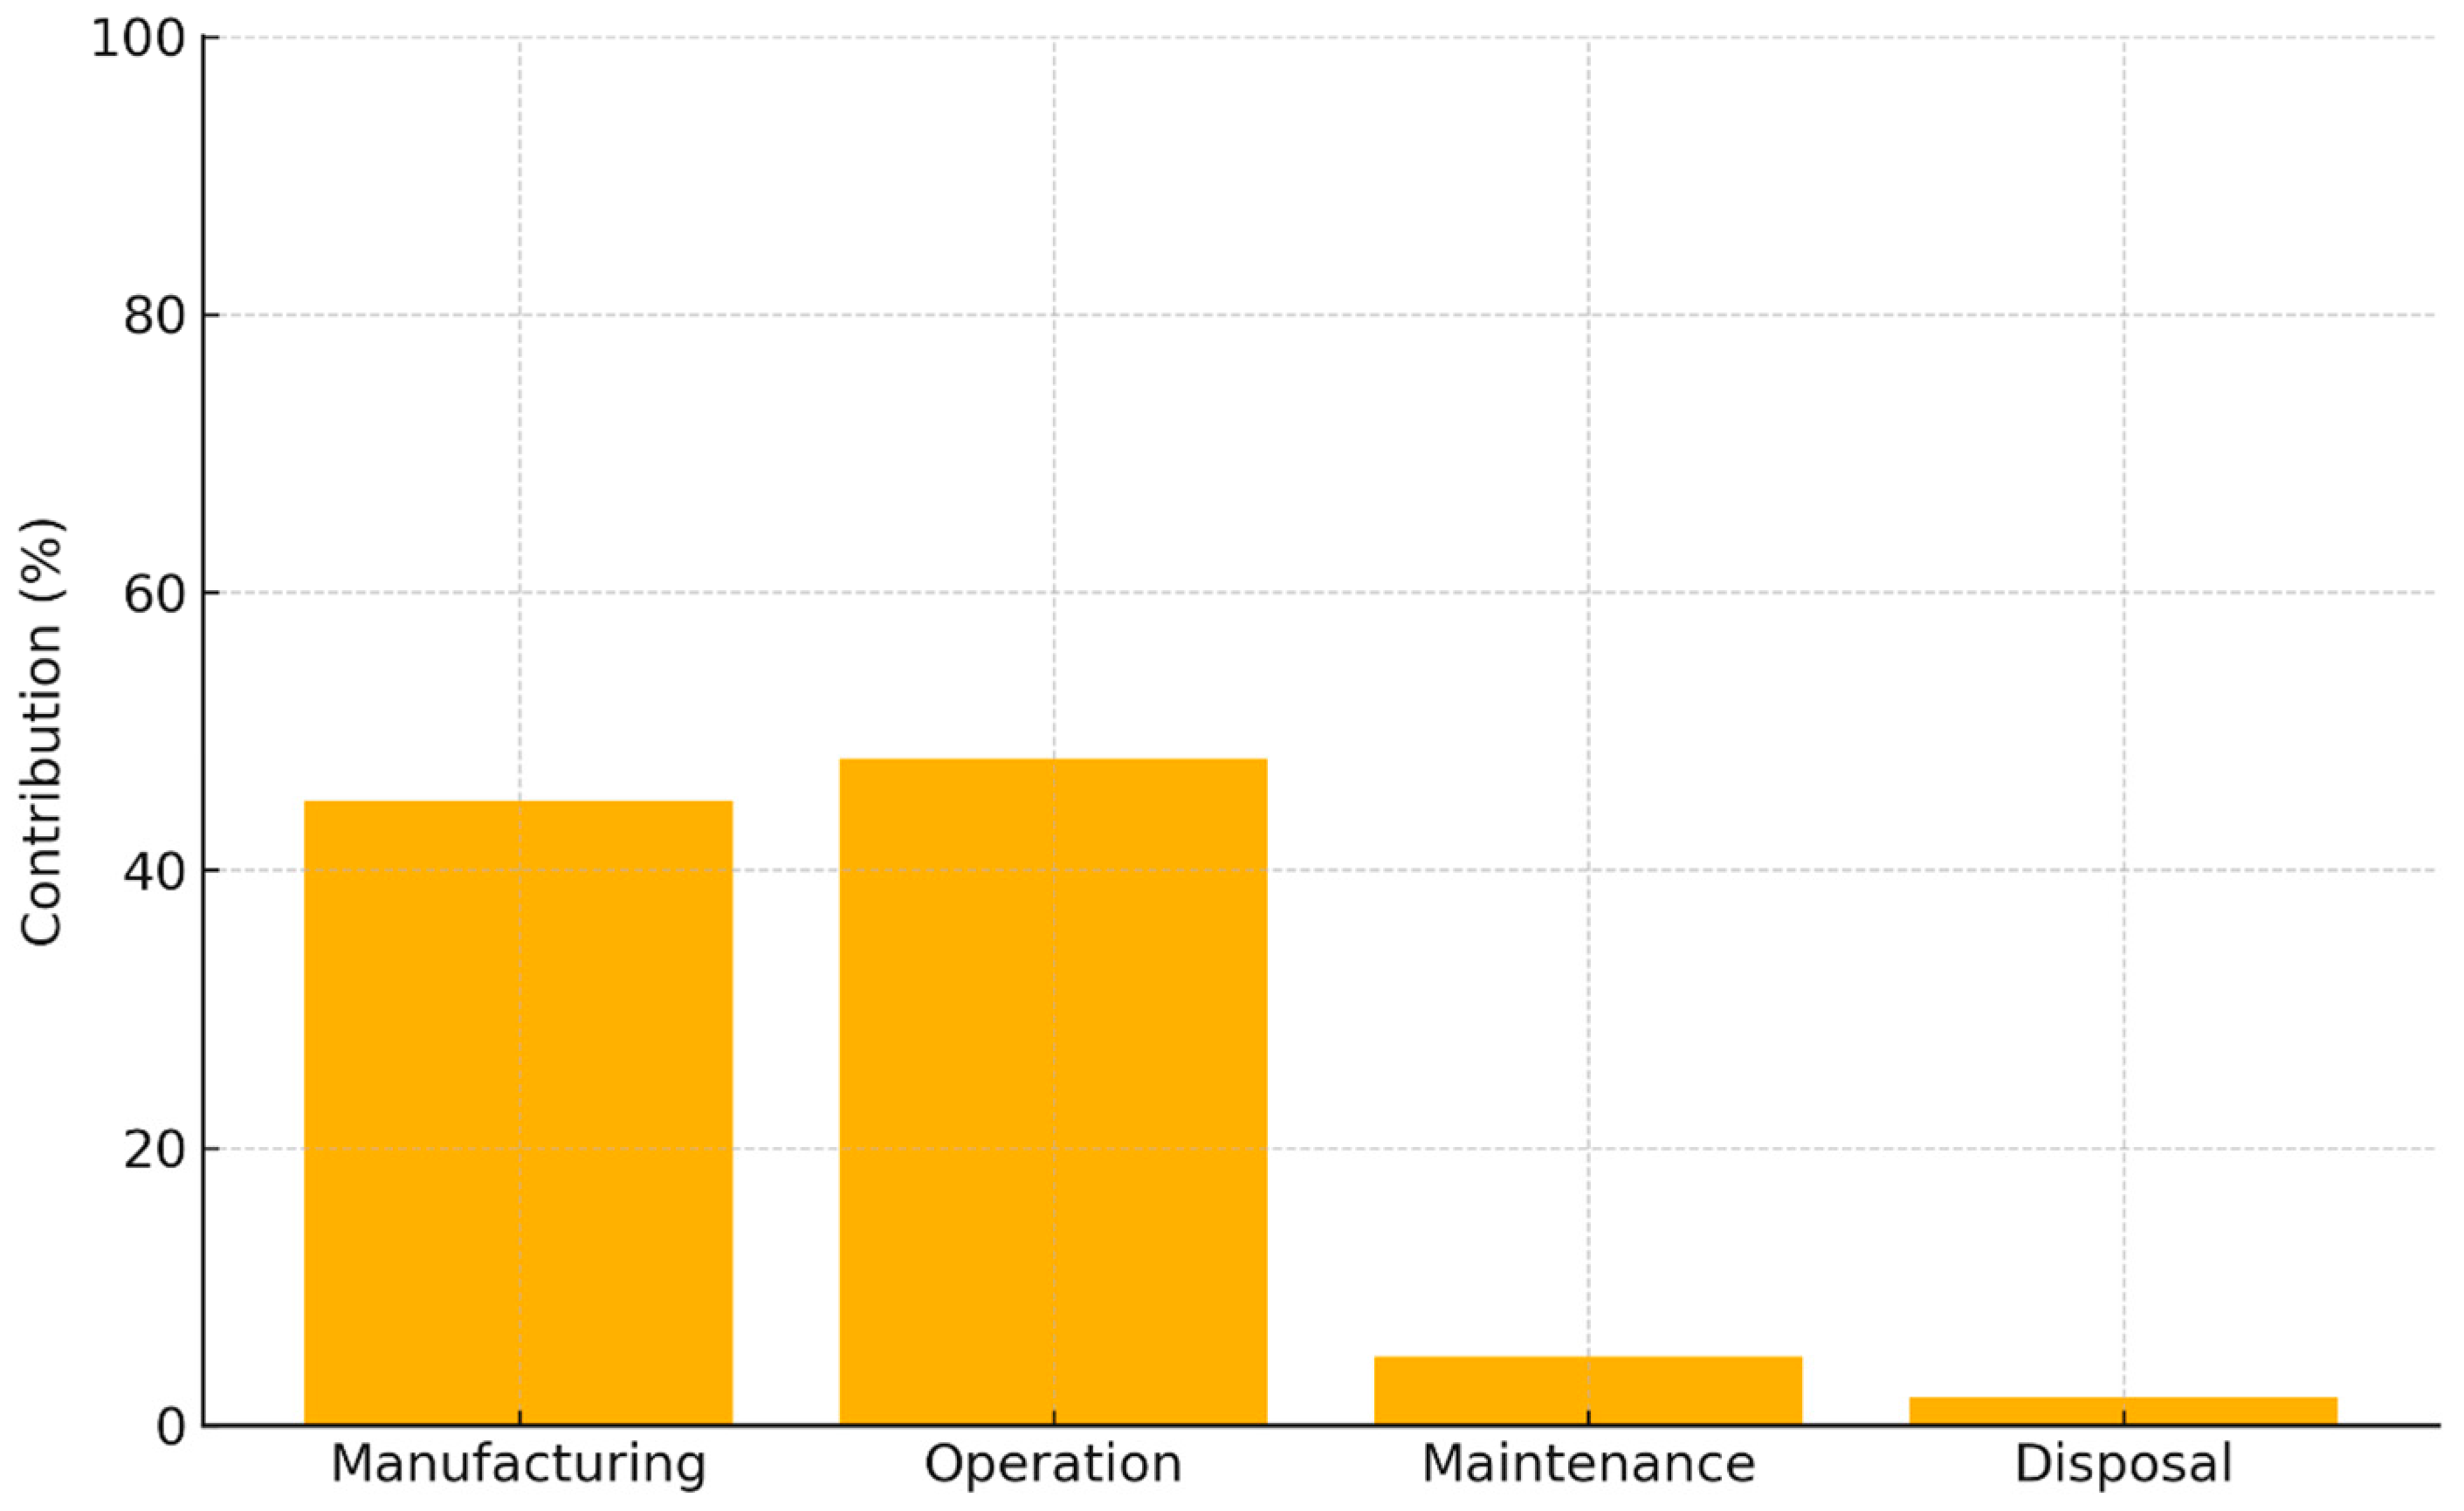
Supporting these findings, Figure 6, Figure 7 and Figure 8 illustrate environmental contributions for AP, EP, and ODP, respectively.

Figure 6.
AP contribution by life cycle stage.
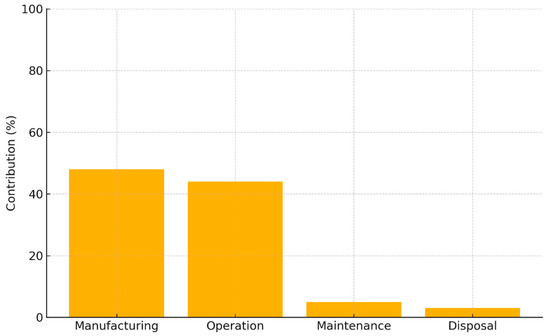
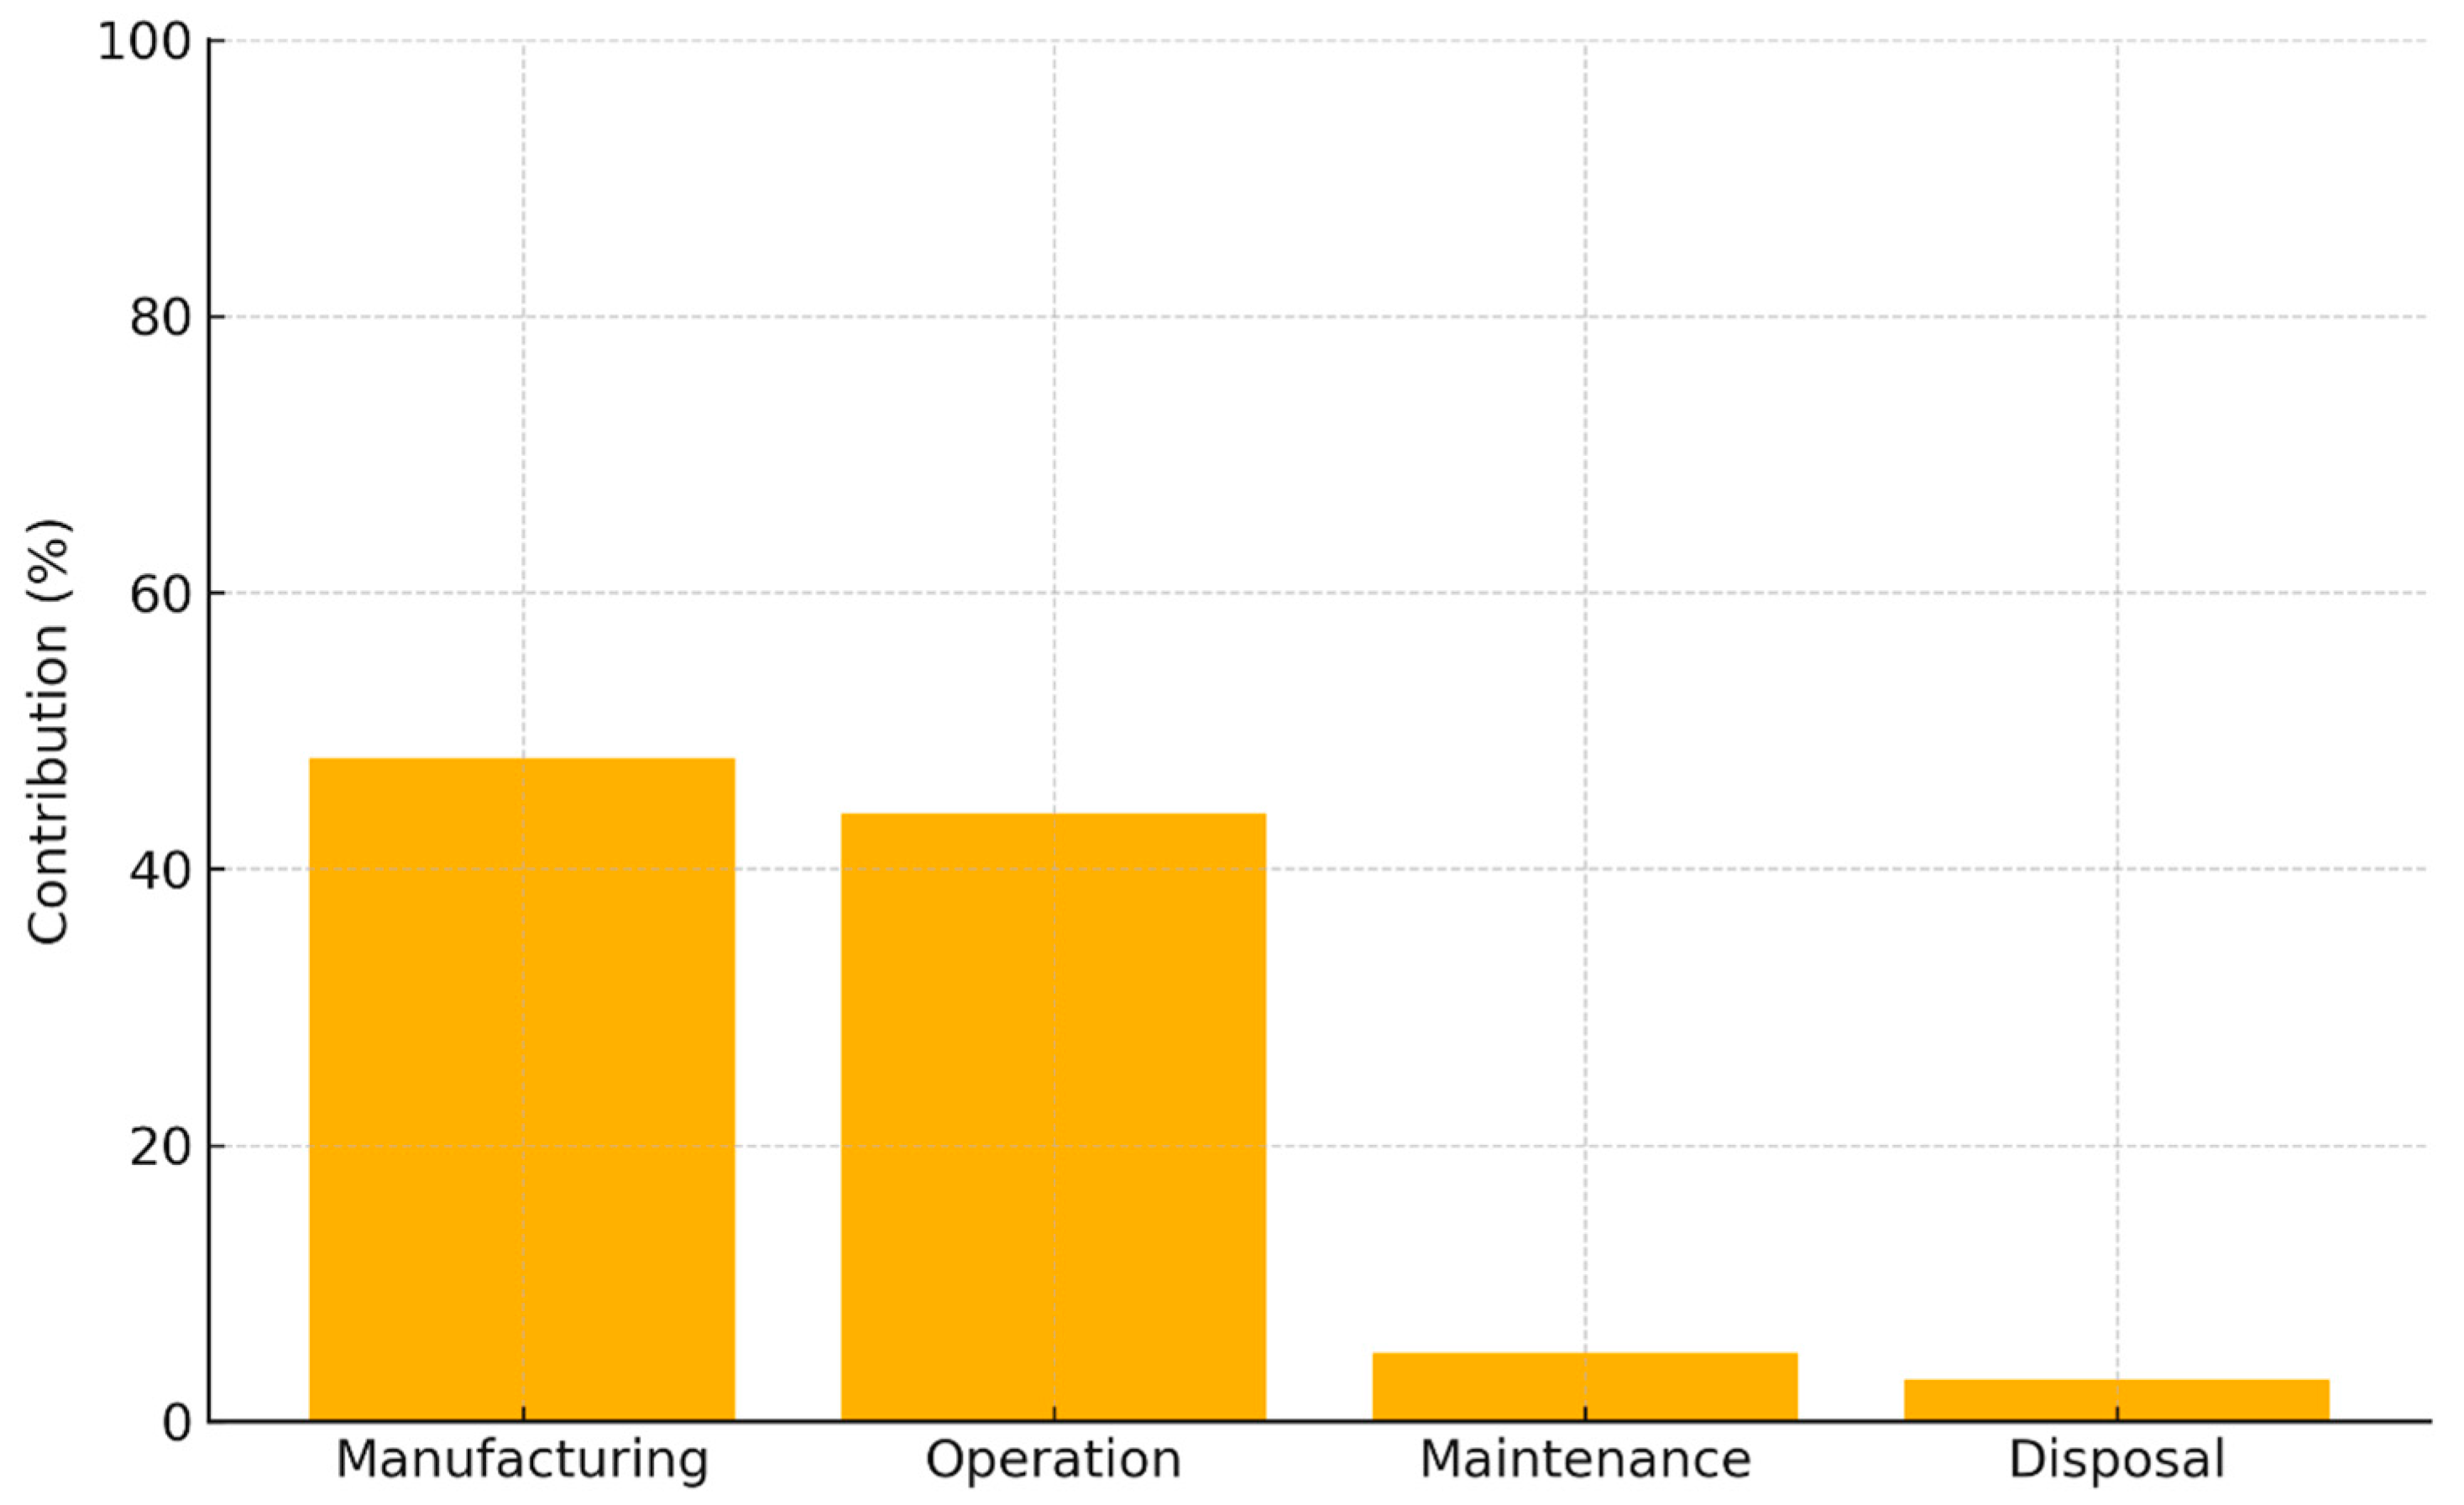
Figure 7.
EP contribution by life cycle stage.

Figure 8.
ODP contribution by life cycle stage.
Consistent trends were observed across all categories: operation and manufacturing phases overwhelmingly dominated environmental impacts, while maintenance and disposal remained minimal. These results highlight the critical importance of improving operational energy efficiency—such as refining TES temperature management and optimizing feedwater flow—and selecting environmentally preferable materials during the manufacturing phase to reduce upstream emissions.
3.2. Techno-Economic Analysis Results
The TEA affirms the financial feasibility of the proposed solar-thermal desalination system under high-irradiance conditions typical of the Middle East. Baseline financial indicators are as follows:
- Levelized Cost of Water: $0.88/m3.
- Net Present Value: Positive at a 7% discount rate.
- Internal Rate of Return: 11.5%.
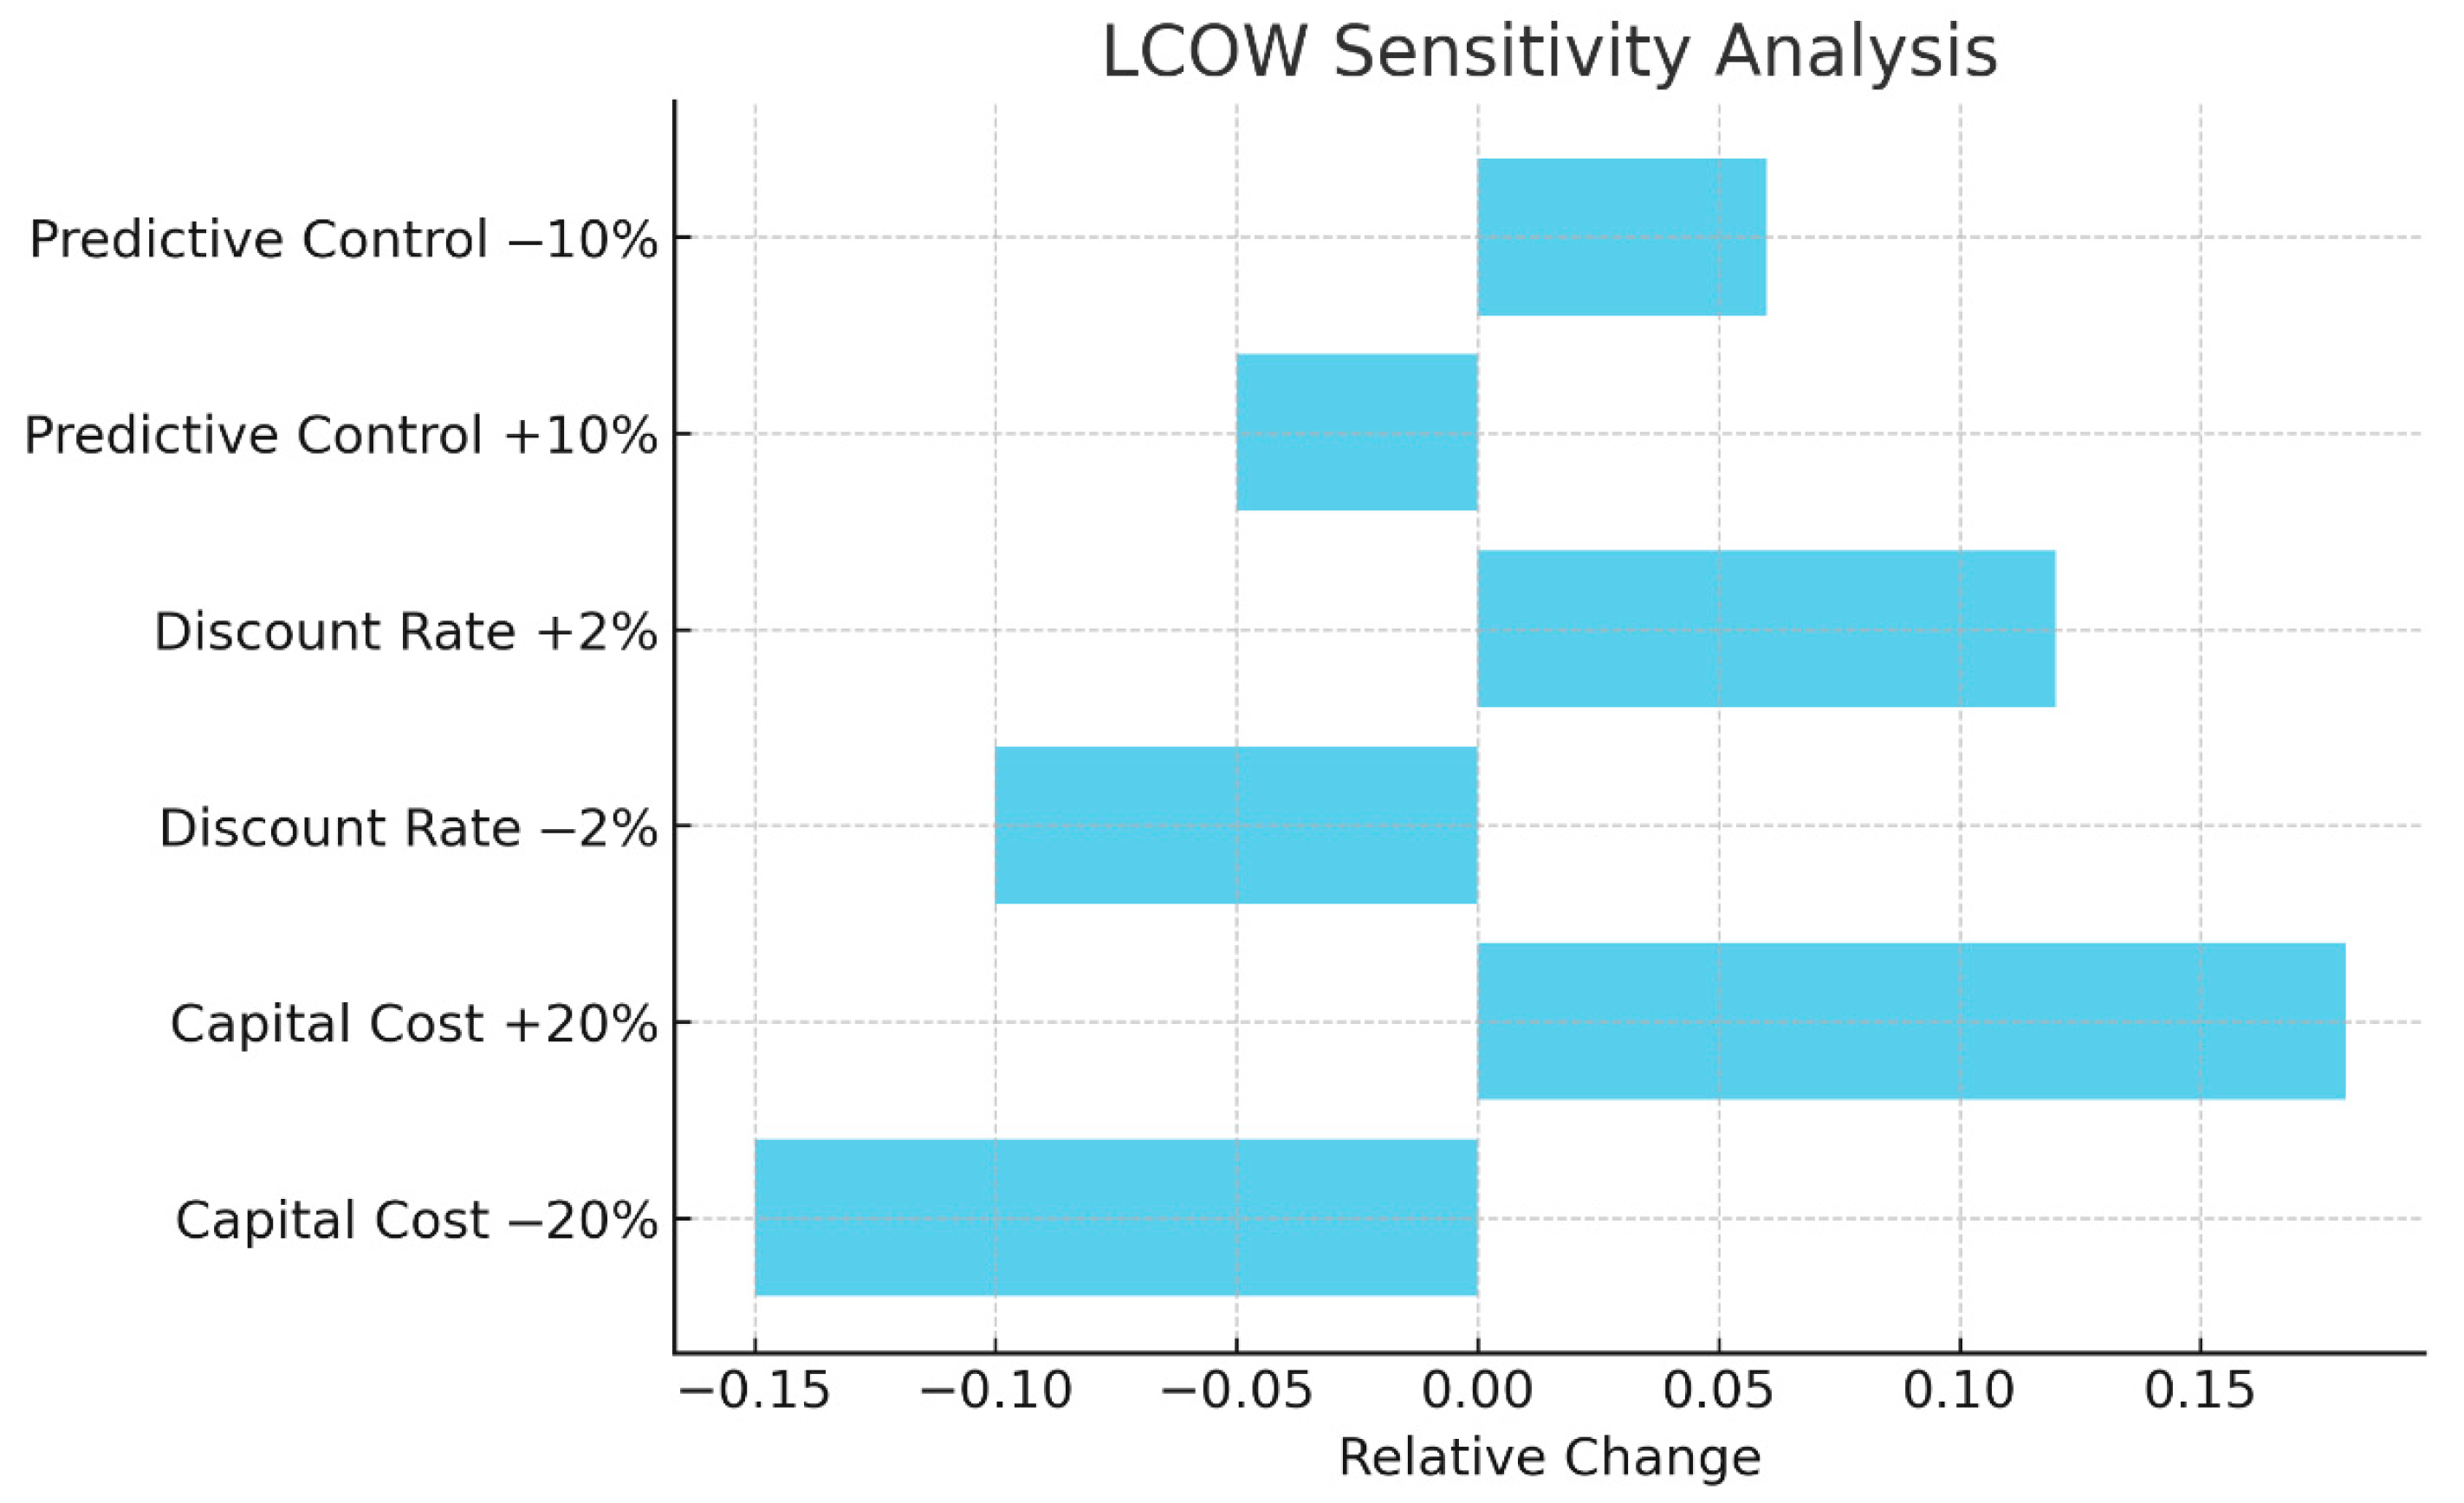
To evaluate the sensitivity of LCOW to fluctuations in key input variables, a tornado diagram is provided in Figure 9. The analysis reveals the following critical influences:

Figure 9.
Tornado diagram showing LCOW sensitivity.
- A 20% reduction in capital costs yields approximately a 15% decrease in LCOW.
- A 10% improvement in predictive control accuracy leads to a further 5% reduction in LCOW.
These results emphasize the dual importance of cost optimization in system hardware and enhancements in forecasting precision. Together, these factors play a pivotal role in improving economic outcomes. When coupled with the LCA results, the TEA outcomes reinforce the system’s balanced sustainability profile and long-term economic viability.
3.2.1. Discount Rate Sensitivity: NPV
Figure 10 illustrates the sensitivity of the NPV to changes in the discount rate. The analysis reveals a clear inverse correlation between the discount rate and long-term project profitability:
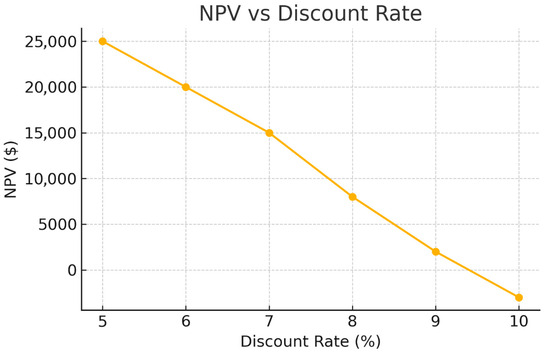
Figure 10.
NPV vs. Discount Rate curve.
- A positive NPV is maintained for discount rates up to approximately 9.5%, indicating the project’s financial viability across a broad spectrum of financing conditions.
- When the discount rate falls below 6%, a significant increase in NPV is observed, underscoring the system’s strong financial resilience under favorable economic conditions or subsidized lending scenarios.
These findings underscore the critical role of financial structuring and access to low-cost capital in enhancing the economic attractiveness of solar-thermal desalination, particularly in emerging markets and development-focused regions.
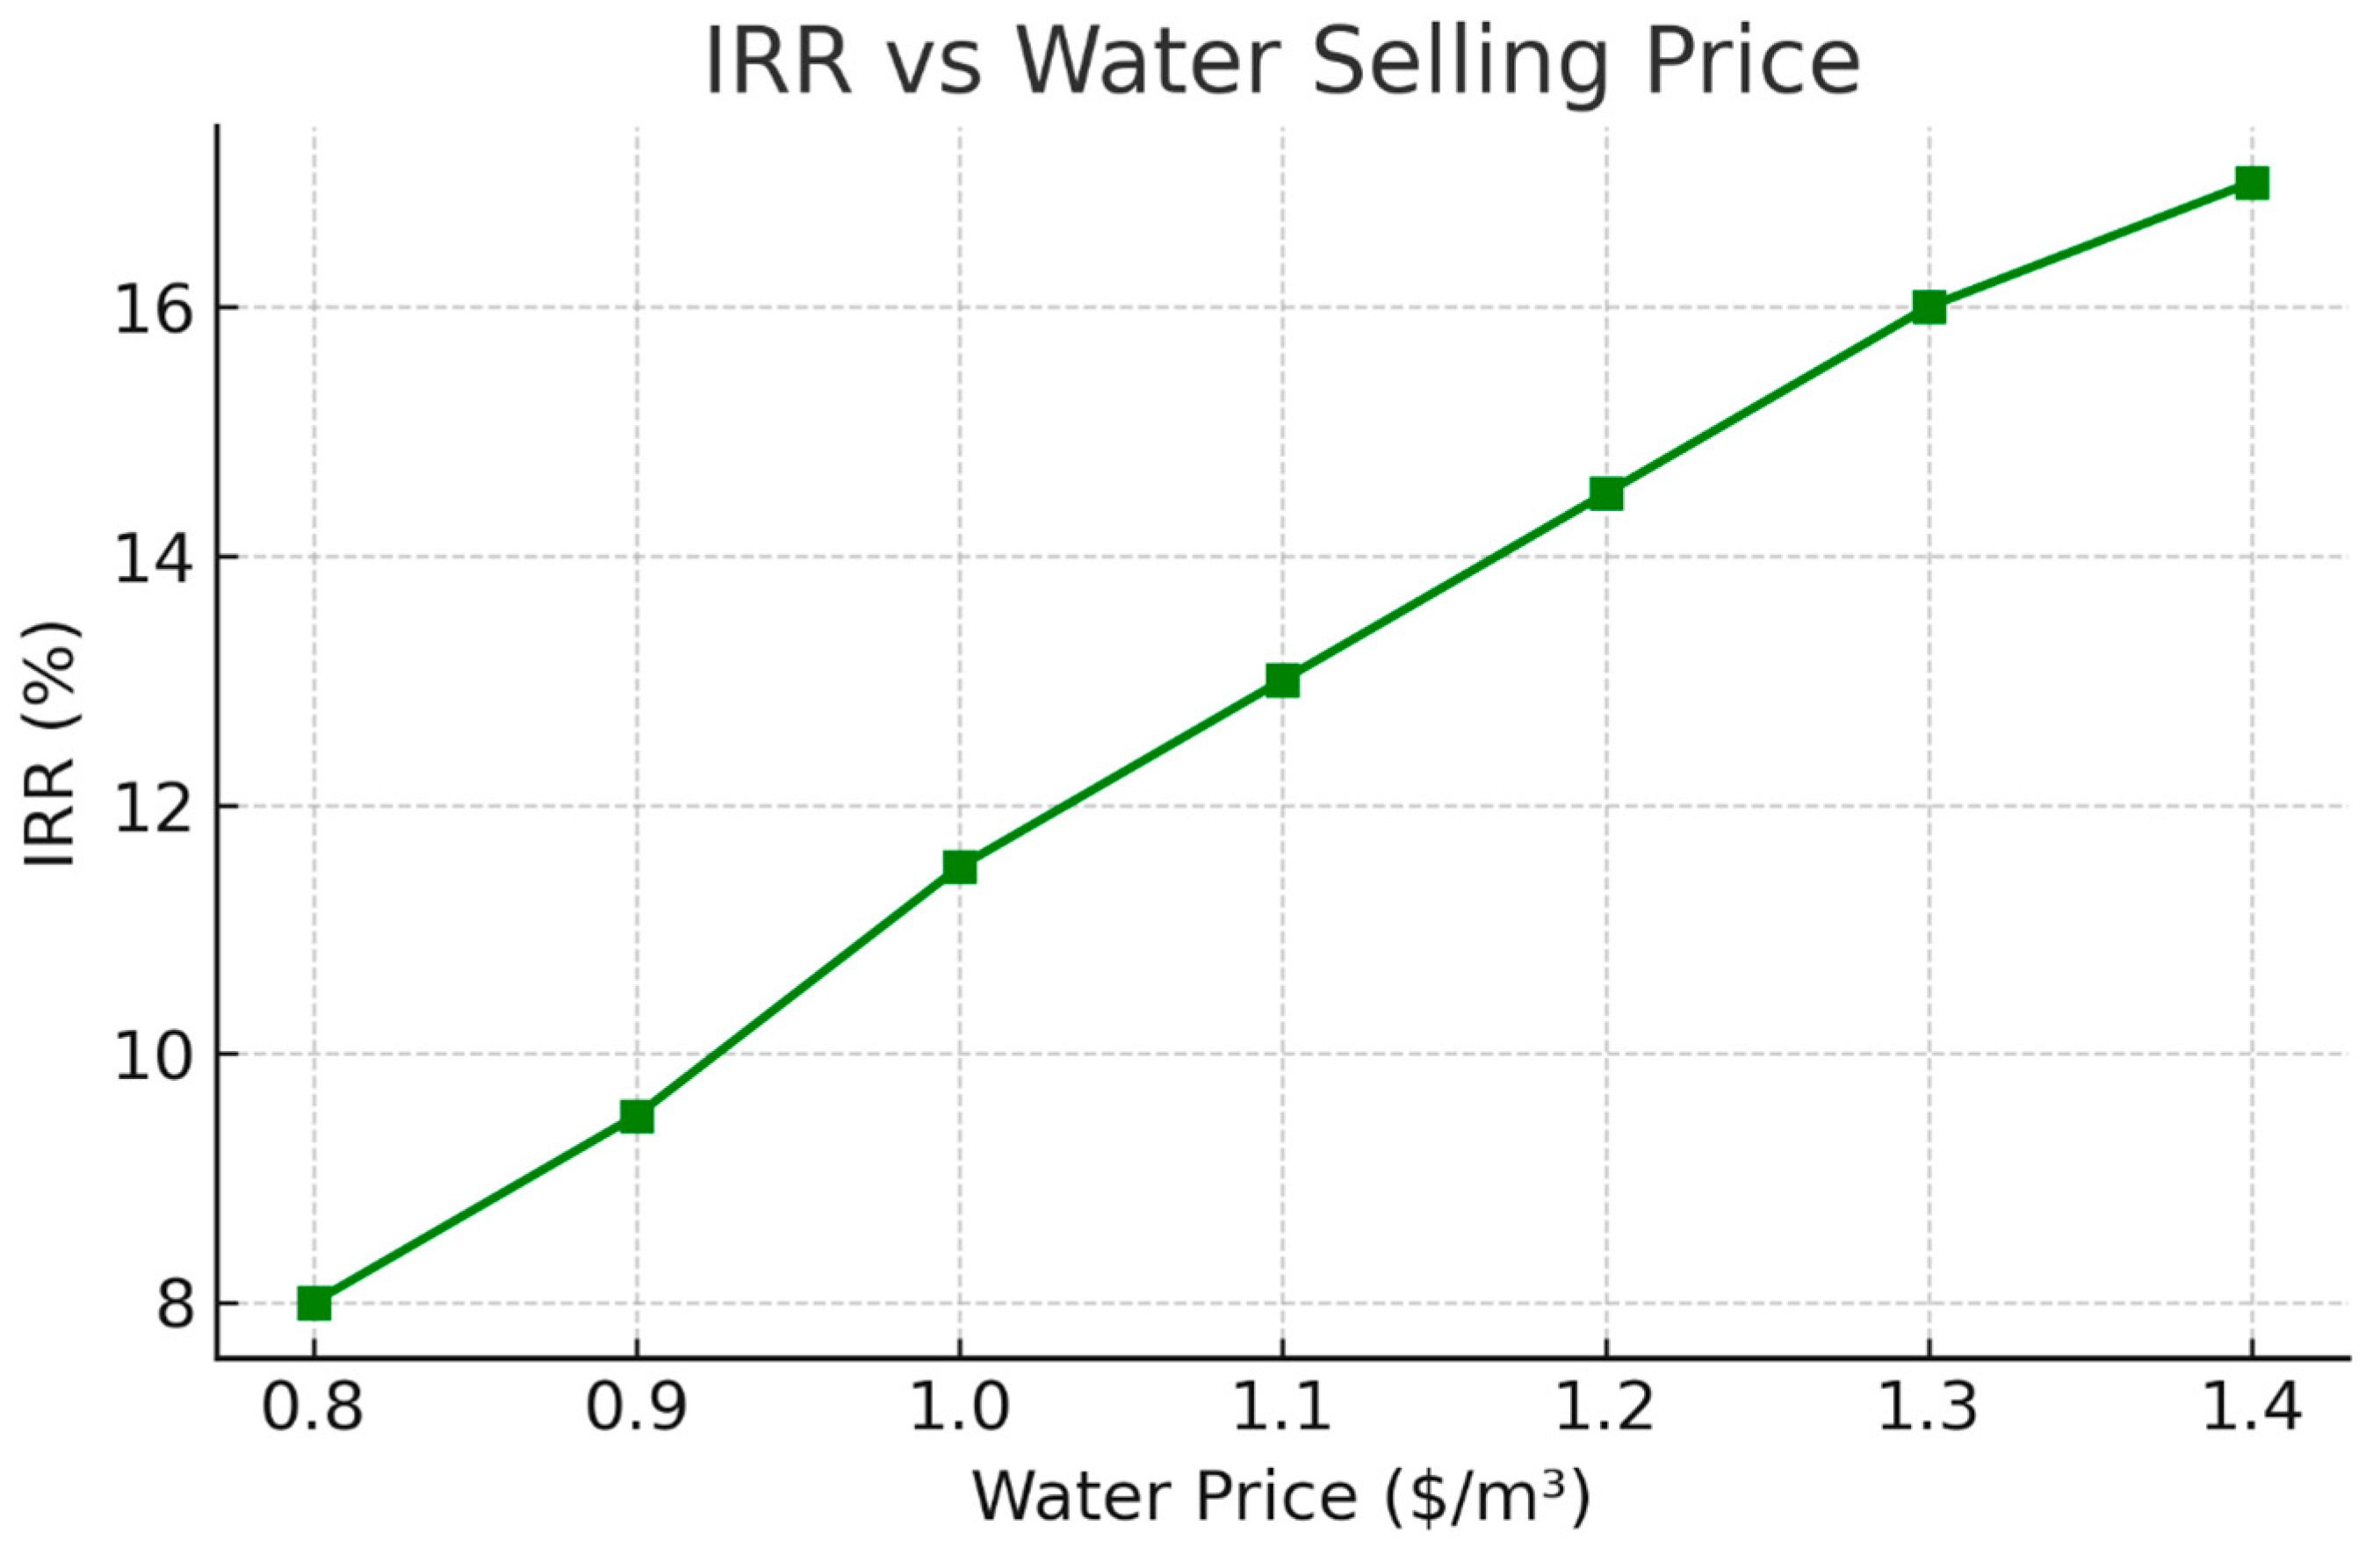
3.2.2. Water Price Sensitivity: IRR
Figure 11 illustrates the sensitivity of the IRR to variations in freshwater selling price. The analysis demonstrates a strong positive correlation between water price and system profitability:
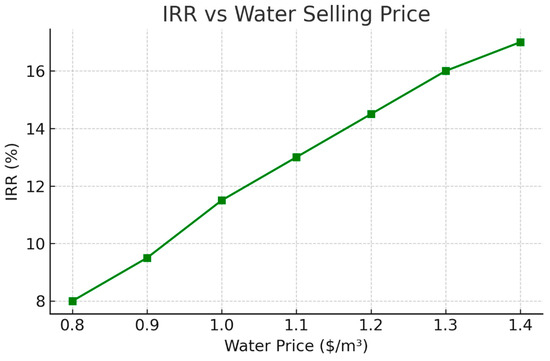
Figure 11.
IRR vs. Water Price plot.
At the baseline price of $1.00/m3, the system achieves an IRR exceeding 11.5%, validating its financial viability under standard commercial conditions.
When the water price rises above $1.20/m3, the IRR improves markedly, highlighting greater investment attractiveness in regions where freshwater is valued at a premium or where scarcity drives price escalation.
These results emphasize the significance of region-specific pricing frameworks and adaptive water valuation policies in enhancing the economic performance of decentralized solar desalination systems.
The sensitivity analysis included the following key variables: CAPEX (±20%), predictive control accuracy (±10%), discount rate (5–10%), and freshwater selling price ($0.80–$1.20/m3). Each parameter was varied independently to evaluate its isolated effect on LCOW, NPV, and IRR. The findings are visualized in Figure 9, Figure 10 and Figure 11.
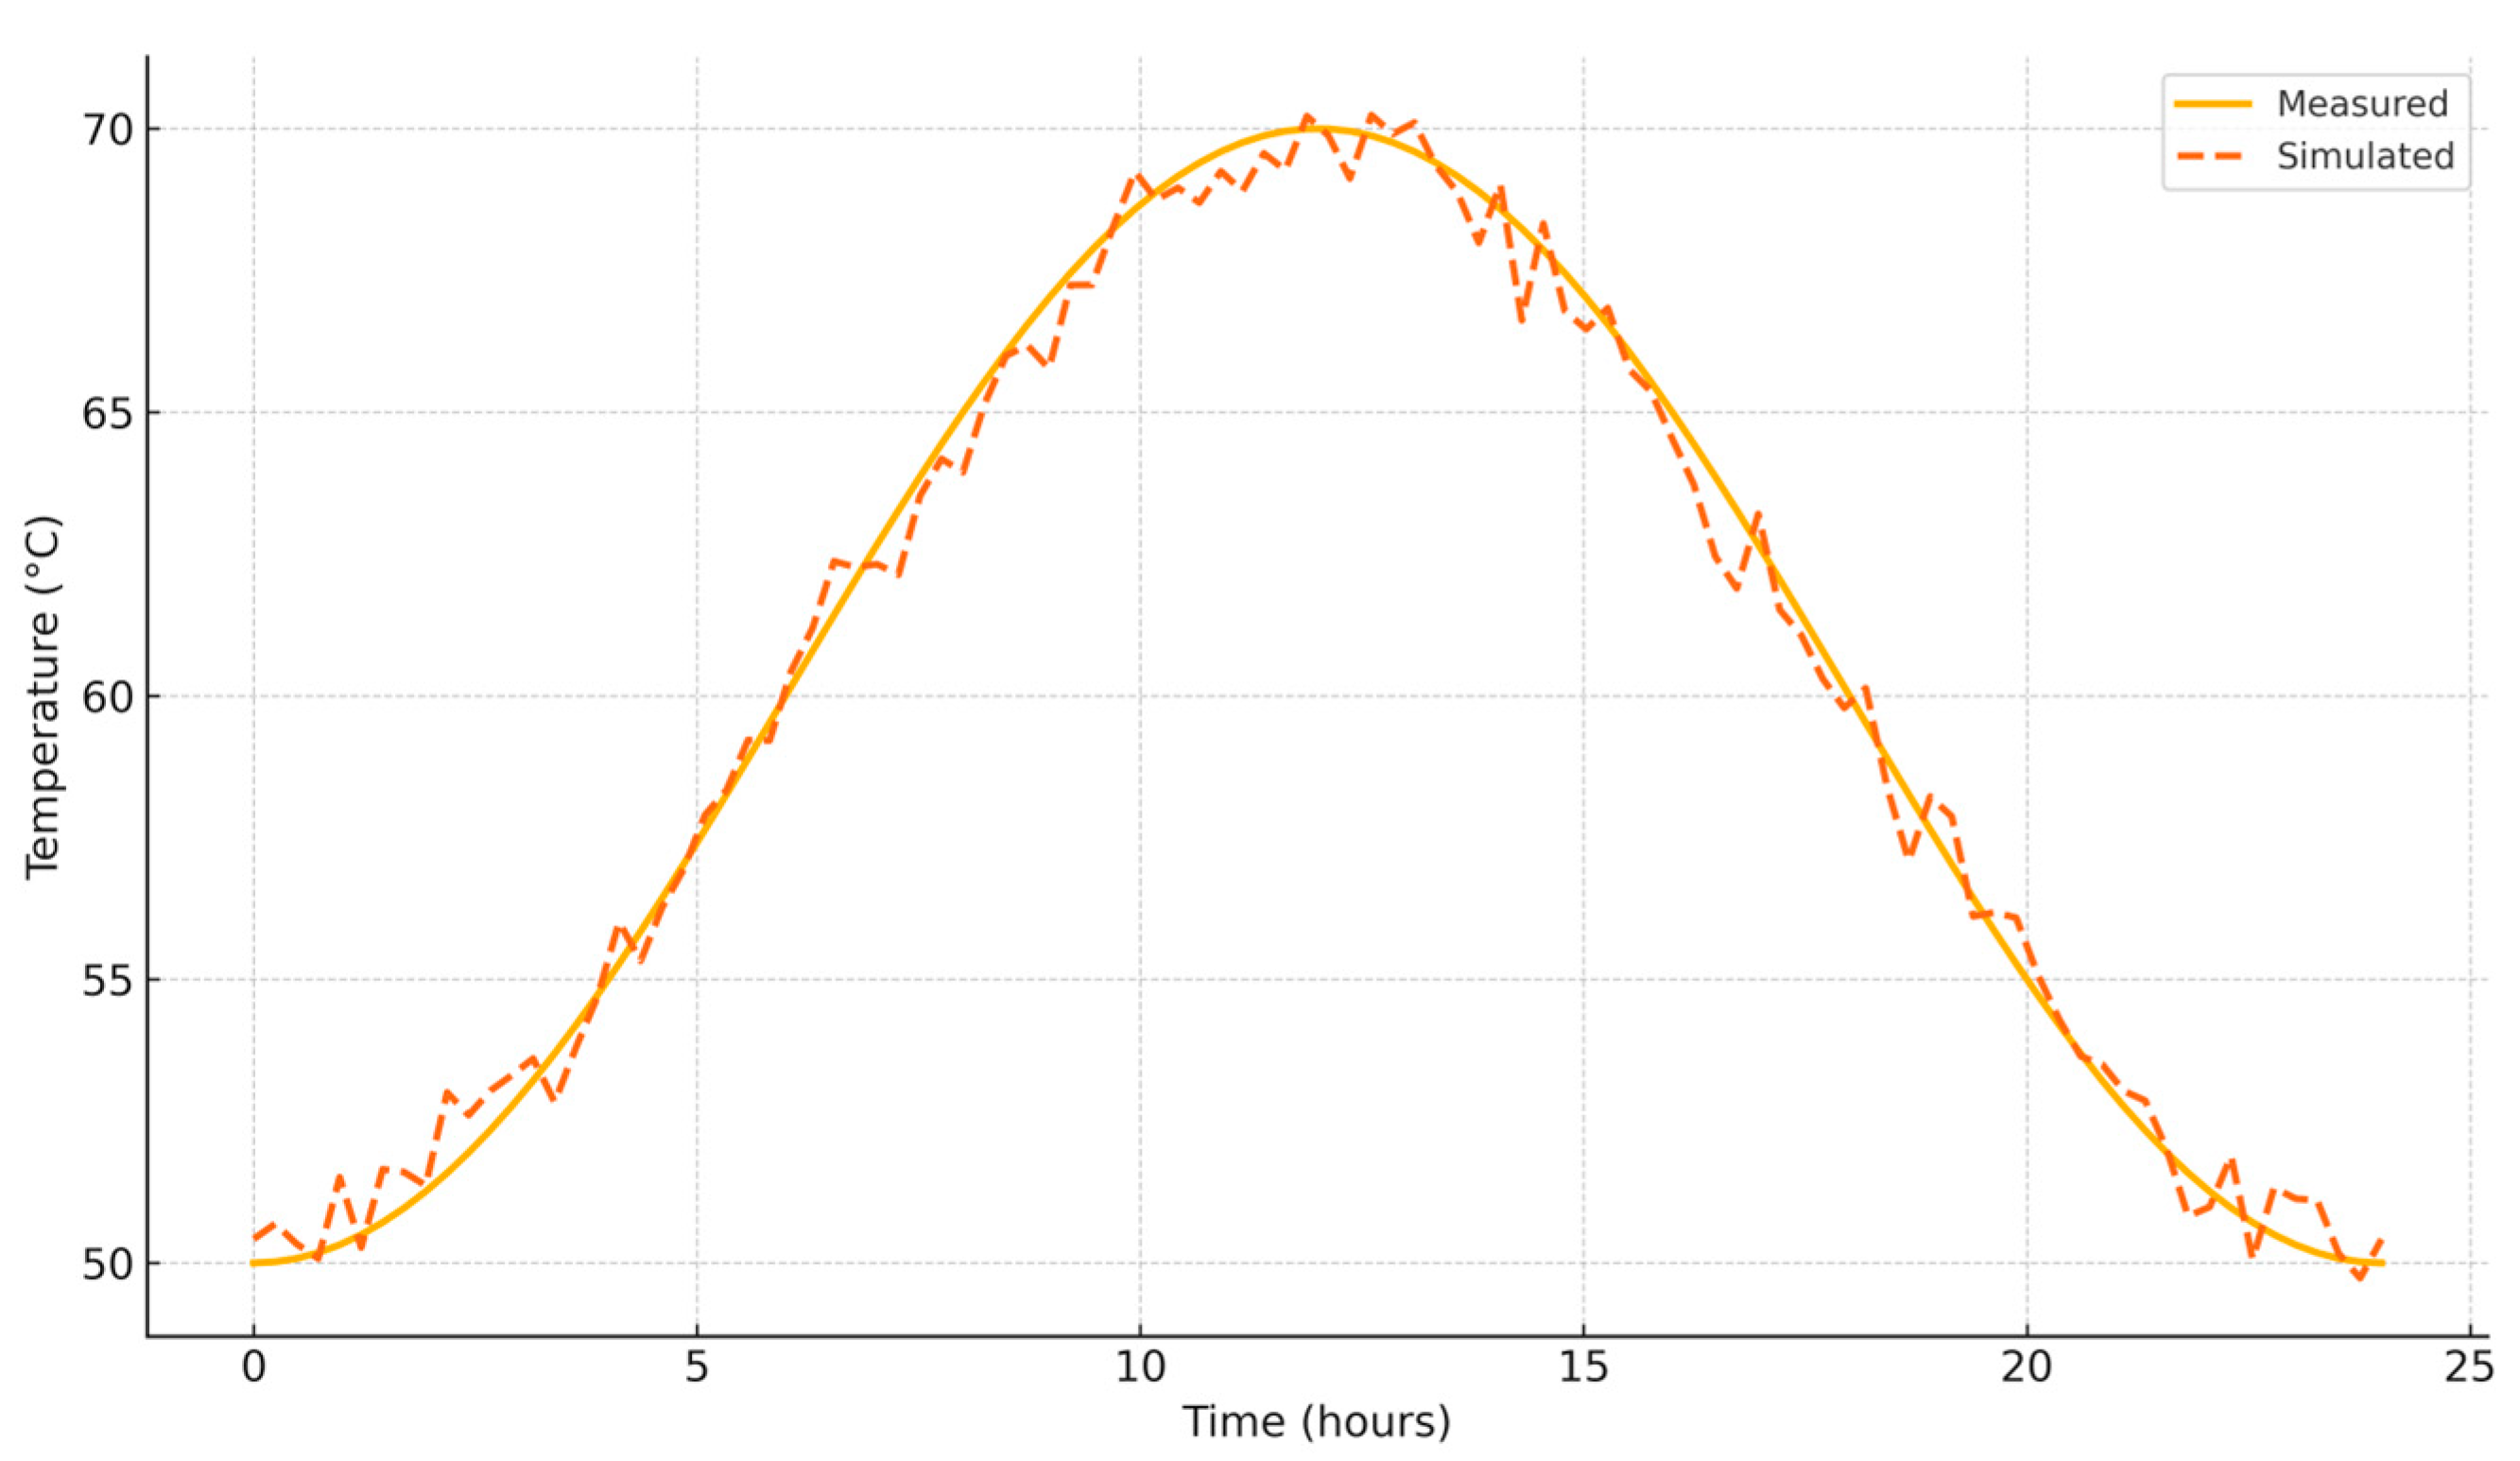
3.2.3. Experimental Validation of TES Thermal Profiles
Figure 12 displays both the measured and simulated thermal profiles of the TES unit under high solar irradiance conditions. The observed strong agreement between experimental and modeled data during peak irradiance hours confirms the model’s capability to accurately capture dynamic thermal behavior. Minor deviations observed during transitional periods are attributed to short-term solar fluctuations and stratification effects. This validation underscores the reliability of the TES model in supporting accurate and responsive predictive control strategies.

Figure 12.
Comparison of measured vs. simulated TES temperature profiles over a 24 h cycle.
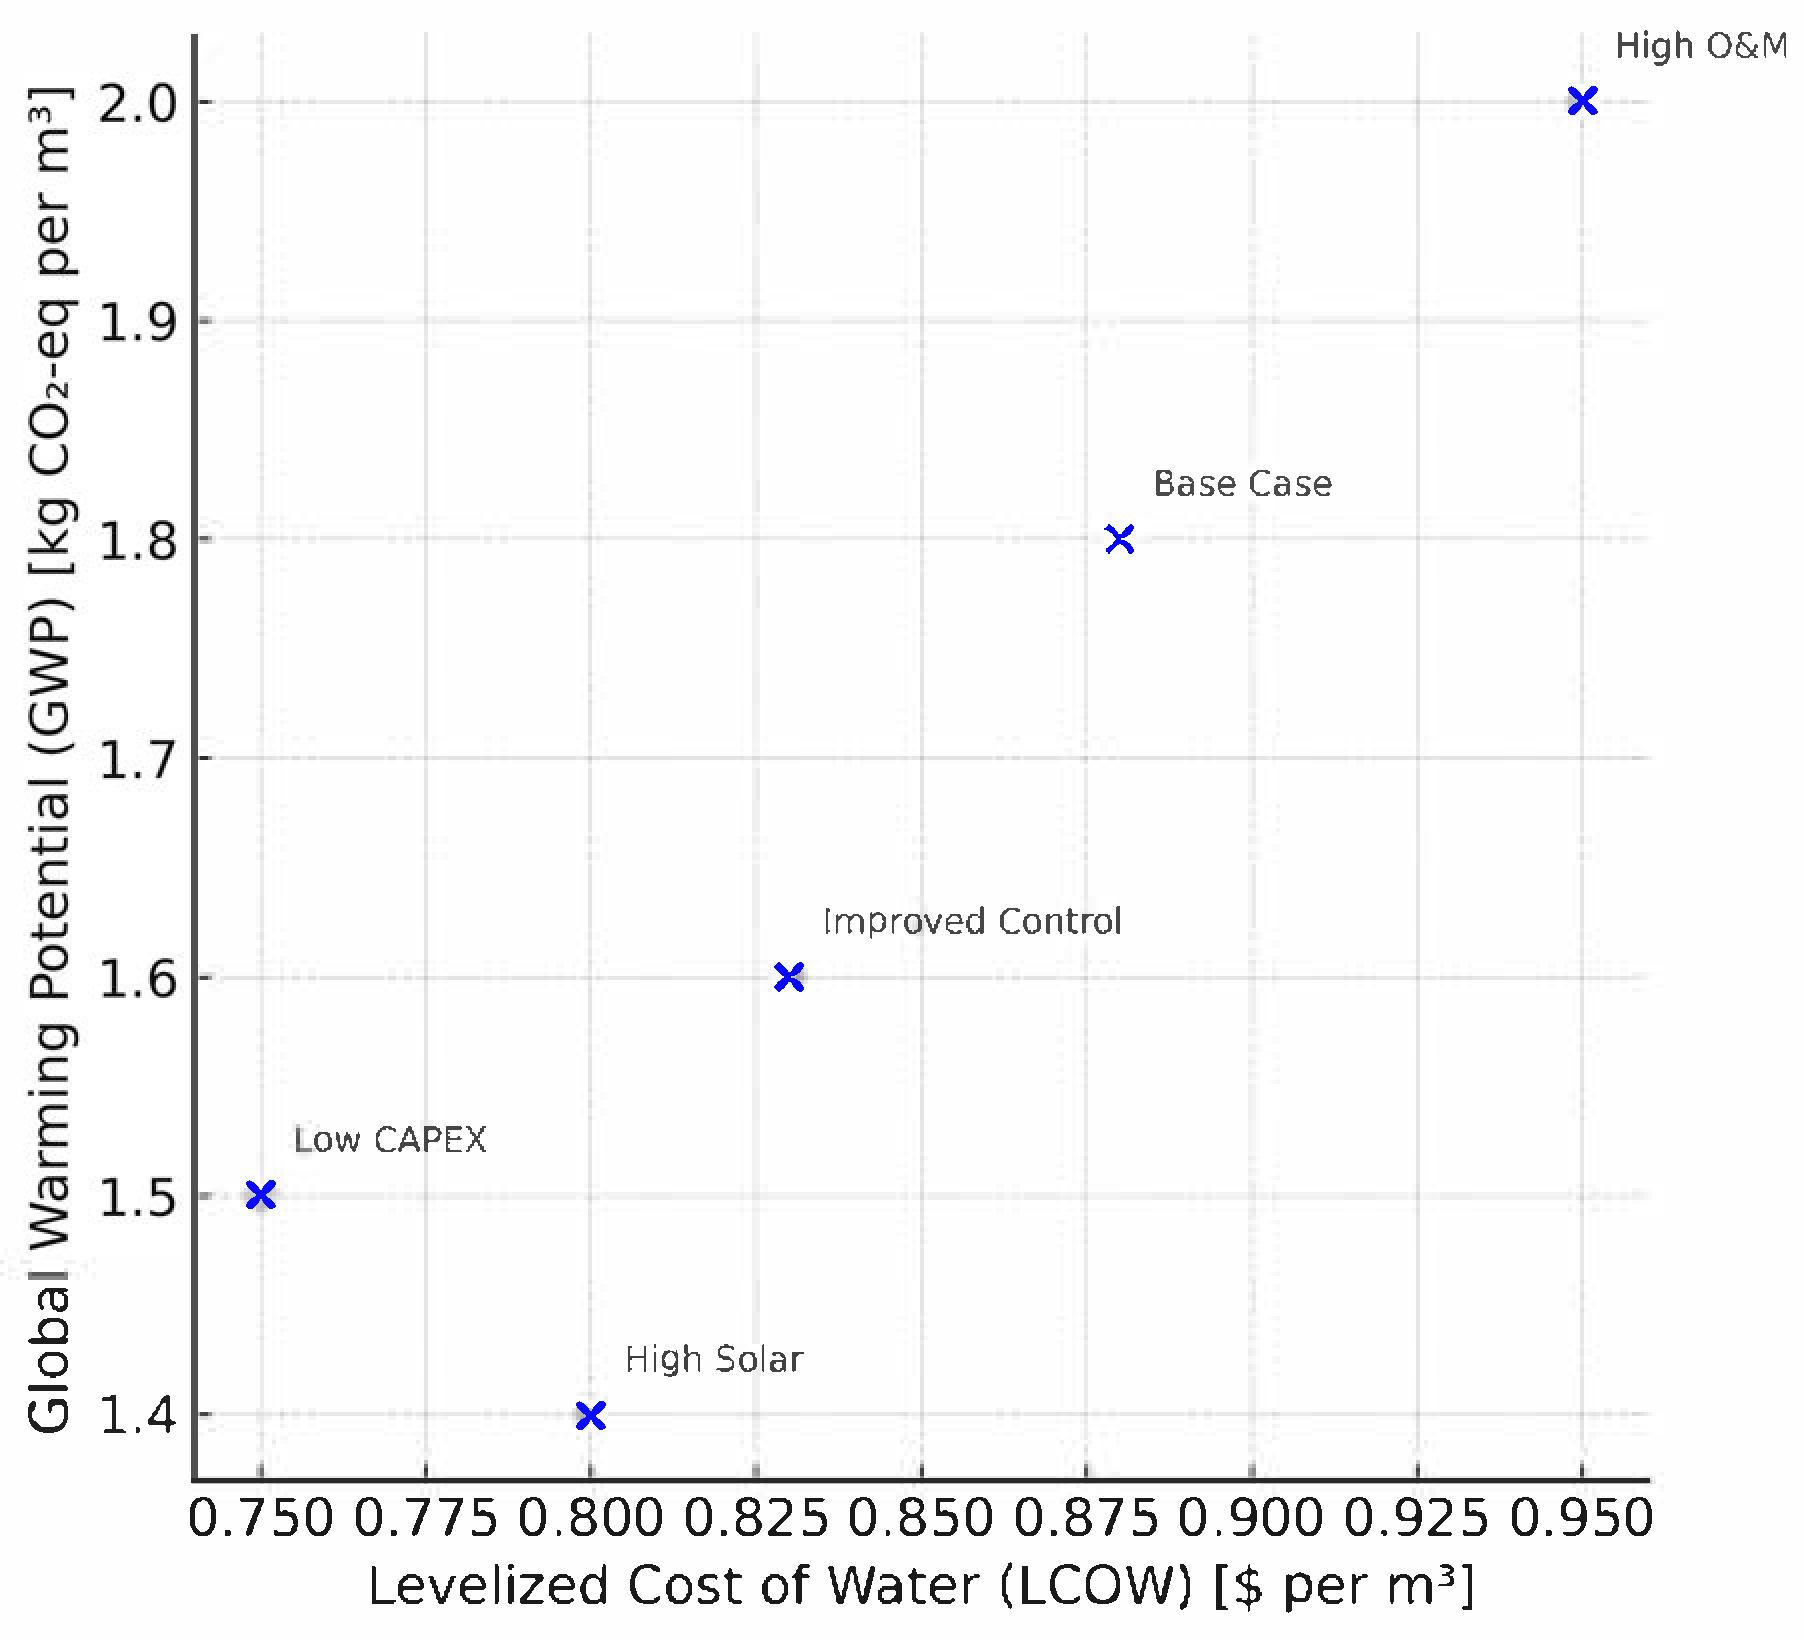
This validation reinforces the credibility of the TEA inputs and underscores the robustness of the proposed predictive control strategy. To elucidate the trade-off between economic and environmental performance, Figure 13 presents a two-dimensional mapping of various system scenarios along the axes of LCOW and GWP. Scenarios positioned in the bottom-left quadrant reflect the most favorable sustainability profiles, combining low cost with minimal environmental impact.
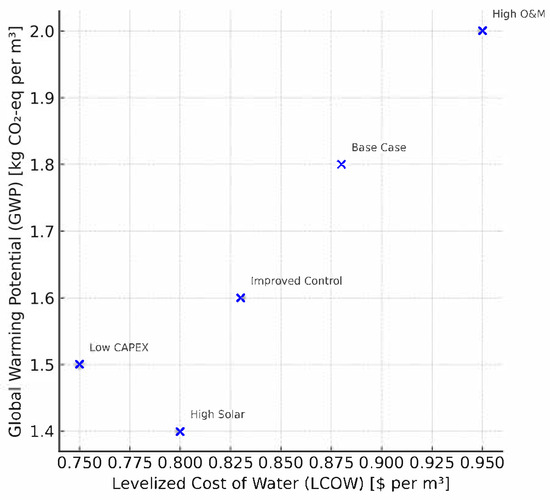
Figure 13.
Integrated sustainability map linking environmental (GWP) and economic (LCOW) outcomes.
In summary, the combined LCA and TEA results confirm the proposed predictive-controlled solar-thermal desalination system as both environmentally and economically viable. The operational and manufacturing stages dominate environmental impacts, suggesting clear pathways for optimization. A competitive LCOW of $0.88/m3 and a positive NPV affirm financial feasibility, while predictive control enhances efficiency and system resilience. Overall, the design presents a scalable, sustainable solution for decentralized freshwater production.
4. Discussion
The performance evaluation of the predictive-controlled solar-thermal desalination system reveals compelling synergies between thermodynamic efficiency, environmental performance, and economic viability. The integration of a single-tank TES architecture and forecast-based feedwater regulation represents a novel convergence of passive thermal storage with intelligent control—delivering measurable gains across both sustainability and financial indicators.
From an environmental standpoint, the LCA highlighted that the operational and manufacturing phases dominate GWP, contributing approximately 63% and 32%, respectively, to total emissions. These values align with prior studies on solar-driven desalination systems, where operation-intensive auxiliary loads and material-heavy components (e.g., evacuated tube collectors) are principal contributors to environmental burden [3,4]. Notably, the relatively low end-of-life and maintenance impacts (<5%) underscore the long-term sustainability of the design when appropriate material recovery and recycling pathways are followed [14].
Economically, the system demonstrated an LCOW of $0.88/m3, with a positive NPV at a 7% discount rate and an IRR of 11.5%, affirming its competitiveness with centralized thermal desalination solutions in high-irradiance contexts like the MENA region [16,19]. Sensitivity analyses revealed that a 20% reduction in capital cost or a 10% improvement in predictive control accuracy could drive LCOW even lower, confirming the scalability potential of both technological and market-based optimizations [20].
Furthermore, the validation of the TES thermal dynamics and the freshwater yield against the measured data reinforces confidence in the control strategy’s predictive fidelity. As shown in Figure 12, the alignment between simulated and experimental temperature profiles during peak irradiance conditions suggests that the simplified energy balance model offers sufficient robustness for real-time control, a key requirement for off-grid deployment.
Importantly, the combined TEA-LCA analysis, visualized in Figure 13, reveals that the system occupies the optimal sustainability-performance quadrant in terms of both economic and environmental metrics. This places it ahead of many reverse osmosis (RO) and multi-effect distillation (MED) systems of similar scale in terms of lifecycle GWP and cost-per-liter performance [3,10,13].
Finally, the role of forecast-based predictive control emerges not just as a feature, but as a strategic enabler of both environmental and financial optimization. As highlighted in recent work on intelligent solar systems [12,20], predictive feedwater regulation in line with irradiance forecasts significantly reduces thermal overshoot and pump energy wastage, thereby improving operational resilience in dynamic weather conditions.
In summary, the predictive-controlled solar desalination system with integrated TES design offers a scalable, low-impact, and economically viable solution for decentralized freshwater production particularly in regions facing water stress, high solar potential, and limited grid access. Future work should explore full-scale pilot deployments, advanced weather forecasting integration, and techno-environmental benchmarking across climates and load profiles.
Limitations and Future Work
While the integrated LCA–TEA assessment provides a robust evaluation of the system, several limitations must be acknowledged. First, the environmental inventory relied on mid-scale experimental data and standard LCI assumptions, which may not fully capture regional variability in material sourcing and disposal practices [8,13]. Second, the predictive control strategy, while validated under clear-sky conditions, has not yet been extended to accommodate intermittency from cloud cover or seasonal shifts [15,20].
Future research should, therefore, focus on:
- Validating the system under real-world field conditions with dynamic weather inputs.
- Exploring multi-tank TES configurations or phase-change materials (PCMs) for enhanced thermal buffering [6,7].
- Integrating advanced machine learning models for irradiance forecasting [12].
- Conducting region-specific LCAs with localized datasets to improve precision and the transferability of results [8,13].
By addressing these areas, the scalability and real-world viability of predictive solar desalination can be significantly strengthened.
5. Conclusions
This study presents a rigorously validated assessment of a predictive-controlled solar-thermal desalination system incorporating single-tank TES. Distinct from prior work, this research integrates experimentally measured thermal data, cradle-to-grave environmental modeling using the ReCiPe 2016 methodology, and detailed TEA to holistically evaluate the system’s performance and sustainability.
The LCA revealed that operational and manufacturing stages are the primary contributors to GWP, jointly accounting for over 90% of total emissions. Importantly, the incorporation of predictive control significantly reduced auxiliary energy losses, resulting in improved lifecycle environmental performance per unit of freshwater produced. In parallel, the TEA indicated strong economic viability under Middle Eastern solar conditions, with an LCOW of $0.88/m3, a positive NPV, and an IRR exceeding 11.5%.
A notable contribution of this work lies in the empirical demonstration of how predictive regulation enhances both thermodynamic responsiveness and sustainability outcomes. The linkage between control accuracy and environmental/economic efficiency reinforces the strategic importance of intelligent systems in future desalination technologies. Moreover, the sustainability mapping (GWP vs. LCOW) introduced in this study offers a practical decision-support framework to balance environmental impact and economic feasibility.
Nevertheless, some limitations remain. The use of generic LCI datasets may not fully reflect region-specific recycling or manufacturing practices. Additionally, the system was validated under clear-sky irradiance and mid-scale settings, potentially limiting its immediate generalizability. Future research should prioritize:
- integration of machine learning and driven irradiance forecasting;
- exploration of advanced or multi-tank TES configurations;
- and regionally customized environmental inventories to improve precision and scalability.
- Future enhancements could integrate formal optimization algorithms, such as multi-objective or metaheuristic approaches, to refine system performance beyond the current sensitivity-driven insights.
In conclusion, the validated integration of predictive feedwater control and TES represents a technically robust and economically scalable solution for low-carbon, off-grid freshwater generation. This approach holds strong potential for deployment in arid, solar-rich, and climate-stressed regions, contributing to water security and supporting broader global sustainability targets.
Funding
This research was funded by Taif University, Saudi Arabia, under project number TU-DSPP-2024-212.
Data Availability Statement
The raw data supporting the conclusions of this article will be made available by the authors on request.
Acknowledgments
The author extends his appreciation to Taif University, Saudi Arabia, for supporting this work through project number (TU-DSPP-2024-212).
Conflicts of Interest
The author declares no conflicts of interest.
Nomenclature
| Symbol | Description |
| AP | Acidification Potential (kg SO2-eq/m3) |
| Net cash flow in year | |
| Energy-related cost in year t (USD) | |
| Day | |
| Energy cost in year t (USD) | |
| EP | Eutrophication Potential (kg PO43−-eq/m3) |
| GWP | Global Warming Potential (kg CO2-eq/m3) |
| IRR | Internal Rate of Return (%) |
| Investment expenditures in year t (USD) | |
| Available Solar Power | |
| LCOW | Levelized Cost of Water ($/m3) |
| Mass of Charging Tank | |
| Mass of Discharging Tank | |
| Mass of Feed water | |
| Operation and maintenance cost in year t (USD) | |
| Plant Lifetime | |
| Number of Collectors | |
| Net cash flow in year t (USD) | |
| NPV | Net Present Value (USD) |
| ODP | Ozone Depletion Potential (kg CFC-11-eq/m3) |
| Time | |
| T | System lifetime (years) |
| Quantity of freshwater produced (m3) | |
| Useful Heat Gain | |
| r | Discount rate (%) |
| Ambient Temperature | |
| Charging Tank Temperature | |
| Discharging Tank Temperature | |
| Loss Coefficient for Tank | |
| Volume of freshwater produced in year t (m3) |
Abbreviations
| Abbreviation | Full Form |
| AP | Acidification Potential |
| EP | Eutrophication Potential |
| GWP | Global Warming Potential |
| ISO | International Organization for Standardization |
| LCA | Life Cycle Assessment |
| LCI | Life Cycle Inventory |
| MED | Multi-Effect Distillation |
| MSF | Multi-Stage Flash |
| ODP | Ozone Depletion Potential |
| PV | Photovoltaic |
| TEA | Techno-Economic Analysis |
| TES | Thermal Energy Storage |
References
- Musie, W.; Gonfa, G. Fresh water resource, scarcity, water salinity challenges and possible remedies: A review. Heliyon 2023, 9, e18685. [Google Scholar] [CrossRef] [PubMed]
- Eyl-Mazzega, M.-A.; Cassignol, É. The Geopolitics of Seawater Desalination; Études de l’Ifri: Ifri, 2022; Available online: https://www.ifri.org/en/publications/etudes-de-lifri/geopolitics-seawater-desalination (accessed on 20 July 2025).
- Mannan, M.; Alhaj, M.; Mabrouk, A.N.; Al-Ghamdi, S.G. Examining the life-cycle environmental impacts of desalination: A case study in the State of Qatar. Desalination 2019, 452, 238–246. [Google Scholar] [CrossRef]
- Ihsanullah, I.; Atieh, M.A.; Sajid, M.; Nazal, M.K. Desalination and environment: A critical analysis of impacts, mitigation strategies, and greener desalination technologies. Sci. Total Environ. 2021, 780, 146585. [Google Scholar] [CrossRef] [PubMed]
- Khashehchi, M.; Thangavel, S.; Rahmanivahid, P.; Heidari, M. Solar desalination techniques: Challenges and opportunities. In Highly Efficient Thermal Renewable Energy Systems; CRC Press: Boca Raton, FL, USA, 2024; pp. 305–329. [Google Scholar] [CrossRef]
- Shabgard, H.; Rahimi, H.; Naghashnejad, M.; Acosta, P.M.; Sharifi, N.; Mahdavi, M.; Faghri, A. Thermal energy storage in desalination systems: State of the art, challenges and opportunities. J. Energy Storage 2022, 52, 104799. [Google Scholar] [CrossRef]
- Maghrabie, H.M.; Olabi, A.G.; Rezk, A.; Radwan, A.; Alami, A.H.; Abdelkareem, M.A. Energy storage for water desalination systems based on renewable energy resources. Energies 2023, 16, 3178. [Google Scholar] [CrossRef]
- Ogbu, C.A.; Ivanova, T.A.; Ewemoje, T.A.; Alabi, H.A.; Roubík, H. Towards environmentally sustainable water management in Africa: A comprehensive review of life cycle assessment studies in water and wastewater treatment. Int. J. Life Cycle Assess. 2025, 30, 956–979. [Google Scholar] [CrossRef]
- Tokui, Y.; Moriguchi, H.; Nishi, Y. Comprehensive environmental assessment of seawater desalination plants: Multistage flash distillation and reverse osmosis membrane types in Saudi Arabia. Desalination 2014, 351, 145–150. [Google Scholar] [CrossRef]
- Goosen, M.; Mahmoudi, H.; Alyousef, Y.; Ghaffour, N. Solar desalination: A review of recent developments in environmental, regulatory and economic issues. Sol. Compass 2023, 5, 100034. [Google Scholar] [CrossRef]
- Razman, K.K.; Hanafiah, M.M.; Mohammad, A.W. An overview of LCA applied to various membrane technologies: Progress, challenges, and harmonization. Environ. Technol. Innov. 2022, 27, 102803. [Google Scholar] [CrossRef]
- Lee, B.; Wang, L.; Wang, Z.; Cooper, N.J.; Elimelech, M. Directing the research agenda on water and energy technologies with process and economic analysis. Energy Environ. Sci. 2023, 16, 714–722. [Google Scholar] [CrossRef]
- Aleisa, E. Metamodeling life cycle assessment to explore interactions in the water-energy nexus of desalination processes. Energy Nexus 2024, 15, 100321. [Google Scholar] [CrossRef]
- Shahabi, M.P.; McHugh, A.; Anda, M.; Ho, G. Environmental life cycle assessment of seawater reverse osmosis desalination plant powered by renewable energy. Renew. Energy 2014, 67, 53–58. [Google Scholar] [CrossRef]
- Rajesh, S.; Chiranjeevi, C. Experimental investigations on PVT-integrated hybrid desalination system: Energy, exergy, and economic analysis. Energy Sources Part A Recovery Util. Environ. Eff. 2024, 46, 3793–3806. [Google Scholar] [CrossRef]
- Zheng, Y.; Hatzell, K.B. Technoeconomic analysis of solar thermal desalination. Desalination 2020, 474, 114168. [Google Scholar] [CrossRef]
- Panagopoulos, A. Assessing the Energy Footprint of Desalination Technologies and Minimal/Zero Liquid Discharge (MLD/ZLD) Systems for Sustainable Water Protection via Renewable Energy Integration. Energies 2025, 18, 962. [Google Scholar] [CrossRef]
- Ferdous, J.; Bensebaa, F.; Pelletier, N. Integration of LCA, TEA, Process Simulation and Optimization: A systematic review of current practices and scope to propose a framework for pulse processing pathways. J. Clean. Prod. 2023, 402, 136804. [Google Scholar] [CrossRef]
- Rajesh, S.; Chalasani, C.; Shaik, S.; Pethurajan, V. Techno-Economic Analysis of a Hybrid Thermal Desalination System Integrated with a PVT Collector. Case Stud. Therm. Eng. 2025, 71, 106155. [Google Scholar] [CrossRef]
- Alsehli, M. Optimizing Solar Desalination: Integrating Predictive Models with Thermal Energy Storage for Enhanced Efficiency and Sustainability. Processes 2024, 12, 1851. [Google Scholar] [CrossRef]
- NEN-EN-ISO 14040: 2006 (en); Environmental Management-Life Cycle Assessment-Principles and Framework. NEN: Delft, The Netherlands, 2006.
- Sollai, S.; Porcu, A.; Tola, V.; Ferrara, F.; Pettinau, A. Renewable methanol production from green hydrogen and captured CO2: A techno-economic assessment. J. CO2 Util. 2023, 68, 102345. [Google Scholar] [CrossRef]


Disclaimer/Publisher’s Note: The statements, opinions and data contained in all publications are solely those of the individual author(s) and contributor(s) and not of MDPI and/or the editor(s). MDPI and/or the editor(s) disclaim responsibility for any injury to people or property resulting from any ideas, methods, instructions or products referred to in the content. |
© 2025 by the author. Licensee MDPI, Basel, Switzerland. This article is an open access article distributed under the terms and conditions of the Creative Commons Attribution (CC BY) license (https://creativecommons.org/licenses/by/4.0/).