Article

Study on Meso-Mechanical Evolution Characteristics and Numerical Simulation of Deep Soft Rock

State Key Laboratory of Digital Intelligent Technology for Unmanned Coal Mining, Anhui University of Science and Technology, Huainan 232001, China
*
Author to whom correspondence should be addressed.
Processes 2025, 13(8), 2358; https://doi.org/10.3390/pr13082358
Submission received: 19 June 2025 / Revised: 15 July 2025 / Accepted: 22 July 2025 / Published: 24 July 2025

Abstract

To reveal the meso-mechanical essence of deep rock mass failure and capture precursor information, this study focuses on soft rock failure mechanisms. Based on the discontinuous medium discrete element method (DEM), we employed digital image correlation (DIC) technology, acoustic emission (AE) monitoring, and particle flow code (PFC) numerical simulation to investigate the failure evolution characteristics and AE quantitative representation of soft rocks. Key findings include the following: Localized high-strain zones emerge on specimen surfaces before macroscopic crack visualization, with crack tip positions guiding both high-strain zones and crack propagation directions. Strong force chain evolution exhibits high consistency with the macroscopic stress response—as stress increases and damage progresses, force chains concentrate near macroscopic fracture surfaces, aligning with crack propagation directions, while numerous short force chains coalesce into longer chains. The spatial and temporal distribution characteristics of acoustic emissions were explored, and the damage types were quantitatively characterized, with ring-down counts demonstrating four distinct stages: sporadic, gradual increase, stepwise growth, and surge. Shear failures predominantly occurred along macroscopic fracture surfaces. At the same time, there is a phenomenon of acoustic emission silence in front of the stress peak in the surrounding rock of deep soft rock roadway, as a potential precursor indicator for engineering disaster early warning. These findings provide critical theoretical support for deep engineering disaster prediction.

1. Introduction

After prolonged extraction activities, shallow-depth coal resources are becoming increasingly depleted, with mining operations extending deeper at an annual rate of 10–25 m. Investigating the fundamental mechanisms underlying stress-induced rock mass destabilization during deep coal mining [1,2,3] holds significant importance for ensuring surrounding rock stability and achieving safe, efficient mineral extraction.
Regarding the connection between acoustic emission (AE) phenomena and failure characteristics during uniaxial loading of rock masses, numerous scholars have conducted extensive research [4,5,6,7,8]. Shan et al. [9] performed acoustic emission monitoring tests on coarse sandstone under uniaxial compression, analyzing the evolution characteristics of acoustic emissions. Li et al. [10] conducted similar acoustic emission monitoring experiments under uniaxial compression to investigate the acoustic emission signals in mudstone. Under true triaxial conditions regarding the failure characteristics of rock masses: Liu et al. [11] analyzed the mechanical response and failure characteristics of rocks; Cyrille et al. [12] investigated the influence of deviatoric loading paths on localized deformation in sandstone; Gautam et al. [13] studied the acoustic emission characteristics of shale failure under cyclic loading conditions. The latest research fully applies the key monitoring technology in the process of material loading failure. For instance, Zhang et al. [14] employed AE and computed tomography (CT) scanning techniques to analyze AE parameters of coal under varying loading conditions; Zhang et al. [15] studied the failure modes of coal with different bedding directions by using acoustic emission technology; Barkat et al. [16] performed multi-stage cyclic loading experiments on sandstone using digital image correlation (DIC) and AE techniques, revealing the progressive failure process of rocks; Mahesh et al. [17] studied the influence of tensile–shear composite loading on material damage evolution through AE and DIC technologies; Li et al. [18] studied the effect of axial load on the damage of three-dimensional braided carbon fiber composites by the three-dimensional digital image method; Luo et al. [19] analyzed the tensile deformation process of magnesium matrix composites by DIC; Gong et al. [20] investigated full-field strain distribution in sandstone under dynamic compressive stress and analyzed strain cloud patterns; Wei et al. [21] studied the fracture mechanical properties of polyethylene composites by the DIC technique; Koohbor B et al. [22] used the DIC technique to measure the strain field of the failure process of large fiber composite materials; Subramani et al. [23] used DIC technology to detect the deviation of the linear strain field more obviously in composite materials. In summary, numerous scholars have employed loading methods such as uniaxial and true triaxial compression to investigate the failure characteristics of coal and rock masses through techniques like AE monitoring, Digital Image Correlation (DIC), and CT scanning. However, comparative analyses of failure characteristics across different lithologies remain relatively scarce, and the means of monitoring internal fracture evolution remain limited. There is a need to combine AE and DIC technologies for joint analysis of fracture evolution processes in two lithological rock masses. Further research is required on the spatiotemporal evolution patterns of AE signals, and the acquisition of AE precursor information urgently demands deeper exploration.
Numerous scholars have employed the particle discrete element method (DEM) to conduct in-depth investigations into several key scientific issues during rock mass failure processes [24,25,26,27,28]. Nitka et al. [29] performed a comparative analysis between laboratory test results and numerical simulations; Zhou et al. [30] utilized numerical simulations to study the influence of backfill geometry on rock failure patterns under uniaxial compression; Lotidis et al. [31] established a marble uniaxial compression model using the particle flow method; Liu et al. [32] investigated the microscopic failure characteristics of bedded rock masses using the particle flow code (PFC) 3D 6.0 software; Li et al. [33] numerically simulated the acoustic emission response characteristics of clay through the particle flow method; Li et al. [34] analyzed damage evolution characteristics of rock with intersecting joints based on the particle flow method; Cheng et al. [35] studied the acoustic emission characteristics of coal–rock failure under uniaxial compression using particle flow software; Zhang et al. [36] simulated and analyzed strain field evolution laws in multi-cracked rocks through PFC software; Yang et al. [37] conducted triaxial cyclic loading simulations of marble using DEM methods; Zhang et al. [38] investigated stress and fracture evolution mechanisms during uniaxial failure of coal specimens via DEM approaches; Ma et al. [39] simulated failure characteristics of rock fracture process zones using two-dimensional discrete element methods. In summary, many researchers have established various laboratory-scale loading models based on the Discrete Element Method (DEM) to study failure characteristics of different rock types. Building upon these studies, the high flexibility of PFC could be leveraged to develop self-designed, full-process, high-precision monitoring programs that compensate for laboratory limitations. This would enable in-depth investigation of the mesoscopic mechanisms underlying rock mass failure. Further research is still needed regarding the evolution characteristics of force chains, and the meso-mechanical essence of rock mass deformation and failure mechanisms awaits further revelation.
Based on this, to deeply analyze the meso-mechanical evolution characteristics of rock mass during deep engineering excavation and reveal the mechanical essence of its deformation and failure, this study employs DIC, AE monitoring technology, and PFC numerical simulation methods. We conduct research on the crack evolution, AE evolution, and force chain evolution of rocks under uniaxial compression. An improved AE simulation method is utilized to investigate precursor information of rock failure. The results verify good consistency in failure patterns and reveal a temporary silence phenomenon of AE signals before two typical surrounding rock failures in deep soft rock roadways. These findings can provide early warning references for geological hazard prevention.

2. Materials and Methods

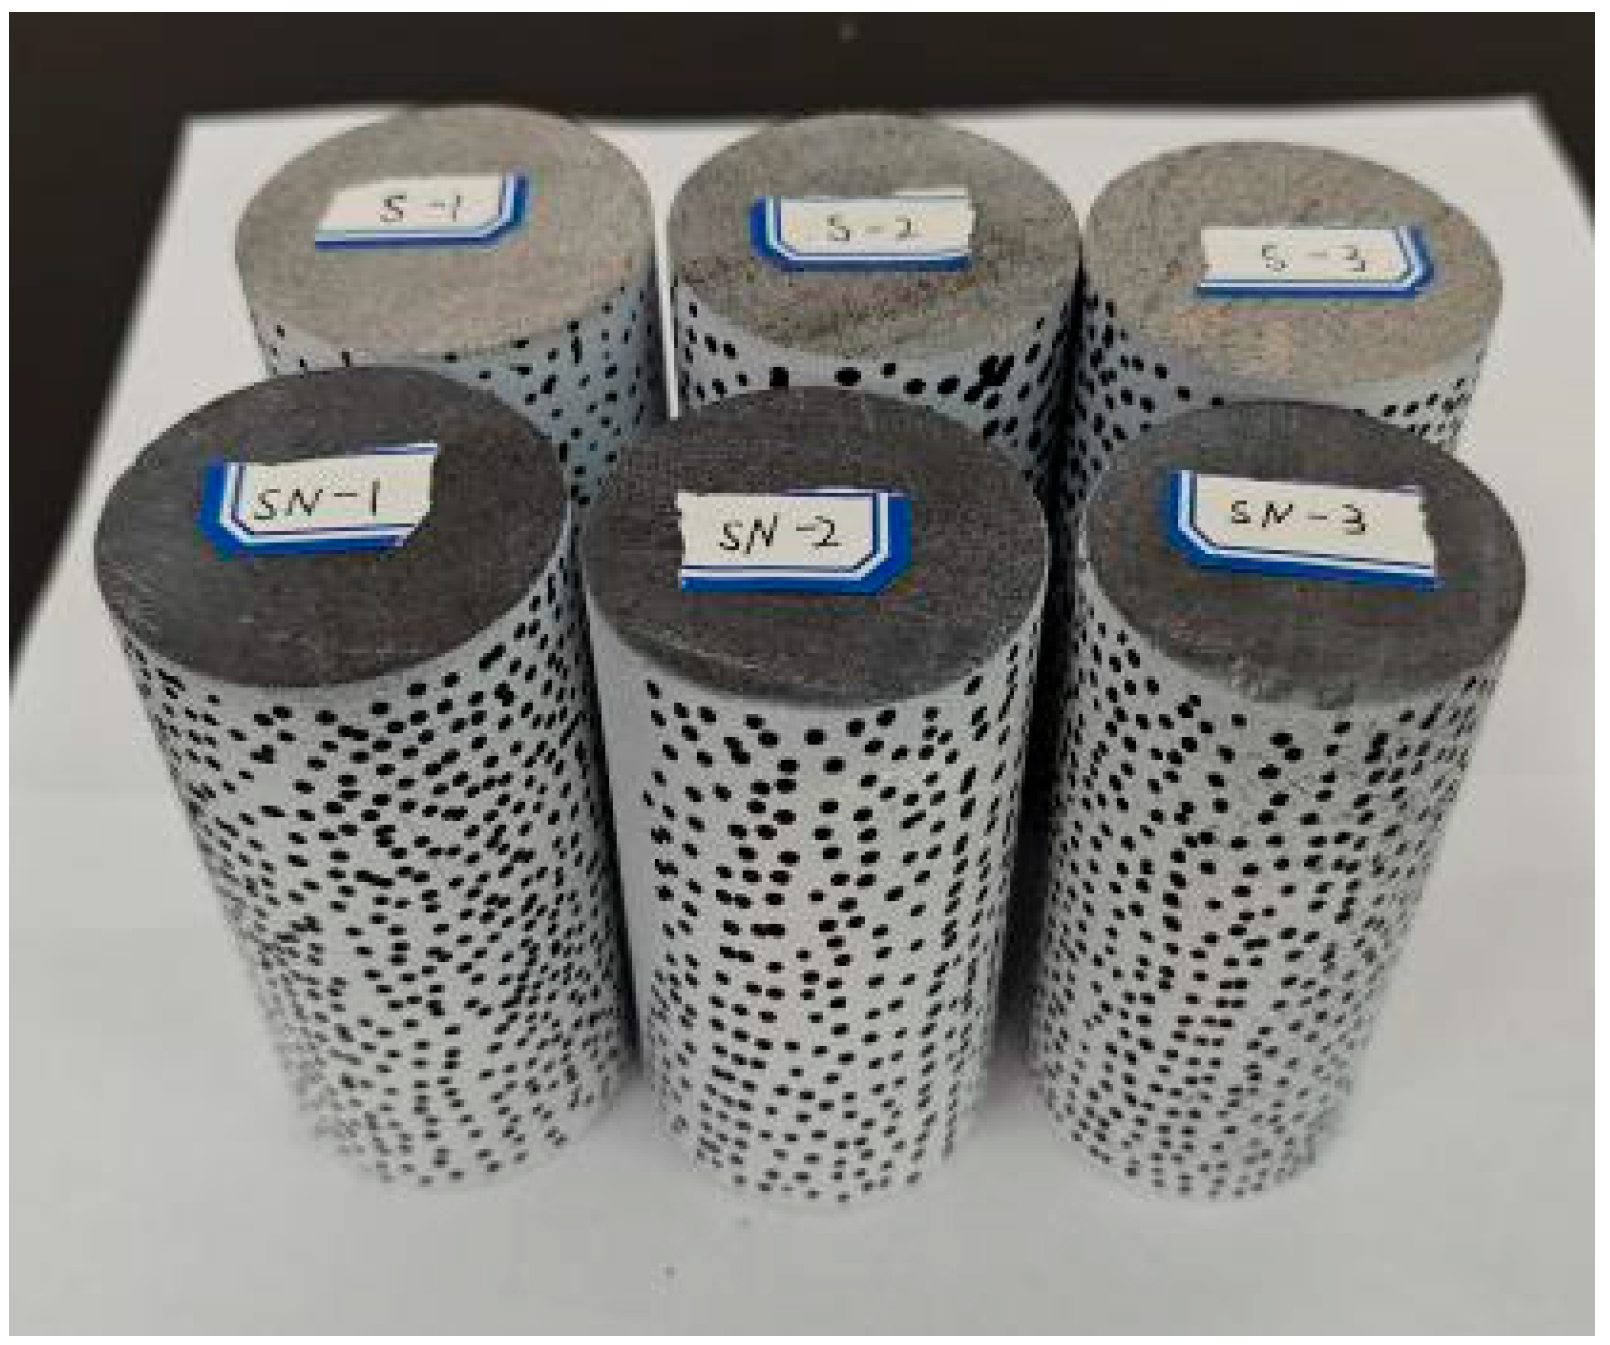
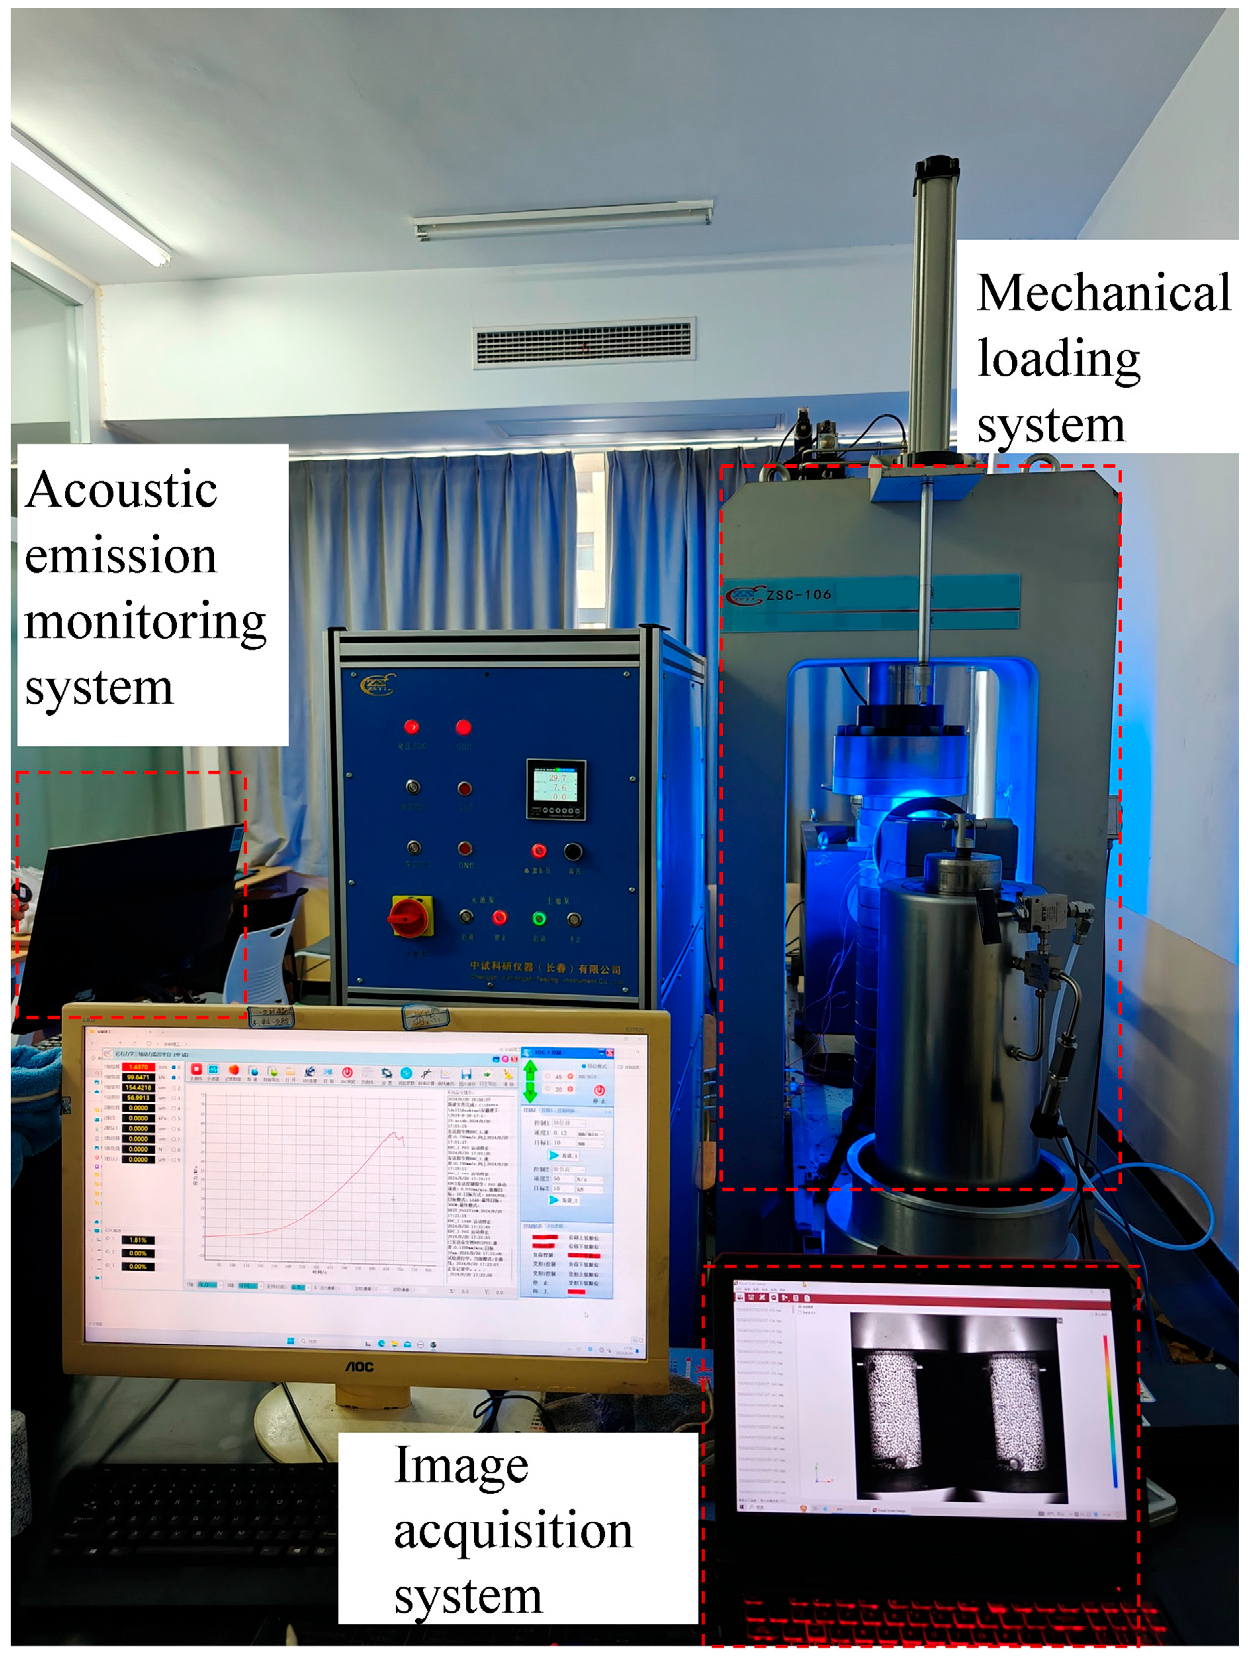
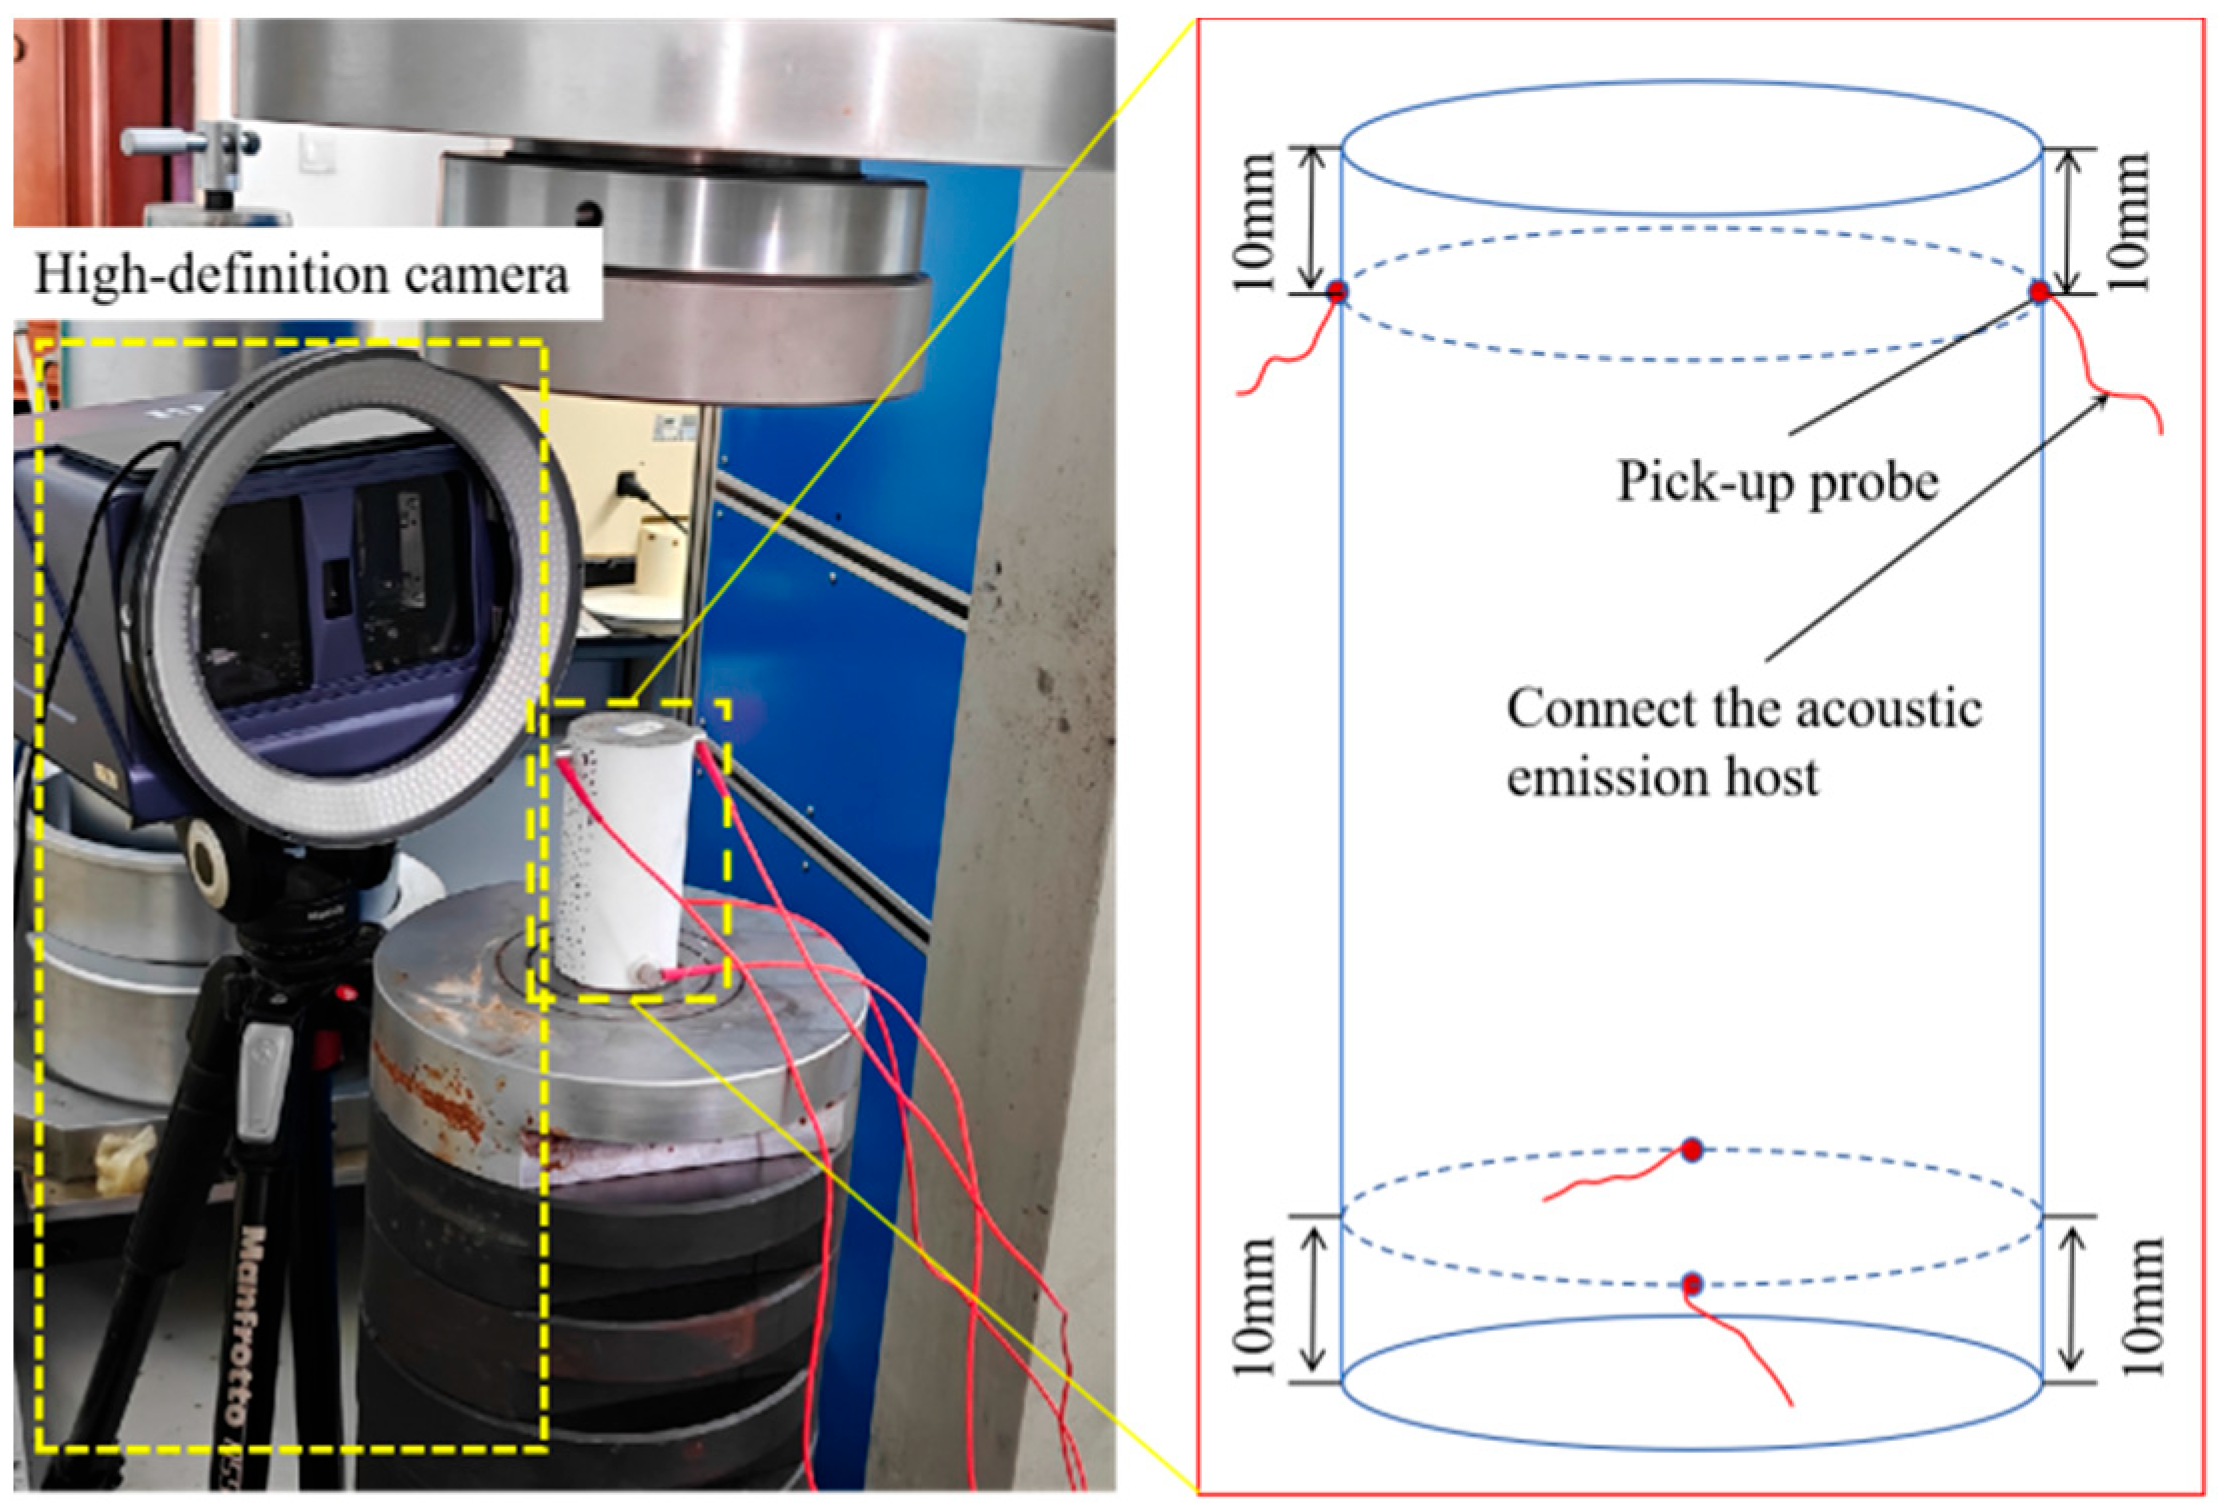
2.1. Sample Preparation and Test Scheme

The sandstone specimens used in this experiment were obtained from the roof strata of a working face at Dingji Coal Mine in Huainan City, Anhui Province, approximately 1000 m below the surface. The large rock blocks collected on-site exhibited homogeneous texture without visible joints or fractures. These blocks were processed into standard cylindrical specimens 50 mm in diameter and 100 mm in height through cutting with a rock saw and surface polishing using abrasive paper. All specimen preparation strictly adhered to the processing standards of the International Society for Rock Mechanics (ISRM) [40]. After sanding the specimen surfaces to achieve smoothness, white paint was uniformly sprayed to ensure complete coverage. Speckle patterns were then created on the cylindrical surface using a marker pen for subsequent analysis [41]. As shown in Figure 1, six specimens were prepared in total: three sandy mudstone specimens labeled SN-1, SN-2, SN-3 and three gray sandstone specimens labeled S-1, S-2, S-3.
The experiment was a uniaxial compression test consisting of a loading system, acoustic emission monitoring system, and image acquisition system, as shown in Figure 2. The Digital Speckle Monitoring and Analysis System consists of an image acquisition system and an image processing terminal. The image acquisition system employs a CCD high-speed camera to capture and store full-process images of specimen loading, simultaneously transferring them to the image processing terminal. It features a capture resolution of 2448 × 2048 pixels and a speed of 1 FPS. The processing terminal utilizes Visual Strain Gauge V1.0 software for post-processing digital speckle images, enabling analysis of surface micro-deformations and generating deformation diagrams including principal strain fields, shear strain fields, and engineering strain fields during loading. Prior to testing, multiple light source adjustments are required to eliminate natural light interference. When the digital speckle monitoring system is arranged, the blue light source is first turned on to illuminate the surface of the specimen. Through the orientation and focal length test of the camera, the digital speckle image is located in the middle of the lens and in a high-definition state.
The acoustic emission sensors employed Nano-30 transducers with a monitoring frequency range of 100–900 kHz. The system utilized Rock Test for Express-8 monitoring software, with data terminals handling acoustic emission information storage and visual output. Four sensors were arranged in the experiment according to the layout shown in Figure 3. Prior to testing, environmental noise was analyzed with the preamplifier gain set to 40 dB and the sampling frequency configured at 1 MHz. The initial timing of the loading system, acoustic emission acquisition system, and image acquisition system was synchronized to ensure consistent initial acquisition times across all systems.
Figure 4 displays the complete stress–strain curves for different lithological specimens during loading. It can be seen that the peak stress of gray sandstone is much higher than that of sandy mudstone, and the compressive strength of gray sandstone is higher than that of sandy mudstone. SN-1 exhibited a macroscopic crack extending diagonally from the upper left corner to the lower right corner, with the on-site specimen having separated into two distinct blocks. SN-2 showed a prominent macroscopic fissure running from the upper left to the lower left corner on its left side, resulting in partial detachment of the specimen’s left portion. SN-3 developed multiple macroscopic cracks originating from the top, propagating through the central region of the specimen, and terminating at the base, causing structural separation along these fracture paths. S-1 displayed a significant macroscopic crack on the left side that induced block detachment. S-2 manifested a dense concentration of cracks at the top that progressively extended toward the specimen’s left side, ultimately leading to the collapse of the left block. S-3 developed a characteristic macroscopic crack that initially propagated from the upper left to the lower right before diverting downward to the lower left, culminating in the specimen’s fragmentation into multiple discrete blocks. The loading curve of grey sandstone remains smooth before reaching peak stress, demonstrating the absence of pre-existing fractures affecting mechanical properties and confirming the rationality of the specimen preparation. In contrast, sandy mudstone shows significant stress drops prior to peak stress, likely attributable to weak planes within the specimens. These weak planes may have facilitated crack propagation along their interfaces before peak stress was attained, leading to unstable fracture development.

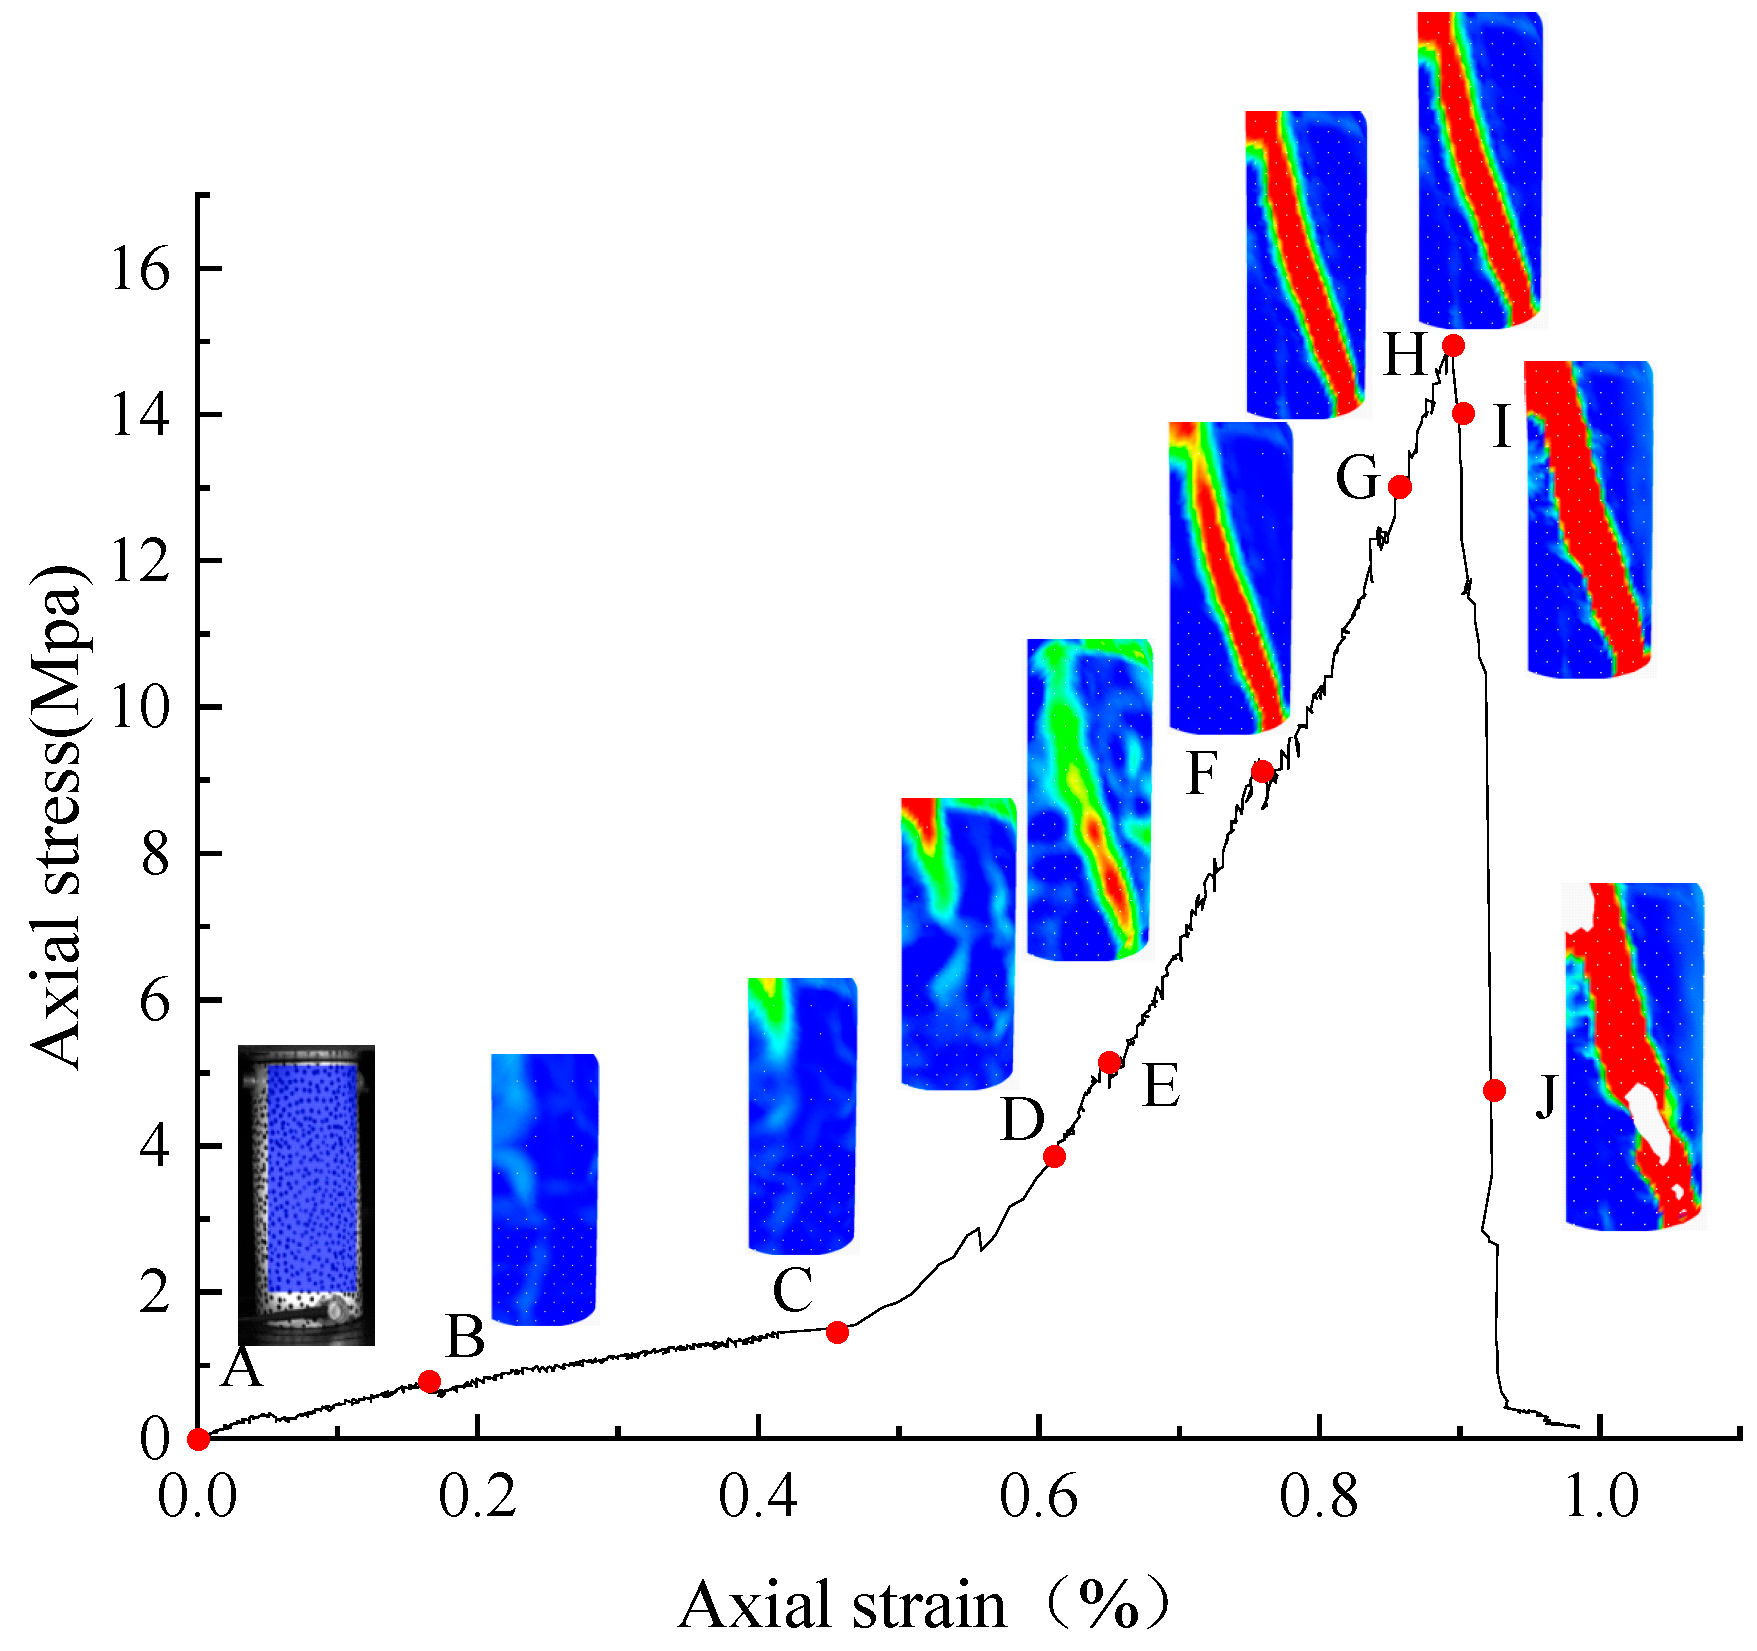
2.2. Evolution Characteristics of Surface Strain Field

Under the same test conditions, the stress–strain curve of gray sandstone is smooth before the peak stress, while the loading curve of sandy mudstone has multiple stress drop characteristics before the peak stress, and the same lithology samples are similar. The axial stress changes in the same lithology samples are in a close range. Considering the similarity of the test results for specimens with identical lithology, the test results of one gray sandstone and one sandy mudstone sample in six groups of tests were randomly selected for analysis.
Figure 5 shows the complete loading curve of SN-1. According to the characteristics of the curve, 10 identification points are selected at typical moments: Marker A: Unloaded state; Marker B: Compaction stage; Marker C: Endpoint of compaction phase before the first significant oscillation; Marker D: Initial elastic loading stage; Markers E and F: Elastic loading stage with notable oscillations; Marker G: Plastic stage preceding peak stress; Marker H: Peak stress point; Markers I and J: Post-peak stress decline phase.
Figure 5 shows the strain field cloud diagrams at various marked points of SN-1, with the extraction range of the cloud diagram indicated by the rectangle at marked point A.
At marked point B during the initial loading stage, the specimen was in the compaction phase with only minor deformations. The strain field distribution remained uniform, showing no significant stress fluctuations.
As the load increased, a localized low-stress zone began to emerge at the upper left corner of the region corresponding to marked point C.
With continued loading, marked point D reached the peak of the first stress drop. At this stage, the low-strain regions continued to expand, while strain values began to increase, indicating the gradual expansion of the damage range and the progressive intensification of the damage severity.
At marked point E, at this time, the high-strain zone changes drastically, and the strain zone expands from the upper left corner to the lower right corner. The strain value increases rapidly before the first stress peak, and the strain band is very clear, indicating that the internal damage of the sample expands from the local to the whole.
At point F, as stress continued to increase, the strain values in the specimen’s deformation zone rose progressively, and the width of the high-strain zone expanded. The low-strain regions in the transitional areas of the original strain bands also gradually intensified. It shows that a new resistance structure is formed inside the sample. Microcracks accumulated and coalesced near the main crack, extending toward both sides of the main crack, while internal damage accumulation intensified.
At point G, prior to the peak stress point, both the width and strain values of the high-strain zone continued to grow. Corresponding actual images revealed through-going cracks penetrating the specimen surface, signifying that the main crack had propagated from the interior to the surface.
At point H, upon reaching the peak stress point, the high-strain zone underwent dramatic changes: its width rapidly expanded, strain values peaked, and stress sharply declined.
At post-peak point J, the specimen had completely fractured into two separate blocks. The strain field became fragmented, and a blank area appeared in the center of the high-stress zone, rendering further monitoring impossible.
Figure 6 shows the loading curve of the entire S-3 process. Based on the curve characteristics, six marker points were selected at typical stages: the identification point A is the unloaded stage, point B marks the end of the compaction stage, point C lies in the elastic loading stage, point D indicates the elastic–plastic transition, point E corresponds to the stress peak stage, and point F denotes the stress decline stage.
To minimize the influence of bonded acoustic emission sensors and specimen boundaries on the strain field, the cloud diagram extraction range is defined by the rectangular area shown at marker point A.
At marker point B, during the initial loading compaction stage, the strain field distribution remains relatively uniform, with only minor deformation observed in the lower left corner.
As loading increases to marker point C, a localized high-strain zone begins to develop in the upper left corner. The load continues to increase before the peak stress at the marking point D, the low-strain area in the upper left corner, becomes overridden, while strain values in the lower left deformation zone surge dramatically, indicating progressive damage accumulation in this region.
At the marker point E stress peak, the high-strain zone undergoes abrupt changes. The strain field continuously propagates from the upper left to the lower left corner, with strain values rapidly escalating compared to pre-peak levels. A distinct strain band forms, revealing that internal damage transitions from localized to global expansion after the first stress drop.
At the marker point F post-peak stress reduction, the specimen exhibits continuous increases in both the strain magnitude and the high-strain zone width. Previously low-strain transitional areas gradually develop higher strains, suggesting the formation of new resistance structures within the specimen. Microcracks near the main crack accumulate and coalesce, propagating laterally along the main fracture. The degree of damage accumulation inside the specimen is increased. Corresponding photographic evidence shows through-going surface cracks, indicating complete specimen separation into two distinct blocks. The strain field is broken, and there is a blank area in the middle of the high-stress area, so it is impossible to continue monitoring.

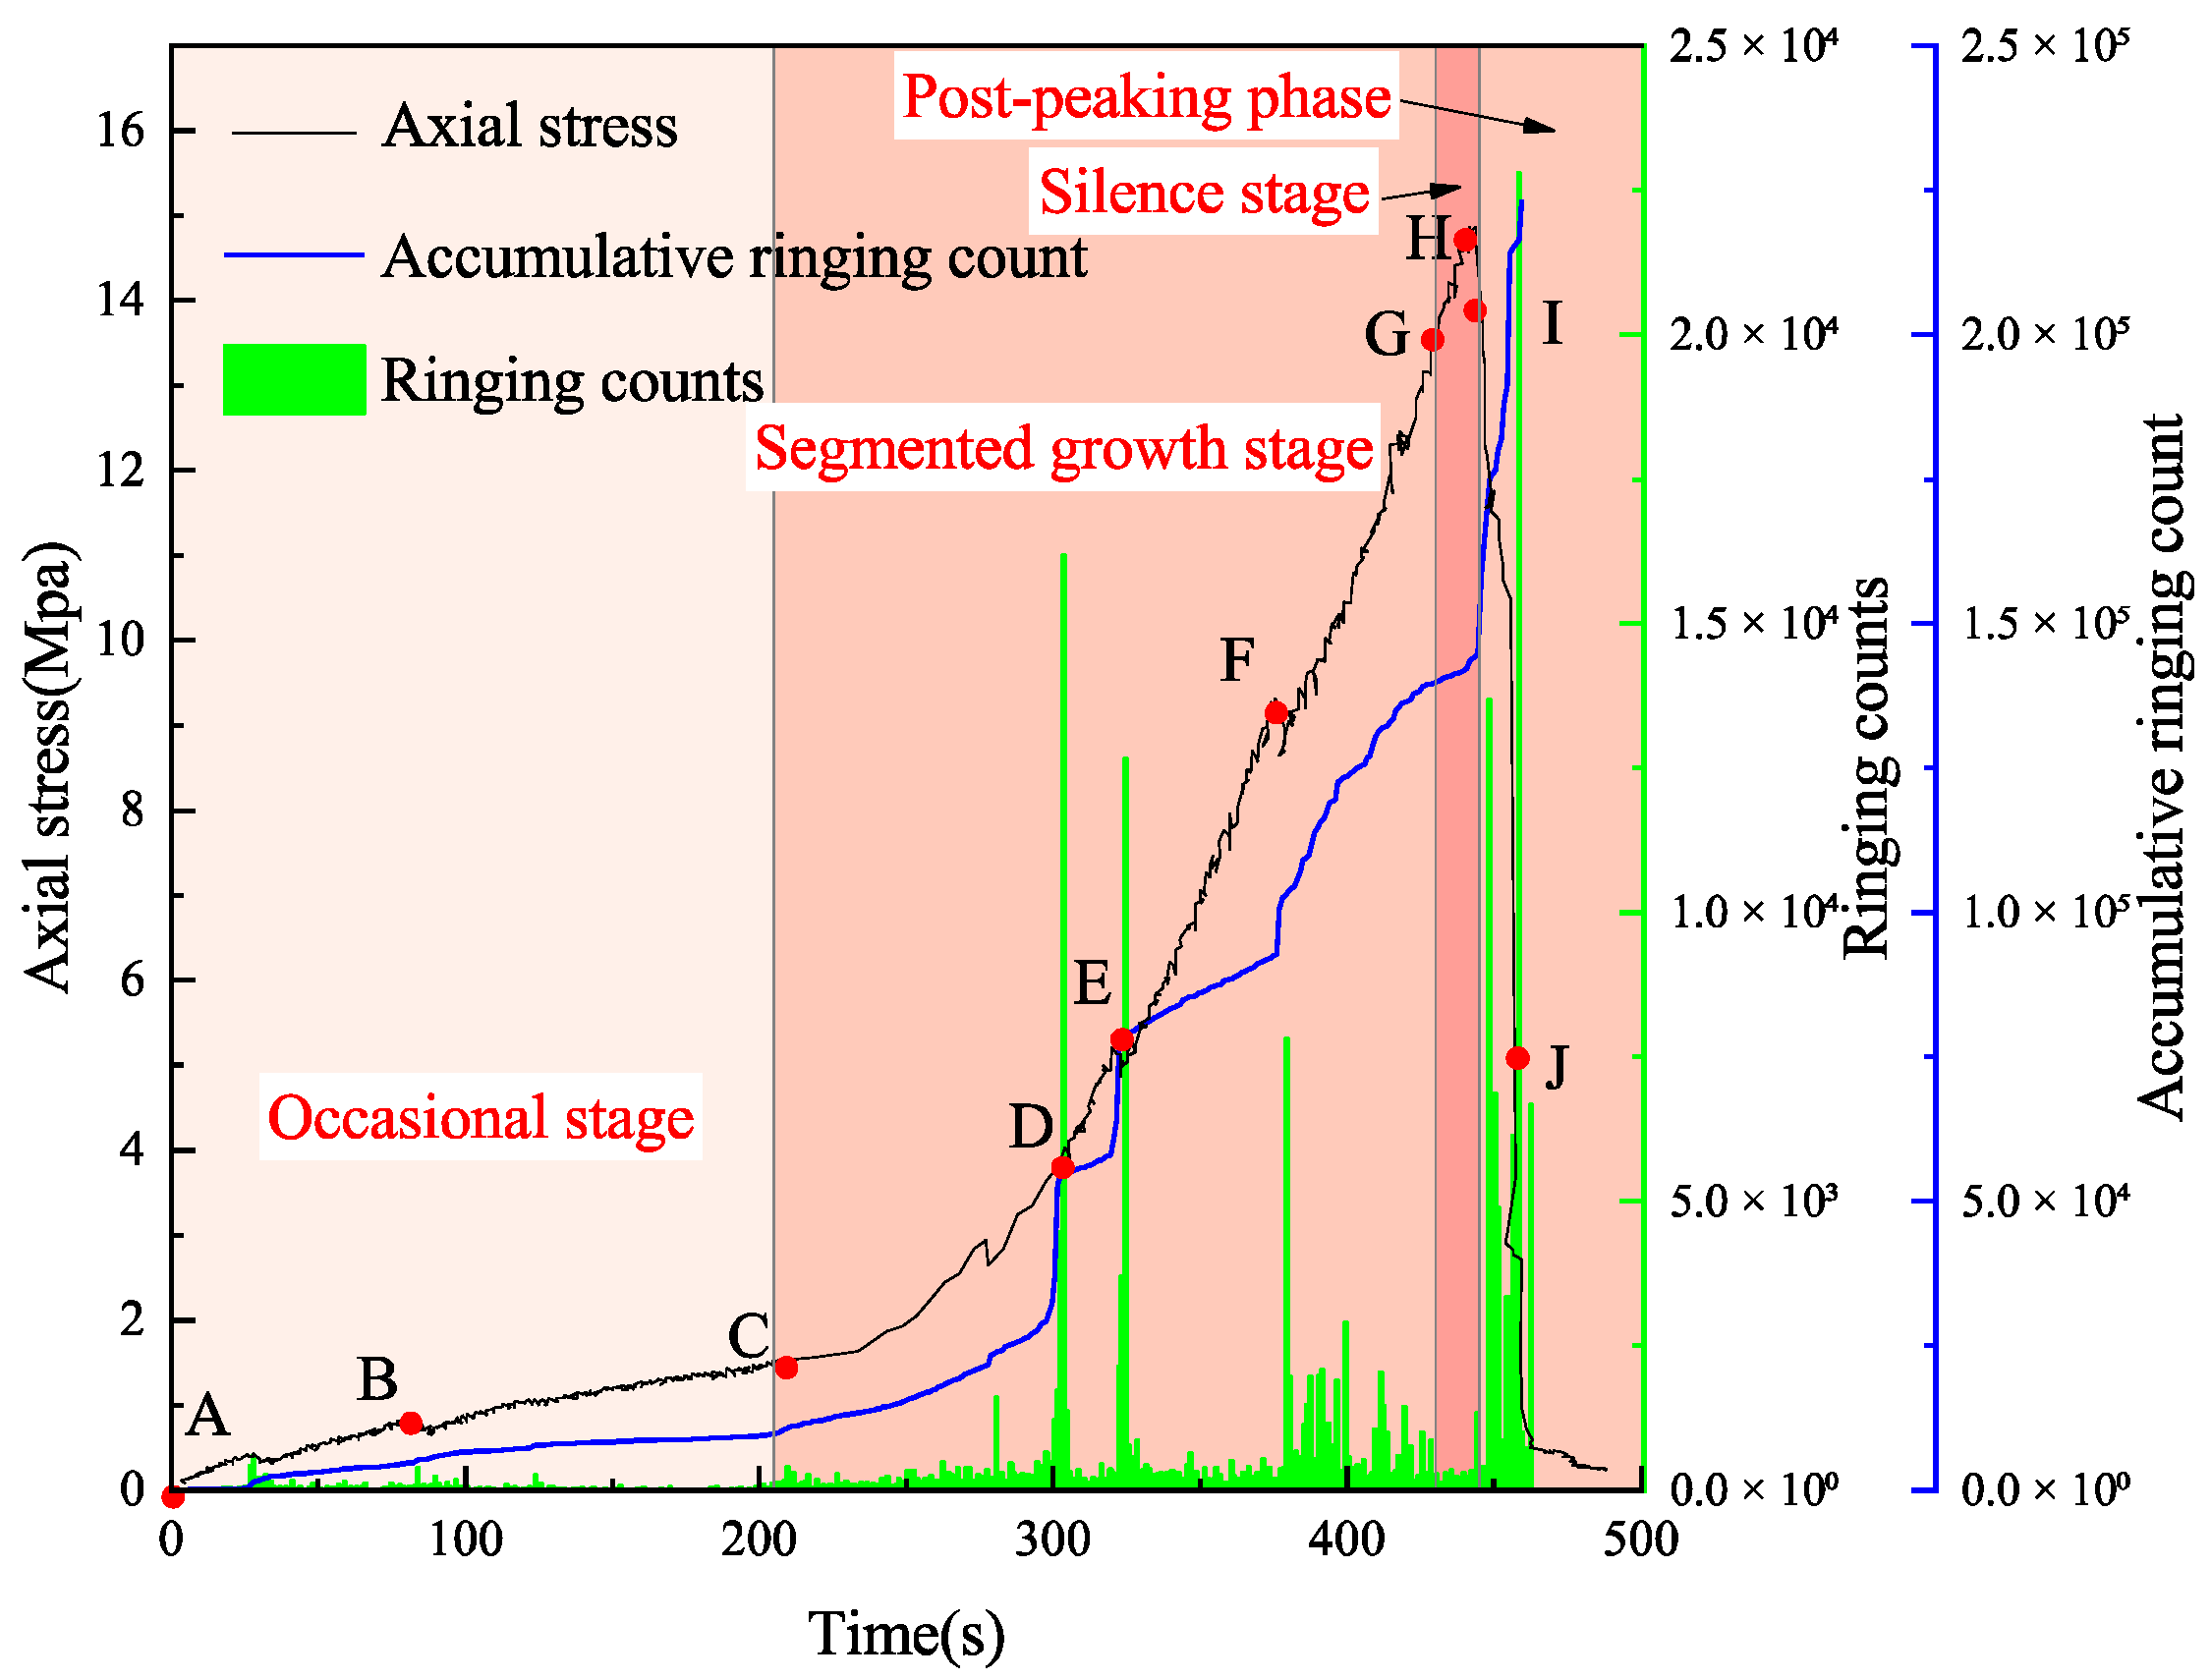
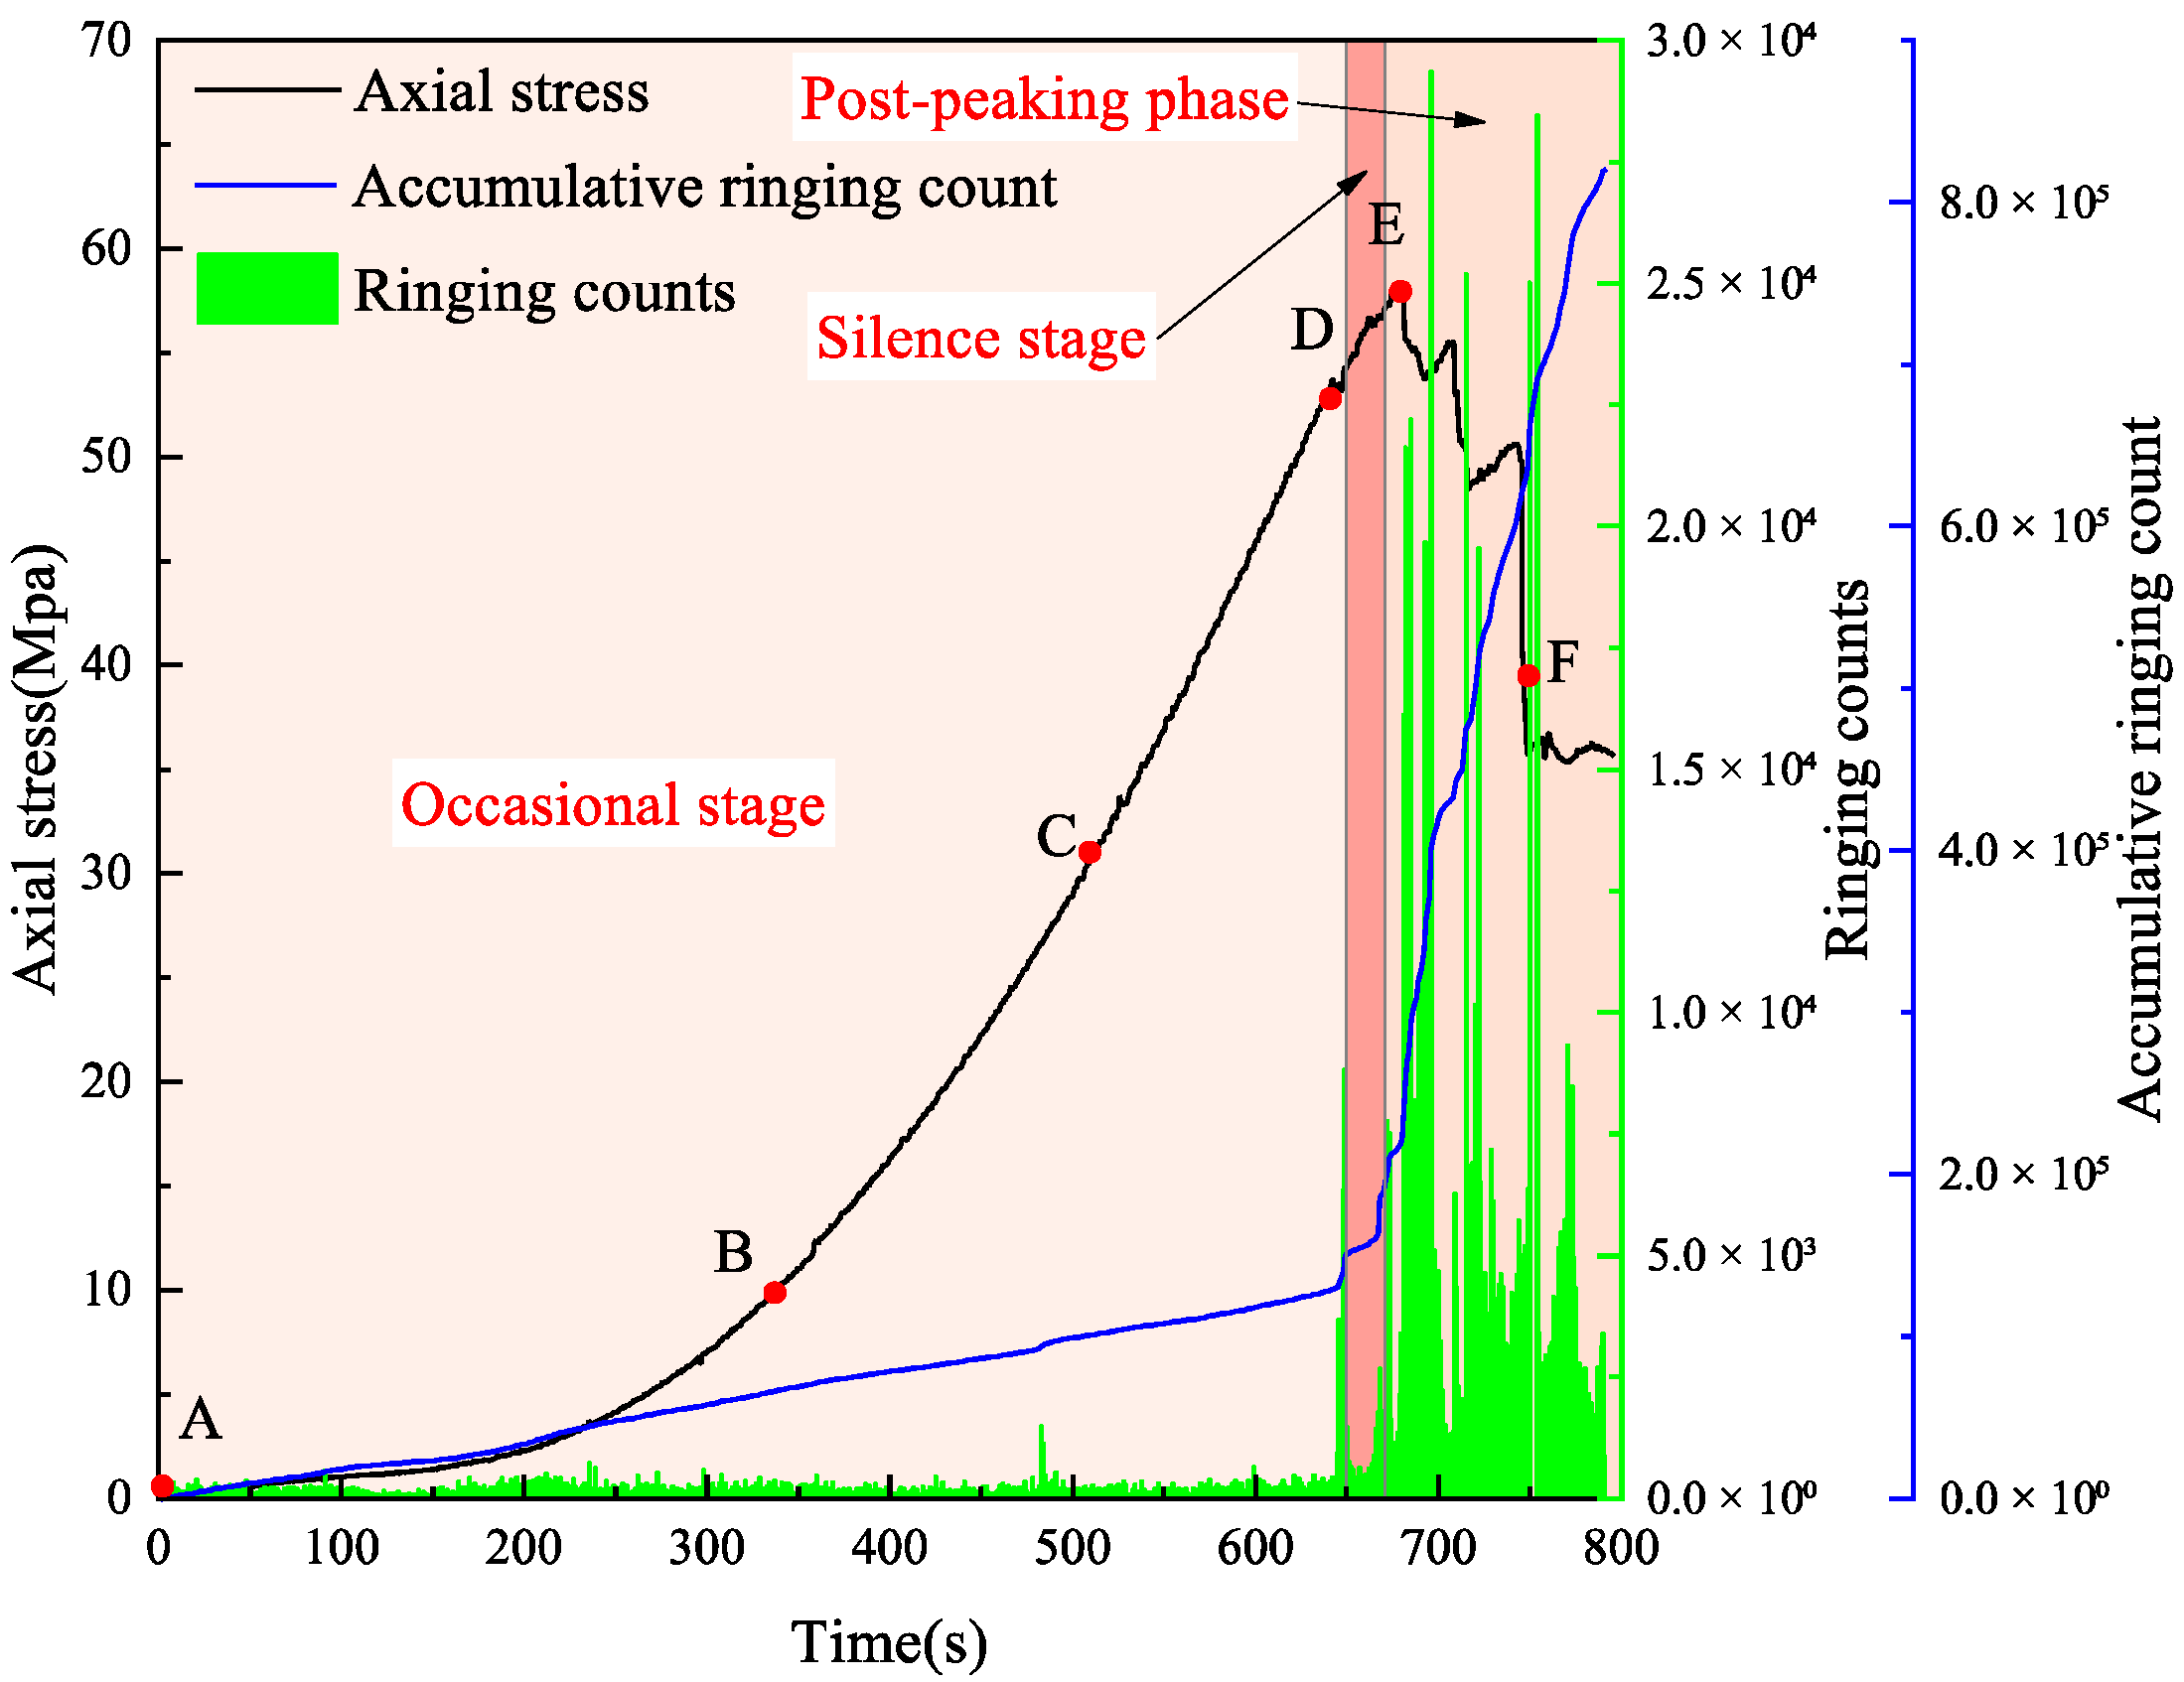
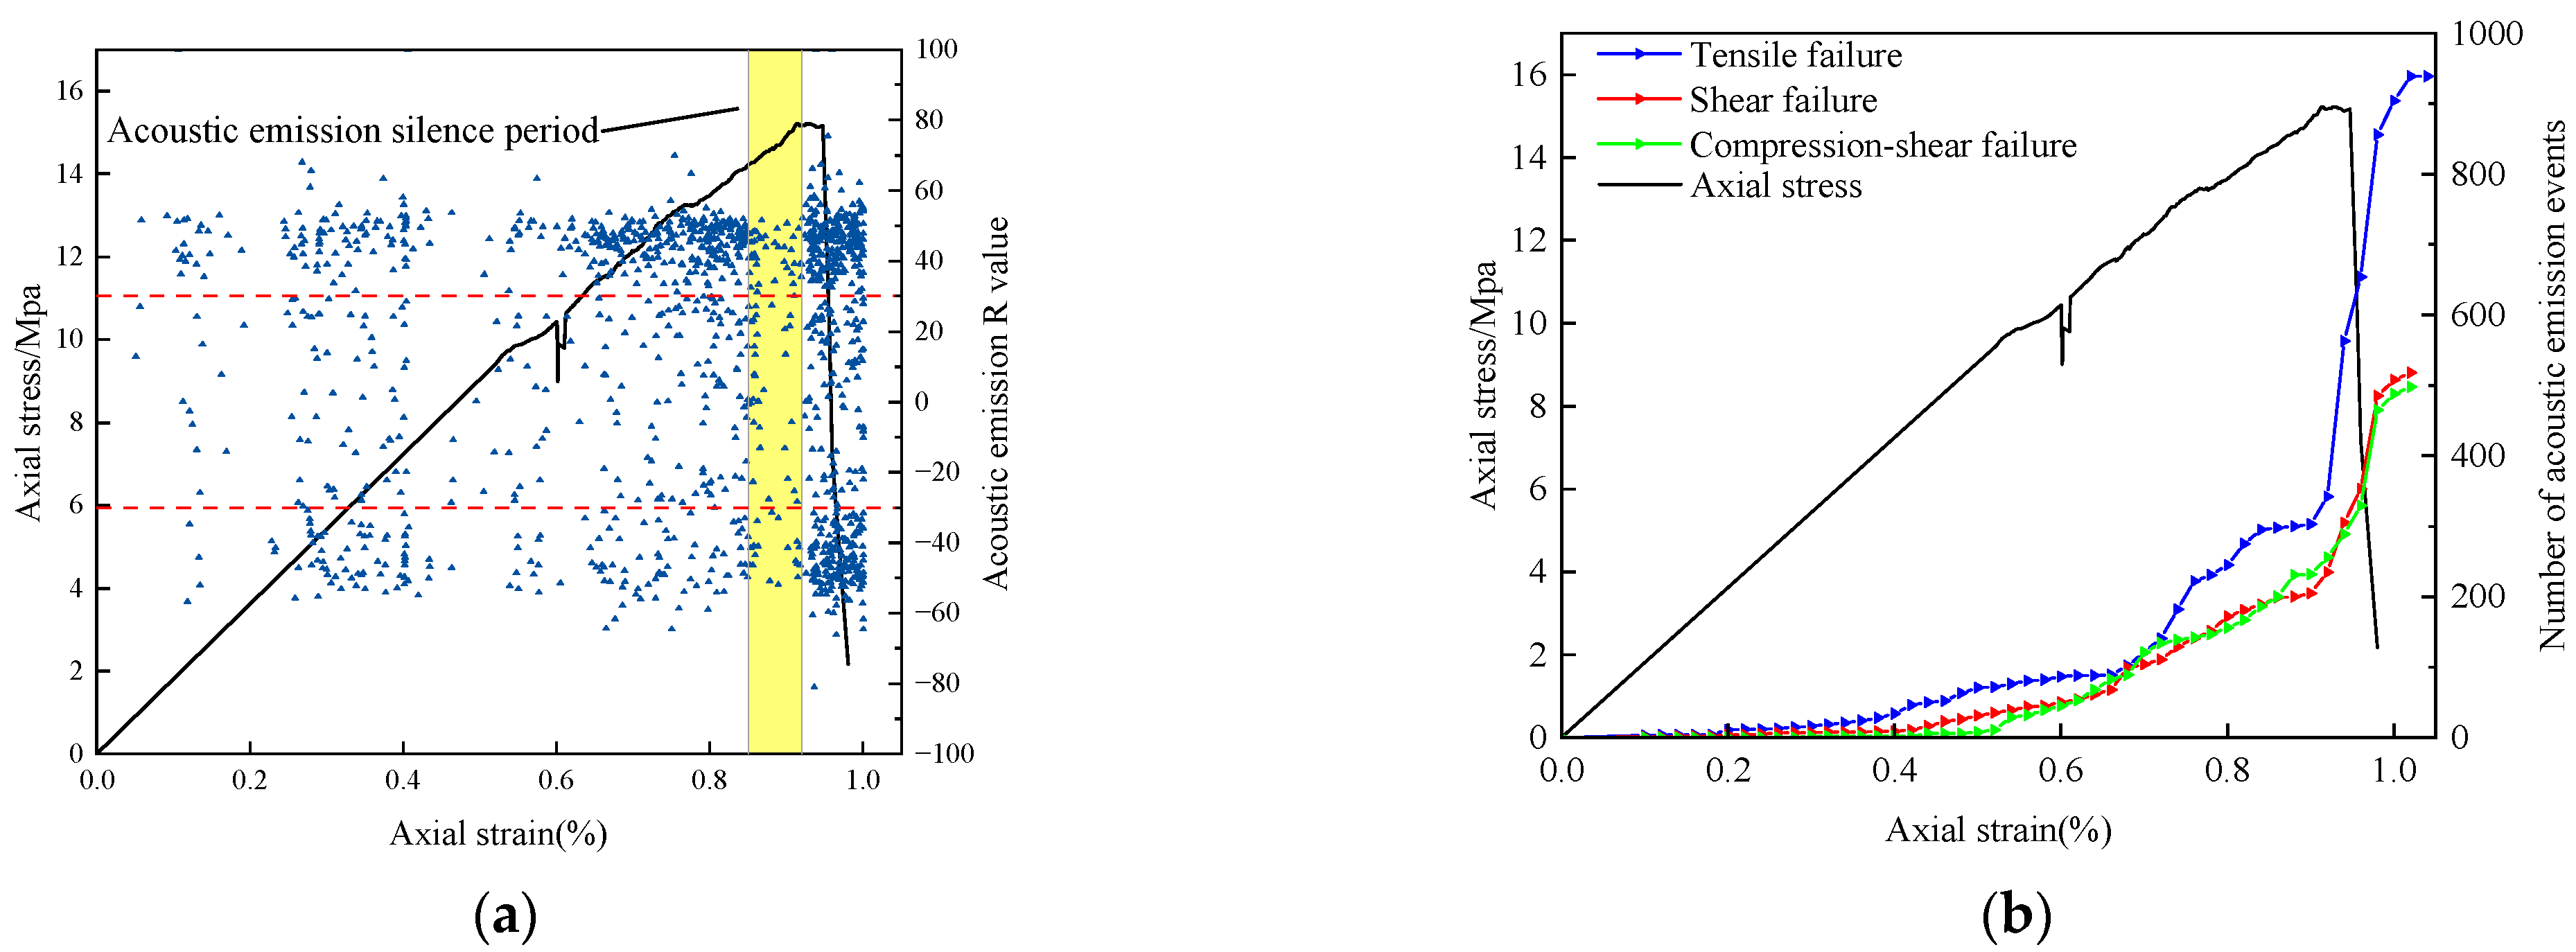
2.3. Acoustic Emission Results and Analysis

The surface deformation field during sandstone loading was analyzed above. To gain deeper insights into the internal failure characteristics and understand the deformation–failure mechanisms, further analysis of acoustic emission (AE) information is required.
By conducting a combined analysis of AE ring counts, cumulative AE ring counts, and stress, the SN-1 results are shown in Figure 7. Based on the cumulative ring count curve, the AE process of SN-1 can be divided into the following stages:
Occasional AE stage (points A–C): This stage exhibits minimal AE ring counts and cumulative counts, with only Occasional AE signals detected. This corresponds to the initial compaction stage of the specimen, where no new cracks are generated internally.
Acoustic emission segmented growth stage (identification points C–G): At this stage, with several large stress drops, each stress drop is accompanied by a sharp increase in the ringing count, which is manifested in a step-by-step increase in the cumulative ringing count. This shows that the internal cracks of the sample expand rapidly at this stage, and each stress drop indicates the breakthrough development of the main crack.
Acoustic emission silence stage (marking points G–H): Before the peak stress, there is a phenomenon of acoustic emission silence in sandy mudstone, and the number of acoustic emission ringing counts in this stage is temporarily stagnant.
Post-peak stage of acoustic emission (identification point H–J): This stage corresponds to the whole post-peak stage of the loading process. The ringing count suddenly increases sharply after a short silence before the peak and increases to the highest level in a very short time. The cumulative ringing count increases linearly. This process has been maintained from the peak stress stage to the end of loading. This shows that the internal crack growth and expansion speed of the sample reaches the maximum, and the internal crack expands to the surface of the sample.
The evolution process of S-3 acoustic emission ring-down counts with stress–strain is shown in Figure 8. The acoustic emission process can be divided into the following stages:
Occasional AE Stage (Markers A–D): This stage corresponds to the specimen compaction phase and elastic loading phase. The number of acoustic emission ring-down counts is relatively low, with the cumulative ring-down count curve showing slow growth. Acoustic emission signals only appear sporadically.
AE Silence Stage (Markers D–E): Similar to sandy mudstone, gray sandstone also exhibits an acoustic emission Silence phenomenon before peak stress. During this stage, the growth of acoustic emission ring-down counts temporarily stagnates.
AE Post-Peak Stage (Markers E–F): This stage corresponds to the entire post-peak phase of the loading process. With several significant stress drops occurring during this phase, each stress drop is accompanied by a sharp increase in ring-down counts, manifested as linear growth in the cumulative ring-down count curve. This indicates that the crack propagation rate within the specimen reaches its maximum, with internal cracks extending to the specimen surface. Consequently, macroscopic cracks penetrating the specimen are observed in photographs.
Next, an analysis of the failure types during the experimental process will be conducted. In acoustic emission analysis, the RA-AF scatter plot is employed to distinguish between shear failure and tensile failure modes in rocks. We classified the internal crack types of the specimens using the conventional RA (rising time/amplitude)-AF (average frequency) formulas, such as Formulas (1) and (2):
R A = R T A M
A F = R D T
where RT is the cumulative rise time, AM is the acoustic emission amplitude, RD is the ring-down count, and T is the duration.
After processing and analyzing relevant experimental data, RA-AF scatter distribution plots for two lithological specimens were generated. In these plots, the y-axis, AF, represents the ratio of the acoustic emission ring-down count to the duration. The x-axis, RA, denotes the ratio of the acoustic emission rise time to the maximum amplitude. Under logarithmic coordinates, the coordinate points exhibited distinct clustering characteristics. Therefore, the K-means clustering method [42,43] was adopted to differentiate rock failure modes. As the analysis required distinguishing between shear and tensile failures, therefore, the clustering number k is specified as 2. ‘k’ is the slope boundary between shear failure and tensile failure; k < 2 is shear failure; and k > 2 is tensile failure, which is related to the iterative optimization clustering center. The analytical process is illustrated in Figure 9. The final classification results of failure types are shown in Figure 10, where blue points indicate tensile failures, and red points represent shear failures.
Figure 10a shows that most failure events are located in the low-AF and high-RA region, with shear-type events accounting for 73.6% of the total. This indicates that shear failure under uniaxial loading predominates in sandy mudstone. In Figure 10b, partial events are distributed in the low-RA and high-AF region, while fewer events occur in the high-RA and low-AF region. Shear-type events constitute merely 10.1%, with dense clustering observed in transitional zones. These patterns demonstrate that tensile failure dominates the failure mechanisms in gray sandstone, accompanied by partial shear and tensile–shear mixed failures, with relatively concentrated energy release.
The acoustic emission b-value is utilized to analyze rock mass failure mechanisms, The b-value is the slope of linear regression by counting the number of events of different magnitudes, requiring fitting through the Gutenberg–Richter empirical formula for calculation [44]:
log 10 N = a b M
where a is a constant, and N represents the number of acoustic emission events with amplitudes greater than or equal to a specific magnitude M. M denotes the acoustic emission amplitude.
The fitting results are illustrated in Figure 11, where the horizontal axis represents the acoustic emission amplitude, and the vertical axis corresponds to the logarithm of the cumulative acoustic emission event count N. The red dashed line indicates the fitting results based on the Gutenberg–Richter empirical formula.
As shown in Figure 11, the fitting results for sandy mudstone exhibit significant dispersion, whereas the data for gray sandstone align well with the fitted line. The calculated b-values are 0.041 for sandy mudstone and 0.044 for gray sandstone. According to the physical interpretation of the b-value, a higher b-value suggests dominant plastic deformation and gentler failure, while a lower b-value indicates dominant brittle failure with more intense fracturing. This implies that the failure process of sandy mudstone is more violent compared to gray sandstone. This difference arises because the instability of sandy mudstone during loading occurs intermittently, generating numerous high-energy acoustic emission events even before reaching peak stress. In contrast, the loading process of gray sandstone remains relatively stable, with instability emerging primarily at the peak stress stage. However, the overall low b-values from the fitting results reflect the brittle failure characteristics of both rock types.
In order to eliminate contingency, the experimental results of the remaining samples are processed and analyzed according to the above process, and the results are shown in Table 1. It can be seen from Table 1 that the proportion of shear events in shaly sandstone is higher than that in gray sandstone, while the b-value of acoustic emission is lower than that of gray sandstone, which strengthens the credibility of the analysis conclusion.

3. Study on the Evolution of Rock Force Chain

3.1. Numerical Model Establishment and Parameter Calibration

A two-dimensional discrete element numerical model with initial dimensions of 100 mm × 50 mm was established using PFC2D 5.0 software. The model construction process involved the following steps:
(1)
Generating 15,000 particles within a 50 mm × 100 mm enclosed space formed by four walls, assigning particle properties including friction coefficient and density;
(2)
Bounce open particles to achieve uniform distribution within the enclosed space while eliminating particle overlap;
(3)
Applying inward velocities to the walls to compact particles and close interparticle voids;
(4)
Implementing a linear parallel bond model, selected based on extensive research demonstrating its effectiveness in rock numerical simulations;
(5)
Removing lateral walls after contact model implementation while retaining upper and lower walls as uniaxial compression loading plates. The numerical model configuration is shown in Figure 12.
Based on SN-1 experimental results from the previous section, a preliminary set of mesoscopic parameters was initially adopted for simulation. Through iterative comparisons between simulation outcomes and laboratory test results, mesoscopic parameter combinations were continuously adjusted until the model’s stress–strain curve characteristics, including the peak stress/strain and the failure mode, aligned with experimental observations. Reasonable microscopic parameters are obtained. The microscopic parameters of the model are shown in Table 2.
After simulation comparison, under the same meso-parameter conditions, changing the particle size has little effect on the macroscopic results, as shown in Table 3.

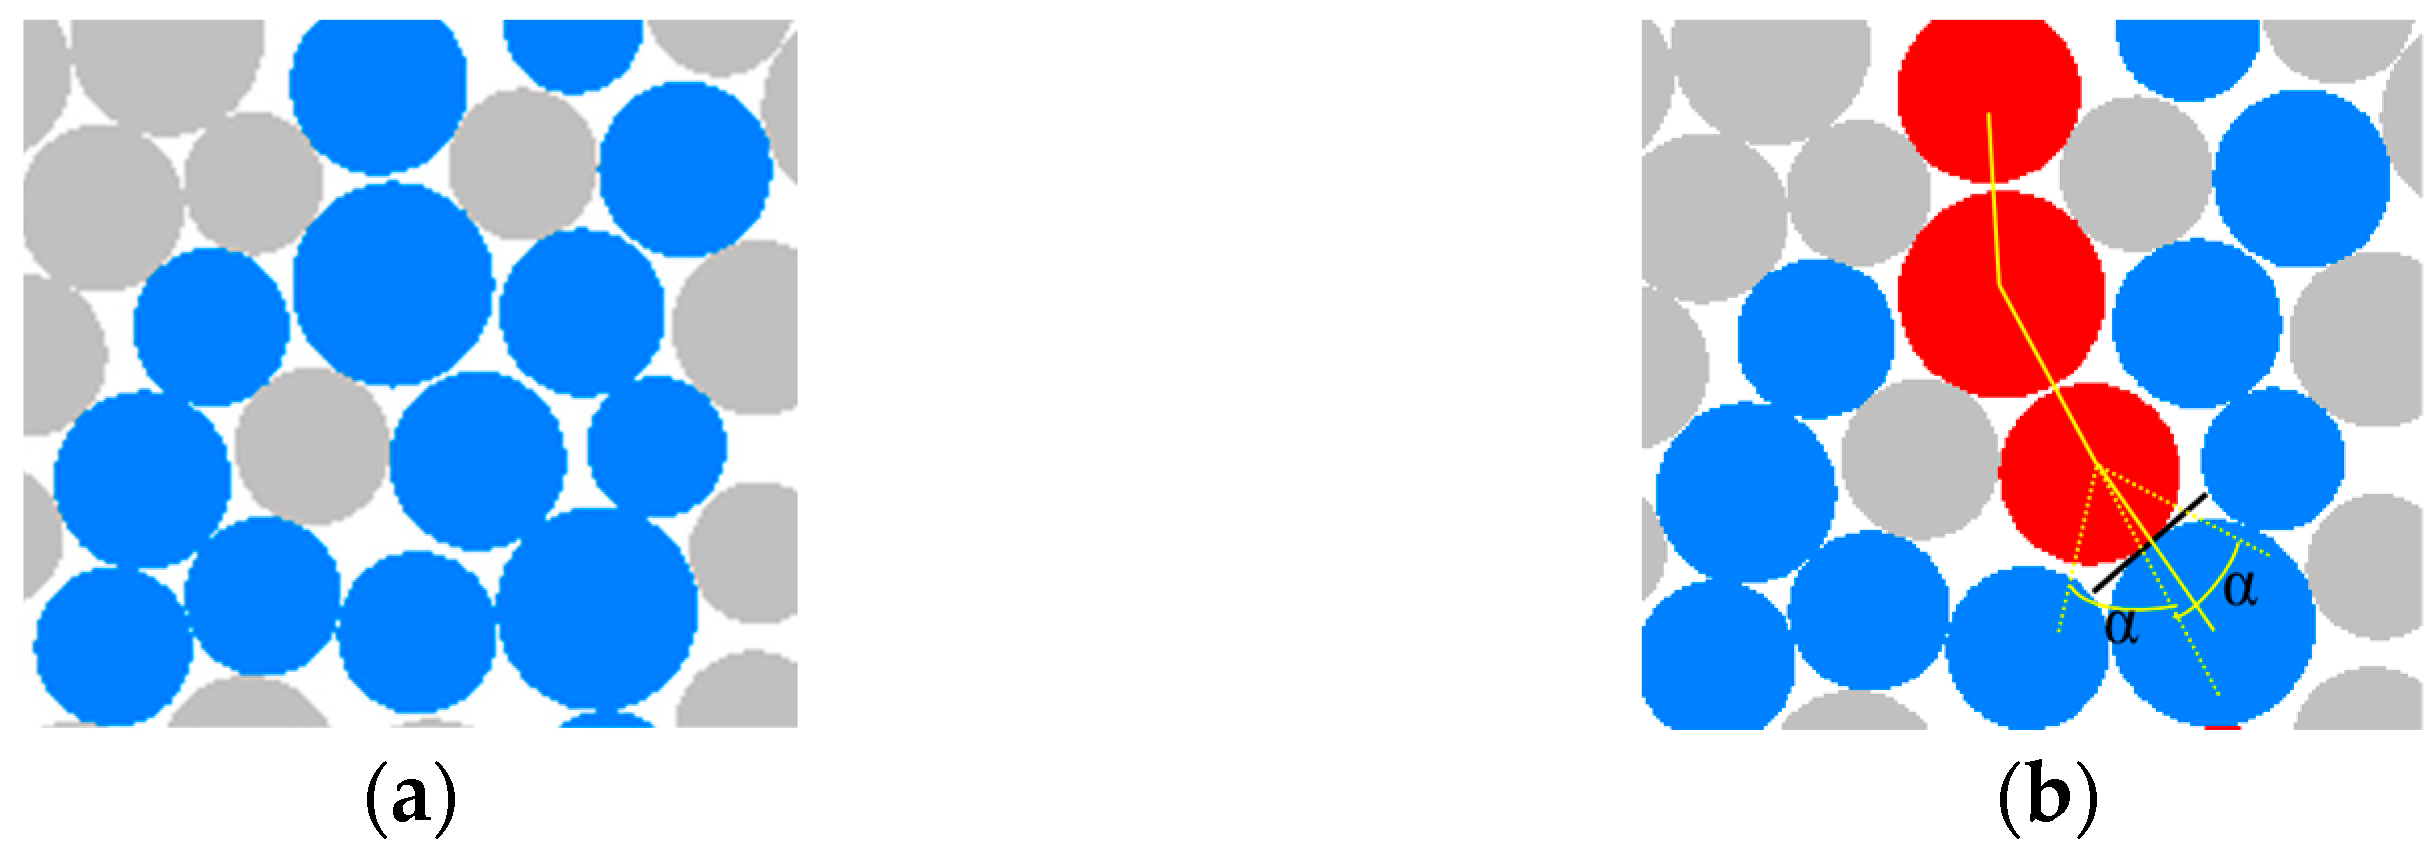
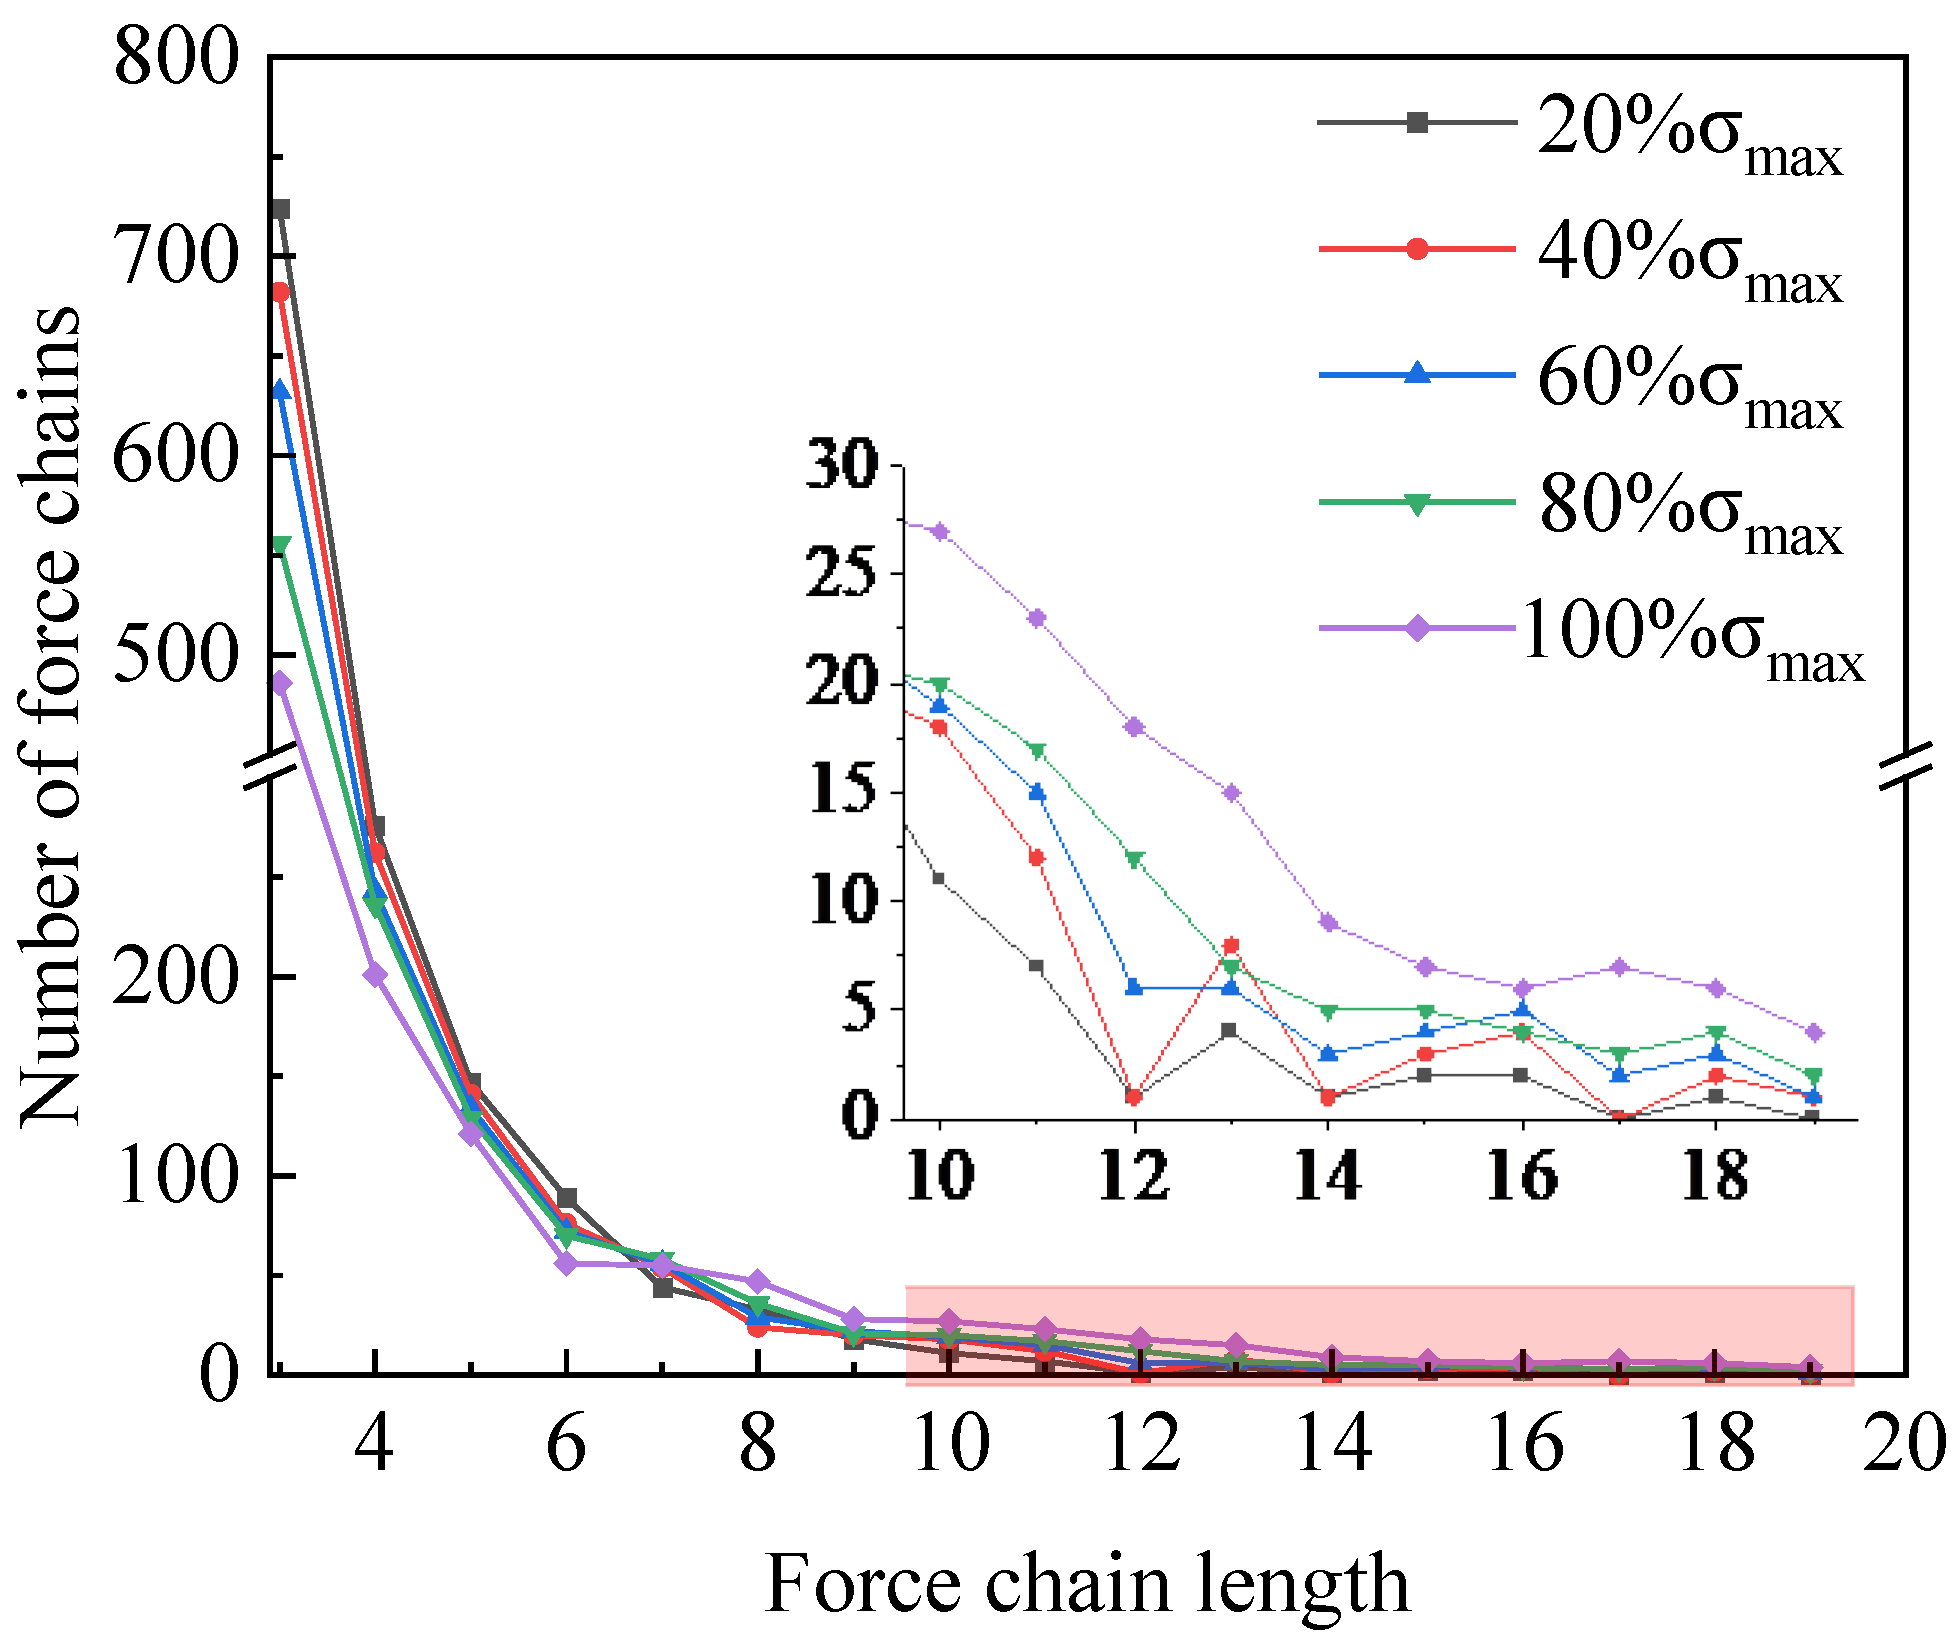
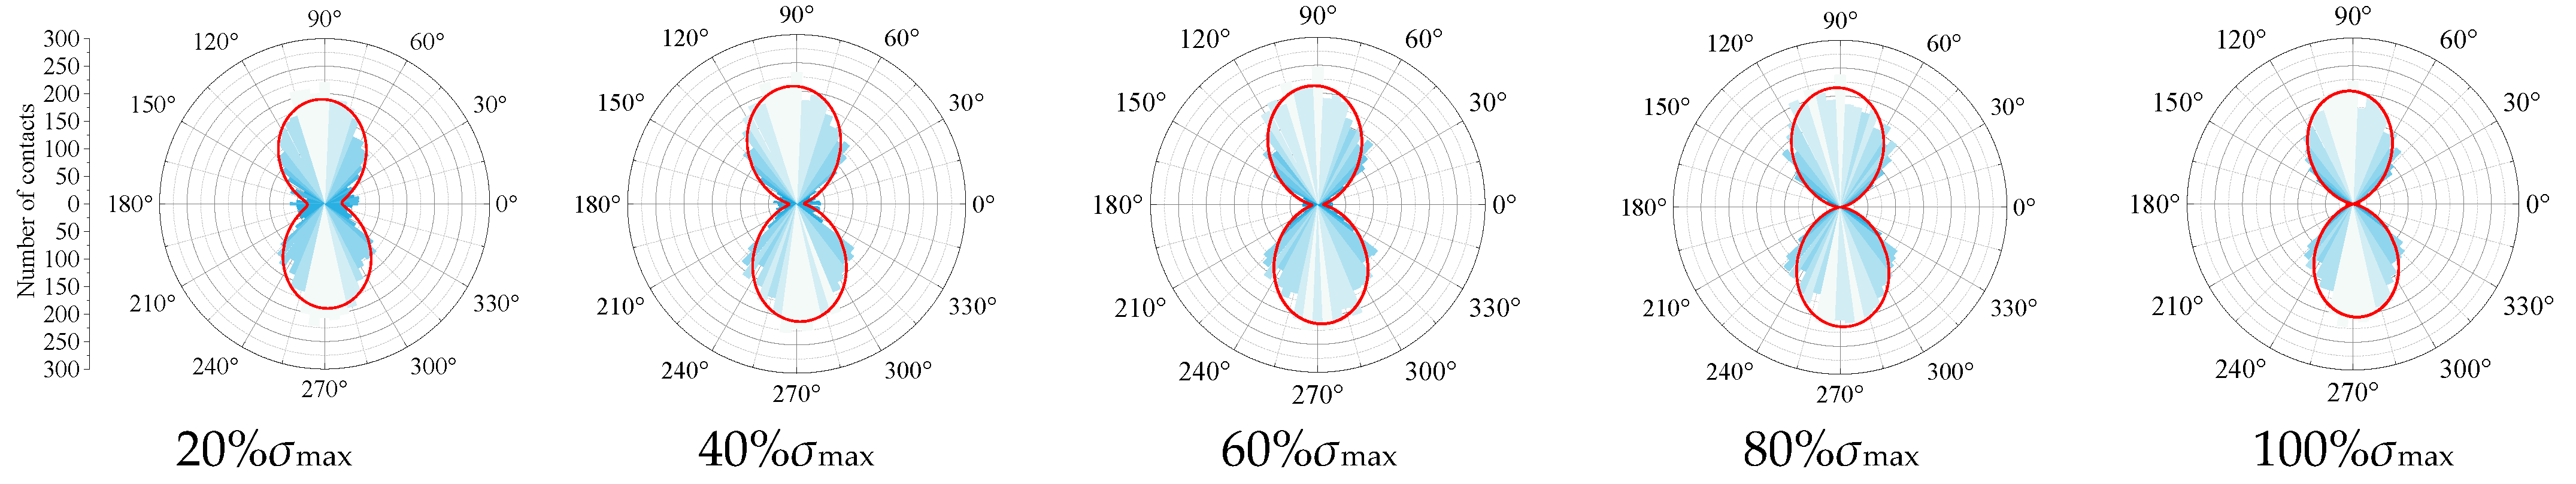
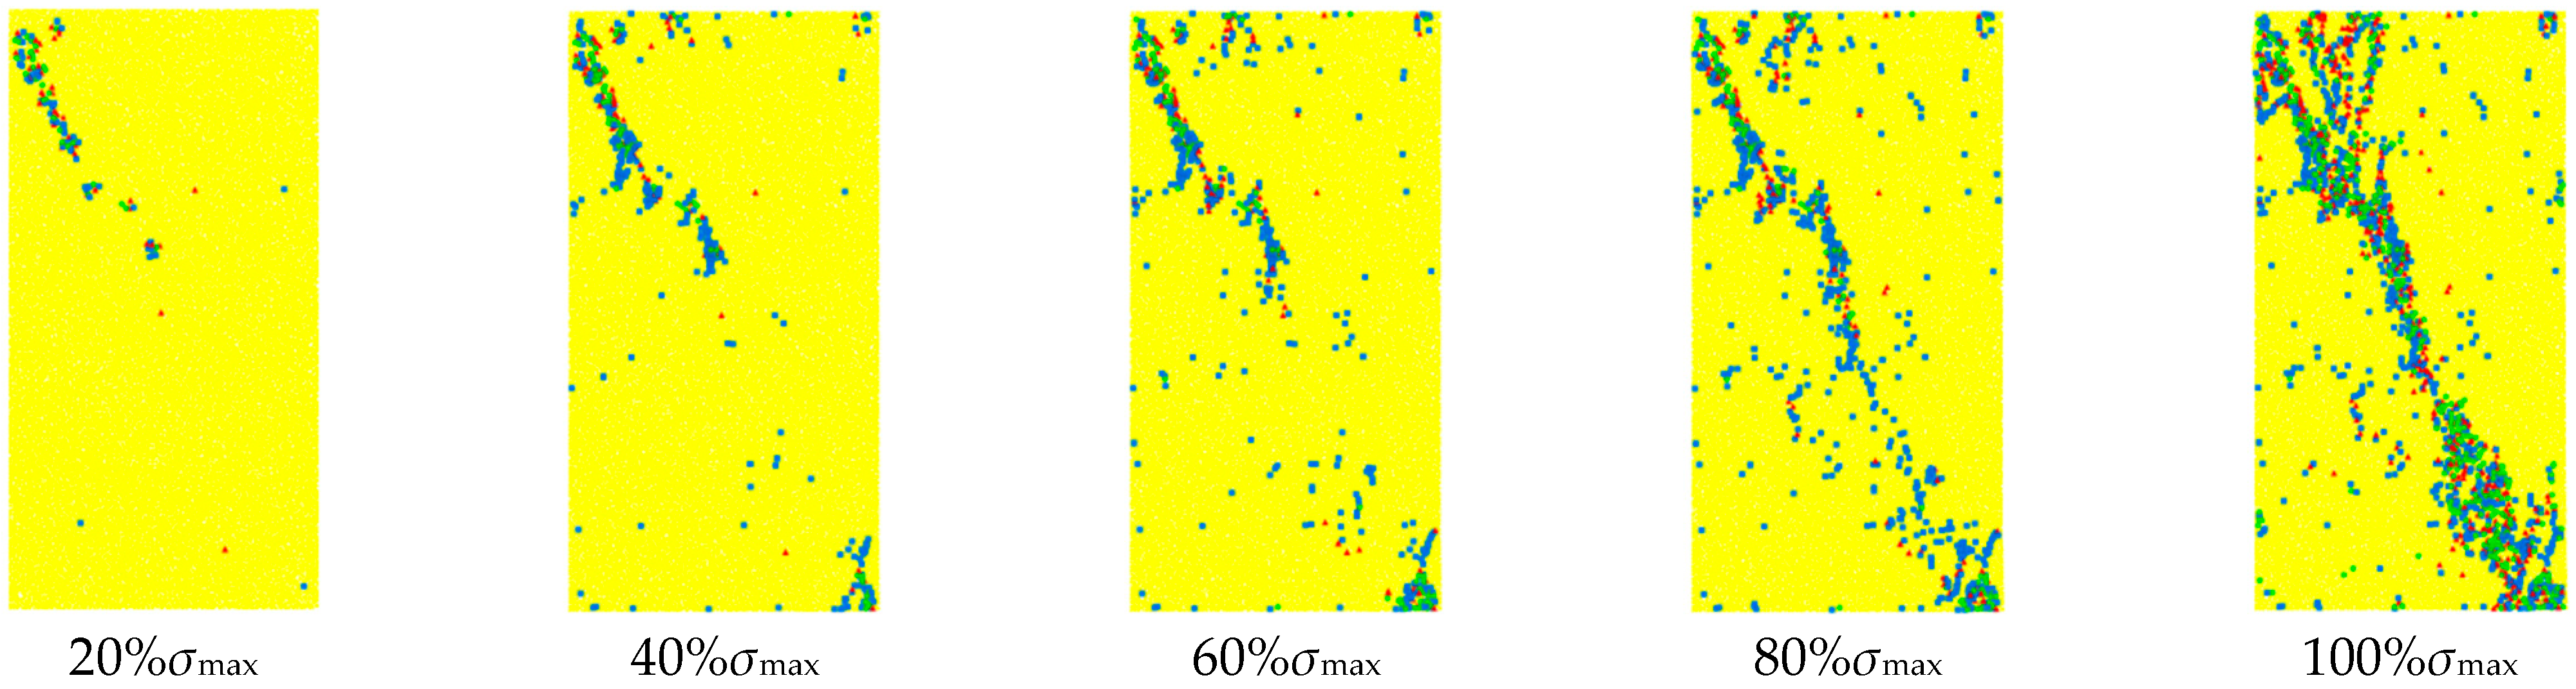
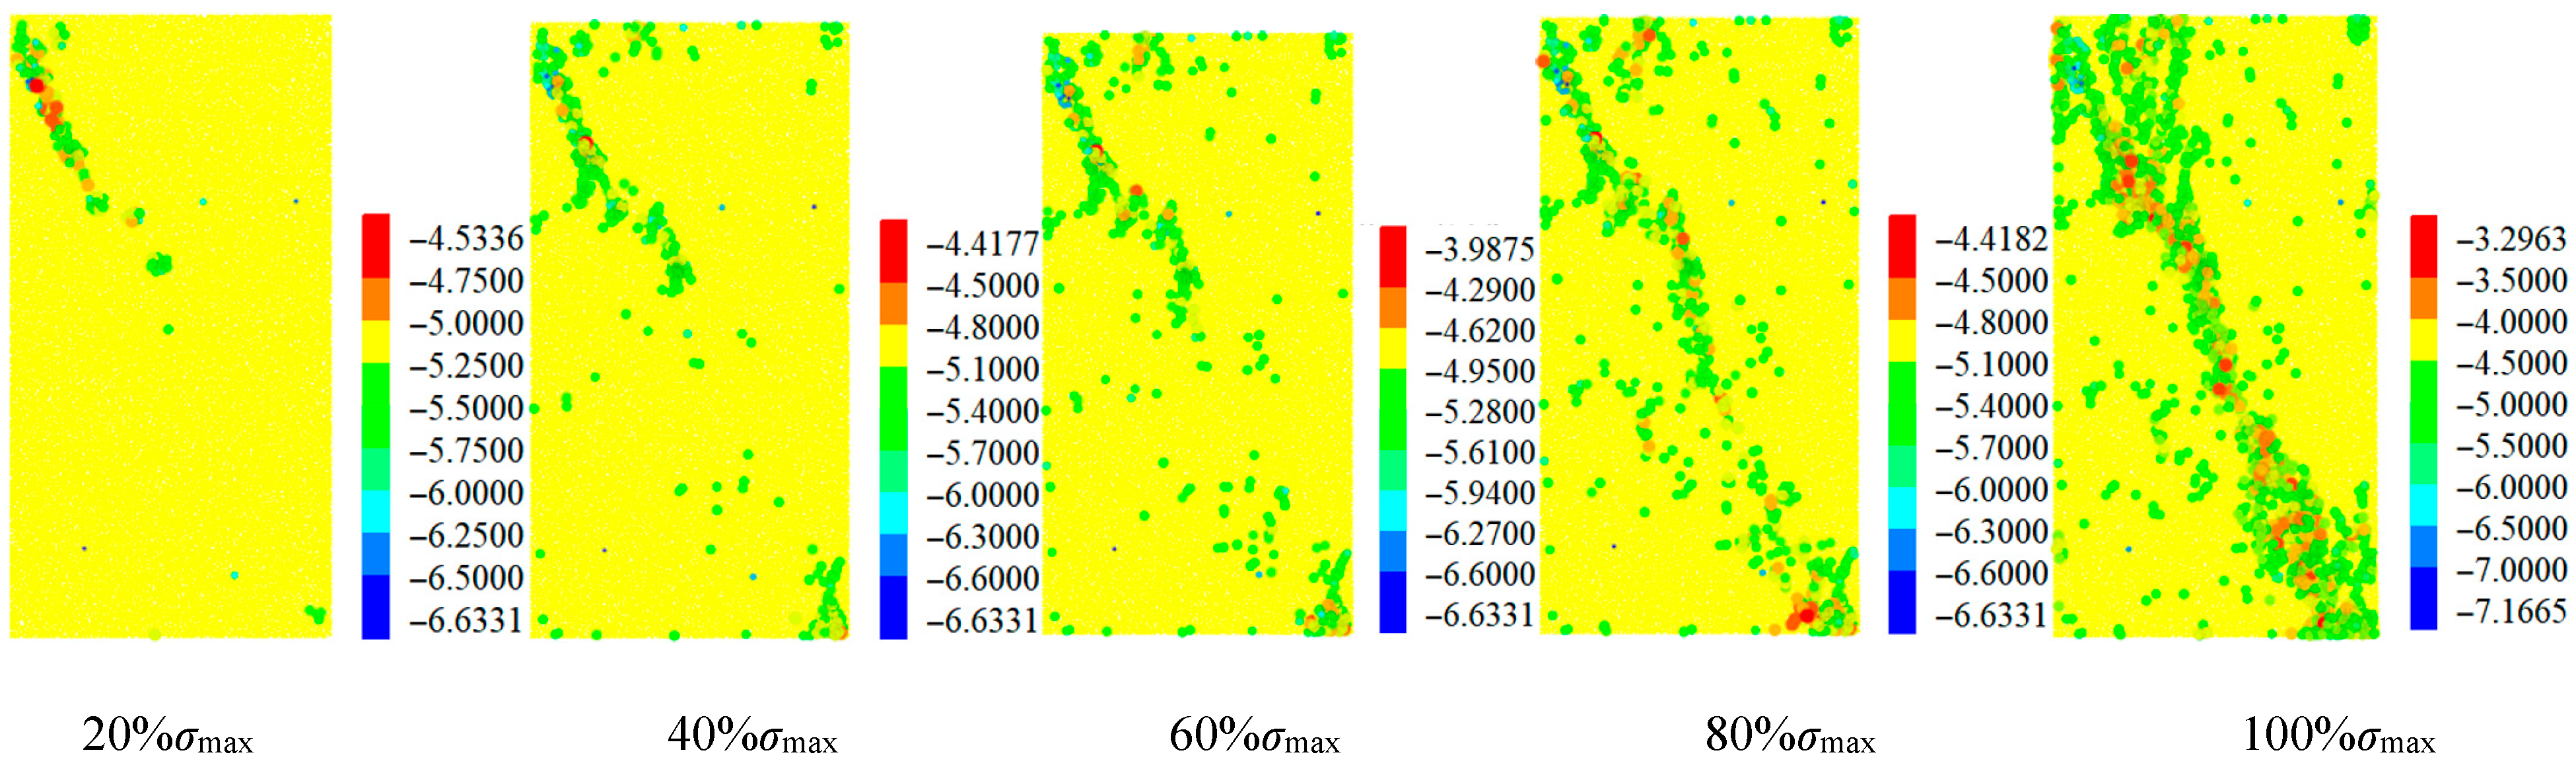
3.2. Evolution Characteristics of Strong Force Chain

The force in the discrete granular material is transmitted from one particle to another particle. This transmission path is visualized as a chain structure, which is called a force chain. Figure 13 shows the characteristics of the rock force chain under different stress states during uniaxial loading. From the diagram, it can be seen that when the initial loading stress is low, the force chain is evenly distributed inside the rock mass, forming a network structure. With the increase in stress, the force chain sparse area appears in the upper left corner and the lower right corner, and the strength of the force chain at the edge of the area increases sharply. The sparse area expands to the center along the diagonal, and the strong force chain also develops to the center, and the length increases continuously. At 100% σmax, the sparse region of the force chain is connected into one, and several strong force chain arch structures are formed in this region. These structures are interconnected to form a clear ‘strong force chain band’.
The transfer, transformation, and direction deflection of the force chain in the process of external force loading are closely related to rock failure, especially the strong chain, which plays a role in maintaining the stability of the bearing structure and transmitting the internal stress. When the rock mass structure is unstable, the direction, shape, and density of the strong chain will show special changes. In order to quantitatively study the evolution law of the strong chain, it is necessary to identify the strong chain in the model first. Based on the determination method of the strong chain based on the physical mechanics of granular materials, the identification conditions of the strong chain are defined as follows:
(1)
Composed of three or more particles;
(2)
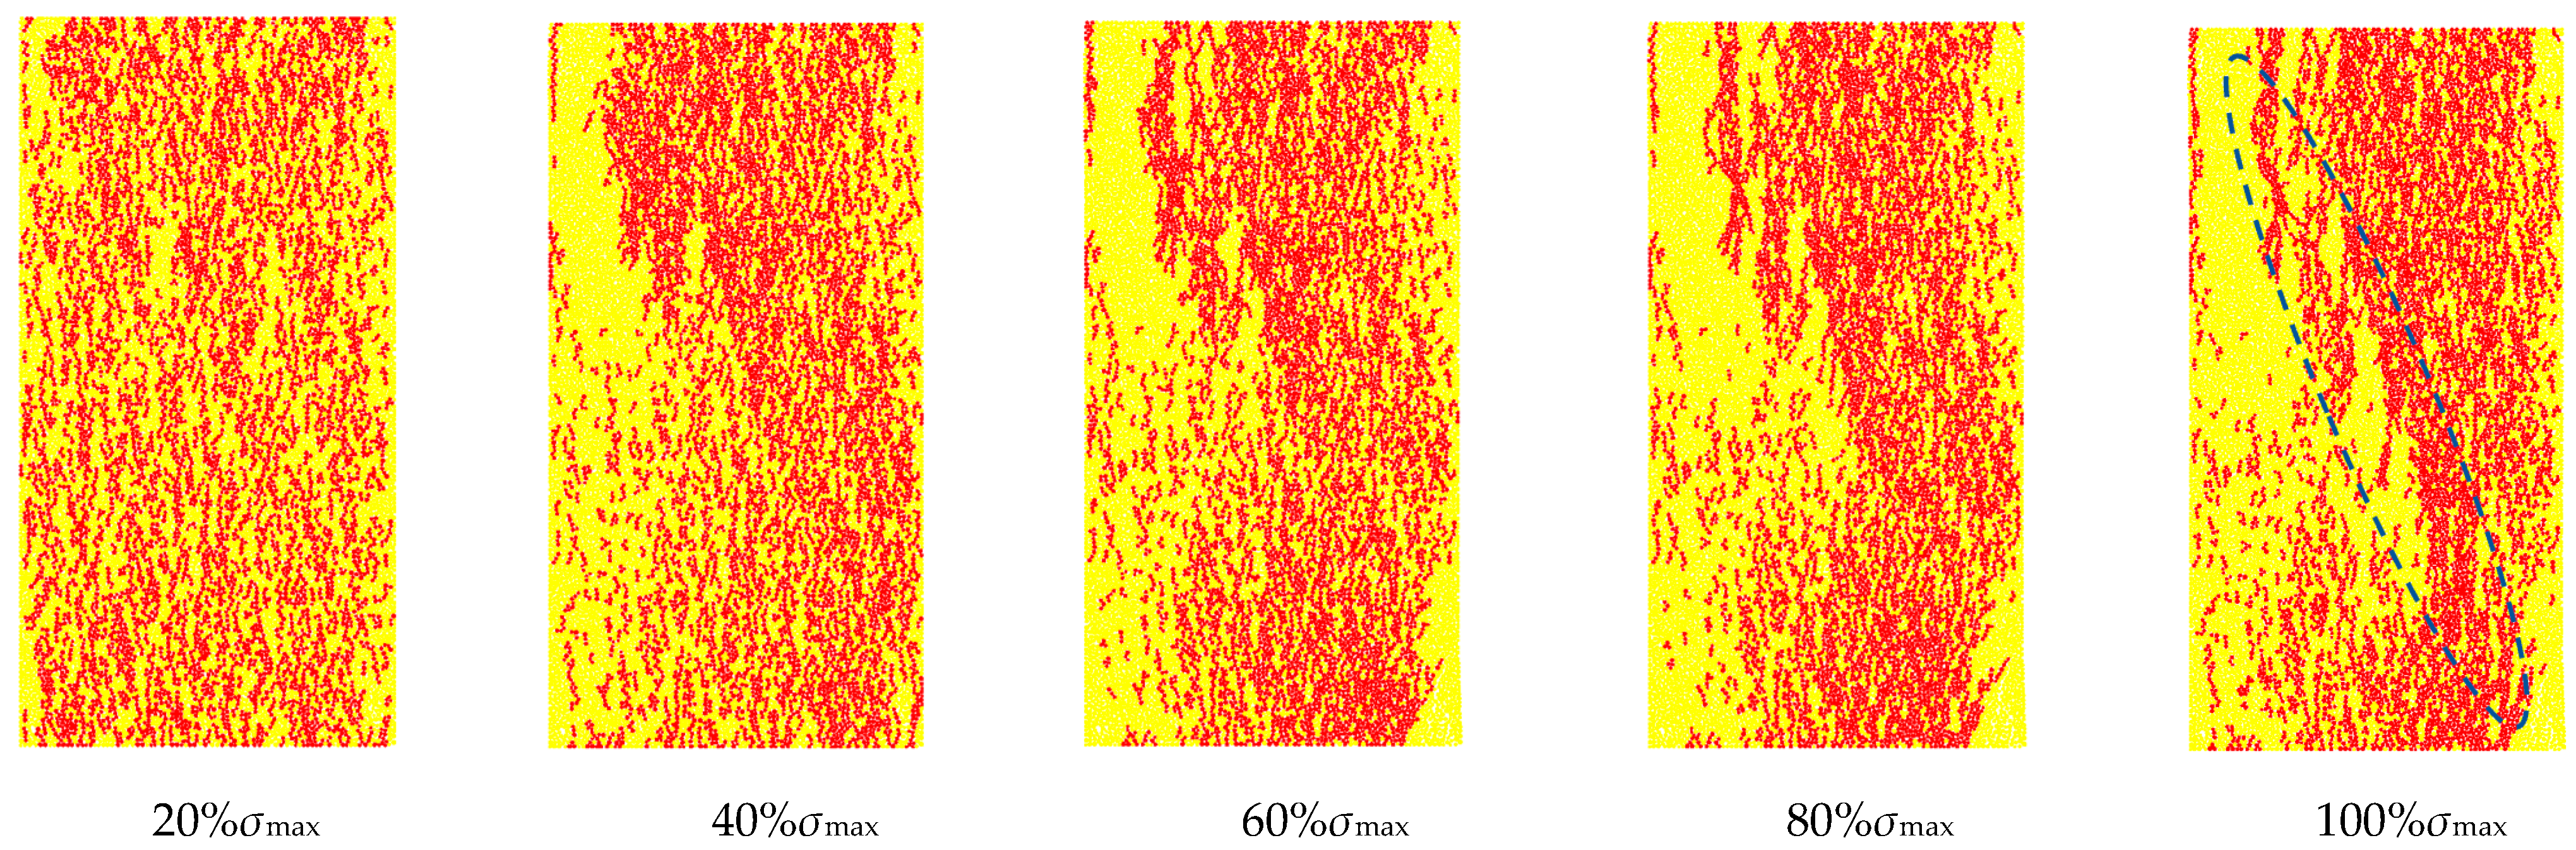
All particles forming the strong force chain are high-stress particles. High-stress particles refer to those with an absolute value of maximum principal stress σ exceeding the average value of all particles, as indicated by the blue particles in Figure 14a. The criterion is expressed in Equation (4);
(3)
The minimum angle between the centerlines of adjacent particles in a single force chain must be less than a specified angle α, as shown by the red particles in Figure 14b. The specific angle varies across different models. Based on previous experience, 45, commonly used in rock models, is adopted here.
σ > 1 n i = 1 n σ i
In the equation, σ denotes the maximum principal stress of particles, and n represents the total number of particles.
Figure 14. Force chain structure formed by contacting particles. (a) Identify high-stress particles. (b) The particles are connected in series to form a force chain.
Processes 13 02358 g014
According to the above definition and extracting the dominant force chains from each stage model, their evolutionary patterns are as shown in Figure 15. Upon initial loading, internal strong force chains immediately aggregate axially. At lower applied stress levels, the strong force chains exhibit relatively uniform distribution within the specimen, with generally shorter individual chain lengths. The predominant orientation of force chains is vertical, though a significant portion also distributes along other directions. As stress increases, the blank area of the strong force chain begins to appear on the upper part of the diagonal of the sample, while the density of the strong force chain significantly intensifies on both sides of these regions. The interconnections between strong force chains form longer dominant chains, a phenomenon that clearly indicates crack propagation in this area. When the stress reaches its peak, a continuous dense strong force chain band appears along the diagonal plane of the specimen. The right adjacent to this band shows densely packed force chains, whereas the left block displays sparse force chain distribution. This demonstrates that the specimen’s load-bearing structure primarily relies on the upper right block during this stage, which aligns with actual observations: after macroscopic failure, stresses transmit through blocks in contact with the loading platen, while the left block is almost unsupported.
Quantitative statistical analysis was performed on these strong force chains. First, the evolution patterns of the strong force chain quantity and length were analyzed. Figure 16 shows the number of strong force chains with different lengths at various loading stages. Analysis of individual loading stage line charts revealed that regardless of the loading stage, the number of strong force chains exhibited an inverse relationship with their length—longer force chains consistently corresponded to fewer quantities, demonstrating an overall negative correlation between force chain quantity and length. Comparing line chart characteristics across different loading stages showed that under lower-stress conditions, shorter force chains were more numerous than those observed at higher stress levels, while longer force chains displayed the opposite trend, with their quantities increasing proportionally to the applied stress.
Through the above analysis, in the initial stage of loading, the stress of the sample is low, the sample is relatively complete, the internal strong chain presents the form of self-organization, and the length is short. As stress increased, partial destabilization occurred in the force chain network within specific regions, triggering the conversion and coalescence of short force chains into longer ones. This pattern became most pronounced at peak stress, where short force chains on both sides of the failure surface were completely transformed into long force chains.
We continue analyzing the evolutionary patterns of strong force chain orientations; documented the contact directions of all strong force chains at each loading stage, using 5° intervals for statistical categorization; quantified the number of contacts falling within each angular interval; and plotted the polar coordinate statistical distribution diagram. The data are fitted according to the method proposed by Rothenburg based on Fourier series expansion [45]. The mathematical expression is:
f ( θ ) = b [ 1 + a cos ( θ γ ) ]
In the formula, f(θ) represents the density distribution of the number of contacts in the direction of [θ−Δθ,θ]; b is the average number of contacts in each angle interval; and a and γ are second-order coefficients and principal directions.
Figure 17 illustrates the directional evolution of strong force chains during loading. In the initial stage, force chains demonstrate omnidirectional distribution, with the fitted curve approximating a peanut shape, indicating relative stability of the force chain network. As stress increases, force chains progressively concentrate along the axial direction. At peak stress, the axial force chains reach maximum density, while horizontal-direction chains nearly vanish, transforming the blue curve into a figure-eight pattern. This pronounced anisotropy in force chain distribution reveals intrinsic characteristics of the force chain network fracture and reorganization.
In addition, it can be seen from the direction distribution diagram at the peak stress that there is an obvious angle between the deflection direction of the force chain and the vertical direction. This angle is the same as the macroscopic crack propagation angle. This law shows that a large number of strong chains are distributed in parallel near the crack zone along the macroscopic crack propagation direction. Before the sample is completely destroyed, the deflection of the strong chain from the axial direction to the macroscopic failure surface may indicate the instability of the internal resistance structure of the sample.

4. Evolution Law of Rock Acoustic Emission Based on Discrete Element Method

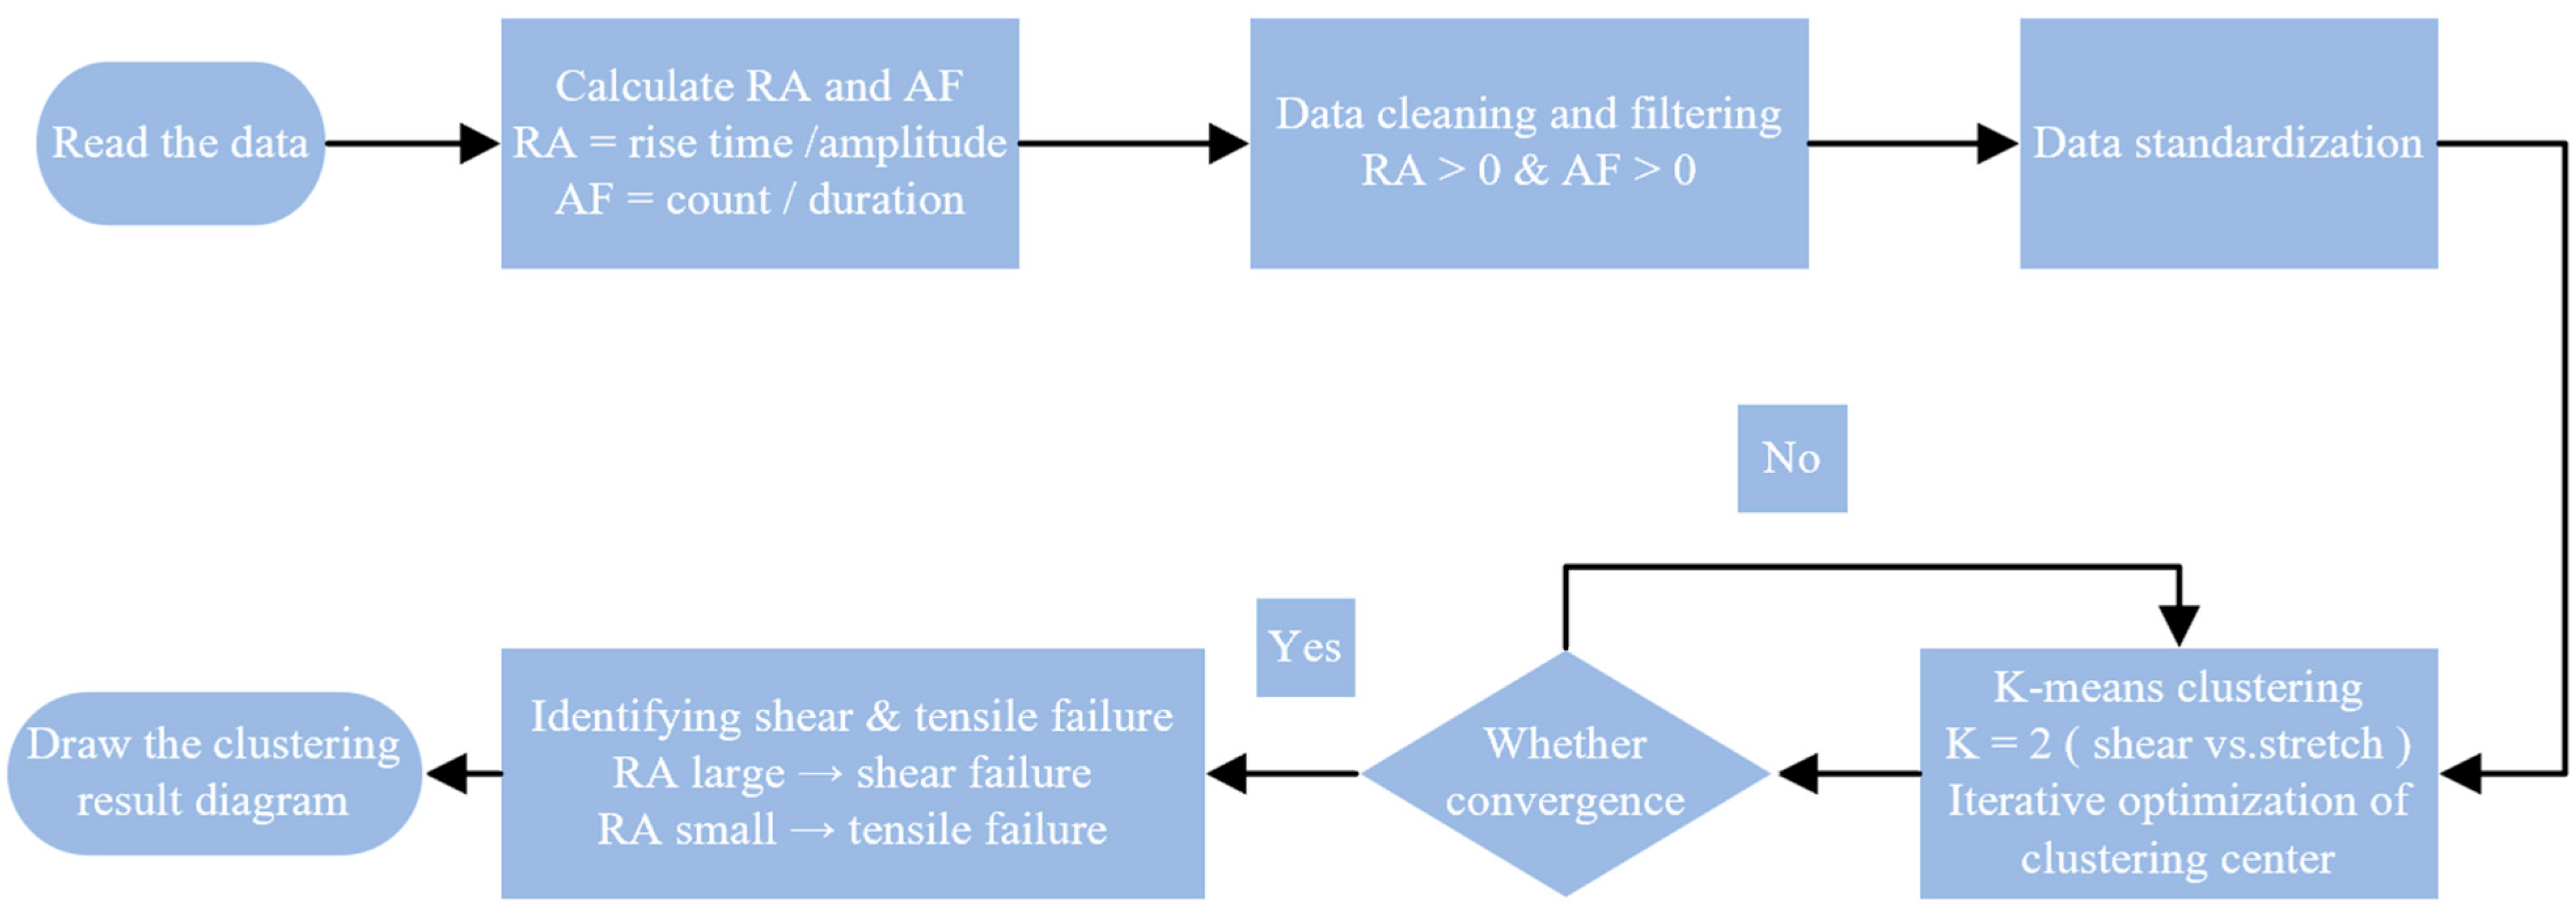
4.1. Introduction of Improved Acoustic Emission Simulation Method

In the discrete element model, the breakage of each bond generates a microcrack. When this occurs, the two particles on either side of the microcrack are displaced, leading to deformation of other contacts around the source particle. The formation of the crack alters the forces at surrounding contact points. An “integration” process is performed over the contacts around the crack to calculate the moment tensor components characterizing the positional and force variations at contacts. For discrete media, this integration corresponds to a vector summation. The moment tensor is therefore computed by multiplying the target contact force by its corresponding moment arm to determine the moment tensor components of contact force variations, as shown in Equation (6):
M i j = s ( Δ F i L j )
In the equation, M i j represents the moment tensor matrix, ΔFi denotes the change in contact force before and after fracture, and Lj indicates the variation in the contact force arm.
By programming to monitor the strain energy change before and after the bond fracture between the source particles, the energy released by the microfracture is recorded as E, which can characterize the energy of the acoustic emission event. The concept of seismic energy magnitude is introduced to quantify the strength of acoustic emission events:
M e = log 10 E 0.44
Among them, Me is the energy magnitude of the acoustic emission event, and E is the strain energy released by the micro-damage contained in the acoustic emission event.
For a two-dimensional model, the moment tensor matrix is a second-order square matrix. By calculating the eigenvalues of the moment tensor matrix denoted as m1 and m2, the trace of the characteristic matrix can be expressed as:
t r ( M i j ) = m 1 + m 2
The trace of the characteristic matrix represents the volume change in the source region. If the seismic source contains an isotropic component, i.e., volume change, then the moment tensor matrix will be decomposed into two parts: isotropic and tensor–shear anisotropy. The concept of the R-value is introduced, as shown in Equation (9).
R = 100 t r ( M i j ) t r ( M i j ) + m
In the equation, m represents the eigenvalue of the shear component.
m = m 1 t r ( M i j ) / 2 + m 2 t r ( M i j ) / 2
The R-value calculated by the ratio of the isotropic and skewed components of the moment tensor can be used to analyze the crack generation mechanism in acoustic emission events and determine the crack type. The R-value ranges from −100 to 100. Previous studies [46] suggest that when R < −30, newly formed cracks are compressive-shear cracks; when R falls between −30 and 30, the cracks are shear dominated; and when R > 30, the cracks are tensile in nature.

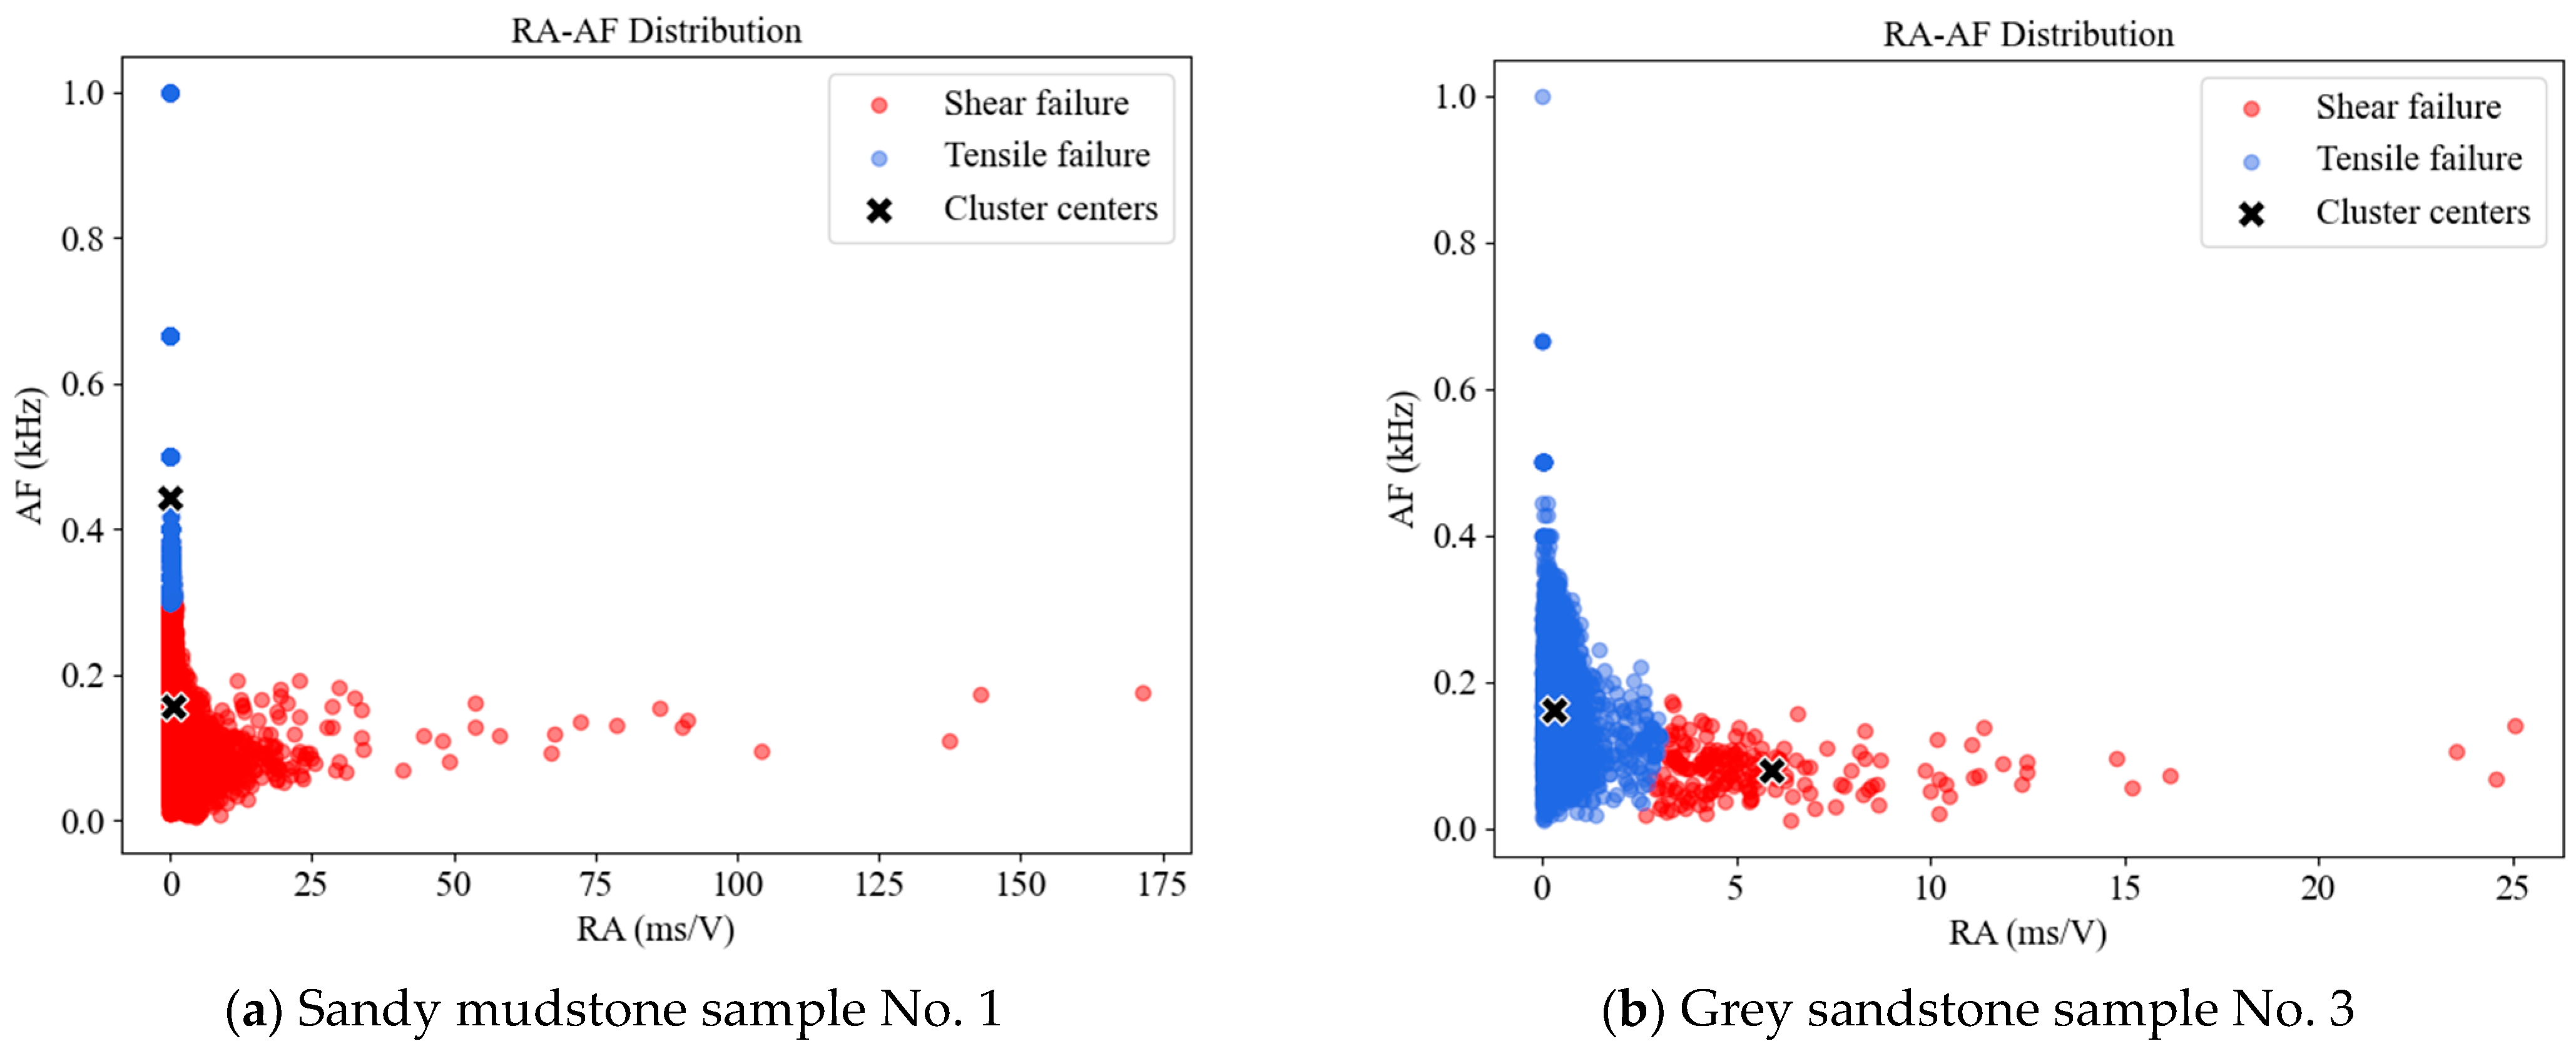
4.2. Statistical Characteristics of Failure Types

The crack types and their spatial distribution calculated based on the R-value are shown in Figure 18, where blue rectangles represent tensile cracks, red triangles denote shear cracks, and green circles indicate compressive-shear cracks.
Figure 18 reveals that under lower stress levels, crack quantities are limited, with irregular distribution patterns. As stress increases, cracks progressively propagate along diagonal directions toward the center, with shear cracks predominantly concentrated along the main fracture. At peak stress, the main fracture completes its propagation to form a continuous band, where shear cracks and mixed-mode compressive-shear cracks are almost exclusively distributed along the primary fracture, while tensile cracks are uniformly dispersed around the shear cracks.
The energy evolution of AE events is shown in Figure 19, where the circle color represents the energy magnitude Me of a single AE event.
From Figure 19, at the beginning of loading, acoustic emission events only have a small amount of distribution in the upper right corner of the sample, and the maximum magnitude is lower. With the deepening of the damage, the acoustic emission events began to extend along the diagonal, and the magnitude gradually increased. At the peak stress, the acoustic emission events are connected to each other to form a complete continuous strip, and the maximum magnitude also reaches the highest level. From the perspective of the whole loading process, the acoustic emission events are basically distributed continuously along the macrocracks. The magnitude of the acoustic emission events on the macrocracks, especially on the diagonal shear main cracks, is obviously at a high level, while the magnitude of the acoustic emission events at other independent failure points is low. No matter which loading stage, the average energy of the acoustic emission of shear failure is much larger than that of tensile failure, and the high-energy events are almost all distributed on the shear failure zone.
Figure 20 illustrates the relationship between acoustic emission events and the stress–strain curve. In Figure 20a, each point represents an acoustic emission event, with the vertical coordinate indicating the R-value of the event. Figure 20b shows the evolution of acoustic emission event counts for different failure types, including tension, shear, and compressive-shear. From Figure 20a, it is evident that the number of acoustic emission events with R-values between −30 and 30 is significantly fewer compared to other intervals. Figure 20b demonstrates that the specimen generated more tensile cracks than shear cracks. Based on the strain corresponding to R-values, shear cracks and tensile cracks were initiated almost simultaneously. During the loading process, acoustic emission events were relatively sparse under low stress. After the first stress drop in Figure 20a, the number of acoustic emission events increased substantially. Around the stress peak, acoustic emission events proliferated. The dense accumulation area of R-value points is formed on the statistical diagram. This indicates active acoustic emission activity and the most rapid progression of damage during this stage.
There is a short blank period of acoustic emission events before the peak stress point, and the yellow area is marked in Figure 20a. Acoustic emission activity was intense both before and after this silent interval yet abruptly ceased immediately prior to peak stress. This phenomenon aligns with the experimental results red-marked regions before peaks in Figure 7 and Figure 8, confirming the existence of an acoustic emission quiescence period preceding rock failure, which can serve as a precursor warning signal.

5. Discussion

Previous scholars have conducted extensive research on the failure characteristics of coal–rock masses. Through technologies such as acoustic emission (AE) monitoring, digital image correlation (DIC), and CT scanning, substantial achievements have been obtained. However, comparative analyses of failure characteristics across different lithologies remain limited, and methods for monitoring internal fracture evolution are relatively simplistic, with most studies focusing on macroscopic failure using single approaches. In Reference [6], abrupt changes in R- and b-values were identified as precursors to macroscopic failure. Reference [15] proposed the TSR parameter, which reflects dynamic proportions of seismic source types through crack classification. A sustained decline in TSR to 61.37% of its peak value was recognized as a precursor to rock failure. Reference [20] identified sharp fluctuations in AE event rates prior to coal rupture as predictive indicators of instability. This study divides AE evolution into sporadic and segmented growth stages, revealing a quiescent AE phase preceding peak stress characterized by stagnant ring-down counts, serving as a precursor to rock mass instability.
Reference [24] quantitatively analyzed the microcrack evolution in sandstones with varying brittleness using discrete element methods. Reference [36] employed DIC and discrete element modeling to investigate crack evolution in fractured rock specimens under uniaxial compression. Integrating AE, DIC, and PFC-based discrete element analysis, this research elucidates meso-mechanical mechanisms of rock deformation and failure, establishes connections between macro- and meso-scale failure processes; deciphers spatiotemporal AE signal patterns and force chain evolution; and identifies critical AE precursor signatures.
Through the combined analysis of multiple research methods, it was found that the crack evolution process in the specimen exhibited strong consistency between experimental and simulation studies. At lower stress levels, the specimen became compacted with uniform internal stress distribution. The strain field and ringing count change slowly, showing no localized stress concentration or damage, while the force chain morphology remained homogeneous and intact. As stress increased, low-strain zones emerged in the strain field images, essentially corresponding to stress concentration regions. As shown in Figure 21c, intense strong force chains densely distributed on both sides of the diagonal principal stress zone, indicating gradual microcrack aggregation in this area that eventually formed macroscopic cracks. Concurrently, the acoustic emission ring-down counts began to increase significantly. During this stage, new crack tips started propagating within the specimen, though at a relatively slow growth rate. The load-bearing structure showed no obvious failure and maintained its external resistance capacity. When stress reached the peak stage, the crack quantity increased dramatically, along with enhanced force chain intensity. The morphology of strong force chains became more distinct, while high-strain zones in the strain field expanded laterally at accelerated rates. Correspondingly, both acoustic emission ring-down counts and energy levels rose substantially. Ultimately, cracks propagated through the specimen surface, as visually captured in the experimental images in Figure 21a. The consistent findings from physical experiments, simulations, and DIC results collectively demonstrate the reliability of the simulation outcomes.
Combined with the change characteristics of the strain field and acoustic emission positioning point in the whole loading process, regardless of the loading stage, the same specimen demonstrates similar evolutionary features in both quantitative parameters, such as AE ring-down counts and the number of spatial coordinate points of AE events and qualitative characteristics including the morphology, location of high-strain zones, and the concentrated zones of AE spatial coordinates.
These observations collectively indicate that variations in AE events are caused by internal damage accumulation and crack development within the specimen. During the initial loading phase, although microscopic damage within the specimen remains visually undetectable, it can be effectively monitored through strain field characteristics. As cracks progressively develop and propagate, the concentrated regions of AE event localization points enable the identification of existing crack morphologies and positions while also allowing for predictive analysis of potential crack propagation directions.

6. Conclusions

This study employs a combined analysis of multiple research methods, utilizing digital image correlation (DIC), acoustic emission (AE) monitoring technology, and particle flow code (PFC) numerical simulation to investigate crack evolution, acoustic emission evolution, and force chain evolution in rocks under uniaxial compression. An improved acoustic emission simulation method was applied to identify precursor acoustic emission signals preceding rock failure. Comparative analysis of failure patterns yielded the following key conclusions:
(1)
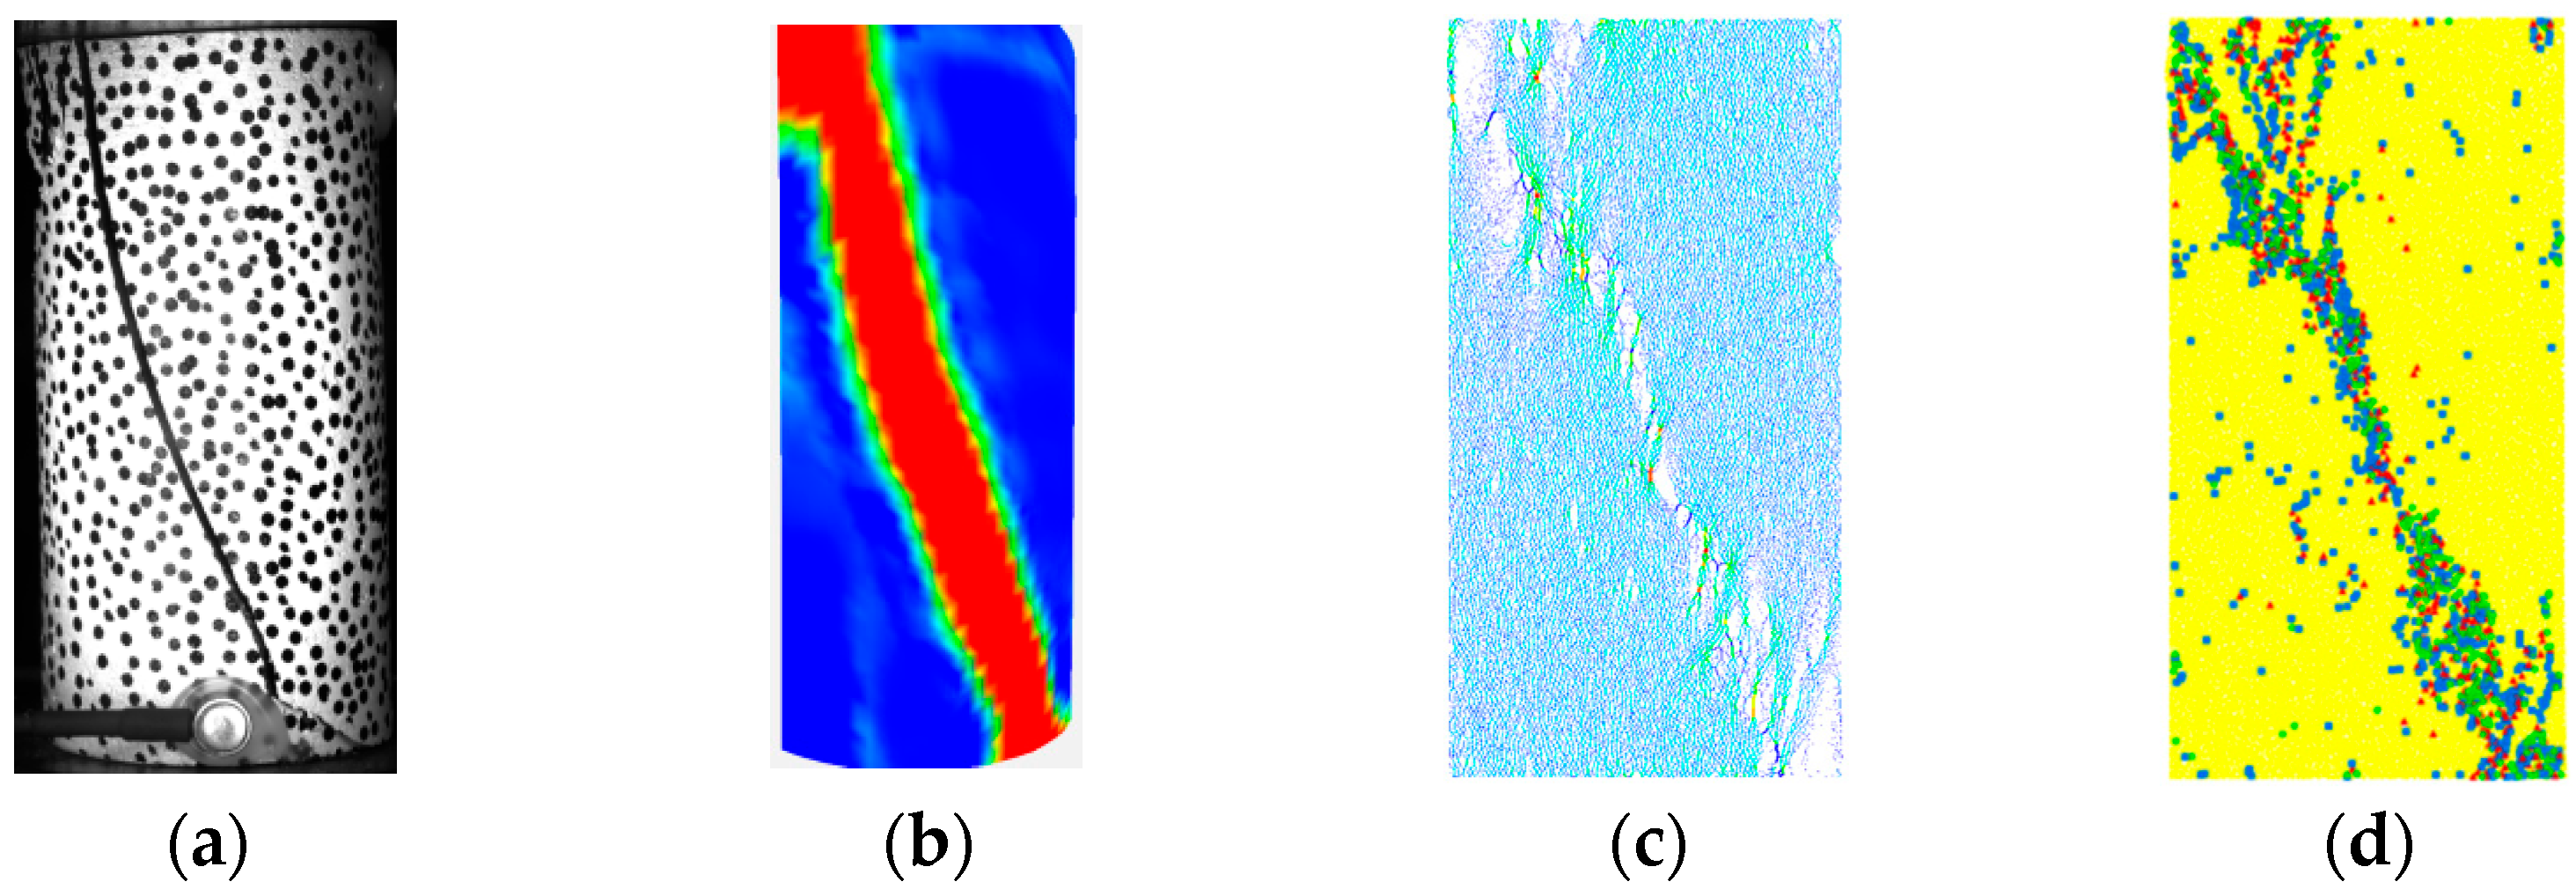
Prior to the formation of macroscopic visible fractures, localized high-strain zones emerge on the specimen surface. The crack tip position exerts a guiding effect on both the strain concentration area and the direction of continuous crack propagation. Under sustained stress loading, cracks propagate along the path predicted by high-strain zones. Eventually, these high-strain zones coalesce to form complete strain bands, indicating the penetration of macroscopic fractures through the specimen and the destruction of the original mechanical structure.
(2)
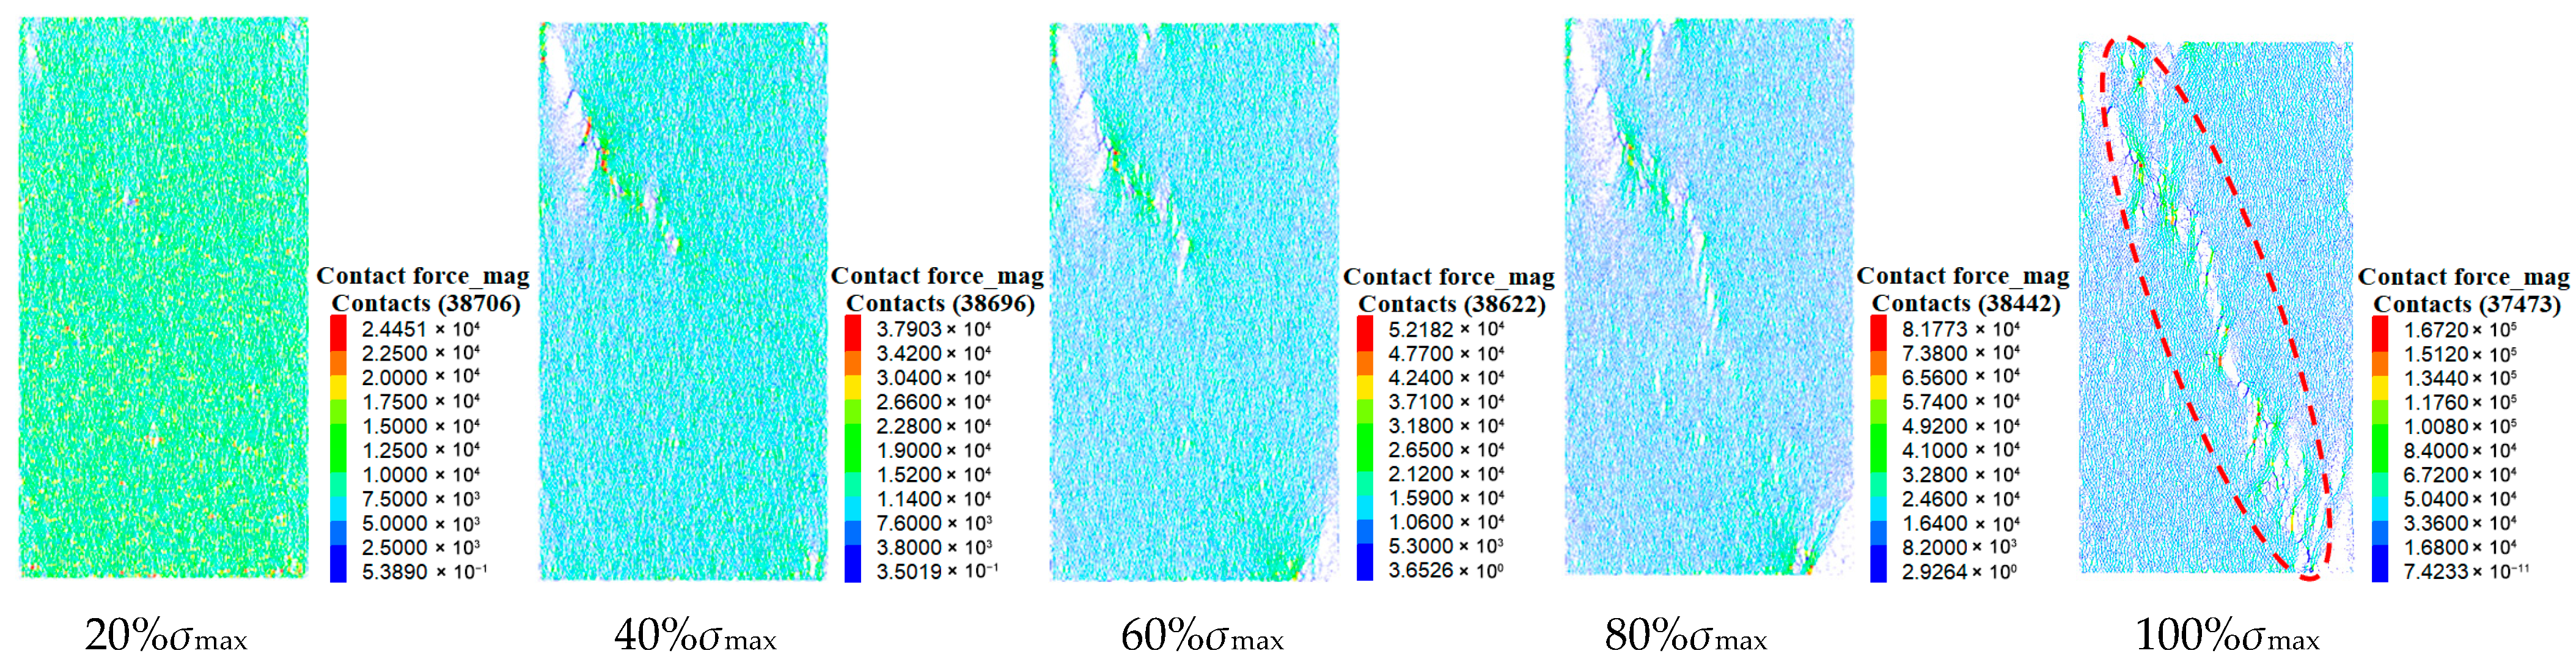
The evolution characteristics of strong force chains exhibit high consistency with the macroscopic stress response of specimens. As stress increases and damage progresses, strong force chains concentrate near macroscopic fracture surfaces, aligning with crack propagation directions. Numerous short force chains transform and combine into longer ones. Locally formed “strong force chain arches” through strong force chain transfer and reorganization gradually interconnect under loading, ultimately forming a complete “strong force chain belt” along the failure surface, signaling impending instability of the force chain system.
(3)
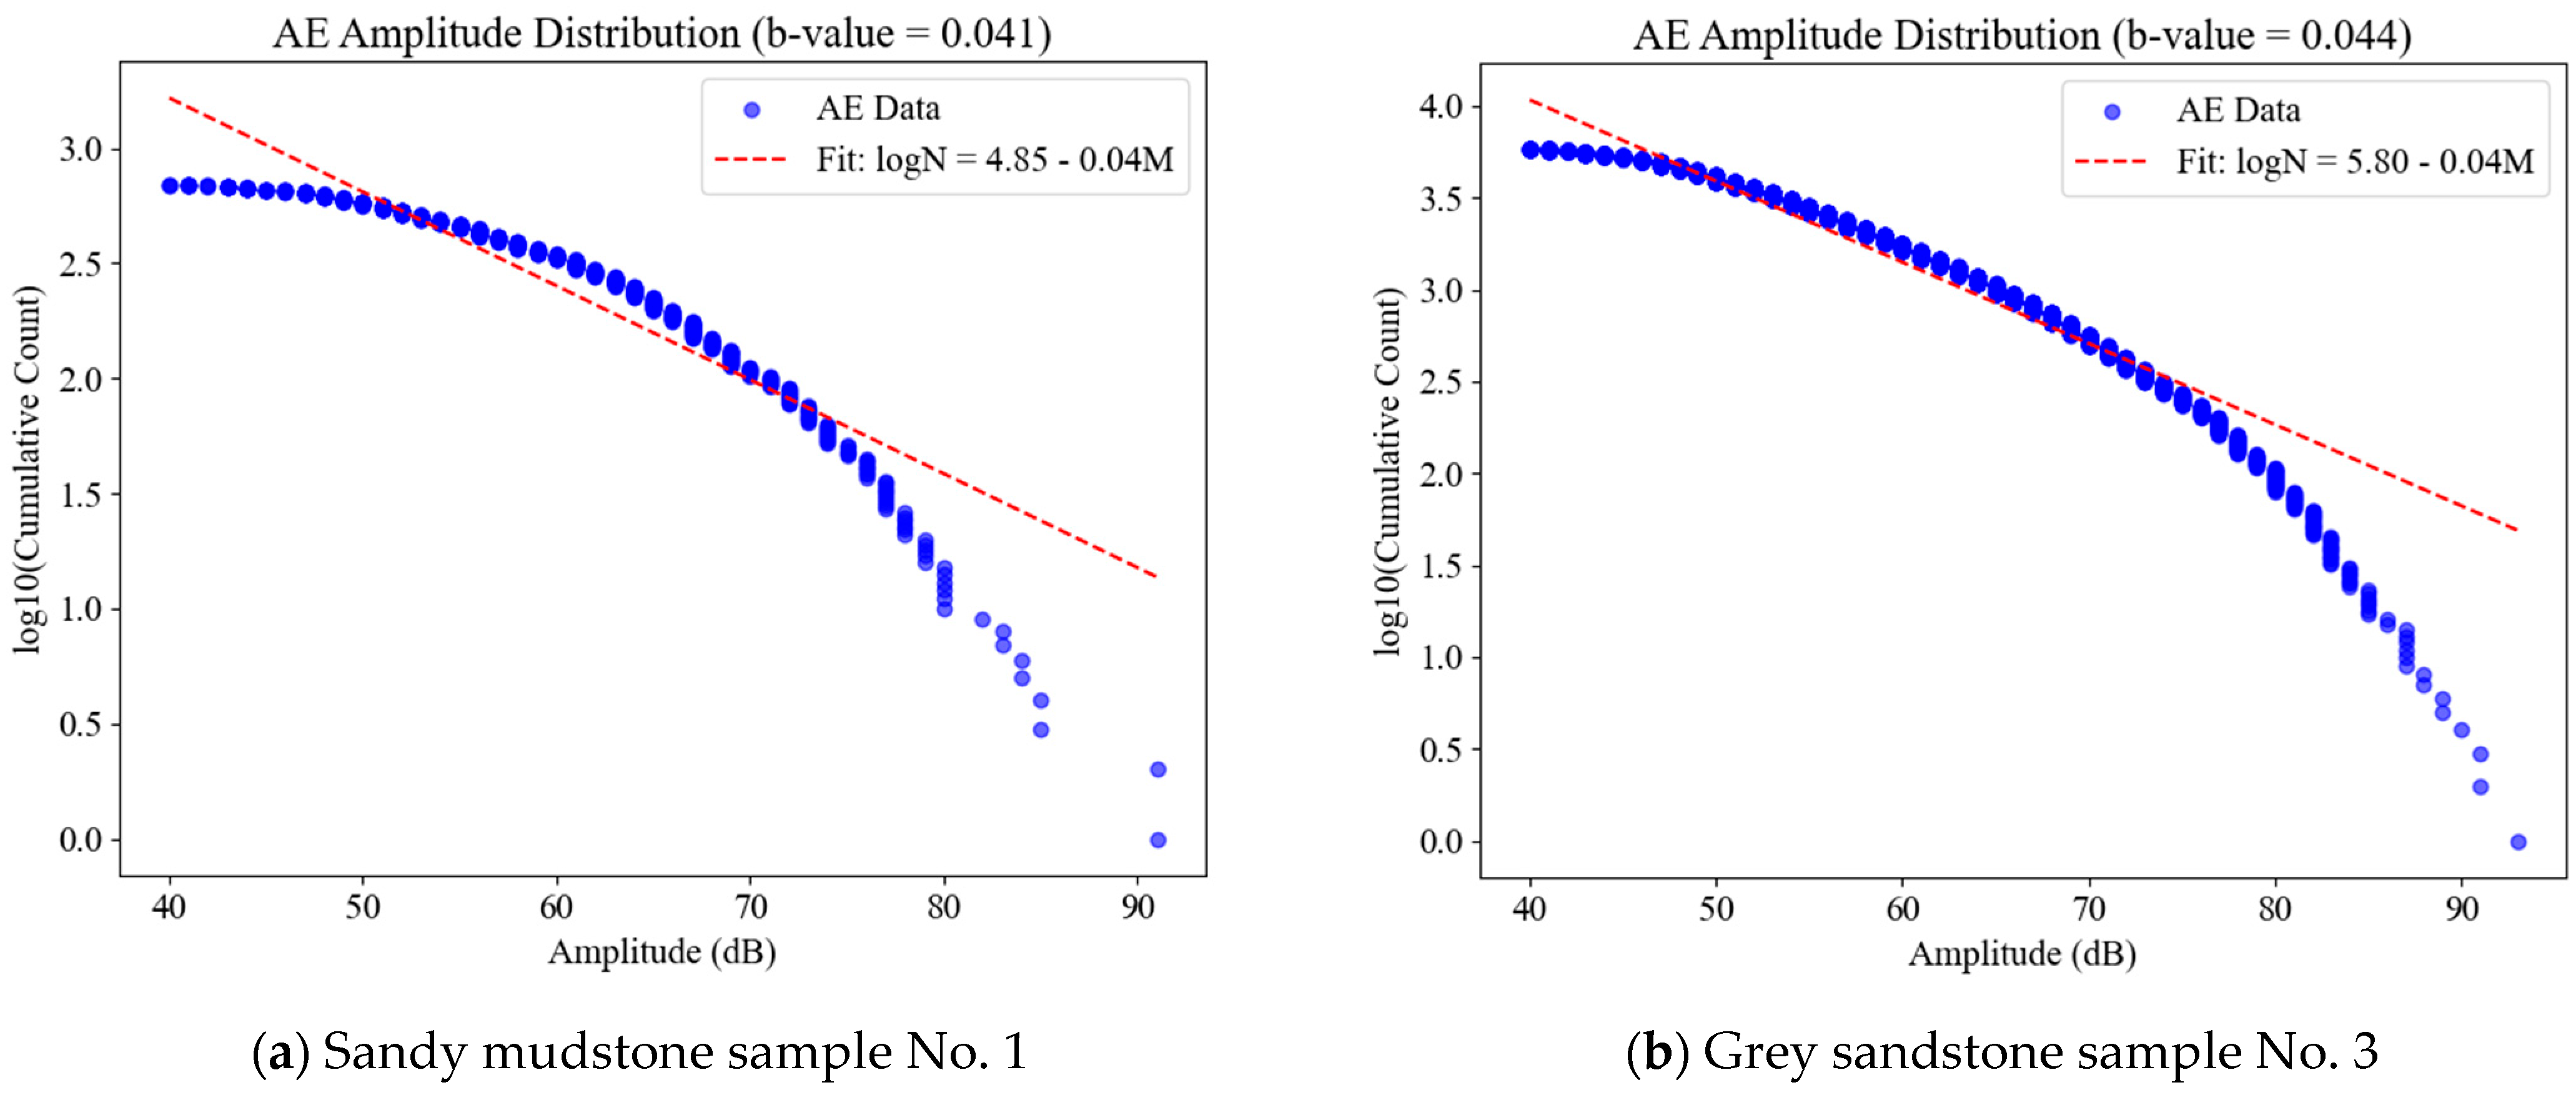
Based on acoustic emission evolution characteristics, the AE process can be divided into multiple stages: sporadic, gradual increase, stepwise growth, and surge. Shear failures predominantly occur near macroscopic failure surfaces, while tensile and tensile–shear failures dominate other regions. Both typical surrounding rock types in deep soft rock roadways exhibit pre-peak acoustic emission quiescence, which can serve as a precursor indicator for catastrophic failure in deep engineering rock masses, providing critical references for engineering early warning systems.
This study conducted laboratory-scale investigations on the meso-failure characteristics of underground engineering rock masses, yet limitations remain due to the authors’ research constraints:
PFC2D simulations are confined to 2D mechanical behaviors under plane stress/strain conditions, failing to capture the complex 3D crack propagation paths in real space. The AE signal may only determine the approximate area of the damage, and the boundary is vague, whereas DIC provides more precise strain distributions with clearer delineations. Both techniques exhibit limitations. AE struggles to detect micro-damage, while DIC may yield errors in complex deformation regions. Sample heterogeneity may lead to fluctuations in experimental results. If there are pores or impurities in the sample, the test results of different samples may be different. Looking forward to the future, the future work should give priority to the failure law of coal and rock mass under real stress, study the three-dimensional model, and combine the experimental results with the actual engineering.
The dynamic disaster of coal and rock is the appearance, and the stress is the essential control factor; that is, the stress is the essence of the dynamic disaster in the deep stope. As the core scientific problem of dynamic disasters in deep stope, aiming at the disaster-causing process of the dynamic evolution of coal and rock mass failure, this paper studies from macro and micro scales, using experiments, theoretical analysis, simulation, and other means to identify the precursory law of failure, explore its breeding mechanism, and reveal its development and evolution process, which is of great significance to the disaster early warning of underground rock mass engineering.

Author Contributions

A.Y. was responsible for the overall framework and research plan of the paper. H.H. and T.L. were responsible for rock mechanics experiments and numerical simulation analysis. H.H. was responsible for organizing and analyzing experimental data. All authors have read and agreed to the published version of the manuscript.

Funding

This work was supported by the National Natural Science Foundation of China (nos. 52104073) and the Open Fund of State Key Laboratory of Water Resource Protection and Utilization in Coal Mining (no. NICE_RD_2023_144).

Data Availability Statement

All data reported in this paper will be shared by the lead contact upon request. Any additional information related to this paper can be provided by the main contact upon request. If anyone wants to request data from this study, they can directly contact Yuan Anying (Email: ayyuan@aust.edu.cn). Further information can be requested via the lead contact, Tang Li (2024202164@aust.edu.cn).

Conflicts of Interest

The authors declare no conflicts of interest or personal relationships that could have influenced the research presented in this paper.

References

  1. Tang, K.J.; Liu, D.D.; Xie, S.; Qiu, J.; Lai, J.; Liu, T.; Fang, Y. Analysis of loess water migration regularity and failure response of tunnel structure under rainfall environment. Bull. Eng. Geol. Environ. 2024, 83, 251. [Google Scholar] [CrossRef]
  2. Qian, X.Y.; Qiu, J.L.; Lai, J.; Liu, Y. Guarantee Rate Statistics and Product-Moment Correlation Analysis of the Optimal Deformation Allowance for Loess Tunnel in China. Appl. Sci. 2025, 15, 2451. [Google Scholar] [CrossRef]
  3. Qiu, J.L.; Liu, D.D.; Zhao, K.; Lai, J.; Wang, X.; Wang, Z.; Liu, T. Influence spatial behavior of surface cracks and prospects for prevention methods in shallow loess tunnels in China. Tunn. Undergr. Space Technol. 2024, 143, 105453. [Google Scholar] [CrossRef]
  4. Ali, H.A.; Zainab, M.; Sakhiah, K.A. Deformation behaviour, crack initiation and crack damage of weathered composite sandstone-shale by using the ultrasonic wave and the acoustic emission under uniaxial compressive stress. Int. J. Rock Mech. Min. Sci. 2023, 170, 105497. [Google Scholar] [CrossRef]
  5. Eidivandi, E.; Nikkhah, M. Acoustic emission analysis of limestone damage evolution using combined parametric and frequency methods under uniaxial compression. Measurement 2025, 247, 116768. [Google Scholar] [CrossRef]
  6. Zhao, K.; Shi, Y.C.; Yan, Y.; Ma, C.; Liu, Y.; Nie, Q. Acoustic emission response precursor characterization of cemented tailings backfill at different loading rates. Constr. Build. Mater. 2025, 473, 141027. [Google Scholar] [CrossRef]
  7. Liu, L.W.; Li, H.B.; Zhang, G.; Fu, S.; Li, X. Investigation on Rate Dependency of Acoustic Emission Behaviours of Sandstone Under Quasi-dynamic Uniaxial Compression. Rock Mech. Rock Eng. 2025, 1–14. [Google Scholar] [CrossRef]
  8. Wang, Y.W.; Zhao, Z.Q.; Hui, Z.; Hao, J.; Zhang, J. Mechanical responses of bedding coals under uniaxial compression: Insights from deformation, energy and acoustic emission characteristics. Case Stud. Constr. Mater. 2025, 22, e04404. [Google Scholar] [CrossRef]
  9. Shan, T.C.; Li, Z.H.; Zhang, X.; Wang, X.; Jia, H.; Wang, E.; Zhang, Q.; Niu, Y.; Wang, D. Superstatistical approach of electric potential and acoustic emission for investigating damage evolution and precursor of water-bearing sandstone under uniaxial compression. Int. J. Rock Mech. Min. Sci. 2025, 189, 106063. [Google Scholar] [CrossRef]
  10. Li, S.N.; Zhang, J.H.; Jin, C.; Yang, H.; Shao, Y.; Peng, J.; Chen, K.; Yu, L.; Ren, Z.; Chen, W. Quantitative calculation of the damage of carbonaceous mudstone during uniaxial compressive failure process under dry–wet cycling. Bull. Eng. Geol. Environ. 2025, 84, 190. [Google Scholar] [CrossRef]
  11. Liu, C.Y.; Zhao, G.M.; Chen, P.; Meng, X.; Xu, W. Experimental Study of Rock Failure and Fractal Characteristics Under True Triaxial Unloading. Fractal Fract. 2025, 9, 182. [Google Scholar] [CrossRef]
  12. Cyrille, C.; Pierre, B. A true triaxial experimental study on porous Vosges sandstone: From strain localization precursors to failure using full-field measurements. Int. J. Rock Mech. Min. Sci. 2022, 153, 105136. [Google Scholar] [CrossRef]
  13. Gautam, P.; Dwivedi, R.; Garg, P.; Majumder, D.; Agarwal, S.; McSaveney, M.; Singh, T. Evolution of the damage precursor based on the felicity effect in shale. Int. J. Damage Mech. 2025, 34, 116–139. [Google Scholar] [CrossRef]
  14. Zhang, C.R.; Ji, H.G.; Fu, Z.; Zhang, Y. Analysis of fracture characteristics and energy evolution of tectonic coal after loading based on acoustic emission. Measurement 2025, 252, 117388. [Google Scholar] [CrossRef]
  15. Zhang, G.N.; Yu, Y.J.; Zhang, W. Experimental investigation of the acoustic emission and energy evolution of bedded coal under uniaxial compression. Sci. Rep. 2025, 15, 12578. [Google Scholar] [CrossRef] [PubMed]
  16. Barkat, U.; Zhou, Z.L.; Cai, X.; Lu, J.; Tang, S.; Wang, Z. Effect of freezing and thawing process on fracturing mechanism and acoustic emission characteristics of notched semi-circular bend specimens of red sandstone. Theor. Appl. Fract. Mech. 2024, 129, 104238. [Google Scholar] [CrossRef]
  17. Mahesh, P.; Chinthapenta, V.; Raju, G.; Ramji, M. Experimental investigation on open-hole CFRP laminate under combined loading using acoustic emission and digital image correlation. Theor. Appl. Fract. Mech. 2024, 130, 104300. [Google Scholar] [CrossRef]
  18. Li, J.K.; Liu, Z.; Liu, Y.; Zhang, Z.; Xu, C. Effects of axial load on torsional fatigue of 3D braided carbon fiber composites: Mechanisms and life prediction. Compos. Part B 2025, 305, 112732. [Google Scholar] [CrossRef]
  19. Luo, H.A.; Li, J.B.; Tian, W.; Wang, Y.; Ye, J.; Chen, X.; Zheng, K.; Pan, F. Insights on enhanced mechanical properties of TC4/VK20 magnesium matrix composites sheet via low-temperature asymmetric extrusion. Mater. Sci. Eng. A 2025, 942, 148646. [Google Scholar] [CrossRef]
  20. Gong, J.; He, M.K.; Zhang, J.; Liang, W.; Wang, S. Dynamic impact mechanical properties of red sandstone based on digital image correlation method. Int. J. Mining Reclam. Environ. 2024, 38, 1–16. [Google Scholar] [CrossRef]
  21. Wei, L.L.; Zheng, Y.; Tian, J.; Wu, X.; Shen, H.; Zhu, J. Investigation into the fracture mechanical performance of strain hardening cementitious composites hybridized with polyethylene and carbon fiber using digital image correlation (DIC) technique. Structures 2025, 78, 109339. [Google Scholar] [CrossRef]
  22. Koohbor, B.; Hazaveh, Z.; Doitrand, A.; Girard, H. Fiber–matrix interface debonding and transverse cracking in macro fiber composites. Eng. Fract. Mech. 2025, 325, 111345. [Google Scholar] [CrossRef]
  23. Subramani, A.; Maimí, P.; Cugnoni, J.; Amacher, R.; Costa, J. Notch nonlinearities in pseudo-ductile composite laminates: A novel LE/HE sublaminate design. Compos. Sci. Technol. 2025, 270, 111250. [Google Scholar] [CrossRef]
  24. Mehran, N.; Gholamreza, K.; Vahab, S.; Behrouz, R.; Reza, H.N.; Wulf, S. Experimental test and numerical simulation of the effect of brittleness on the microfracturing of sandstone. Bull. Eng. Geol. Environ. 2022, 81, 309. [Google Scholar] [CrossRef]
  25. Xu, R.C.; Zhao, Y.; Dou, B.; Hou, R.; Li, Z.; Dong, J. Experimental investigation of the effect of strain rate on the cracking behaviour and acoustic emission characteristics of red sandstone containing orthogonal cross flaws under quasistatic uniaxial compression. Eng. Fail. Anal. 2025, 170, 109323. [Google Scholar] [CrossRef]
  26. Song, Y.Z.; Zhao, Y.; Dang, G.W.; Zhang, M. Mechanical Responses of Sandstone Exposed to Triaxial Differential Cyclic Loading with Distinct Unloading Rates of Confining Stress: A Particle-Based Numerical Investigation. Rock Mech. Rock Eng. 2025, 58, 1–26. [Google Scholar] [CrossRef]
  27. Zhou, J.; Zhang, L.; Peng, X.; Liu, H.; Jiang, R.; Zhang, L.; Wang, S. Numerical study of voids geometry effects on sandstone’s mesoscopic fracture Mechanism: Insights from acoustic emission and moment tensor inversion. Theor. Appl. Fract. Mech. 2024, 133, 104588. [Google Scholar] [CrossRef]
  28. Jing, W.; Cao, Z.H.; Jing, L.; Jin, R.; Rong, C. Crack Initiation and Propagation Mechanism of Flawed Rock Mass Based on Improved Maximum Distortion Energy Theory and PFC Numerical Simulation. J. Fail. Anal. Prev. 2024, 24, 1799–1813. [Google Scholar] [CrossRef]
  29. Nitka, M.; Rucka, M. 3D DEM modelling of acoustic emission in concrete: Insights into elastic waves initiated by microcracks. Ultrasonics 2025, 150, 107599. [Google Scholar] [CrossRef] [PubMed]
  30. Zhou, L.; Sarfarazi, V.; Haeri, H.; Shahbazian, A.; Far, A.; Marji, M. Rock joint filling breakage under three different instant loading conditions; physical test and PFC simulation. Comput. Part. Mech. 2024, 12, 1–22. [Google Scholar] [CrossRef]
  31. Lotidis, M.A.; Nomikos, P.P.; Sofianos, A. Experimental and Numerical Investigation of the Fracturing Process of Marble Plates with a Pair of Twin Cylindrical Holes Subjected to Uniaxial Compression. Geotech. Geol. Eng. 2024, 42, 4173–4190. [Google Scholar] [CrossRef]
  32. Liu, X.W.; Meng, Y.Y.; Jing, H.; Liu, W.; Wan, C.; Cao, Y.; Yin, Q. Effects of bedding plane properties on mechanical, acoustic emission and micro failure characteristics of bedded rock mass. Bull. Eng. Geol. Environ. 2024, 83, 191. [Google Scholar] [CrossRef]
  33. Li, X.C.; Li, Y.; Yang, C.; Zhang, L.; Li, Z.; Huang, T. Acoustic emission response characteristics and numerical simulation of soil failure under uniaxial compression. J. Appl. Geophys. 2024, 222, 105310. [Google Scholar] [CrossRef]
  34. Li, X.; Wang, X.Q.; Wang, K.; Diao, H.; Zhang, H. Damage Evolution of Rocks Containing a Set of Cross-Joints Based on Acoustic Emission Characteristics. Adv. Mater. Sci. Eng. 2022, 2022, 4120287. [Google Scholar] [CrossRef]
  35. Cheng, G.Q.; Sun, X.H.; Li, J. Study on the Precursors of Coal-Rock Fracture Based on the Maximum Lyapunov Exponent of Acoustic Emission Parameters. Geofluids 2022, 2022, 3280185. [Google Scholar] [CrossRef]
  36. Zhang, H.D.; Zhou, L.; Nie, F.; Qi, J.; Hua, J.; Liu, B. Experimental and numerical research on crack extension behavior of multi-cracked rock based on discrete element method. Theor. Appl. Fract. Mech. 2025, 138, 104944. [Google Scholar] [CrossRef]
  37. Yang, Y.S.; Peng, J.C.; Cui, Z.; Yan, L.; Kang, Z. Mechanical Properties of Marble Under Triaxial and Cyclic Loading Based on Discrete Elements. Appl. Sci. 2025, 15, 3576. [Google Scholar] [CrossRef]
  38. Zhang, J.W.; Zhang, Y.; Wang, S.; Xing, C.; Dong, X.; Wu, S.; Song, Z.; Zhou, Y. Study of the mechanical response and numerical simulation of uniaxial compression of coal based on size effect. Int. J. Press. Vessel. Piping 2025, 215, 105463. [Google Scholar] [CrossRef]
  39. Ma, Y. Discrete modeling of acoustic emission and fracture process zone in quasi-brittle rocks. Comput. Part. Mech. 2025, prepublish, 1–15. [Google Scholar] [CrossRef]
  40. GB/T23561.7-2009; Method for Determination of physical and mechanical properties of coal and rock. China Standards Press: Beijing, China, 2009.
  41. He, M.C. The future of rock mechanics lies with China: Inaugural editorial for Rock Mechanics Bulletin. Rock Mech. Bull. 2022, 1, 100010. [Google Scholar] [CrossRef]
  42. Macqueen, J. Some methods for classification and analysis of multivariate observations. In Proceedings of the Fifth Berkeley Symposium on Mathematical Statistics and Probability, Berkeley, CA, USA, 21 June–18 July 1965 and 27 December 1965–7 January 1966. [Google Scholar]
  43. Jain, A.K.; Dubes, R.C. Algorithms for Clustering Data; Prentice Hall: Saddle River, NJ, USA, 1988. [Google Scholar] [CrossRef]
  44. Gutenberg, B.; Richter, C.F. Frequency of earthquakes in California. Bull. Seismol. Soc. Am. 1944, 34, 185–188. [Google Scholar] [CrossRef]
  45. Rothenburg, L.; Bathurst, R. Analytical study of induced anisotropy in idealized granular materials. Geotechnique 1989, 39, 601–614. [Google Scholar] [CrossRef]
  46. Feignier, B.; Young, R.P. Moment tensor inversion of induced microseisnmic events: Evidence of non-shear failures in the −4 < M < −2 moment magnitude range. Geophys. Res. Lett. 1992, 19, 1503–1506. [Google Scholar] [CrossRef]
Figure 1. Rock samples for testing.
Processes 13 02358 g001
Figure 2. Test system.
Processes 13 02358 g002
Figure 3. Probe distribution of acoustic emission sensor.
Processes 13 02358 g003
Figure 4. Stress–strain curves of two lithological sandstones.
Processes 13 02358 g004
Figure 5. Surface strain field evolution of SN-1.
Processes 13 02358 g005
Figure 6. Surface strain field evolution of S-3.
Processes 13 02358 g006
Figure 7. The acoustic emission ringing count of SN-1 evolves with stress.
Processes 13 02358 g007
Figure 8. The acoustic emission ringing count of S-3 evolves with stress.
Processes 13 02358 g008
Figure 9. Clustering analysis process for shear–tensile failure types.
Processes 13 02358 g009
Figure 10. RA-AF scatter plot clustering distribution of two lithological specimens.
Processes 13 02358 g010
Figure 11. Acoustic emission b-value fitting results of two lithological specimens.
Processes 13 02358 g011
Figure 12. Numerical model of sandstone under uniaxial compression loading.
Processes 13 02358 g012
Figure 13. Characteristics of force chains under different stresses.
Processes 13 02358 g013
Figure 15. Evolution characteristics of strong chain under different stresses.
Processes 13 02358 g015
Figure 16. Quantity distribution of force chains with different lengths.
Processes 13 02358 g016
Figure 17. Distribution of contact direction quantity under different stresses.
Processes 13 02358 g017
Figure 18. Acoustic emission spatial location and event types under different stresses.
Processes 13 02358 g018
Figure 19. Energy evolution of acoustic emission events under different stresses.
Processes 13 02358 g019
Figure 20. Variations of different acoustic emission event types with stress–strain. (a) R-value evolution of acoustic emission events. (b) The number evolution of acoustic emission events of different failure types.
Processes 13 02358 g020
Figure 21. Specimen failure mode. (a) Real shot; (b) strain field; (c) force chain; (d) acoustic emission simulation.
Processes 13 02358 g021
Table 1. The analysis results of shear–tensile failure ratio and b-value of two lithological samples.
Proportion of Stretching Events/%Proportion of Shear Events/%b-Value
SN-126.473.60.041
SN-259.640.40.046
SN-343.756.30.045
S-184.715.30.062
S-286.313.70.065
S-389.910.10.044
Table 2. Model microscopic parameters.
Mesoscopic ParametersNumerical Value
Least radius/mm0.24
Particle size ratio1.66
Volume density/(kg·m−3)2600
Particle modulus/GPa1.6
Stiffness ratio of particle1.1
Friction factor0.4
Tensile strength between bonding/MPa21
Shear strength between bond/MPa28
Parallel bond modulus/GPa2.5
Parallel bond stiffness ratio3.4
Table 3. Simulation comparison of particle size effect.
Mesoscopic Parameters12345
Least Radius/mm0.160.20.240.280.32
Peak Strain (%)0.880.930.940.890.95
Peak Stress/Mpa14.815.11515.415.3
Disclaimer/Publisher’s Note: The statements, opinions and data contained in all publications are solely those of the individual author(s) and contributor(s) and not of MDPI and/or the editor(s). MDPI and/or the editor(s) disclaim responsibility for any injury to people or property resulting from any ideas, methods, instructions or products referred to in the content.

