Article

Experimental Study on Damage Characteristics and Microcrack Development of Coal Samples with Different Water Erosion Under Uniaxial Compression

1
Banji Coalmine, China Coal Xinji Energy Co., Ltd., Bozhou 232001, China
2
School of Mines, China University of Mining and Technology, Xuzhou 221116, China
3
Key Laboratory of Deep Coal Resource Mining (CUMT), Ministry of Education, Xuzhou 100013, China
*
Author to whom correspondence should be addressed.
Processes 2025, 13(7), 2196; https://doi.org/10.3390/pr13072196
Submission received: 25 May 2025 / Revised: 30 June 2025 / Accepted: 7 July 2025 / Published: 9 July 2025

Abstract

It is vital to stabilize pillar dams in underground reservoirs in coal mine goafs to protect groundwater resources and quarry safety, practice green mining, and protect the ecological environment. Considering the actual occurrence of coal pillar dams in underground reservoirs, acoustic emission (AE) mechanical tests were performed on dry, naturally absorbed, and soaked coal samples. According to the mechanical analysis, Quantitative analysis revealed that dry samples exhibited the highest mechanical parameters (peak strength: 12.3 ± 0.8 MPa; elastic modulus: 1.45 ± 0.12 GPa), followed by natural absorption (peak strength: 9.7 ± 0.6 MPa; elastic modulus: 1.02 ± 0.09 GPa), and soaked absorption showed the lowest values (peak strength: 7.2 ± 0.5 MPa; elastic modulus: 0.78 ± 0.07 GPa). The rate of mechanical deterioration increased by ~25% per 1% increase in moisture content. It was identified that the internal crack development presented a macrofracture surface initiating at the sample center and expanding radially outward, and gradually expanding to the edges by adopting AE seismic source localization and the K-means clustering algorithm. Soaked absorption was easier to produce shear cracks than natural absorption, and a higher water content increased the likelihood. The b-value of the AE damage evaluation index based on crack development was negatively correlated with the rock damage state, and the S-value was positively correlated, and both effectively characterized it. The research results can offer reference and guidance for the support design, monitoring, and warning of coal pillar dams in underground reservoirs. (The samples were tested under two moisture conditions: (1) ‘Soaked absorption’—samples fully saturated by immersion in water for 24 h, and (2) ‘Natural absorption’—samples equilibrated at 50% relative humidity and 25 °C for 7 days).

1. Introduction

Coal resources, as the primary energy source in the current energy consumption structure of China, have always been the focus of research by experts at home and abroad to secure their safety and stability during mining and sustainable development of the eco-environment in mined areas [1]. After mining, the overburden collapses, the aquifer is destroyed, and the groundwater vertically flows into the goaf, forming a place where the groundwater source is gathered with the boundary and section coal pillars as the dam [2,3]. Groundwater resources are gathered in the goaf, with periodic fluctuations in water levels, exerting long-term water erosion on coal pillars. According to previous studies, water weakens the physical and mechanical attributes of coal rock masses, reduces their bearing strength, and makes them easier to deform and destabilize [4,5,6]. When coal pillars collapse under water erosion, a large amount of groundwater gushes into the quarry, wasting water resources and seriously threatening the safe production of the quarry [7,8].
Currently, the comprehension of the damage mechanisms in coal rock under water erosion mainly includes two aspects: (1) water dissolves clay minerals within the coal rock mass [9,10], and (2) chemical reaction occurs between the water solution and the mineral components within the coal rock mass, leading to a loss of mineral components [11,12]. Under physical and chemical reactions, the coal rock mass undergoes different degrees of initial damage, resulting in the coal (rock) pillar dam body being more easily damaged and destroyed under mining stress, which affects the roadway surrounding rock stability. Combined with the field investigation of the interaction between the water source and the dam body of coal (rock) pillars in mid-western China, it was found that the fluctuation of reservoir water levels can lead to a dry and wet cycling erosion effect on the coal (rock) pillar dam body, and that variations in damage and rupture features exist in coal (rock) pillars in areas with different moisture content and soaking time. Water sources in goafs in different mining areas may be acidic or alkaline, causing chemical erosion of the dam body. Based on this, experts and scholars from home and abroad have conducted substantial targeted studies.
In a study of coal rock damage induced by dry and wet cycling, it was demonstrated through numerous laboratory tests that as the number of dry and wet cycles increases, the physical and mechanical performance of the rock gradually deteriorates, accelerating the damage process of rocks under external forces [13,14,15,16]. On this basis, Khanlari and Abdilor [17] demonstrated that the cementation of saturated coal rock samples deteriorates and produces a large number of secondary cracks after undergoing dry and wet cycling based on laboratory tests and electron microscopy. Zhang, Jiang, and Yang [18] carried out a shear creep test on granite specimens under dry and wet cycling to determine their performance deterioration and creep characteristic changes under hydraulic weathering conditions, and proposed a creep damage model with varying parameters taking into account dry and wet cycling effects on granite creep damage. In addition, using scanning electron microscopy (SEM) and CT technology, it was found that multiple dry and wet cycles led to the exfoliation of particles on the rock surface and promoted the continuous development and penetration of cracks [19,20], further revealing the rock damage and rupture mechanism.
Regarding the study on the effect of moisture content on the mechanical attributes of coal rock masses, Tianjun Zhang et al. [21] studied the wave velocity and power spectral density characteristics of pore-bearing samples under varying moisture contents and found that the wave velocity decay can be classified into steady, slight decline, and rapid decline phases during damage. Tian Chen et al. [22] investigated the loading rate affecting the mechanical performance and fracture extension of coal rock assemblage under varying moisture content. They clarified that the mechanical attributes deteriorate faster, and the macrocracks show a complex penetration pattern with a higher moisture content under a high loading rate. Based on AE monitoring, SEM, and CT scanning, Chuanjin Tang et al. revealed the crack development characteristics under varying moisture contents from macro- and micro-perspectives and proposed a new method for calculating the inclination of the macro-fracture surface of samples. Lu et al. [23] demonstrated that mixed-mode cracks inevitably develop during the failure process of coal samples. Daraei and Zare [24,25] investigated the impact of moisture content variation on the crucial strain and damage strain of rocks based on crucial rock saturation with the maximum loss of uniaxial compressive strength and deformation modulus. Furthermore, several studies have indicated that with different moisture contents of the samples, there are differences in the microstructure, porosity, and crack development of the rock (mass), causing variations in its macro-mechanical features [26,27].
In a study on chemical erosion-induced coal rock damage, Wang et al. [28] carried out physical-mechanical performance evolution and uniaxial compression tests (UCTs) of coals under salt solution, obtained variations in coal porosity, mass, microstructure, solution pH, and stress-strain curve under varying immersion times, and developed a damage constitutive model of coal samples taking chemical erosion into account. Xiating Feng et al. [29,30,31] explored the variation of sandstone mechanical performance under different pH solutions, revealing the microdamage mechanism of rocks under chemical erosion. Current studies have shown that the chemical interactions between water and rocks, including ion exchange, dissolution, and hydrolysis, change the mineral components in rock masses and increase the pore structure, thus resulting in changes in the macro-mechanical performance [12].
In summary, although significant progress has been made in research on the damage mechanisms and damage evolution processes of coal rock under the influence of water, laying an important foundation and providing a clear direction for subsequent research into the damage and failure mechanism of coal-pillar dams subjected to water-induced erosion in goaf reservoirs, a review of the relevant studies reveals a lack of comprehensive and in-depth exploration of the microfracture scale, type, and location in coal rock induced by moisture action. Therefore, to address the alternating wet-dry and long-term fully submerged conditions present due to the different environmental conditions of coal-pillar dams in various areas, this paper conducts uniaxial compression tests (UCTs) on dry, moisture-containing, and pre-immersed coal samples. Particular attention is given to multiparametric acoustic emission (AE) monitoring of coal sample damage under different water erosion conditions. Based on a comparison of the AE source localization results and macroscopic fracture patterns, the influence of moisture content on the macroscopic failure and fracturing characteristics of coal samples is investigated. Moreover, the RA-AF correlation method combined with K-means clustering is applied to analyze the evolution of the fracture mechanism during coal loading. Furthermore, b-values and S-values are introduced to discuss the crack-scale development features throughout the loading process.

2. Experimental Design and Microscopic Morphology

2.1. Test Materials

Figure 1 shows that the coal samples were obtained from the remnant pillars near the goaf of a mine in the Shendong mining area, northwest China, and were processed into standard cylindrical samples measuring 50 mm in diameter and 100 mm in height. To ensure that all sample ends were flat, both ends of the processed samples were polished with sandpaper so that the end surface was flat to within 0.02 mm. Twelve samples with intact surfaces, no obvious lamination or damage, accounting for similar wave velocities, were selected and placed in a vacuum drying oven for low-temperature drying at 40 °C for 6 h. The samples were then removed and sealed with plastic wrap for use.

2.2. Test Scheme

Figure 2 illustrates the reservoir formation and the occurrence environment of the pillar dam in the goaf. It can be seen that after the collapse of the overburden, the surface water and groundwater flowed into the goaf along the fissure zones to form the underground reservoir, and the boundary pillars and section pillars formed the reservoir dam. The pillar dam body affected by water erosion can be divided into three regions. Region ① lies below the immediate roof, far from the water surface, where the coal body is usually dry (or has a low moisture content). Region ② lies above the water surface, closer to the water surface, where the coal body is usually water-bearing. The moisture content tended to increase with proximity to the water surface. Region ③ lies below the water surface and is adjacent to the water surface, remaining in a prolonged state of water immersion.
Consequently, the prepared coal samples were subjected to treatments corresponding to the three states, as depicted in Figure 3. In Scheme A, the samples were subjected to low-temperature drying at 40 °C for 6 h and removed for UCTs, which were used to simulate the coal body in region ①. In Schemes B and C, the samples were placed in a non-destructive soaking device independently developed by the China University of Mining and Technology for natural water absorption for 8 h and 16 h, respectively, and then subjected to UCTs to simulate the coal body in region ② [32]. In Scheme D, the samples were placed in vacuum-purified water for 24 h and then subjected to UCTs to simulate the coal body in region ③ after wiping off the surface water with absorbent paper. All coal samples were treated using four schemes and tested for wave velocity using a wave velocity meter (RSM-SY6 acoustic monitor, manufactured by Hebei Tianqixingzi Testing Equipment Co., Ltd. in Cangzhou, China) before starting the test. Table 1 lists the sample numbers and basic physical parameters.

2.3. Microscopic Morphology
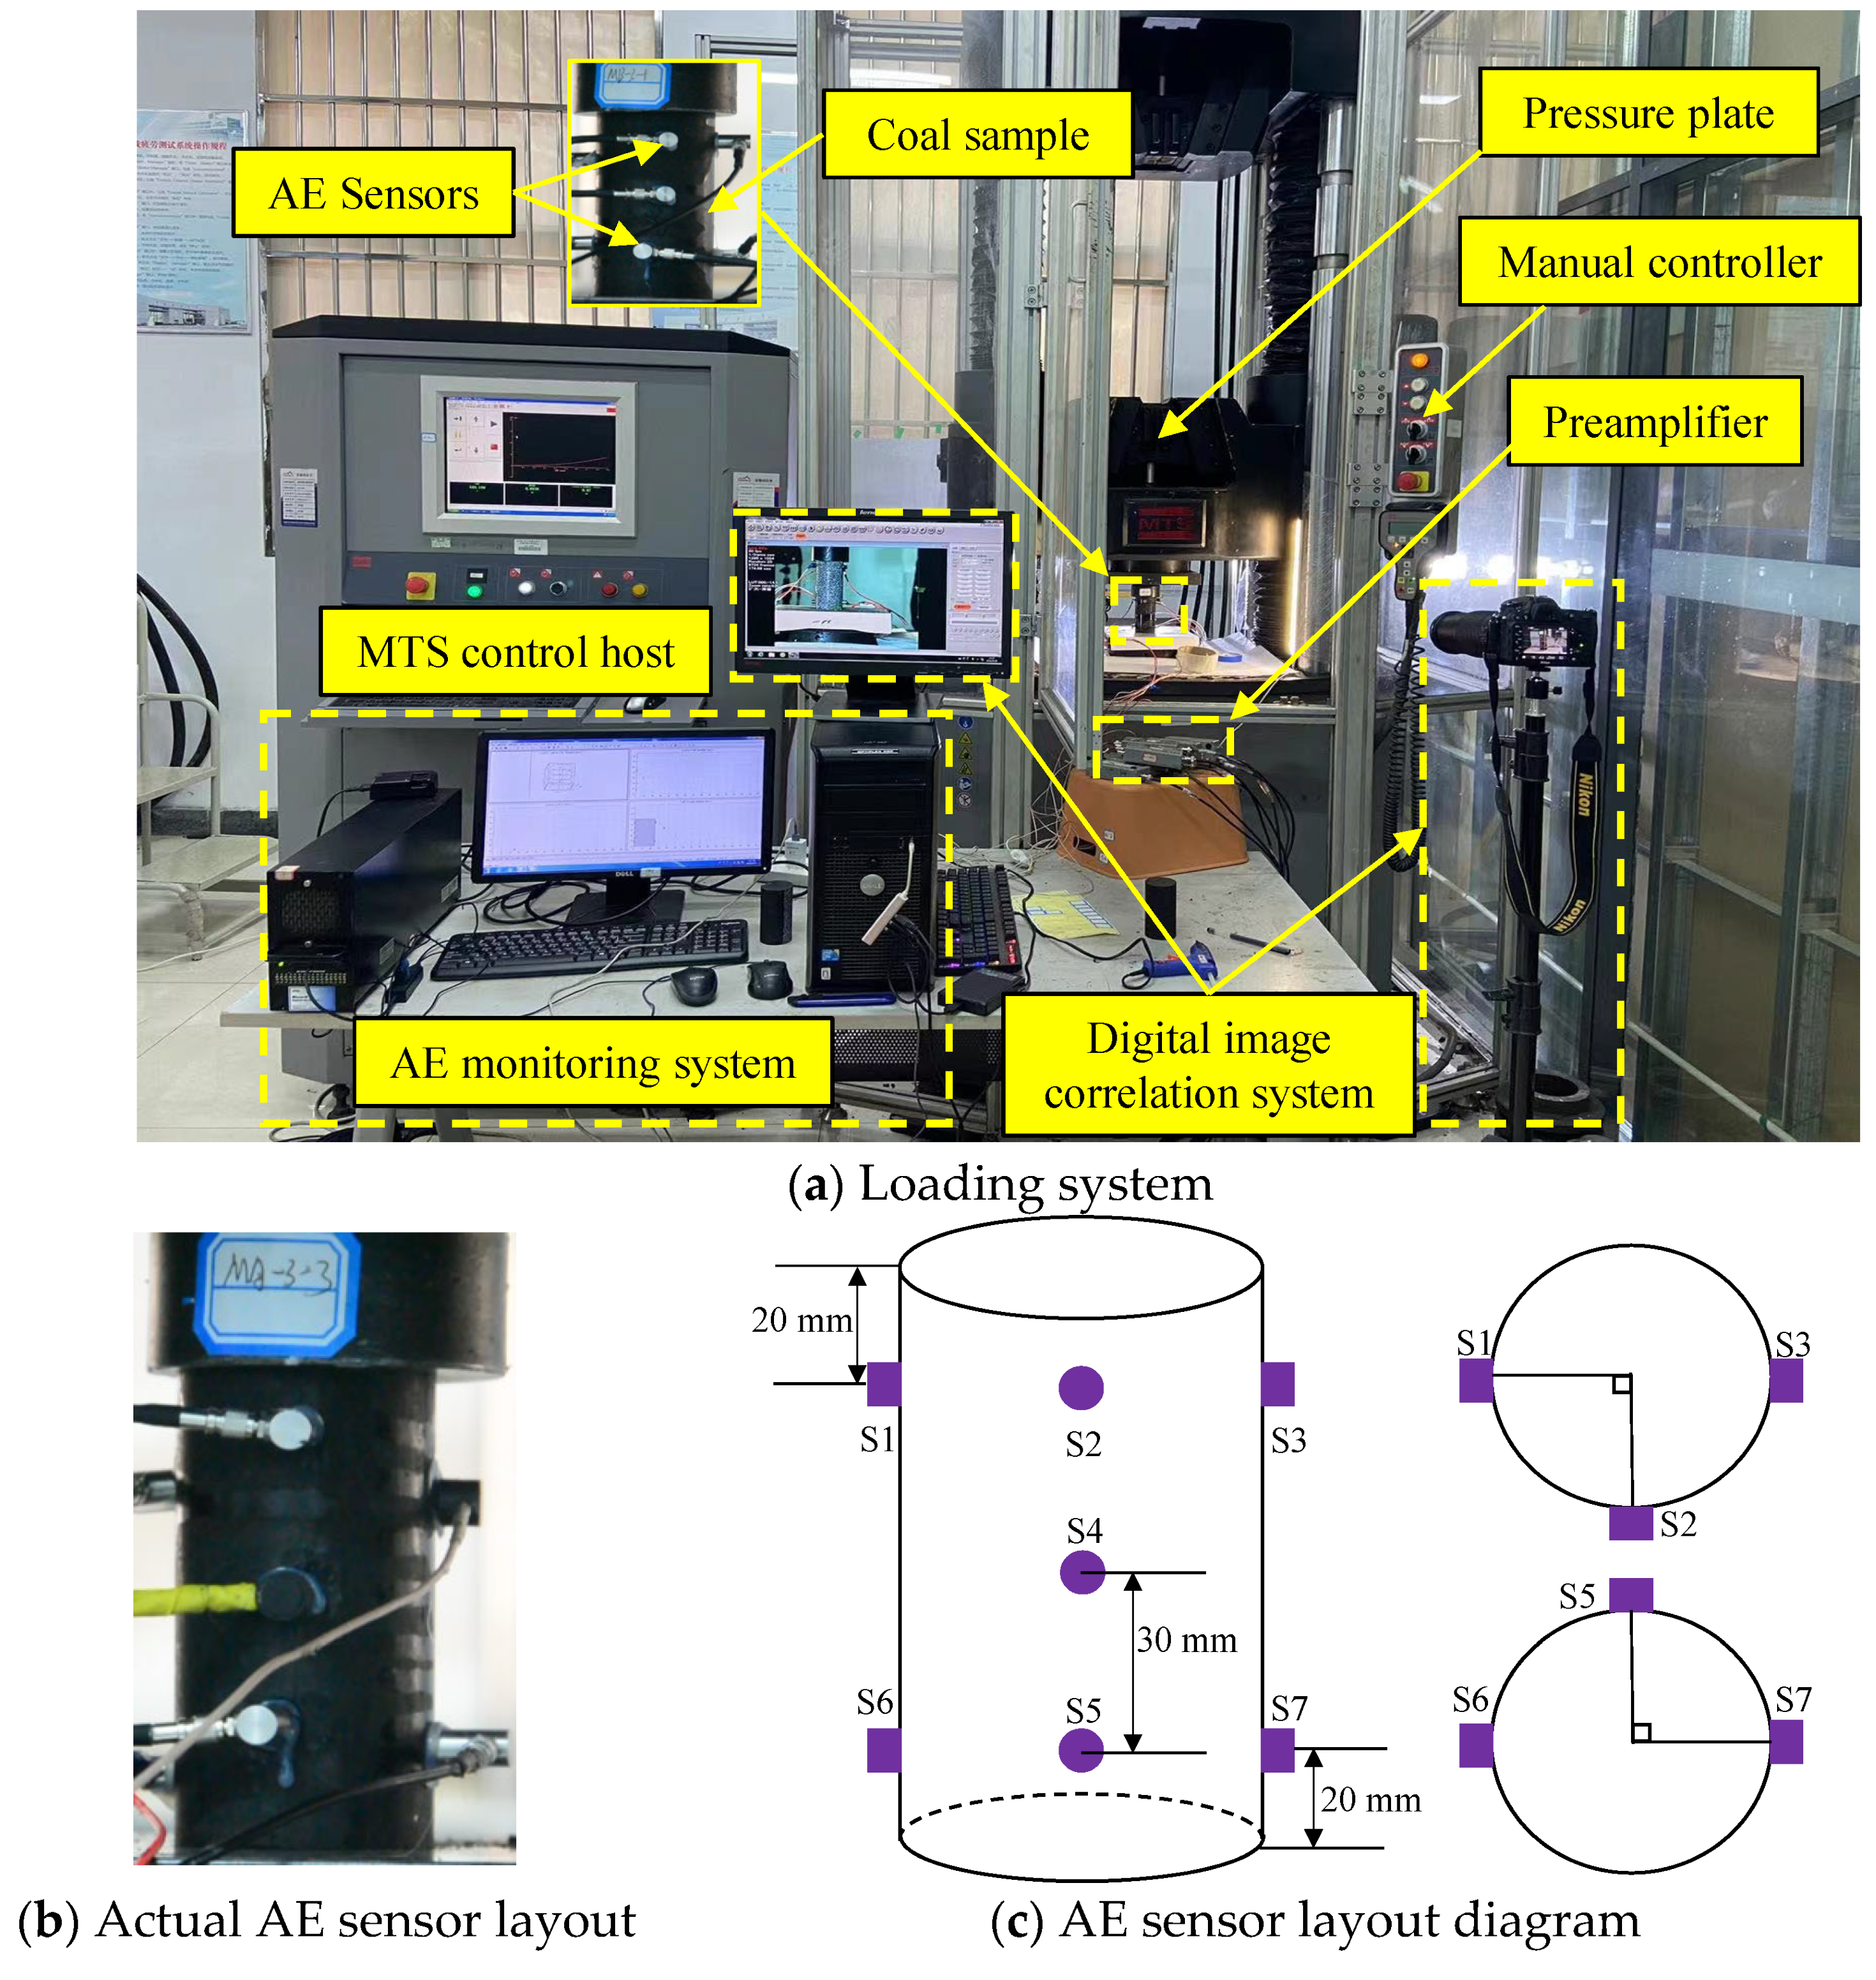
SEM analyses were conducted using a VEGA COMPACT scanning electron microscope (produced by TESCAN in Brno, Czech Republic). The experimental procedure involved selecting representative coal samples (MA-MD) based on different soaking methods according to the test plan in Section 2.2. The samples were cut into observation blocks measuring 10 mm × 2 mm. Subsequently, these blocks were dried and their surfaces were coated with gold, so that SEM (manufactured by FEI Company in Hillsboro, OR, USA) could be used to identify the microscopic morphology of coal samples with different water immersion before uniaxial compression. The pore structure and crack development were analyzed at different magnifications of 500× (corresponding to a size of 50 μm), 1500× (20 μm), and 3000× (10 μm), as illustrated in Figure 4.
As shown in Figure 4a, the surface of the dry MA coal sample was rough, featuring abundant depressions and protrusions, and displayed a layered accumulation. This structure results in a large specific surface area, which is advantageous for liquid adsorption. At a magnification of 1500×, intergranular cracks were apparent. Furthermore, at higher magnifications, a small number of transgranular cracks within the coal matrix can be observed.
Figure 4b reveals that after an 8-h immersion in a non-destructive device, the MB coal samples exhibit typical step cleavage when magnified 500 times. This step-like morphology was formed by the intersection of cleavage planes at different elevations. Owing to the expansion of clay minerals in the coal composition upon contact with water or the partial dissolution of major minerals in water, higher magnification reveals multiple dissolution pores on the coal surface that interconnect to form crack channels.
Figure 4c demonstrates that, following a 16-h immersion in a non-destructive device, the MC coal samples continued to hydrate clay minerals in their composition. At 500× magnification, the laminar structures were observable. At 1500× magnification, an increased number of dissolution pores appeared. Further magnification to 3000× revealed more pronounced characteristics of the transgranular crack morphologies.
As shown in Figure 4d, the MD coal samples, after 24 h of soaking in vacuum-purged pure water, exhibited weakened bonding forces between fine coal particles due to water immersion, leading to the emergence of minor tensile cracks. At a magnification of 1500×, the particle surfaces displayed layered or flaky accumulation characteristics, surrounded by particles of varying sizes and shapes. Upon further magnification to 3000×, both dissolution pores and microcracks were noticeably larger than in their previous water-bearing state, with the presence of 8 μm dissolution pores.

2.4. Test Equipment

Figure 5a shows that UCTs were performed on the treated coal samples using an MTS-C64.106 static electro-hydraulic servo universal testing machine (produced by MTS Systems Corporation in Shanghai, China), which can synchronously collect load, displacement, and time data in the loading process, featuring high testing accuracy and stable and reliable performance. Displacement loading at 0.2 mm/min was used. The AE system utilized a PCI-2 acquisition system (PCI-2, Physical Acoustic Corporation, Princeton, NJ, USA), with the threshold set at 40 dB, preamplification at 40 dB, sampling rate at 2 MSPS, and PDT, HDT, and HLT set at 50 μs, 200 μs, and 300 μs, respectively [33,34,35]. The AE sensors (NANA-30, Physical Acoustic Corporation, Princeton, NJ, USA) were operated at a frequency of 100–400 kHz, and seven sensors were arranged on the sample surfaces, as shown in Figure 5b,c. To ensure the high spatial resolution and stability of acoustic emission (AE) source localization results, a strict sensor calibration procedure was implemented prior to formal testing. The calibration steps are as follows: First, the Nano30 acoustic emission sensors were uniformly and tightly bonded to the specimen surface using a special coupling agent to ensure good sensor-specimen coupling. Subsequently, the sensitivity of each sensor was individually checked using the pencil-lead-breakage method. Sensor acceptance required the measured amplitude deviation to remain within ±3 dB; otherwise, the sensors were reattached and rechecked until the requirement was satisfied. At least 10 standard measurement points were selected at various locations (including the midsection and both end surfaces) on the specimen surface. Each point underwent pencil-lead-breakage tests repeated at least three times, and the position errors were documented. The actual positioning errors (measured vs. theoretical position) were calculated, and these positioning errors were controlled within 5 mm. Formal rock-loading experiments were conducted only after completing this calibration procedure, thus ensuring the reliability and accuracy of the acoustic emission data collection and localization analysis.

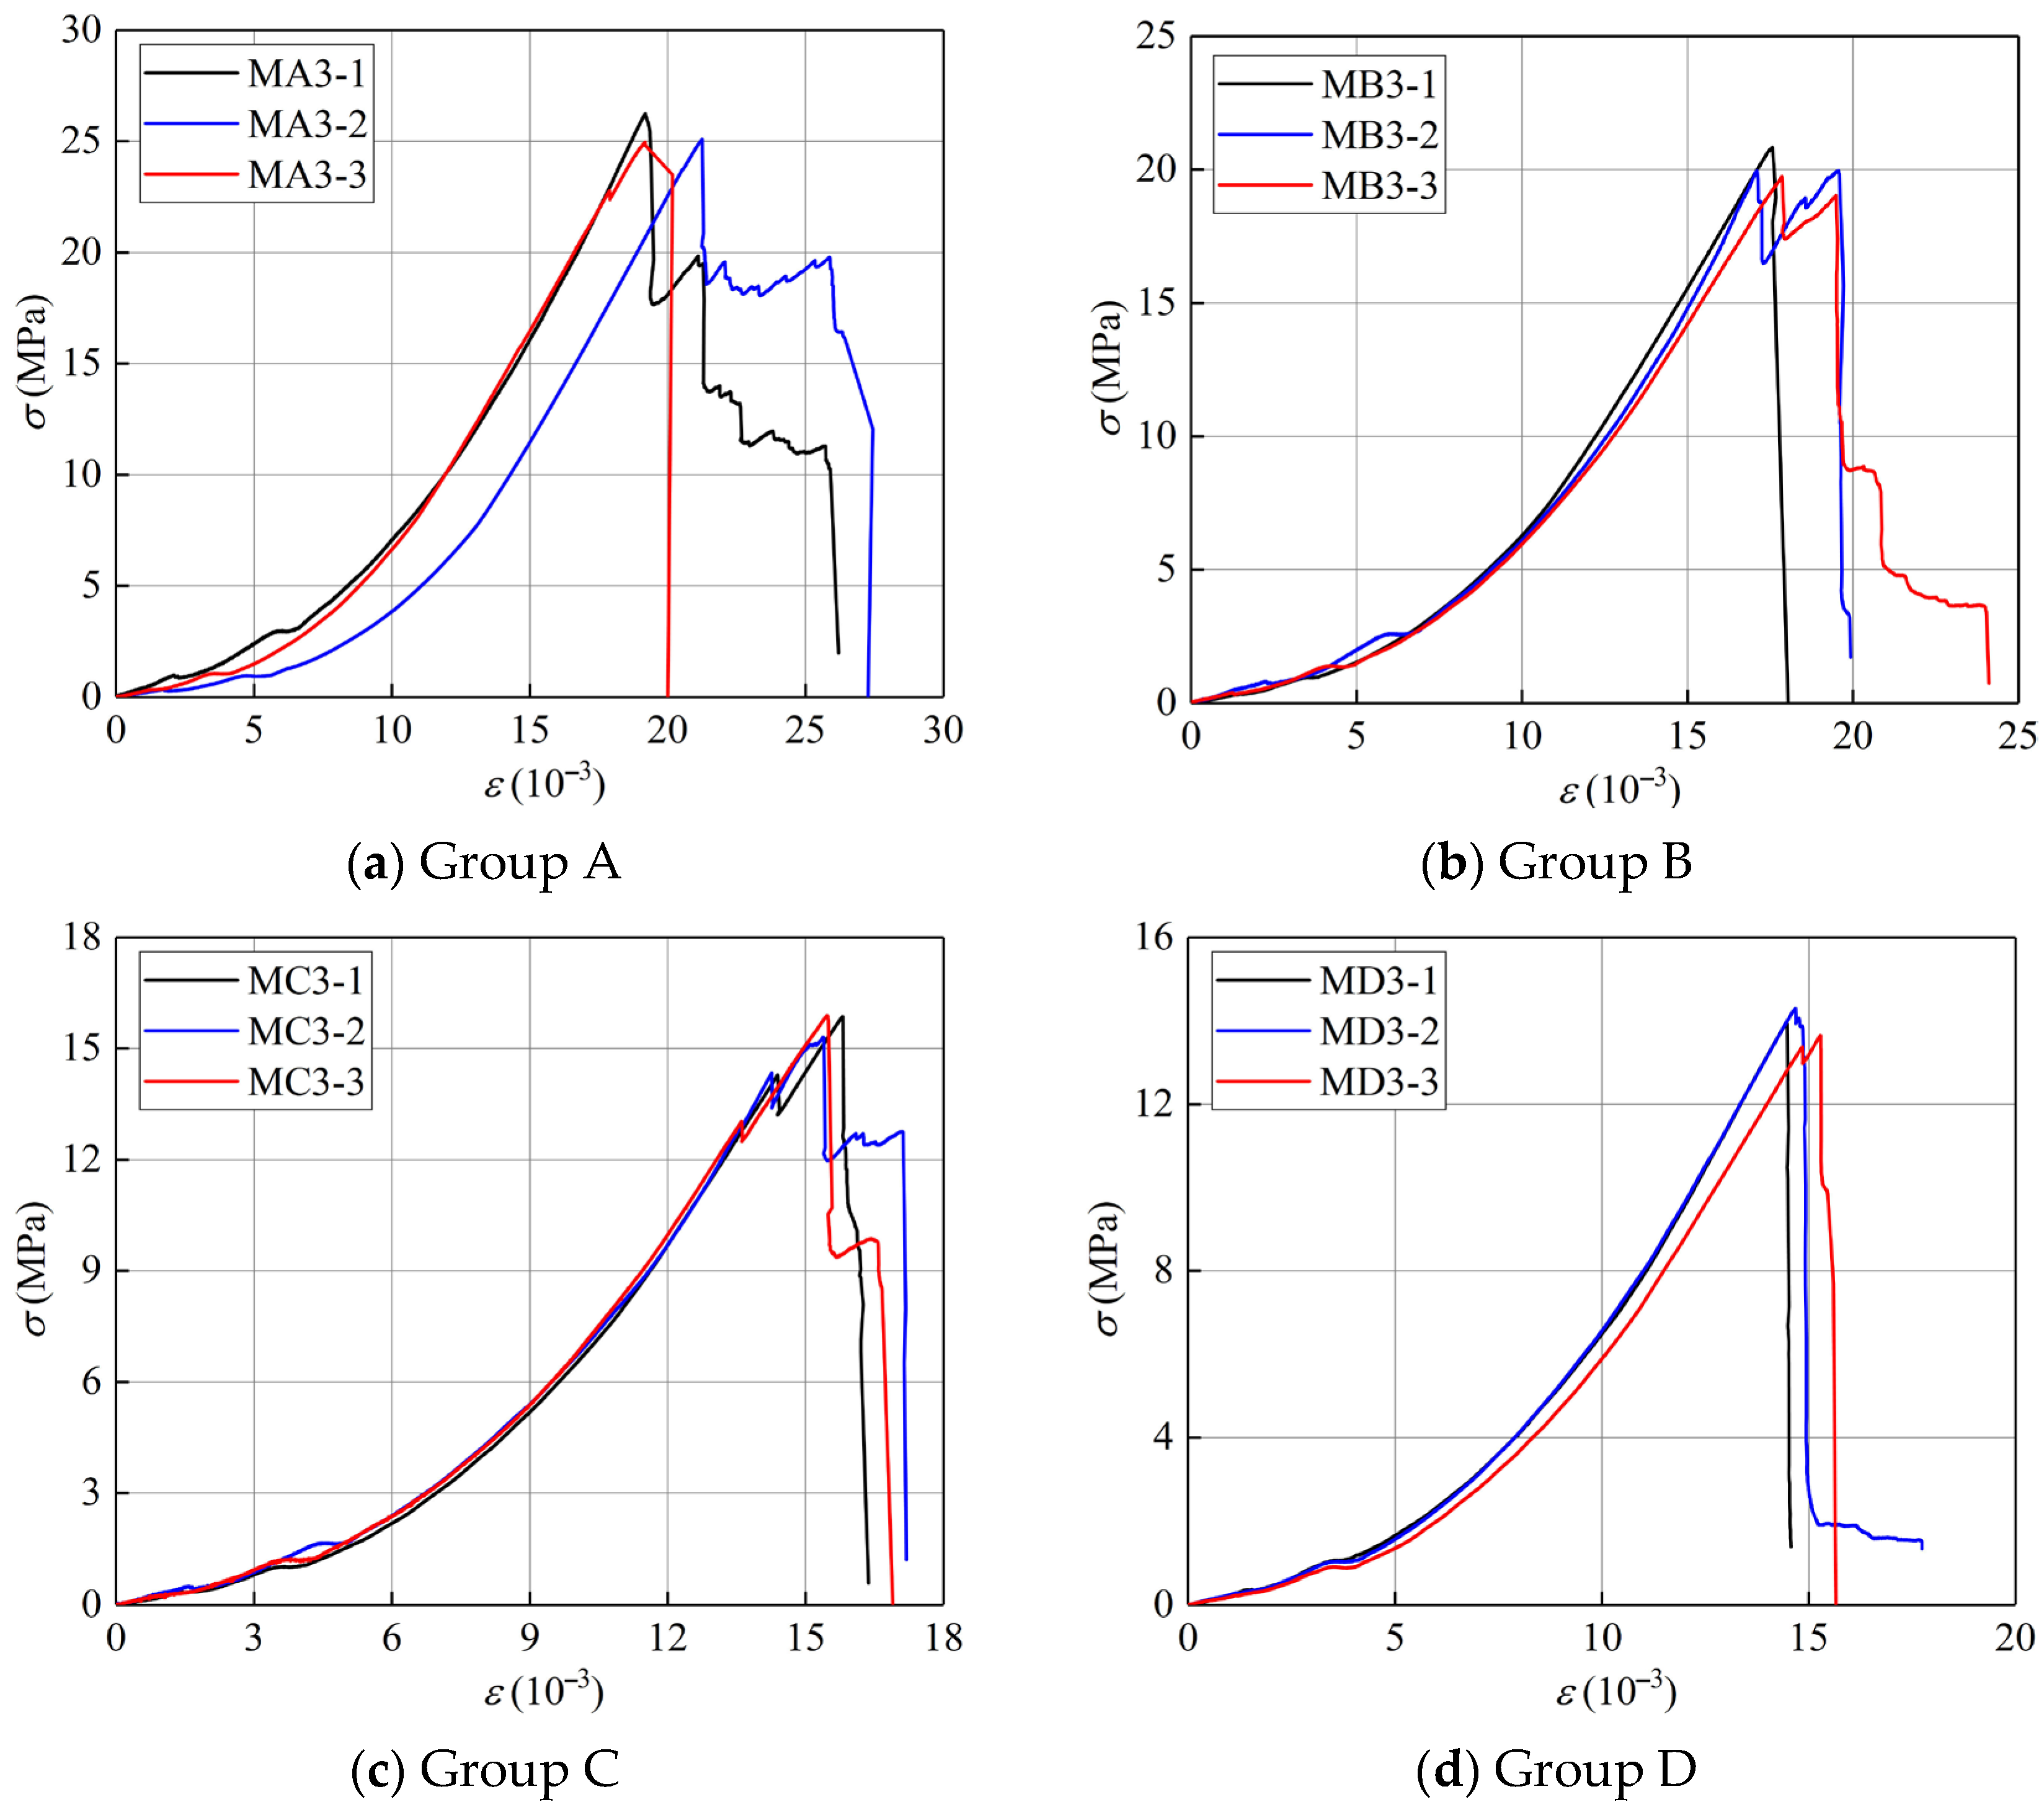
3. Mechanical Performance

Figure 6 indicates that the stress-strain diagrams for the four groups of coal samples under varying treatments were dominated by brittle damage after the peak. No obvious stress drop was noticed in the pre-destruction curves of the dry samples in group A and the soaked samples in group D. In contrast, an obvious stress drop was observed in the water-containing samples in groups B and C. This was mainly due to the different moisture contents of different regions in the natural water absorption process, leading to different strengths in each region. The loading process was prone to stress drops. However, the water distribution in the soaked samples was more uniform, and the regional strength gap was smaller, making it difficult to observe a stress drop. The stress-strain curves in the same group exhibited higher coupling and better homogeneity.
Figure 7 presents the strength and deformation parameters for the four groups of coal samples, from which it is clear that the peak strength, peak strain, elastic modulus, and deformation modulus declined with increasing water erosion duration. Comparing the mechanical parameters of samples from groups A, B, and C, it was observed that with increasing moisture content, the mechanical parameters progressively declined, which was the same as the conclusion of previous research. Comparing the mechanical parameters of the samples saturated by natural water absorption from group C and those saturated by immersion from group D, it was found that the samples from group D had lower parameters. This is because long-term immersion caused the loss of some water-soluble minerals in the samples, resulting in initial damage and accelerating the destruction of the coal samples under external force. This suggests that, compared with naturally absorbed coal samples, the long-term soaked ones were easier to destabilize and damage under external load. Therefore, reinforcement is required for this part of the coal body in the support design of the underground reservoir dam.

4. Characteristics of Microcrack Development

Characterizing the microcrack evolution inside coal rock masses is essential for uncovering the mechanisms of rock damage and failure and maintaining the stability of underground engineering. The spatial and temporal evolution of inner microcracks in the sample damage process requires AE source localization to microscopically recreate the emergence, development, propagation, and penetration of inner cracks throughout the damage process.

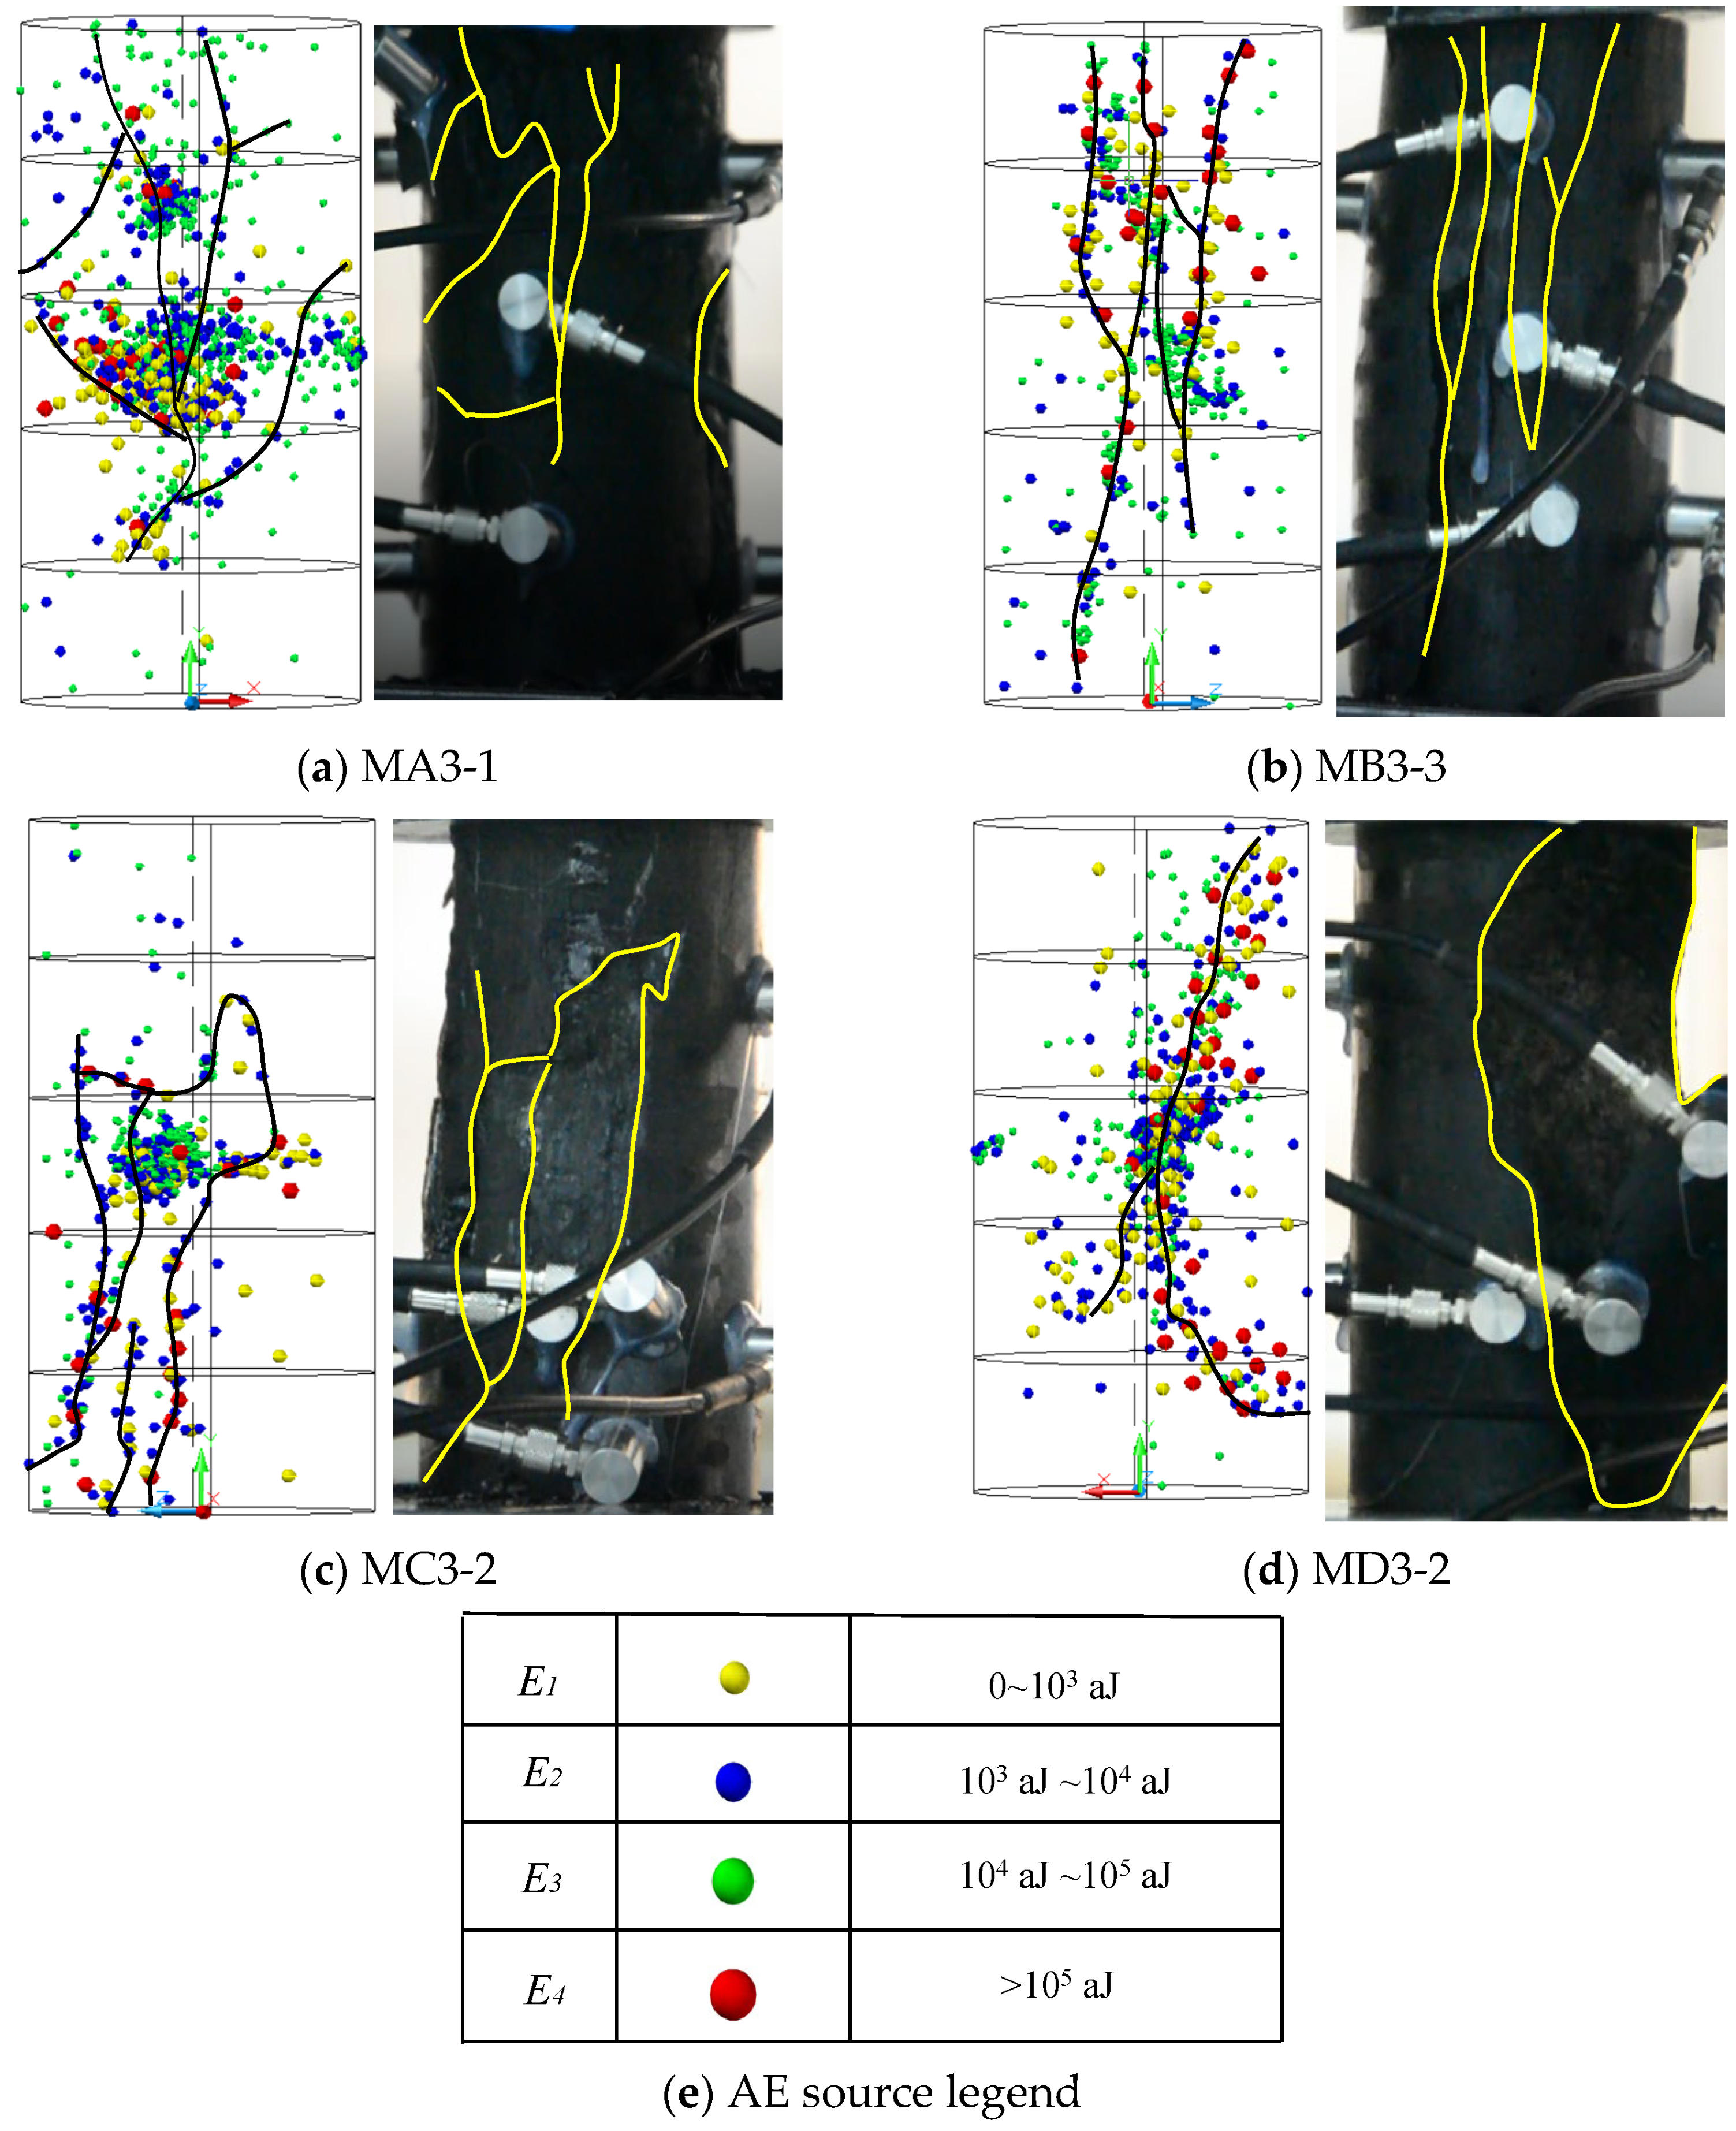
4.1. Analysis of the Overall Effect of AE Localization

Figure 8 shows that the energy associated with the varying events represented the scale of inner cracks during AE source localization. Consequently, the crack scale can be classified according to the energy magnitude. The left side of the figure presents the AE localization results, while the right side presents the macro-damage patterns of the samples. Figure 8e illustrates that the balls of different colors and radii on the left represent cracks with varying scales. The yellow, blue, green, and red balls represent microcracks at energy scales E1, E2, E3, and E4, corresponding to specific values of E1: 0–103 aJ, E2: 103–104 aJ, E3: 104–105 aJ, and E4: >105 aJ. These four energy levels characterize fracture events at the micro-, small-, medium-, and large-scales, respectively. It should be noted that these four energy levels are defined empirically based on the overall energy distribution range of acoustic emission signals obtained experimentally, serving as a convenient means of categorizing data for subsequent statistical analysis. The detected AE energies ranged from 10–100 aJ (attojoules) during the fracture propagation. These values are lower than the typical rock AE energies (1–100 μJ) reported in previous studies [36], which can be attributed to the nanoscale nature of our synthetic samples.
Figure 8. Comparison between macro damage patterns of coal samples and results of AE localization.
Processes 13 02196 g008
The AE localization results clearly demonstrated that internal microcracks initially formed within the central region of the samples, subsequently propagating gradually toward the edges, and ultimately developing into a concentrated AE source aggregation zone that spanned both the interior and surface of the samples. Notably, low-energy AE sources (E1 and E2) tended to cluster around higher-energy AE events (E3 and E4), expanding radially outward and significantly enlarging the internal damage zone. Moreover, a high degree of correspondence was observed between the simulated fracture surfaces obtained by connecting high-energy AE sources (illustrated as black lines in the left figure) and the actual macrofracture surfaces recorded at the moment of sample failure (highlighted by yellow lines in the right figure). This strong coupling provides robust evidence that microcrack evolution and propagation profoundly influence the formation path, orientation, and morphology of macroscale fractures. These observations further suggest that during the loading-induced microcrack development process, small-scale, low-energy microcracks serve as fundamental precursors of rock damage. Extensive clustering of numerous low-energy AE events generated localized damage zones, where the accumulation of internal microcracks significantly weakened the local structural integrity. Consequently, under sustained external loading, these localized damage zones became more susceptible to crack propagation, enabling smaller cracks to coalesce and evolve into larger-scale fractures, corresponding to a high-energy AE source. The subsequent aggregation and outward expansion of these high-energy AE events further intensified and broadened the internal damage in the sample. As the number of low-energy AE sources continuously increased, indicating ongoing microcrack formation, and as high-energy AE sources continued to propagate outward, the overall load-bearing capacity of the coal samples decreased steadily. Eventually, when the internal microcracks expanded sufficiently to intersect the outer edges of the sample, the stress concentration led to the rapid interconnection and coalescence of cracks at various scales, resulting in the formation of clear macro-fracture surfaces. This process culminated in the instability of the sample strength and ultimate failure. Thus, the analysis underscores that internal microfractures, represented by low-energy AE signals, play a critical role not only in promoting sustained crack growth but also in acting as foundational elements and bridges that effectively connect internal damage regions to the external surfaces of the samples, ultimately determining the overall rupture characteristics.

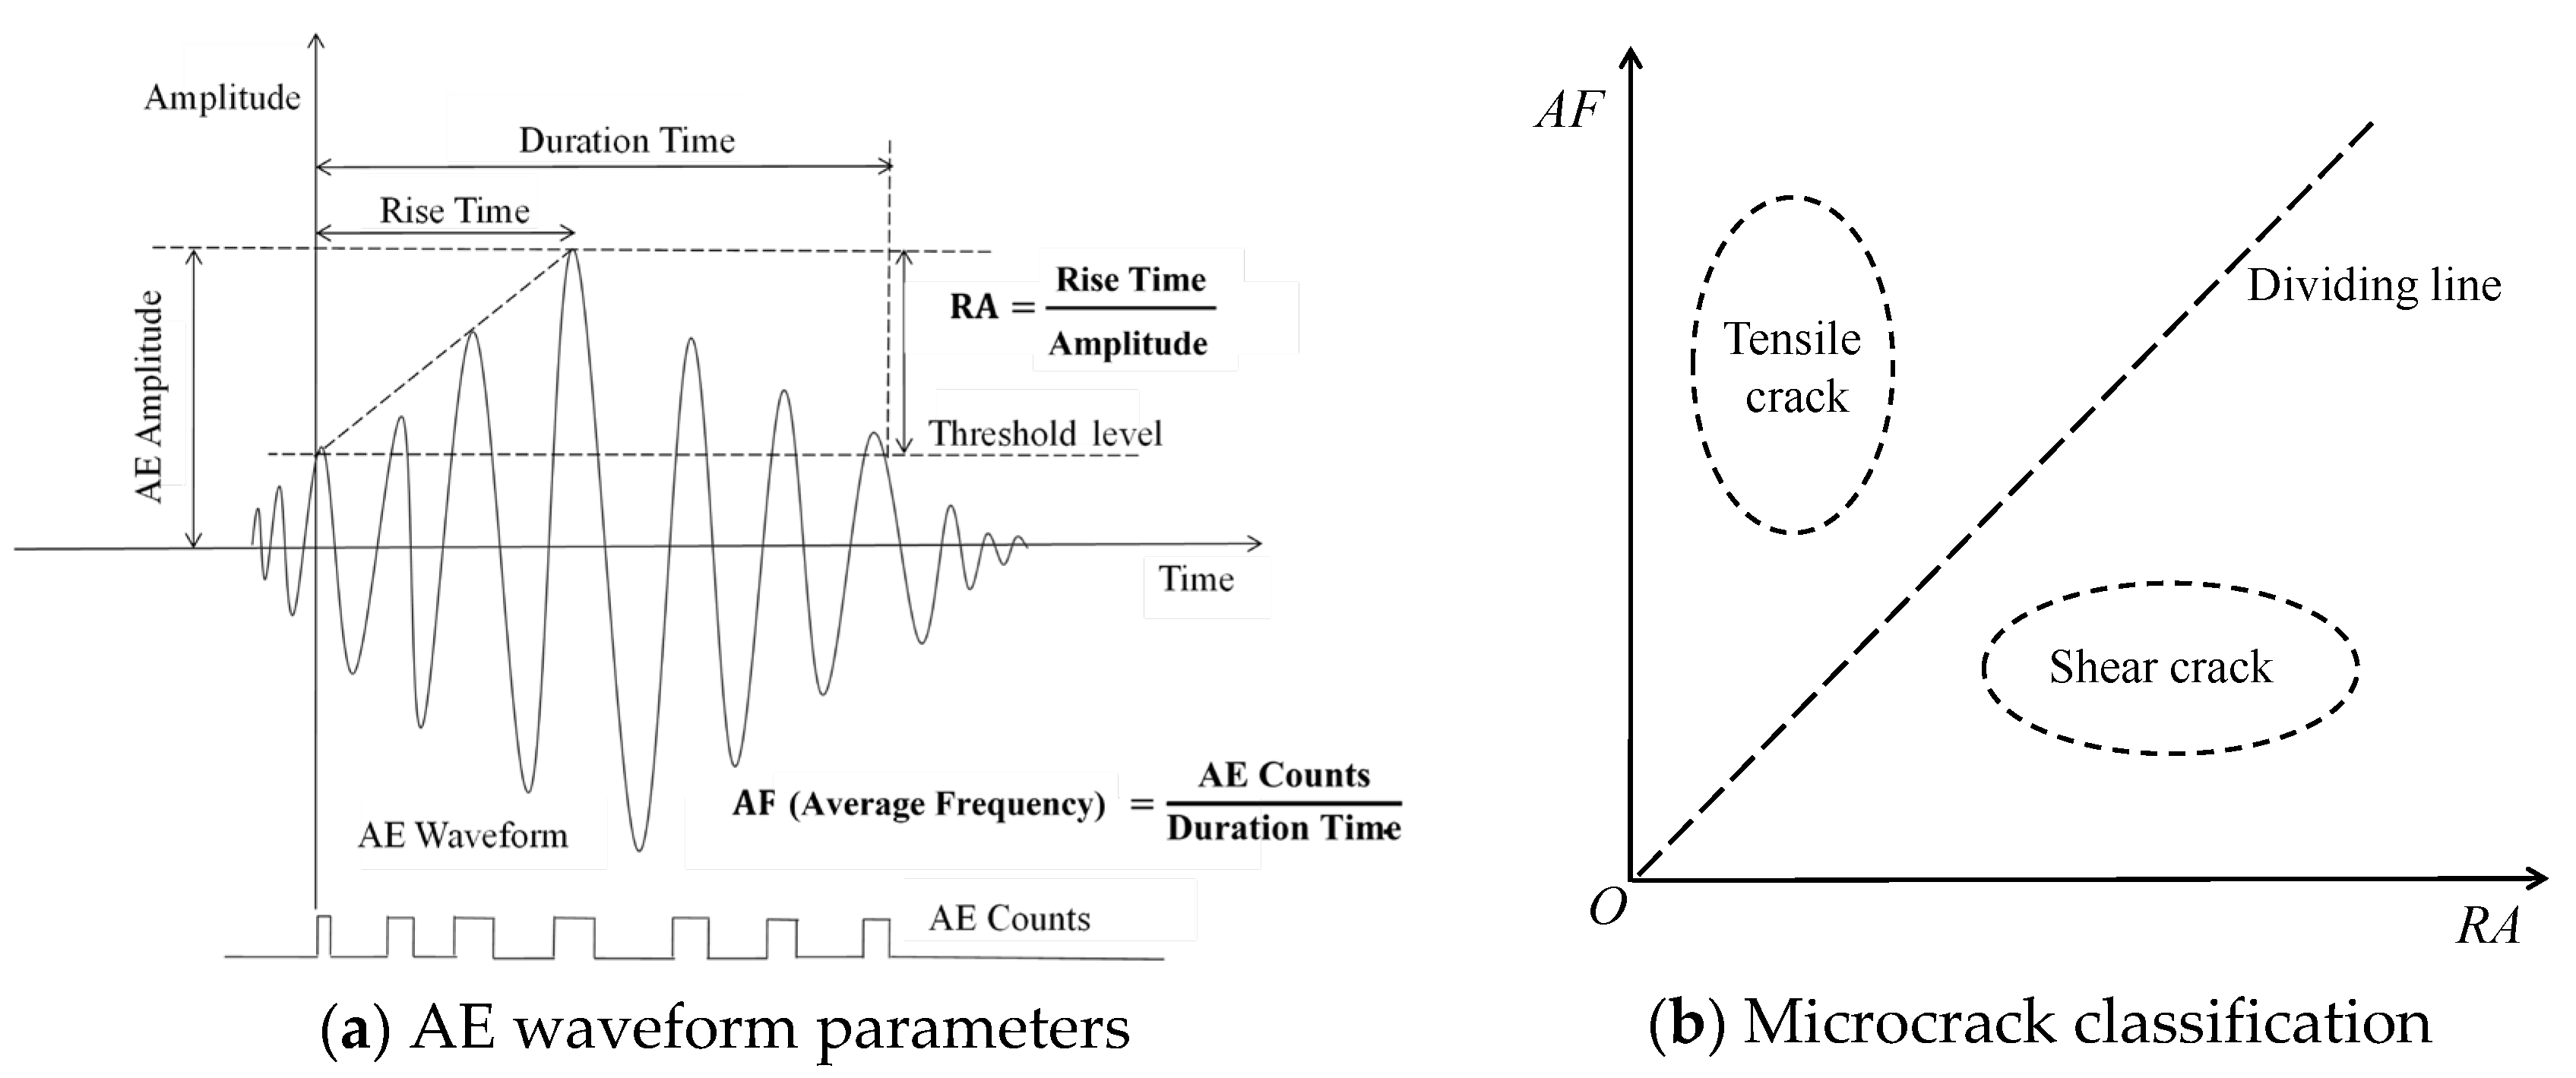
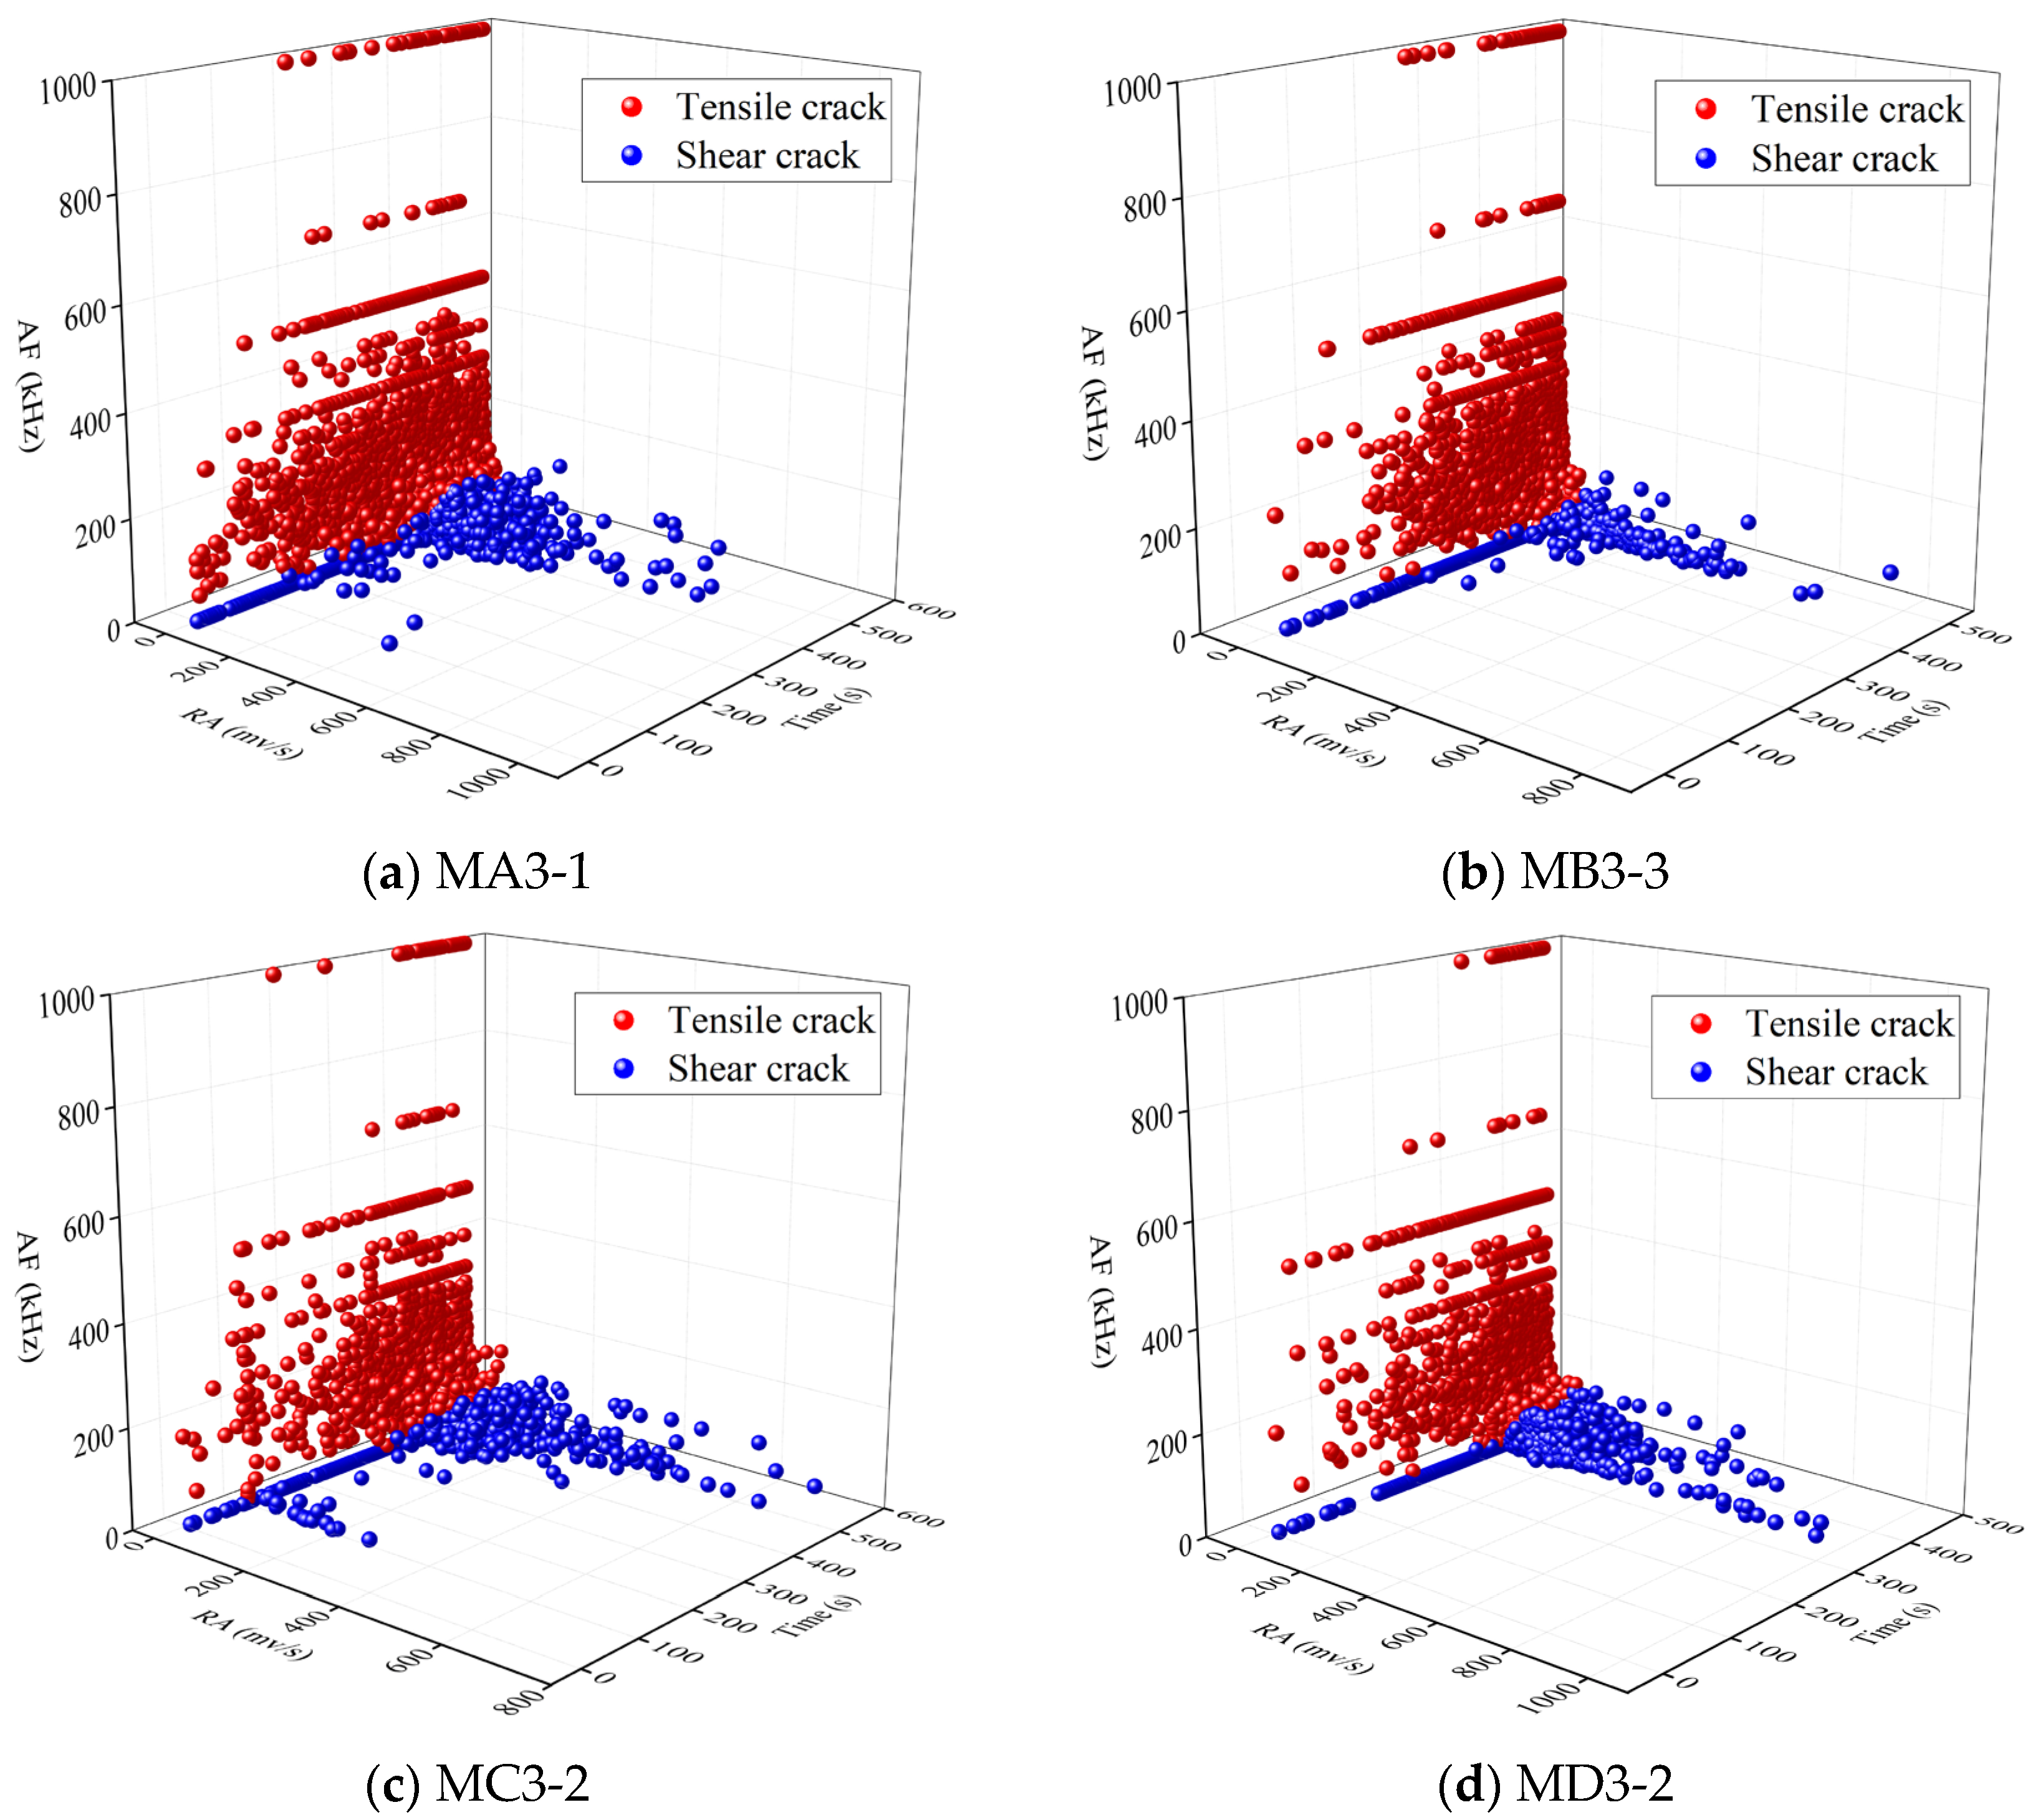
4.2. Evolution Characteristics of Microcrack Classification

(1)
Establishment of the classification method of microcracks
Different types of microcracks were generated in rock units under tensile and shear stresses, and the differences in the mechanism of microcrack generation led to the release of different AE waveforms during formation. Generally, the AE waveforms released by tensile cracks have a high frequency and short rise time, in contrast to shear cracks [37,38,39,40]. Therefore, defining the AE characteristic parameters allowed a microscopic distinction between tensile and shear cracks. Figure 9 shows that tensile cracks exhibited high AF and low RA, in contrast to shear cracks; however, there was still no clear definition for the demarcation line. Therefore, it is necessary to introduce new algorithms for quantitative analysis.
The K-means clustering algorithm, one of the most popular clustering methods, is used to classify data by dividing it into varying clusters based on relevance. Data clustering is calculated based on the criterion that the sum of squared distances between each data point in a sample subset and the centroid of the subset being classified is less than a set threshold. Data points meeting this criterion are considered to belong to the same kind as each other [41,42]. Therefore, suppose that for a given sample set X = X 1 , X 2 , X 3 , , X N , the final output is C = ( C 1 , C 2 , C 3 C K ) , X i C classified into K clusters, and K samples are randomly selected from the data set X to serve as the initial centroids u = u 1 , u 2 , u K , where u j represents the centre point for C i . Then, the minimization of the squared error E ¯ can be denoted as follows.
E ¯ = i = 1 N j = 1 K X i u j 2
This calculation process was realized by programming in MATLAB (2024a version) with the following steps.
  • Firstly, determine the size of the output K value, randomly divide the sample data X = X 1 , X 2 , X 3 , , X N into K clusters, and preliminarily determine the K centroids u = u 1 , u 2 , u K , typically the average of each sample subset.
  • Calculate the distance from each data point X i to the centroid u j by Equation (4), and then assign each data point X i to the cluster C i nearest to u j for the formation of a new cluster C i .
  • Recalculate the average coordinates of all points in the new cluster C i , and use this average as the new clustering centre u j .
  • Repeat steps b and c until the clustering centre u j is no longer required to move widely.
Based on the correlation of the source mechanisms of the same tensile or shear rupture, the K-means clustering algorithm classified AE source signals of the same source mechanism into one category in the process of multiple iterations of calculations to realize the purpose of classifying tensile and shear cracks in AE signals.
It should be noted that, because multiple sensors were used to acquire data synchronously during the test, a single micro-fracture event was almost invariably recorded on several channels at nearly the same instant, producing multiple AE hits. To remove such duplicates, a coincidence time-filter was applied before the event classification. Within each predefined window, only the first-arriving-waveform was retained while all subsequent arrivals were discarded. This procedure effectively eliminated redundant records and yielded a reliable dataset in which each entry corresponded to an independent micro-fracture generated during loading.
(2)
Evolution results of the classification of microcracks
The K-means clustering algorithm was employed to classify the AE signals while loading four coal sample groups into microcracks. The detailed results are presented in Table 2 and Figure 10. As shown in Figure 10a–d, during the damage failure under uniaxial compression, tensile cracks were distributed across the entire loading phase. In contrast, shear cracks were mainly distributed in the failure phase (including the pre-peak failure and the entire post-peak stage). Different moisture content and water intrusion modes had little influence on the AF and RA values of AE signals during loading, and the AF and RA values were mainly distributed in the ranges of 100–400 kHz and 50–200 mv/s, respectively.
According to Table 3 and Figure 10e, as the moisture content increased, the sum of the cracks, tensile cracks, and shear cracks gradually decreased. This was mainly because water weakened the varying mechanical parameters of the coal body, leading to initial damage, while dry coal masses required massive cracks during loading and accumulated sufficient damage to cause strength instability. A gradual decline in the percentage of tensile cracks and a gradual increase in shear cracks were observed. Comparing the shear crack classification results of varying pretreated coal samples, it was indicated that there was a large difference in the percentage of shear cracks between dry coal samples (group A) and water-unsaturated coal samples (group B), which was 1.59%. In contrast, there was a small difference in the percentage of shear cracks between the water-unsaturated (group B) and water-saturated (group C) coal samples under natural water absorption, which was 0.08%. There was a large difference in the percentage of shear cracks between the naturally absorbed water-saturated coal samples (group C) and vacuum-soaked water-saturated coal samples (group D), which was approximately 2%. Therefore, different water erosion methods affected the generation of microcracks during the damage failure process. Shear cracks were more likely to be generated by soaking water absorption than by natural water absorption. Under the same water erosion conditions, a higher moisture content is more likely to induce shear cracks.

5. Characteristics of AE Damage

In essence, crack emergence, development, and propagation in coal rock masses are processes of cumulative and progressive damage. Therefore, AE signals during the damage and failure processes were collected to establish reasonable and effective evaluation indicators for characterizing the damage state of coal rock masses.

5.1. Establishment of AE Damage Index

(1)
b-value of AE
In 1944, Gutenberg and Richter first proposed the equation for the frequency-magnitude relation, namely the G-R relation [43].
lg N = a b M
where N stands for seismic frequency; M stands for seismic magnitude; a and b stand for constants, and b-value stands for the reduction rate of vibration intensity per unit time. Since there is no magnitude parameter in the data collected by AE tests, the amplitude of each event is usually post-processed in place of the magnitude [44,45,46,47].
M i = m s i / 20
where m s i represents every AE event amplitude; M i represents every AE event magnitude. Then the b-value of AE can be expressed as follows.
lg N i = a b m s i / 20
where Ni represents the frequency of AE event with amplitude of msi; Currently utilized approaches for the b-value of AE are the linear least-squares method and the maximum likelihood method. The least squares approach was utilized, and the b-value of AE is as follows.
b = i = 1 n m s i 20 i = 1 n l g N i n i = 1 n m s i 20 l g N i n i = 1 n l g 2 N i ( i = 1 n l g N i ) 2
(2)
S-value of AE
The S-value of seismic activity (Yang et al., 2022) [33] contains factors such as time, space, and intensity, including seismic frequency, average energy level or average release energy, maximum energy level, concentration of spatial distribution of micro-earthquakes and their memory effects, which can be obtained by adopting fuzzy set weighting method comprehensively. The calculation formula is as follows.
S = 0.117 lg ( N + 1 ) + 0.029 lg 1 N i = 1 N 10 1.5 M i + 0.015 M
where N stands for seismic frequency, M i stands for each seismic magnitude, and M stands for the maximum magnitude. Seismic activity reflects the probability of earthquakes occurring in a region. The higher the seismic activity, the higher the probability of earthquake occurrence.
The propagation of cracks inside rocks releases elastic waves similar to earthquakes, so the S-value can also be used to monitor the crack development inside rocks by AE. Assuming that there are n AE events in a certain period, Equation (10) can be substituted into Equation (13) to obtain Equation (14).
S = 0.117 lg ( n + 1 ) + 0.029 lg 1 n i = 1 n 10 0.075 m s i + 0.00075 m s
where msi stands for each AE event amplitude; m s stands for the largest amplitude of any AE event. When the AE signal surges or the signal amplitude is large, the S-value increases. In theory, the S-value of AE shows a high-value anomaly during rock damage.

5.2. Analysis of AE Damage Index

Figure 11 represents that the AE signals gathered during the failure of each sample were classified into 10 stages in terms of the peak stress percent, which were 0~10%, 10~20% and so on. The post-peak and 90~100% were normalized into one stage, and the b-value and S-value were calculated. In addition, with increasing external stress, the b-value exhibited a downward tendency, while the S-value exhibited an upward tendency.
During the initial loading stage (0–40%), the coal samples were in the compaction and elastic stages, and the interior was mainly composed of the compaction and penetration of primary cracks and the development of a few microcracks. At this time, low-energy AE signals were mainly present, and the b-value showed a high fluctuation decline, while the S-value showed a low fluctuation rise.
During the middle loading stage (40–80%), the coal samples were in the plastic stage. Massive cracks were generated in the interior, which gradually expanded and penetrated, and the regional damage was severe. At this time, massive AE signals were generated, and the b-value exhibited a downward trend, while the S-value exhibited an upward trend.
During the late loading stage (80–100%), the coal samples were in the failure and post-peak stages, the internal cracks extended to the edges, forming a macro-fracture surface, and the broken blocks slipped along the fracture surface. At this stage, massive high-energy AE signals were induced, and the b-value rapidly decreased to a low value. In contrast, the S value rapidly increased to a continuously high value.
Therefore, the b-value presented a downward trend of fluctuating down-decreasing-continuously low value, and the S-value presented an upward trend of fluctuating up-increasing-continuously high value, corresponding to the elastic, plastic, and failure stages, respectively.
Comparing the changes in the two AE damage values of dry, different moisture content, and soaked water absorption samples, it was found that under the same stress level, the b-value of different coal samples met the requirements of bdry < bnaturally absorbed to unsaturated < bnaturally absorbed to saturated < bsoaked saturated. The S-value met the requirements of Sdry > Snaturally absorbed to unsaturated > Snaturally absorbed to saturated > Ssoaked saturated. This indicates that the internal crack scale and damage accumulation in the dry samples were the largest at the same external stress level. The internal crack number, scale, and damage accumulation in the soaked samples were the lowest. Under natural water absorption, with increasing moisture content, the number and scale of damage accumulation of internal cracks gradually decreased.

6. Conclusions

Four sets of AE mechanical experiments were conducted on dry, water-containing, and soaked coal samples with pre-treatment to investigate the impacts of water content and soaking on their mechanical characteristics, crack development laws, and AE damage characteristics. The following specific conclusions were drawn.
(1)
Under uniaxial compression, coal samples with different pre-treatments exhibited brittle failure. The peak strength, peak strain, elastic modulus, and deformation modulus decreased with increasing water erosion duration. As the moisture content increased, the mechanical parameters gradually decreased. The mechanical parameters of the samples with natural water absorption to saturation were higher than those of the samples with immersion to saturation. Thus, reinforcement was required for this part of the coal body in the support design of the underground reservoir dam.
(2)
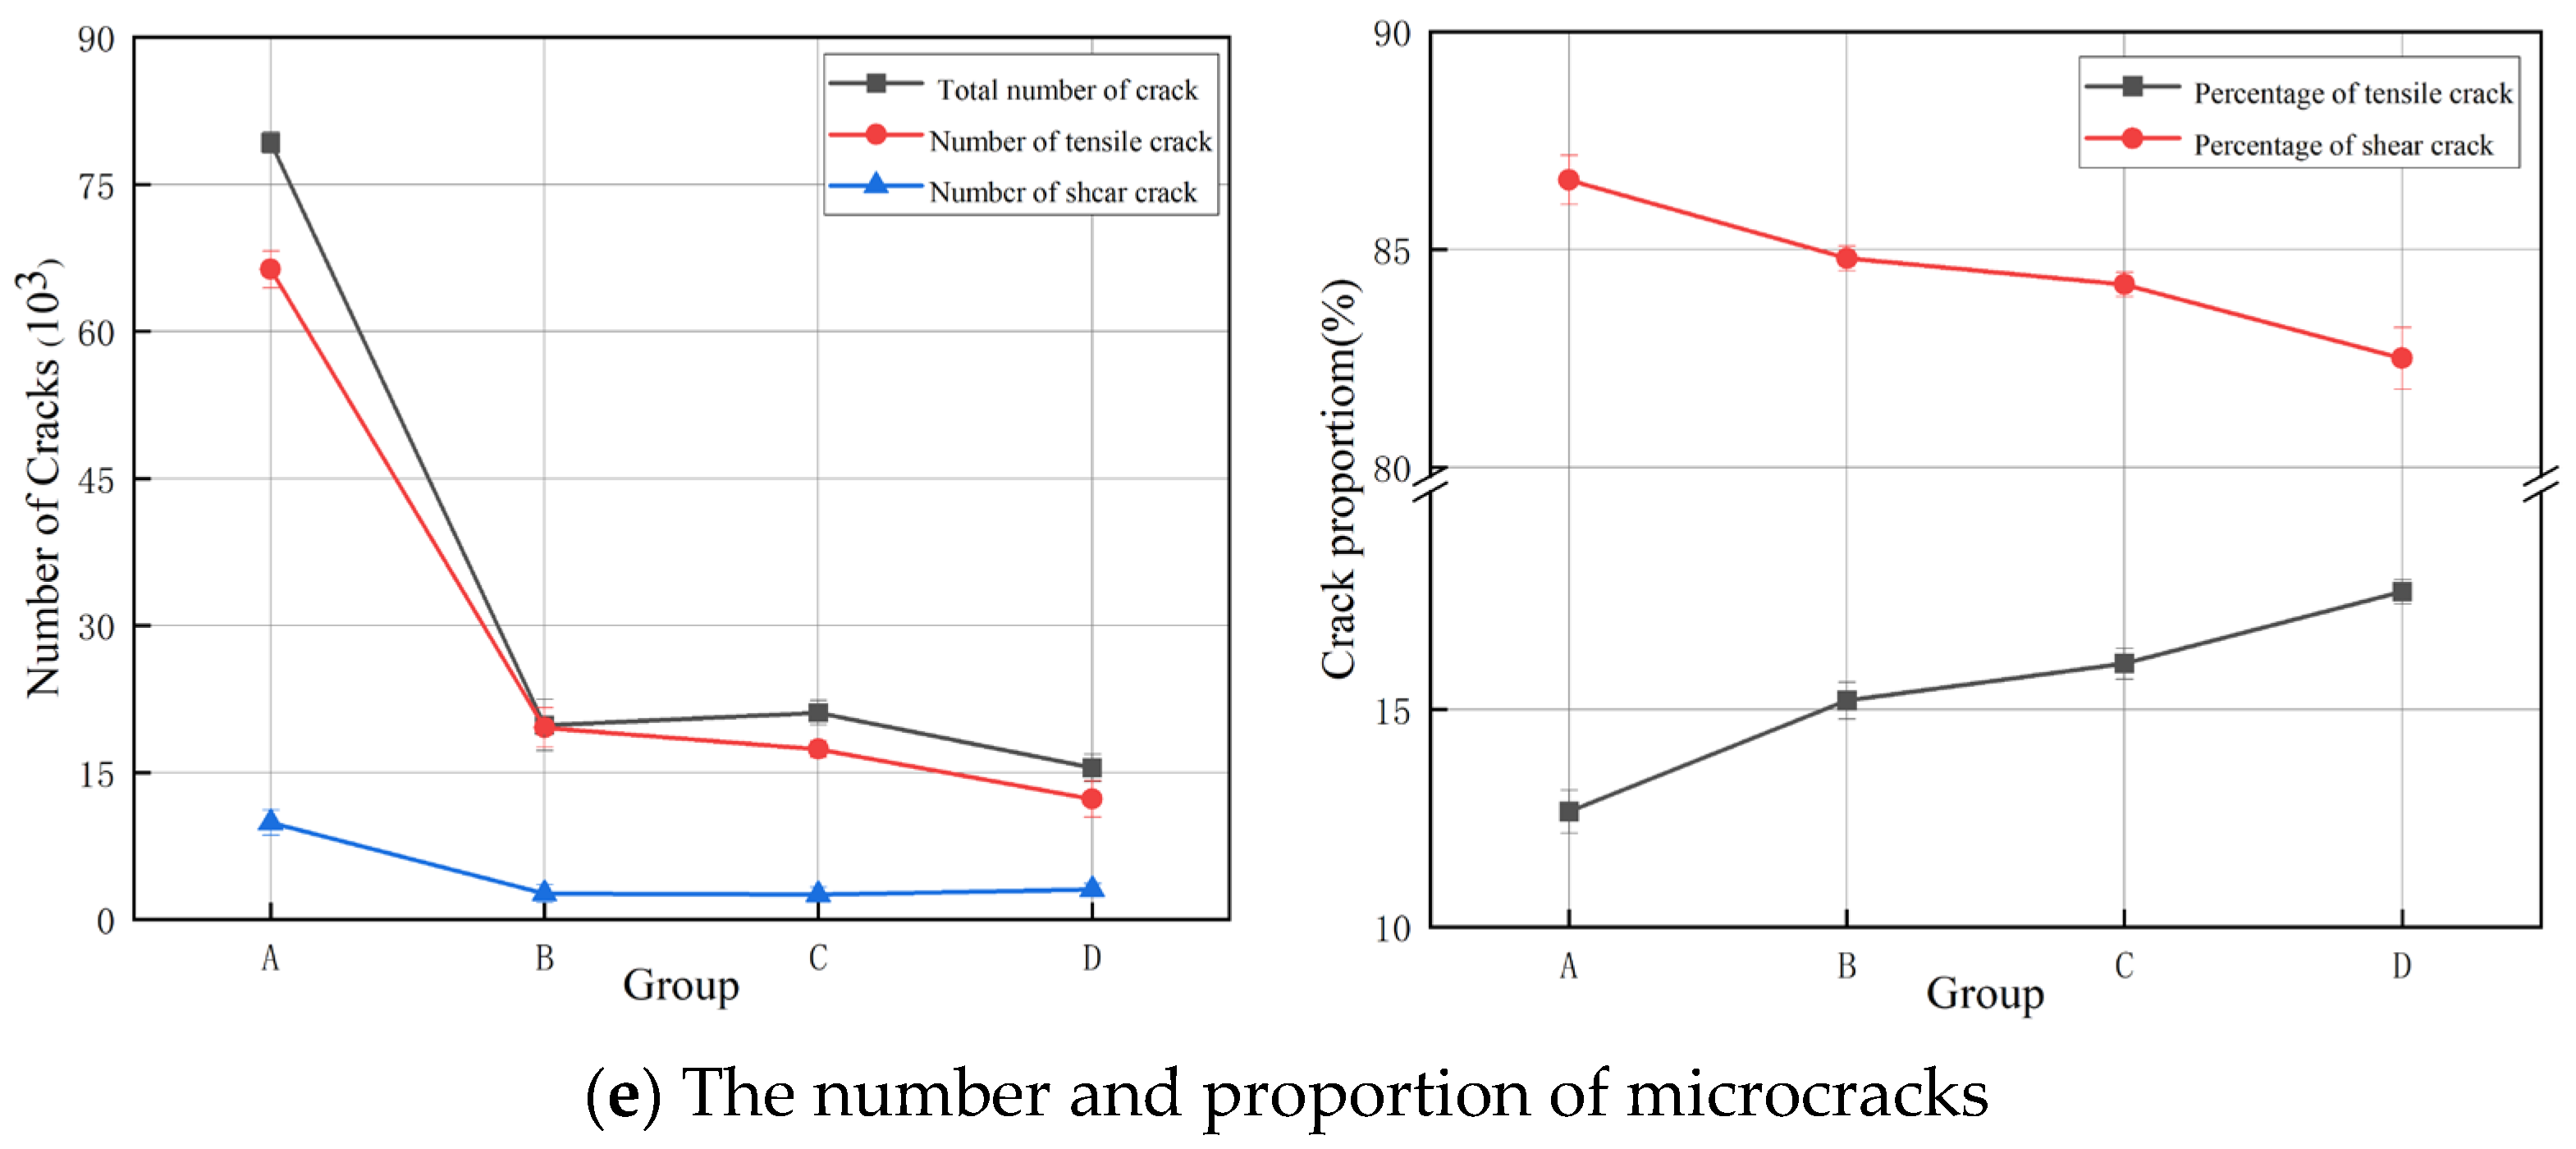
Under uniaxial compression, the samples exhibited tensile failure along the axial splitting. In the case of coal bodies subjected to prolonged immersion, spalling occurred during damage. With increasing moisture content, the sum of the cracks, tensile cracks, and shear cracks decreased progressively. The percentage of tensile cracks decreased progressively, whereas that of shear cracks increased progressively. Soaking water absorption was more likely to produce shear cracks than natural water absorption, and there was a greater tendency for shear cracks to be induced at higher water content.
(3)
During damage and failure, the b-value exhibited a downward trend of fluctuating down-decreasing-continuously low value, and the S-value exhibited an upward trend of fluctuating up-increasing-continuously high value, corresponding to the elastic, plastic, and failure stages of rocks, respectively. Under the same external stress level, the internal crack scale and damage accumulation in the dry samples were the largest, while the internal crack number, scale, and damage accumulation in the soaked samples were the smallest. Under natural water absorption, with increasing moisture content, the number and scale of damage accumulation of internal cracks gradually decreased. The mechanical properties of the samples significantly decreased with increasing moisture content (peak strength reduction from 12.3 to 7.2 MPa and elastic modulus decline from 1.45 to 0.78 GPa). AE monitoring effectively captured the damage evolution process, showing a 2.3-fold increase in crack density under soaked conditions compared to that in dry samples.
(4)
The proposed energy classification-spatial clustering characterization framework can be extended to multi-scale strain field validation using digital image correlation (DIC), where spatiotemporal correlations between surface deformation and internal microfractures may deepen the understanding of cross-scale damage mechanisms. Such a methodology based on AE-mechanical response synergy mapping is poised to advance the transition from empirical judgment to quantitative early warning in the long-term stability monitoring of underground reservoir coal pillars, offering both theoretical and technological support for groundwater conservation and green mining practices.
However, it should be noted that the current research has limited implications for providing useful references for coal pillar design and dam-body stability analysis. The tests and analyses conducted in this study were based on standard coal specimens recommended by the International Society for Rock Mechanics (ISRM). Further research is required to investigate the influence of coal type, strength, cyclic loading, and size effects on their mechanical behavior and damage processes. We intend to address these limitations in subsequent studies to provide valuable references for the design of underground pillar structures.

Author Contributions

M.S.: Writing—original draft, Formal analysis, Data curation, Conceptualization. Q.X.: Methodology, Funding acquisition, Conceptualization. H.H.: Visualization, Data curation, Funding acquisition. J.S.: Methodology, Conceptualization. X.Z.: Visualization, Conceptualization. Y.F. (Yuanfeng Fan): Visualization, Conceptualization. Y.F. (Yukuan Fan): Visualization, Conceptualization. J.M.: Data curation, Conceptualization. All authors have read and agreed to the published version of the manuscript.

Funding

This work was supported by the National Natural Science Foundation of China [grant number 52404153] and the Natural Science Foundation of Jiangsu Province [grant number BK20241649].

Data Availability Statement

The data presented in this study are available upon request from the corresponding author. The data are not publicly available due to laboratory regulations.

Conflicts of Interest

Authors Maoru Sun, Heng He, Jiqiang Shen, Xun Zhang and Yuanfeng Fan were employed by the company Banji Coalmine, China Coal Xinji Energy Co., Ltd. The remaining authors declare that the research was conducted in the absence of any commercial or financial relationships that could be construed as a potential conflict of interest.

References

  1. Guo, X.; Wang, X.; Zheng, D. Effect of coal consumption on the upgrading of industrial structure. Geofluids 2022, 2022, 4313175. [Google Scholar] [CrossRef]
  2. Yu, L.; Yao, Q.; Chong, Z.; Li, Y.; Xu, Q.; Xie, H.; Ye, P. Mechanical and micro-structural damage mechanisms of coal samples treated with dry–Wet cycles. Eng. Geol. 2022, 304, 106637. [Google Scholar] [CrossRef]
  3. Yao, Q.; Chen, T.; Tang, C.; Sedighi, M.; Wang, S.; Huang, Q. Influence of moisture on crack propagation in coal and its failure modes. Eng. Geol. 2019, 258, 105156. [Google Scholar] [CrossRef]
  4. Pan, Y.; Wu, G.; Zhao, Z.; He, L. Analysis of rock slope stability under rainfall conditions considering the water-induced weakening of rock. Comput. Geotech. 2020, 128, 103806. [Google Scholar] [CrossRef]
  5. Zhu, J.; Deng, J.; Chen, F.; Wang, F. Failure analysis of water-bearing rock under direct tension using acoustic emission. Eng. Geol. 2022, 299, 106541. [Google Scholar] [CrossRef]
  6. Verstrynge, E.; Adriaens, R.; Elsen, J.; Van Balen, K. Multi-scale analysis on the influence of moisture on the mechanical behavior of ferruginous sandstone. Constr. Build. Mater. 2014, 54, 78–90. [Google Scholar] [CrossRef]
  7. Yao, Q.; Chen, T.; Ju, M.; Liang, S.; Liu, Y.; Li, X. Effects of water intrusion on mechanical properties of and crack propagation in coal. Rock Mech. Rock Eng. 2016, 49, 4699–4709. [Google Scholar] [CrossRef]
  8. Shan, C.; Yao, Q.; Cao, S.; Xie, H.; Xu, Q.; Zheng, C.; Chen, X. Measurement of fracture development evolution of coal samples under acid-alkaline by three-dimensional reconstruction and AE time-frequency characteristic analysis. Measurement 2023, 217, 112944. [Google Scholar] [CrossRef]
  9. Qin, Z.; Fu, H.; Chen, X. A study on altered granite meso-damage mechanisms due to water invasion-water loss cycles. Environ. Earth Sci. 2019, 78, 1–10. [Google Scholar] [CrossRef]
  10. Eshiet, K.I.; Sheng, Y.; Ye, J. Microscopic modelling of the hydraulic fracturing process. Environ. Earth Sci. 2013, 68, 1169–1186. [Google Scholar] [CrossRef]
  11. Lin, Y.; Zhou, K.; Gao, F.; Li, J. Damage evolution behavior and constitutive model of sandstone subjected to chemical corrosion. Bull. Eng. Geol. Environ. 2019, 78, 5991–6002. [Google Scholar]
  12. Miao, S.; Cai, M.; Guo, Q.; Wang, P.; Liang, M. Damage effects and mechanisms in granite treated with acidic chemical solutions. Int. J. Rock Mech. Min. Sci. Géoméch. Abstr. 2016, 88, 77–86. [Google Scholar] [CrossRef]
  13. Zhang, L.; Wang, G.; Liu, B.; Sun, F.; Wang, R. Experimental investigation of the fracture evolution and fracture criterion of jointed sandstone subject to dry–wet cycling. Bull. Eng. Geol. Environ. 2023, 82, 101. [Google Scholar] [CrossRef]
  14. Cai, X.; Zhou, Z.; Tan, L.; Zang, H.; Song, Z. Fracture behavior and damage mechanisms of sandstone subjected to wetting-drying cycles. Eng. Fract. Mech. 2020, 234, 107109. [Google Scholar] [CrossRef]
  15. An, W.-b.; Wang, L.; Chen, H. Mechanical properties of weathered feldspar sandstone after experiencing dry-wet cycles. Adv. Mater. Sci. Eng. 2020, 2020, 6268945. [Google Scholar]
  16. Wang, C.; Pei, W.; Zhang, M.; Lai, Y.; Dai, J. Multi-scale experimental investigations on the deterioration mechanism of sandstone under wetting–drying cycles. Rock Mech. Rock Eng. 2021, 54, 429–441. [Google Scholar]
  17. Khanlari, G.; Abdilor, Y. Influence of wet–dry, freeze–thaw, and heat–cool cycles on the physical and mechanical properties of Upper Red sandstones in central Iran. Bull. Eng. Geol. Environ. 2015, 74, 1287–1300. [Google Scholar] [CrossRef]
  18. Zhang, F.; Jiang, A.; Yang, X. Shear creep experiments and modeling of granite under dry-wet cycling. Bull. Eng. Geol. Environ. 2021, 80, 5897–5908. [Google Scholar] [CrossRef]
  19. Wen, T.; Chen, X.; Shao, L. Effect of multiple wetting and drying cycles on the macropore structure of granite residual soil. J. Hydrol. 2022, 614, 128583. [Google Scholar] [CrossRef]
  20. Yu, F.; Tong, K.; Fu, Z.; Feng, G.; Zhou, Z.; Chen, S.; Dai, Z. Multi-scale deformation characteristics and mechanism of red-bed mudstone in dry-wet environment. Front. Earth Sci. 2022, 10, 974707. [Google Scholar] [CrossRef]
  21. Zhang, T.-j.; Zhang, L.; Li, S.-g.; Liu, J.-l.; Pan, H.-y.; Ji, X. Wave velocity and power spectral density of hole-containing specimens with different moisture content under uniaxial compression. Energies 2018, 11, 3166. [Google Scholar] [CrossRef]
  22. Chen, T.; Yao, Q.-l.; Wei, F.; Chong, Z.-h.; Zhou, J.; Wang, C.-b.; Li, J. Effects of water intrusion and loading rate on mechanical properties of and crack propagation in coal–rock combinations. J. Cent. South Univ. 2017, 24, 423–431. [Google Scholar] [CrossRef]
  23. Lu, X.; Yan, G. A Quasi-2D exploration of mixed-mode fracture propagation in concrete semi-circular chevron-notched disks. Buildings 2023, 13, 2633. [Google Scholar] [CrossRef]
  24. Daraei, A.; Zare, S. Determination of critical saturation degree in rocks based on maximum loss of uniaxial compression strength and deformation modulus. Géoméch. Geophys. Geo-Energy Geo-Resour. 2018, 4, 343–353. [Google Scholar] [CrossRef]
  25. Daraei, A.; Zare, S. Effect of water content variations on critical and failure strains of rock. KSCE J. Civ. Eng. 2018, 22, 3331–3339. [Google Scholar] [CrossRef]
  26. Cai, X.; Zhou, Z.; Liu, K.; Du, X.; Zang, H. Water-weakening effects on the mechanical behavior of different rock types: Phenomena and mechanisms. Appl. Sci. 2019, 9, 4450. [Google Scholar] [CrossRef]
  27. Wang, W.; Li, X.; Zhu, Q.; Shi, C.; Xu, W. Experimental study of mechanical characteristics of sandy slate under chemical corrosion. Rock Soil Mech. 2017, 38, 2559. [Google Scholar]
  28. Wang, M.; Guo, Q.; Tian, Y.; Dai, B. Physical and mechanical properties evolution of coal subjected to salty solution and a damage constitutive model under uniaxial compression. Mathematics 2021, 9, 3264. [Google Scholar] [CrossRef]
  29. Feng, X.T.; Ding, W. Coupled chemical stress processes in rock fracturing. Mater. Res. Innov. 2011, 15, s547–s550. [Google Scholar] [CrossRef]
  30. Feng, X.-T.; Chen, S.; Zhou, H. Real-time computerized tomography (CT) experiments on sandstone damage evolution during triaxial compression with chemical corrosion. Int. J. Rock Mech. Min. Sci. 2004, 41, 181–192. [Google Scholar] [CrossRef]
  31. Feng, X.-T.; Ding, W. Experimental study of limestone micro-fracturing under a coupled stress, fluid flow and changing chemical environment. Int. J. Rock Mech. Min. Sci. 2007, 44, 437–448. [Google Scholar] [CrossRef]
  32. Shan, C.; Yao, Q.; Zheng, C.; Xie, H.; Xu, Q.; Xia, Z.; Zou, S. Strength Degradation and Fracture Propagation of Repeatedly Immersed Artificial Dam Samples under Uniaxial Cyclic Loading–Unloading. ACS Omega 2023, 8, 2538–2555. [Google Scholar] [CrossRef] [PubMed]
  33. Yang, J.; Mu, Z.-L.; Yang, S.-Q.; Tian, W.-L. Experimental investigation of microscopic crack development and damage characteristics of sandstone based on acoustic emission characteristic parameters. Géoméch. Geophys. Geo-Energy Geo-Resour. 2022, 8, 51. [Google Scholar] [CrossRef]
  34. Yang, J.; Mu, Z.-L.; Yang, S.-Q. Experimental study of acoustic emission multi-parameter information characterizing rock crack development. Eng. Fract. Mech. 2020, 232, 107045. [Google Scholar] [CrossRef]
  35. Yang, J.; Yang, S.-Q.; Liu, G.-J.; Tian, W.-L.; Li, Y. Experimental study of crack evolution in prefabricated double-fissure red sandstone based on acoustic emission location. Géoméch. Geophys. Geo-Energy Geo-Resour. 2021, 7, 1–20. [Google Scholar] [CrossRef]
  36. Lockner, D. The role of acoustic emission in the study of rock fracture. Int. J. Rock Mech. Min. Sci. Geomech. Abstr. 1993, 30, 883–899. [Google Scholar] [CrossRef]
  37. Soulioti, D.; Barkoula, N.; Paipetis, A.; Matikas, T.; Shiotani, T.; Aggelis, D. Acoustic emission behavior of steel fibre reinforced concrete under bending. Constr. Build. Mater. 2009, 23, 3532–3536. [Google Scholar] [CrossRef]
  38. Shiotani, T.; Ohtsu, M.; Ikeda, K. Detection and evaluation of AE waves due to rock deformation. Constr. Build. Mater. 2001, 15, 235–246. [Google Scholar] [CrossRef]
  39. Shiotani, T. Evaluation of long-term stability for rock slope by means of acoustic emission technique. NDT E Int. 2006, 39, 217–228. [Google Scholar] [CrossRef]
  40. Ohno, K.; Ohtsu, M. Crack classification in concrete based on acoustic emission. Constr. Build. Mater. 2010, 24, 2339–2346. [Google Scholar] [CrossRef]
  41. Bagirov, A.M. Modified global k-means algorithm for minimum sum-of-squares clustering problems. Pattern Recognit. 2008, 41, 3192–3199. [Google Scholar] [CrossRef]
  42. Carrasco, Á.; Méndez, F.; Leaman, F.; Molina Vicuña, C. Short review of the use of acoustic emissions for detection and monitoring of cracks. Acoust. Aust. 2021, 49, 273–280. [Google Scholar] [CrossRef]
  43. Li, P.; Ren, F.-H.; Cai, M.-F.; Guo, Q.-F.; Wang, H.-F.; Liu, K. Investigating the mechanical and acoustic emission characteristics of brittle failure around a circular opening under uniaxial loading. Int. J. Miner. Met. Mater. 2019, 26, 1217–1230. [Google Scholar] [CrossRef]
  44. Chu, C.; Wu, S.; Zhang, C.; Zhang, Y. Microscopic damage evolution of anisotropic rocks under indirect tensile conditions: Insights from acoustic emission and digital image correlation techniques. Int. J. Miner. Met. Mater. 2023, 30, 1680–1691. [Google Scholar] [CrossRef]
  45. Wei, H.; Liu, Y.; Li, J.; Wang, F.; Zheng, J.; Yuan, Z. Characterizing fatigue damage evolution in asphalt mixtures using acoustic emission and Gaussian mixture model analysis. Constr. Build. Mater. 2023, 409, 133973. [Google Scholar] [CrossRef]
  46. Luo, T.; Chen, S.; Li, B. Experimental Investigation on the Destruction Features and Acoustic Characteristics of a Brittle Rock Sample Containing Both 2D and 3D Preset Flaws. Appl. Sci. 2023, 13, 12705. [Google Scholar] [CrossRef]
  47. Liu, X.; Zeng, Y.; Xia, C.; Liu, H.; Xie, Q.; Zhong, Y. Influence of specimen size on granite fracture characteristics and acoustic emission phenomena under mode I loading conditions. Theor. Appl. Fract. Mech. 2023, 128, 104106. [Google Scholar] [CrossRef]
Figure 1. Test sample preparation process.
Processes 13 02196 g001
Figure 2. Schematic diagram of reservoir formation and occurrence environment of pillar dam body in the goaf of a coal mine.
Processes 13 02196 g002
Figure 3. Schematic diagram of coal sample pre-treatment.
Processes 13 02196 g003
Figure 4. Surface characteristics of coal samples with microscopic structures under various water immersion methods.
Processes 13 02196 g004aProcesses 13 02196 g004b
Figure 5. Test equipment.
Processes 13 02196 g005
Figure 6. Stress-strain curves.
Processes 13 02196 g006
Figure 7. Strength and deformation parameters.
Processes 13 02196 g007
Figure 9. Characteristic parameters of AE.
Processes 13 02196 g009
Figure 10. Classification and evolution of microcracks in different pretreated coal samples.
Processes 13 02196 g010aProcesses 13 02196 g010b
Figure 11. Evolution curve of AE damage index.
Processes 13 02196 g011
Table 1. Alphabetic order.
Term NameSymbol/AbbreviationEquation No.Definition/Description
Energy ThresholdsE1, E2, E3, E4Figure 8eAE energy classification: 0–103 aJ, 103–104 aJ, 104–105 aJ, >105 aJ.
Squared Error Function J (1)Sum of squared distances between data points and cluster centroids in K-means clustering.
Gutenberg-Richter Relation lg N = a b M (2)Relationship between seismic event frequency (N) and magnitude (M).
AE Amplitude-Magnitude Conversion M i = m s i / 20 (3)Conversion of AE event amplitude to equivalent magnitude.
b-value (Maximum Likelihood) lg N i = a b m s i / 20 (4)Damage index based on AE amplitude distribution, reflecting the crack scale variation rate.
b-value (Least Squares) b = i = 1 n m s i 20 i = 1 n l g N i n i = 1 n m s i 20 l g N i n i = 1 n l g 2 N i ( i = 1 n l g N i ) 2 (5)AE damage index calculated via linear regression.
Seismic Activity S-value S = 0.117 lg ( N + 1 ) + 0.029 lg 1 N i = 1 N 10 1.5 M i + 0.015 M (6)Integrated metric combining seismic frequency (N), average magnitude, and peak magnitude.
AE-based S-value S = 0.117 lg ( n + 1 ) + 0.029 lg 1 n i = 1 n 10 0.075 m s i + 0.00075 m s (7)Weighted composite index of AE signal amplitudes.
Table 2. Basic physical parameters of coal samples.
Scheme IDSample IDHeight
(mm)
Diameter (mm)Pre-Processed Quality (g)Post-Processed Quality (g)Pre-Processed
P-Wave
Velocity (m/s)
Post-Processed P-Wave Velocity (m/s)Moisture Content (%)
AMA3-149.44101.42260.93260.9317891789/
MA3-249.5699.25251.06251.0617981798
MA3-349.4999.54252.02252.0217791779
BMB3-149.2499.24255.76265.71174516343.78
MB3-249.3599.32258.19267.5918211738
MB3-349.4299.36252.61262.2317581660
CMC3-149.68101.23264.55278.39176015204.86
MC3-249.7299.86254.46266.0618111582
MC3-349.8199.76251.13263.1617781552
DMD3-149.68101.31258.14274.97182614566.34
MD3-249.75101.21258.41274.1217431423
MD3-349.92101.16258.79275.4017671427
Table 3. Classification results of microcracks in different pretreated coal samples.
GroupCrack CountTensile Crack
Count
Shear Crack
Count
Tensile Crack Proportion
(%)
Shear Crack Proportion
(%)
MA3-191,85181,16910,68288.3711.63
MA3-278,93467,78811,14685.8814.12
MA3-365,04654,24310,80383.3916.61
Mean value78,61067,73310,87785.8814.12
MB3-124,05319,967408683.0116.99
MB3-221,70318,415328884.8515.15
MB3-319,38016,704267686.1913.81
Mean value21,71218,362335084.9515.05
MC3-121,05018,331271987.0812.92
MC3-220,18516,905328083.7516.25
MC3-319,44916,034341582.4417.56
Mean value20,22817,090313884.4215.58
MD3-118,02115,318270385.0015.00
MD3-216,60513,650295582.2017.80
MD3-315,19812,180301880.1419.86
Mean value16,60813,716289282.4517.55
Disclaimer/Publisher’s Note: The statements, opinions and data contained in all publications are solely those of the individual author(s) and contributor(s) and not of MDPI and/or the editor(s). MDPI and/or the editor(s) disclaim responsibility for any injury to people or property resulting from any ideas, methods, instructions or products referred to in the content.

