Article

Mechanism Analysis and Evaluation of Formation Physical Property Damage in CO2 Flooding in Tight Sandstone Reservoirs of Ordos Basin, China

1
Research Institute of Yanchang Petroleum (Group) Co., Ltd., Xi’an 710065, China
2
Department of Geology, Northwest University, Xi’an 710069, China
*
Author to whom correspondence should be addressed.
Processes 2025, 13(7), 2320; https://doi.org/10.3390/pr13072320
Submission received: 12 June 2025 / Revised: 10 July 2025 / Accepted: 16 July 2025 / Published: 21 July 2025
(This article belongs to the Section Energy Systems)

Abstract

Capturing CO2 emitted by coal chemical enterprises and injecting it into oil reservoirs not only effectively improves the recovery rate and development efficiency of tight oil reservoirs in the Ordos Basin but also addresses the carbon emission problem constraining the development of the region. Since initiating field experiments in 2012, the Ordos Basin has become a significant base for CCUS (Carbon capture, Utilization, and Storage) technology application and demonstration in China. However, over the years, projects have primarily focused on enhancing the recovery rate of CO2 flooding, while issues such as potential reservoir damage and its extent have received insufficient attention. This oversight hinder the long-term development and promotion of CO2 flooding technology in the region. Experimental results were comprehensively analyzed using techniques including nuclear magnetic resonance (NMR), X-ray diffraction (XRD), scanning electron microscopy (SEM), inductively coupled plasma (ICP), and ion chromography (IG). The findings indicate that under current reservoir temperature and pressure conditions, significant asphaltene deposition and calcium carbonate precipitation do not occur during CO2 flooding. The reservoir’s characteristics-high feldspar content, low carbon mineral content, and low clay mineral content determine that the primary mechanism affecting physical properties under CO2 flooding in the Chang 4 + 5 tight sandstone reservoir is not, as traditional understand, carbon mineral dissolution or primary clay mineral expansion and migration. Instead, feldspar corrosion and secondary particles migration are the fundamental reasons for the changes in reservoir properties. As permeability increases, micro pore blockage decreases, and the damaging effect of CO2 flooding on reservoir permeability diminishes. Permeability and micro pore structure are therefore significant factors determining the damage degree of CO2 flooding inflicts on tight reservoirs. In addition, temperature and pressure have a significant impact on the extent of reservoir damage caused by CO2 flooding in the study region. At a given reservoir temperature, increasing CO2 injection pressure can mitigate reservoir damage. It is recommended to avoid conducting CO2 flooding projects in reservoirs with severe pressure attenuation, low permeability, and narrow pore throats as much as possible to prevent serious damage to the reservoir. At the same time, the production pressure difference should be reasonably controlled during the production process to reduce the risk and degree of calcium carbonate precipitation near oil production wells.

1. Introduction

With the rapid advancement of the global socio-economic landscape and the depletion of conventional oil and gas reserves, unconventional resources such as tight oil and gas, shale oil and gas, and coalbed gas have progressively emerged as pivotal elements in ensuring energy security, ecological sustainability, and economic progress across nations [1,2,3,4]. Among these unconventional resources, tight oil holds significant importance due to its increasingly prominent contribution. Data from a fresh round of evaluation on oil and gas reserves reveals that tight oil accounts for approximately 40% of China’s recoverable oil resources, primarily concentrated in four basins: Ordos, Sichuan, Bohai Bay, and Songliao [5]. However, due to low permeability, complex reservoir structure, and strong heterogeneity, conventional water injection development in tight reservoirs often encounters challenges such as high injection pressure and ineffective displacement. Consequently, recovery rates are generally low, leaving a large amount of remaining oil trapped in the reservoir and cannot be produced out [6,7].
Injecting captured CO2 into oil reservoirs can not only reduce crude oil viscosity, lower interfacial tension, supplement formation energy, effectively improve oil recovery, create considerable economic benefits, but also achieve long-term geological storage of CO2 [8,9]. Against the backdrop of global advocacy for carbon emissions reduction, CO2 displacement and geological storage technologies have garnered increasing attention and have been applied and promoted in many countries [10,11,12,13]. CO2 flooding is suitable for a wide range of oil reservoirs, particularly tight reservoirs with poor water injection. This approach not only resolves injection challenges, but also effectively mobilizes residual oil, significantly enhancing development efficiency [14,15,16]. However, CO2 miscible flooding demonstrates superior oil displacement efficiency and CO2 storage performance compared to immiscible flooding. Achieving miscibility typically requires reservoir depths exceeding 1000 m. Although the effectiveness of CO2 flooding in improving oil recovery is widely recognized, the adverse effects of CO2-formation fluid–rock interactions on reservoirs must be considered, as they directly affect subsequent development effect of reservoirs [17,18]. Overall, research on CO2 injection impacts primarily focuses on two aspects: (1) Reservoir damage from asphaltene deposition induced by CO2—crude oil interactions and its effect on reservoir properties; and (2) reactions of CO2, formation water, and rocks, and their impact on reservoir properties. So, there are two significant issues that require attention: (1) The law of asphaltene deposition caused by the interaction between CO2 and crude oil under different reservoir conditions and injection conditions, and the degree of its impact on reservoir properties. (2) For different types reservoirs, the principle of the interactions of CO2, formation water, and rocks, and the extent of its influence on reservoir properties. Clarifying these issues can provide a scientific basis for CO2 flooding engineering design, improve reservoir management, and development levels.
At present, the impact of CO2 injection on reservoir properties is usually evaluated through experiments and mathematical simulations [19,20,21,22]. Through static reaction experiments and dynamic displacement experiments, Zhao F. et al. [23] found that the asphaltene precipitation generated by the interaction of CO2 and crude oil reduces oil displacement efficiency and recovery rate. The higher the asphaltene content in crude oil, the lower the oil displacement efficiency and recovery rate. Zhao Y.C. et al. [24] carried out CO2 immiscible flooding experiment using artificial rock cores. High-resolution images of asphaltene precipitation were obtained using an X-ray micro-CT scanner, and it was found that the asphaltene deposition causes changes in reservoir wettability, reducing crude oil flow capacity, porosity, and permeability. Li R.T. et al. [25] conducted experimental studies on the asphaltene deposition during CO2 flooding in ultra-low permeability reservoirs. The results from both static reaction and dynamic displacement experiments showed that with increasing of temperature and asphaltene content, asphaltene precipitation increased, enhancing damage to porosity and permeability; as pressure increases, asphaltene precipitation and reservoir damage show a trend of first increasing and then decreasing, reaching a peak near the minimum mixing pressure. Qian K. et al. [26] and Chen W. et al. [27] used nuclear magnetic resonance technology to study pore throat blockage by asphaltene deposition during CO2 flooding. The results showed that in the CO2 immiscible flooding stage, with the increase in pressure, the amount of asphaltene precipitation increased, and blockage mainly occurred in larger pores; when pressure exceeds the minimum mixing pressure, the precipitation of asphaltene hardly increases, but smaller pore blockage becomes significant. Behbahani T.J. et al. [20,28] studied the asphaltene deposition of miscible CO2 flooding processes in a tight sandstone core sample saturated by Iranian bottom hole live oil. The results indicate that 20–40% permeability reduction was caused by asphaltene deposition during a slow process, whereas 60–80% of formation damage is due to mechanical plugging and takes place in a short time. Furthermore, rock sample analysis through scanning electron microscopy and elemental analysis revealed asphaltene adsorption occurs as multilayer within the formation. A modified model based on multilayer adsorption theory was built. Compared with the experimental results, the prediction accuracy is higher. However, it should be noted that the applicability of the model needs to be verified.
To study water–rock interactions during CO2 flooding, Shiraki R. et al. [29] performed a displacement experiment using sandstone rock samples from the Tensleep formation, Wyoming, USA. The results indicate that the dissolution reactions of dolomite mainly occurred during the displacement process, and that the migration of clay mineral particles is the main cause of pore throat blockage and reservoir damage. The impact of CO2 flooding on reservoirs varies depending on the type of formation water. Tang Y.Q. et al. [30] conducted static reaction experiments of CO2, formation water and rock debris, as well as displacement experiments to study mineral dissolution and mobilization during CO2 injection into the sandstone reservoir of the Pucheng Oilfield, China. The static reaction experiment results demonstrated significant changes in rock minerals after experiments, with calcite content and feldspar content reduced, clay minerals content increased, and quartz content changed only slightly. For low-permeability reservoirs, secondary migration of minerals can cause severe blockage of pore throats and a significant decrease in permeability. For middle-high permeability reservoirs, most secondary mineral particles generated by dissolution can be carried out of the formation, improving the permeability. Han J. et al. [31] conducted CO2 miscible flooding experiments using carbonate rocks (homogeneous and heterogeneous, with similar mineral compositions and calcite content exceeding 98%), and analyzed changes in rock porosity, permeability, and pore structure before and after displacement using techniques such as X-ray CT and SEM. The results indicate that injection of CO2 causes dissolution of calcite and generates mineral precipitation, but its impact on homogeneous reservoirs with low permeability (2.1 md) is relatively small, and permeability is slightly improved; on the contrary, it has a significant impact on the pore structure of heterogeneous reservoirs with high permeability (36.8 md), severely reducing reservoir permeability, fluid injection capacity and flow capacity. Oil displacement effect of the former reservoir is obviously better than that of the latter. To effectively study reservoir changes along the CO2 displacement direction, Narayanan P. et al. [32] developed a “long tube apparatus” and analyzed the water and salt content in different parts of the pipeline before and after displacement to determine the impact of CO2 flooding on the reservoir. The results showed that salt precipitation only occurred in the middle section of the tube, and CO2 flooding did not have a significant impact on pressure drop. However, the permeability of the sand tube is very high and the experiment does not consider factors such as rock composition and pore throat structure, so it cannot explain the principles of reservoir property changes or accurately evaluate reservoir damage. In addition, the research results of many scholars [33,34,35,36,37] also indicate that CO2 injection can cause salt precipitation and particle migration, significantly impacting reservoir properties.
In summary, the damage mechanism of CO2 flooding to reservoirs is intricate and multifaceted. The properties of oil, physical properties of the reservoir, rock and mineral composition, gas injection methods, and injection conditions all exert an influence [38,39,40,41,42,43]. Therefore, targeted research is imperative. However, current research on CO2 flooding reveals a systematic knowledge gap regarding reservoir damage mechanisms, controlling factors, impact patterns, mitigation strategies, and countermeasures. For instance, most studies focus on how water–rock interactions after CO2 injection affect reservoir porosity and permeability yet fail to comprehensively analyze the underlying mechanisms through integrated changes in formation fluid properties, rock micro-characteristics, and mineral composition. Few studies explain the intrinsic causes of pore throat plugging damage in cores with varying permeability after fluid–rock reactions. Furthermore, existing research lacks investigation into CO2-induced reservoir damage under injection–production pressure fluctuations and fails to effectively guide field applications. To address these limitations, this study systematically investigates water–rock interactions during CO2 injection based on asphaltene deposition experiments within the CCUS project in the Ordos Basin tight sandstone reservoirs. The work comprehensively reveals the primary causes, mechanisms, controlling factors, and impact patterns of CO2 injection-induced reservoir damage in these formations, thereby bridging previous gaps of incomplete variables and unclear mechanistic pathways.
The Ordos Basin has inherent advantages in developing CCUS technology. Firstly, the basin has abundant oil and gas resources suitable for CO2 flooding and possesses huge geological storage capacity for CO2. Secondly, the region has numerous large coal chemical enterprises that produce high-concentration CO2 annually. This synergy not only generate huge economic benefits but also improve the ecological environment while achieving the goal of reducing carbon emissions. Since initiating CO2 injection in 2015, the study area has become one of the most representative CCUS technology application demonstration bases in the Ordos Basin. To date, the pilot area has conducted experiments evaluating CO2 and crude oil interactions under reservoir temperature and different pressure conditions. The results indicate that injected CO2 mainly extracts the light components (Figure 1) with almost no asphaltene precipitation (Figure 2) under reservoir conditions (45 °C, 10 MPa).
However, as mentioned earlier, the damage of CO2 injection to reservoirs is not limited only to asphaltene precipitation, but also includes rock–fluid interactions. Thus, the influence mechanism and degree of long-term gas injection on the reservoir are still unclear. Conducting detailed and in-depth research is extremely urgent. In this paper, the CO2-formation water–rock reaction mechanism, the influence on reservoir pore throat structure, and the damage of reservoir physical properties were systematically analyzed by dissolution reaction experiments and displacement experiments, and combining nuclear magnetic resonance (NMR), X-ray diffraction (XRD), scanning electron microscope (SEM), inductively coupled plasma spectrometer (ICP), and ion chromatograph (IG), which will provide a theoretical basis for the design of CO2 flooding project in the Ordos Basin.

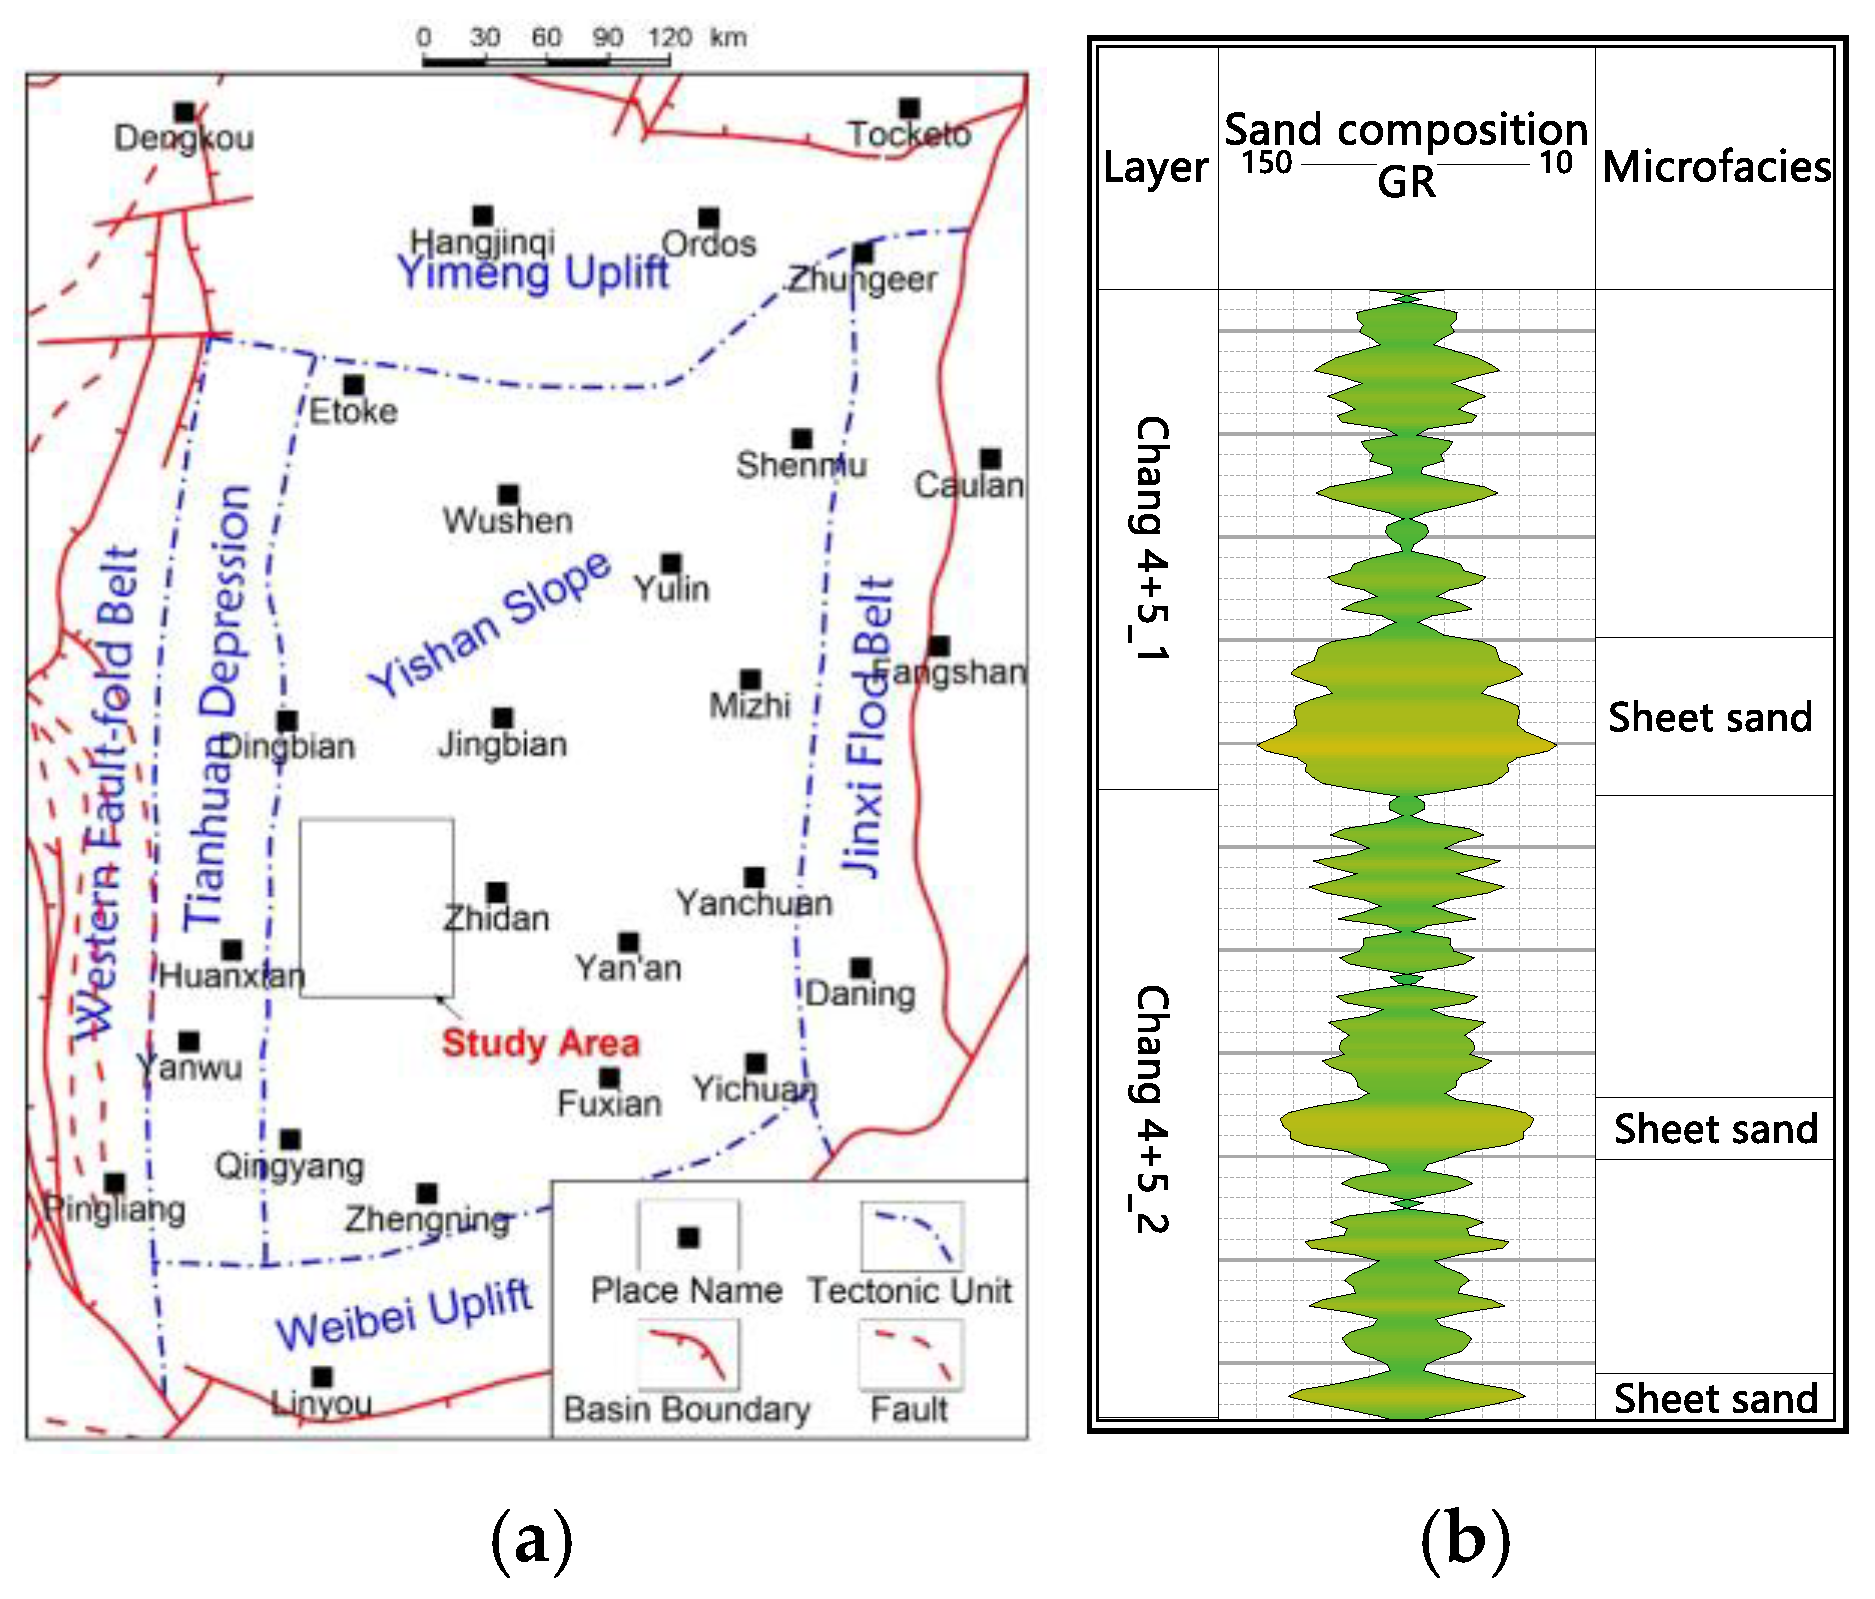
2. Geological Background

The Ordos basin, as the second largest oil-bearing basin in China, formed through compound superposition of two major tectonic dynamic systems. Constrained by the north–south Helan–Sichuan–Yunnan structural system and the east–west Qilian–Qinling–Dabie structural system, it exhibits a rectangular distribution pattern. According to tectonic morphology and evolution history, the basin can be divided into six tectonic units: the Western fault-ford belt, Tianhuan depression, Yishan slope, Jinxi fold belt, Yimeng uplift, and Weibei uplift. The WQ block studied in this paper is located in the central south of the northern Yishan slope in the basin in terms of regional structure (Figure 3).
The WQ region is a key area for regional research due to its favorable oil source conditions. During the middle and late Triassic Yanchang period, this area underwent a complete sedimentary cycle of lake basin formation, development, prosperity, stability, shrinkage, and extinction. During the formation of the lake basin, deposition gradually evolved from early fluvial facies (Chang 10 formation) to fluvial–lacustrine facies (Chang 9 formation). The Chang 7 period reached its peak, with the lake basin achieving its largest range and deepest water. A set of gray-black mudstone and oil shale about 50 to 100 m thick was deposited, which was the main period of the formation of the source rock in the basin. The research area is located within the Chang 7 main source rock distribution area and has sufficient oil source conditions. The interval from Chang 6 to Chang 4 + 5 was the period of stable development of the lake basin. The delta around the basin developed and retreated, and the sand–mudstone interbedded system created favorable conditions for the formation of reservoir-cover. Under the influence of the Western Fault-fold Belt, vertical faults formed during the Yanshanian period, and their associated microfractures cut through the Mesozoic strata. During the Early Cretaceous, hydrocarbons from the Chang 7 shale migrated along these faults and microfractures to the Chang 4 + 5 layer, leading to the formation of early oil reservoirs within lithologic traps. In the Cenozoic era, tectonic activities were relatively weak, and the faults were predominantly subjected to compressional and torsional stresses. Following brittle fracture of rocks, they underwent diagenetic recementation, resulting in a tight and sealed environment conducive to hydrocarbon preservation. As a result, this period marked the most important oil and gas exploration target within the Mesozoic strata.
During the evolution of the basin, the WQ region was at the center of oil generation during the Chang 4 + 5 sedimentary period. It had abundant material sources and favorable reservoir-capping conditions. As a result, it formed a well-sealed lithologic reservoir with huge resource potential, becoming one of the most important tight oil and gas producing layers in the Mesozoic strata. In the study area, the average thickness of the Chang 4 + 5 reservoir is approximately 5 m, with permeability ranging from 0.003 to 3.65 × 10⁻³ μm2 and an average value of 0.62 × 10⁻³ μm2. Porosity distribution ranges from 2.67% to 14.91%, with an average of 11.21%, as shown in Figure 4. This reservoir exemplifies the typical characteristics of tight sandstone reservoirs in the Ordos Basin, with feldspar sandstone predominating. The XRD quantitative phase analysis results (Figure 5) show that the Chang 4 + 5 tight sandstone reservoir in the study area has a relatively high albite content, averaging 51.64%. Quartz and K-feldspar are secondary, with average contents of 26.34% and 13.87%, respectively. It also contains the acid-sensitive mineral ankerite and minor clay minerals. The clay minerals are primarily chlorite, kaolinite, illite, chlorite/smectite mixed-layer, and minor illite/smectite mixed-layer. Chlorite has an average relative content of 67.39%; kaolinite averages 10.10%; and illite averages 7.05%. No discrete smectite was detected; smectite exists primarily within the chlorite/smectite and illite/smectite mixed-layer minerals. The chlorite/smectite mixed-layer relative content ranges from 8.00% to 21.00%, averaging 12.59%. The illite/smectite mixed-layer has a lower relative content, averaging 2.87%.

3. Materials and Methods
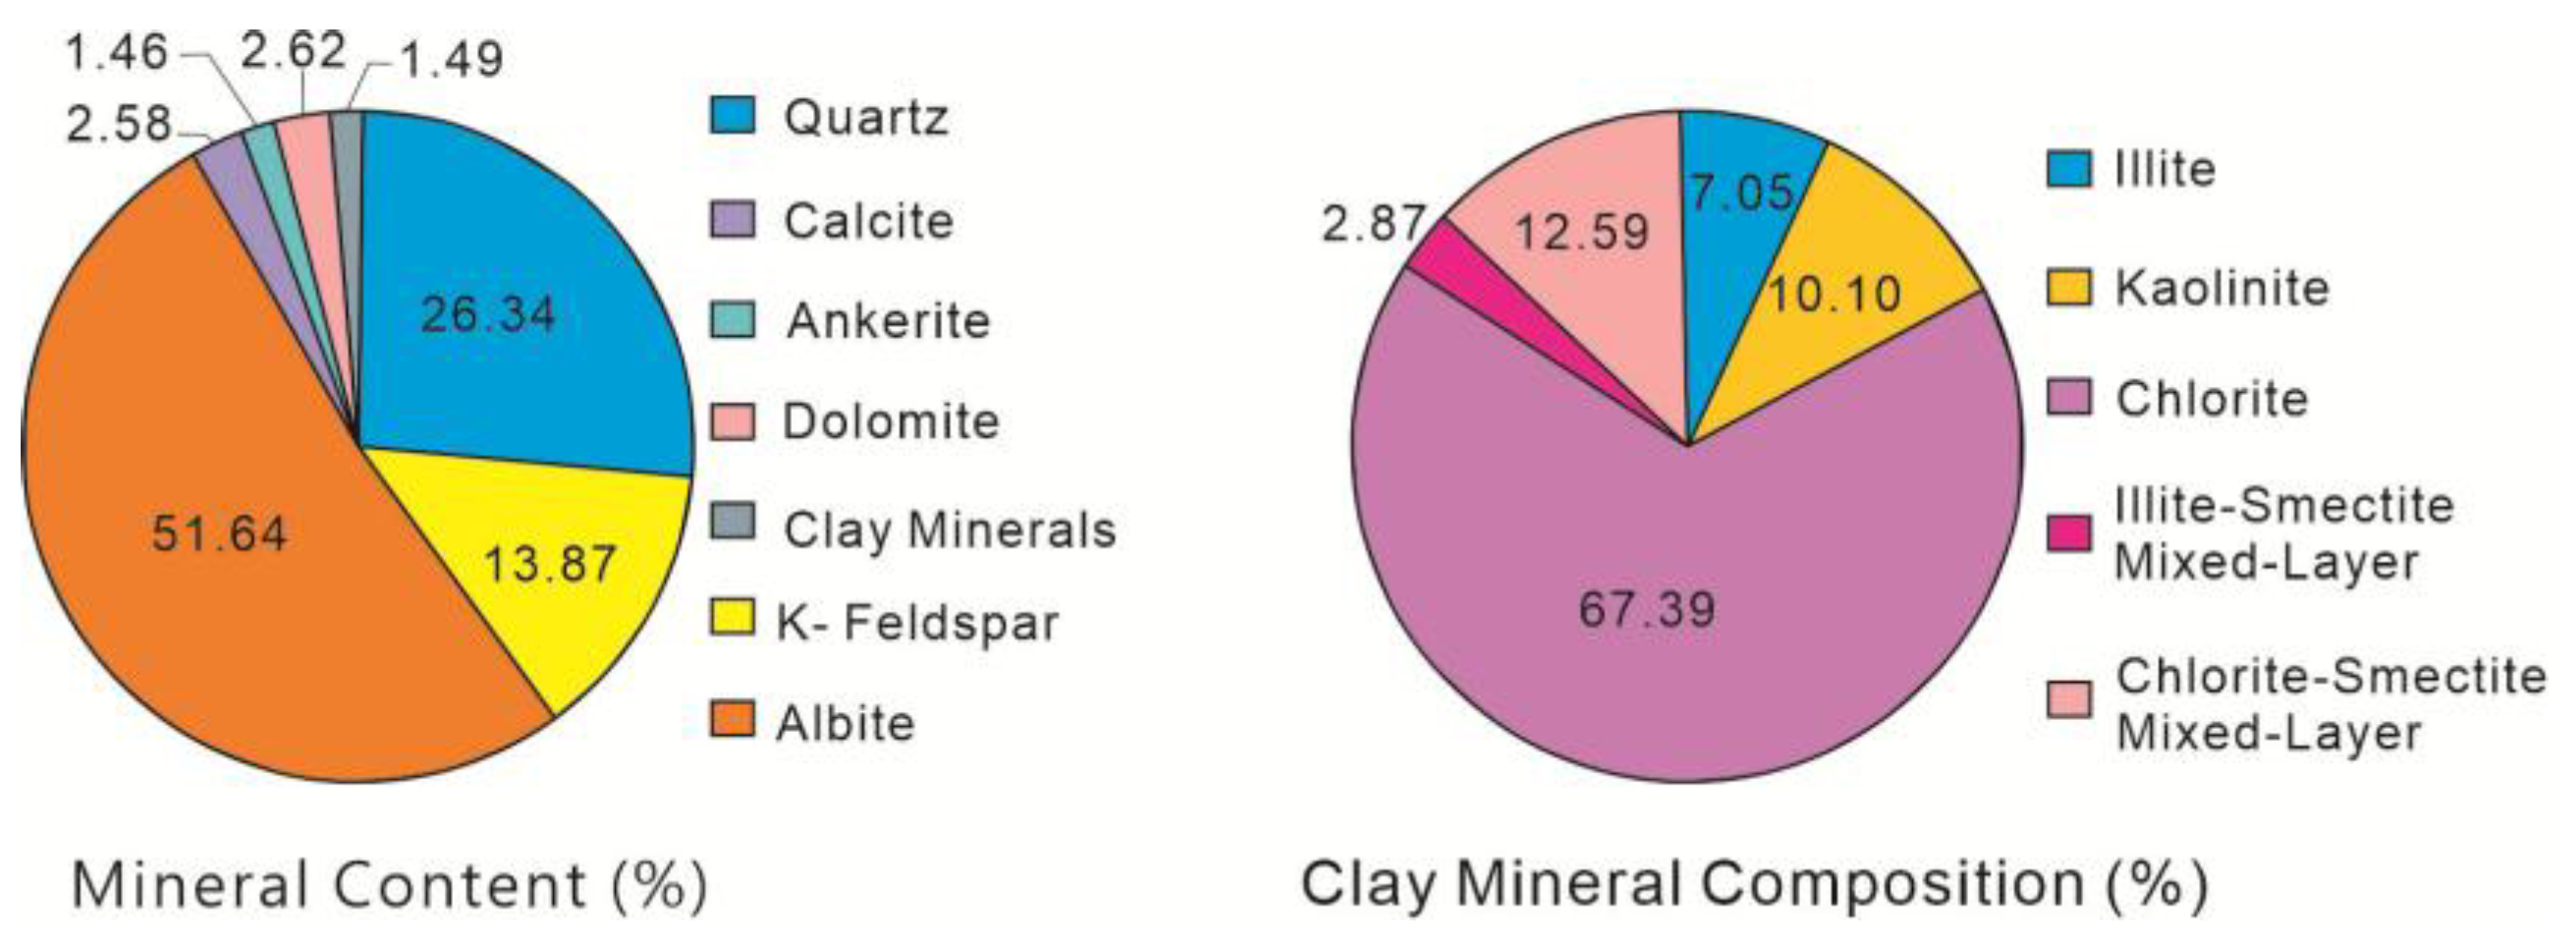
3.1. Materials

The oil, formation water, and rock samples used in the experiments were all from the Chang 4 + 5 reservoir in the WQ area. The density of crude oil under formation conditions is 0.7816 g/cm3, and the viscosity is 2.5 mPa·S. The basic physical property parameters of cores and the formation water composition are shown in Table 1 and Table 2, respectively. The CO2 (99.99% pure) was supplied by the Antaike Gas Company, Qingdao, Shandong, China.

3.2. Apparatus and Methods

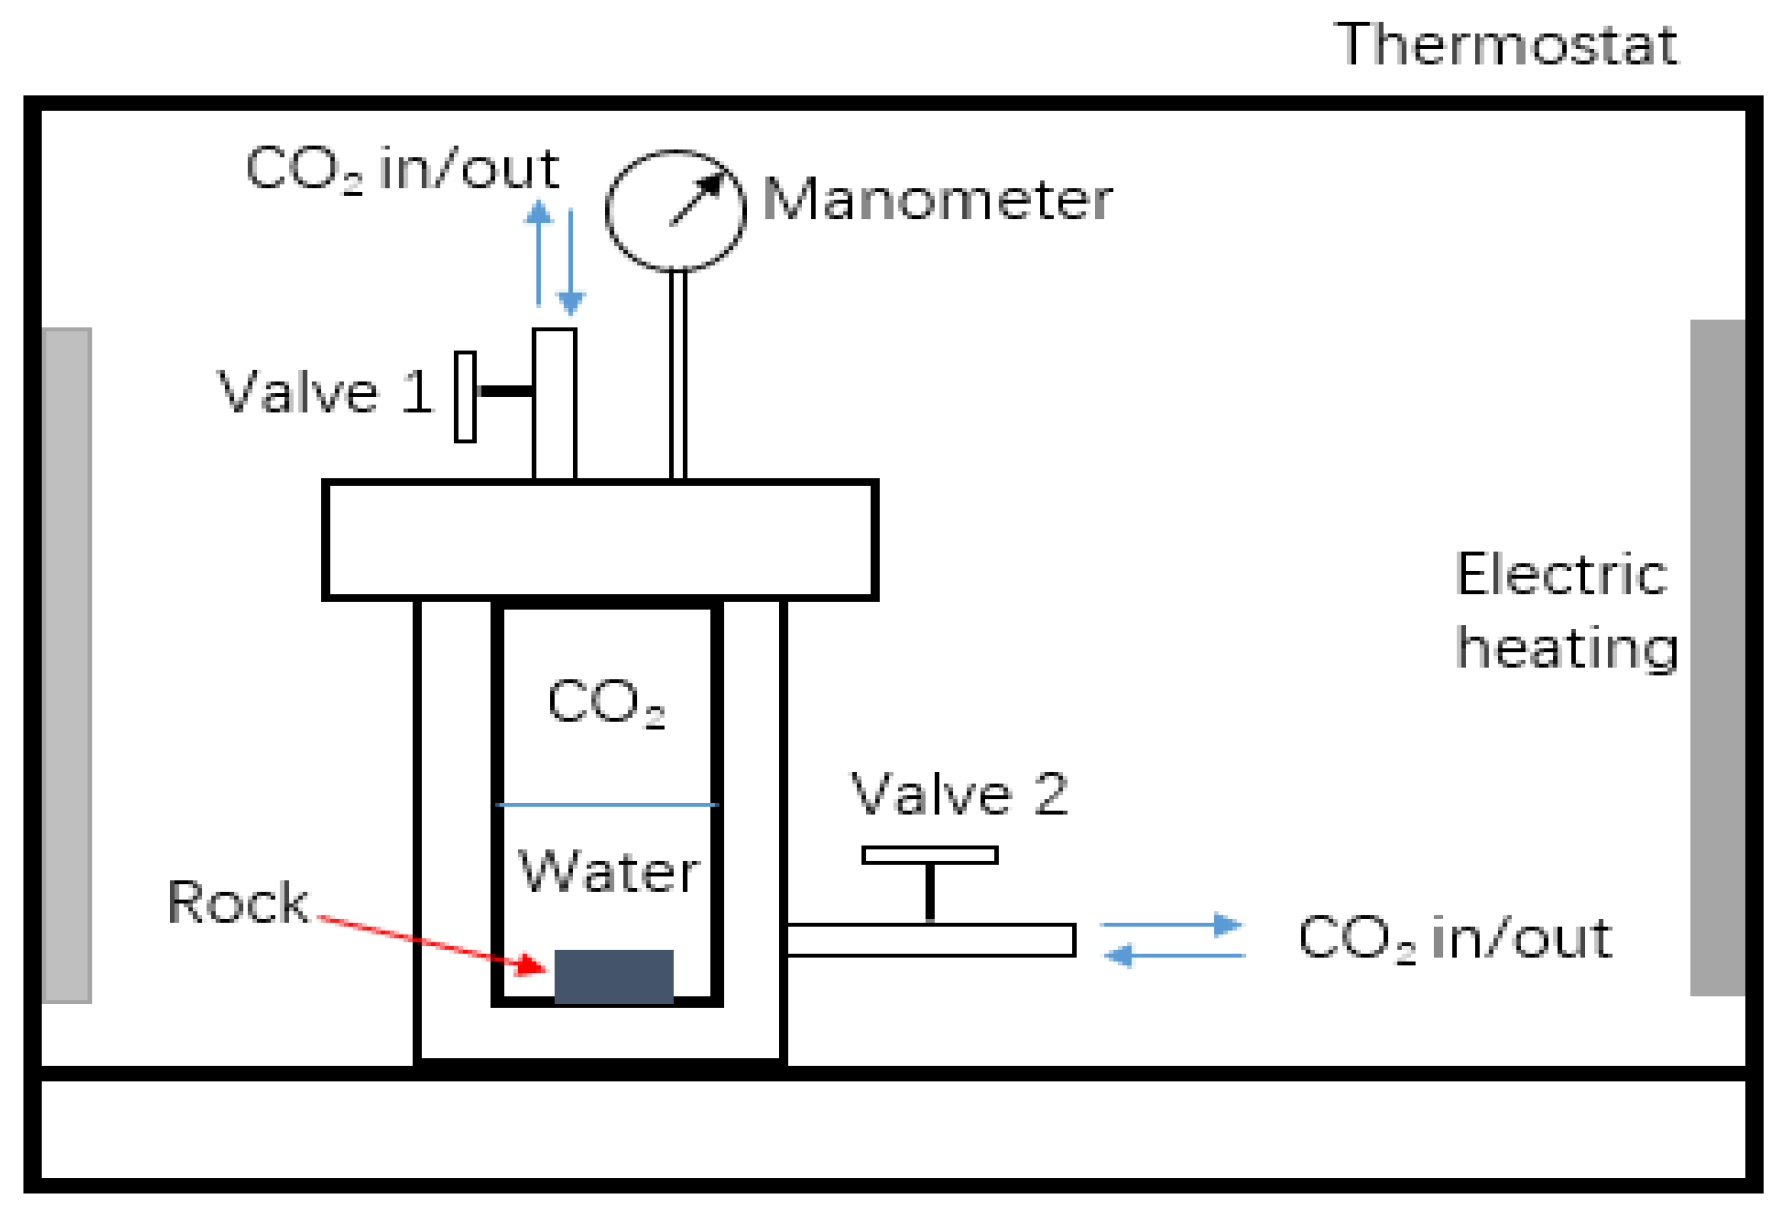
3.2.1. Static Reaction Experiments

This section describes reaction experiments of pressure maintaining and pressure reduction. The former involves injecting CO2 into calcium chloride solution and formation water at reservoir temperature and different pressures, maintaining the system for 48 h. The pH value is then measured using a PHS-3C acidity meter (Shanghai Yidian Scientific Instrument Co., Ltd., Shanghai, China), and precipitation occurrence is observed. This simulates reactions under relatively stable reservoir conditions. The latter involves injecting CO2 into the formation water containing rock core fragments at reservoir temperature and pressure for 240 h, followed by gradual pressure reduction to observe results. This tests whether precipitation could block formation under the condition of pressure drop near the oil production well.
The above experiments were all conducted in a high-pressure reactor, as shown in Figure 6. The reactor has a 100 mL internal volume and maximum working pressure of 32 MPa. It features two horizontal valves (top/bottom), and an upper-end MPM480 pressure sensor (0–25 MPa) (Micro Sensor Co., Ltd., Baoji, Shaanxi, China). All pipelines and valves are made of corrosion-resistant 316 stainless steel. During experiments, the high-pressure reactor was placed in an electrically heated HHB11-600 constant-temperature box (Shanghai Lianxiang Environmental Protection Technology Co., Ltd., Shanghai, China). Experimental design fundamentals for CO2-reservoir rocks/fluid follow China’s petroleum and natural gas industry standard [44].

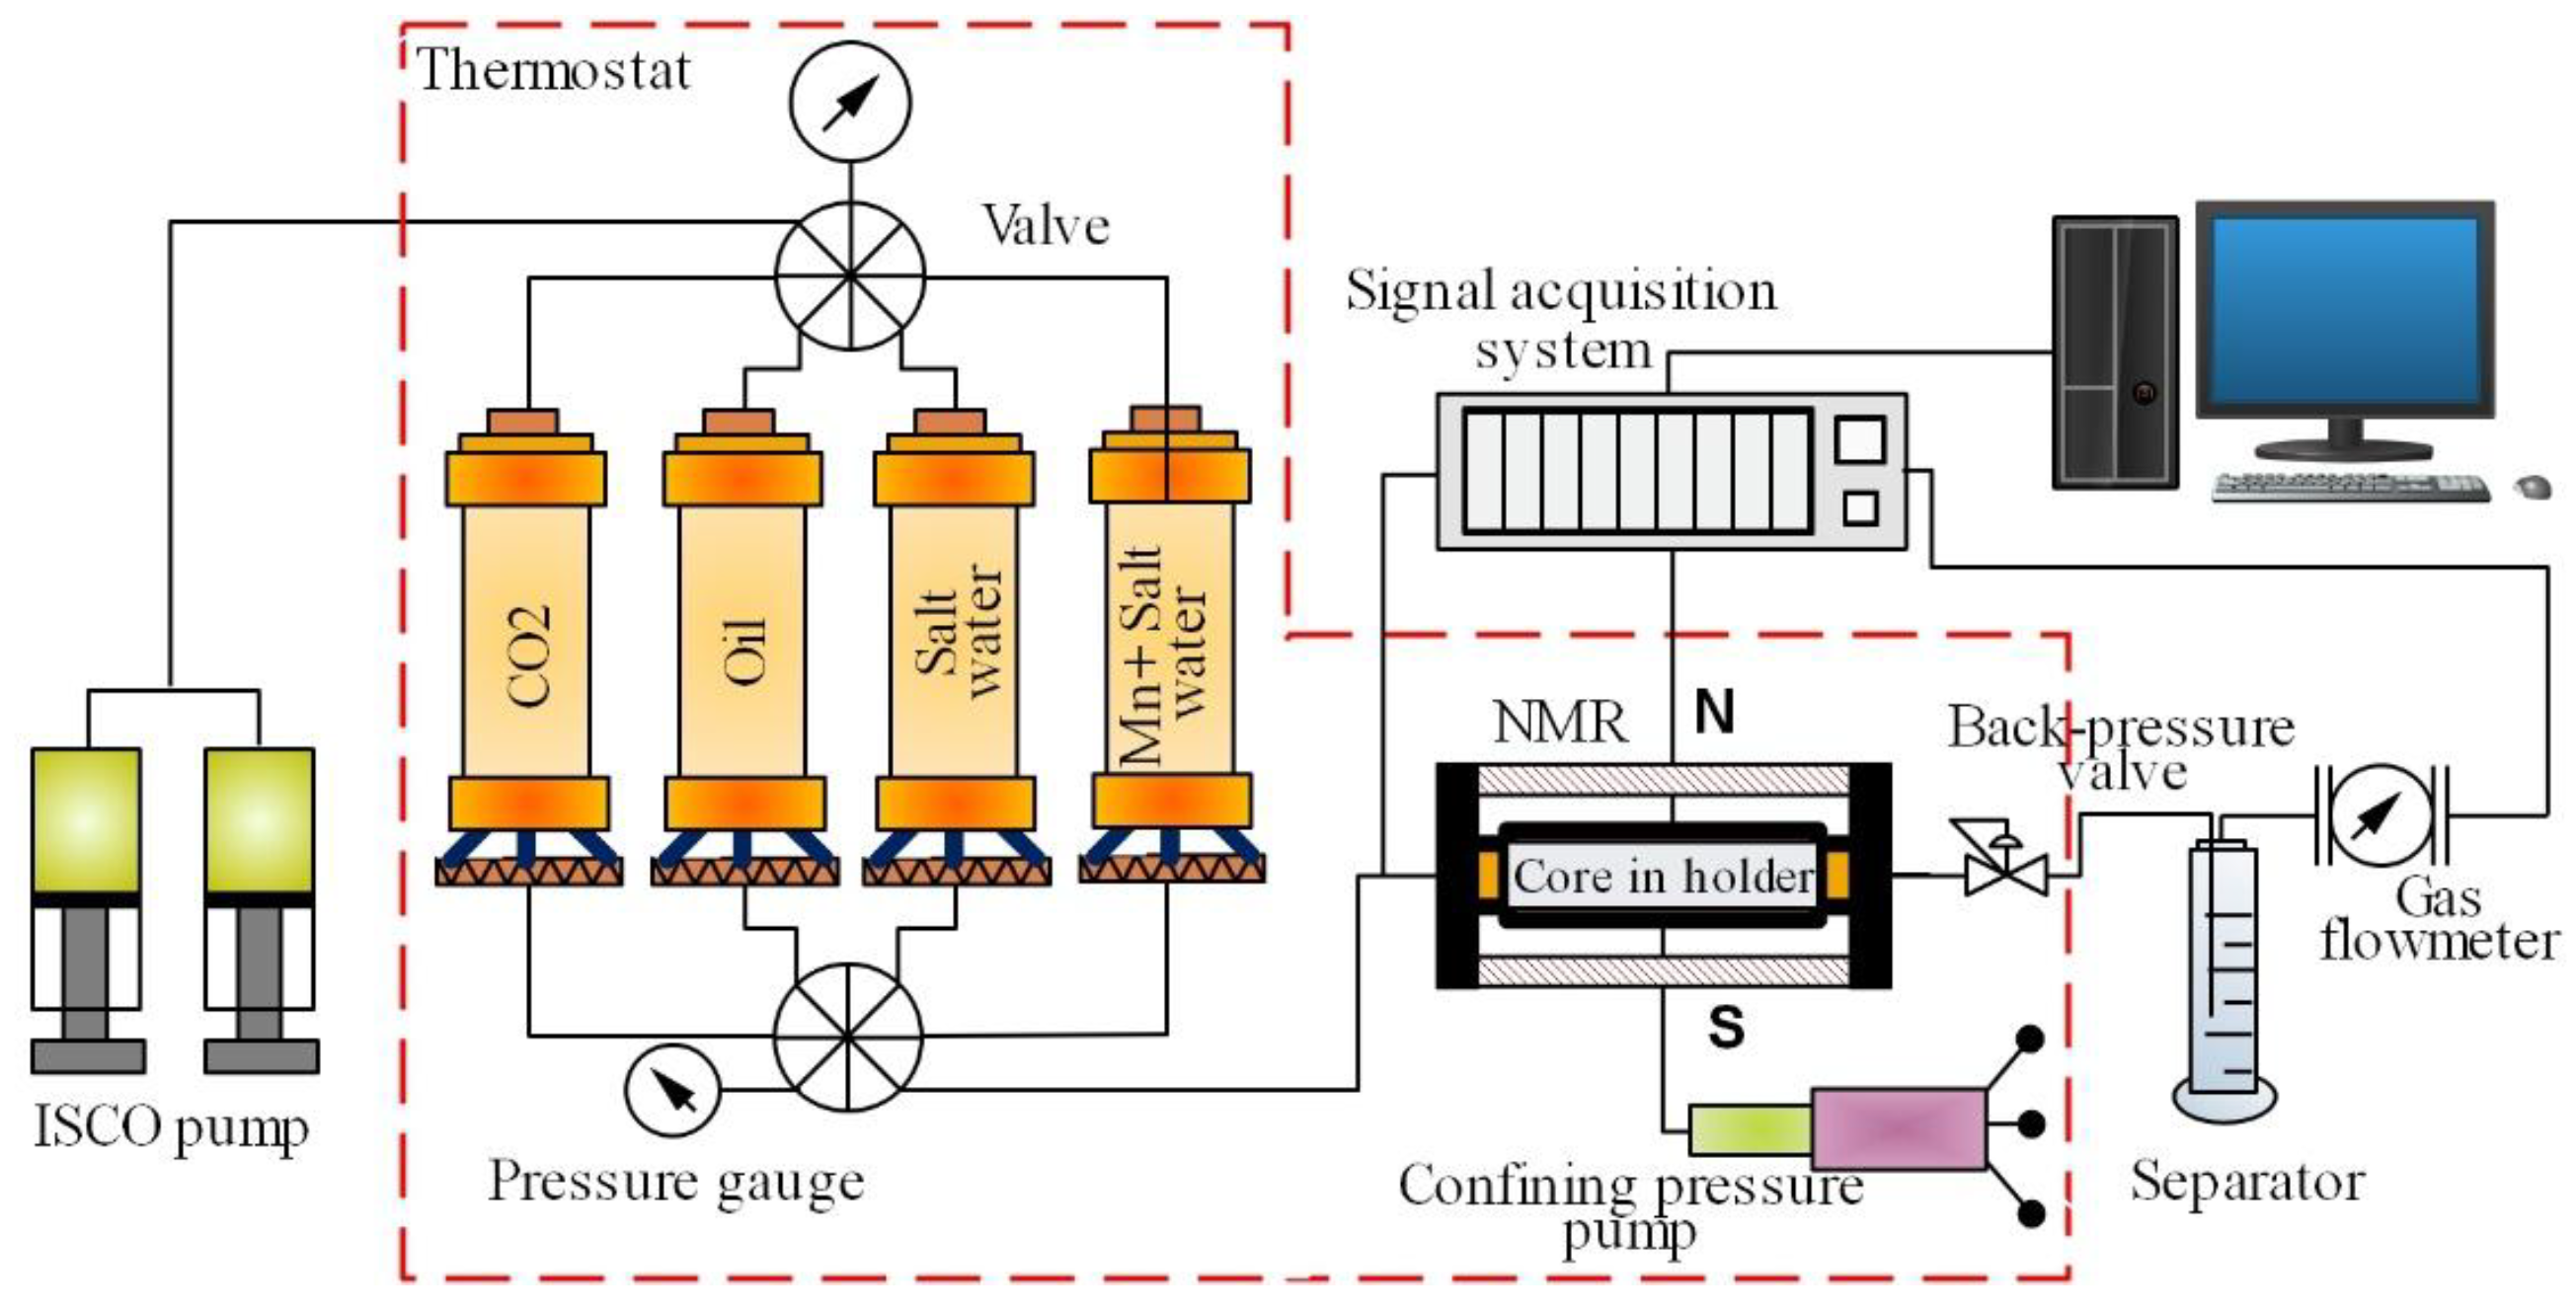
3.2.2. Displacement Experiments
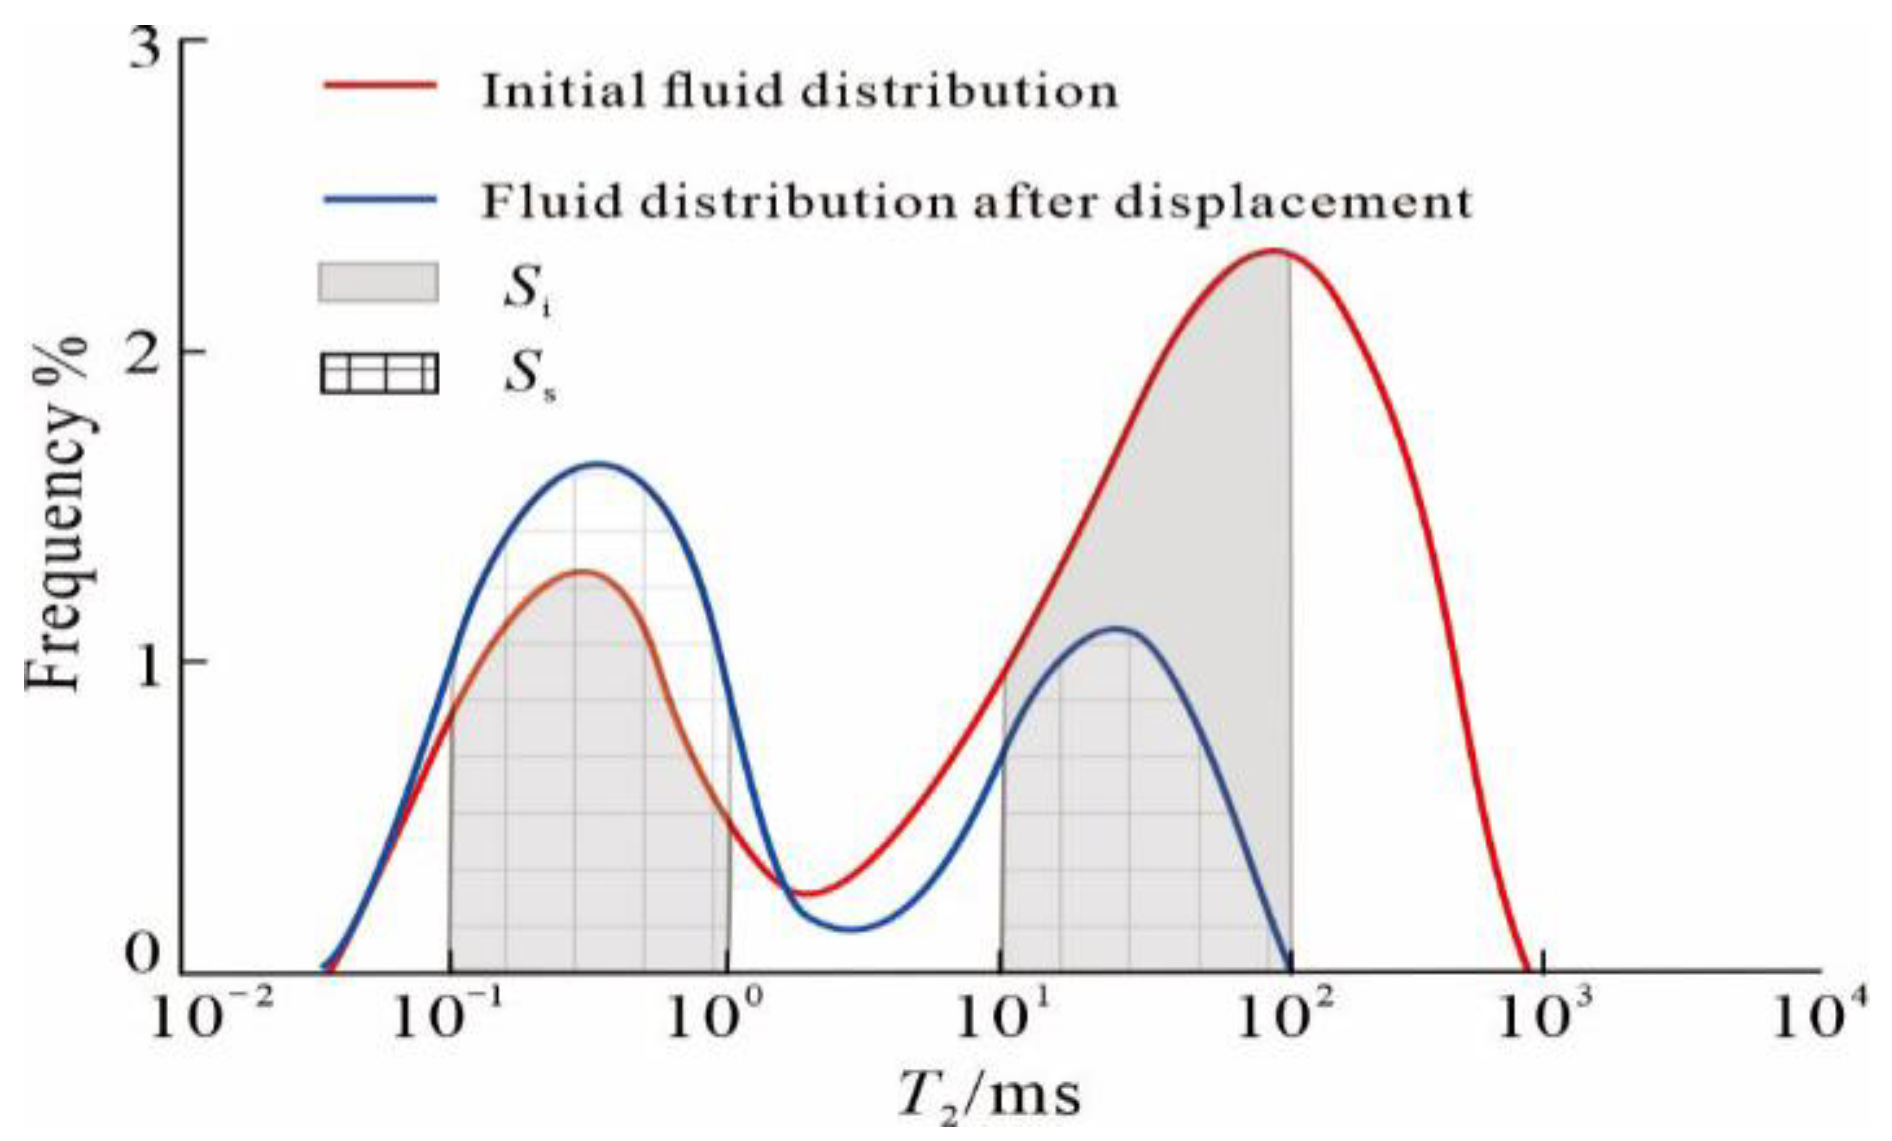
This section describes experiments conducted primarily using a constant-pressure displacement device with NMR T2 spectrum sampling (Figure 7). The displacement device consists of an injection system, a reservoir simulation system, and an output measurement system. The injection system mainly consists of a displacement pump and four vessels containing, respectively: ordinary brine, brine containing Mn2+, crude oil, and CO2. The reservoir simulation system mainly includes thermostat, confining pressure pump, and core holder. The output measurement system is mainly composed of a gas–liquid separation device and flowmeter. The temperature accuracy of the equipment is ±1 °C, the pressure accuracy is ±0.01 MPa, and the flow accuracy is ±0.01 cm3.
The experimental procedure is as follows: (1) Place the treated core in a specialized holder and position it within the NMR probe. (2) Vacuum saturate the core with formation water, then flood it with 2–3 pore volumes (PV) of Mn2+-doped brine to eliminate the brine signal. (3) Perform NMR scanning on the Mn2+-saturated core to obtain the original fluid distribution. (4) Conduct the constant-pressure CO2 gas displacement using a back pressure controller, maintaining a 0.2 MPa displacement pressure difference for 240 h at constant injection pressure. (5) Following displacement, extract and dry the core, measure permeability and porosity, re-vacuum-saturate with formation water, perform secondary NMR T2 spectrum sampling to observe structural and fluid distribution changes. The above core processing and experimental operation procedures refer to the petroleum and natural gas industry standard of the China [45].
Each mineral in the rock corresponds to a specific X-ray spectrum, and its position and intensity can distinguish different kinds of minerals, so as to achieve qualitative analysis of mineral types. In addition, the mineral content is positively correlated with the diffraction peak and intensity in the spectrum, according to which the mineral can be quantitatively analyzed. The operation procedures and analysis methods refer to the petroleum and natural gas industry standard of the China [46]. Some samples were taken from the near injection end of the rock plugs before and after flooding for XRD analysis. Pretreatment and testing of the rock samples were completed using a D8 Advance X-ray diffractometer from Bruker AXS in Karlsruhe, Germany. The instrument parameters were as follows: Lynx XE array detector, Cu target, ceramic X-ray tube, voltage 40 kV, and current 40 mA. Continuous scanning mode was adopted, with an angle range of −110~168° (2θ), angle accuracy of 0.0001°, step size of 0.02°, and scanning speed of 0.2 s per step.
After freeze-drying the clean sample at 0 °C, the sample was ground with an agate mortar to below 200 mesh. The ground powder sample was placed into the groove of the XRD sample table, and the powder was compacted to produce a flat surface. The appropriate testing conditions were selected, and all samples had the same testing conditions. After obtaining the XRD pattern, the sample X-ray diffraction data were compared with the standard mineral data for qualitative analysis. The Rietveld full spectrum fitting method was used for semiquantitative analysis, with specific methods and steps detailed in the literature [47].
Scanning electron microscopy (SEM) enables direct observation of the alterations in rock surface morphology following the interaction between rock, carbon dioxide, and water, thereby unveiling the dissolution characteristics of reservoir rocks by CO2. This study used the Leica CAMBRIDGE S-360 scanning electron microscope (sourced from Cambridge Instruments, Cambridge, UK) manufactured jointly by Cambridge in the UK and Leica Joint Limited Company in Germany, in accordance with industry standard of the China [48]. The instrument features a resolution of 5 nm (100,000× magnification), operates at a working voltage of 20 kV, maintains a chamber vacuum of 1.33 × 10⁻³ to 1.33 × 10⁻⁴ Pa, and generates secondary electron images for analysis.
Inductively coupled plasma (ICP) analysis determines cation concentration in aqueous solutions. Its principle relies on qualitative and quantitative study of the chemical composition of the sample according to the characteristic spectra emitted by outer electron transitions of atoms (or ions) after being excited. Experiments employed a Profile type inductively coupled plasma spectrometer (Teledyne Leeman Labs, Mason, OH, USA) to analyze produced water ation. The performance indicators were as follows: grating: 79 bars·mm−1; focal length: 750 mm; resolution: 0.006 (200 nm); and pump speed: 0.5–2 mL·min−1. Ion chromatography (IG) analysis is the most mature method for qualitative and quantitative detection of inorganic anions currently. The principle is to separate and recognize different ions based on the differences in ion exchange. This study used a DX-120 ion chromatograph (Dionex, Sunnyvale, CA, USA) to determine the anion concentration in produced water. The main technical indicators are pump flow setpoint error: <±4%; pump flow repeatability error: <±2%; and minimum detection concentration: ≤0.005 μg·g−1. For detailed standards and requirements regarding ion testing, please refer to the petroleum and natural gas industry standard of the China [49].

3.3. Metrics

By calculating the porosity and permeability change rate of rock samples post-displacement, the impact of CO2 flooding on reservoir physical properties can be analyzed macroscopically. The calculation methods are illustrated in Equations (1) and (2).
Δ K = K 1 K 2 K 1 × 100 %
where Δ K is the permeability change rate, %; K 1 is the initial permeability, 10−3 μm2; and K 2 is the permeability after displacement, 10−3 μm2.
Δ φ = φ 1 φ 2 φ 1 × 100 %
where Δ φ is the porosity change rate, %; φ 1 is the initial porosity, %; and φ 2 is the porosity after each flooding, %.
The aforementioned calculation and characterization methods offer simplicity and intuitiveness as their main advantages. However, they fail to examine the alteration of pore throat structure at the micro scale, thus hindering a fundamental understanding of the damage mechanism. This study introduces the concept of pore throat plugging rate to quantitatively assess and analyze the plugging effect of solid particles across different pore scales.
The pore throat in porous media distribution can be characterized by NMR transverse relaxation time (T2) of [50]:
1 T 2 ρ s v = ρ a r
where ρ is the surface relaxation strength, s is the pore surface area, v is the pore volume, and s v is the specific pore surface area. For rock cores, the surface relaxation strength ρ can be regarded as a constant and a stands for the pore shape factor. Therefore, T2 is a function of the porous radius r: larger pores correspond to longer relaxation time, while smaller pores correspond to shorter relaxation time. The T2 distribution map actually reflects the distribution of pore throat size.
Initially, T2 spectrum of fluid-saturated samples pre-CO2 displacement were measured and recorded. Subsequently, after conducting the displacement experiment, samples were resaturated with the same fluid and the T2 spectrum was measured and recorded once again. The degree of plugging for pore throats of different scales could be calculated using the envelope area between curves in Figure 8 and Equation (4).
P = S i S s S i × 100 %
where P is the plugging rate, %; S i is the original saturated fluid quantity within the radius of the corresponding pore throat. S s is the amount of secondary saturated fluid within the radius of the corresponding pore throat. When small pore throats are altered by dissolution, the petrophysical properties improve, resulting in a significant increase in T2 spectrum amplitude. Consequently, calculated plugging degree is negative. Conversely, when large pore throats undergo dissolution, fine particles may be released and subsequently plug the narrow throats connected to larger pores, leading to deteriorated petrophysical properties and a notable decrease in T2 spectrum, thereby yielding a positive plugging degree.
According to Figure 8 and the concept of plugging rate, when the secondary saturated fluid quantity is less than the original saturated fluid quantity, the plugging rate is positive, indicating pore throat blockage by solid particles. On the other hand, when the secondary saturated fluid quantity is greater than the original saturated fluid quantity, the plugging rate is negative, suggesting dissolution and migration of pore throat particles.

4. Results and Discussion

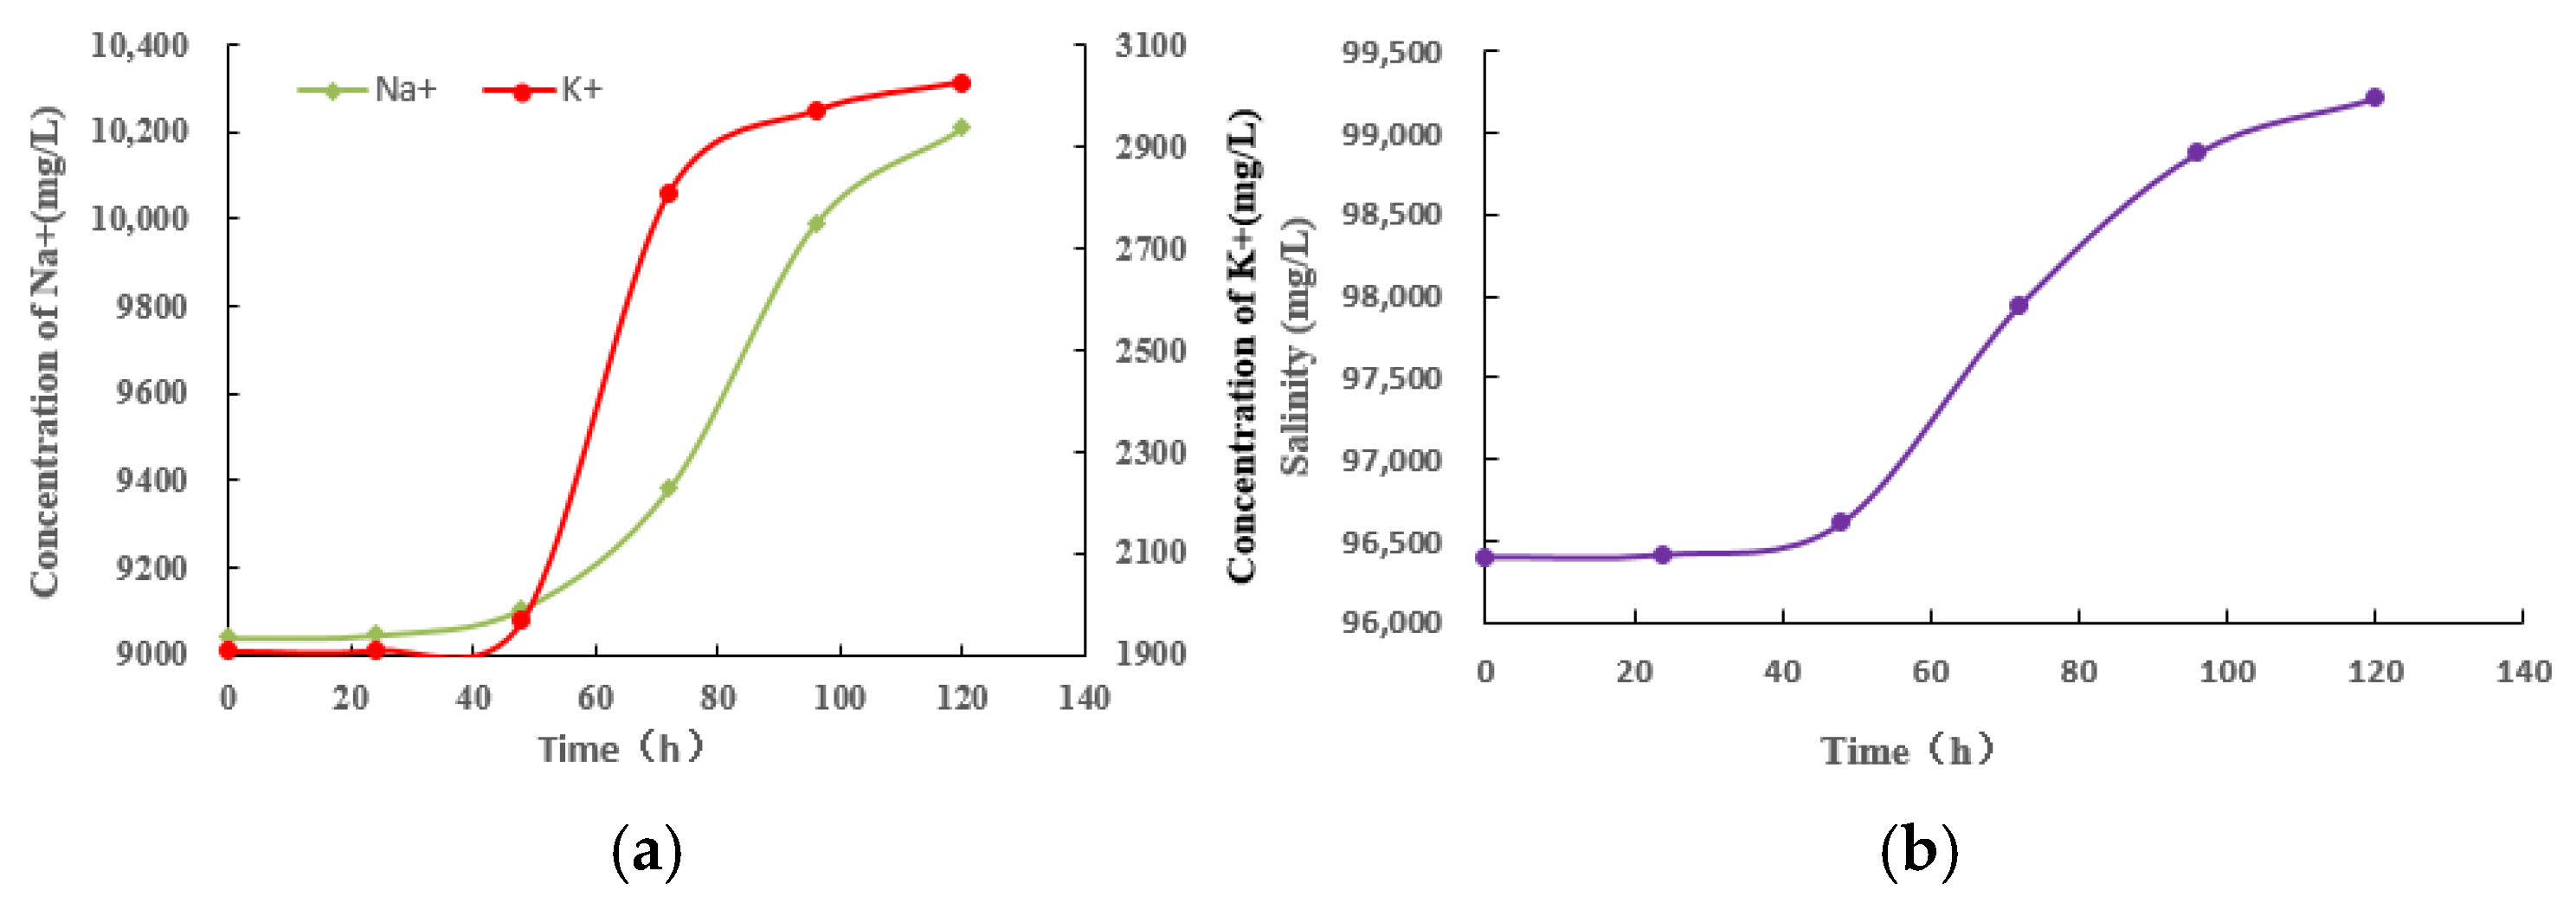
4.1. Static Experiments

The formation water in the research area belongs to the calcium chloride type, with a very high concentration of calcium ions (Table 2). In order to clarify whether calcium carbonate precipitation will cause damage to the reservoir during CO2 flooding, the changes in pH value and the formation pattern of calcium carbonate in solutions with different concentrations of calcium chloride were investigated. Figure 9 shows that the pH value of calcium chloride solution decreases with the increase in pressure. When the pressure is between 0.25 and 2.5 MPa, the pH value of the solution fluctuates between 3.0 and 4.0. This is mainly due to the solubility of CO2 in water increases with pressure. So, more CO2 combines with water to form carbonic acid, leading to a decrease in the pH value of the solution. As the concentration of calcium chloride increases, the pH value of the solution decreases, and no precipitation of calcium carbonate was observed during all the experiments.
Although injecting CO2 into pure calcium chloride solution does not form precipitation, will the addition of CO2 cause precipitation when other ions are present in formation water? To investigate this, CO2 was injected into the formation water of the research area to examine solution pH variation and precipitation occurrence. Figure 10 shows that after introducing CO2 into the formation water, the pH value of the solution gradually decreases, and no precipitation was observed during experiments. The results indicate that the formation water becomes acidic post-CO2 injection, with carbon dioxide mainly existing as HCO3 and H2CO3. Calcium bicarbonate formed by the combination of HCO3 and Ca2+ is water-soluble. Therefore, during the CO2 flooding process in the study area, despite the Ca2+ content in the formation water is high, the dissolution of CO2 in the formation water does not form salt precipitation and block the reservoir pores.
It is worth noting that the above experiments were conducted under constant or increased pressure conditions, which is similar to the process of CO2 displacement. However, near production wells, the pressure gradually decreases. Will salt precipitation form under such conditions? To investigate, CO2 was injected into a system composed of rock core slices and formation water. Pressure and temperature were maintained at 10 MPa and 45 °C for 240 h. Then, the system pressure was slowly reduced, and the surface morphology and composition of the rock core slices were finally observed. The results are shown in Figure 11.
From the analysis of the morphological changes and sediment composition in Figure 10, it can be seen that calcium carbonate precipitation occurred during depressurization after the reactions among the rock, formation water and CO2. This is mainly when the partial pressure of carbon dioxide in the solution decreases, as described in Equation (5), the reaction will proceed to the left. Gradual pressure reduction causes the dissolved calcium bicarbonate to decompose, forming calcium carbonate precipitation.
C a C O 3 + C O 2 + H 2 O Ca ( HCO 3 ) 2
Additionally, experiments revealed calcium carbonate deposits not only on the surface of the rock core, but also extensively adhered to the inner walls of the reaction vessel. The above experimental results and phenomena explain why scaling is more common near production wells. The rapid change in pressure during CO2 flooding can easily lead to salt precipitation, adversely affecting oil recovery.

4.2. Dynamic Displacement Experiments

4.2.1. Movable Fluid Saturation

In order to study the effect of CO2 displacement on porous media under different permeability, three representative cores (W1, W2, and W3) with different permeability were selected. Experiments were conducted at reservoir temperature (45 °C) with injection pressure set at 8 MPa based on wellsite condition. The T2 spectrum changes in the three groups of cores before and after CO2 displacement are shown in Figure 12. From the experimental results, it can be found that the pore throat structures of cores with different permeability are different, and the T2 shows significant differences before and after gas injection. In the core with a permeability of 0.413 mD, the proportion of micro pores (T2 below 1 ms) of different sizes sometimes increased and sometimes decreased, the proportion of small pores (T2 between 1 and 10 ms) decreased significantly, and the middle and large pores (T2 above 10 ms) remained basically unchanged after CO2 displacement. For the core with a permeability of 1.158 × 10⁻³ μm2, the proportion of micro pores increased significantly, the proportion of small pores decreased significantly, and the proportion of middle and large pores also decreased to varying degrees after CO2 displacement. For the core with a permeability of 7.272 × 10⁻³ μm2, the proportion of micro pores also increased after CO2 displacement, but the increase rate was smaller than that of the core with a permeability of 1.158 × 10⁻³ μm2. The proportion of small holes decreased, and the decrease was also smaller than in the previous two cases. The proportion of middle and large pores was basically unchanged.
Figure 13 displays the changes in the plugging rate of pore throats in each group of cores. As shown in the figure, the plugging rate in smaller pores significantly decreases with increasing permeability. Under certain conditions, the plugging rate becomes negative, indicating that the dissolution effect exceeds the plugging effect. However, both the plugging rate and porosity change rate in larger pore throats exhibit a turning point, where they initially increase then decrease with increasing permeability. It is worth noting that although the plugging rate in the middle and large pore throats of the latter two groups are significantly higher than those of the first group, the permeability changes are significantly lower than those of the first group. These results indicate that the permeability changes in low permeability cores after CO2 flooding mainly depend on alterations in micro and small pore throats.
Comprehensive analysis shows that the main reason for the above phenomenon is likely the interaction between CO2, formation water, and rock. In the process of CO2 displacement, the interaction of CO2, formation water, and rock results in the dissolution of some minerals in the rock, which increases the porosity to a certain extent. However, during the dissolution process, new mineral particles are generated, and clay particles and other interstitial materials released by the dissolution of cement cause blockage damage to the pore throat. When the permeability is very low, the proportion of micro pores is very high, and most of the secondary particles generated in the process of CO2 displacement are blocked at narrow points near the pore throat, so the plugging shows more severe. When the permeability is high, the pore throat size in rock is correspondingly large, and the particles produced by dissolution at small pore throats can migrate a certain distance to larger pores, but most are still blocked at narrow sections of larger pore throats. When the permeability increases to a certain value, the particles produced by dissolution at the small pore throats can basically migrate to large pore throats or even be partially displaced out.
The change in temperature will significantly influence the physicochemical properties of CO2, which may affect the rock skeleton and pore throats during the CO2 flooding process. Three cores with similar permeability in the study area (cores numbered W4, W5, and W6) were selected to study the temperature effect. Three temperature points were set, namely 45 °C (reservoir temperature), 25 °C (below CO2 supercritical temperature, 31.2 °C), and 70 °C (above reservoir temperature), along with an injection pressure of 9 MPa. The experimental results are shown in Figure 14 and Figure 15.
It can be observed from Figure 14 that temperature significantly influences the pore throat structure after CO2 flooding. With increasing temperature, the dissolution effects on micro and small pores become more pronounced, leading to increased volume, whereas no obvious changes occur in middle and large pores. Notably, when temperature is lower than the supercritical temperature of CO2, micro and small pores show neither CO2 dissolution nor pore enlargement. As shown in Figure 15, higher temperatures correspond to significantly decreased plugging rates in micro and small pores. At 70 °C, corresponding to approximately 2200 m depth in the study area, the plugging rate of micro and small pores even becomes negative, indicating an overall effect of dissolution and porosity increase, thereby reducing the extent of permeability damage. Meanwhile, at the current level of permeability, temperature does not have a noticeable effect on the larger pores, leading to only a slight increase in the plugging rate. Hence, porosity and permeability alterations primarily depend on micro and small pore throat structure changes.
The injection pressure of CO2 varies greatly in different fields, and the pressure also affects the physicochemical properties of CO2 and its solubility in the formation water. Three cores with similar permeability (cores numbered W7, W8, and W9) in the study area were selected to study the effects of different pressures on the pore throat structure in CO2 flooding. The three pressures were selected as 5.5 MPa (lower than the critical pressure of CO2, 7.38 MPa), 8 MPa (the well site injection pressure and higher than the critical pressure of CO2), 11 MPa (slightly higher than the reservoir pressure), and the experimental temperature was selected as the reservoir temperature, 45 °C. The experimental results are shown in Figure 16 and Figure 17.
It can be seen from the experimental results that the influence of pressure on the pore throat structure of CO2 flooding is similar to that of temperature; that is, with the increase in pressure, the dissolution effect of micro and small pores is significantly enhanced, and the volume proportion of micro and small pores increases, especially for pores with T2 values between 1 and 10, which change significantly. Similarly, at the current permeability level, pressure has no obvious effect on the larger pore throat, and the plugging rate decreases slightly with the increase in pressure. The changes of overall porosity and permeability still mainly depend on the change in micro and small pore throat. Comprehensive analysis shows that when the pressure is low, the solubility of CO2 in formation water is low, and its reactivity is also very low, the dissolution of rock is relatively weak, and the blockage of small pores is mainly caused by the falling and migration of clay particles, insoluble matter of rock debris, and other interstitial matter. With the increase in pressure, the solubility of CO2 in formation water increases, and the reactivity and dissolution effect are enhanced. Furthermore, it is possible that the pore enlargement effect resulting from dissolution may exceed the damage caused by blockage. Meanwhile, the expansion energy of free CO2 increases, so the migration capacity of plugging particles is enhanced, which may also be an important reason.

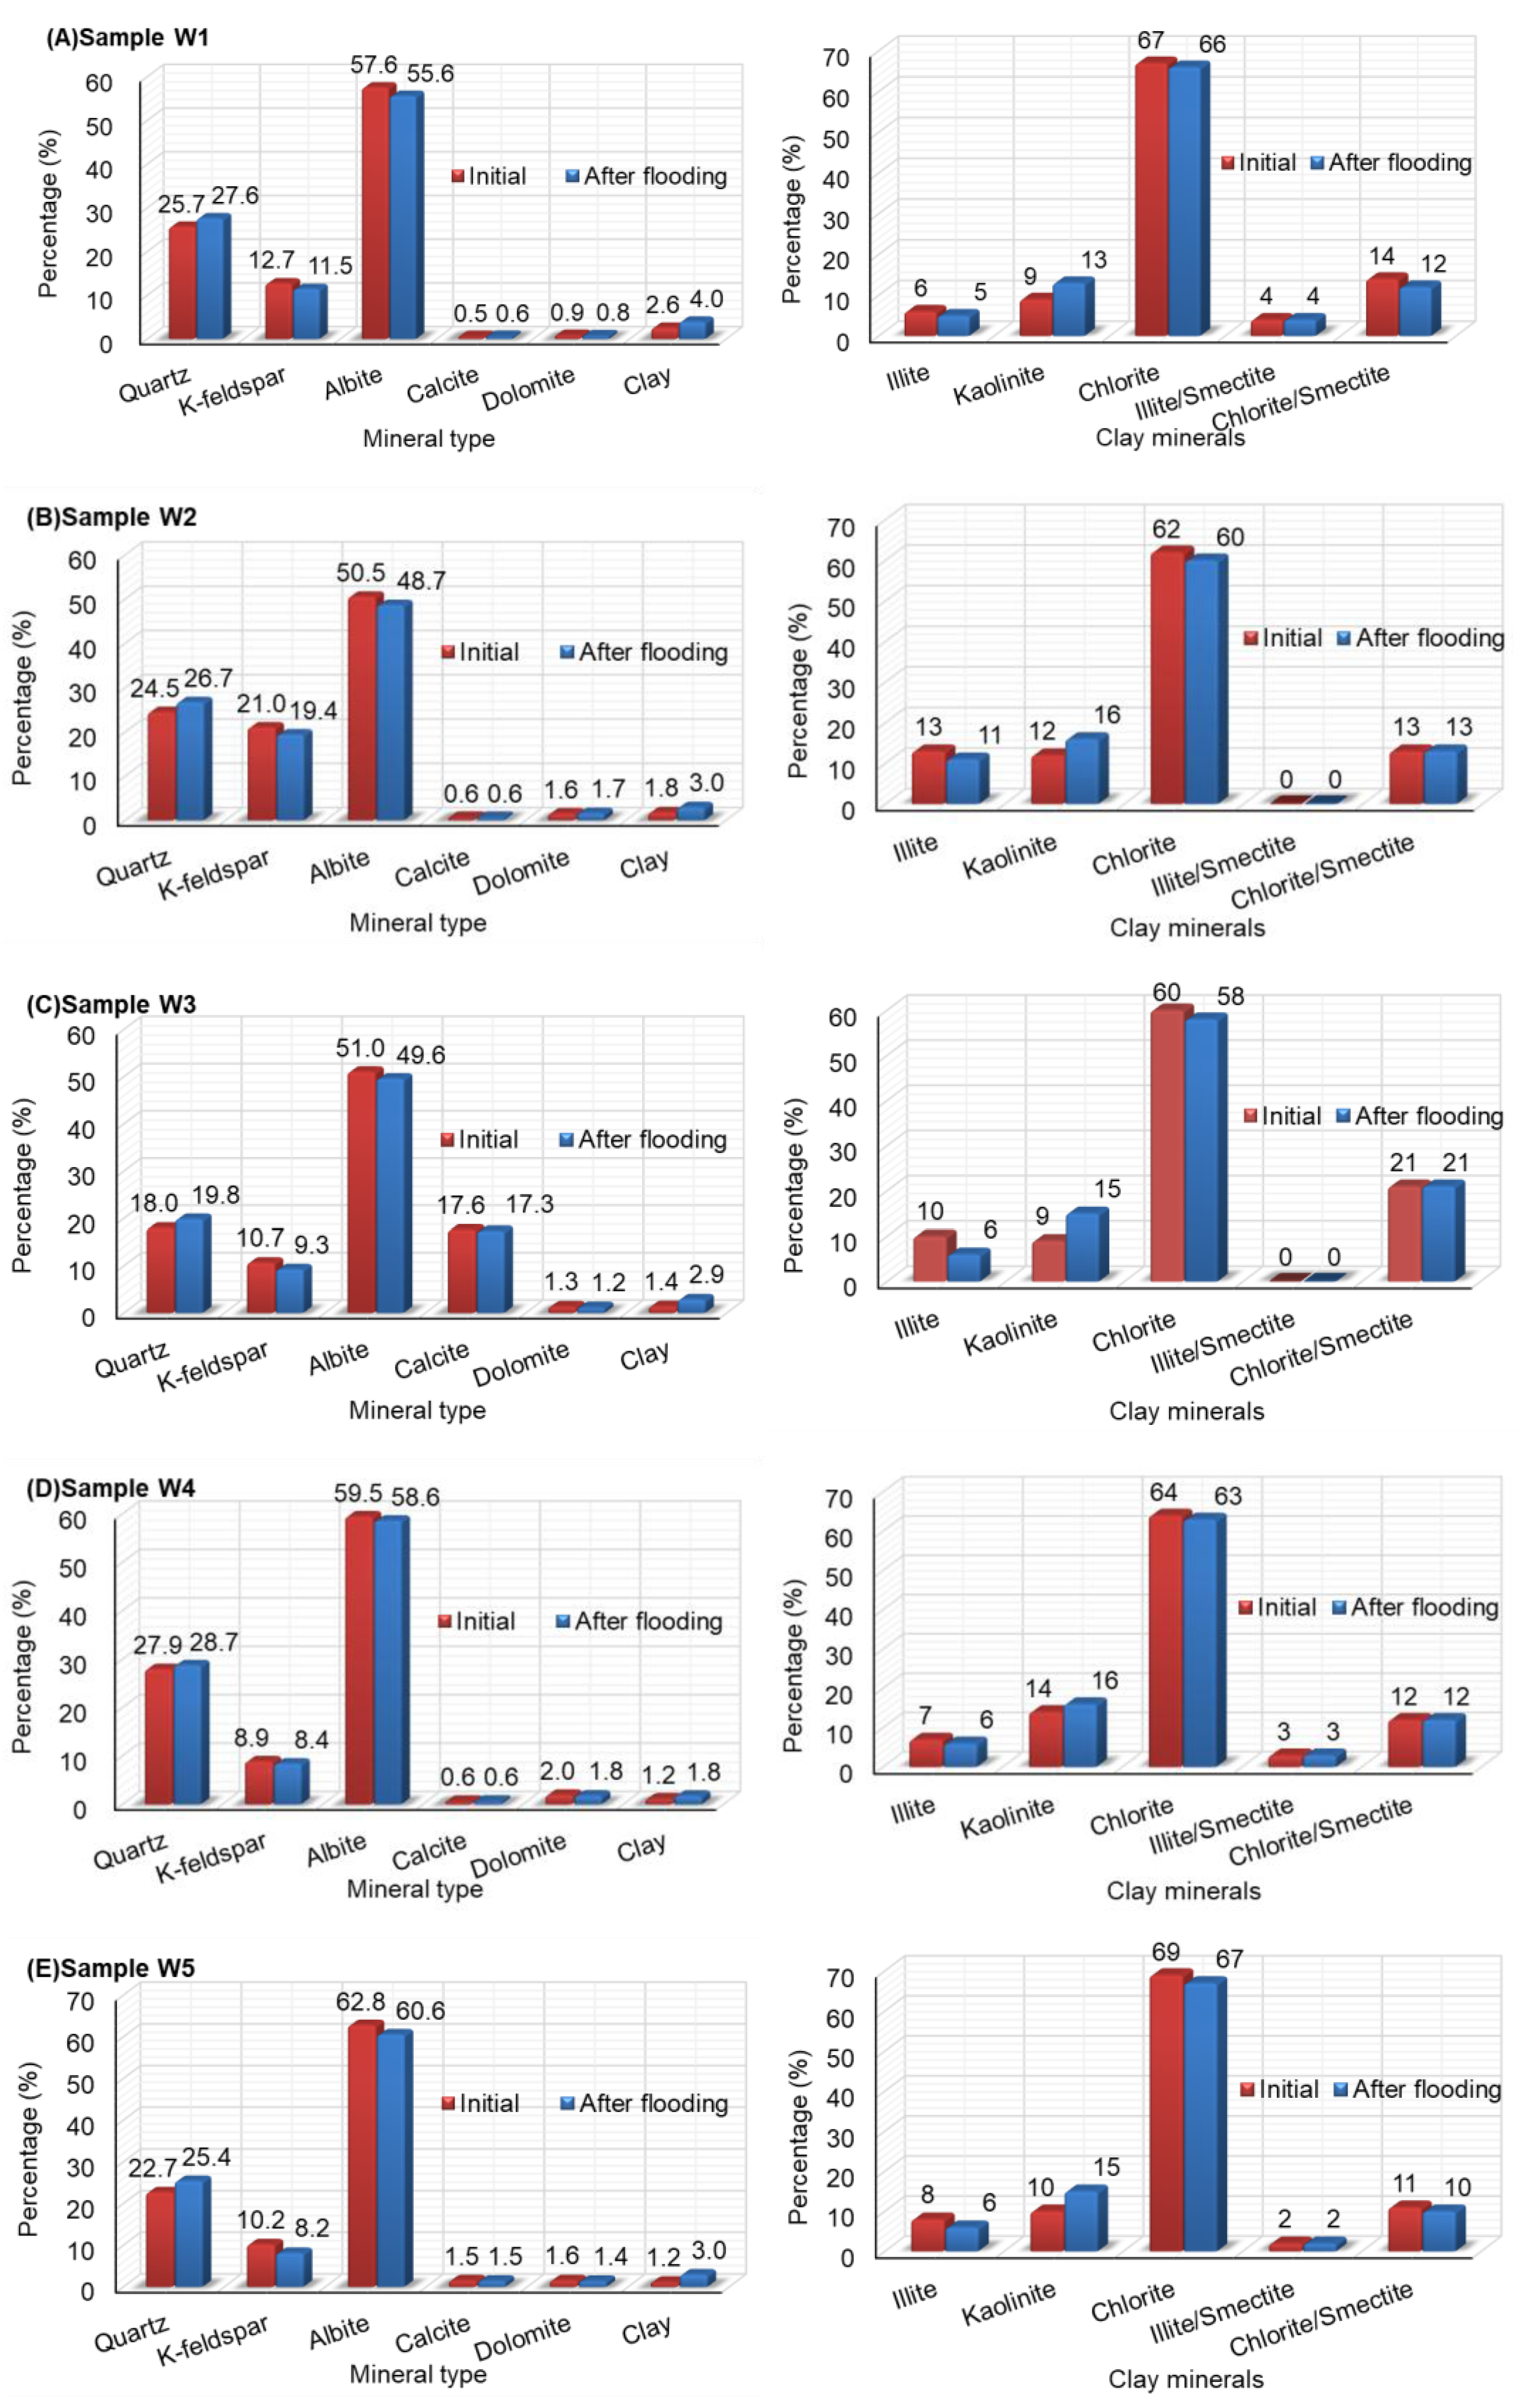
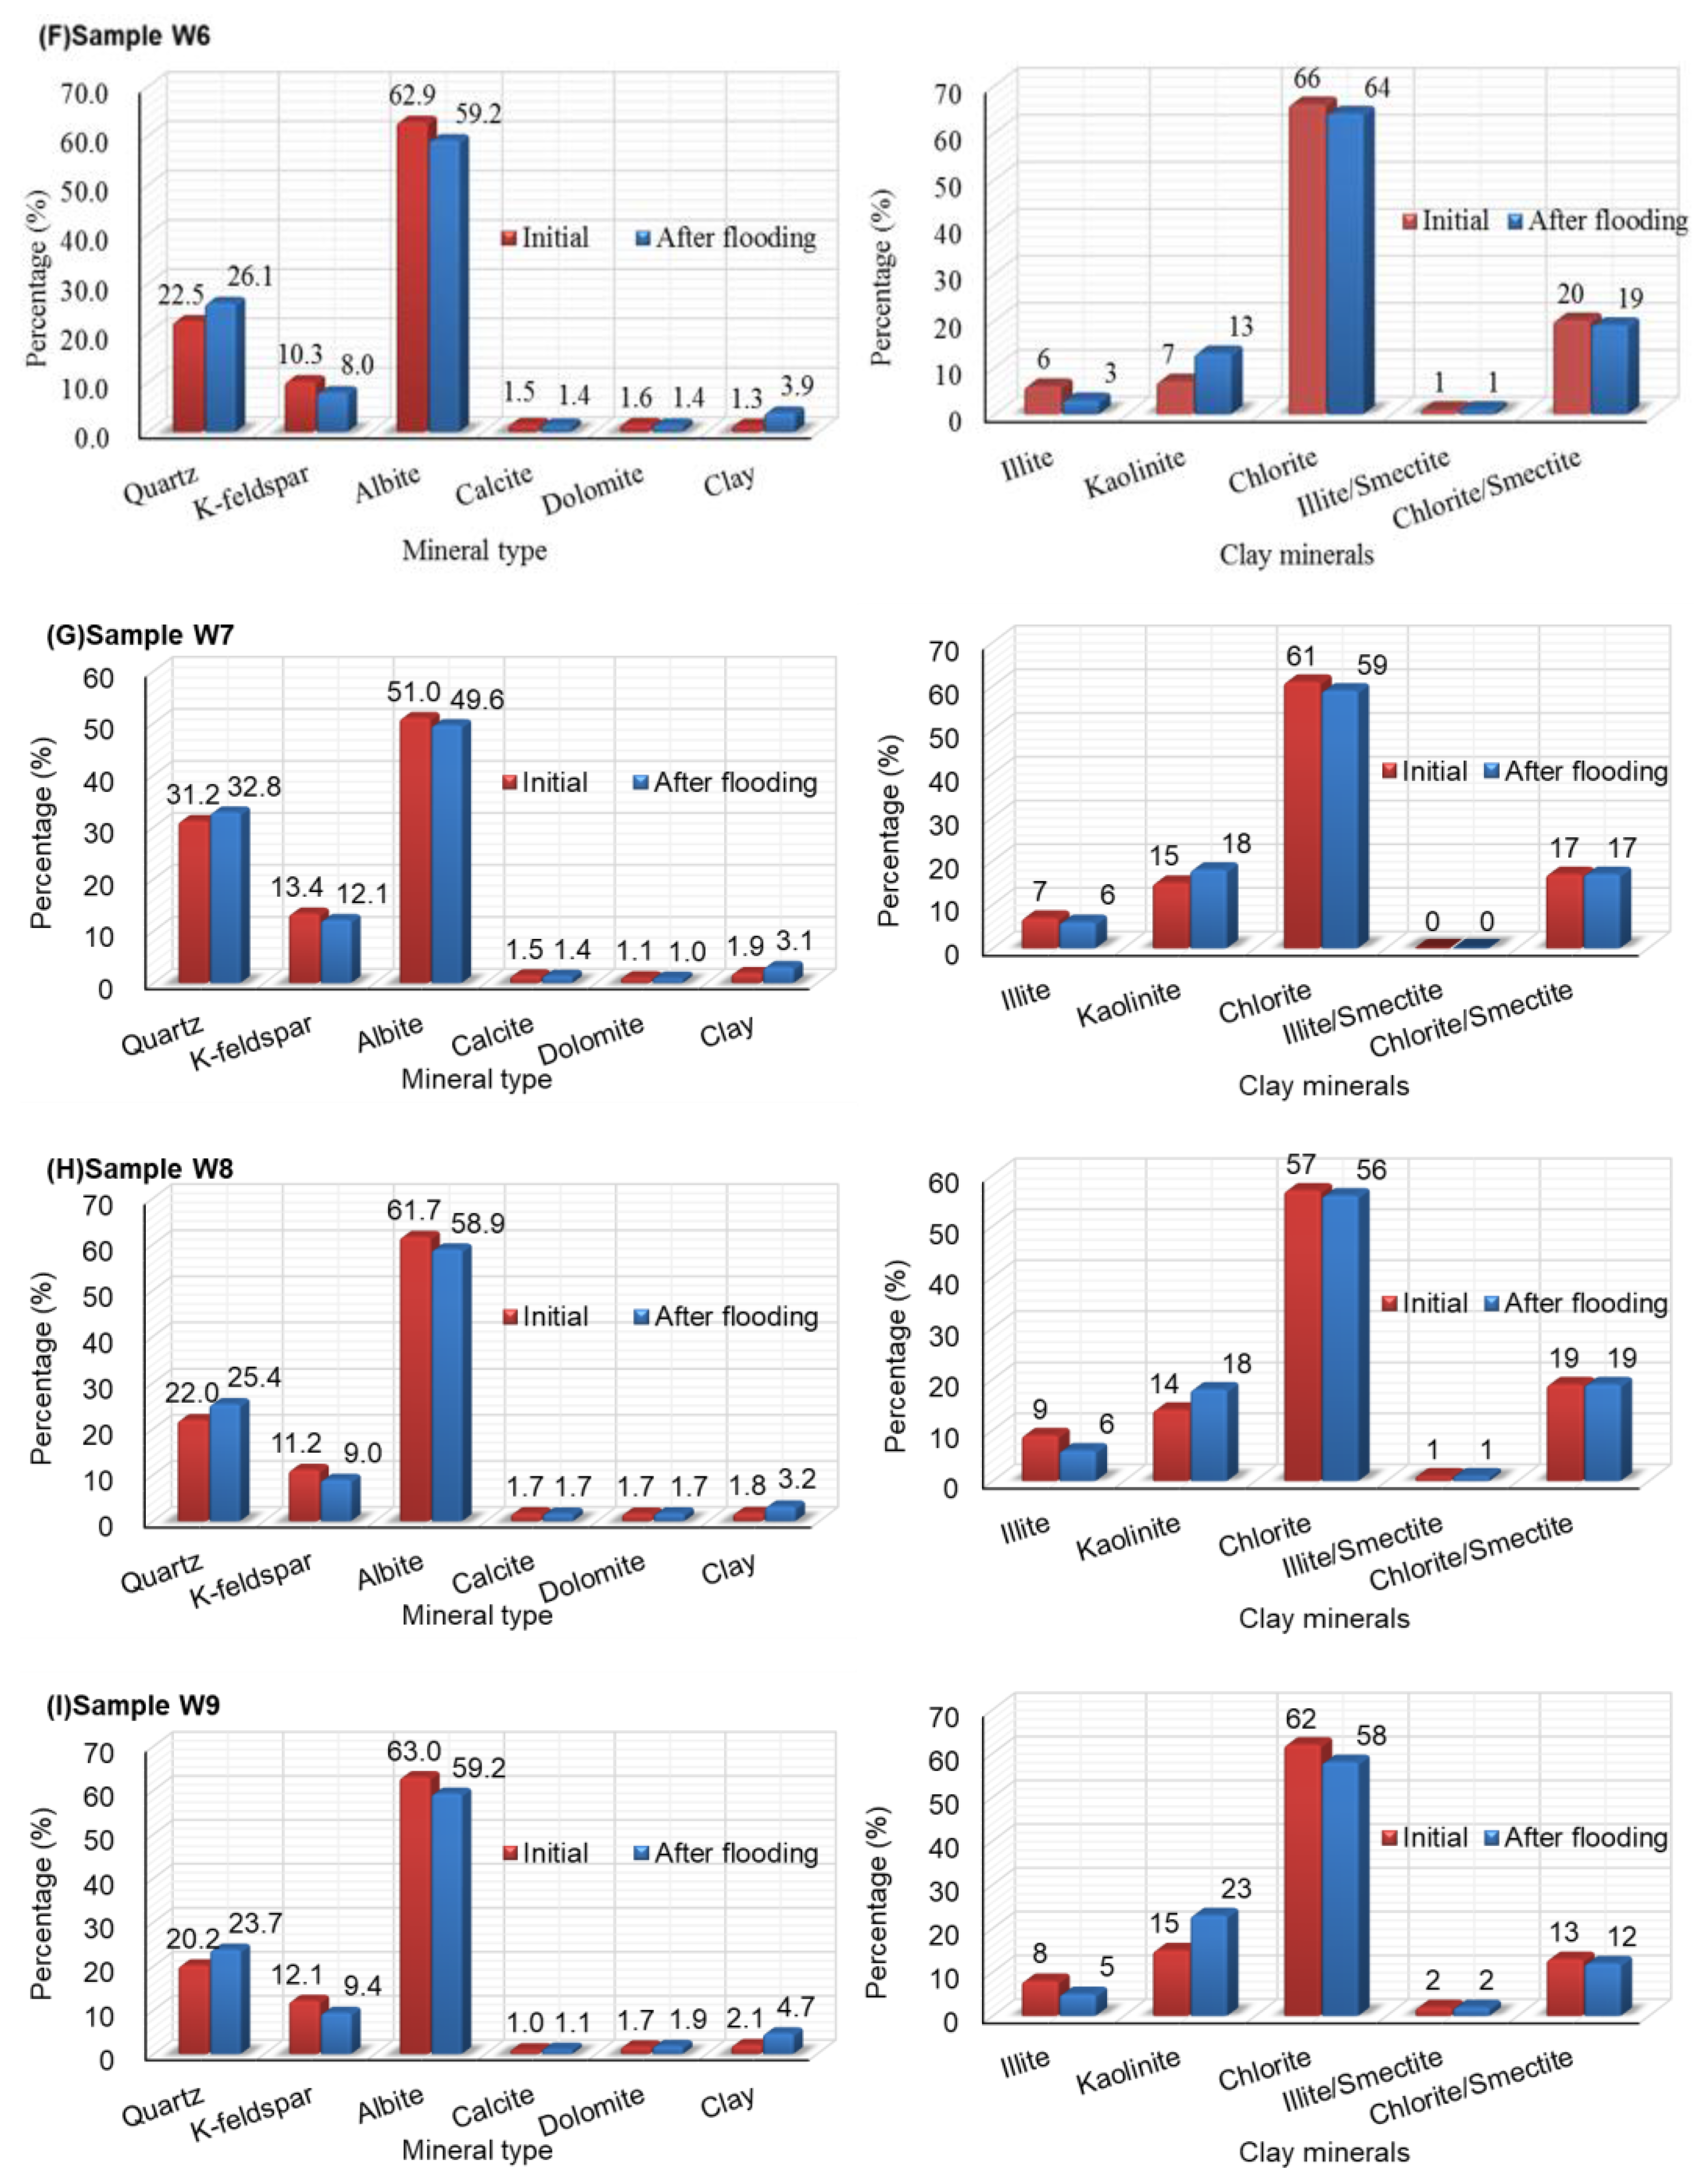
4.2.2. Minerals Changes

To further clarify the interaction mechanism between fluid and reservoir during the process of CO2 flooding in the study area, X-ray diffraction analysis, SEM analysis, and ion analysis of produced water were conducted before and after CO2 injection. These analyses enabled us to explore the internal mechanism of different factors’ damage to the reservoir by examining the changes in microscopic mineral composition and content. The changes in the initial mineral content of each core and the mineral content after gas injection are shown in Figure 18. The salinity and major ion changes in produced water from core W2 during CO2 flooding are shown in Figure 19. The morphology changes in core W2 before and after displacement are shown in Figure 20.
As can be seen from Figure 18, the X-ray diffraction analysis results of the cores before and after CO2 displacement basically show a relatively similar pattern; that is, the quartz content increased slightly (mainly due to the change in relative content), the K-feldspar and albite contents decreased, and the content of carbonate minerals did not change significantly. The increase in clay mineral content is mainly manifested by the increase in kaolinite content. Research indicates that kaolinite typically occurs in the form of book-like or vermicular aggregates, with particle sizes ranging from 1 to 5 μm. When the flow velocity of formation water exceeds the critical velocity (ranging from 0.1 to 1 cm/s), kaolinite particles may detach and migrate, subsequently plugging the pore throat structure and leading to a reduction in porosity and permeability. This phenomenon is also one of the primary contributing factors to reservoir damage in this study. From Figure 19, it can be seen that, with the extension of displacement time, the content of K+ and Na+ significantly increases, and the salinity of formation water increases, explaining that the change in mineral composition in Figure 11 is due to dissolution reactions occurring.
Chloride and sulfate are important components of reservoir formation fluids, with Cl and SO42− being the primary anions contributing to the salinity of formation water. The presence of these ions leads to competitive dissolution effects, which reduce the capacity of formation water to dissolve CO2, thereby weakening the dissolution effect of CO2 injection on the rock matrix. This phenomenon may represent one of the key factors responsible for the observed deceleration in the upward trend of the curves in Figure 19 during the later stages. Through the SEM results in Figure 20, it can be further confirmed that significant dissolution occurred in feldspar during the displacement process. The reaction principles are as follows [51]:
C O 2 + H 2 O H + + HCO 3
2 K A l S i 3 O 8 K f e l d s p a r + 2 H + + 9 H 2 O 2 K + + 4 H 4 S i O 4 + A l 2 S i 2 O 5 ( OH ) 4 K a o l i n i t e        
N a A l S i 3 O 8 A l b i t e + C O 2 + 5.5 H 2 O Na + + HCO 3 + 2 H 4 S i O 4 + 0.5 A l 2 S i 2 O 5 ( OH ) 4 K a o l i n i t e  
The comparative analysis also found that with the increase in temperature and pressure, the content of K-feldspar and albite, as the main minerals in the study reservoir, decreased, while the content of clay mineral kaolinite showed a trend of obvious increase, indicating a stronger dissolution effect. Many research results show that with the rise in temperature, the solubility of CO2 in formation water decreases [52,53], the pH value of the solution increases, and the dissolution effect of CO2 on the reservoir decreases. However, the experiment in this paper shows a completely different phenomenon; that is, the dissolution of the reservoir in the study area is enhanced with the increase in temperature. What is the reason for the different conclusions in this experiment? Firstly, the analysis shows that it is related to the mineral composition of the rock skeleton. The content of carbonate rocks that are easily reactive with CO2 and formation water in the traditional understanding is very low and does not play a major role (as shown in Figure 17). The dissolution of feldspar plays an important role in the formation of secondary pores in sandstone [54,55], especially in tight sandstone reservoirs with fewer primary pores and a relatively high content of feldspar in the study area. Secondly, under high-temperature and high-pressure environment, supercritical CO2 shows stronger reactivity and further promotes the dissolution of feldspar [56].
In summary, the main mechanism of changes in reservoir properties caused by CO2 flooding in the study area is as follows: (1) The corrosion of feldspar plays a crucial role in the generation of secondary pores and blockages and is the fundamental cause of changes in reservoir properties. (2) Permeability and the distribution structure of pore throat size influence both gas–water–rock contact time and particle migration extent, and further affect changes in reservoir properties. (3) Other influencing factors such as temperature and pressure primarily operate through their impact on these aforementioned internal causes.

5. Conclusions

(1)
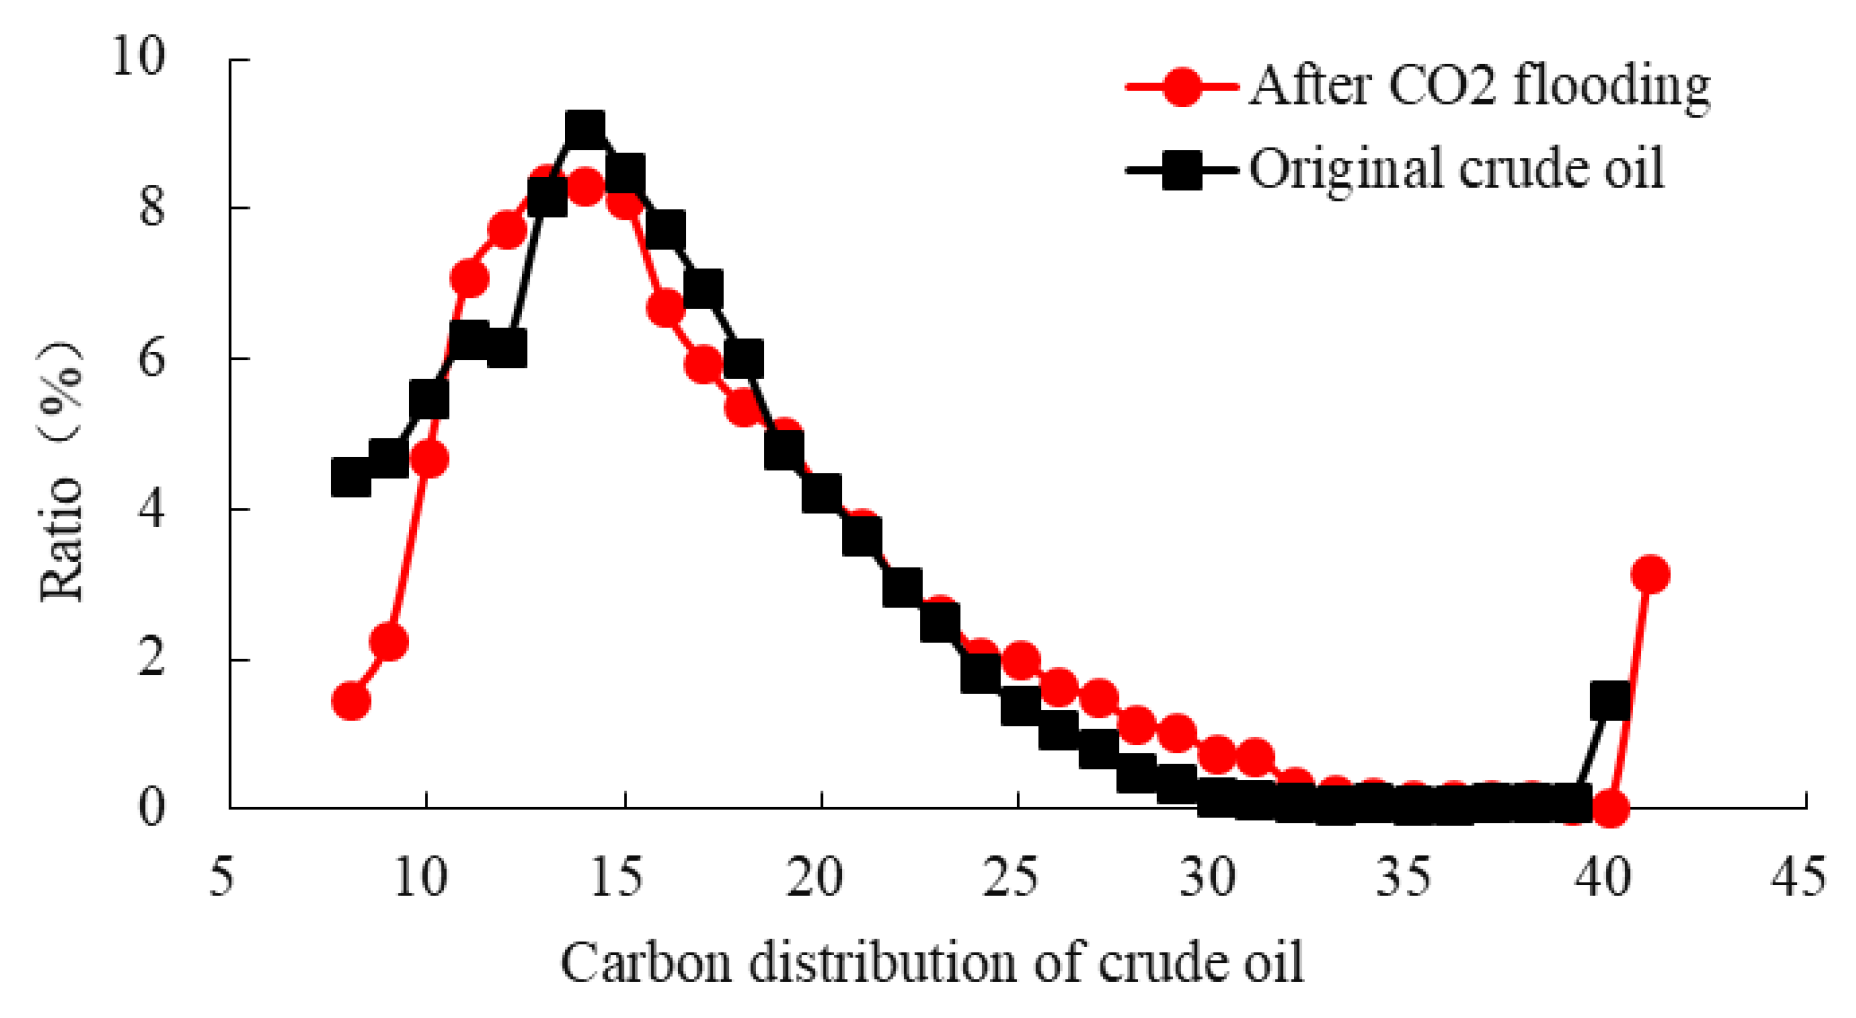
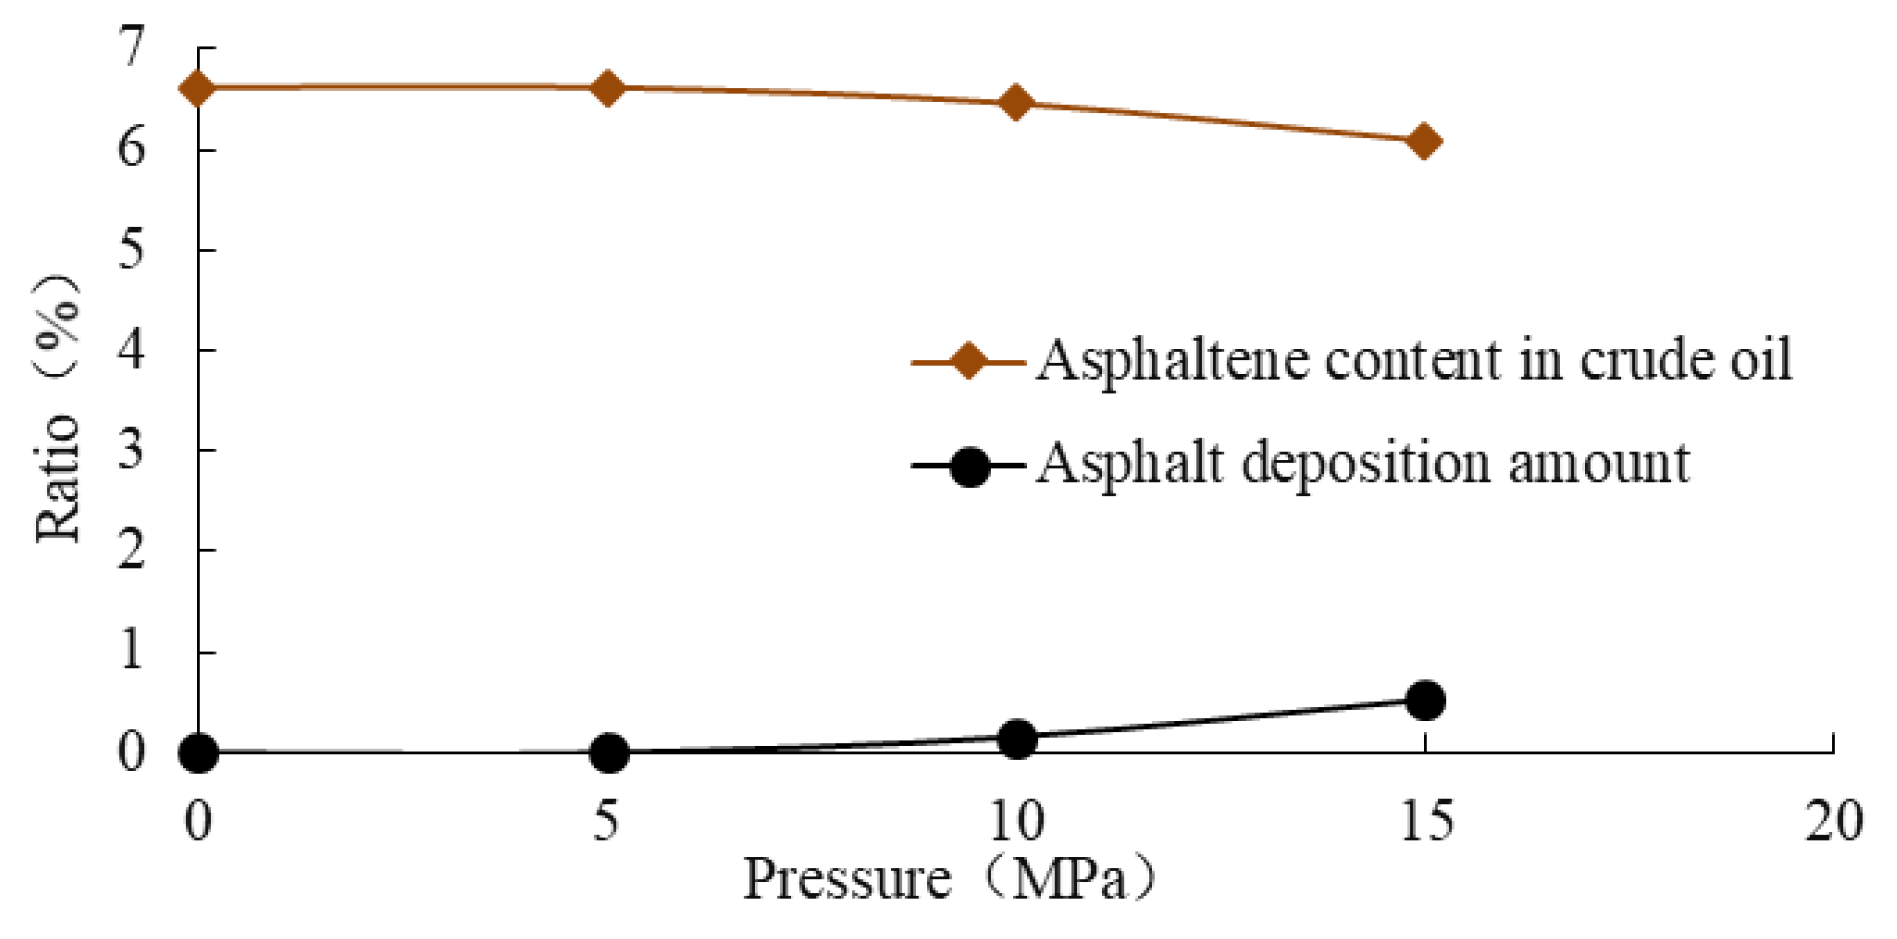
Under current reservoir temperature and pressure conditions, there will be no significant asphaltene deposition or calcium carbonate precipitation during CO2 flooding in the Chang 4 + 5 tight sandstone reservoir in the Ordos Basin. However, due to the combined effects of dissolution and secondary particle migration, CO2 injection may cause certain damage to the reservoir in the study area, resulting in a porosity reduction of approximately 2% and permeability decline ranging from 2% to 6%. Moreover, in areas near oil wells where pressure drops occur, the risk of calcium carbonate precipitation increases significantly. Therefore, during the production process, it is essential to reasonably control the production pressure difference, with a recommended limit within 4 MPa, in order to minimize potential damage to the reservoir.
(2)
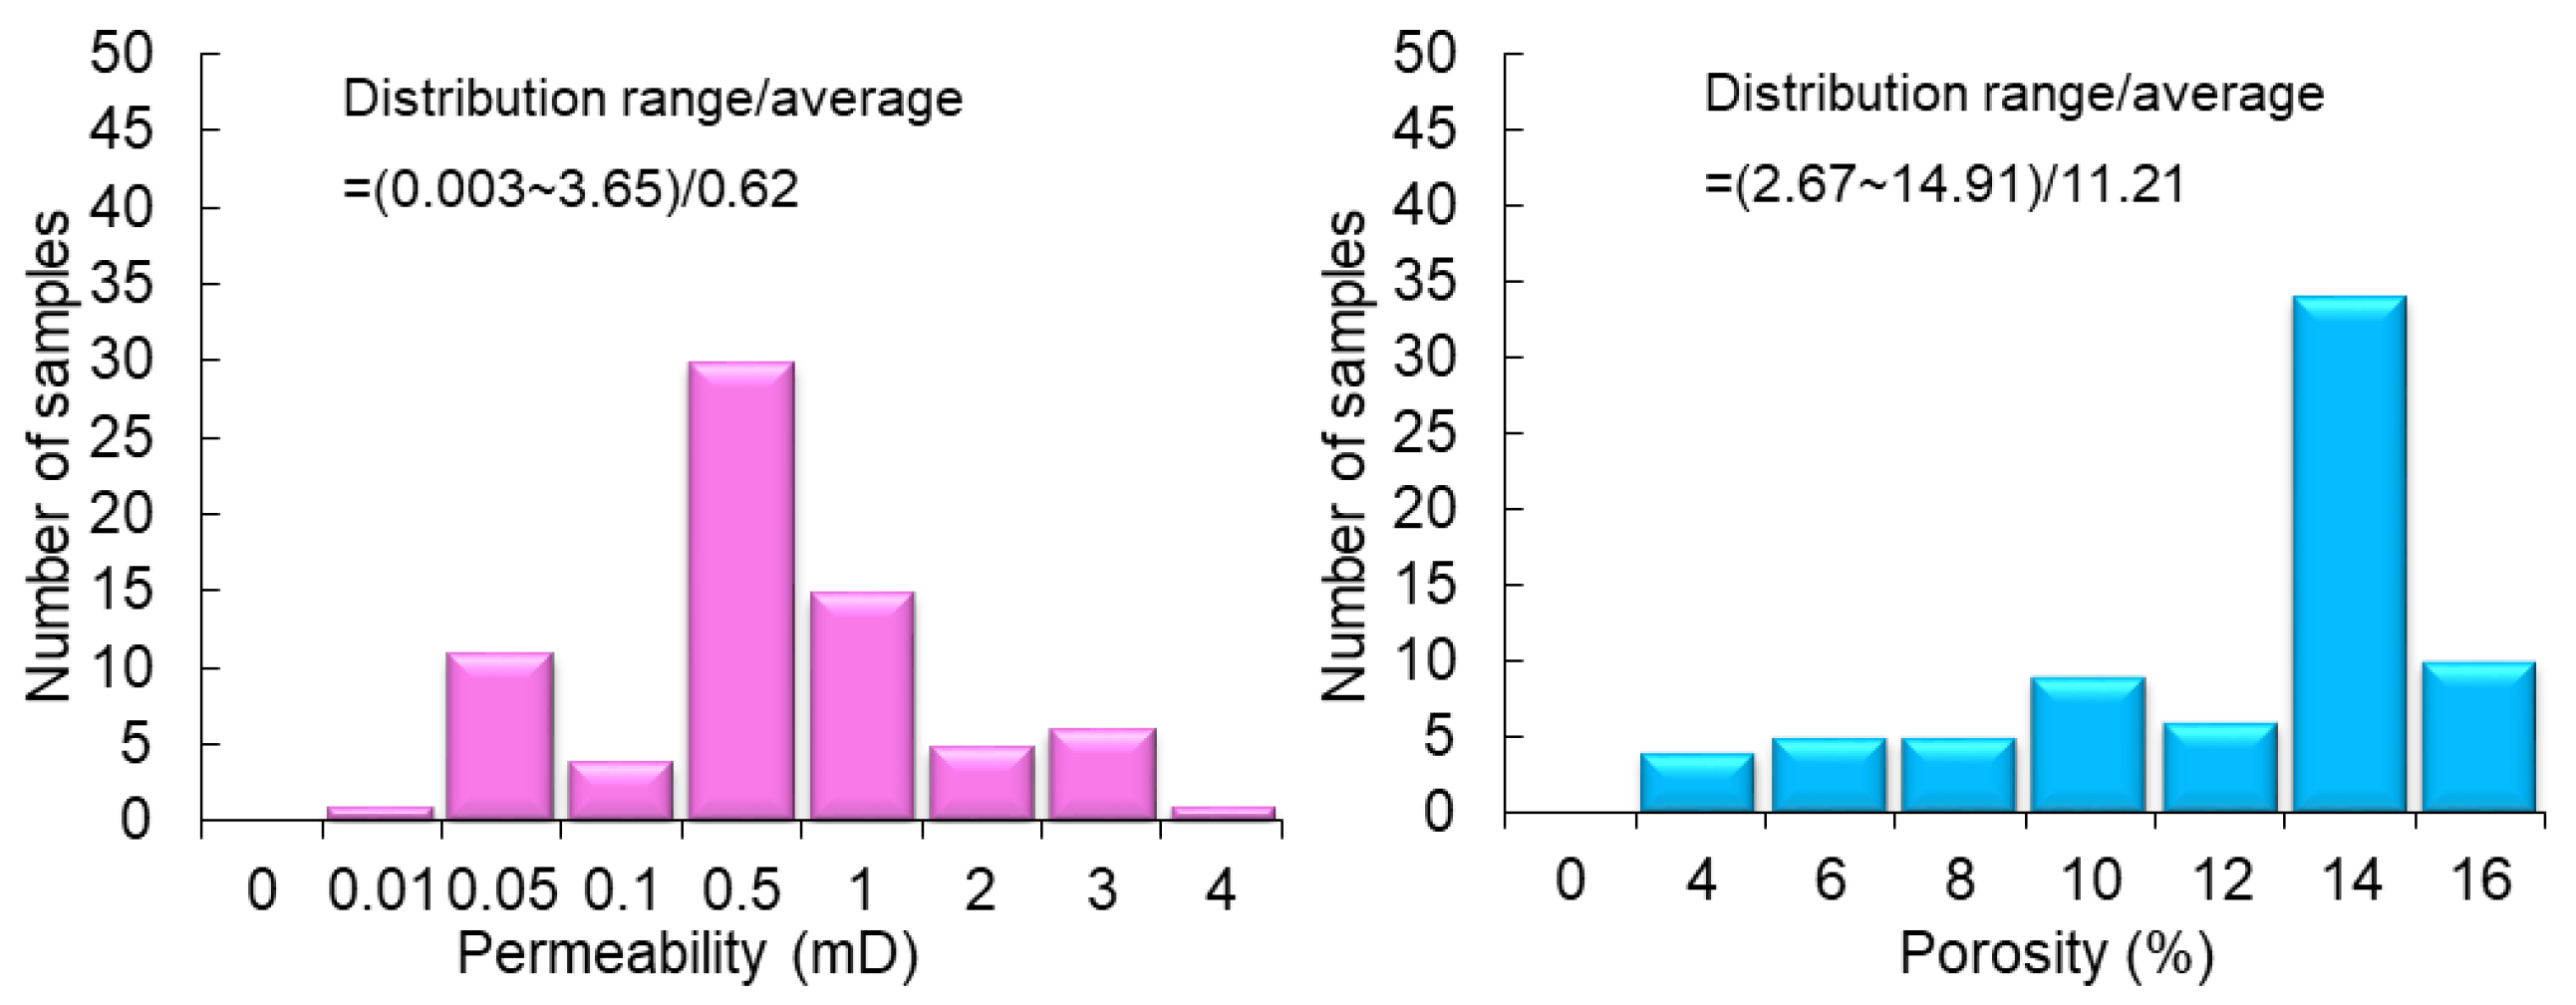
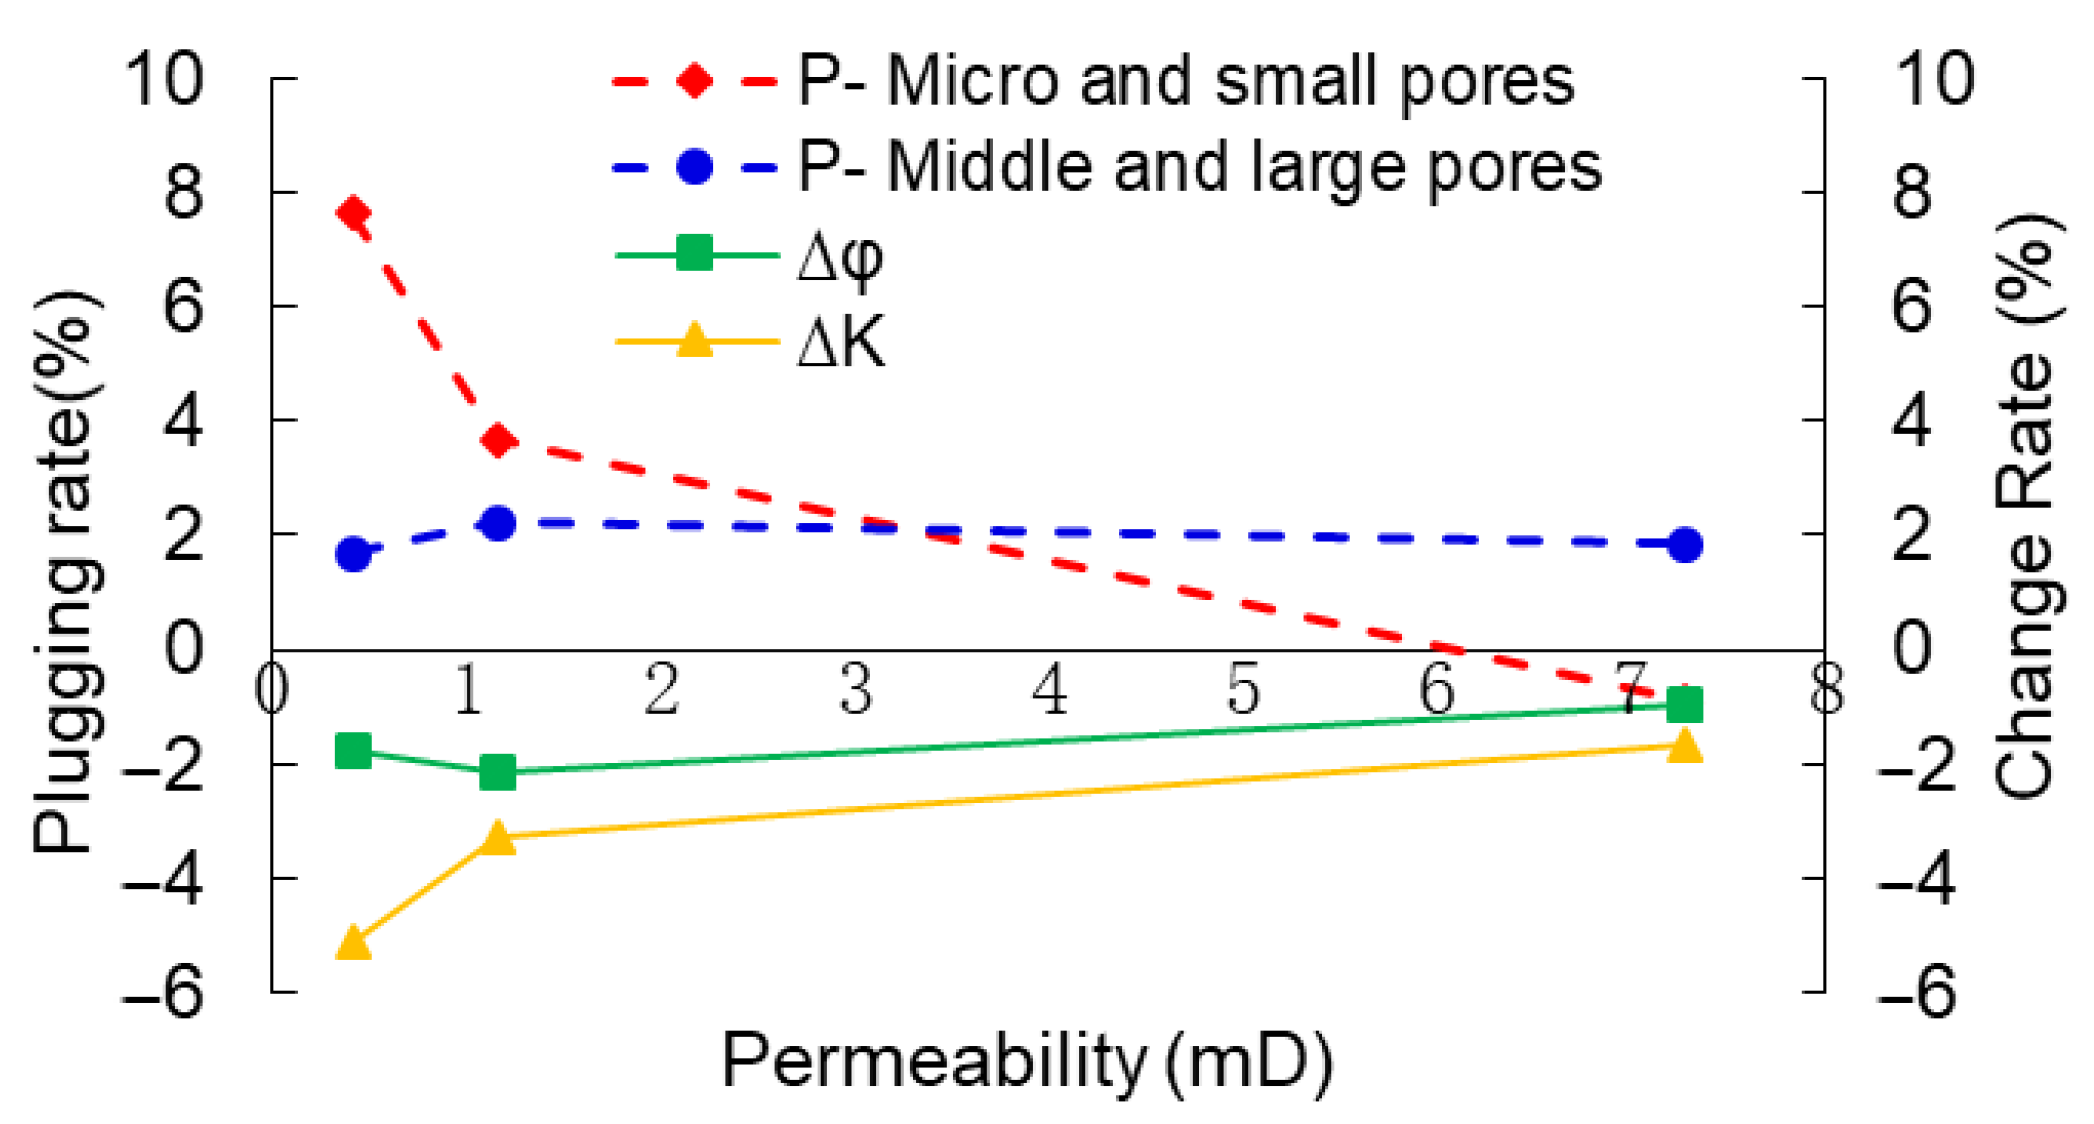
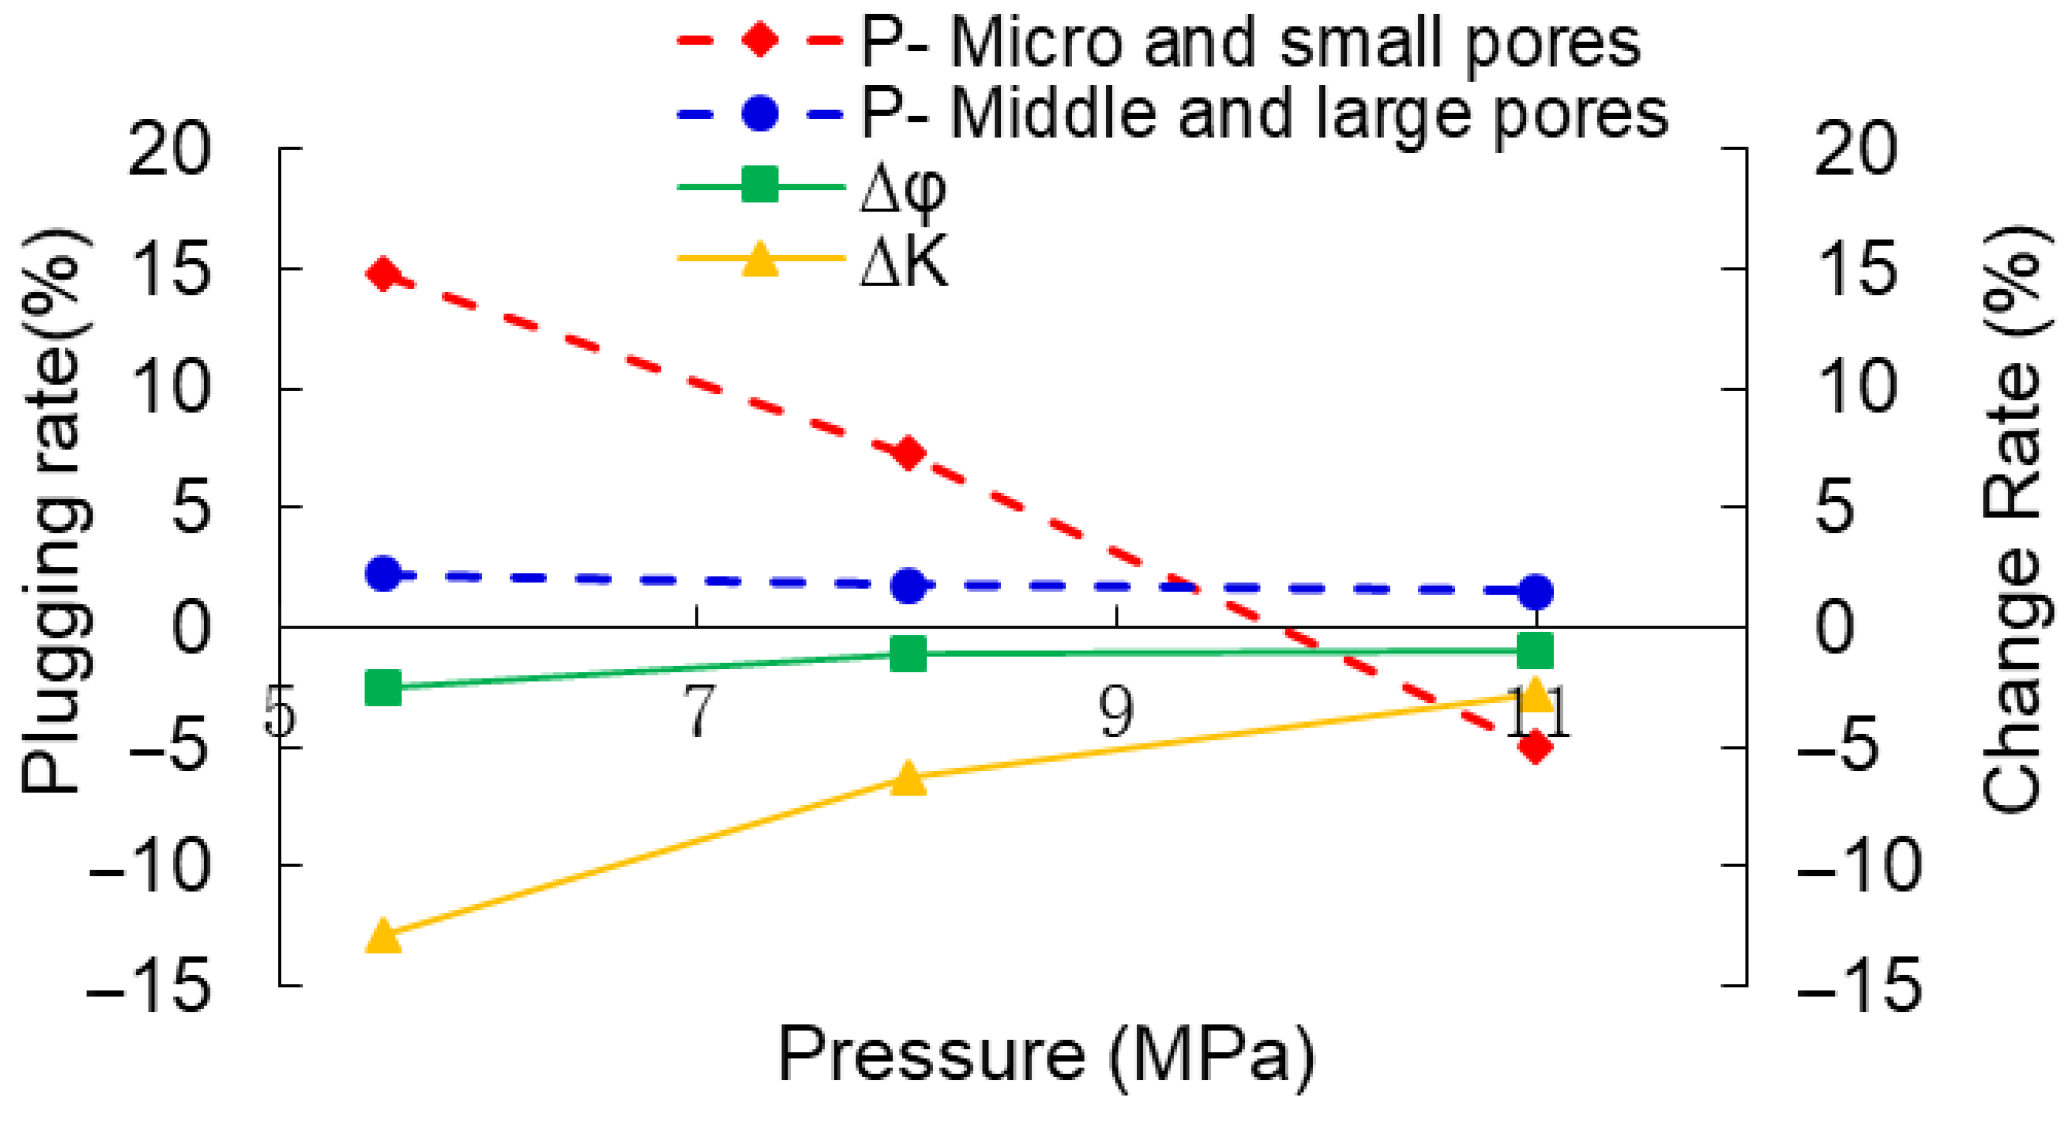
The dissolution of feldspar and secondary particles migration are the fundamental reasons for the changes in reservoir properties during CO2 flooding in the tight sandstone reservoir in the Ordos Basin, and the degree of reservoir damage varies with different permeabilities and pore throat structures. With increasing permeability, micro pore blockage decreases, and the damage of CO2 flooding to the permeability of the reservoir is weakened. The proportion and the size of micro pores in tight reservoir are significant factors determining the damage degree of CO2 flooding to the reservoir. When permeability is lower than 0.5 × 10⁻³ μm2, the reservoir is dominated by micro-nano pore throats, and CO2-induced permeability damage becomes significant. During reservoir screening for CO2 flooding, reservoirs with permeability greater than 1 × 10⁻³ μm2 are recommended, while ultra-low permeability reservoirs with narrow pore throats should be avoided where possible.
(3)
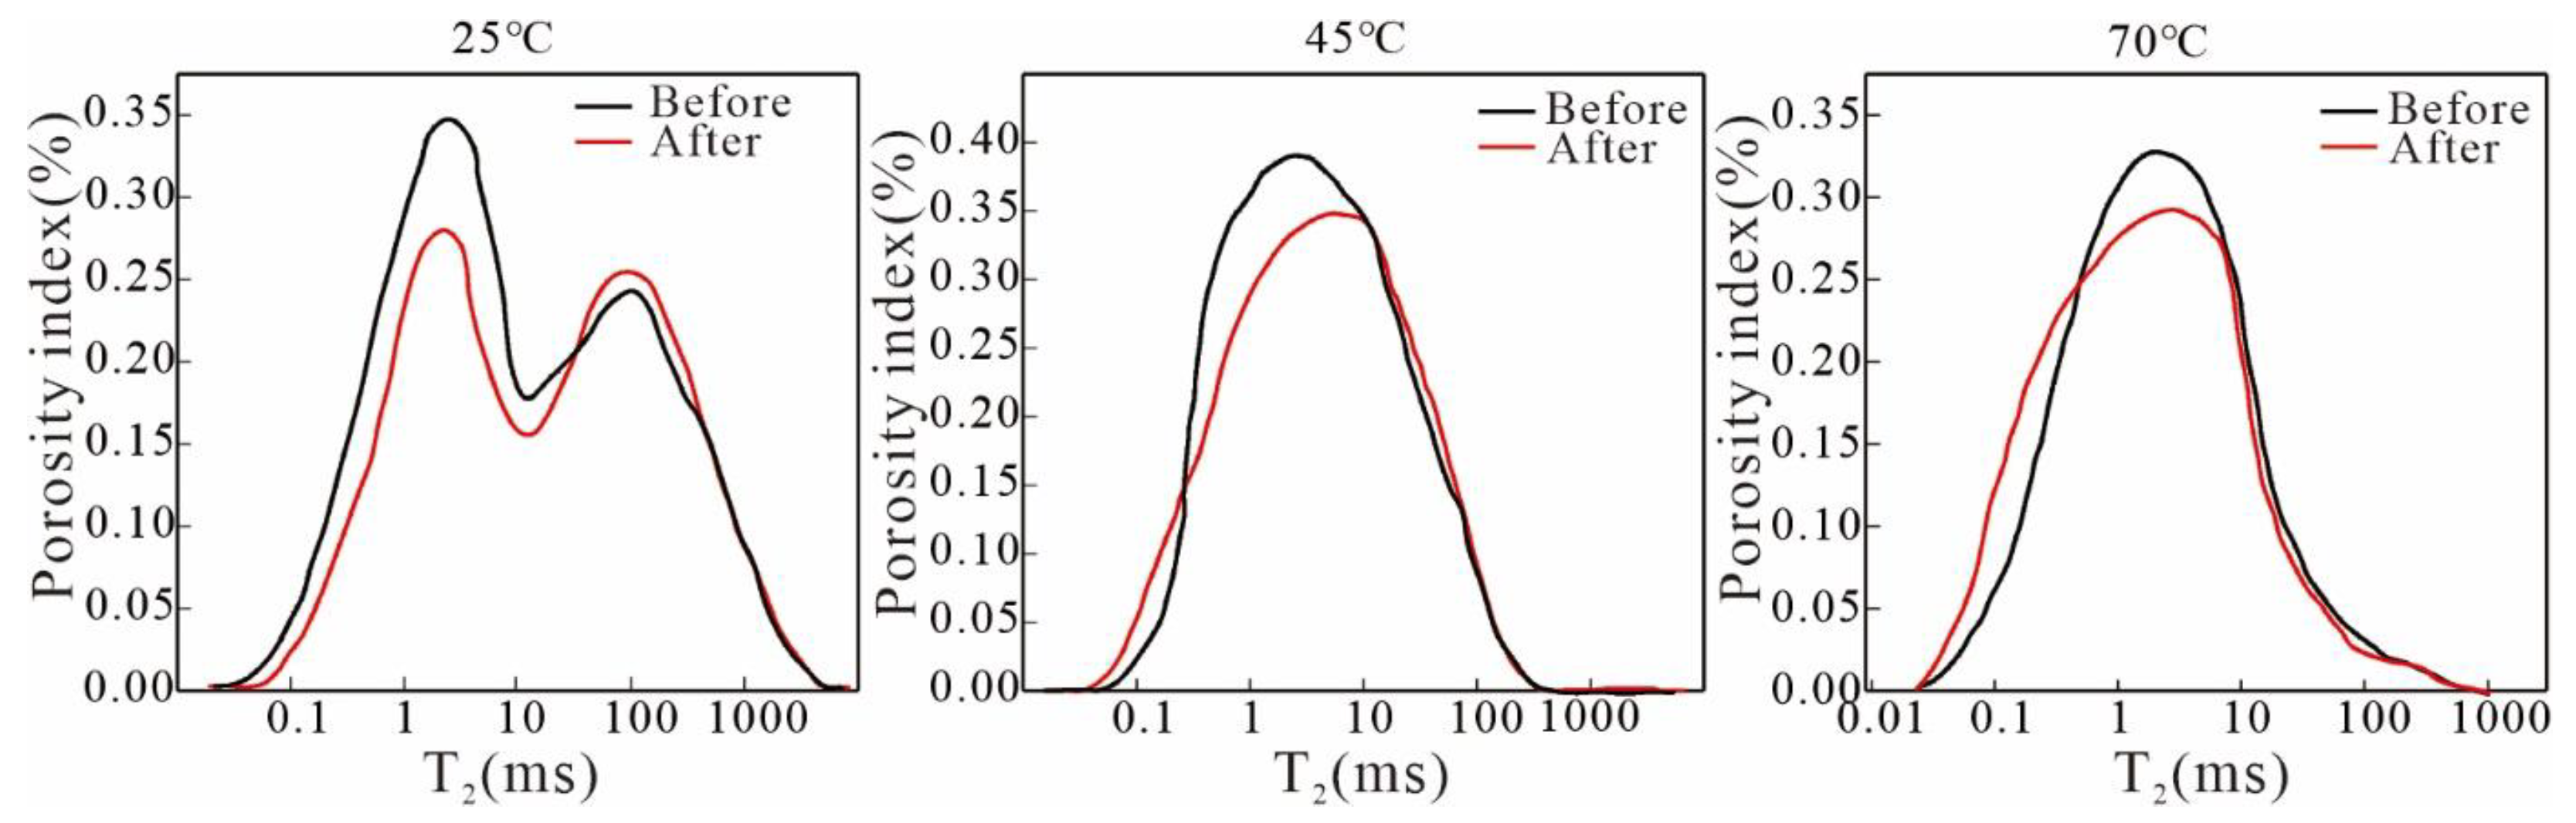
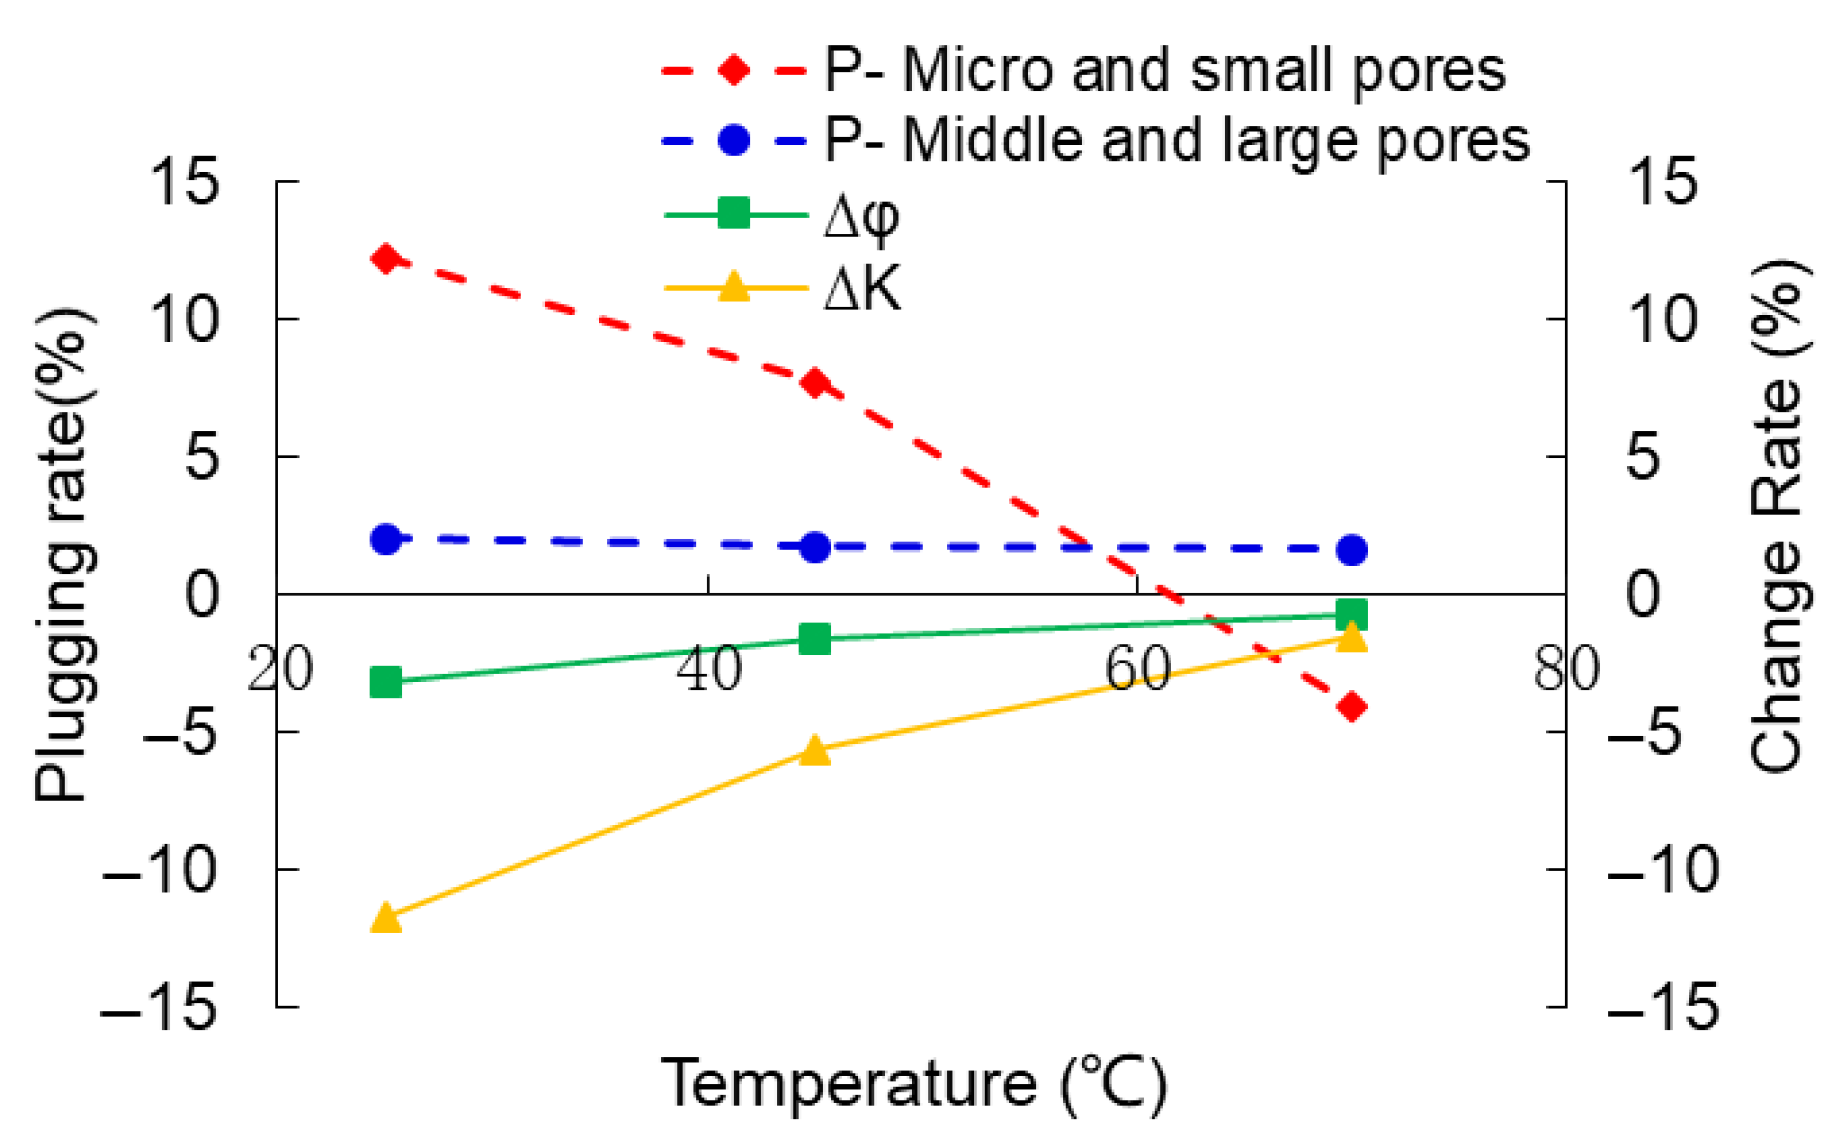
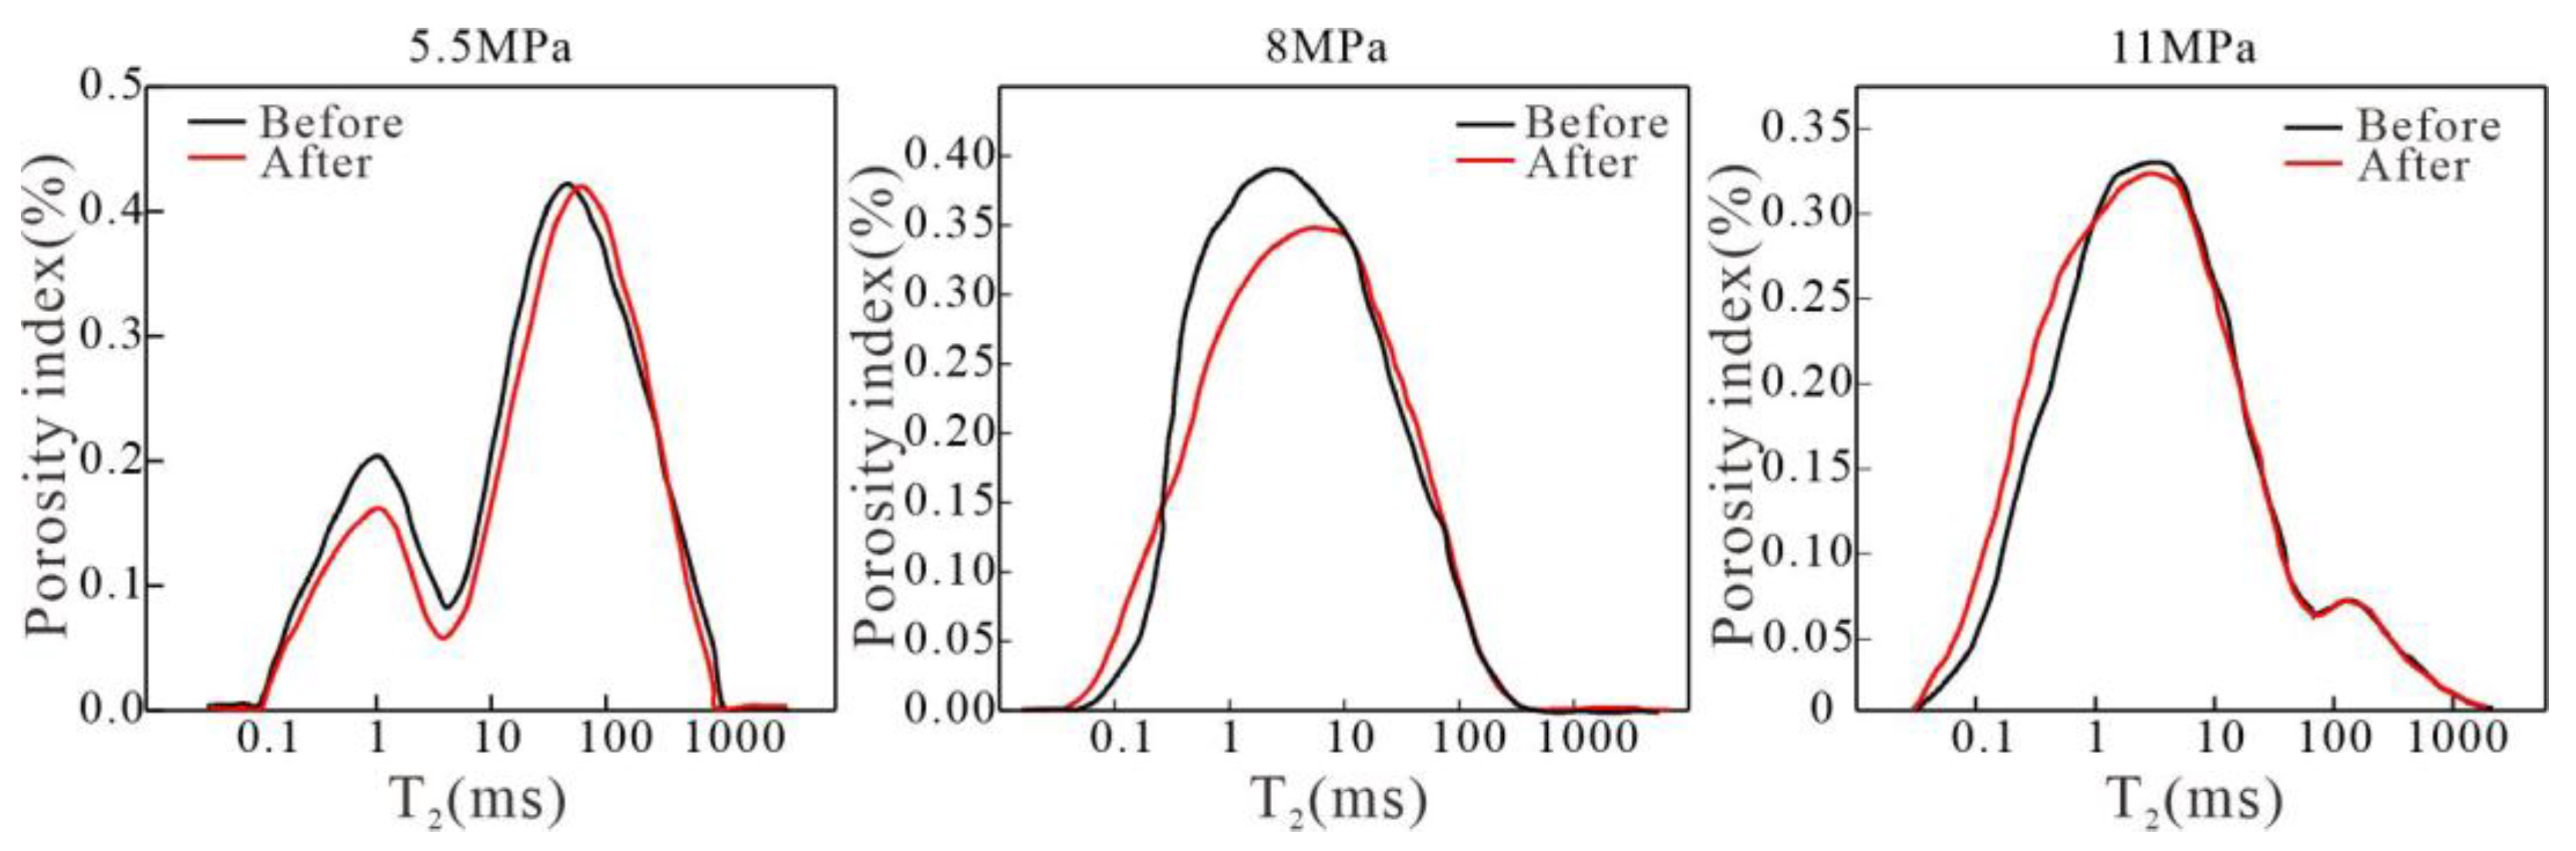
Temperature and pressure have a significant impact on the extent of reservoir damage caused by CO2 flooding in the study region. As both parameters increase, the damage inflicted on the reservoir by CO2 injection gradually diminishes. Specifically, when the temperature exceeds 70 °C and the pressure surpasses 11 MPa, the impact of CO2 injection on reservoir permeability becomes minimal. Under certain reservoir temperature, increasing CO2 injection pressure can reduce damage to the reservoir. It is therefore advised to avoid implementing CO2 flooding projects in areas characterized by low temperatures and severe reservoir pressure depletion.
(4)
Long-term CO2 injection can lead to significant dissolution of reservoir rocks. In reservoirs with potential fluid channeling pathways such as fractures and faults, leakage risk increases significantly during the mid-to-late stage of CO2 injection. It is recommended to enhance leakage monitoring at critical locations, including areas near injection/production wellbores, fault zones, and along preferential CO2 migration pathways. This ensures both the effectiveness and safety of the CO2 flooding and sequestration project.

Author Contributions

Conceptualization, Q.S.; Methodology, Y.W.; Investigation, Q.S.; Resources, Y.W.; Data Curation, Q.S.; Writing—Original Draft Preparation, Q.S.; Writing—Review and Editing, Y.W.; Supervision, D.W.; Project Administration, L.C.; Funding Acquisition, L.C. All authors have read and agreed to the published version of the manuscript.

Funding

This research was funded by the National Key Research and Development Program of China, CO2 displacement technology and geological storage safety monitoring, grant number 2018YFB0605500.

Data Availability Statement

The original contributions presented in this study are included in the article. Further inquiries can be directed to the corresponding author.

Conflicts of Interest

Authors Qinghua Shang, Dengfeng Wei and Longlong Chen was employed by the company Research Institute of Yanchang Petroleum (Group) Co., Ltd. The remaining authors declare that the research was conducted in the absence of any commercial or financial relationships that could be construed as a potential conflict of interest.

Abbreviations

The following abbreviations are used in this manuscript:
CO2Carbon dioxide
EOREnhanced oil recovery
XRDX-ray diffraction
SEMScanning electron microscope
NMRNuclear magnetic resonance
ICPInductively coupled plasma
IGIon chromatograph

References

  1. Hackley, P.C.; Warwick, P.D. Unconventional energy resources: 2015 review. Nat. Resour. Res. 2015, 24, 443–508. [Google Scholar] [CrossRef]
  2. Zou, C.; Zhai, G.; Zhang, G.; Wang, H.; Zhang, G.; Li, J.; Wang, Z.; Wen, Z.; Ma, F.; Liang, Y.; et al. Formation, distribution, potential and prediction of global conventional and unconventional hydrocarbon resources. Petroleum Explor. Dev. 2015, 42, 13–25. [Google Scholar] [CrossRef]
  3. Wang, H.; Ma, F.; Tong, X.; Liu, Z.; Zhang, X.; Wu, Z.; Li, D.; Wang, B.; Xie, Y.; Yang, L. Assessment of global unconventional oil and gas resources. Petroleum Explor. Dev. 2016, 43, 850–862. [Google Scholar] [CrossRef]
  4. Hein, F.; Ambrose, W.; Hackley, P.; Mead, J.S. Unconventional energy resources: 2017 review. Nat. Resour. Res. 2017, 28, 1661–1751. [Google Scholar] [CrossRef]
  5. Zhu, R.; Li, G.; Cui, J.; Huang, F.; Lu, X.; Guo, Z.; Cao, Z. Geological accumulation conditions and exploration prospects of tight oil and gas in China. Acta Pet. Sin. 2025, 46, 17–32. [Google Scholar]
  6. Hu, S.; Zhu, R.; Wu, S.; Bai, B.; Yang, Z.; Cui, J. Exploration and development of continental tight oil in China. Petroleum Explor. Dev. 2018, 45, 790–802. [Google Scholar] [CrossRef]
  7. Liu, S. Review of the Development Status and Technology of Tight Oil: Advances and Outlook. Energy Fuels 2023, 37, 14645–14665. [Google Scholar] [CrossRef]
  8. Tao, L.; Li, Z.; Zhang, N.; Sun, H. CO2 Capture and for Improving Heavy Oil Recovery. In Proceedings of the Asia-Pacific Power and Energy Engineering Conference, Wuhan, China, 28 March 2009. [Google Scholar]
  9. Yang, Y.; Liao, G.; Wu, Y.; Ma, X.; Dong, Z.; Li, W.; Wei, J. Displacement efficiency and storage characteristics of CO2 in low permeability reservoirs: An experimental work. Energy Explor. Exploit. 2023, 41, 601–618. [Google Scholar] [CrossRef]
  10. Qin, J.; Han, H.; Liu, X. Application and enlightenment of carbon dioxide flooding in the United States of America. Pet. Explor. Dev. 2015, 42, 232–240. [Google Scholar] [CrossRef]
  11. Lv, G.; Li, Q.; Wang, S.; Li, X. Key techniques of reservoir engineering and injection–production process for CO2 flooding in China’s SINOPEC Shengli Oilfield. J. CO2 Util. 2015, 11, 31–40. [Google Scholar] [CrossRef]
  12. Rahimi, V.; Bidarigh, M.; Bahrami, P. Experimental Study and Performance Investigation of Miscible Water-Alternating-CO2 Flooding for Enhancing Oil Recovery in the Sarvak Formation. Oil Gas Sci. Technol.-Rev. D IFP Energ. Nouv. 2017, 72, 35–47. [Google Scholar] [CrossRef]
  13. Wang, Y.; Morozov, I. Time-lapse acoustic impedance variations during CO2 injection in Weyburn oilfield, Canada. Geophysics 2020, 85, M1–M13. [Google Scholar] [CrossRef]
  14. Cheng, Q.; Li, Z.; Zhu, G. Research and Application of CO2 Flooding to Improve Oil Recovery in Low Permeability Oilfield. In Proceedings of the 6th International Conference on Energy and Environmental Protection, Zhuhai, China, 29 June 2017. [Google Scholar]
  15. Lu, M.; Qian, Q.; Zhong, A.; Zhang, Z.; Zhang, L. Investigation on the flow behavior and mechanisms of water flooding and CO2 immiscible/miscible flooding in shale oil reservoirs. J. CO2 Util. 2024, 80, 102660. [Google Scholar] [CrossRef]
  16. Wang, T.; Wang, L.; Meng, X.; Chen, Y.; Song, W.; Yuan, C. Key parameters and dominant EOR mechanism of CO2 miscible flooding applied in low-permeability oil reservoirs. Geoenergy Sci. Eng. 2023, 225, 211724. [Google Scholar] [CrossRef]
  17. Li, J.; Chen, Z.; Feng, Y.; Qu, L.; Liu, J.; Li, W.; Dai, M. Damage of reservoir rock induced by CO2 injection. Pet. Sci. 2022, 19, 1674–1681. [Google Scholar] [CrossRef]
  18. Wang, C.; Cui, M.; Wang, K.; Wei, Y.; Wang, K.; Gao, H. Full-Scale Experimental Study on the Effect of CO2 Flooding on Storage-Seepage Capacity of Tight Sandstone Reservoirs. ACS Omega 2023, 8, 11897–11907. [Google Scholar] [CrossRef]
  19. Sbai, M.; Azaroual, M. Numerical modeling of formation damage by two-phase particulate transport processes during CO2 injection in deep heterogeneous porous media. Adv. Water Resour. 2011, 34, 62–82. [Google Scholar] [CrossRef]
  20. Behbahani, T.; Ghotbi, C.; Taghikhani, V.; Shahrabadi, A. Investigation on asphaltene deposition mechanisms during CO2 flooding processes in porous media: A novel experimental study and a modified model based on multilayer theory for asphaltene adsorption. Energy Fuels 2012, 26, 5080–5091. [Google Scholar] [CrossRef]
  21. Khurshid, I.; Fujii, Y. Geomechanical analysis of formation deformation and permeability enhancement due to low-temperature CO2 injection in subsurface oil reservoirs. J. Pet. Explor. Prod. Technol. 2021, 11, 1915–1923. [Google Scholar] [CrossRef]
  22. Huang, X.; Tian, Z.; Zuo, X.; Li, X.; Yang, W.; Lu, J. The microscopic pore crude oil production characteristics and influencing factors by DME-assisted CO2 injection in shale oil reservoirs. Fuel 2022, 331, 125843. [Google Scholar] [CrossRef]
  23. Zhao, F.; Hou, J.; Huang, S. Asphaltene Deposition Induced by Carbon Oxide and its Influence on Displacement Efficiency. Adv. Mater. Res. 2012, 594–597, 2451–2454. [Google Scholar] [CrossRef]
  24. Zhao, Y.; Wang, T.; Song, Y.; Liu, Y.; Dong, B.; Zhu, N. Visualization of asphaltene deposition effects on porosity and permeability during CO2 flooding in porous media. J. Vis. 2016, 19, 603–614. [Google Scholar] [CrossRef]
  25. Li, R.; Liao, X.; Zou, J.; Gao, C.; Zhao, D.; Zhang, Y.; Zhou, X. Asphaltene Deposition during CO2 Flooding in Ultralow Permeability Reservoirs: A Case Study from Changqing Oil Field. Geofluids 2021, 6626114. [Google Scholar] [CrossRef]
  26. Qian, K.; Yang, S.; Dou, H.; Pang, J.; Huang, Y. Formation damage due to asphaltene precipitation during CO2 flooding processes with NMR technique. Oil Gas Sci. Technol.-Rev. D IFP Energ. Nouv. 2019, 74, 11. [Google Scholar] [CrossRef]
  27. Wang, C.; Li, T.; Gao, H.; Zhao, J.; Li, H. Effect of asphaltene precipitation on CO2-flooding performance in low-permeability sandstones: A nuclear magnetic resonance study. RSC Adv. 2017, 7, 38367–38376. [Google Scholar] [CrossRef]
  28. Behbahani, T.; Ghotbi, C.; Taghikhani, V.; Shahrabadi, A. Investigation of asphaltene adsorption in sandstone core sample during CO2 injection: Experimental and modified modeling. Fuel 2014, 133, 63–72. [Google Scholar] [CrossRef]
  29. Shiraki, R.; Dunn, T. Experimental study on water-rock interactions during CO2 flooding in the Tensleep Formation, Wyoming, USA. Appl. Geochem. 2000, 15, 265–279. [Google Scholar] [CrossRef]
  30. Tang, Y.; Lv, C.; Wang, R.; Cui, M. Mineral dissolution and mobilization during CO2 injection into the water-flooded layer of the Pucheng Oilfield, China. J. Nat. Gas Sci. Eng. 2016, 33, 1364–1373. [Google Scholar] [CrossRef]
  31. Han, J.; Han, S.; Sung, W.; Lee, Y. Effects of CO2 miscible flooding on oil recovery and the alteration of rock properties in a carbonate reservoir. J. CO2 Util. 2018, 28, 26–40. [Google Scholar] [CrossRef]
  32. Narayanan, P.; Khosravi, M.; Weibel, R.; Meirles, L.; Schovsbo, N.; Stenby, E.; Yan, W. Long tube flooding tests for investigating salt precipitation induced by CO2 injection. Carbon Capture Sci. Technol. 2023, 9, 100143. [Google Scholar] [CrossRef]
  33. Yusof, M.; Neuyam, Y.; Ibrahim, M.; Saaid, I.; Idris, A.; Mohamed, M. Experimental study of CO2 injectivity impairment in sandstone due to salt precipitation and fines migration. J. Pet. Explor. Prod. Technol. 2022, 12, 2191–2202. [Google Scholar] [CrossRef]
  34. Liu, Y.; Fu, M.; Wang, C.; Xu, S.; Meng, F.; Shen, Y.; Yan, Y. The Damage Caused by Particle Migration to Low-Permeability Reservoirs and Its Effect on the Seepage Capacity after CO2 Flooding. Processes 2023, 11, 3279. [Google Scholar] [CrossRef]
  35. Khurshid, I.; Afgan, I. Geochemical investigation of CO2 injection in oil and gas reservoirs of Middle East to estimate the formation damage and related oil recovery. Energies 2021, 14, 7676. [Google Scholar] [CrossRef]
  36. Wang, Q.; Yang, S.; Lorinczi, P.; Glover, P.; Lei, H. Experimental investigation of oil recovery performance and permeability damage in multilayer reservoirs after CO2 and water−alternating-CO2 (CO2−WAG) flooding at miscible pressures. Energy Fuels 2020, 34, 624–636. [Google Scholar] [CrossRef]
  37. Sadati, E.; Sahraei, E.; Rahnema, M.; Aghdam, S.; Reyhani, M. The effect of CO2-enriched water salinity on enhancing oil recovery and its potential formation damage: An experimental study on shaly sandstone reservoirs. J. Pet. Explor. Prod. Technol. 2020, 10, 3791–3802. [Google Scholar] [CrossRef]
  38. Kord, S.; Mohammadzadeh, O.; Miri, R.; Soulgani, B. Further investigation into the mechanisms of asphaltene deposition and permeability impairment in porous media using a modiffed analytical model. Fuel 2014, 117, 259–268. [Google Scholar] [CrossRef]
  39. Alimohammadi, S.; Zendehboudi, S.; James, L. A comprehensive review of asphaltene deposition in petroleum reservoirs: Theory, challenges, and tips. Fuel 2019, 252, 753–791. [Google Scholar] [CrossRef]
  40. Cao, M.; Gu, Y. Oil recovery mechanisms and asphaltene precipitation phenomenon in immiscible and miscible CO2 flooding processes. Fuel 2013, 109, 157–166. [Google Scholar] [CrossRef]
  41. Wang, H.; Alvarado, V.; Bagdonas, D.; McLaughlin, J.; Kaszuba, J.; Grana, D.; Campbell, E.; Ng, K. Effect of CO2-brine-rock reactions on pore architecture and permeability in dolostone: Implications for CO2 storage and EOR. Int. J. Green. Gas Control 2021, 107, 103283. [Google Scholar] [CrossRef]
  42. Cui, G.; Ning, F.; Dou, B.; Li, T.; Zhou, Q. Particle migration and formation damage during geothermal exploitation from weakly consolidated sandstone reservoirs via water and CO2 recycling. Energy 2022, 240, 122507. [Google Scholar] [CrossRef]
  43. Yu, Z.; Liu, L.; Yang, Y.; Li, S.; Yang, Y. An experimental study of CO2-brine-rock interaction at in situ pressure–temperature reservoir conditions. Chem. Geol. 2012, 326, 88–101. [Google Scholar] [CrossRef]
  44. SY/T 7454-2019; Technical Specifications of Compiling the Development Plan of Sandstone Oilfield CO2 Flooding [Standard in Chinese]. National Energy Administration (NEA): Beijing, China, 2019. Available online: https://std.samr.gov.cn/db/search/stdDBDetailed?id=CA1B5CFFE8E14A15E05397BE0A0A1C07 (accessed on 14 July 2025).
  45. SY/T 6490-2023; Specification for Measurement of Rock NMR Parameter in Laboratory [Standard in Chinese]. National Energy Administration (NEA): Beijing, China, 2023. Available online: https://std.samr.gov.cn/hb/search/stdHBDetailed?id=1C3F24E40A0DE543E06397BE0A0AFB62# (accessed on 14 July 2025).
  46. SY/T 5163-2018; Analysis Method for Clay Minerals and Ordinary Non-Clay Minerals in Sedimentary Rocks by the X-ray Diffraction [Standard in Chinese]. National Energy Administration (NEA): Beijing, China, 2018. Available online: https://std.samr.gov.cn/hb/search/stdHBDetailed?id=8B1827F256BDBB19E05397BE0A0AB44A (accessed on 14 July 2025).
  47. Andrade, F.; Polo, L.; Janasi, V.; Carvalho, F. Volcanic glass in Cretaceous dacites and rhyolites of the Parana Magmatic Province, southern Brazil: Characterization and quantification by XRD-Rietveld. J. Volcanol. Geotherm. Res. 2017, 355, 219–231. [Google Scholar] [CrossRef]
  48. SY/T 5162-2021; Analytical Method for Rock Samples by Scanning Electron Microscope [Standard in Chinese]. National Energy Administration (NEA): Beijing, China, 2021. Available online: https://std.samr.gov.cn/hb/search/stdHBDetailed?id=DA2A0F8D9A299F00E05397BE0A0A8D2D (accessed on 14 July 2025).
  49. SY/T 5523-2016; Method for Analysis of Oilfiled Water [Standard in Chinese]. National Energy Administration (NEA): Beijing, China, 2016. Available online: https://std.samr.gov.cn/hb/search/stdHBDetailed?id=8B1827F1CCD3BB19E05397BE0A0AB44A (accessed on 14 July 2025).
  50. Brownstein, K.; Tarr, C. Importance of classical diffusion in NMR studies of water in biological cells. Phys. Rev. 1979, 19, 2446–2453. [Google Scholar] [CrossRef]
  51. Kweon, H.; Deo, M. The impact of reactive surface area on brine-rock-carbon dioxide reactions in CO2 sequestration. Fuel 2017, 188, 39–49. [Google Scholar] [CrossRef]
  52. Zhao, H.; Dilmore, R.; Allen, D.; Hedges, S.; Soong, Y.; Lvov, S. Measurement and modeling of CO2 solubility in natural and synthetic formation brines for CO2 sequestration. Environ. Sci. Technol. 2015, 49, 1972–1980. [Google Scholar] [CrossRef] [PubMed]
  53. Zhang, J.; Guan, Y.; Li, T.; Yin, G. Solubility Variation and Prediction Model of CO2 in Water-Bearing Crude Oil. ACS Omega 2022, 48, 44420–44427. [Google Scholar] [CrossRef]
  54. Gao, Z.; Feng, J.; Cui, J.; Wang, X.; Zhou, C.; Shi, Y. Physical simulation and quantitative calculation of increased feldspar dissolution pores in deep reservoirs. Petroleum Explor. Dev. 2017, 44, 387–398. [Google Scholar] [CrossRef]
  55. Du, S.; Zhao, Y.; Jin, J.; Kou, G.; Shi, Y.; Huang, X. Significance of the secondary pores in perthite for oil storage and flow in tight sandstone reservoir. Mar. Pet. Geol. 2019, 110, 178–188. [Google Scholar] [CrossRef]
  56. Sorai, M.; Ohsumi, T.; Ishikawa, M. Nanoscale surface observation of feldspar dissolved under supercritical CO2-water-mineral system. Energy 2005, 30, 2334–2343. [Google Scholar] [CrossRef]
Figure 1. Changes in crude oil composition before and after CO2 displacement.
Processes 13 02320 g001
Figure 2. Asphaltene content and deposition content under different pressures of CO2 injection.
Processes 13 02320 g002
Figure 3. Geographic location of the study area. (a) Structural division of the Ordos Basin and location of the study area; (b) sand composition of Chang 4 + 5.
Processes 13 02320 g003
Figure 4. Distribution of physical property parameters of Chang 4 + 5 reservoir in the study area.
Processes 13 02320 g004
Figure 5. The XRD quantitative phase analysis results of Chang 4 + 5 reservoir in the study area.
Processes 13 02320 g005
Figure 6. Structure diagram of the high-pressure reactor.
Processes 13 02320 g006
Figure 7. Schematic diagram of the NMR-assisted constant pressure displacement.
Processes 13 02320 g007
Figure 8. Schematic diagram of NMR T2 spectrum changes.
Processes 13 02320 g008
Figure 9. The variation in pH with pressure in calcium chloride solutions of different concentrations at 45 °C.
Processes 13 02320 g009
Figure 10. The variation in formation water pH with pressure during CO2 injection process at 45 °C.
Processes 13 02320 g010
Figure 11. The morphology of rock core slices. (a) Before reaction; (b) after reaction.
Processes 13 02320 g011
Figure 12. T2 spectra of cores with different permeability before and after CO2 displacement.
Processes 13 02320 g012
Figure 13. Damage degree of reservoirs with different permeability.
Processes 13 02320 g013
Figure 14. T2 spectra of cores with different temperatures before and after CO2 displacement.
Processes 13 02320 g014
Figure 15. Damage degree of reservoirs with different temperatures.
Processes 13 02320 g015
Figure 16. T2 spectra of cores with different pressures before and after CO2 displacement.
Processes 13 02320 g016
Figure 17. Damage degree of reservoirs with different pressures.
Processes 13 02320 g017
Figure 18. X-ray diffraction analysis of whole rock of cores before and after CO2 displacement.
Processes 13 02320 g018aProcesses 13 02320 g018b
Figure 19. Changes in ions and formation water salinity with displacement time. (a) Changes in ions. (b) The variation in formation water salinity.
Processes 13 02320 g019
Figure 20. Changes in rock morphology before and after CO2 displacement. (a) Before displacement; (b) after displacement.
Processes 13 02320 g020
Table 1. The basic physical properties of cores.
Core NumberLength (cm)Diameter (cm)Permeability (×10−3 μm2)Porosity (%)
W16.62.540.4139.25
W26.82.511.15810.07
W36.52.527.27212.34
W46.32.510.4729.29
W56.72.530.4359.26
W66.52.520.5019.32
W76.42.540.4199.25
W86.72.510.4879.30
W96.62.520.4459.27
Table 2. The chemical composition and salinity of formation water.
CompositionNa+K+Ca2+Mg2+Ba2+Sr2+ClHCO3SO42−Total Salinity
Concentration
mg/L
9040.31907.221,380.0108.1130.91383.362,125.0214.9114.296,403.9
Disclaimer/Publisher’s Note: The statements, opinions and data contained in all publications are solely those of the individual author(s) and contributor(s) and not of MDPI and/or the editor(s). MDPI and/or the editor(s) disclaim responsibility for any injury to people or property resulting from any ideas, methods, instructions or products referred to in the content.

