Article

Reliability Evaluation of New-Generation Substation Relay Protection Equipment Based on ASFSSA-LSTM-GAN

1
State Grid Henan Electric Power Company, Zhengzhou 450052, China
2
State Grid Henan Electric Power Company Electric Power Research Institute, Zhengzhou 450052, China
3
Wuhan Kemo Electric Co., Ltd., Wuhan 430223, China
4
School of Electricity and New Energy, Three Gorges University, Yichang 443002, China
*
Authors to whom correspondence should be addressed.
Processes 2025, 13(7), 2300; https://doi.org/10.3390/pr13072300
Submission received: 3 May 2025 / Revised: 14 June 2025 / Accepted: 15 June 2025 / Published: 19 July 2025
(This article belongs to the Section Energy Systems)

Abstract

In order to improve the reliability evaluation accuracy of a new generation of substation relay protection equipment under small-sample failure rate data, a Generative Adversarial Network (GAN) model based on the Adaptive Spiral Flying Sparrow Search Algorithm (ASFSSA) to optimize the Long Short-Term Memory (LSTM) network is proposed. Because of the adaptability of LSTM for processing time series, LSTM is embedded into the GAN, and the LSTM optimized by ASFSSA is used as the generator of GAN. The trained model is used to expand the original data samples, and the least squares method is used to estimate the distribution model parameters, to obtain the reliability function of the relay protection equipment, and to predict the operating life of the equipment. The results show that compared with other methods, the correlation coefficient of the expanded data samples is closer to the original data, and the life estimation of the equipment is more accurate. The model can be used as a reference for reliability assessment and acceptance testing of the new generation of substation relay protection equipment.

1. Introduction

With the expansion of China’s power system, its system structure has also become increasingly complex and volatile. Particularly for mining machinery, the high-power operation in extreme environmental conditions predisposes the electronic components within the system to malfunctions, thereby potentially compromising the system’s service life and exerting a detrimental effect on the actual production output. Therefore, the prediction of the lifespan of relay protection devices is extremely important [1,2,3,4]. The amount of operational failure data for relay protection equipment is extremely limited. Given this, achieving an accurate evaluation of the remaining service life of the equipment is a worthy researchable problem [5,6,7,8]. Common methods include the Markov model [9], Fault Tree Analysis, and the GO method [10], among which there are great limitations in dealing with small-sample failure data accuracy. In recent years, the effectiveness of machine learning based methods in reliability prediction has been minimal. Many scholars have conducted research on methods suitable for small sample analysis. For example, in reference [11], BP neural networks are used to expand training on small sample data, and finally, the least squares method is used to predict the lifespan of devices. However, this method has drawbacks such as slow learning speed and susceptibility to local minima, making it unsuitable for practical engineering applications. Reference [12] uses support vector machine theory to plot a Weibull probability paper for parameter estimation. However, its learning ability depends on the selection of the kernel function. If the selected kernel function is not sufficiently adapted to the model, it may introduce significant bias to the result. Reference [13] proposes a method to warn about the state of equipment by combining GAN with random forest algorithm. However, the GAN model has poor adaptability in dealing with time series data and cannot perform effective evaluation.
To address these challenges, this paper proposes a novel generative framework based on an LSTM-GAN architecture optimized by the ASFSSA, in which the generator is an LSTM network enhanced by ASFSSA. The LSTM network is particularly well-suited for modeling temporal dependencies in time-series data [14], while the ASFSSA enhances its ability to escape local optima and adaptively adjust its parameters. Within the GAN framework, the optimized LSTM generates high-quality synthetic fault data, and the discriminator learns to distinguish between real and generated samples through adversarial training. Once the model converges, the synthetic data is used to augment the original small dataset, and the least squares method is employed to estimate the parameters of the reliability distribution model. Experimental results demonstrate that the generated data exhibits a high degree of correlation with the real data, and the proposed method outperforms traditional approaches in terms of reliability prediction accuracy. This work provides a promising solution for improving the reliability evaluation and life prediction of substation relay protection devices under data-scarce conditions, offering valuable guidance for maintenance decision-making and equipment acceptance. In contrast to recent deep reinforcement learning (DRL) algorithms such as Deep Deterministic Policy Gradient (DDPG), Proximal Policy Optimization (PPO), and State-Action-Reward-State-Action (SARSA), which have shown strong real-time performance in routing and decision-making applications, the proposed ASFSSA-LSTM optimization framework is designed for offline scenarios with limited data availability [15,16,17]. DRL methods often rely on large-scale training datasets, online learning procedures, and complex reward shaping, which are not suitable for failure data that are sparse and costly to obtain. Therefore, the ASFSSA-LSTM framework offers a more practical and efficient solution for reliability assessment in substation environments where data acquisition is constrained [18]. The structure of this paper is organized as follows: Section 2 introduces the reliability distribution model of relay protection equipment. Section 3 presents the SFSSA optimization of the LSTM-GAN model. Section 4 describes the ASFSSA optimization applied to the reliability assessment of the LSTM-GAN model for relay protection equipment. Finally, Section 5 provides the analysis of numerical examples to validate the proposed methods.
The main contributions of this paper are summarized as follows:
  • A novel generative framework is proposed based on an LSTM-GAN architecture optimized by the ASFSSA, effectively addressing the issue of small sample size in fault data.
  • The LSTM network, enhanced by ASFSSA, improves the generator’s ability to model temporal dependencies and escape local optima.
  • A least squares-based reliability estimation method is employed to fit the reliability distribution model using both real and synthetic data.
  • This work provides a practical solution for reliability assessment and life prediction of substation relay protection devices in data-scarce scenarios.

2. Reliability Distribution Model of Relay Protection Equipment

The two-parameter Weibull model [19,20,21] is widely used in reliability and equipment life analysis. Since the lifespan of relay protection devices follows a Weibull distribution, this paper employs the Weibull model to evaluate their reliability. The expressions for the reliability function and failure rate function are as follows:
Reliability function:
F t = e t α β
Failure rate function:
λ t = β α β · t β 1
In the equations, t is time; α is the scale parameter; β is the shape parameter.

3. SFSSA Optimizes the GAN Model of LSTM

To address the low evaluation accuracy caused by directly using small-sample failure data in the reliability assessment of relay protection equipment, this paper proposes a method that employs the ASFSSA to optimize the LSTM-GAN model. The optimized model is used to first generate expanded data samples and then evaluate equipment reliability based on the augmented data, thereby improving evaluation accuracy. The model is described as follows.

3.1. Principles of GAN Model

GAN consists of a generator G and a discriminator D. The role of G is to mimic real samples from the training set, while D is responsible for distinguishing real data from the mixed input. The two networks learn from each other through adversarial training, eventually making D unable to tell the difference between real and fake data, thereby achieving the optimization goal [22]. At this point, G can generate samples that match the distribution of the real data.

3.2. Generator Model Construction

The generator is responsible for producing samples that are as realistic as possible, such that the discriminator is unable to distinguish them from real ones [23]. After training, the generator’s predicted future values can be used as input data for evaluating the reliability of relay protection equipment. In this study, an LSTM network optimized by the ASFSSA algorithm is employed as the GAN’s generator, which improves the model’s ability to escape local optima and enhances prediction accuracy.

3.2.1. ASFSSA Algorithm

The Sparrow Search Algorithm (SSA) is a swarm intelligence optimization algorithm that simulates the foraging and anti-predation behaviors of sparrows. The ASFSSA improves upon it by introducing a tent mapping strategy based on a random variable to enhance the initialization process. The mapping is defined as follows:
x i + 1 = 2 x i + rand ( 0,1 ) × 1 N , 0 x 1 2 2 1 x i + rand ( 0,1 ) × 1 N , 1 2 x 1
The Bernoulli-transformation expression is
x i + 1 = 2 x i mod 1 + rand ( 0,1 ) × 1 N
In the formula, N represents the number of particles in the chaotic sequence. An initial value x 0 is randomly generated in the range (0, 1), and i = 1 is set. The sequence x is iteratively generated using Equation (4), incrementing i by 1 in each step. The iteration stops when the maximum number of iterations is reached, and the resulting x sequence is stored.
ASFSSA incorporates an inertia weight w that dynamically changes with the number of iterations during the explorer phase of the sparrow optimization process. In the early stages of the algorithm, this weight helps reduce the influence of random initialization and maintains a balance with the subsequent Levy flight mechanism, thereby enhancing both local exploitation and global exploration capabilities. In the sparrow population, explorers play a guiding role, leading other individuals toward food sources. ASFSSA strengthens the adaptive weighting mechanism of these explorers, which improves the positional accuracy of individuals. As a result, the population converges more quickly toward the global optimum, accelerating the overall convergence rate. Based on the behavioral characteristics of sparrows, the adaptive weight is calculated as follows:
w ( t ) = 0.2 cos π 2 1 t iter max
Equation (5) indicates that the inertia weight w exhibits nonlinear variation within the interval [0, 1]. By leveraging the properties of the cosine function, the weight starts at a relatively low value, which accelerates the early-stage optimization process. As the algorithm progresses, the weight gradually increases, while its rate of change decreases, thus achieving a balanced trade-off between exploration and convergence. The updated position of the improved explorer is as follows:
X i , j t + 1 = w t · X i , j t · e i α · iter max , R 2 < ST w t · X i , j t + Q · L           , R 2 ST
The introduction of an adaptive weight dynamically adjusts the positional changes of sparrows, enabling explorers to adopt different guidance strategies at various stages. This increases the flexibility of the algorithm’s search process. As the number of iterations increases, individuals tend to converge toward the optimal solution. A larger weight leads to faster movement, thereby accelerating the overall convergence of the algorithm.
In SSA, the roles assigned to individuals within the population are limited, and those with the same role follow identical position update formulas. This can lead to multiple individuals converging to the same optimal position, resulting in high solution redundancy that reduces the algorithm’s efficiency and hinders further optimization. Explorers, due to their broader search range and stronger global search capability, benefit significantly from the introduction of an adaptive weighting strategy, which enhances convergence performance. However, when addressing high-dimensional or complex optimization problems, the algorithm may still become trapped in local optima. To mitigate this issue, the Levy flight strategy is incorporated to increase the randomness of position updates, thereby enhancing population diversity. This not only reduces the risk of premature convergence, but also improves the overall operational efficiency of the algorithm.
The Levy flight follows a Levy distribution. It utilizes a random mechanism of long and short distances to cover a large area. After incorporating the Levy flight mechanism, the performance of the algorithm has been enhanced. The position update formula with the introduction of the Levy flight strategy is as follows:
x i t = x i t + l Levy ( λ )
In the formula, x i t represents the position of the i -th individual at the iteration t , and x i t denotes the arithmetic symbol for element-wise multiplication. l represents the step size control parameter, which is obtained through the following formula: l = 0.01 ( x i t x p ) . Levy ( λ ) is a path that follows the Levy distribution, representing the introduced Levy flight strategy, and satisfies the following condition: Levy ~ u = t λ , 1 < λ < 3 .
Due to the complexity of the Levy distribution, it is typically simulated using the Mantegna algorithm. The formula for calculating the step size is as follows:
s = μ v 1 γ , μ ~ N 0 , σ μ 2 , v ~ N 0 , σ v 2 , σ μ = Γ ( 1 + γ ) sin ( π γ / 2 ) γ · Γ [ ( 1 + γ ) / 2 ] · 2 ( γ + 1 ) / 2 1 γ
In the formula, σ v = 1 , and γ is typically set to 1.5. The introduction of the Levy flight strategy enhances the exploration ability of sparrows during this phase, allowing them to escape local optima and guide other individuals toward better solutions. By combining the Levy flight mechanism with the adaptive weight strategy, the algorithm achieves a balanced search process, improves the quality of candidate solutions, and significantly enhances the overall search performance.
Based on their fitness ranking, the top pNum individuals are selected as explorers (where pNum denotes the total number of explorers), and the remaining individuals are assigned as followers. The positions of the explorers are updated according to Equations (6) and (7).
In SSA, followers update their positions based on those of the explorers, which may lead to a certain degree of search blindness and homogeneity. To overcome this limitation, the ASFSSA introduces a variable spiral position-update strategy that enhances the flexibility of follower updates and enables the development of diverse search trajectories, thereby balancing the algorithm’s global and local search capabilities. During the position update process, maintaining a fixed spiral trajectory can result in search monotony and an increased risk of falling into local optima, thus weakening the overall search performance. To address this, a design parameter z is introduced as an adaptive variable to dynamically adjust the spiral shape, expanding the population’s ability to explore unknown regions and improving both search efficiency and global optimization capability. The formula for the variable spiral position-update strategy is as follows:
X i , j t + 1 = e zl · cos 2 π l · Q · e X worst t X i , j t i 2 , i > n 2 X P t + 1 + X i , j t X P t + 1 · A + · L · e zl · cos 2 π l , i n 2 z = e k · cos ( π · ( 1 ( i / i max ) ) ) .
In Equation (9), X P t + 1 represents the best position occupied by the explorer up to iteration t + 1 , while X worst t denotes the worst position occupied during iteration t . Matrix A is of size l × D , with each element randomly assigned a value of 1 or −1. Its generalized inverse is denoted as A + = A T ( A A T ) 1 . If i > n / 2 , it indicates that the current follower is located at the periphery of the population and lacks access to food. In this case, the follower must search for food independently. Otherwise, the follower continues to track the explorer’s movements in search of food.
To more clearly explain the design concept of the variable spiral position-update strategy in Equation (9), this strategy dynamically adjusts the size and amplitude of the spiral trajectory, achieving a balance between global exploration and local exploitation. The parameter z varies with the number of iterations, combining exponential and cosine functions to gradually shrink the search range, ensuring the algorithm quickly finds high-quality solutions in the early stages and performs fine local searches in later stages, thereby improving optimization accuracy and convergence speed. The introduction of the random matrix A and its generalized inverse enhances search diversity and helps avoid local optima. When an individual is located at the periphery of the population i > n / 2 , it searches for food independently; otherwise, it tracks the explorer’s position to search collaboratively.
The parameter z , which varies with the number of iterations, is defined using an exponential function involving the constant e . The size and amplitude of the spiral trajectory are dynamically adjusted according to the cosine function, with k serving as the variation coefficient. To maintain an appropriate search range, k is set to 5. The parameter L is a uniformly distributed random number in the interval [−1,1]. As the follower’s position update range gradually decreases over time, the algorithm is able to identify high-quality solutions in the early stages and reduce computational effort in the later stages. This enhances its global search performance. Simultaneously, the spiral structure contributes to improving the algorithm’s optimization accuracy, to a certain extent.
Subsequently, Equation (9) is applied to update the positions of the followers, and Equation (10) governs the position update of the sparrows identified as being in danger.
X i , j t + 1 = X best t + β · X i , j t X best t             , f i f g X i , j t + K · X i , j t X w o r s t t f i f w + ε , f i = f g
In the formula, X best t represents the global optimal solution obtained in the t -th iteration. The parameters β , K and ε are constants within the formula. Specifically, β is a random number following a standard normal distribution, used to control the step size. K is any random number between −1 and 1, representing the movement direction and also serving as a step size control parameter. ε is a small positive constant introduced to avoid division by zero. The term f i denotes the fitness value of the i -th individual, and f g and f w represent the best and worst fitness values in the current iteration, respectively. If f i > f g , the individual is located on the periphery of the population and is more vulnerable to predator attacks. Conversely, if the individual is situated near the center of the population, it needs to move closer to other individuals to reduce the likelihood of being captured.
Equation (10) flexibly adjusts the position based on the fitness of each individual, combining the random step size parameter β and the direction parameter K to achieve dynamic changes in the search step and direction, thereby enhancing the algorithm’s ability to escape local optima. To prevent numerical instability, a small constant ε is introduced to avoid division by zero. Individuals select corresponding movement strategies according to their fitness, relative to the best and worst fitness values in the population, which strengthens the algorithm’s robustness and global search capability.
After each iteration, the fitness value f i of each individual is recalculated, and the maximum fitness value f g , the minimum fitness value f w , along with their corresponding positions, are updated. The algorithm then checks whether the maximum number of iterations has been reached or whether the desired solution accuracy has been achieved. If either condition is satisfied, the optimization results are output. Otherwise, the population is reordered based on the updated fitness values, and the position updates are recalculated using Equations (6)–(10) until the termination criteria are met.

3.2.2. ASFSSA Optimizes the LSTM Algorithm
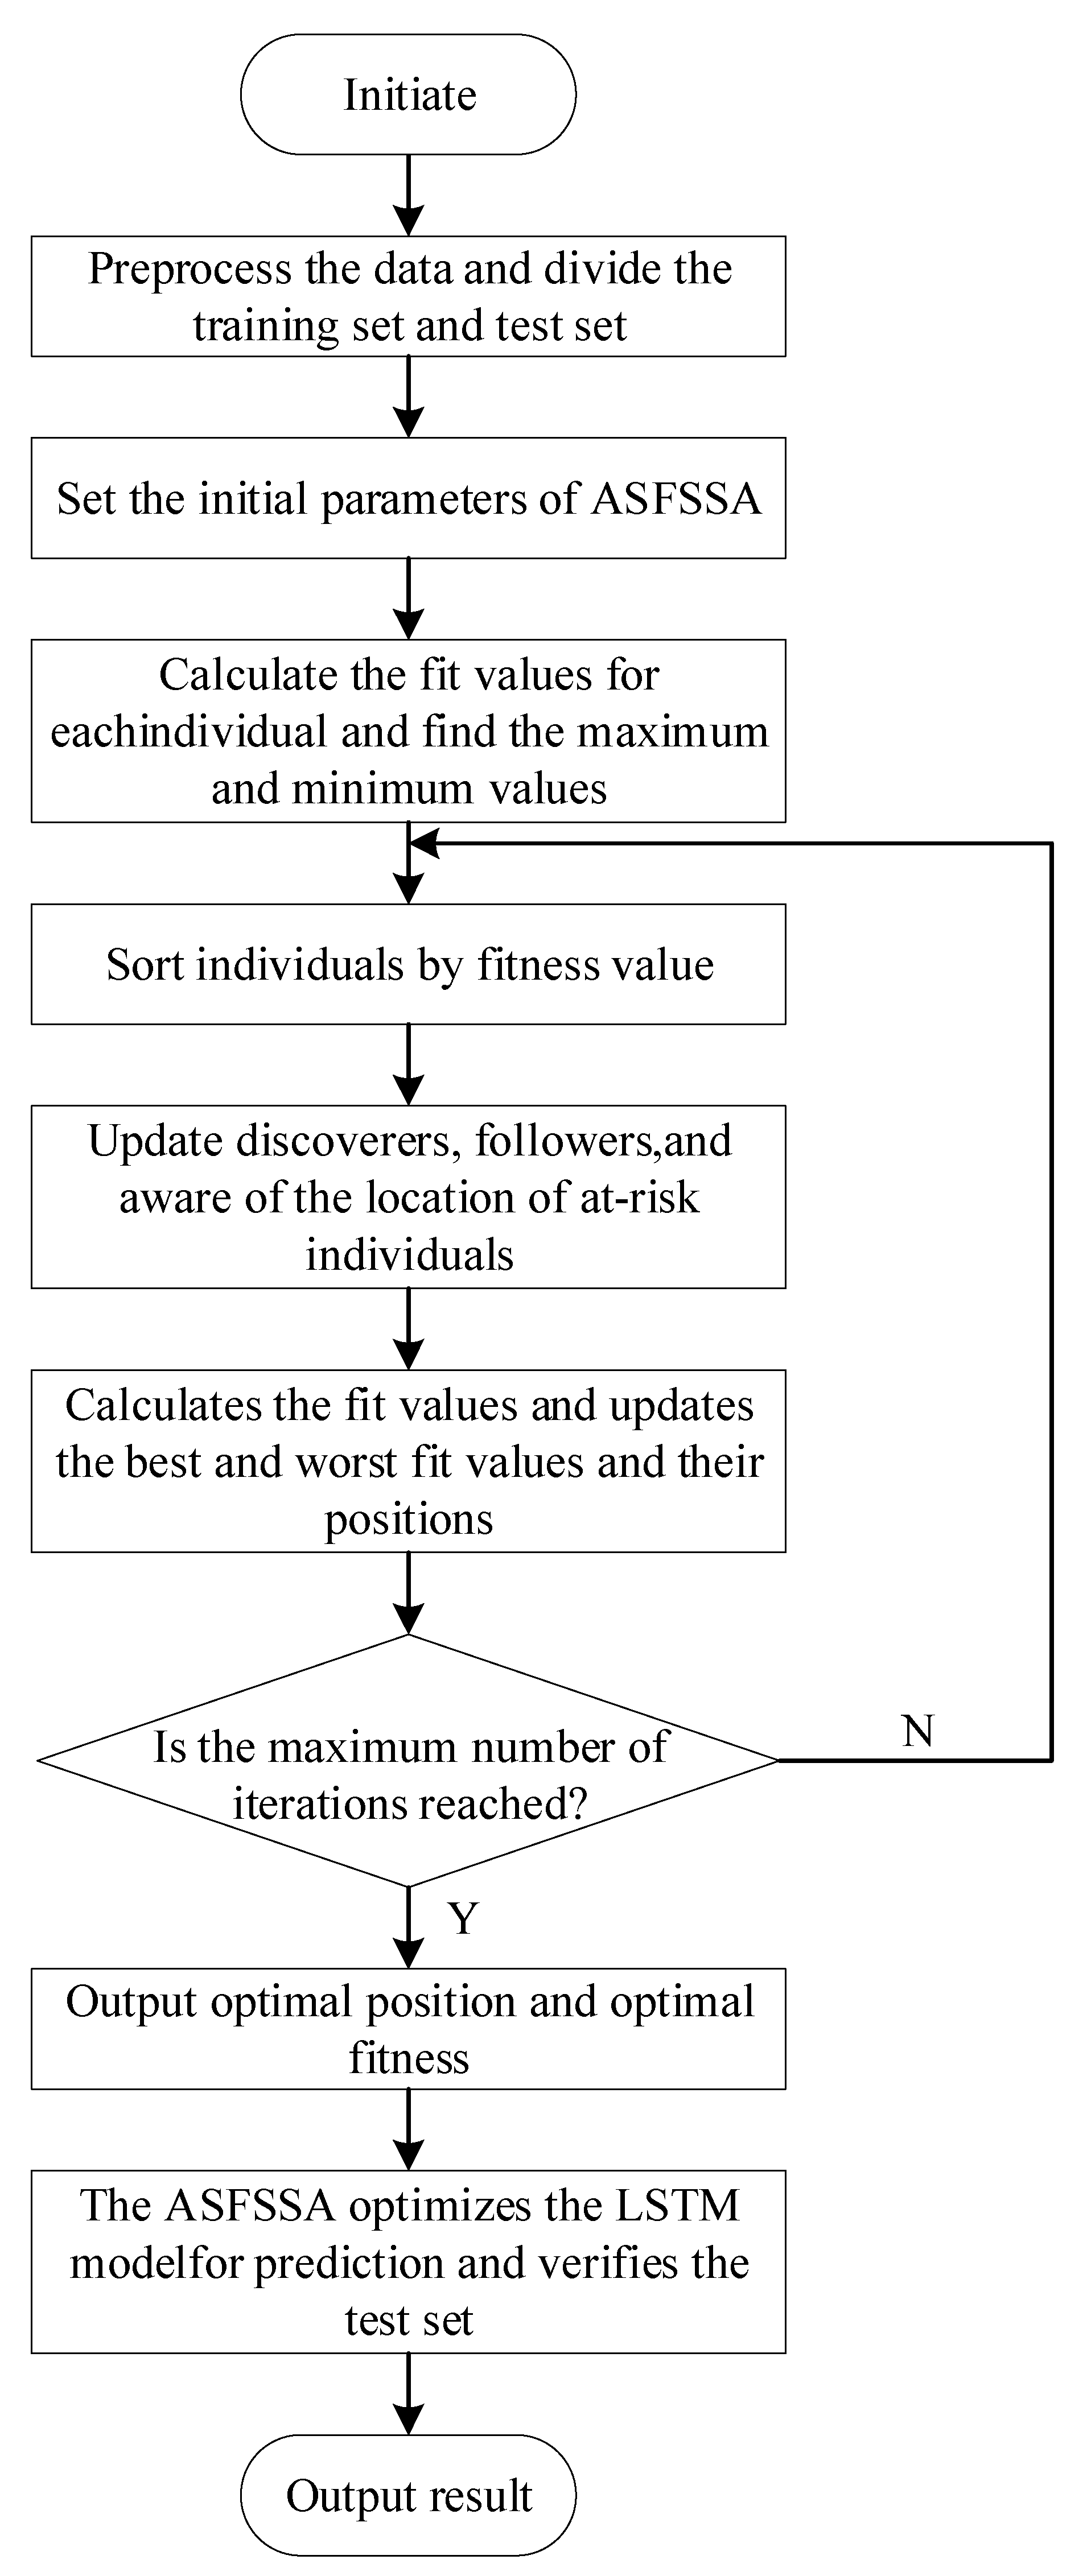
The generator in the expanded sample model for the reliability assessment of relay protection equipment is primarily designed to generate convincing synthetic data. It takes historical data as input to produce future predictions, aiming to generate synthetic data that is indistinguishable from real data. The error between the real and predicted data is used as the fitness function, which is defined as follows:
L o s s G = t = 1 n y i y i
where y i represents the predicted value and y i represents the true value. The process of optimizing the LSTM algorithm by ASFSSA is as follows:
0.
The initialization of sparrow swarm parameters involves setting the total population size (pop), the number of discoverers ( pNum ), total iterations ( iter ), solution accuracy (E), and the weights and biases in the LSTM. The vector Z denotes the weights and biases in the LSTM, and its initialization can be expressed as follows:
Z = f r e w ; f r e ( b )
In the equations, Z = ( Z 1 , Z 2 , , Z s ) ; f re is a function that transforms matrices into column vectors; w represents the various weight matrices in the LSTM; and b represents the various bias matrices in the LSTM.
1.
The population individuals’ positions are initialized using tent mapping to generate pop sparrow individuals.
2.
The position of each sparrow individual is assigned to the optimization parameters in the LSTM. The fitness value f w of each population individual is calculated using Equation (11), and the maximum fitness value f g and minimum fitness value f w are determined.
3.
The population is then sorted, based on fitness values.
4.
The top pNum individuals are selected as discoverers, while the rest are followers. The discoverers’ positions are updated using Equations (6) and (7), after incorporating the strategy.
5.
The positions of the followers are updated using Equation (9).
6.
Equation (10) is used to update the positions of the sparrow individuals aware of danger.
7.
After each iteration, the fitness value f i for each individual is recalculated, and the maximum fitness value f g , minimum fitness value f w , and their corresponding positions are updated.
8.
Judge whether the algorithm has reached the maximum number of iterations or the solution’s precision. If it has, then output the optimization results; otherwise, return to step 4.
9.
Assign the optimal position vector to the weights and bias parameters of the LSTM neural network, and train and predict with the LSTM, according to these parameters.
The ASFSSA algorithm is employed to optimize the initial parameters of the LSTM model, with the objective of minimizing the root mean square error (RMSE) on the test set. The final predicted values are then output. The overall process is illustrated in Figure 1.

3.3. Construction of Discriminator Model

The discriminator is implemented as a fully connected neural network consisting of one input layer, two hidden layers, and one output layer. The two hidden layers contain 64 and 32 neurons, respectively, while the output layer has a single neuron. The hidden layers use the Rectified Linear Unit ( ReLU ) activation function, whereas no activation function is applied to the output layer. The loss function for the discriminator is defined as follows:
Loss D = t = 1 n D y t D ( y t )
The loss function Loss D in Equation (13) measures the error between the predicted results of the model and the actual results. A discriminator output probability closer to 1 indicates that the input data is more similar to the real sample set, while a probability closer to 0 suggests that the input data is more likely to be fake. This formulation follows the approach presented in [24].

ASFSSA-LSTM-GAN Model

After the completion of the generator and discriminator model construction, the ASFSSA-LSTM-GAN model can be assembled, and its overall architecture is shown in Figure 2.
This comprehensive framework seamlessly integrates ASFSSA, LSTM, and GAN into a structured pipeline. First, ASFSSA adaptively tunes critical LSTM hyperparameters—such as the number of hidden units, sequence length, and dropout rate—by minimizing the forecast error. The optimized LSTM then serves as the generator in a GAN architecture, synthesizing realistic temporal sequences from noise-enhanced inputs. Simultaneously, a convolutional discriminator is trained adversarially to distinguish real data from synthetic data. This data augmentation strategy enhances the generalization ability of the LSTM model, especially under conditions of data scarcity or rare-event prediction, thereby enabling more accurate and reliable forecasting.

4. ASFSSA Optimizes the Reliability Assessment of GAN Model Relay Protection Equipment for LSTM

In the statistical analysis of relay protection equipment failure data, References [11,25] have employed two distinct methods, respectively. One method involves statistical analysis based on operational time and the ID of the malfunctioning equipment, while the other is based on operational time and the average failure rate. This paper refers to these methods as Statistical Mode 2 and Statistical Mode 1, respectively.

4.1. Statistical Mode 1: Reliability Evaluation Model

For this Statistical Mode 1, the average fault rate per year for each device was selected as the original time series. This is shown in Table 1.
First, let the failure rate distribution function λ ( t ) be
λ t = e m · t n
Apply the natural logarithm function l n to both sides of the equation, simultaneously:
ln λ t = m + n   l n   t
Taking l n   t and ln λ t as inputs and outputs for the ASFSSA-LSTM-GAN generator network, adversarial training is conducted on the model until the set accuracy is achieved. The model’s predicted fault rate data for relay protection equipment is combined with the original statistical data to obtain an augmented sample of the average fault rate for relay protection equipment.
Using the augmented sample data, the method of least squares is employed to estimate the parameters m and n in Equation (15). This is combined with Equation (2) and Equation (14) to obtain the following:
α = ( n + 1 e m ) 1 / ( n + 1 ) β = n + 1
Thus, the expression for the reliability function of the relay protection equipment is obtained. Furthermore, based on the expert’s experience that the reliability of the relay protection device is 0.9, i.e., F ( t 0 ) = 0.9 , the reliable service life t 0 of the relay protection equipment can be calculated.

4.2. Statistical Mode 2: Reliability Evaluation Model

This statistical model selects 50 relay protection devices and records the time they experience from commissioning to failure under the same working conditions, as shown in Table 2. The empirical reliability is calculated using an approximate median rank formula. The formula is as follows:
F t i = 1 i 0.3 N + 0.4
where i is the number of faulty devices and N is the total number of devices.
For Equation (1) reliability function, the logarithm of both sides can be obtained:
ln F t = ( t α ) β
Taking logarithms on both sides of Equation (18) and collating them gives
ln ln F t = β ln t β ln α
make p = β , q = β l n α , gain:
ln ln F t = p   l n   t + q
The ASFSSA-LSTM-GAN generator network takes F ( t ) as input and t as output, respectively. The model undergoes adversarial training until it reaches the set accuracy. Thereafter, the augmented relay-protection-device failure time samples are generated by combining the generated samples with the original sample set.
Then, using the augmented sample data, the parameters p and q in Equation (20) are estimated by the method of least squares, thereby obtaining the values of parameters α and β , and thus deriving the expression for the reliability function. Similarly, based on the expert’s experience setting F t 0 = 0.9 , the reliable service life t 0 of the relay protection equipment is obtained.

5. Analysis of Numerical Examples

This paper analyzes examples from Statistical Mode 1 and Mode 2 and compares the ASFSSA-LSTM-GAN model with the BP neural network, LSTM, and LSTM-GAN to verify the effectiveness of the proposed method.

5.1. Statistical Mode 1: Example Analysis

The data from Table 1 is separately inputted into ASFSSA-LSTM-GAN model, BP neural network, LSTM, and LSTM-GAN for training. After training, the test set is fed into each model, and the Root Mean Square Error (RMSE), Mean Square Error (MSE), and R-squared (R2) of the output data are calculated. RMSE measures the deviation between predicted and actual values; a smaller MSE indicates better predictive performance. R-squared evaluates the degree of fit between the predicted and actual values, reflecting how well the model captures the variance in the data; values closer to 1 indicate better fit. The performance metrics for all four models are summarized in Table 3.
As Table 3 demonstrates, the ASFSSA-LSTM-GAN model exhibits the lowest RMSE and MSE values, as well as an R2 value closest to 1, indicating the best fitting performance. The correlation coefficients of the original data, BP neural network augmented data, LSTM network augmented data, LSTM-GAN network augmented data, and the proposed model augmented data are calculated and presented in Table 4.
The closer the correlation coefficient of the expanded data to that of the original data, the higher the similarity between the expanded data and the actual data. As shown in Table 4, the data generated by the proposed ASFSSA-LSTM-GAN model is closer to the original data compared to those generated by BP neural networks, LSTM networks, and LSTM-GAN networks. Therefore, it can improve the accuracy of reliability assessment for relay protection devices.
Finally, the augmented sample data were fitted using the least squares method, yielding m = 4.2210 and n = 1.4238 , and the corresponding fitting curve shown in Figure 3. By substituting these values into Equation (20), we obtained α = 8.2215 and β = 2.4238 , and the reliability function curve is plotted in Figure 4, thus deriving the lifespan prediction curve for the relay protection equipment.
Based on expert experience, the reliability of the relay protection equipment is set at 0.9, i.e., F t 0 = 0.9 , from which the predicted reliable service life of the relay protection equipment is t 0 = 10.746 . Accordingly, the recommended withdrawal operation time for the relay protection equipment is 10.746 years.
As shown in Figure 3, the original and augmented fault data are closely aligned with the fitted line, exhibiting only slight fluctuations. This suggests that under Statistical Pattern 1, the augmented data closely resemble the original data in distribution and demonstrate excellent goodness of fit.

5.2. Statistical Mode 2: Example Analysis

Using the same method as outlined in Section 5.1, an analysis was conducted on the data from Statistical Mode 2 in the case study. The statistical indicators are presented in Table 5.
From Table 5, it can be observed that the ASFSSA-LSTM-GAN model has the smallest RMSE and MSE values, and the R2 value is closest to 1. Similarly, the correlation coefficients for the original data of Statistical Mode 2, as well as the augmented data from the BP neural network, LSTM network, LSTM-GAN network, and the model proposed in this paper are calculated and presented in Table 6.
Table 6 reveals the fact that the correlation coefficient of the ASFSSA-LSTM-GAN data generated by the model is closest to that of the original data, indicating that its use in evaluating the reliability of relay protection devices can enhance the accuracy of the assessment. Additionally, the method of least squares was employed to estimate the parameters of p and q in Equation (20), yielding α = 0.0662 and β = 1.8403 , respectively. The fitting curve based on these parameters is presented in Figure 5.
Figure 5 shows that under Statistical Mode 2, both datasets align well with the fitted line, with only minor deviations. This further confirms the fact that the augmentation process effectively preserves the statistical characteristics of the original data and ensures a reliable fit.
By substituting these into Equation (1), the specific expression of the reliability function can be obtained, and the life prediction curve for the relay protection equipment is plotted, as shown in Figure 6. By setting the reliability of the relay protection equipment to 0.9, that is, F t 0 = 0.9 , the predicted reliable service life of the relay protection equipment is calculated to be t 0 = 13,991.8 h.

6. Conclusions

This paper addresses the challenge of high reliability requirements and limited fault data in new-generation substation relay protection equipment. To enhance data availability, an ASFSSA-LSTM-GAN model is proposed to augment the original failure samples. Comparative experiments were conducted against BP neural networks, conventional LSTM, and LSTM-GAN models in terms of prediction accuracy and data similarity. Results show that the proposed model achieves the lowest prediction error and the highest correlation with original data, improving the coefficient of determination (R2) by nearly 0.5% over the baseline LSTM-GAN and significantly outperforming the BP and LSTM methods. These improvements demonstrate the proposed model’s superior performance in reliability assessment tasks.
Furthermore, evaluation models were constructed based on two statistical patterns of fault data. Corresponding case studies were carried out, and reliability operation curves were plotted for relay protection equipment. These results offer practical insights for formulating maintenance strategies and guiding equipment replacement decisions in new-generation substations.
In future work, we plan to incorporate more detailed comparative analyses involving classification metrics, conduct ablation studies to explore the individual contributions of each module, and apply statistical significance tests to ensure the robustness of observed performance improvements. These enhancements will strengthen the scientific rigor and practical applicability of the model. Additionally, we aim to extend the proposed approach to other types of industrial equipment, broadening its scope and impact.

Author Contributions

Conceptualization, B.T., K.C., X.D., W.D., Y.W., J.H. and H.Z.; methodology, B.T., K.C., X.D., W.D., Y.W., J.H. and H.Z.; software, B.T., K.C., X.D., W.D., Y.W., J.H. and H.Z.; investigation, B.T., K.C., X.D., W.D., Y.W., J.H. and H.Z.; writing—original draft preparation, B.T., K.C., X.D., W.D., Y.W., J.H. and H.Z. All authors have read and agreed to the published version of the manuscript.

Funding

This research was supported by the Science and Technology Project of the Henan Electric Power Company of the State Grid in China (Grant No.: 521702230013).

Data Availability Statement

Data are contained within the article.

Conflicts of Interest

Authors Baojiang Tian, Kai Chen, and Xingwei Du were employed by State Grid Henan Electric Power Company, China. The remaining author declares that the research was conducted in the absence of any commercial or financial relationships that could be construed as a potential conflict of interest. State Grid Henan Electric Power Company had no role in the design of the study; in the collection, analyses, or interpretation of data; in the writing of the manuscript, or in the decision to publish the results.

References

  1. Yang, L.; Cao, X.; Zhou, Y.; Lin, Z.; Zhou, J.; Guan, X.; Wu, Q. Frequency-Constrained Coordinated Scheduling for Asynchronous AC Systems under Uncertainty via Distributional Robustness. IEEE Trans. Netw. Sci. Eng. 2025, 1–13. [Google Scholar] [CrossRef]
  2. Dai, Z.; Wang, Z.; Jiao, Y.; Cao, S. Probabilistic Assessment Method for Failure Risk of Stepped Protection Philosophy. Trans. China Electrotech. Soc. 2012, 27, 175–182. [Google Scholar] [CrossRef]
  3. Zhu, Y.; Liu, X. Research on safe operation mode of power supply reliability in distribution network. China High New Technol. 2023, 22, 16–18. (In Chinese) [Google Scholar] [CrossRef]
  4. Guo, T.; Zhao, X.; Feng, B.; Chen, H. Network security risk and protection strategy of power distribution network automation system. Netw. Secur. Technol. Appl. 2023, 6, 124–125. (In Chinese) [Google Scholar]
  5. Wang, J.; Wu, D.; Zhu, Z.; Li, H.; Yang, L.; Tang, W.; Mu, C. Fine management practice for reliability analysis of low-voltage electrical equipment. Electr. Eng. 2023, 16, 182–184+188. (In Chinese) [Google Scholar] [CrossRef]
  6. Huang, K. Study on Residual Life Evaluation of High Voltage Circuit Breaker; North China Electric Power University: Beijing, China, 2013. (In Chinese) [Google Scholar]
  7. Gui, H. Study on Residual Life Evaluation of Power Transformer; North China Electric Power University: Beijing, China, 2014. [Google Scholar]
  8. Yi, Y. Life analysis of relay protection device and study on life influence mechanism. Power Syst. Prot. Control 2013, 41, 79–83. (In Chinese) [Google Scholar] [CrossRef]
  9. Tan, Z.; Xu, C.; Yin, Z.; Tian, X.; Lu, S. Research on AT traction network relay protection model based on Feeding Section. J. Phys. Conf. Ser. 2022, 2310, 012081. [Google Scholar] [CrossRef]
  10. Li, X.; Ge, D.; Lin, Z.; Wang, S.; Wang, J. Practical application of dynamic fault tree in reliability evaluation of reactor protection system. Nucl. Tech. 2021, 44, 73–80. (In Chinese) [Google Scholar] [CrossRef]
  11. Dai, Z.; Li, Z.; Jiao, Y.; Wang, Z. Reliability assessment of relay protection based on small sample failure data based on BP neural network. Electr. Power Autom. Equip. 2014, 34, 129–134. (In Chinese) [Google Scholar]
  12. Wang, J. Research on Real-Time Reliability and Risk Assessment of Relay Protection in Intelligent Substation; North China Electric Power University: Beijing, China, 2019. (In Chinese) [Google Scholar]
  13. Zhang, L.; Wang, G.; Cao, L.; Dai, Z.; Kou, B. Intelligent state evaluation and early warning of protection system based on GAN model and random forest algorithm. J. Electr. Power Sci. Technol. 2021, 36, 104–112. (In Chinese) [Google Scholar] [CrossRef]
  14. Zhang, H.; Meng, R.; Fu, W.; Wang, Z.; Jia, J. Reliability prediction of LSTM network relay protection device. China Meas. Test 2023, 49, 164–170. (In Chinese) [Google Scholar]
  15. Nikpour, B.; Sinodinos, D.; Armanfard, N. Deep Reinforcement Learning in Human Activity Recognition: A Survey and Outlook. IEEE Trans. Neural Netw. Learn. Syst. 2025, 36, 4267–4278. [Google Scholar] [CrossRef] [PubMed]
  16. Richter, D.J.; Calix, R.A.; Kim, K. A Review of Reinforcement Learning for Fixed-Wing Aircraft Control Tasks. IEEE Access 2024, 12, 103026–103048. [Google Scholar] [CrossRef]
  17. Nguyen, T.T.; Reddi, V.J. Deep Reinforcement Learning for Cyber Security. IEEE Trans. Neural Netw. Learn. Syst. 2023, 34, 3779–3795. [Google Scholar] [CrossRef] [PubMed]
  18. Zhu, Z.; Lin, K.; Jain, A.K.; Zhou, J. Transfer Learning in Deep Reinforcement Learning: A Survey. IEEE Trans. Pattern Anal. Mach. Intell. 2023, 45, 13344–13362. [Google Scholar] [CrossRef]
  19. Yang, X.; Xie, L.; Yang, Y.; Zhao, B.; Li, Y. A comparative study for parameter estimation of the Weibull distribution in a small sample size: An application to spring fatigue failure data. Qual. Eng. 2022, 35, 553–565. [Google Scholar] [CrossRef]
  20. Zhang, X.; Zhao, Y. Small sample Weibull reliability analysis based on least squares support vector machine. China Mech. Eng. 2012, 23, 1967–1971. (In Chinese) [Google Scholar]
  21. Jagadeesan, K.; Palanisamy, G. Atherosclerosis plaque tissue classification using self-attention-based conditional variational auto-encoder generative adversarial network using OCT plaque image. Biomed. Eng./Biomed. Tech. 2023, 68, 633–649. [Google Scholar] [CrossRef]
  22. Dong, X.; Miao, Z.; Man, L.; Shen, J.; Jin, Z.; Guo, Z.; Teoh, A.B.J. Reconstruct face from features based on genetic algorithm using GAN generator as a distribution constraint. Comput. Secur. 2023, 125, 103026. [Google Scholar] [CrossRef]
  23. Ouyang, C.; Qiu, Y.; Zhu, D. Adaptive Spiral Flying Sparrow Search Algorithm. Sci. Program. 2021, 2021, 6505253. [Google Scholar] [CrossRef]
  24. Wang, S.; Jia, H.; Shen, C.; Wu, Y.; Liu, J. Application of an optimized GAN model in 5G energy-saving timing. J. Taiyuan Univ. Technol. 2024, 55, 743–751. (In Chinese) [Google Scholar]
  25. Jing, Z.; Dai, B.; Wang, R.; Liu, S.; Jiang, Z. Reliability evaluation method of relay protection device based on long short-term memory network. Electr. Eng. 2023, 14, 115–117. (In Chinese) [Google Scholar] [CrossRef]
Figure 1. ASFSSA-LSTM optimization algorithm.
Processes 13 02300 g001
Figure 2. Overall prediction mode.
Processes 13 02300 g002
Figure 3. Statistical Mode 1 extended sample data fitting curve.
Processes 13 02300 g003
Figure 4. Reliability curve of relay protection equipment in Statistical Mode 1.
Processes 13 02300 g004
Figure 5. Statistical Mode 2: extended sample data fitting curve.
Processes 13 02300 g005
Figure 6. Reliability curve of relay protection equipment in Statistical Mode 2.
Processes 13 02300 g006
Table 1. Statistical table of malfunction rate of relay protection equipment.
Operating Year Limited to/YearAverage Failure Rate/(Times Year−1
Station−1)
Operating Year
Limited to/Year
Average Failure Rate/(Times Year−1
Station−1)
80.018516.50.0386
100.018417.50.0452
11.50.023619.50.0564
130.038922.50.1142
14.50.0217240.1862
Table 2. Operation data record of relay protection equipment.
Device IDReliabilityFailure Time/hEquipment
Operation Condition
10.9861 t 1 = 4399 maloperation
30.9663 t 2 = 5286 maloperation
180.9464 t 3 = 9582 maloperation
200.9266 t 4 = 9606 maloperation
250.9067 t 5 = 13,327 maloperation
380.8869 t 6 = 16,158 maloperation
390.8671 t 7 = 17,622 maloperation
440.8472 t 9 = 20,407 maloperation
Table 3. Statistical mode 1 Statistical indicators.
MODELRMSEMSER2
BP0.005953.538 × 10−50.79798
LSTM0.005653.189 × 10−50.8179
LSTM-GAN0.005613.151 × 10−50.82009
ASFSSA-LSTM-GAN0.002335.451 × 10−50.96888
Table 4. Statistical model 1 data correlation coefficient.
DataCorrelation Coefficient
Raw data0.8925
BP network expansion data0.7643
LSTM network expansion data0.9944
LSTM-GAN network expansion data0.9878
ASFSSA-LSTM-GAN network expansion data0.9759
Table 5. Statistical Model 2: statistical indicators.
MODELRMSEMSER2
BP1034.431,070,043.880.9342
LSTM897.90806,223.140.9505
LSTM-GAN826.09682,422.060.9581
ASFSSA-LSTM-GAN776.24602,542.130.9630
Table 6. Statistical Model 2: data correlation coefficient.
DataCorrelation Coefficient
Raw data0.9795
BP network expansion data0.7549
LSTM network expansion data0.9444
LSTM-GAN network expansion data0.9702
ASFSSA-LSTM-GAN network expansion data0.9758
Disclaimer/Publisher’s Note: The statements, opinions and data contained in all publications are solely those of the individual author(s) and contributor(s) and not of MDPI and/or the editor(s). MDPI and/or the editor(s) disclaim responsibility for any injury to people or property resulting from any ideas, methods, instructions or products referred to in the content.

