1. Introduction
In 2023, aimed at promoting the adoption of new energy vehicles (NEVs) in rural areas, the Chinese government launched “NEVs Going to the Countryside Campaign”. It is projected that by 2030, the total stock of NEVs in rural regions will exceed 70 million units [
1]. Alongside this growth, NEV rural expansion requires the development of charging infrastructure. Currently, rural charging infrastructure is still in the early stages of development. High-power ultra-fast charging stations (e.g., 120 kW, 240 kW, 360 kW, 480 kW, or even 600 kW) are not yet suitable for rural areas [
2].
Rural areas are typically distant from load centers and power generation facilities [
3,
4]. As a result, rural power grids face significant challenges such as long transmission lines, limited line capacity, and so on, making them unsuitable for large-scale EV charging station deployment. Additionally, these grids exhibit weak grid characteristics [
5,
6]. Thus, the deployment of large-scale NEV charging stations would impose significant stress on rural power grids [
7]. The operation and maintenance costs of large-scale charging stations is relatively high. Moreover, charging stations are sparsely distributed, leading to increased labor costs for repairs. Additionally, regular maintenance and technological upgrades further raise operational costs for charging service providers [
8,
9]. Thus, home-based chargers are the predominant solution in rural areas.
Most AC charging piles have a power rating of approximately 6.6 kW, which imposes relatively high power capacity requirements for rural household grid connections [
10,
11]. Rural areas predominantly feature single-household courtyard residences, offering abundant idle rooftop resources [
12,
13]. This creates favorable conditions for deploying distributed home solar–storage-integrated charging systems [
14]. Furthermore, solar–storage charging infrastructure can alleviate rural power shortages by leveraging time-of-use electricity pricing to increase household income through peak shaving and valley filling. This approach enables coordinated frequency regulation of the power system through the synergy of source, load, grid, and storage components [
3].
However, rural power grids exhibit weak grid characteristics. Solar–storage-integrated charging piles incorporate a significant number of power electronic devices, and the high-frequency switching operations of these devices introduce higher-order harmonic currents into the grid. While LCL filters are commonly used to suppress high-frequency harmonics, they are prone to triggering resonance issues [
15,
16]. Moreover, maximum power point tracking (MPPT) control in the photovoltaic (PV) generation units of such charging piles typically relies on the output voltage of PV arrays as the reference. This approach is highly susceptible to environmental factors such as temperature and solar irradiance variations, leading to reduced tracking efficiency [
17,
18].
To address the aforementioned challenges, this study establishes a solar–storage-integrated charging pile model with the following advanced control strategies. Firstly, an improved incremental conductance (IC) maximum power point tracking (MPPT) control strategy is implemented to achieve precise power tracking under dynamic environmental conditions. Then, a quasi-proportional resonant controller is adopted to enable zero steady-state error tracking of single-phase sinusoidal voltage references [
19]. Finally, a second-order generalized integrator (SOGI)-based PLL is designed to ensure accurate grid voltage synchronization while actively suppressing resonance risks inherent to weak grid operation [
20].
Electric vehicle charging stations employ a segmented charging strategy. The pre-charging phase safeguards battery integrity, the segmented constant-current charging phase enables rapid energy replenishment, and the positive–negative pulse current charging phase mitigates battery polarization phenomena. This approach extends battery service life and cycle durability. Compared to conventional methods, this solution addresses infrastructure limitations in remote areas by eliminating dependency on grid installations, thereby promoting EV adoption in underserved regions. This dual-benefit approach reduces carbon emissions while enhancing resident mobility convenience.
By establishing a model of a photovoltaic (PV)–storage-integrated charging station in a weak grid environment, this study verifies that the proposed control method effectively addresses the charging challenges of new energy electric vehicles in remote rural areas characterized by weak grid conditions. The PV–storage charging station not only enhances residents’ economic benefits but also contributes to grid frequency stabilization. Furthermore, the proposed method significantly improves the adaptability of single-phase grid-connected inverters in weak grid scenarios and demonstrates robust performance. And all the methods are developed separately for different power electronic converters within the PV–storage-integrated charging station, laying the technical foundation for future coordinated control research.
2. Topology of the Photovoltaic Energy Storage System
Figure 1 illustrates the topology of a distributed household-level PV energy storage (ES) charging pile designed for rural areas. The system comprises a battery unit interfaced via a bidirectional Direct Current/Direct Current (DC/DC) converter, a PV array connected through a unidirectional DC/DC converter, a charging pile also linked through a unidirectional DC/DC converter, and a single-phase full-bridge inverter module.
The bidirectional DC/DC converter adopts a buck/boost topology, as illustrated in
Figure 2a; the first unidirectional single-phase DC/DC converter employs a boost configuration, as shown in
Figure 2b; and the single-phase full-bridge inverter follows the structural layout presented in
Figure 2c.
In
Figure 2b,
ipv denotes the output current of the PV array, while
vpv represents its output voltage. The parameter
L corresponds to the filter inductance in the Boost converter circuit. In
Figure 2c,
Udc and
Cdc signify the voltage and capacitance of the DC bus, respectively.
L1 and
L2 are the two inductors within the LCL, and
C is the corresponding filter capacitance.
Lg indicates the equivalent grid-side reactance. The variable
upcc refers to the voltage at the point of common coupling,
ug to the grid voltage, and
uinv to the output voltage of the grid-tied inverter. The currents
iL1 and
iL2 denote the respective currents flowing through inductors
L1 and
L2.
To streamline the analysis of the control strategy for the PV-ES charging pile, this study does not consider the optimal operational states of the PV and energy storage systems under varying economic returns. Instead, the PV system operates under a maximum power point tracking (MPPT) scheme, and the charging/discharging behavior of the energy storage unit is governed by the conditions outlined in
Table 1.
As indicated in
Table 1, during peak pricing periods, the energy storage system engages in discharging provided the SOC exceeds 20%; if the SOC falls at or below this threshold, the system remains inactive. During flat-rate periods, the system charges only when certain conditions are met: the SOC is below 80%, and the photovoltaic output surpasses the electric vehicle’s power demand. Failing either condition results in system idleness. During off-peak periods, the energy storage unit enters the charging mode when its SOC remains below 80%; in all other cases, it remains inactive. Furthermore, the DC bus voltage is maintained and regulated through the operation of the single-phase grid-connected inverter.
3. Control Strategy Analysis of Optical Storage Charging Pile
3.1. Photovoltaic Array DC/DC Converter Control
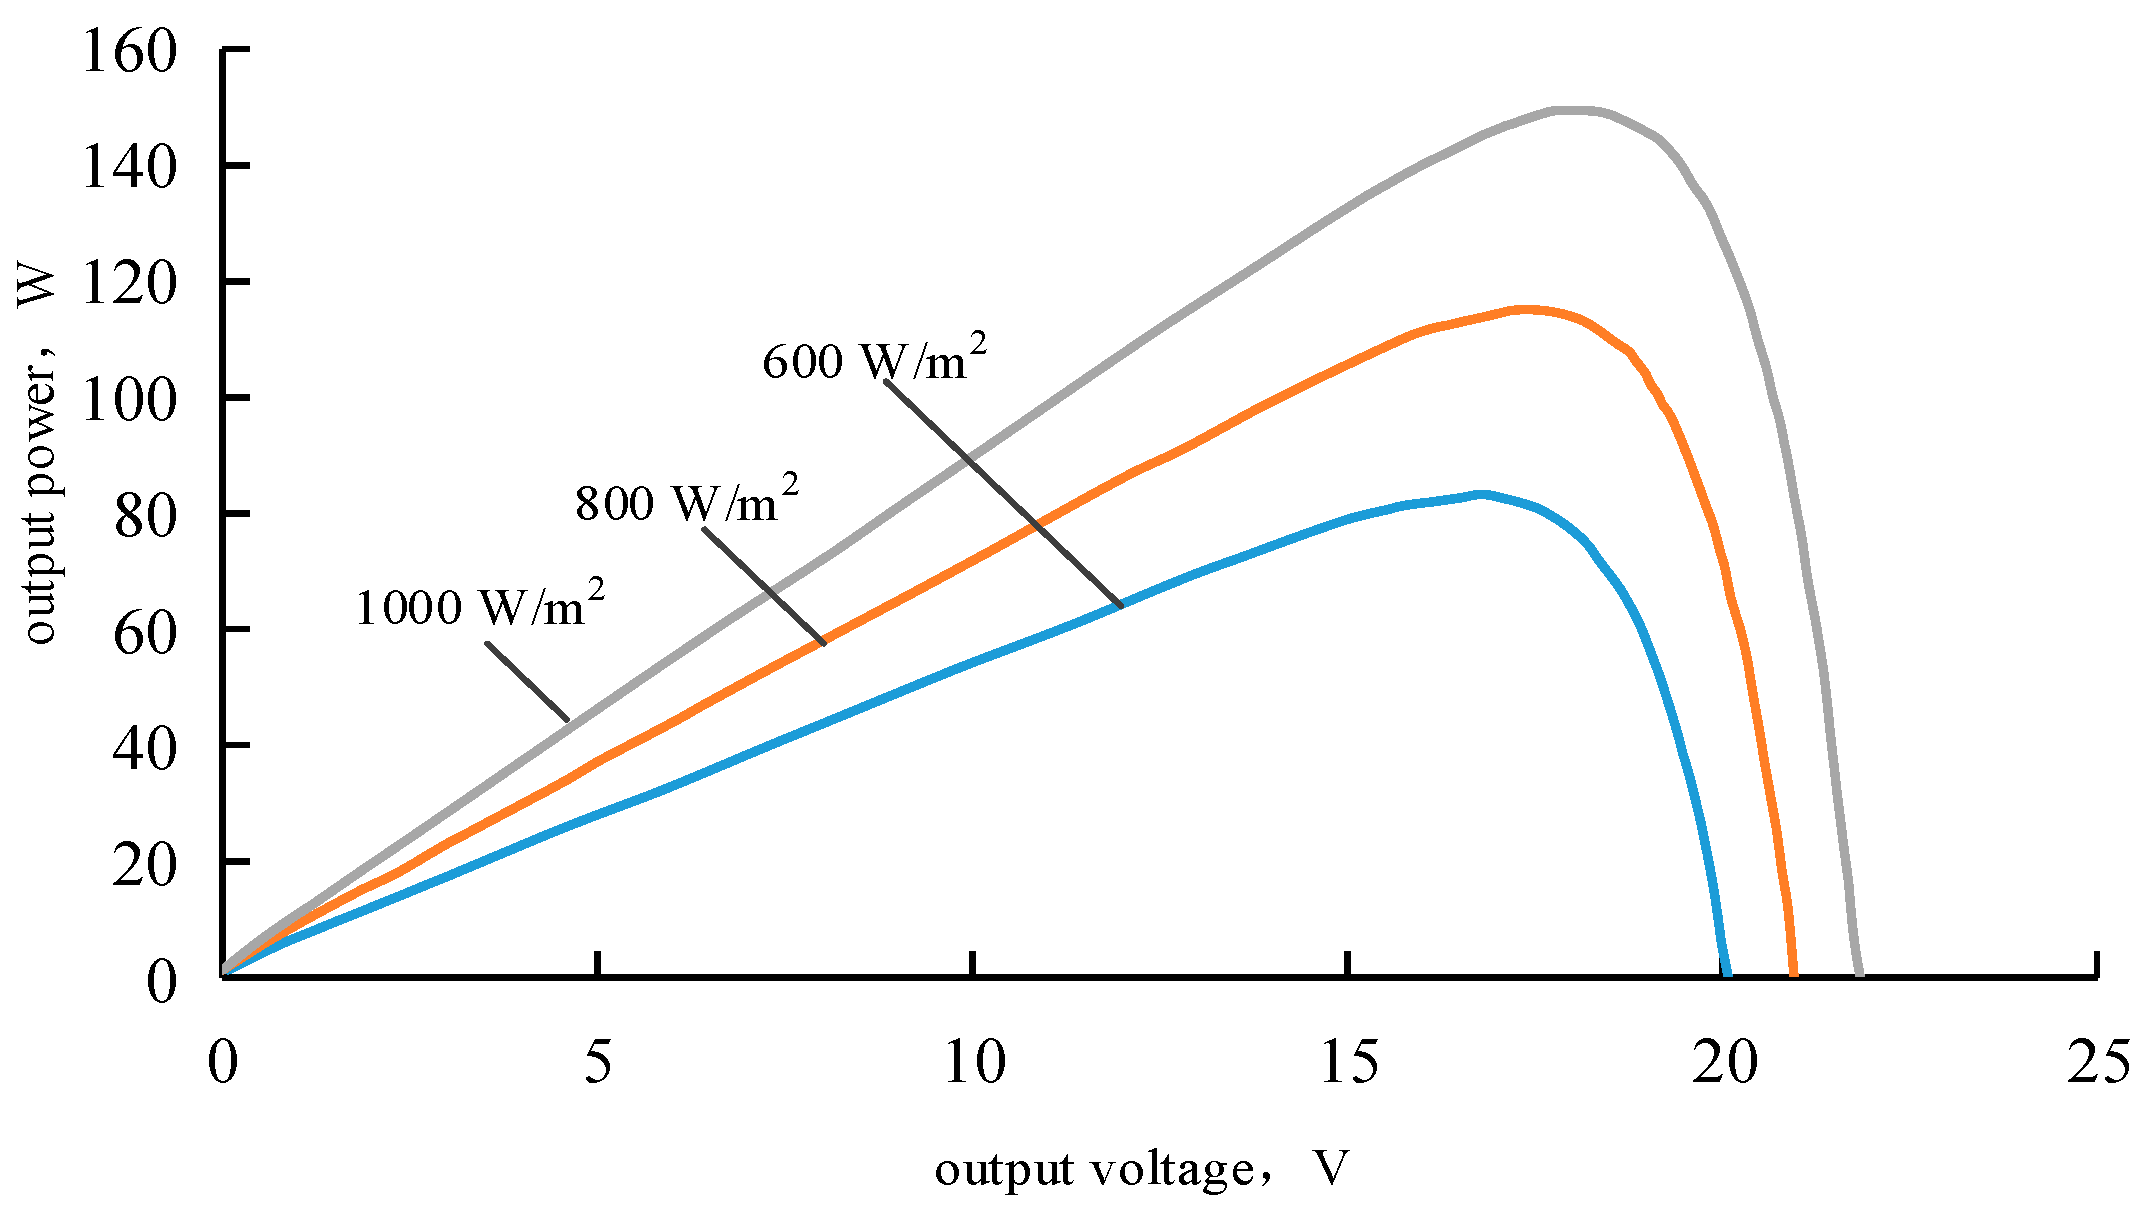
For a specific model of PV array at an ambient temperature of 25 °C with varying light intensities,
Figure 3 illustrates the nonlinear relationship between the output power
Ppv and the output voltage
vpv.
From
Figure 3, it can be seen that the relationship between the output power and output voltage of the PV array is affected by the ambient temperature and light intensity.
The DC bus voltage is connected to the PV array through a Boost converter, and the maximum power tracking control strategies that are commonly used include the conductance increment method, the constant voltage method, and the perturbation observation method. Among them, the conductivity increment method is characterized as having high data memory requirements and high computational accuracy. The constant voltage method can be easily implemented. However, in areas where ambient temperatures are unstable, it cannot be guaranteed that the PV power system is working in the maximum power tracking mode. The perturbation observation method has fewer control parameters, but requires repeated adjustments to the output power.
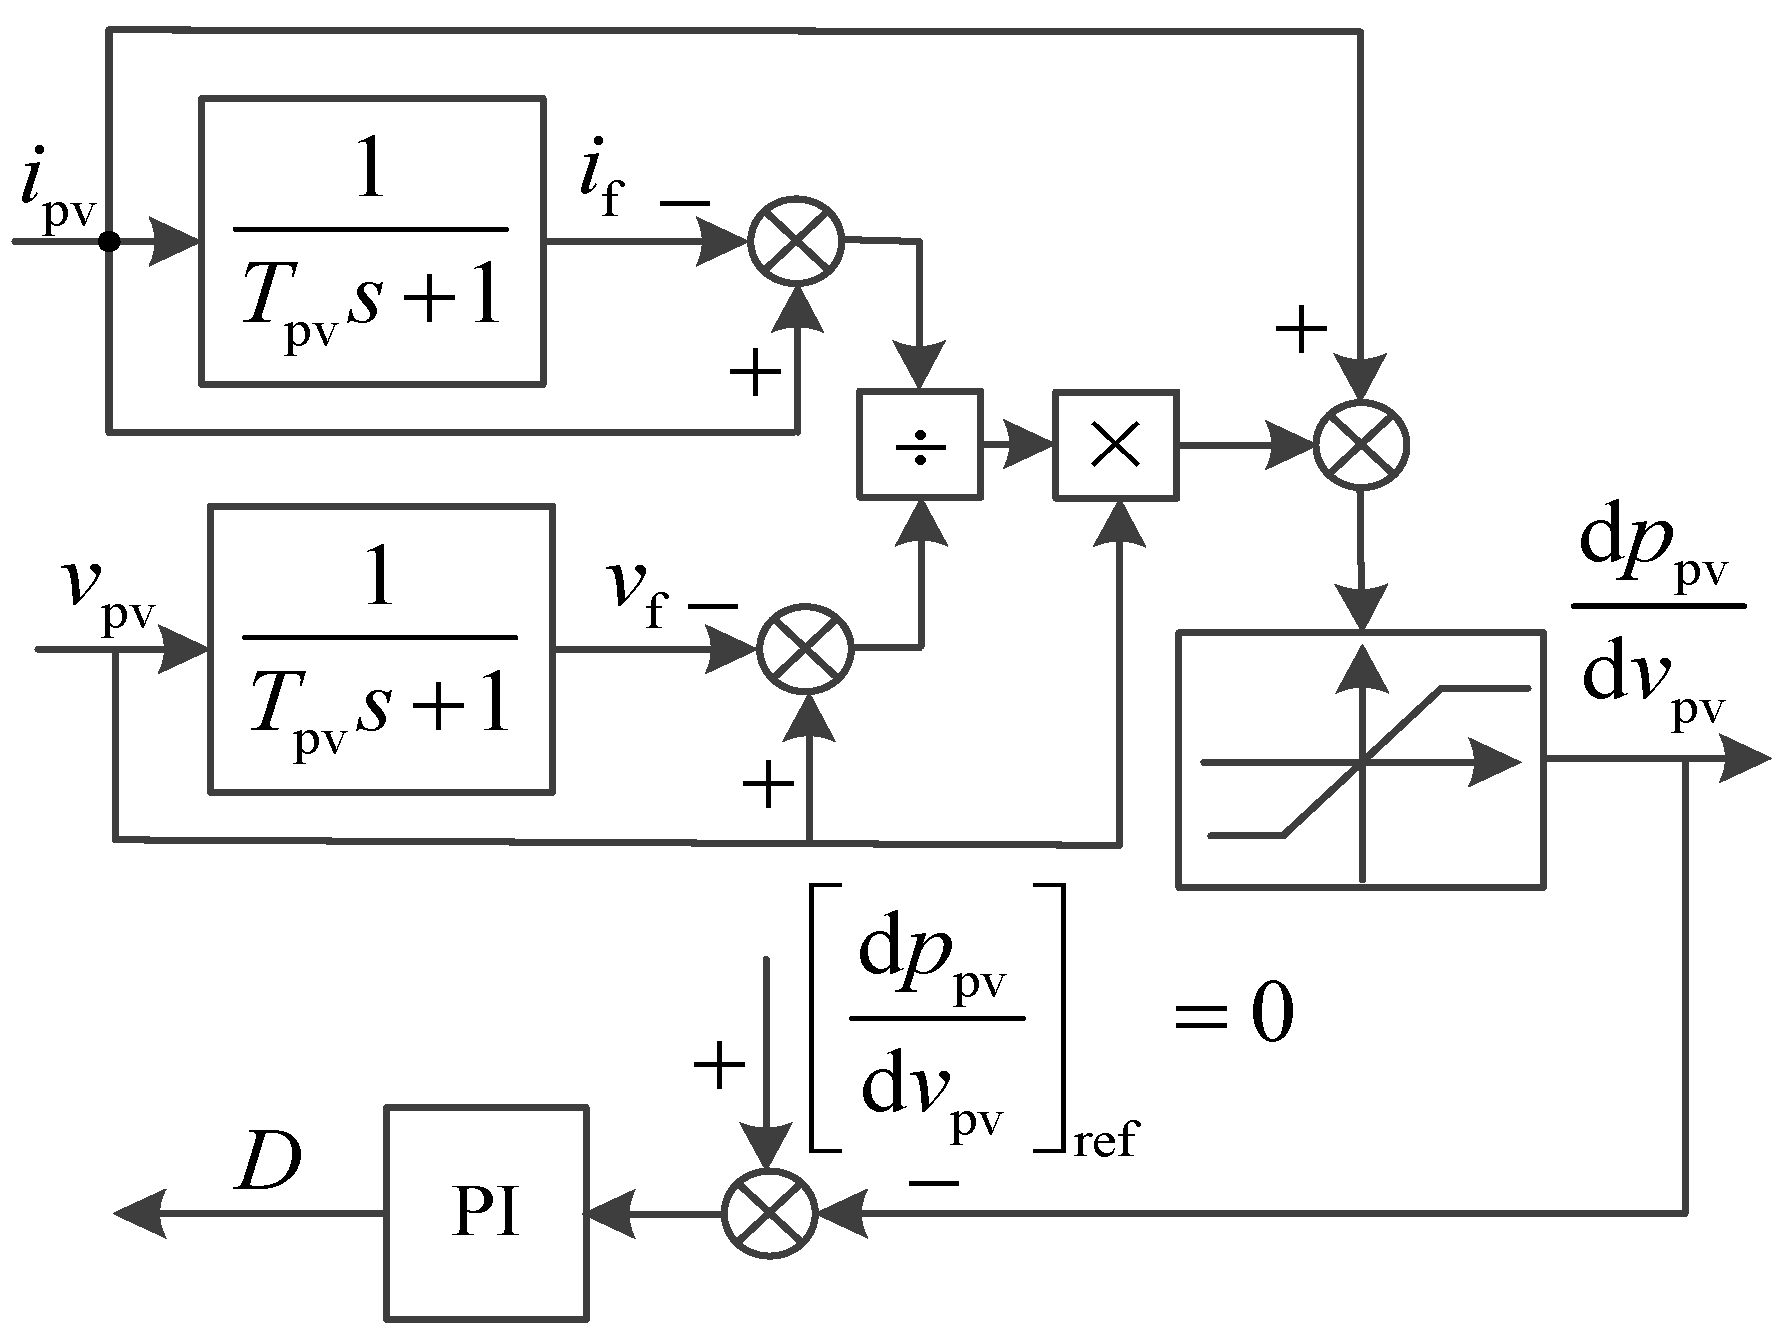
Based on the conductivity increment method, a control strategy for differentiating the output voltage of the PV array in the PV power generation system is proposed in this paper. The conductance micro-increment can be expressed as Equation (1).
where the micro-increment of the output current of the PV array with respect to the output voltage can be obtained through a low-pass filter, as demonstrated in Equations (2)–(4).
where
if(
s) denotes the low-frequency component of the PV array output current, and 1/
T denotes the cutoff frequency of the low-pass filter, which can be set to 1000 Hz.
vf denotes the low-frequency component of the PV array output voltage.
Based on Equation (4), the conductance micro-increment of the PV array can be obtained through the method demonstrated in
Figure 4. Therefore, the conductance micro-increment can be adopted as the control objective for realizing the maximum power tracking control of the PV power generation system.
3.2. Control Strategies for Energy Storage Devices
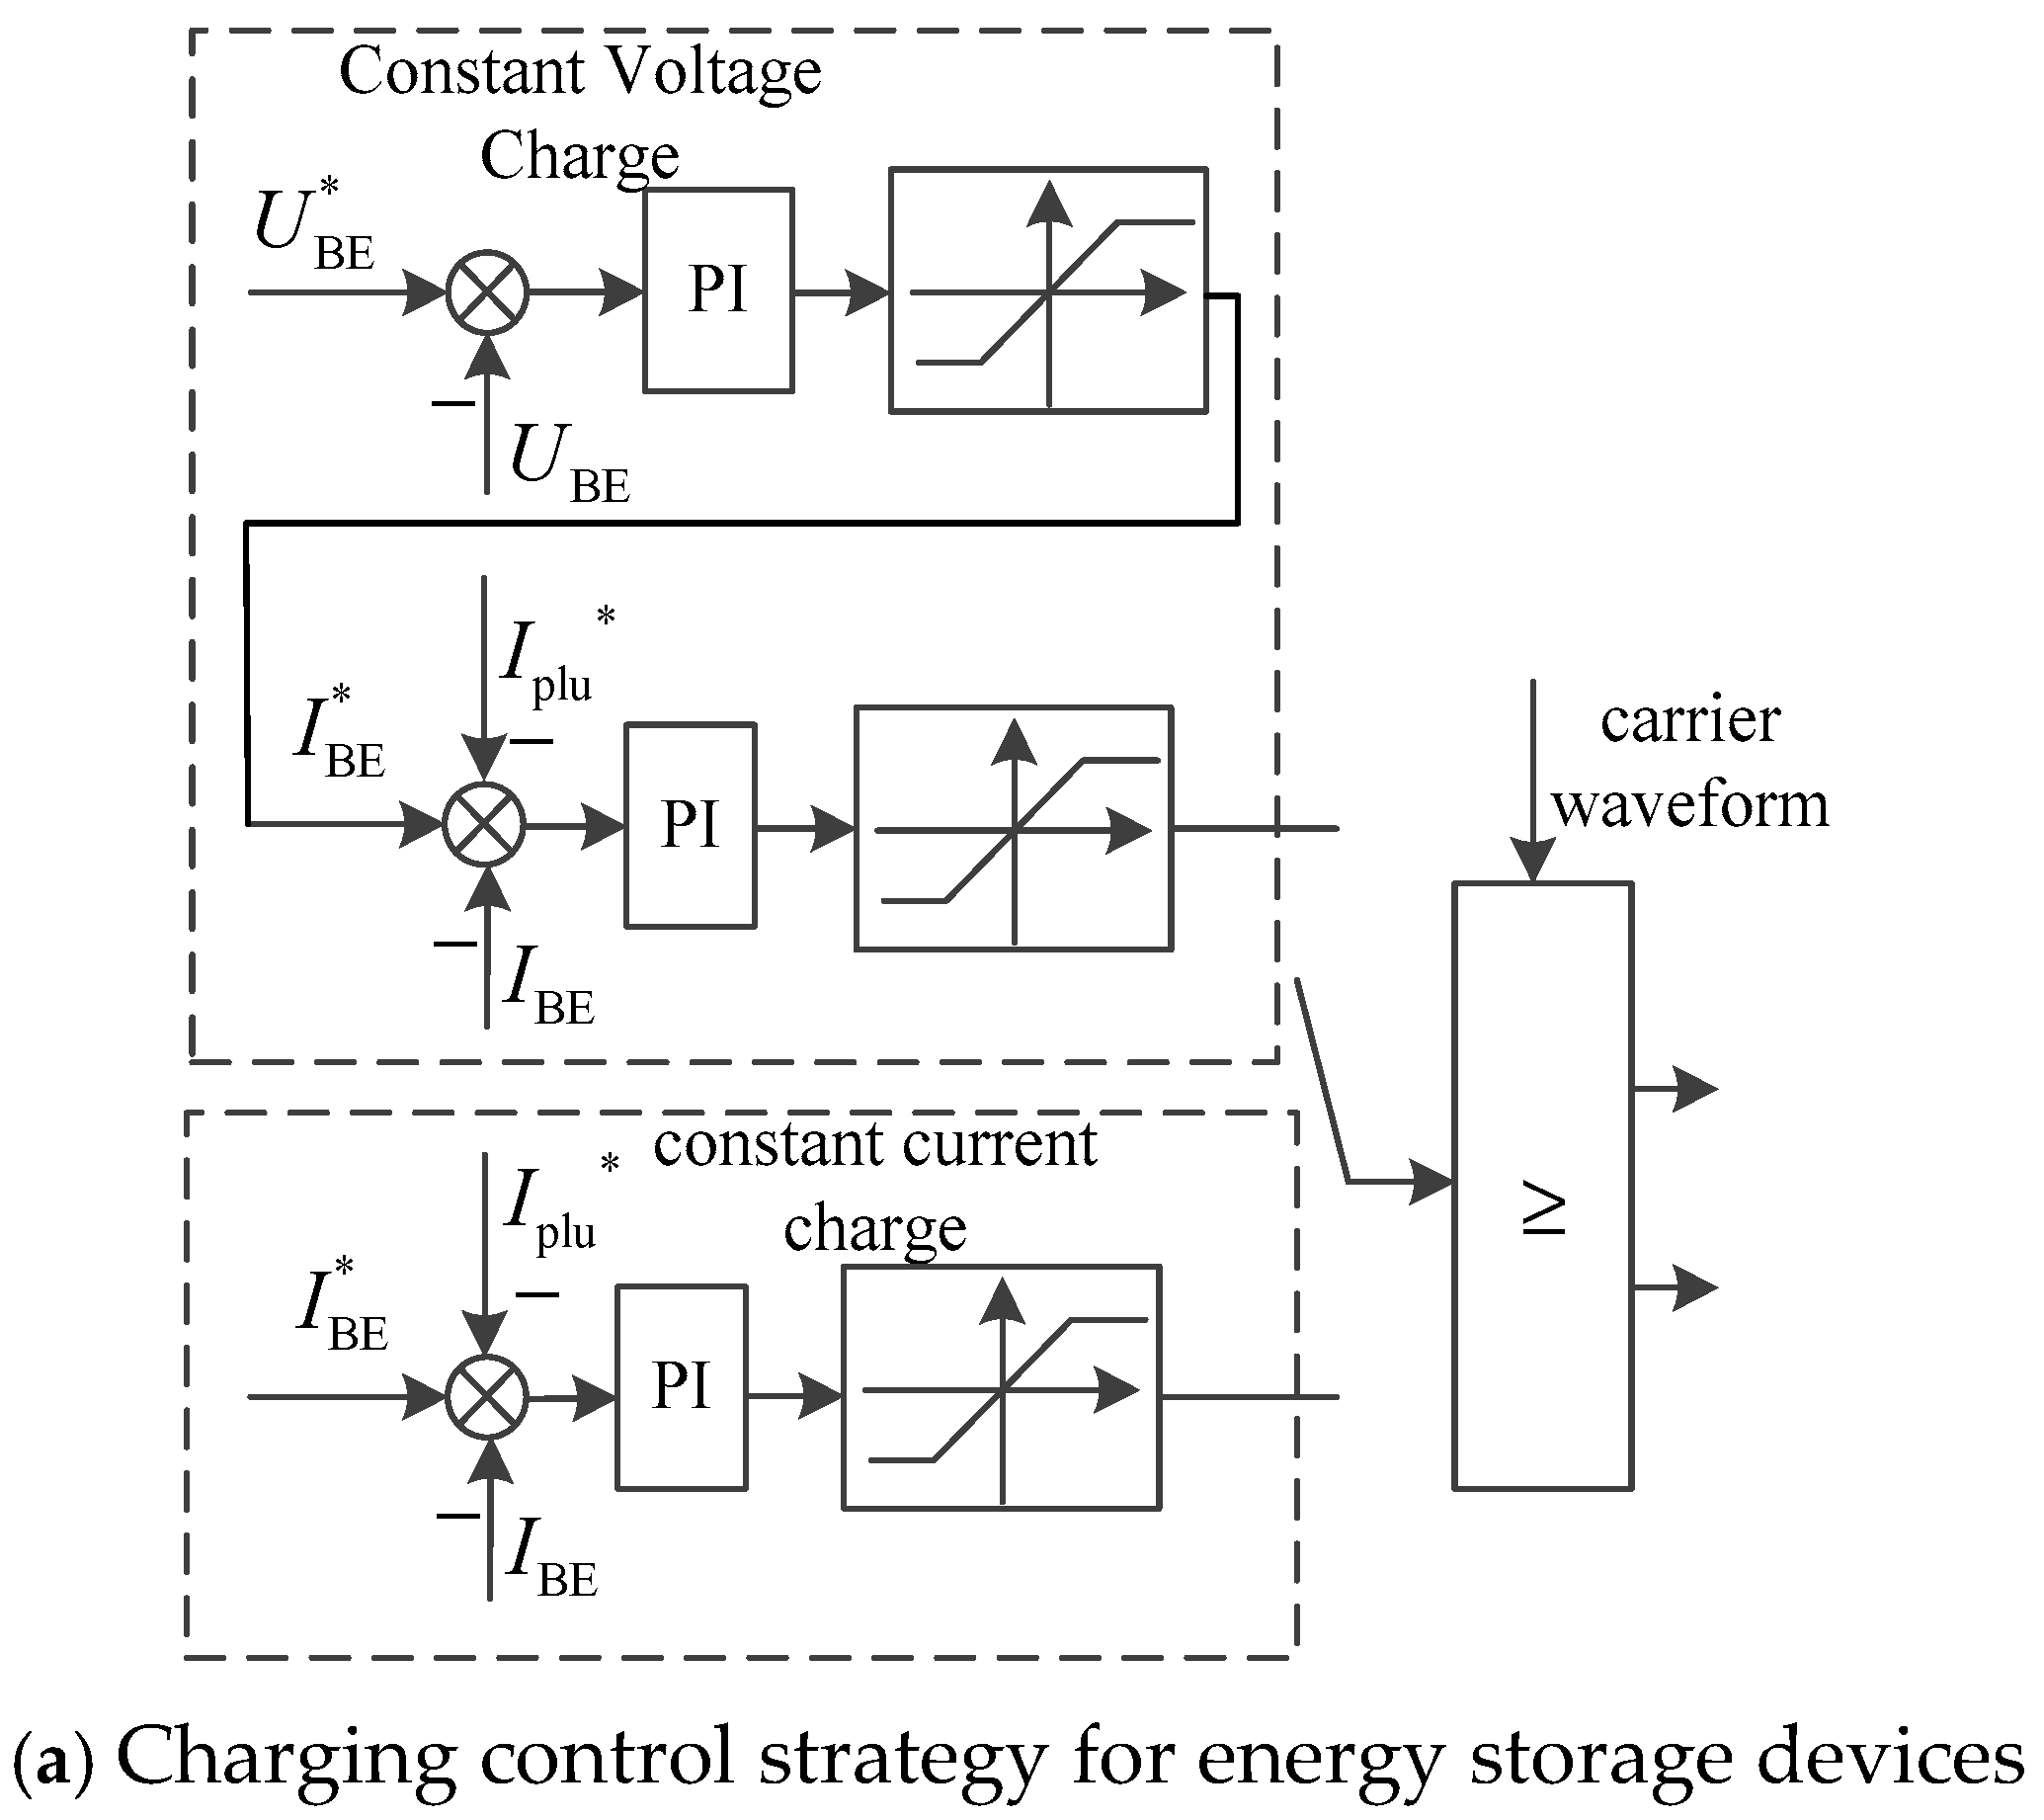
The energy storage device adopts a constant-current and constant-voltage control strategy. The charging process is divided into two stages: constant-current charging and constant-voltage charging. During the initial charging stage, charging is performed with a constant high current. When the terminal voltage of the energy storage device reaches the pre-set voltage value, a constant voltage control strategy is employed, during which the charging current is gradually reduced. Charging of the energy storage device is completed when the charging current decreases to the set value. When the energy storage device is discharged, constant-current discharge control is employed.
One of the functions of the energy storage device in the photovoltaic energy storage charging pile is to absorb the pulse current generated during the initiation of charging by a new energy vehicle, thereby mitigating sudden drops in the DC bus voltage that may cause system shutdown. The charging control strategy and discharging control strategy of the energy storage device are presented in
Figure 5a,b, respectively.
3.3. Segmented Control Strategy for Electric Vehicle Charging Pile
Lithium iron phosphate batteries are predominantly employed in most new energy electric vehicles. The charging methods for charging piles are classified into AC charging and DC charging, with AC charging typically utilizing single-phase or three-phase power supplies featuring low rated currents. DC charging posts have high charging power and high current ratings. Lower power capacity is observed in residential power grids of rural areas; thus, AC charging piles are employed, with a typical charging duration ranging from 6 to 10 h.
Constant current charging, constant voltage charging, pulse charging, and reflex charging are employed in new energy electric vehicles. The use of a reflective charging method can remove the polarization phenomenon of the battery in new energy electric vehicles and increase the service life of the battery as well as the number of cycles of charging and discharging.
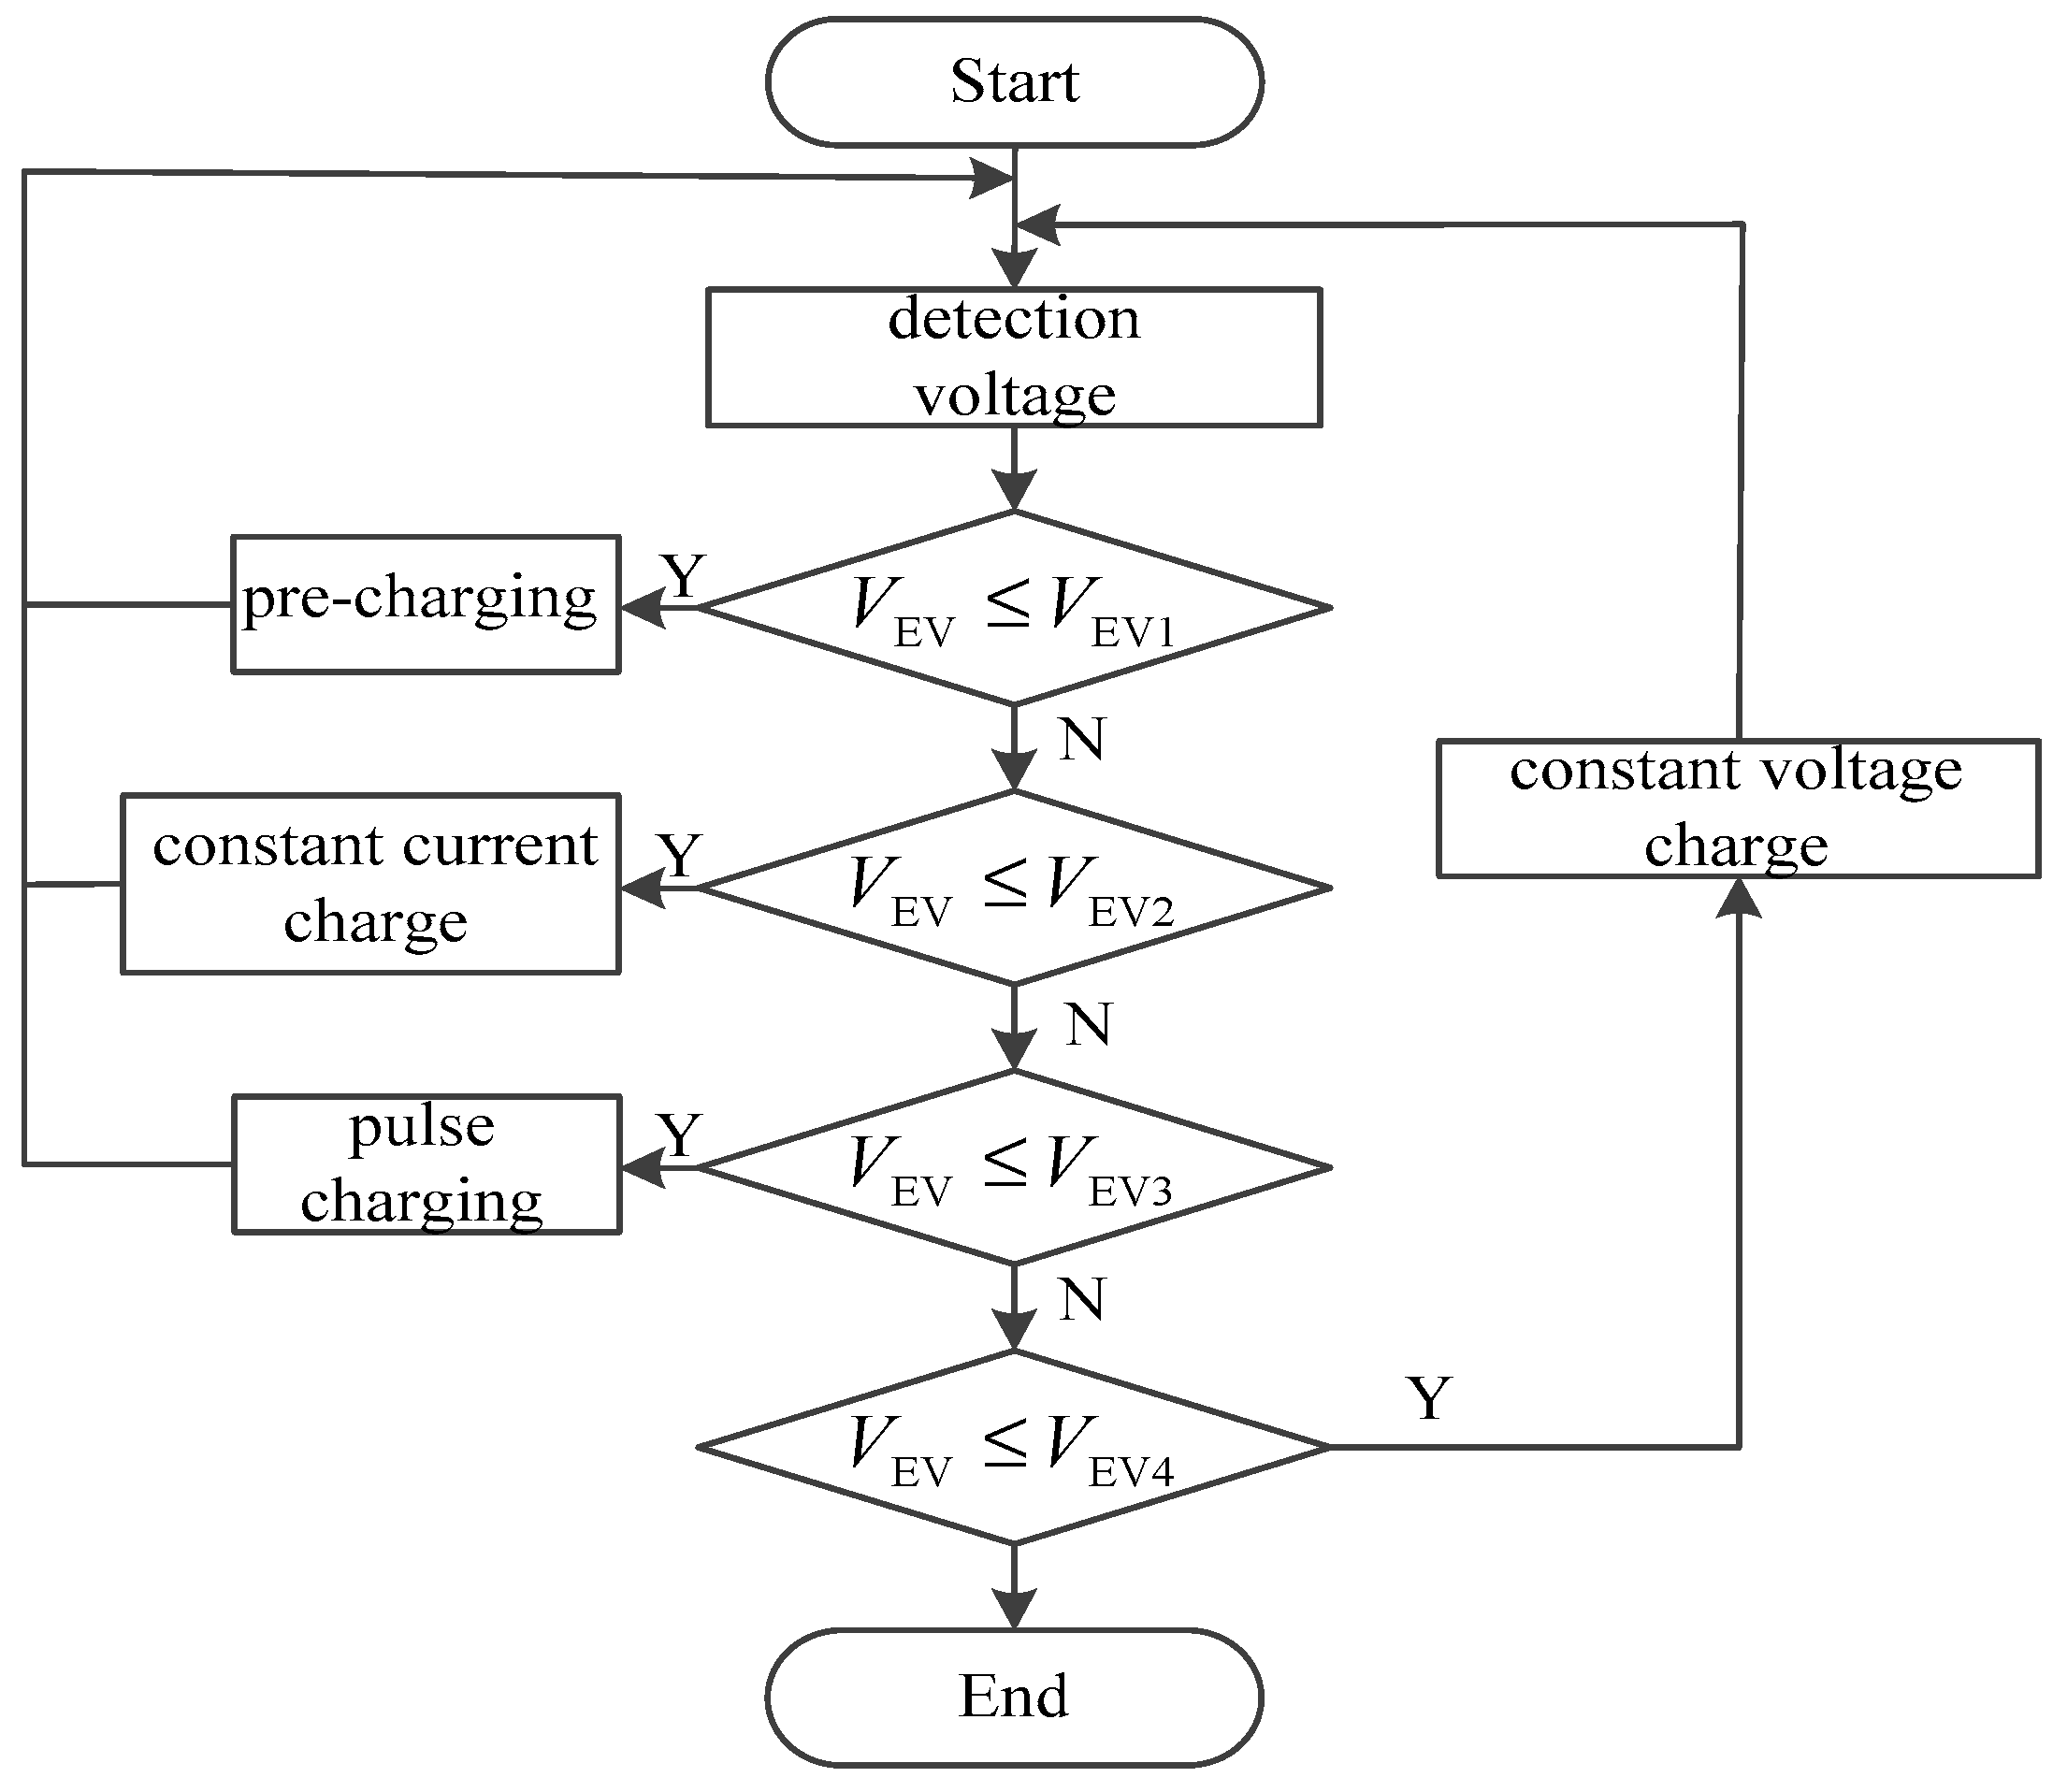
Considering both the charging time and service life of the battery, the segmented fast charging strategy is adopted. This approach employs different charging methods across distinct stages and can be divided into three stages.
In the pre-charging stage, the SOC of the battery is maintained below 10%, its primary function is battery protection. The segmented constant current (SCC) charging stage is recognized as the rapid charging stage. The high-current positive/negative pulse charging stage involves charging the battery with large-amplitude positive and negative pulse currents.
To ensure that the charge capacity of each charging segment is approximately equal for rechargeable battery cells, the state of charge (SOC) can be divided as follows: 10%, 20%, 30%, 40%, 50%, 60%, 70%, 80%, and 99%.
The charging strategy of the charging pile is depicted in
Figure 6.
3.4. Grid-Connected Inverter Control Strategy
The single-phase inverter topology is shown in
Figure 2c. Considering the equivalent inductance
Lg of the grid transmission line, the transfer function of the LCL filter is
From Equation (5), it can be seen that the grid inductive reactance affects the performance of the LCL filter due to the weak grid characteristics, which changes the resonant frequency.
When the PI controller is employed in the control system of a single-phase grid-connected inverter, steady-state errors in amplitude and phase are introduced during the tracking of sinusoidal signals, and the anti-interference capability is found to be weak. While strong anti-interference performance is exhibited and no steady-state errors are observed during sinusoidal signal tracking when a PR controller is employed, the gain of the PR controller is relatively low at non-fundamental frequencies, and system performance may deteriorate if the grid frequency shifts.
The quasi-PR controller offers the advantage of enabling sinusoidal signal tracking without steady-state errors and can mitigate the impact of grid fundamental frequency offset on the control system’s performance. The transfer function of the quasi-PR controller is as follows:
where
Kp_PR,
KR_PR, and
ω0_PR are, respectively, defined as the scaling coefficient, resonance coefficient, and fundamental angular frequency of the quasi-PR controller.
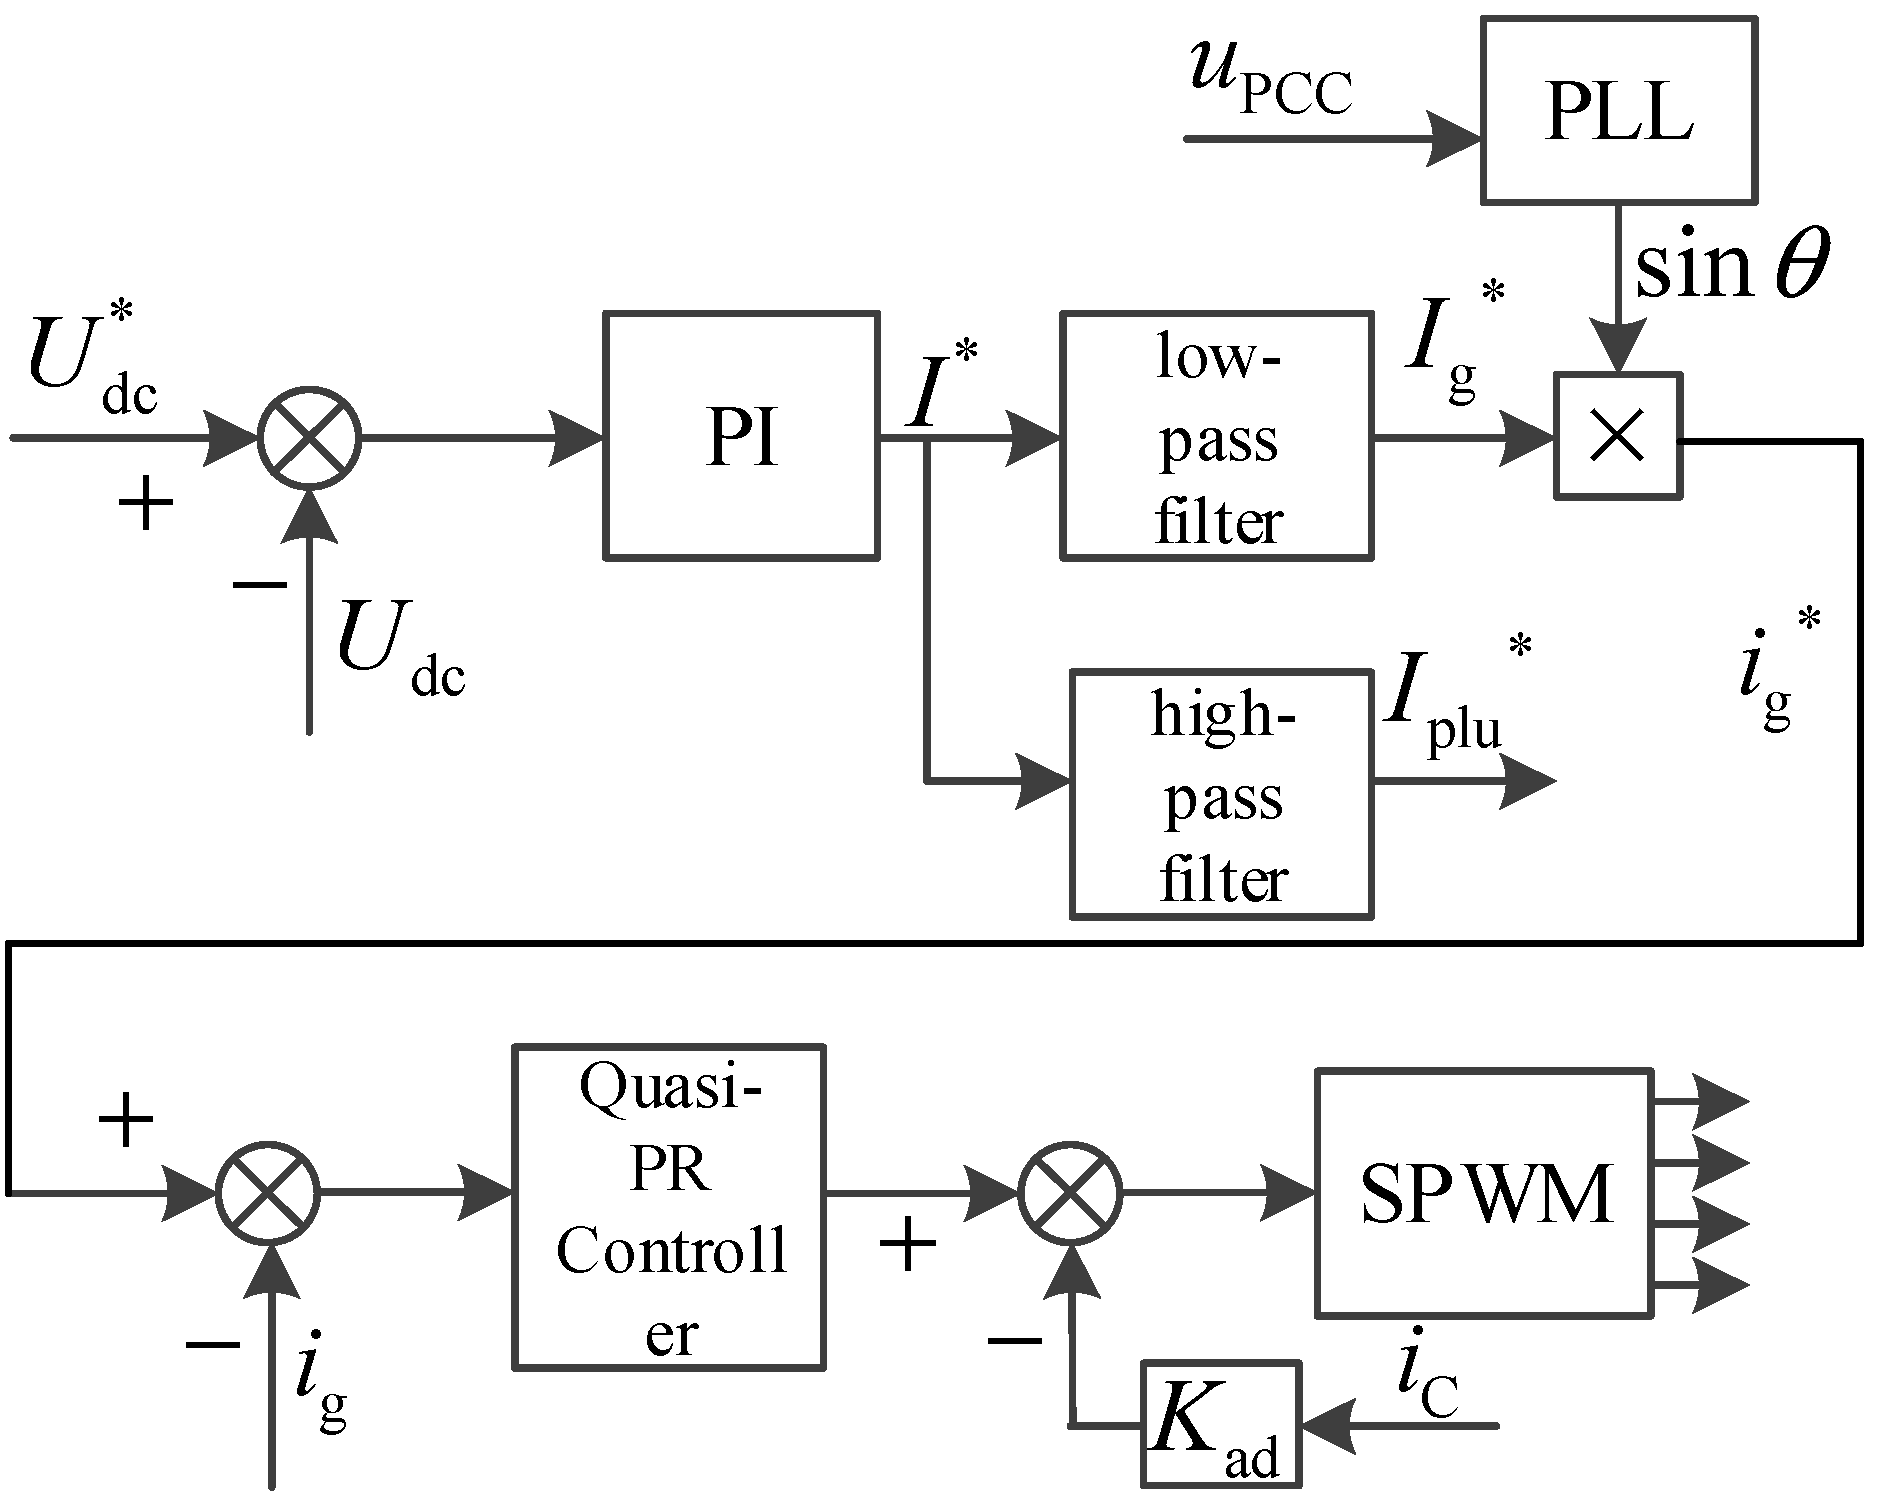
The single-phase grid-connected inverter control system employing a quasi-PR controller is depicted in
Figure 7.
I* is the current reference value output by the DC bus voltage controller,
Ig* is the low-frequency component of the current reference value, and
Iplu* is the high-frequency component of the current reference value, where
Ig* is provided by the single-phase grid connected inverter and
Iplu* is provided by the battery system.
When the operating condition of a weak grid changes, the equivalent impedance
Lg of the transmission line varies. The synchronization of the voltage phase angle at the point of common coupling (PCC) using a phase-locked loop (PLL) can be expressed as follows:
where
ωg is the angular frequency of the grid voltage. Equation (7) indicates a coupling relationship between the PLL and
Lg. Therefore, using a conventional PLL may result in poor system stability or even system failure. The second-order generalized integrator phase-locked loop (SOGI-PLL) can reduce the system bandwidth, filter out high-order harmonics while having minimal impact on the fundamental component, and ensure the accuracy of phase angle detection at the PCC. The block diagram of SOGI-PLL is shown in
Figure 8.
In the diagram, upcc_α and upcc_β represent the α-axis and β-axis components of upcc in the stationary two-phase coordinate system; upcc_d and upcc_q are the d-axis and q-axis components in the rotating two-phase coordinate system. uq* denotes the reference value of upcc_q, Δuq is the error of upcc_q, s is the differential operator, and kff is the first-order differential coefficient.
To further reduce the impact of the transmission line inductance on the PLL, a grid current feedforward module is adopted. This module can reduce the effect of the term
ωgLgiL2 in Equation (7) on the PLL. Since the current feedforward loop is added, the output of the SOGI_PLL is no longer the phase of
upcc, as shown in
Figure 9.
Therefore, a phase compensation module is added, which can be expressed as follows:
where
Iref is the amplitude of
iL2, and
Um is the amplitude of
Ug.
4. Simulation Results
To verify the proposed control strategy in this paper, a simulation model was built.
Figure 10 shows the simulation model built through Matlab R2020b/simulation.
Figure 10a shows the PV system,
Figure 10b shows MPPT for PV system,
Figure 10c shows the single-phase full-bridge inverter,
Figure 10d shows the buck/boost converter,
Figure 10e shows the SOGI-PLL, and
Figure 10f shows the control strategy for a buck/boost converter.
The parameters in the simulation model are shown in
Table 2.
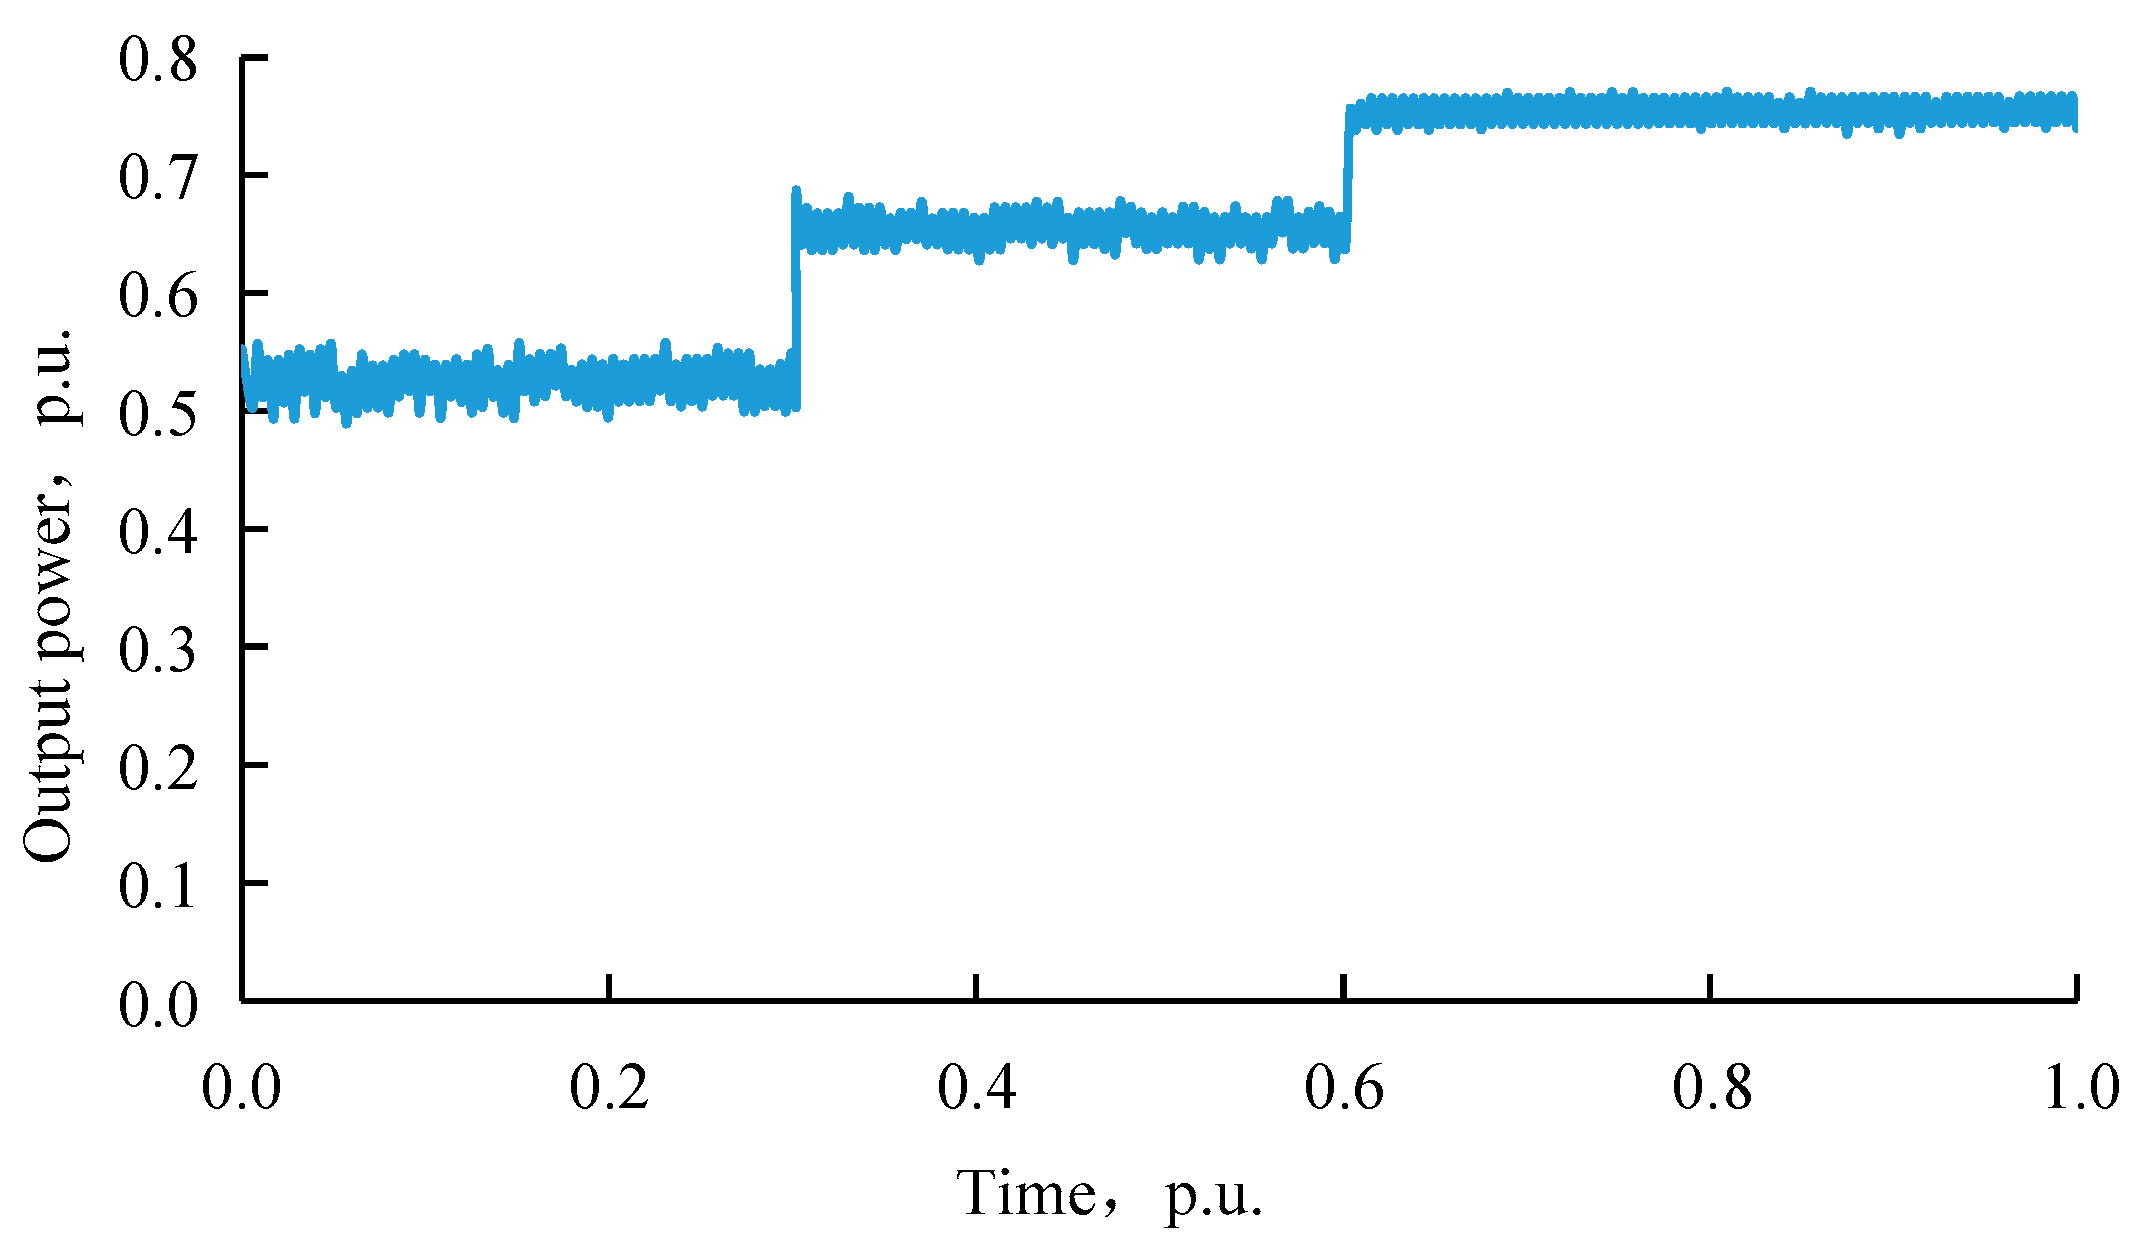
To verify the maximum power point tracking (MPPT) control strategy of the photovoltaic power generation system based on incremental conductance, the irradiance was set to increase from 600 W/m
2 to 800 W/m
2, and then to 1000 W/m
2. The output power curve of the photovoltaic power generation system under these conditions is shown in
Figure 11. The rated time in
Figure 11 is 6 h.
As shown in
Figure 11, with the increase in irradiance intensity, the output power of the photovoltaic power generation system also increases, indicating that the maximum power point tracking can be effectively achieved.
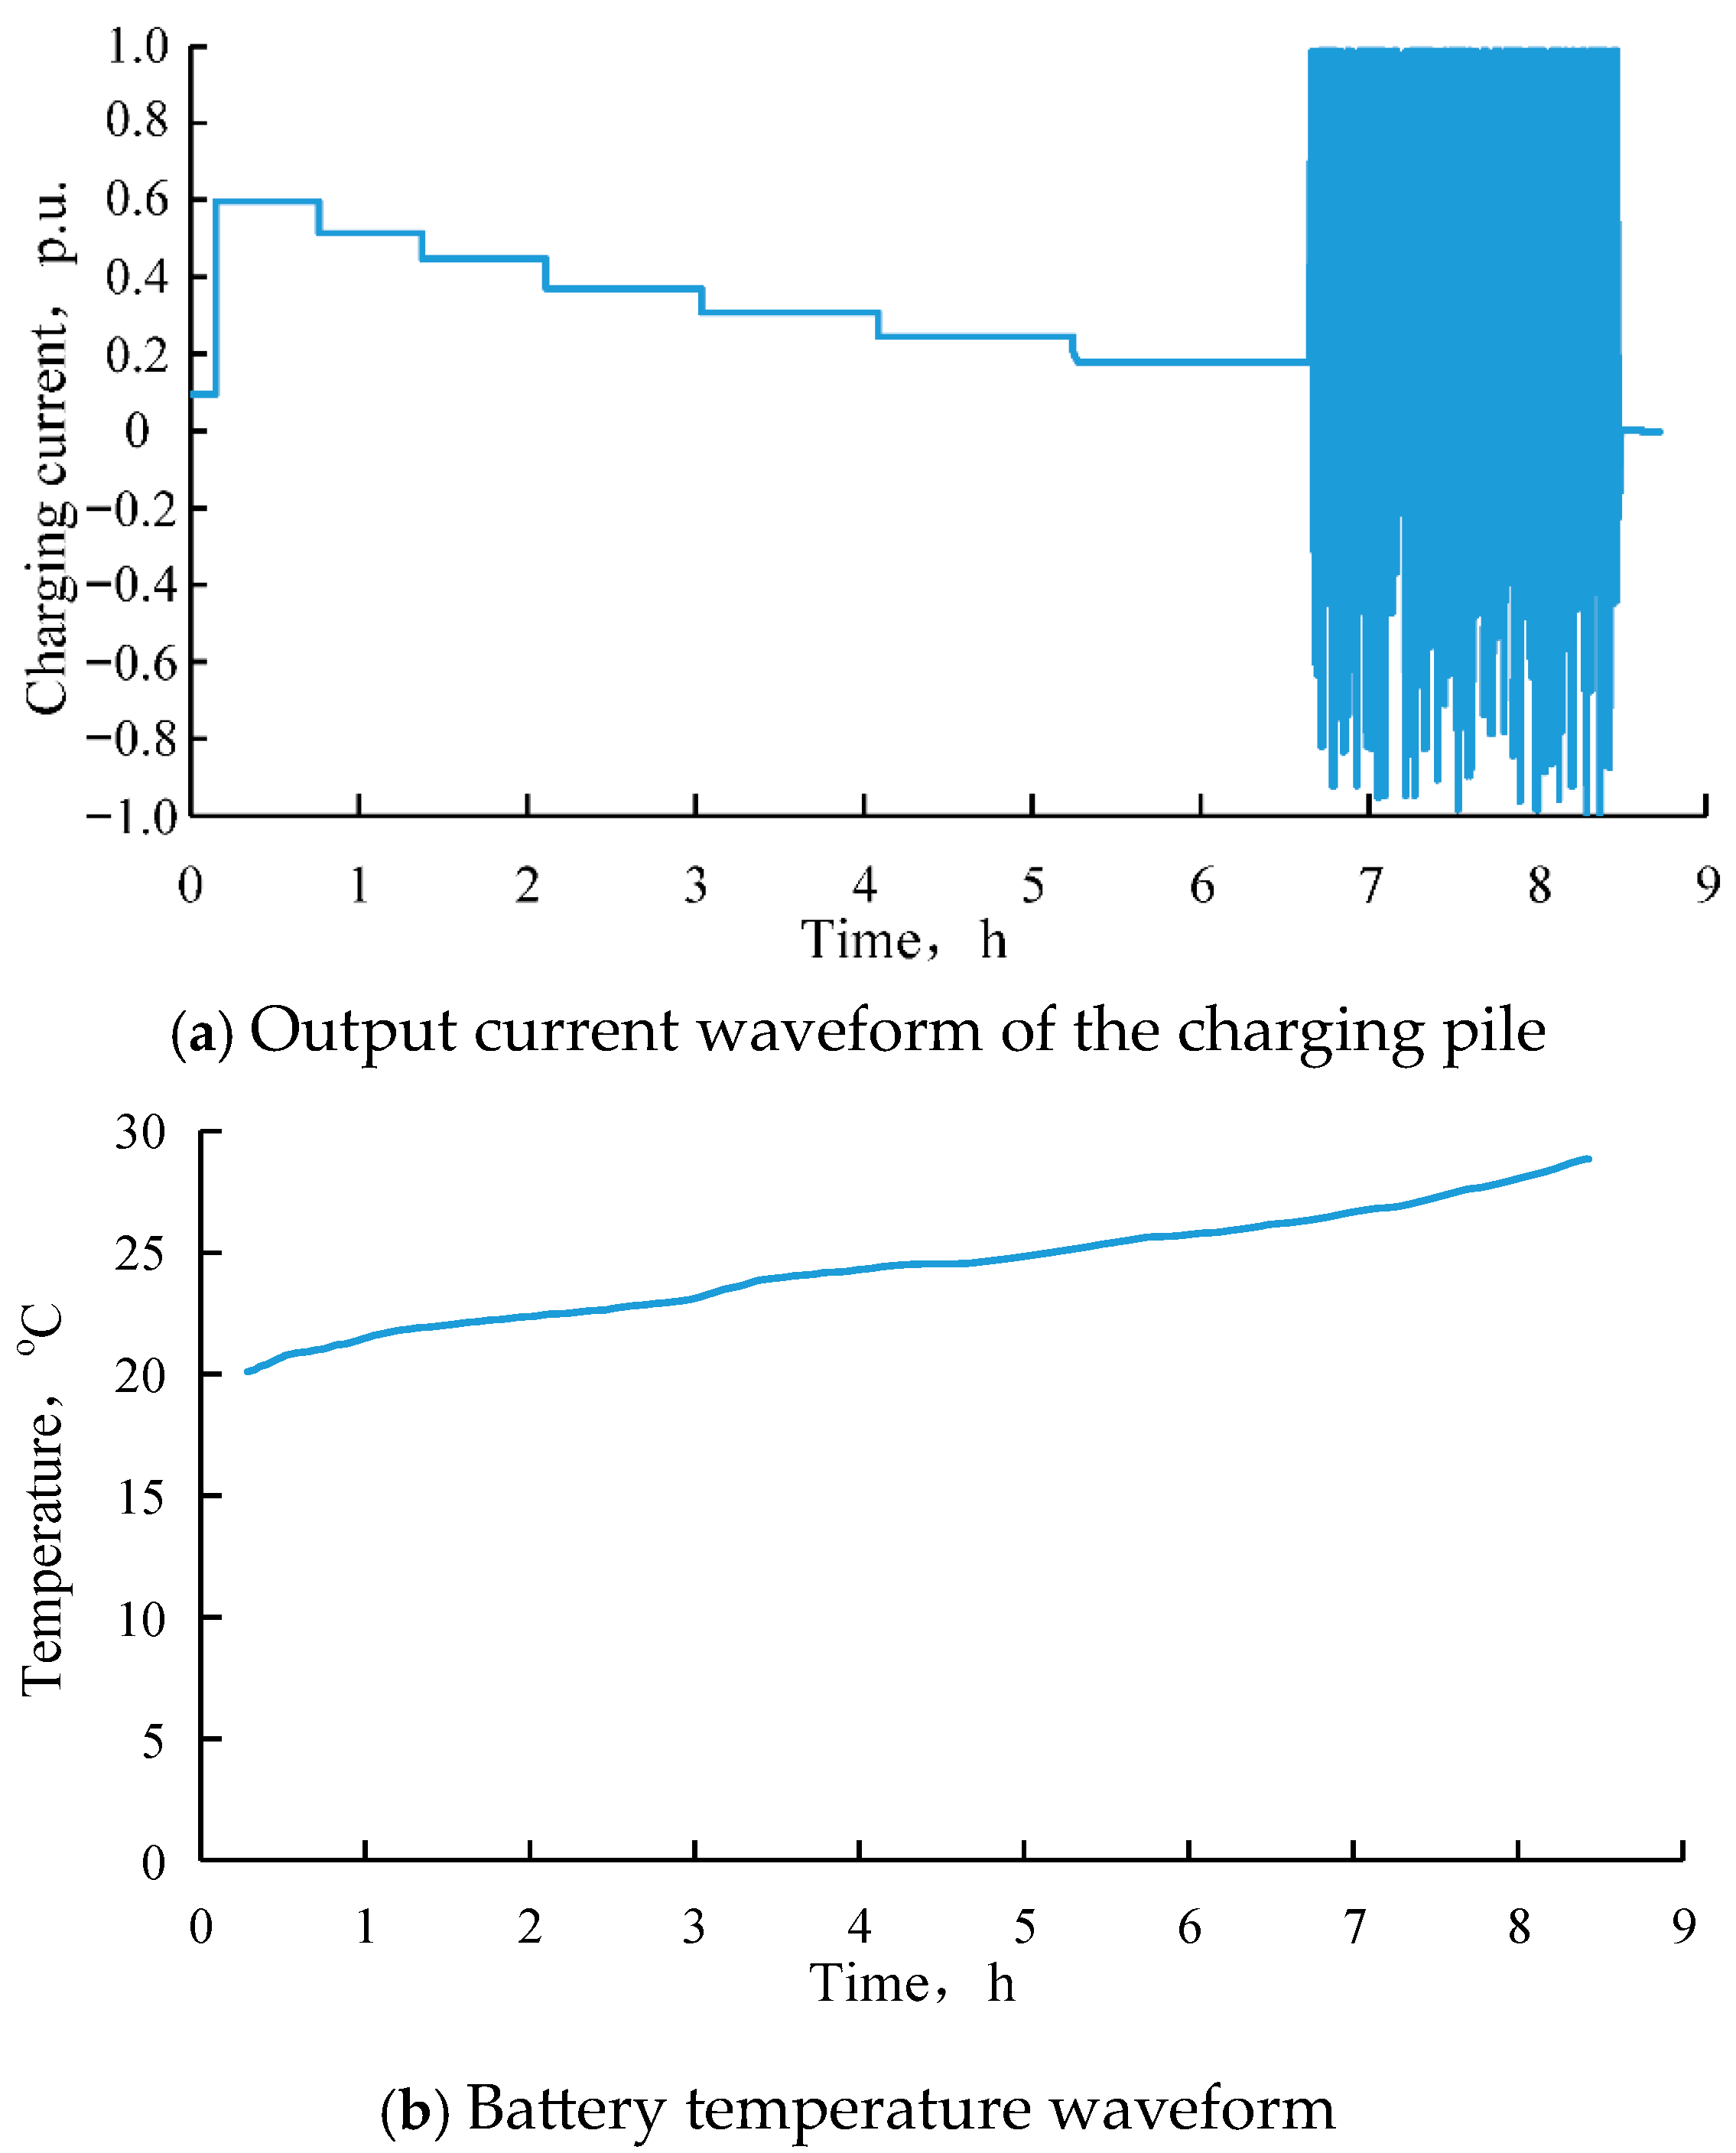
Figure 12a shows the output current waveform of the charging pile for the new energy electric vehicle, and
Figure 12b illustrates the temperature rise in the battery during charging.
As shown in
Figure 12, the charging process of the battery for the new energy electric vehicle is divided into four stages. First, a small current is used for pre-charging. Then, constant current charging is applied to raise the battery state of charge (SOC) to approximately 80%. After that, large positive and negative pulse currents are used to further charge the battery to around 98–99% SOC. Finally, constant current charging is applied again to increase the SOC to 99.9%, completing the charging process. From the battery temperature rise curve, it can be observed that the battery temperature increases gradually from room temperature (20 °C) to about 29 °C. The temperature rise is small, indicating that the method does not cause thermal damage to the battery.
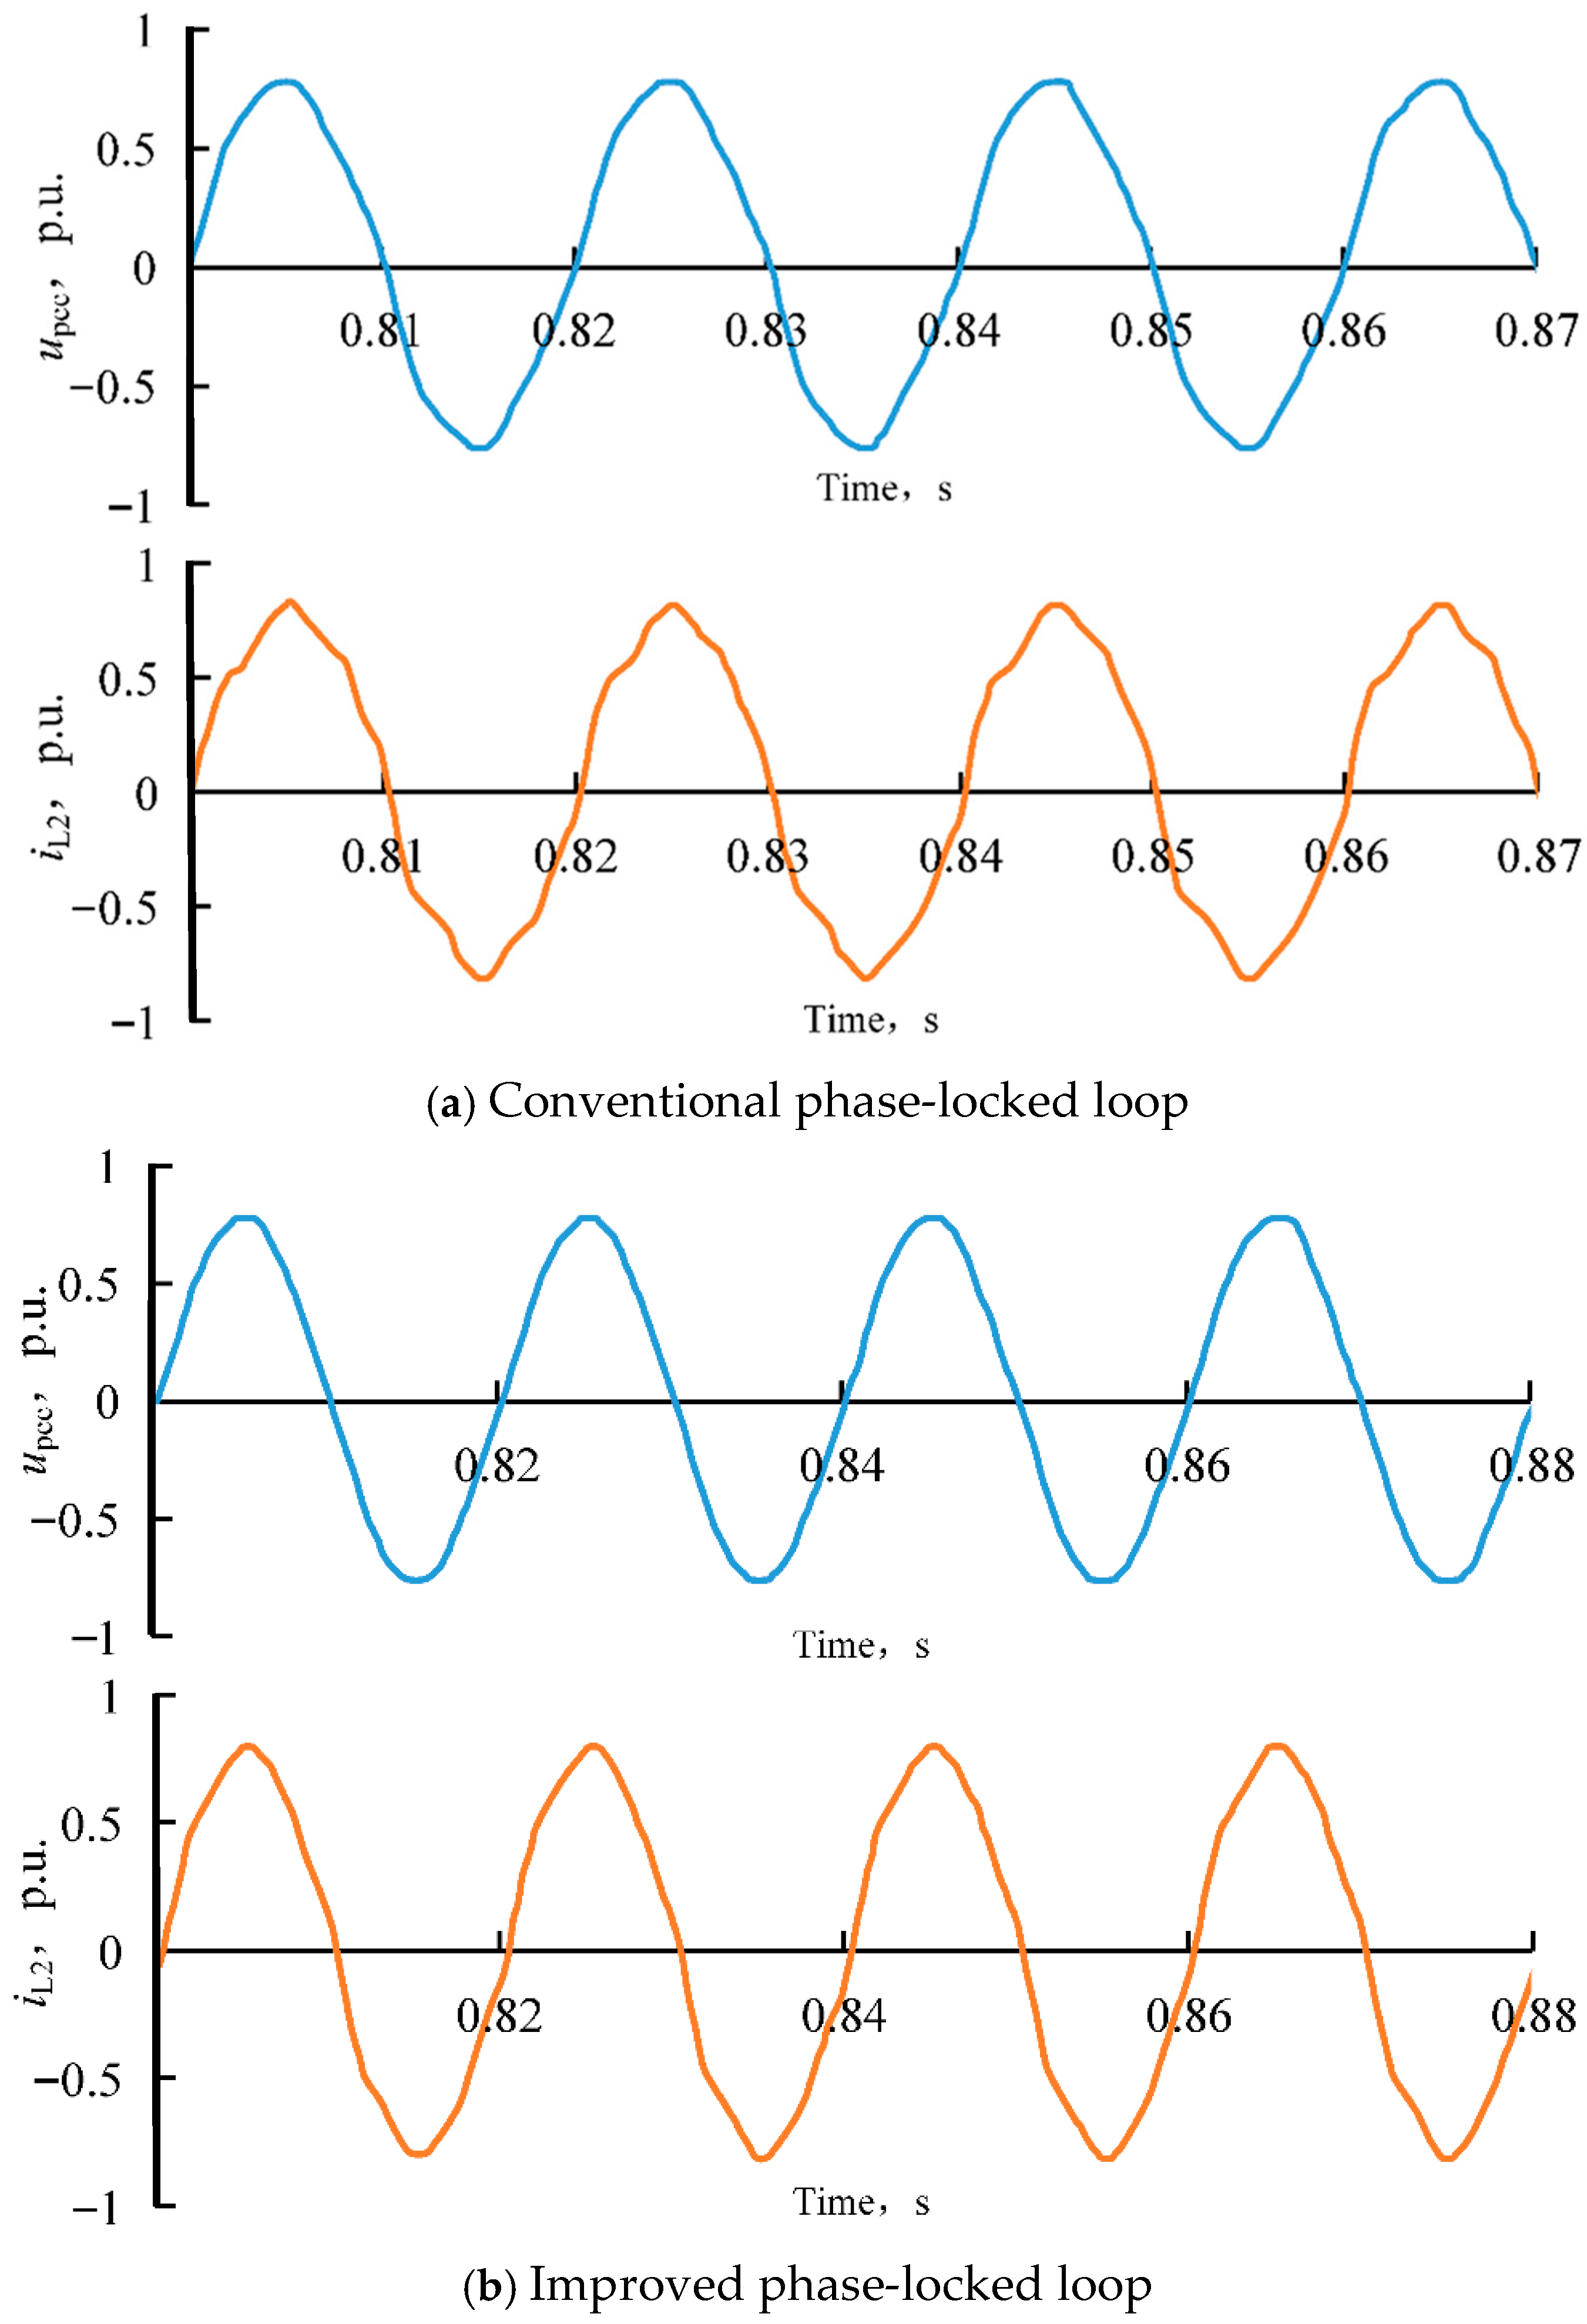
Figure 13a shows the output voltage and current waveforms of the single-phase grid-connected inverter when the transmission line impedance is set to 1 mH and a conventional phase-locked loop (PLL) is used.
Figure 13b shows the waveforms when the proposed improved PLL is adopted.
As shown in
Figure 13, when the improved PLL is applied, the output current of the grid-connected inverter exhibits lower harmonic content. In contrast, under the control system with a conventional PLL, the harmonic content of the inverter output current increases as
Lg (the grid-side inductance) rises, indicating a greater influence of transmission line impedance under weak grid conditions.
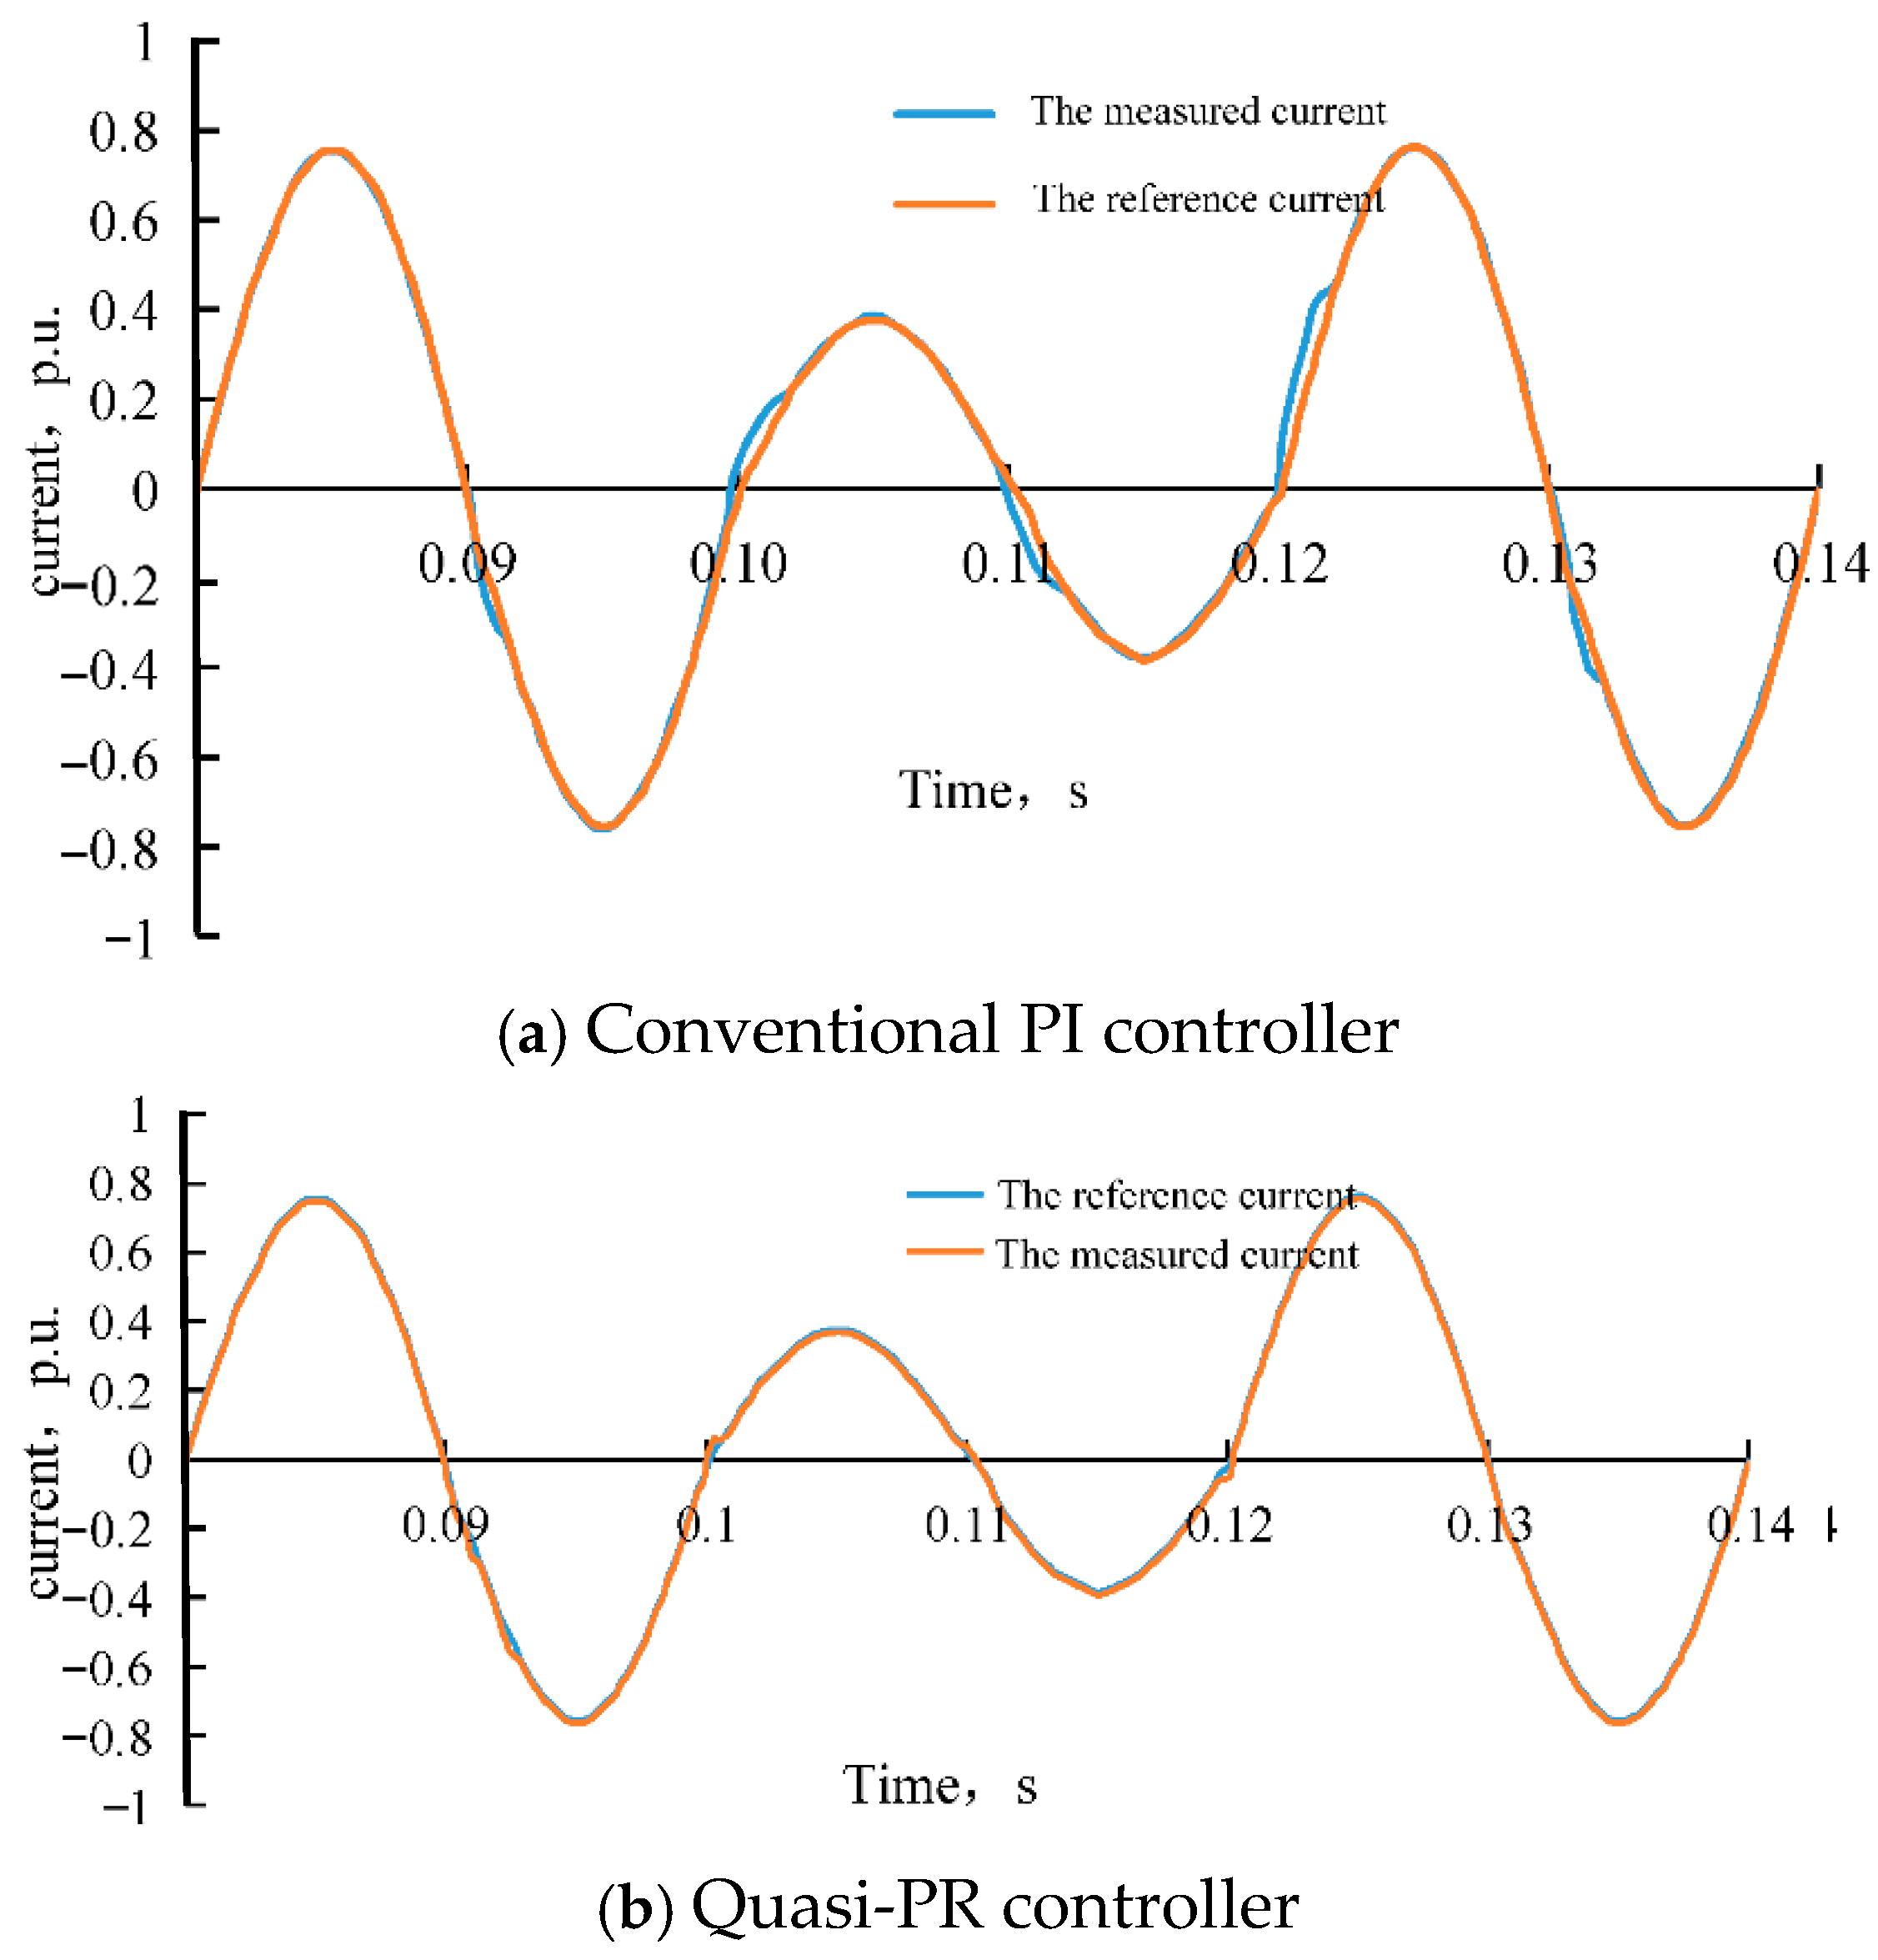
Figure 14a shows the output current of the single-phase grid-connected inverter when a conventional PI controller is used, under a scenario where the solar irradiance changes suddenly.
Figure 14b presents the output current waveform when a quasi-PR controller is used under the same conditions.
As shown in
Figure 14, the single-phase grid-connected inverter using the quasi-PR controller is able to track the reference current of the system without steady-state error.


