Article

Research on Optimization of Orebody Mining Sequence Under Isolation Layer of Filling Body Based on FLAC3D Software

1
School of Resources and Safety Engineering, University of Science and Technology, Beijing 100083, China
2
Changsha Mining Research Institute Co., Ltd., Changsha 410012, China
*
Authors to whom correspondence should be addressed.
Processes 2025, 13(7), 2296; https://doi.org/10.3390/pr13072296
Submission received: 16 June 2025 / Revised: 3 July 2025 / Accepted: 11 July 2025 / Published: 18 July 2025
(This article belongs to the Section Energy Systems)

Abstract

This study investigates the stability risks associated with a substandard-thickness (42 m) backfill isolation layer in the open-underground coordinated mining system of the Yongping Copper Mine’s eastern panel at the −150 m level. A numerical simulation based on FLAC3D 3.00 was conducted to evaluate the impacts of four mining sequences (south-to-north, north-to-south, center-to-flank, and flank-to-center) on stress redistribution and displacement evolution. A three-dimensional geomechanical model incorporating lithological parameters was established, with 23 monitoring points tracking stress and displacement dynamics. Results indicate that the mining sequence significantly influences the stability of both the isolation layer and the slope. No abrupt displacement occurred during mining, with incremental isolation layer settlement controlled within 3 mm. Post-mining maximum displacement increased to 10–12 mm. The “north-to-south” sequence emerged as the theoretically optimal solution, reducing cumulative displacements in pillars and stopes by 9.1% and 7.8%, respectively, compared to the suboptimal scheme. However, considering the engineering continuity of the existing “south-to-north” sequence at the −100 m level, maintaining consistent directional mining at the −150 m level is recommended to ensure synergistic disturbance control, ventilation system stability, and operational management coherence.

1. Introduction

With the gradual depletion of shallow mineral resources in China and the sustained growth of socioeconomic demand for resources, mining operations are increasingly transitioning to deeper deposits and accelerating the secondary exploitation of residual ores. However, during early-stage extensive mining practices, substantial roof and floor pillar resources were permanently lost in goafs due to constraints including complex orebody geometries, limitations in mining technologies, and short-term management decisions [1]. Although deep mining partially alleviates resource supply pressures, its associated technical challenges, high costs, and safety risks have rendered residual ore re-mining a more economically viable alternative [2,3]. Notably, the mining sequence directly governs the stress redistribution path in surrounding rock masses, the mechanical response characteristics of backfill isolation layer systems, and the coordinated deformation mechanisms of goafs, posing critical challenges for dynamic stability control during residual ore recovery.
To address these issues, researchers worldwide have conducted studies employing analogous material tests, machine learning, and numerical simulations [4,5,6]. Gao et al. [7] established a two-dimensional physical simulation platform to systematically investigate the time-dependent roof caving sequence during continuous mining under complex backfill conditions in the No. 92 orebody of Tongkeng Tin Mine. Through analogous material testing, Ye et al. [8] analyzed the evolution of surrounding rock strain, roadway deformation, and surface subsidence under advancing and retreating mining sequences, further exploring rational sequencing strategies for subsequent backfill mining in Shanghengshan Mine. Cui et al. [9] combined physical simulation with multi-parameter monitoring to compare overburden deformation and energy release characteristics during initial coal seam mining and residual coal recovery, revealing key patterns in strata movement, pressure distribution, and energy dissipation. Moosavi et al. [10] proposed a new binary integer programming model to solve the optimization problem of the mining sequence of orebodies, and discussed the influence of boundary grade strategy on mining sequence. Zhou et al. [11] enhanced mining sequence rationality and efficiency through genetic algorithm optimization based on numerical simulation results. Sears et al. [12] compared roof displacement predictions under two mining sequences in an inclined limestone mine using FLAC3D modeling, identifying optimal sequencing strategies. Jiang et al. [13] combined theoretical analysis, physical simulation, and numerical modeling to study stress evolution and surface subsidence under alternative backfill sequences in strip–fill mining. Wang et al. [14] developed an ANSYS v12.1-based 3D model of Zhangfushan Iron Mine to optimize mining sequences through back-analysis of backfill stability via displacement and stress monitoring. Nevertheless, existing research predominantly focuses on single mining modes or standard-thickness isolation layers, leaving a knowledge gap regarding mining sequence optimization for open-underground coordinated systems with nonstandard isolation layers and slope stability interactions.
This study focuses on the open-underground coordinated mining system of Yongping Copper Mine, establishing a 3D numerical model to investigate stress–displacement evolution mechanisms under a nonstandard 42 m backfill isolation layer. By analyzing four mining sequences through displacement monitoring point networks, this research identifies an optimal mining scheme balancing theoretical superiority with engineering continuity, providing scientific decision-making support for safe and efficient mining at the −150 m level.

2. Research Method

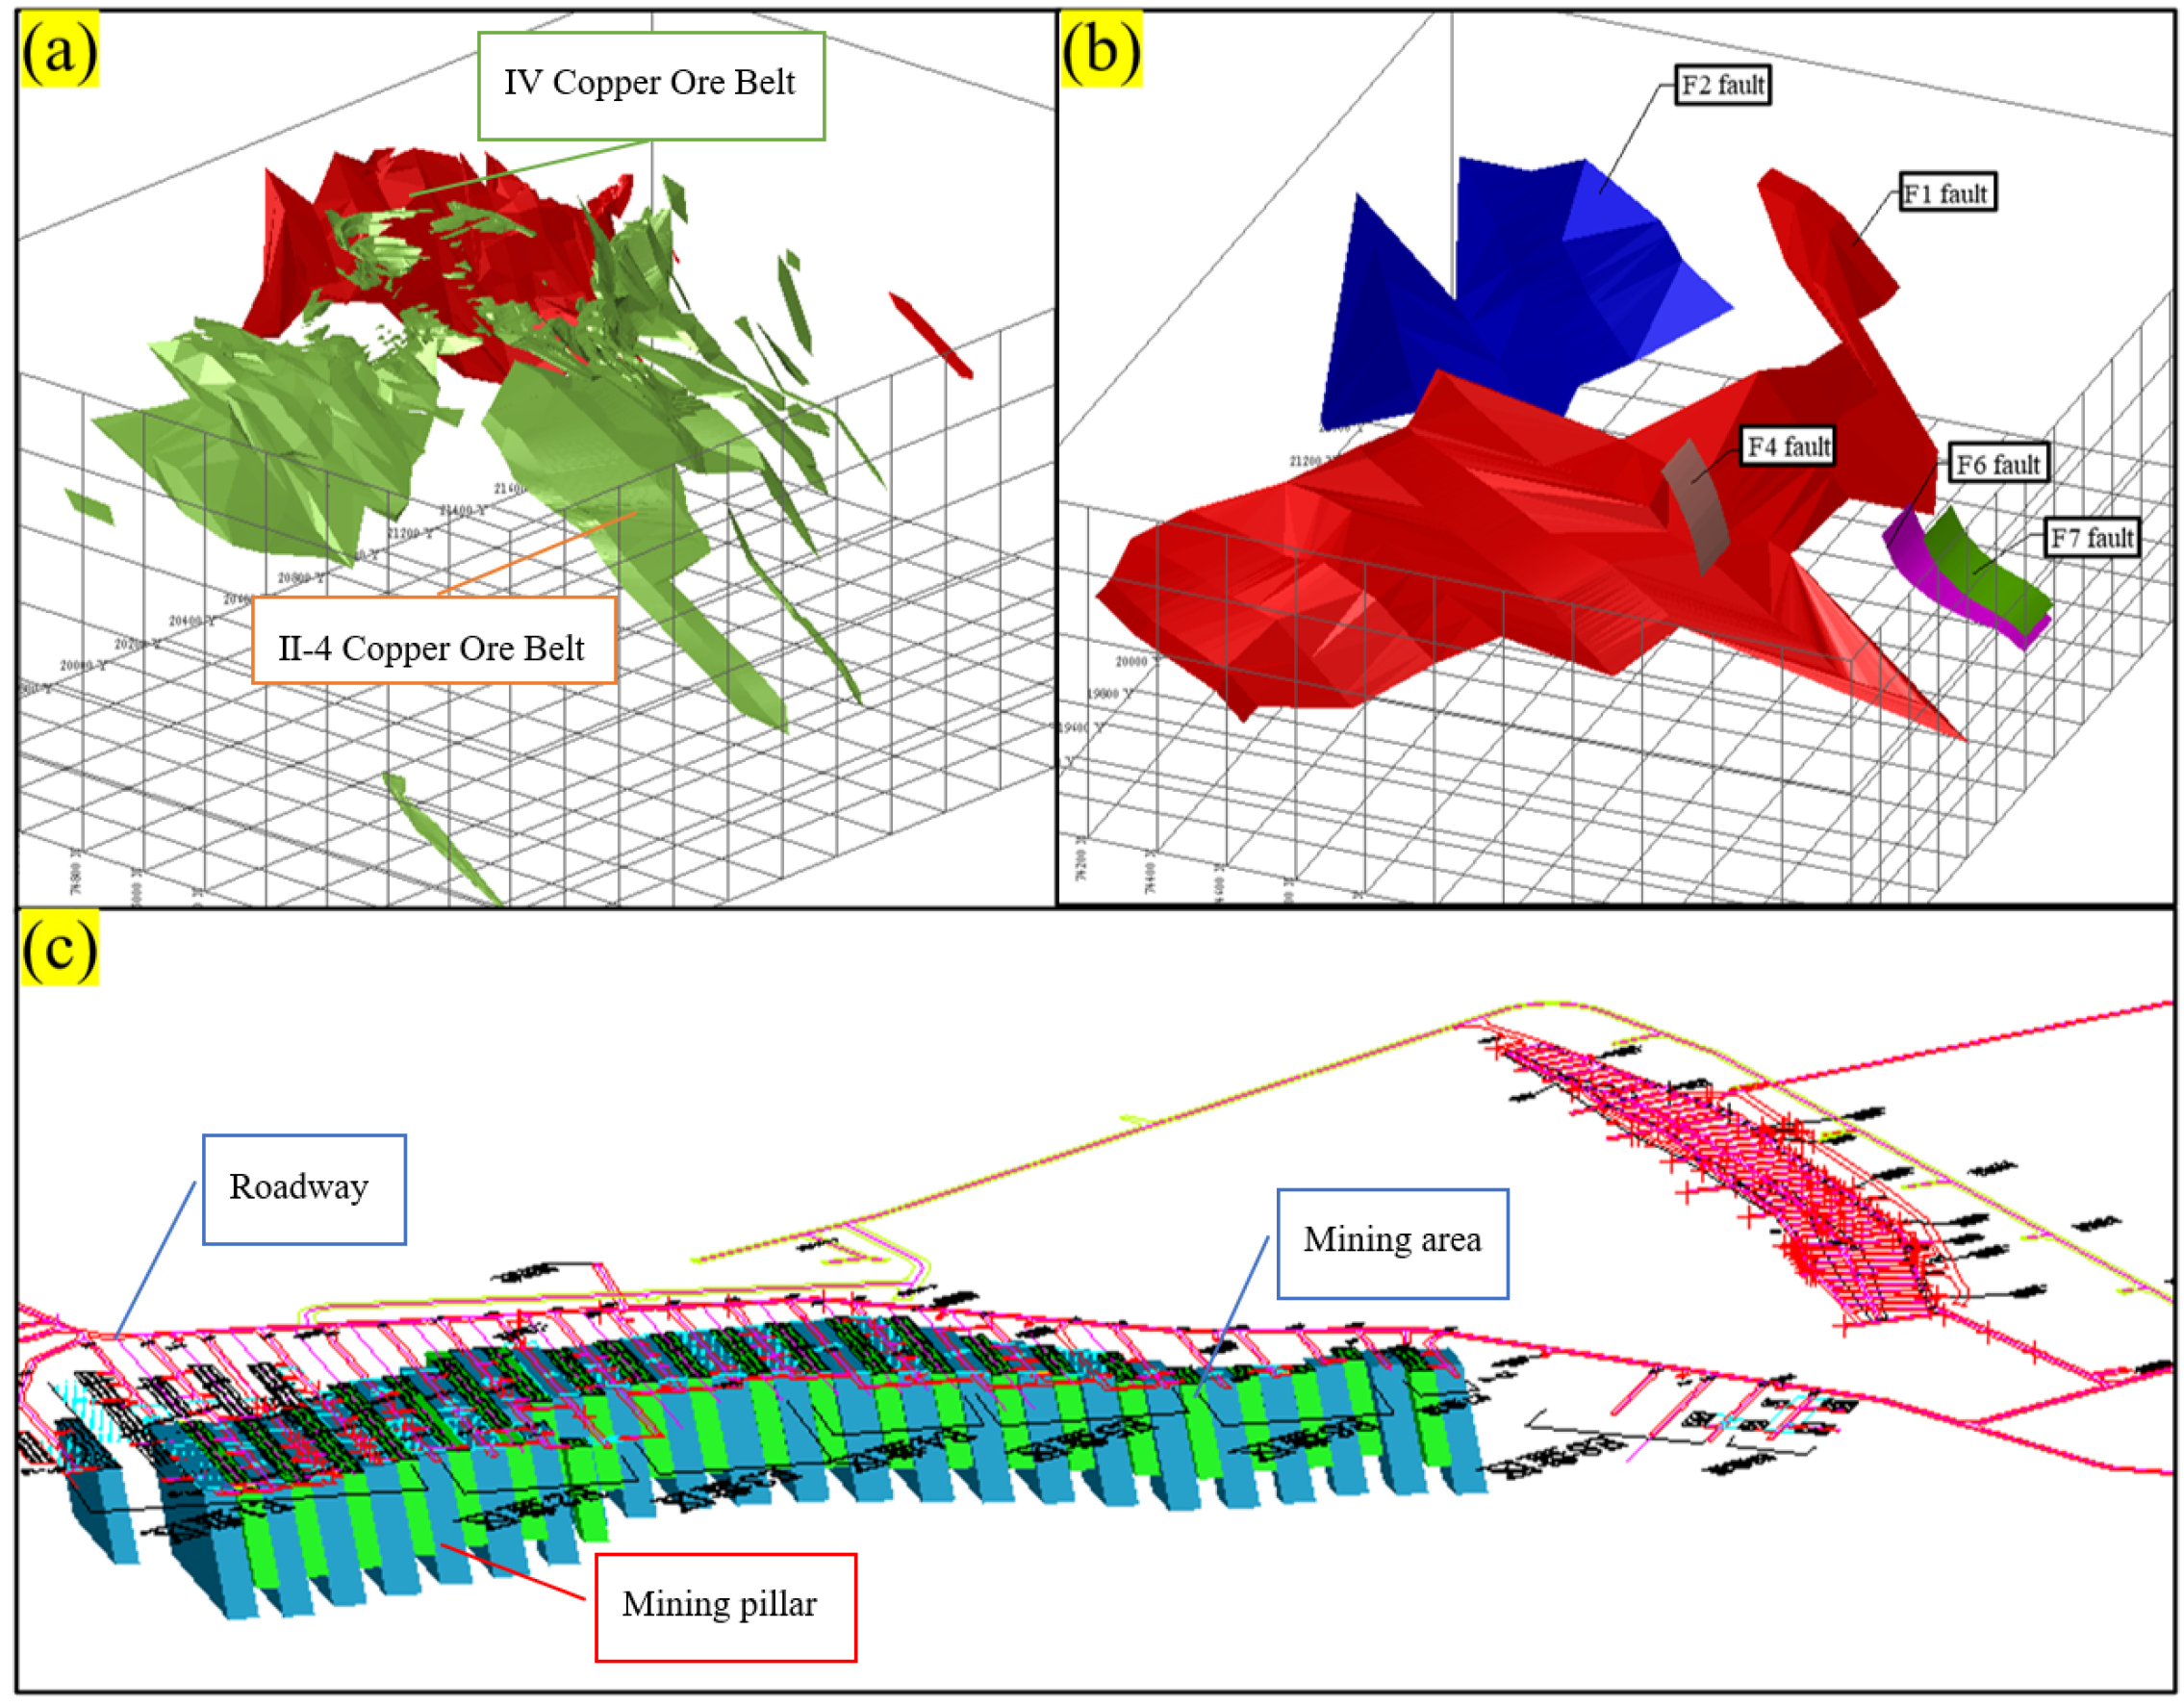
2.1. Geological Overview and Study Area

The Yongping Copper Mine is situated in Yongping Town, Yanshan County, Shangrao City, Jiangxi Province, China, located at the northern margin of the Wuyi Mountain uplift (geographic coordinates: 117°45′–117°48′ E and 28°11′–28°13′ N; Figure 1a). As a flagship operation of Jiangxi Copper Corporation, this large-scale open-underground hybrid mine has a designed production capacity of 10,000 t/d (5000 t/d for both surface and underground operations). The ore deposits primarily comprise Zone II (main orebody) and Zone IV. The II-4 orebody exhibits a gently dipping stratiform morphology, extending 2500 m in strike length with an average thickness of 17.11 m, occurring at elevations between +470 m and −670 m. In contrast, Zone IV features steeply dipping medium-thick orebodies (average thickness: 14.07 m), structurally controlled by the F2 fault. The stratigraphic sequence is dominated by Carboniferous Yejiawan Formation limestone, skarn, and migmatite, with complex geological structures including large reverse faults (F1, F2) and the Tianpaishan overturned anticline. Rock mass engineering geological conditions are classified as moderate, though localized stability is compromised by fault fracture zones.
The mine adopts a “belt inclined shaft + auxiliary ramp” development system, and the underground mining method employed is a two-step sublevel open stoping method with subsequent backfilling. As mining depths advance (current open-pit floor at −8 m; initial underground mining level at −100 m), the designed isolation layer thickness between surface and underground operations has been reduced from 50 m (+0 to −50 m) to 42 m, falling below the 50 m minimum specified by the “Nonferrous Metals Mining Design Code” (GB 50771-2012) [15]. This substandard configuration amplifies instability risks under coupled dynamic loads from surface blasting vibrations and underground extraction-induced disturbances, potentially triggering roof collapse, airblast waves, and slope failure.
Rational mining sequences in underground mining operations facilitate improvements in rock mass stress distribution and mitigate stress concentration caused by multiple mining disturbances through controlled overlap of stress elevation zones. Different mining sequences exert varying degrees of influence on the stability of both the backfill isolation layer and open-pit slopes.
Current mining configurations divide underground operations into eastern and western panels (Figure 1b). As illustrated in Figure 1c, the eastern panel lies directly beneath the open-pit excavation, representing the primary area affected by the isolation layer. In contrast, the western panel maintains a separation thickness exceeding 50 m from surface workings, ensuring negligible stability impacts. This study therefore focuses on optimizing mining sequences for orebody exploitation at the −150 m level beneath the backfill isolation layer in the eastern panel.

2.2. Numerical Simulation Method

2.2.1. Model Construction

The model scope was determined based on the research scope and current open-pit and underground mining conditions, with coordinate ranges of X = 74,200–75,600 m, Y = 20,200–21,600 m, and Z > −300 m. In the numerical model, the X-direction aligns with the orebody dip, the Y-direction follows the orebody strike, and the Z-direction represents elevation. Based on the exploration line profile, a three-dimensional model of the original orebody and the faults in the mining area was established using the profile mapping method. Considering the current situation of the open-pit mine, the orebody model was optimized by cutting off the orebodies for open-pit mining and the corner orebodies to reduce the computational load of the subsequent numerical simulation. According to the current situation map of underground filling and the data collected from on-site field investigations, a mining site model for the eastern zone of the open-pit mine directly below the actual mining area and the −150 m middle section was established. The optimized orebody model, mining site model, and fault model are shown in Figure 2a–c, respectively. The overall three-dimensional model of the mining area was finally integrated and is shown in Figure 3.
FLAC3D software was employed to discretize the model using hexahedral-dominated hybrid elements, generating a total of 18,828 nodes and 96,277 elements. The stope areas (including stopes and pillars) were refined to mesh sizes of 2–5 m, while the surrounding rock areas adopted mesh sizes of 10–20 m. The coordinate origin (0, 0, 0) in the numerical model corresponds to the real-world coordinates (74,200, 20,200, −300). The open-pit model was constructed according to current excavation conditions, while the orebody and fault models were developed based on exploration line cross-sections and planar maps, omitting minor faults and small orebodies with negligible impacts on simulation results. The stope and pillar configurations were established according to actual layout plans. The complete FLAC3D model of the mining area is shown in Figure 4a, and the FLAC3D model of stopes and pillars at the −150 m level is presented in Figure 4b.

2.2.2. Constitutive Model Selection

The orebody, surrounding rock, and backfill within the study scope are elastoplastic materials conforming to the Mohr–Coulomb failure criterion [16,17], expressed as
f s = σ 1 σ 3 1 + sin φ 1 sin φ 2 C 1 + sin φ 1 sin φ
where fs is the failure coefficient; σ1 is the maximum principal stress (MPa); σ3 is the minimum principal stress (MPa); c is cohesion (MPa); and φ is the friction angle (°). Shear failure occurs when fs > 0, indicating plastic flow, while fs ≤ 0 corresponds to elastic deformation. Under tensile stress conditions, if the tensile stress exceeds the material’s tensile strength, the material will undergo tensile failure.

2.2.3. Material Parameter Selection

The hanging wall primarily consists of limestone, while the footwall is dominated by migmatite. The orebody’s physical–mechanical properties vary significantly depending on ore types and geological conditions. For simplification, rock masses were categorized into limestone, migmatite, and ore. Mechanical parameters were determined by synthesizing multi-source data, calibrated using Roclab 5.0 software from Canada to incorporate joint fractures, weathering, groundwater effects, rock mass classification indices, and geological strength indicators, thereby obtaining engineering rock mass parameters [18].
The parameters of the backfill are determined based on the mine’s two-step subsequent filling process: In the first step, the goafs are filled with cemented backfill (with a cement-to-sand ratio ranging from 1:4 to 1:10). In the second step, the bottom 8 m of the voids are filled with cemented backfill (cement-to-sand ratio of 1:4), while the portion above 8 m is filled with waste rock and a water–sand mixture, with the top of the goafs sealed using cemented backfill (cement-to-sand ratio of 1:10). The mass concentration of the backfill material is maintained between 68% and 72%. Samples are taken at the filling station, demolded, and then cured underground for 28 days. The summarized mechanical parameters of the final rock and backfill are presented in Table 1.

2.2.4. Numeric Simulation Scheme

The underground mine employs a two-step sublevel open stoping method, with mining sequences categorized into pillar extraction sequences and stope extraction sequences. Four mining sequences were evaluated: ① south-to-north, ② north-to-south, ③ center-to-flank, and ④ flank-to-center. Optimization was first conducted for pillar mining sequences, followed by stope sequence optimization, ultimately determining rational extraction sequences for both pillars and stopes.
Based on the number of isolation layers and the quantity of slope steps, twenty-three monitoring points were established in critical zones of the slope and isolation layer to track settlement displacement, horizontal displacement, compressive stress, and tensile stress variations (locations shown in Figure 1c). Monitoring points ID8–ID17 were positioned within the backfill isolation layer, with the remaining points distributed across the slope. The layout captures potential failure modes (e.g., tensile cracks at slope toes, shear zones in fill).

3. Numerical Simulation Analysis

3.1. Optimization Analysis of Pillar Mining Sequence

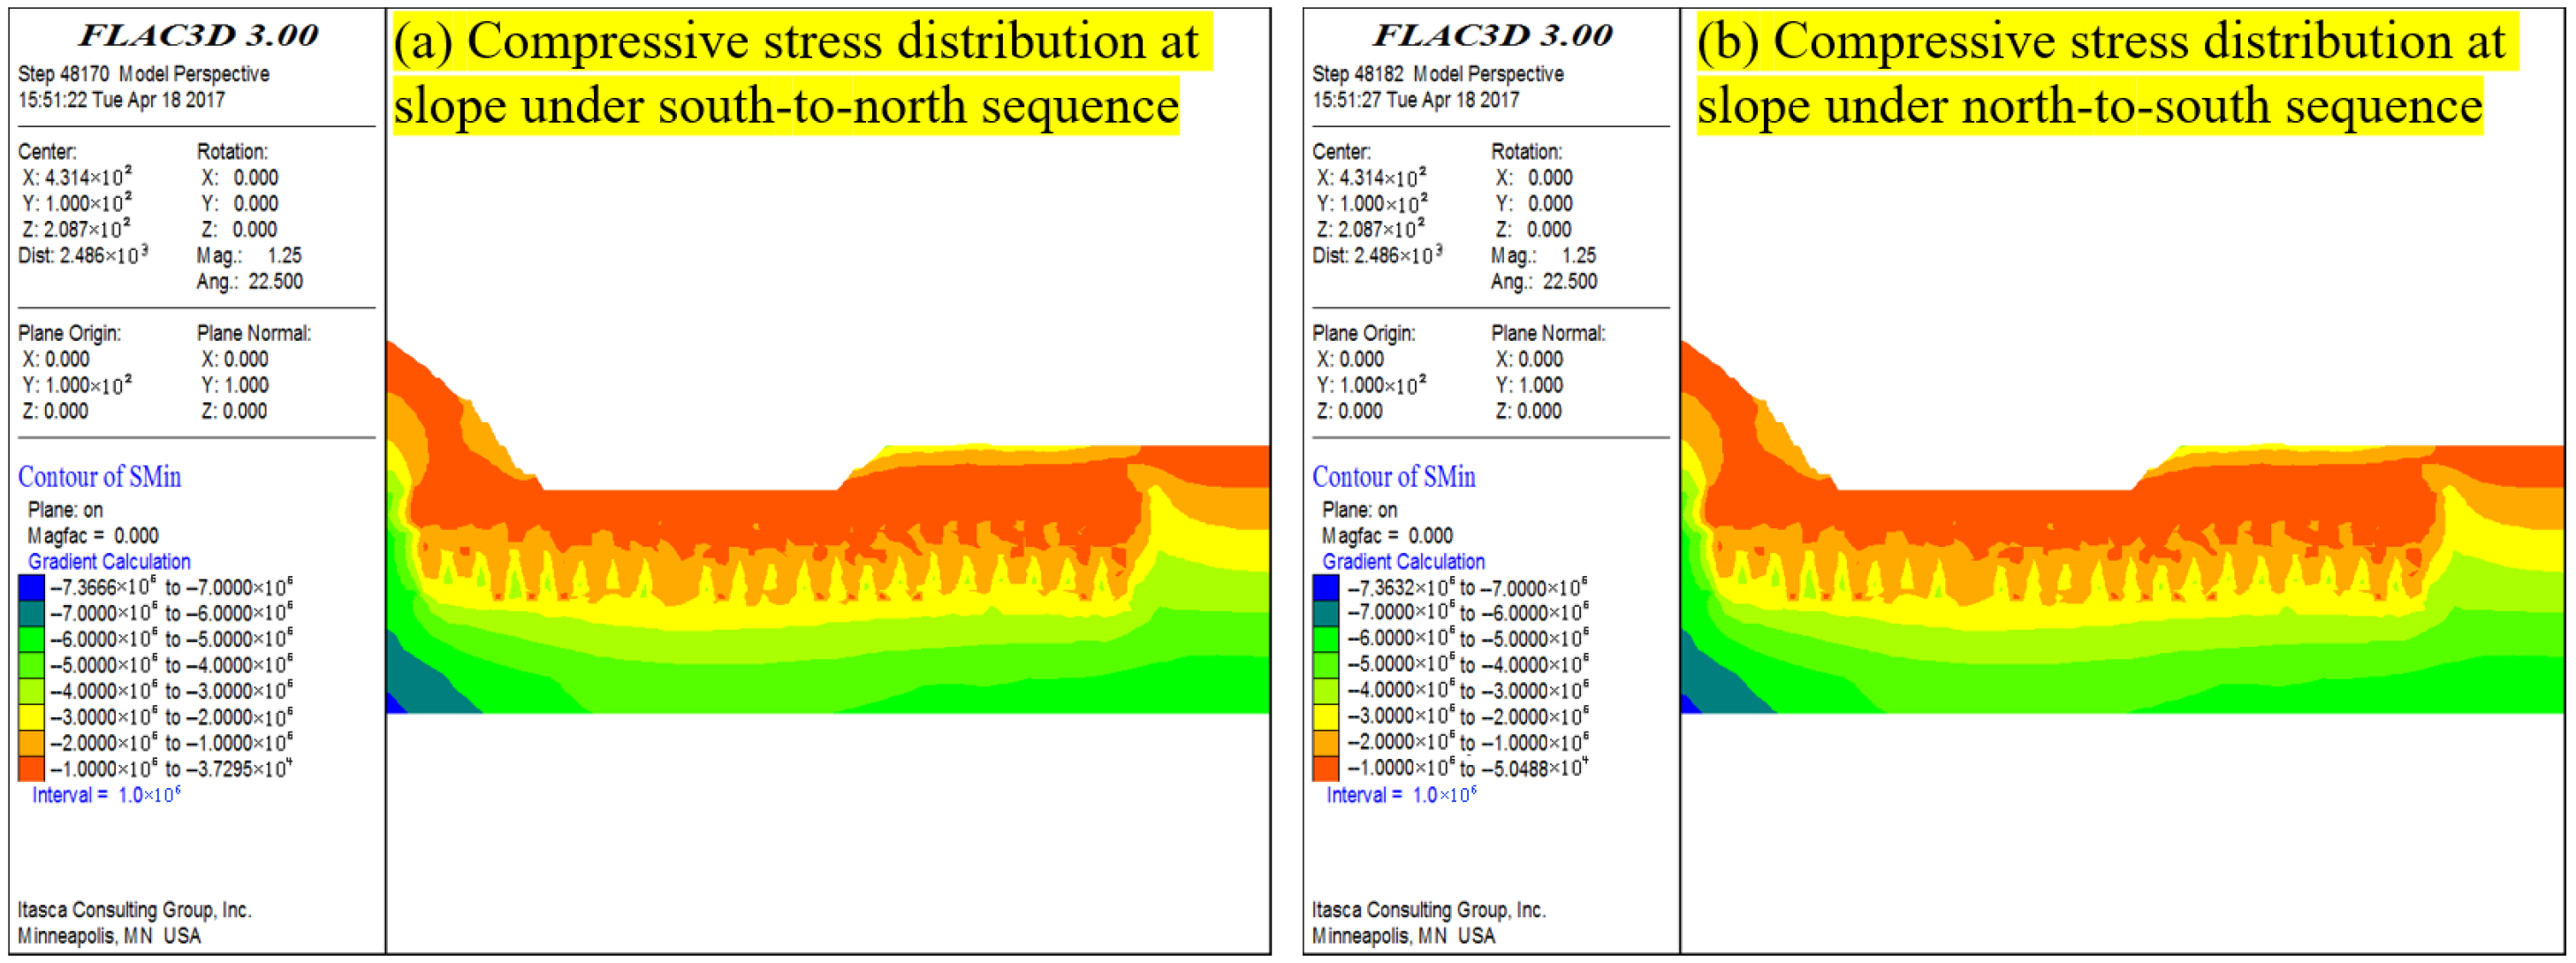
3.1.1. Compressive Stress Distribution

The compressive stress evolution varies significantly under four pillar mining sequences: south-to-north, north-to-south, center-to-flank, and flank-to-center. Figure 5 presents the compressive stress nephograms post-pillar mining. All schemes demonstrate compressive stresses within 0.04–2 MPa in the open-pit slope and backfill isolation layer, with no stress concentration observed. The stress redistribution influence zones remain consistent across schemes, confirming stable isolation layer and slope conditions.

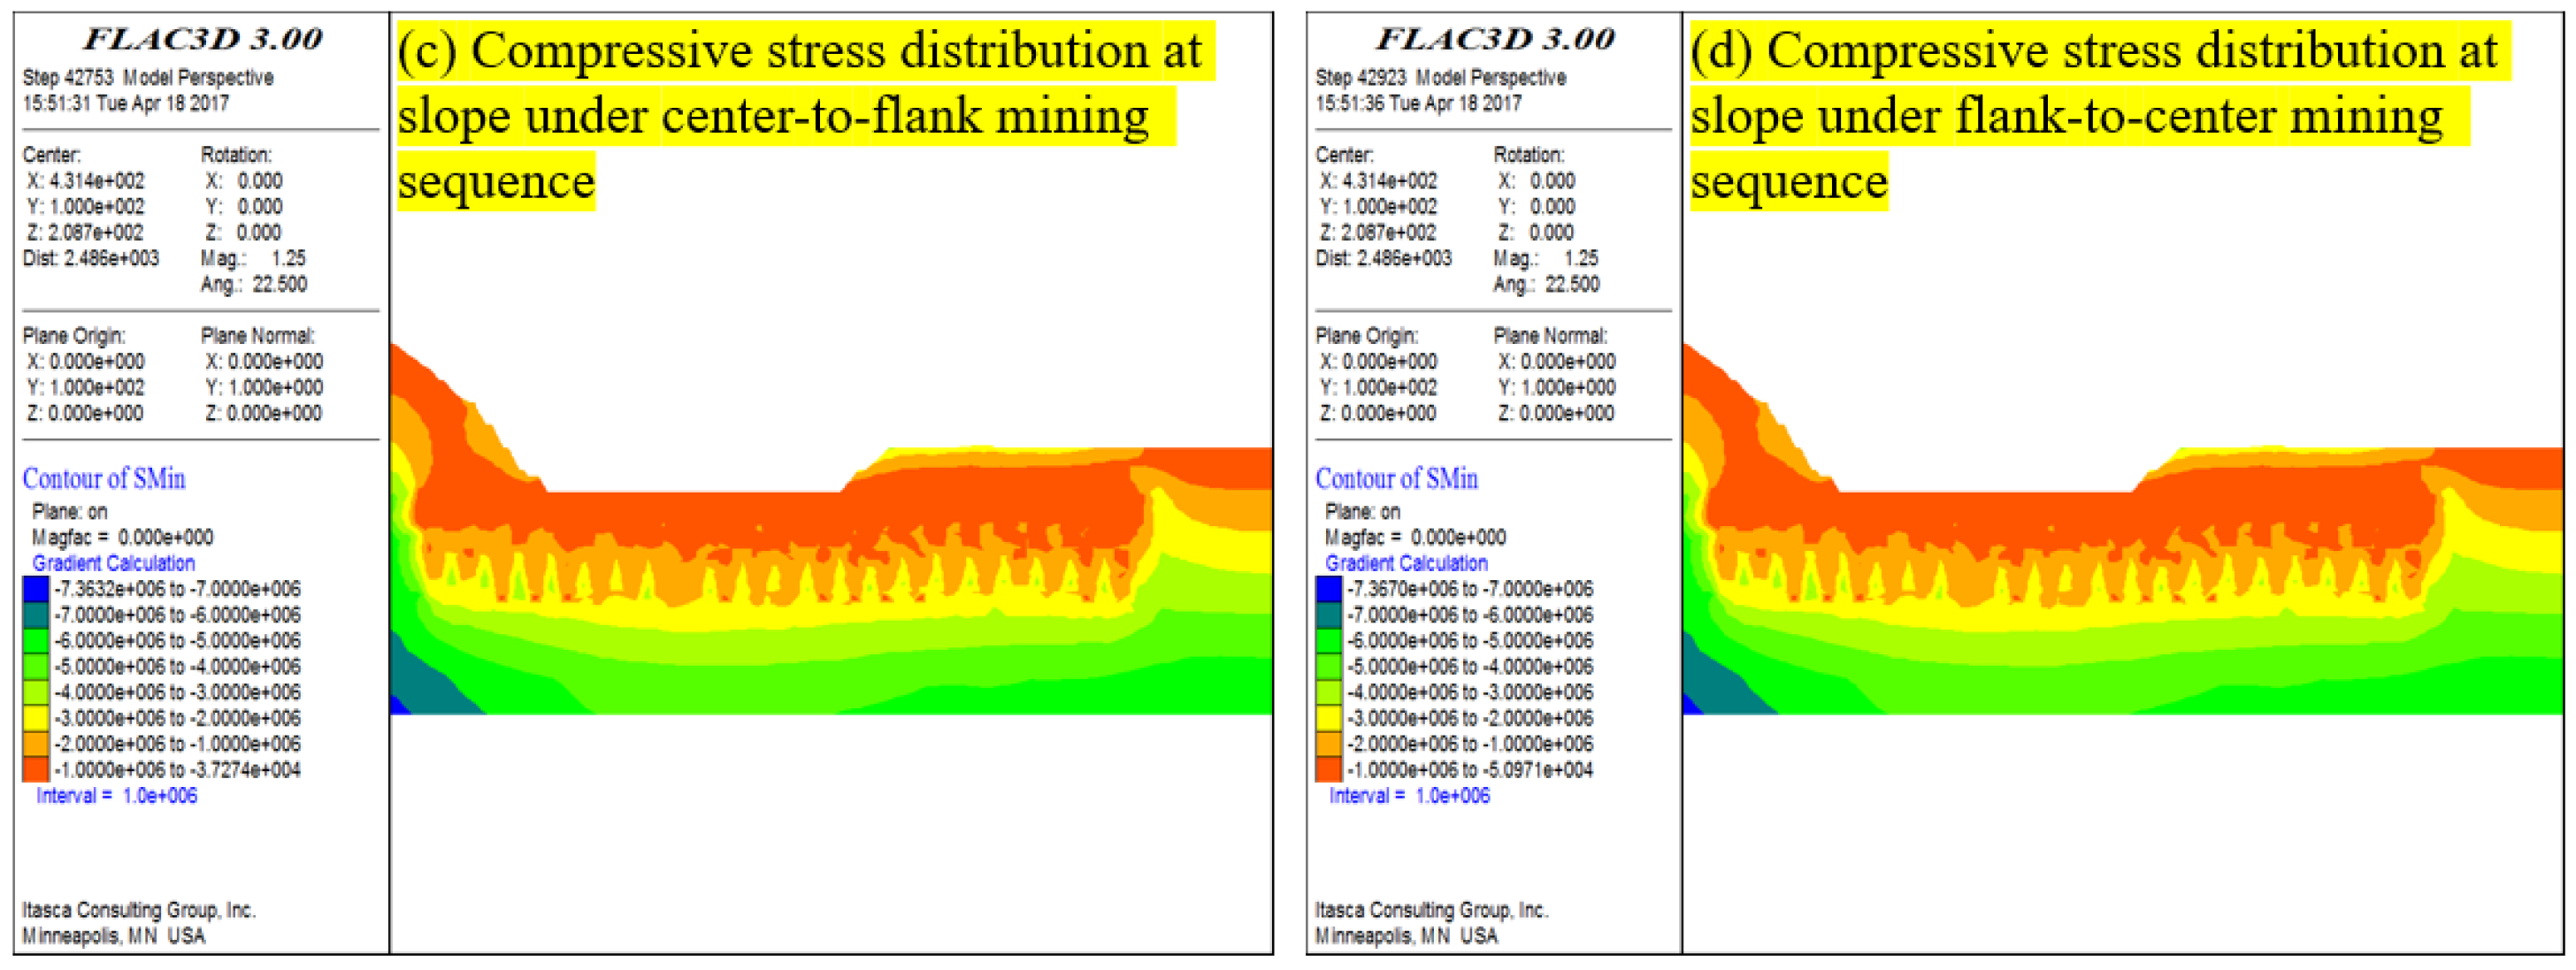
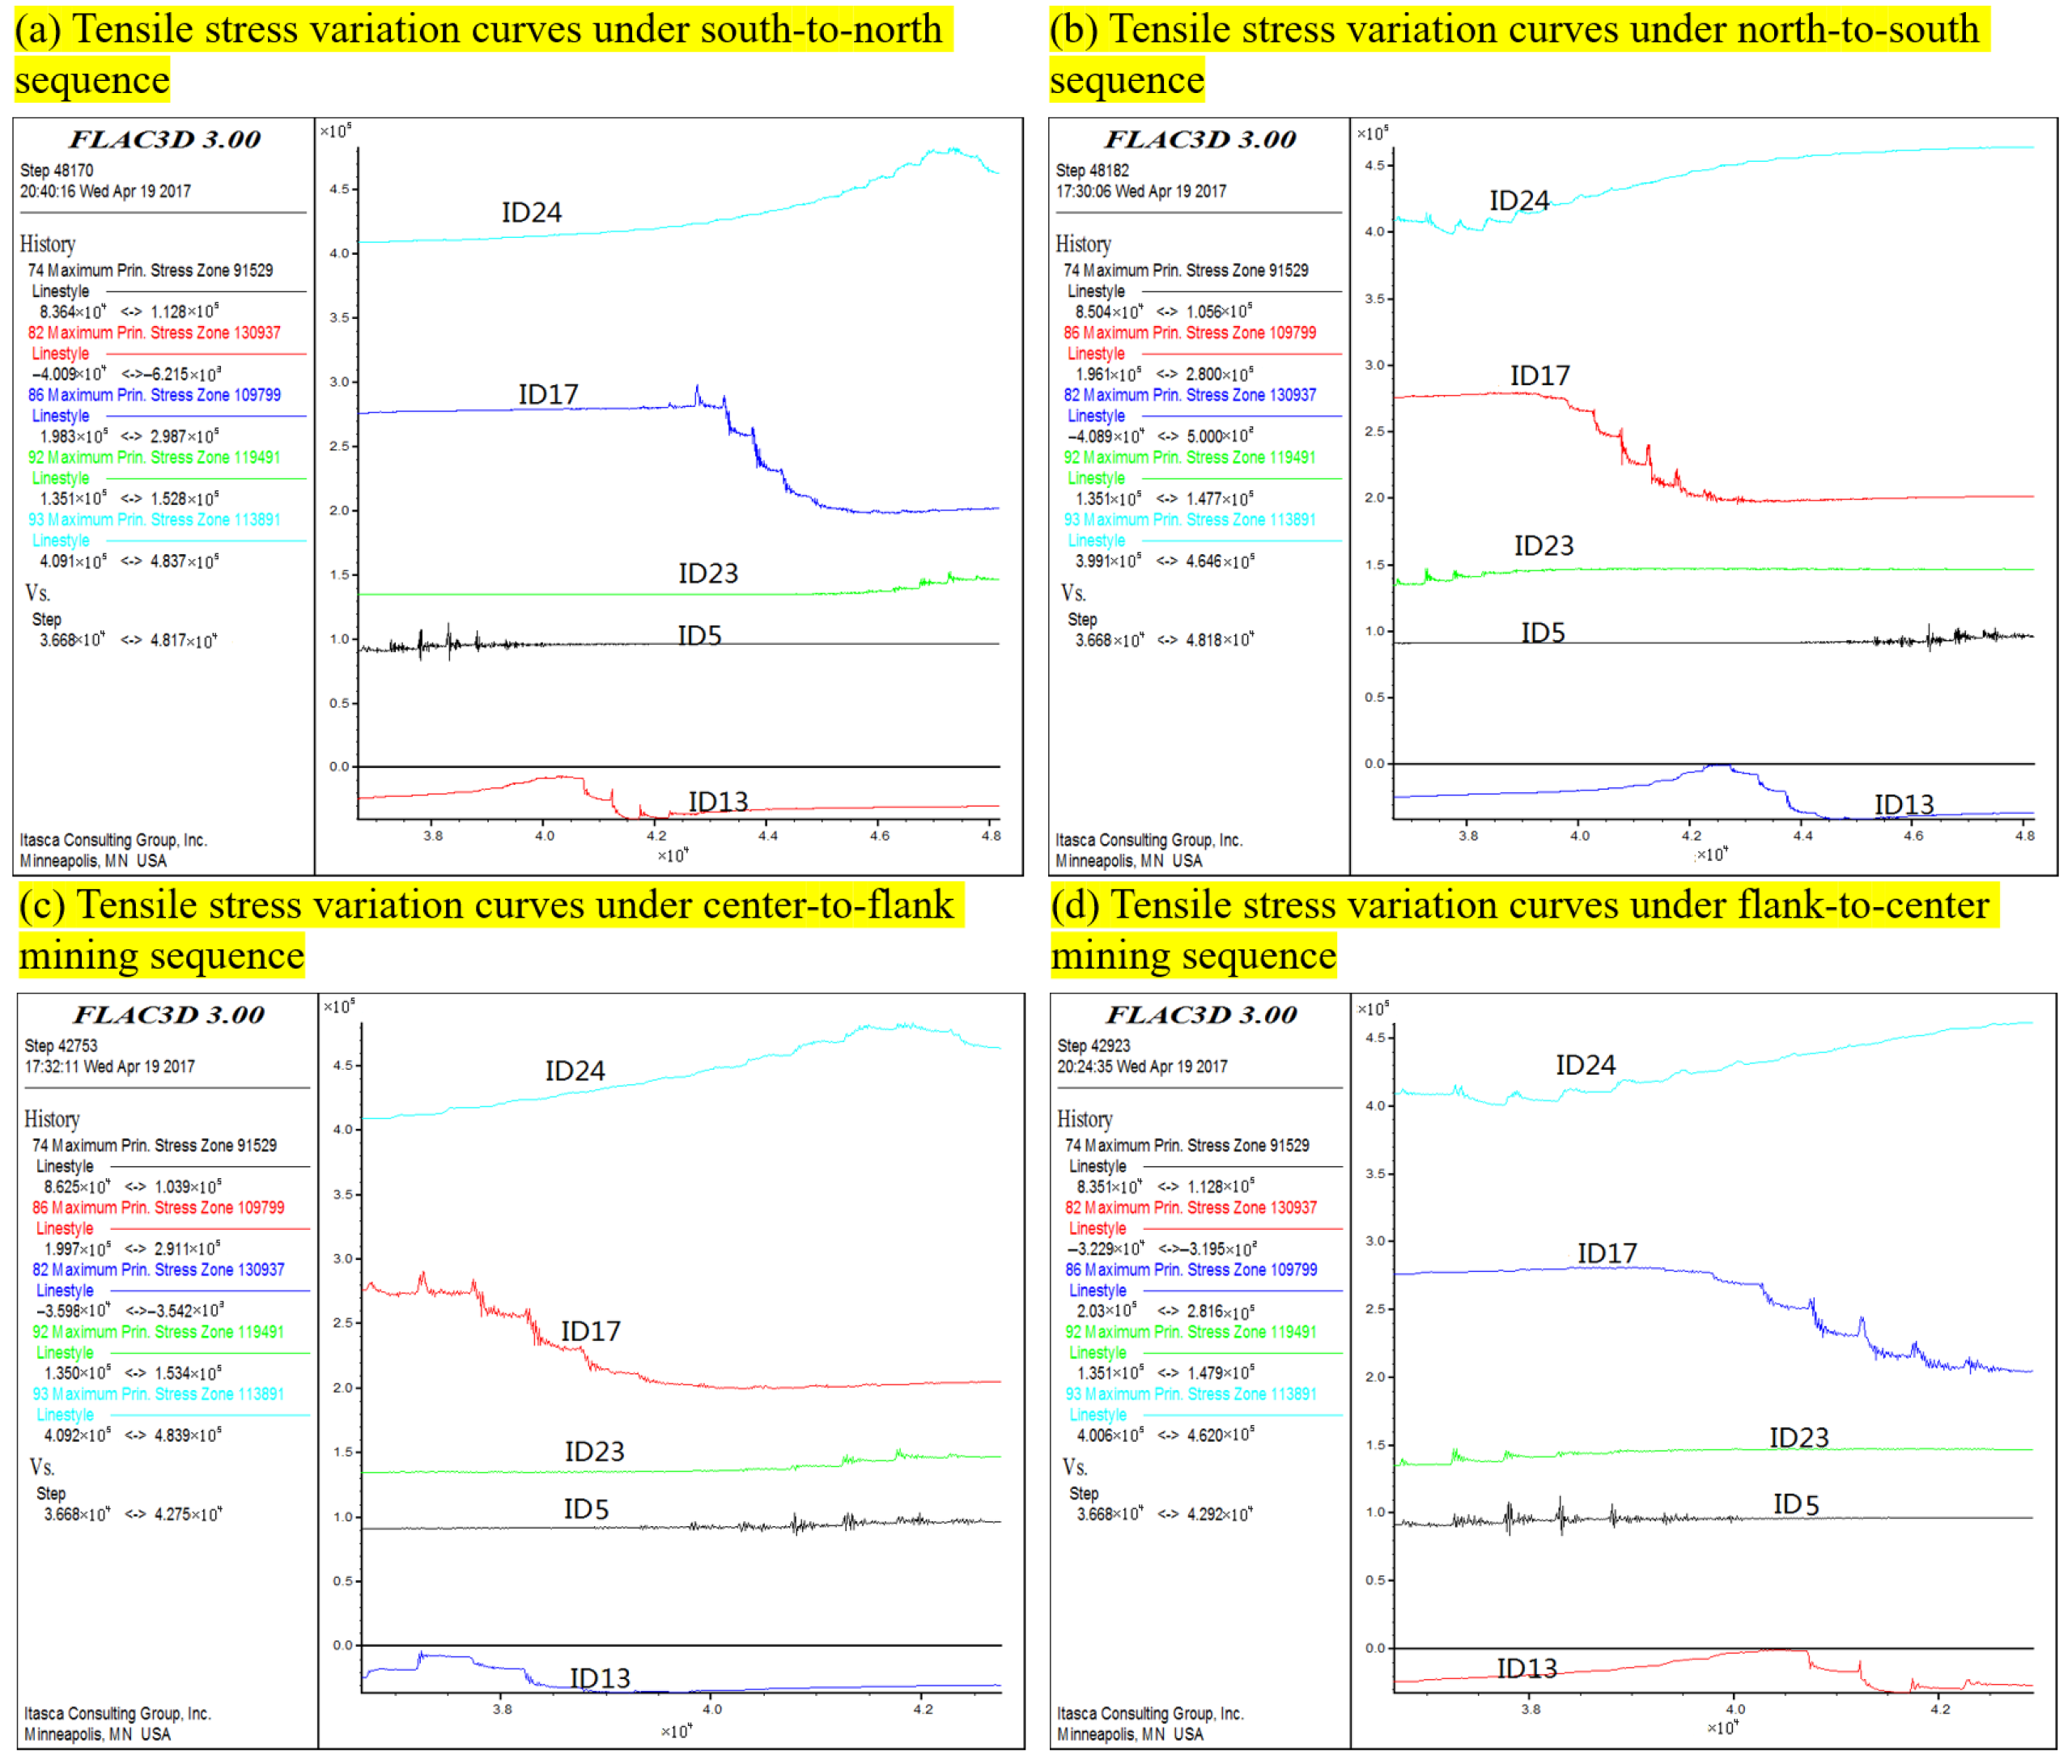
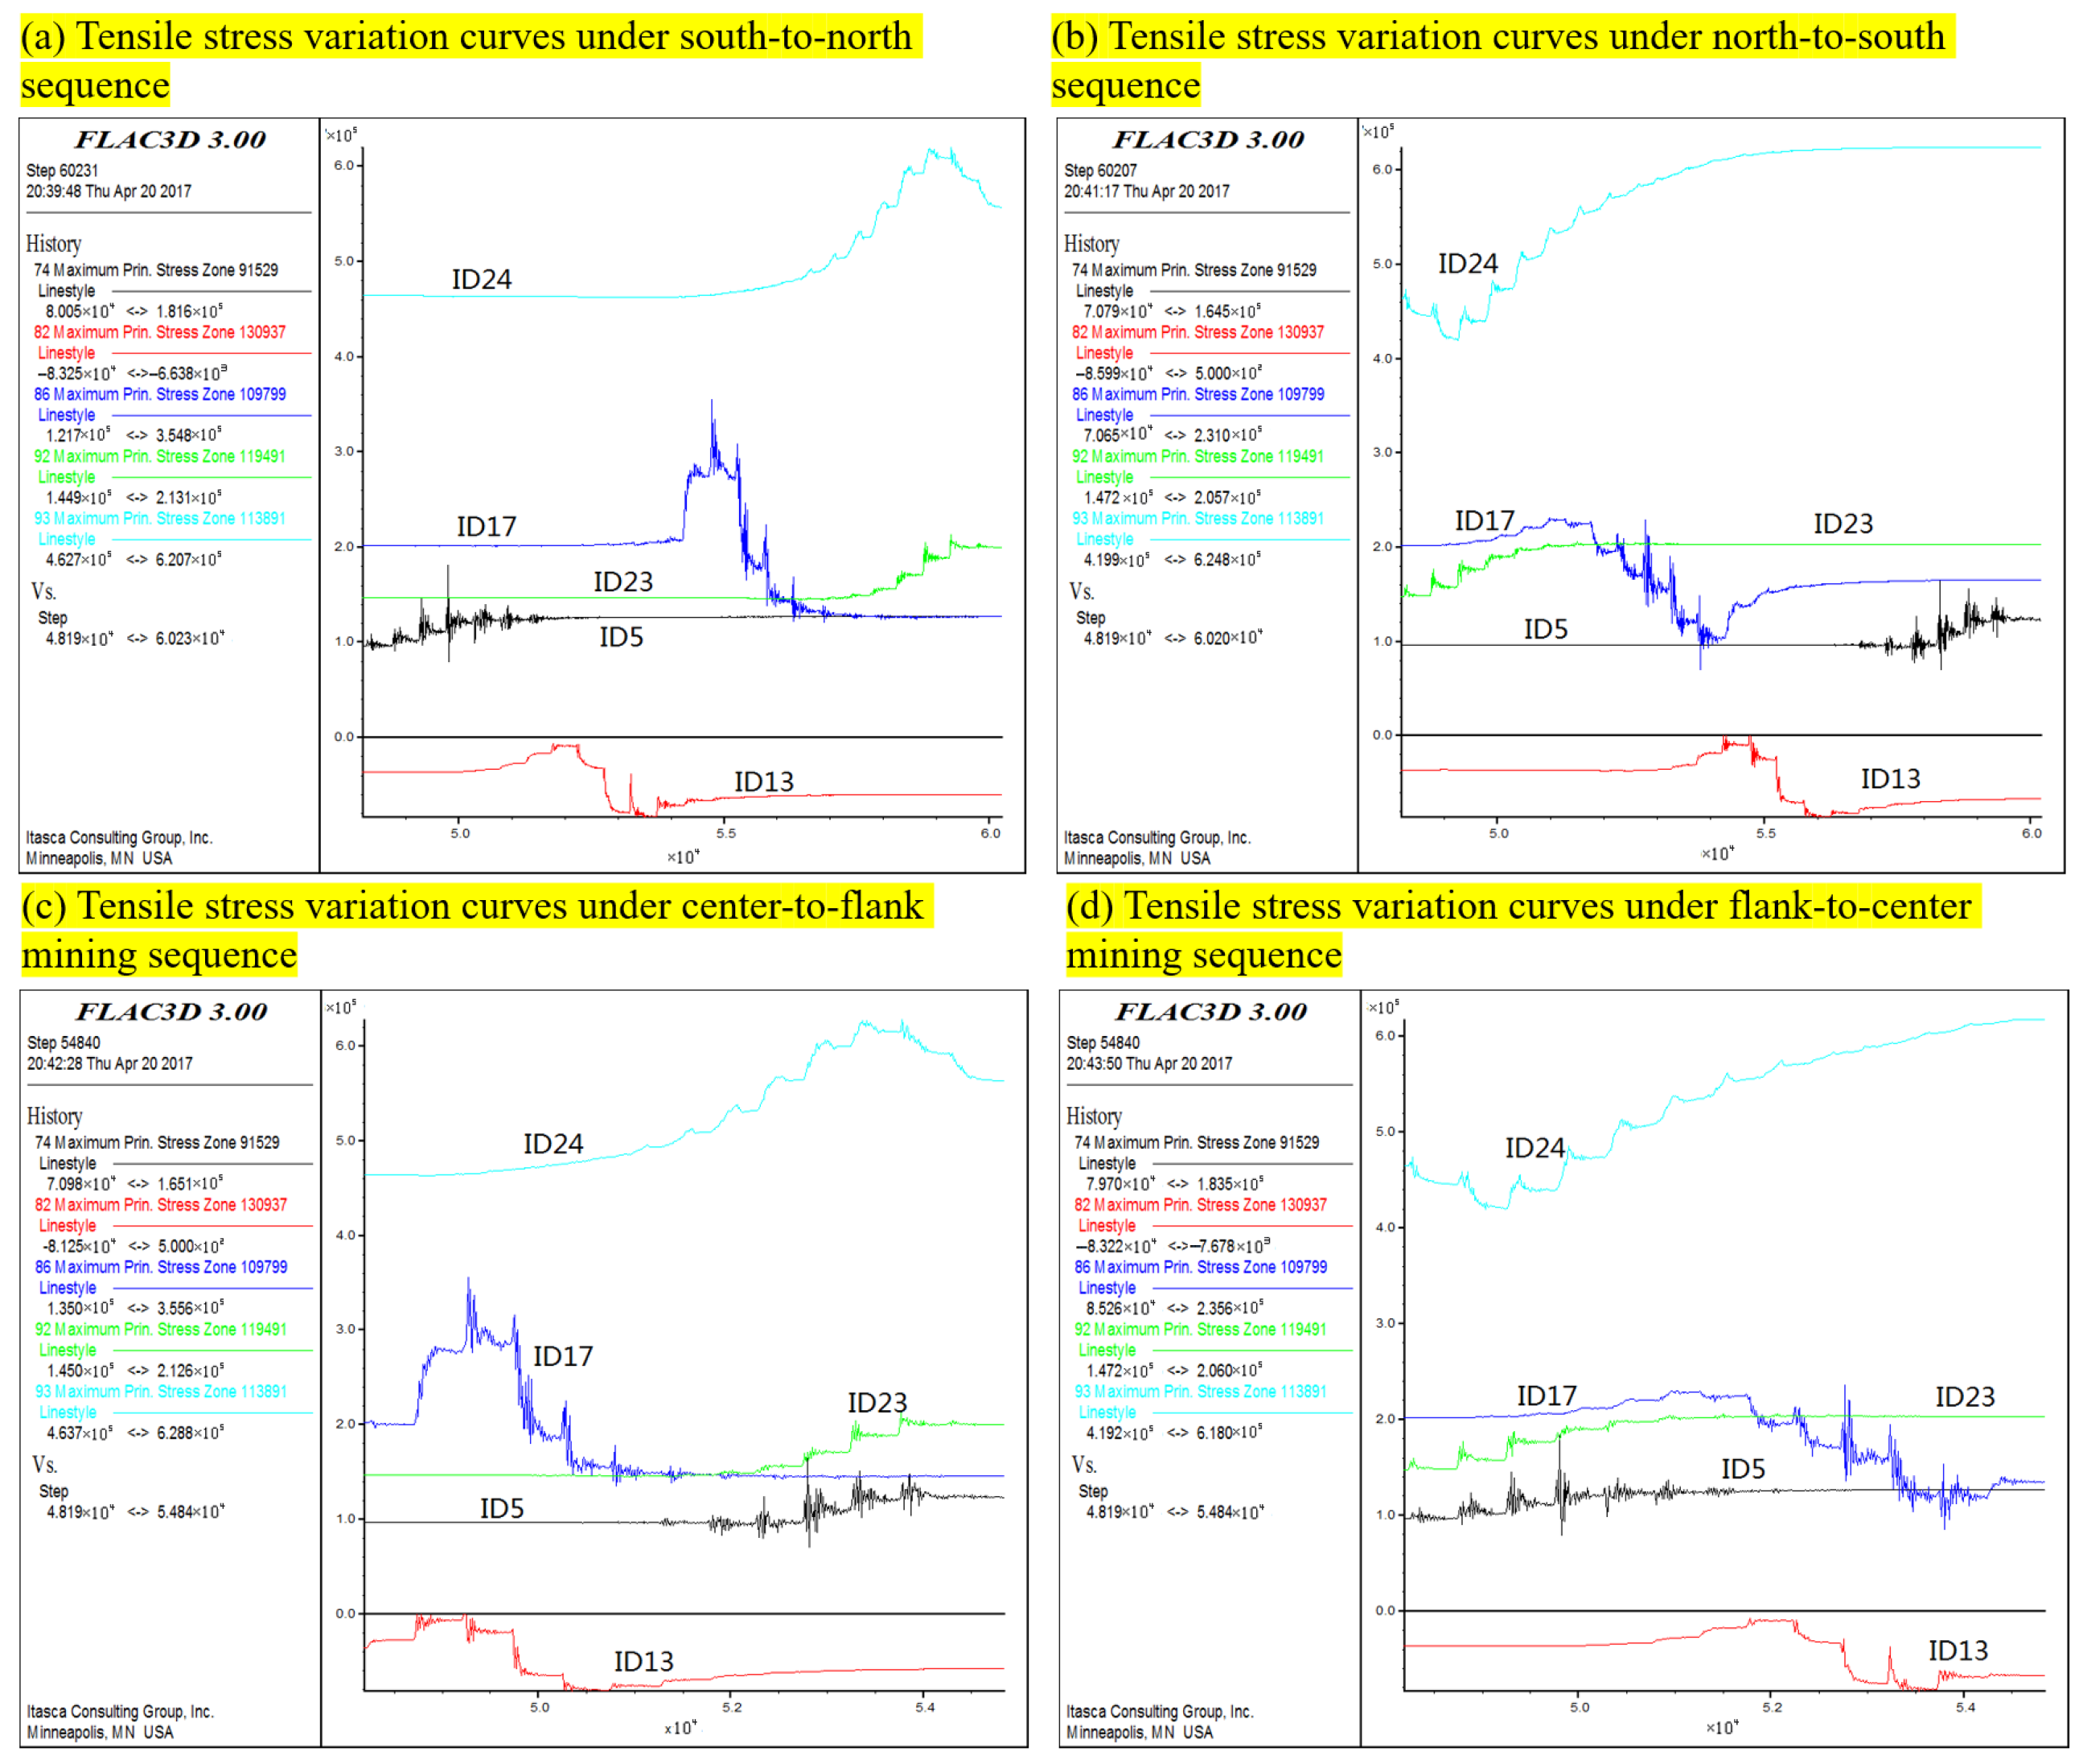
3.1.2. Tensile Stress Distribution

Figure 6 shows tensile stress nephograms after pillar mining. Tensile stresses occur only partially at monitoring points, primarily localized on the two lowest benches of the open-pit slope, with magnitudes of 0.44 MPa, 0.45 MPa, 0.47 MPa, and 0.44 MPa for the four schemes, respectively.
Tensile stress constitutes a critical factor inducing rock mass failure. The tensile stress evolution in the slope and isolation layer was analyzed through monitored data. Figure 7 illustrates tensile stress variations at slope monitoring points (ID5, ID23, ID24) and isolation layer points (ID13, ID17) across all sequences. Tensile stresses (0.05–0.50 MPa) were observed at slope points ID5, ID23, and ID24 and isolation layer point ID17 in all mining sequences.
Reliance on individual monitoring points proves insufficient for rational assessment of mining sequence performance. Statistical analysis revealed tensile stresses at monitoring points ID3, ID5, ID17, ID22, ID23, and ID24, with all except ID17 located on the slope. Table 2 summarizes the tensile stress values at critical monitoring points following pillar mining under different sequences. The results indicate that the center-to-flank scheme generated the highest cumulative tensile stress (1.684 MPa), while the north-to-south sequence produced the lowest (1.388 MPa). The maximum tensile stress occurred at point ID24 in all sequences. These findings demonstrate that mining sequence significantly affects tensile stress distributions, particularly at slope toe and isolation layer edges [19,20].
To quantitatively assess the risk of tensile failure during pillar extraction, the peak tensile stresses at the monitoring points were compared to the measured tensile strength of limestone. The maximum tensile stress recorded during pillar mining occurred at point ID24, with a value of 0.629 MPa under the center-to-flank mining sequence, corresponding to 41.7% of the limestone tensile strength. At point ID17 within the backfill isolation layer, the highest tensile stress was 0.378 MPa, approximately 25.0% of the tensile strength. Across all evaluated mining sequences, tensile stresses at monitoring points remained well below the 80% tensile strength threshold, indicating a low probability of immediate tensile failure.
Cumulative tensile stresses across the four sequences measured 1.503 MPa, 1.388 MPa, 1.684 MPa, and 1.524 MPa, respectively. The ranking by total tensile stress magnitude yields is as follows: center-to-flank > flank-to-center > south-to-north > north-to-south. Thus, the north-to-south sequence emerges as optimal based on tensile stress minimization.

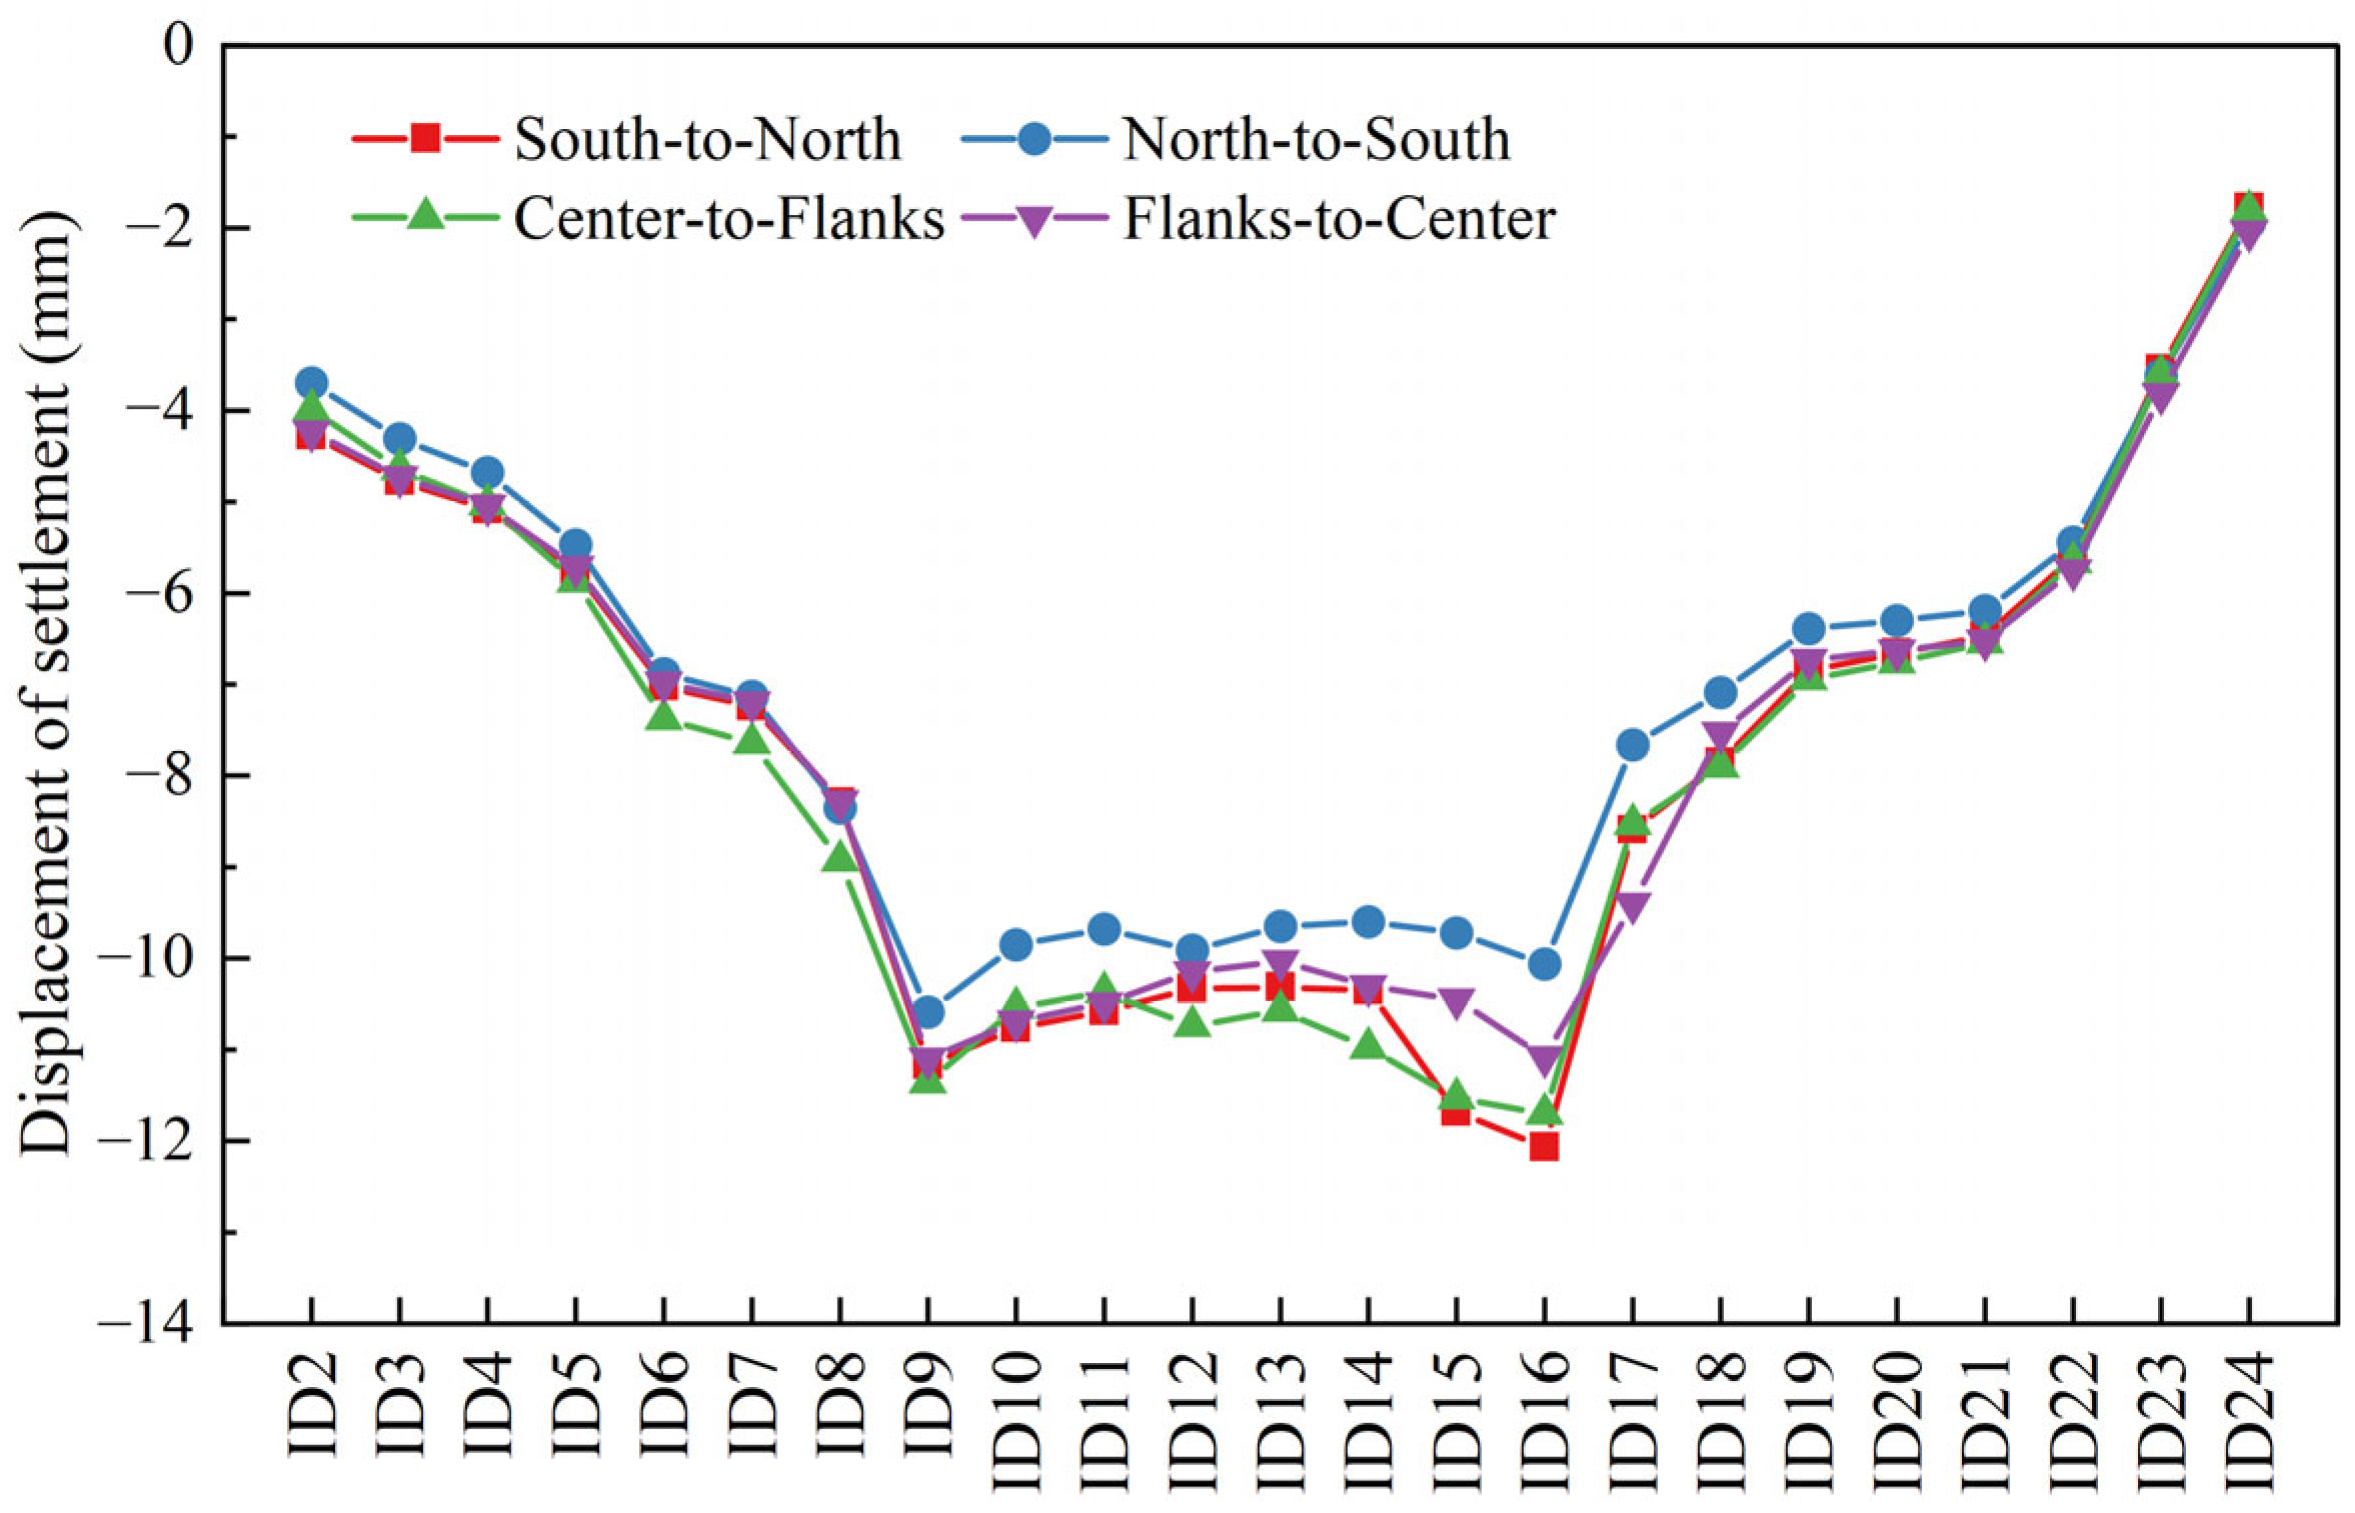
3.1.3. Displacement Response

Figure 8 presents settlement displacement nephograms post-pillar mining. Mining sequences differentially influence the surrounding rock, backfill isolation layer, and slope in terms of impact magnitude and spatial extent. In terms of influence range, the south-to-north and flank-to-center mining sequences result in a broader affected area compared to the other two schemes. However, regarding the severity of the impact, these same sequences cause less disturbance.
Different mining sequences exert different effects on the open-pit slope and the backfill isolation layer. By monitoring displacement variations during the mining process, it is possible to assess whether abrupt changes have occurred in the slope or the isolation layer, thereby evaluating their stability. Figure 9 illustrates the settlement displacement curves for four monitoring points—ID7 and ID18 located on the slope, and ID10 and ID15 on the backfill isolation layer. The results show that no sudden displacement changes occurred at these points. Instead, settlement displacement gradually increased as pillar mining progressed. Maximum settlement displacements were less than 2 mm on the slope and less than 3 mm on the isolation layer, indicating stable conditions throughout the process.
Moreover, a comparative analysis of displacement evolution among the four mining sequences indicated that the south-to-north and flank-to-center schemes resulted in relatively larger cumulative settlement displacements in both the slope and the isolation layer, especially in the mid-to-late stages of pillar extraction. In contrast, the north-to-south sequence consistently produced the lowest cumulative settlement values at all monitoring points throughout the mining process. The center-to-flank sequence exhibited intermediate displacement magnitudes. These comparative results demonstrate that the north-to-south sequence not only minimized total deformation but also maintained a stable displacement accumulation rate, thereby providing the best overall ground stability control during pillar extraction.
Monitoring point settlement displacement statistics are summarized in Table 3, with corresponding displacement curves illustrated in Figure 10. The results show that settlement displacements within the backfill isolation layer (ID8–ID17) were notably larger than those at the open-pit slope, with maximum values reaching −3.16 mm at ID12 under the south-to-north sequence. Overall, the north-to-south mining sequence demonstrated the smallest displacements (45.22 mm) across most monitoring points, followed by the center-to-flank sequence (47.75 mm). Cumulative total settlement displacements across the four sequences ranked as follows: south-to-north > flank-to-center > center-to-flank > north-to-south.
Based on monitoring point data and cumulative deformation analysis, the north-to-south mining sequence is identified as the optimal extraction strategy. Integrating stress redistribution characteristics and displacement response patterns, the north-to-south mining sequence is recommended for pillar extraction to ensure stability of the open-pit slope, backfill isolation layer, and stopes.

3.2. Optimization Analysis of Stope Mining Sequence

Building upon the established “north-to-south” pillar extraction sequence, the stope mining sequence was further optimized. The stopes are flanked by Stage 1 cemented backfill with lower strength compared to the intact rock mass, resulting in more complex stress redistribution and displacement responses during extraction. Numerical simulations were conducted to compare four mining sequences—south-to-north, north-to-south, center-to-flank, and flank-to-center—revealing their impacts on the stability of the isolation layer and slope.

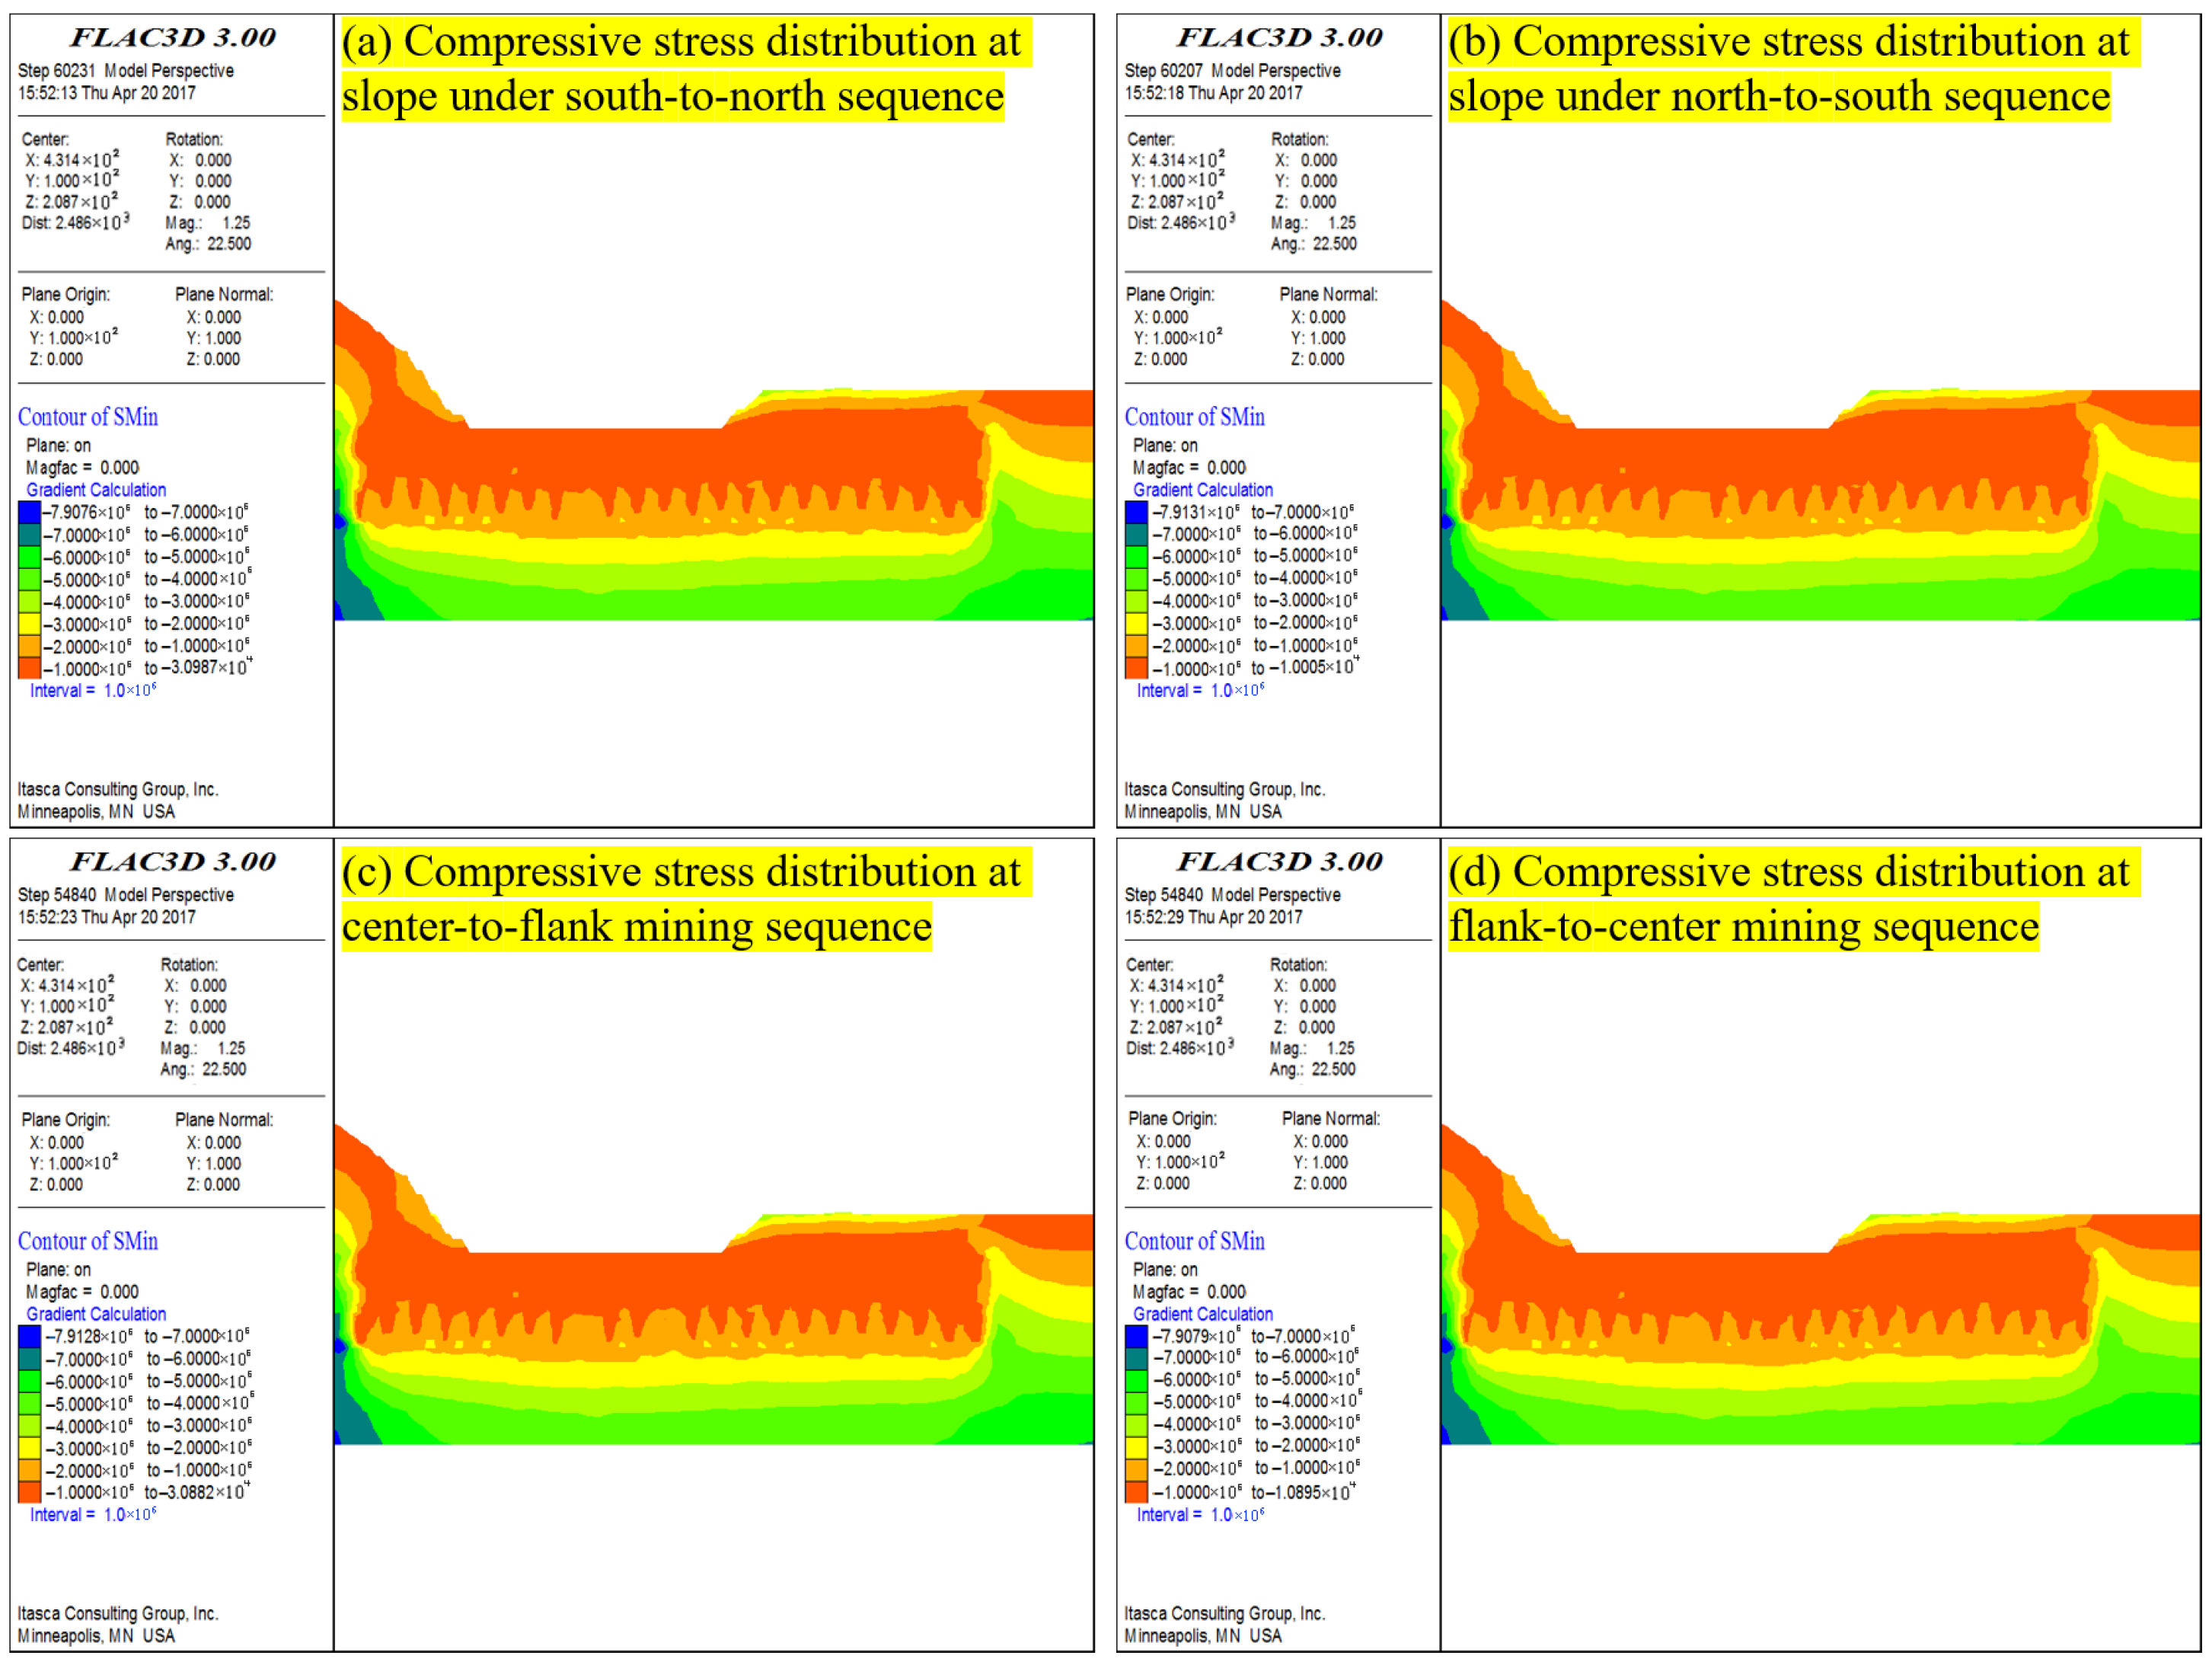
3.2.1. Compressive Stress Distribution

Following pillar extraction, the compressive stress distributions under four stope mining sequences (south-to-north, north-to-south, center-to-flank, and flank-to-center) are illustrated in Figure 11. Post-stope extraction, the stress redistribution zones expanded further. The compressive stress nephograms reveal no stress concentration in the open-pit slope or backfill isolation layer. The isolation layer primarily experienced gravitational stresses (0.04–2 MPa), which remained lower than those in the surrounding rock and insufficient to induce failure.

3.2.2. Tensile Stress Distribution

Figure 12 shows tensile stress cloud maps after stope mining. Tensile stresses emerged on the lowest benches of the open-pit slope, with magnitudes exceeding those observed during pillar extraction. In contrast, the backfill isolation layer remained predominantly under compressive loading.
Figure 13 presents tensile stress variation curves at monitoring points ID5, ID23, ID24, ID13, and ID17 during stope extraction. Tensile stresses increased across all four mining sequences at slope points ID5, ID23, and ID24 and isolation layer point ID17, with magnitudes varying by sequence.
Statistical analysis identified tensile stresses at monitoring points ID3, ID5, ID17, ID22, ID23, and ID24 (Table 4), with all except ID17 located on the slope. During stope extraction, tensile stress magnitudes exhibited a decreasing trend compared to pillar extraction [13]. ID24 recorded the highest tensile stresses (0.65–0.85 MPa), followed by ID17 (0.25–0.50 MPa), with other points ranging between 0.10 and 0.20 MPa. To quantitatively assess the tensile failure risk during stope extraction, the peak tensile stresses at these monitoring points were compared to the measured tensile strength of the limestone. The maximum tensile stress recorded during this stage occurred at point ID24, with a value of 0.818 MPa under the center-to-flank mining sequence, corresponding to 54.2% of the limestone tensile strength. The highest tensile stress within the backfill isolation layer appeared at point ID17, reaching 0.463 MPa under the same sequence, equivalent to 30.6% of the tensile strength. Throughout all mining sequences, tensile stresses at monitoring points remained below 80% of the limestone tensile strength, indicating a low immediate risk of tensile failure.
Cumulative tensile stresses across sequences ranked as follows: center-to-flank > south-to-north > flank-to-center > north-to-south. Consequently, the north-to-south mining sequence is identified as the optimal strategy based on tensile stress minimization.

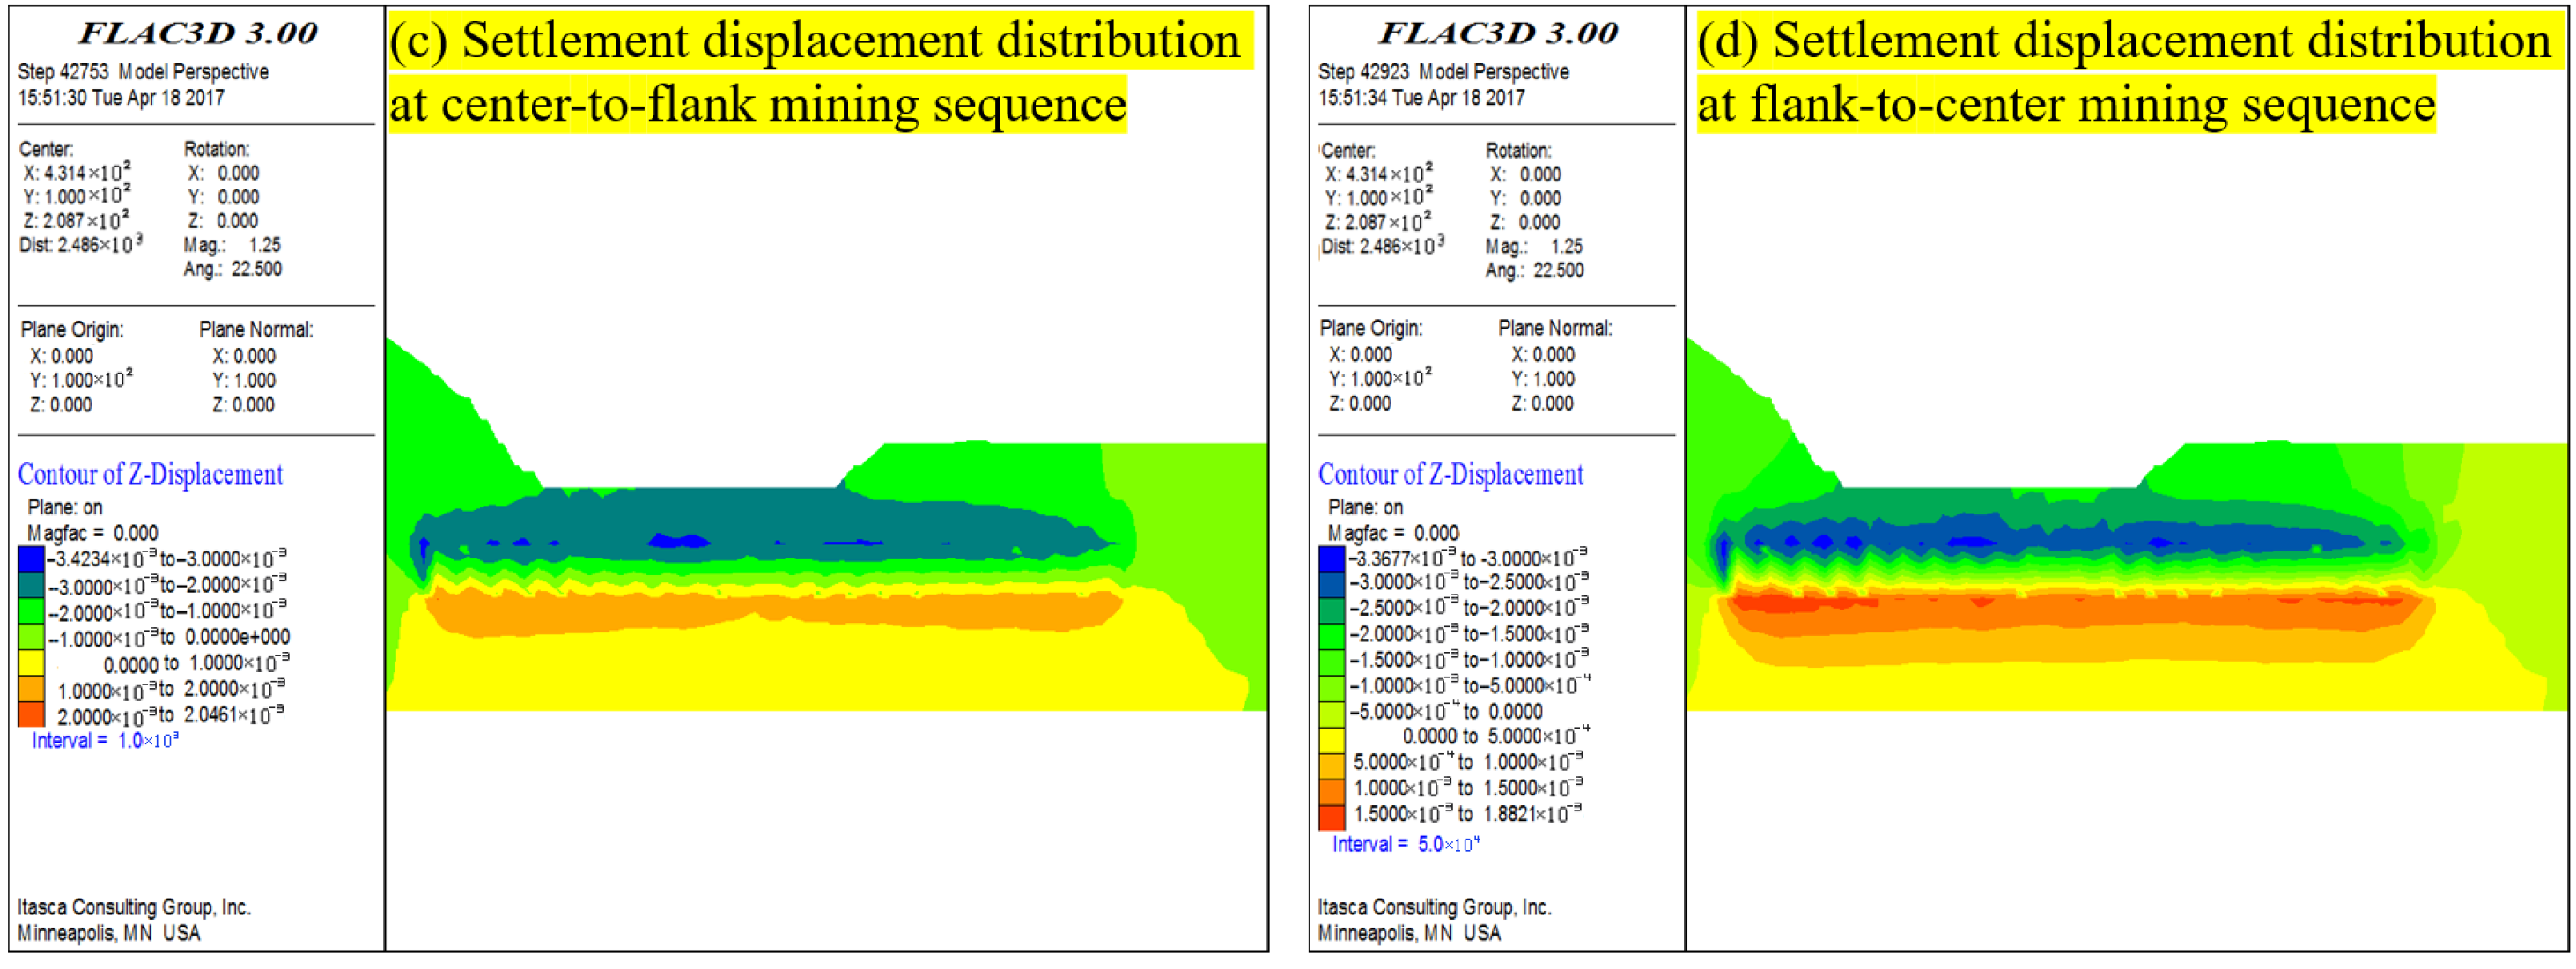
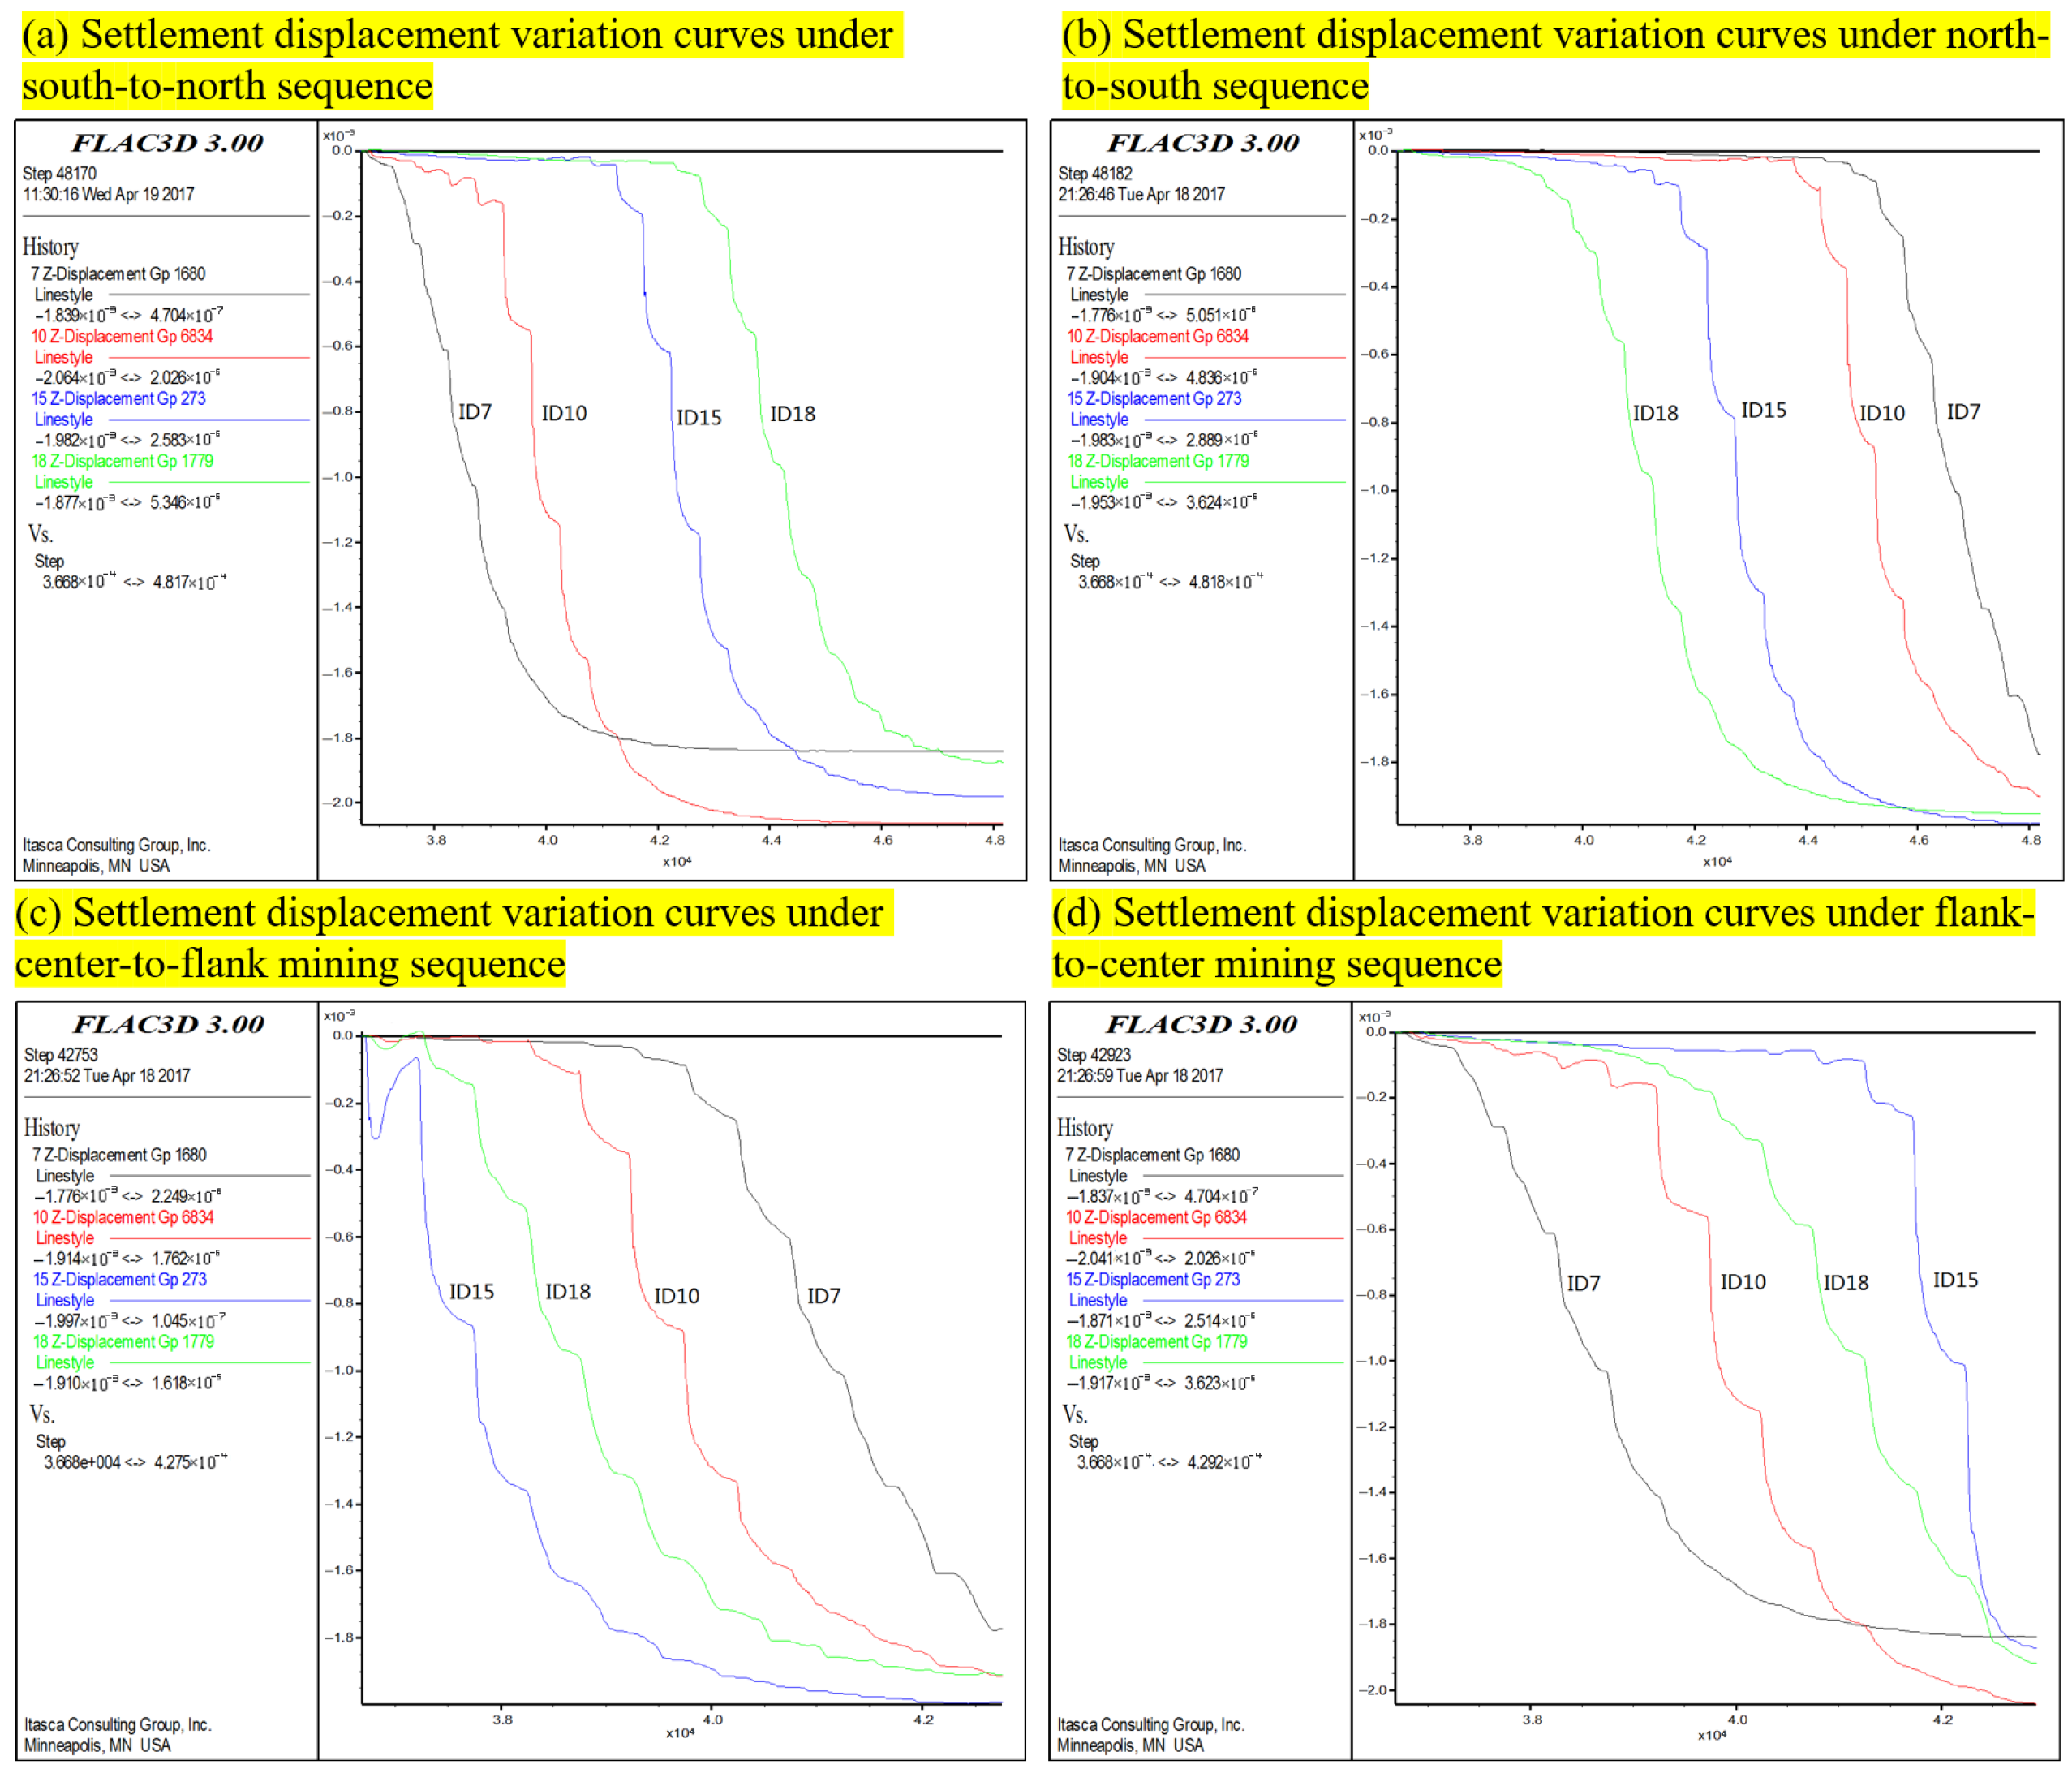
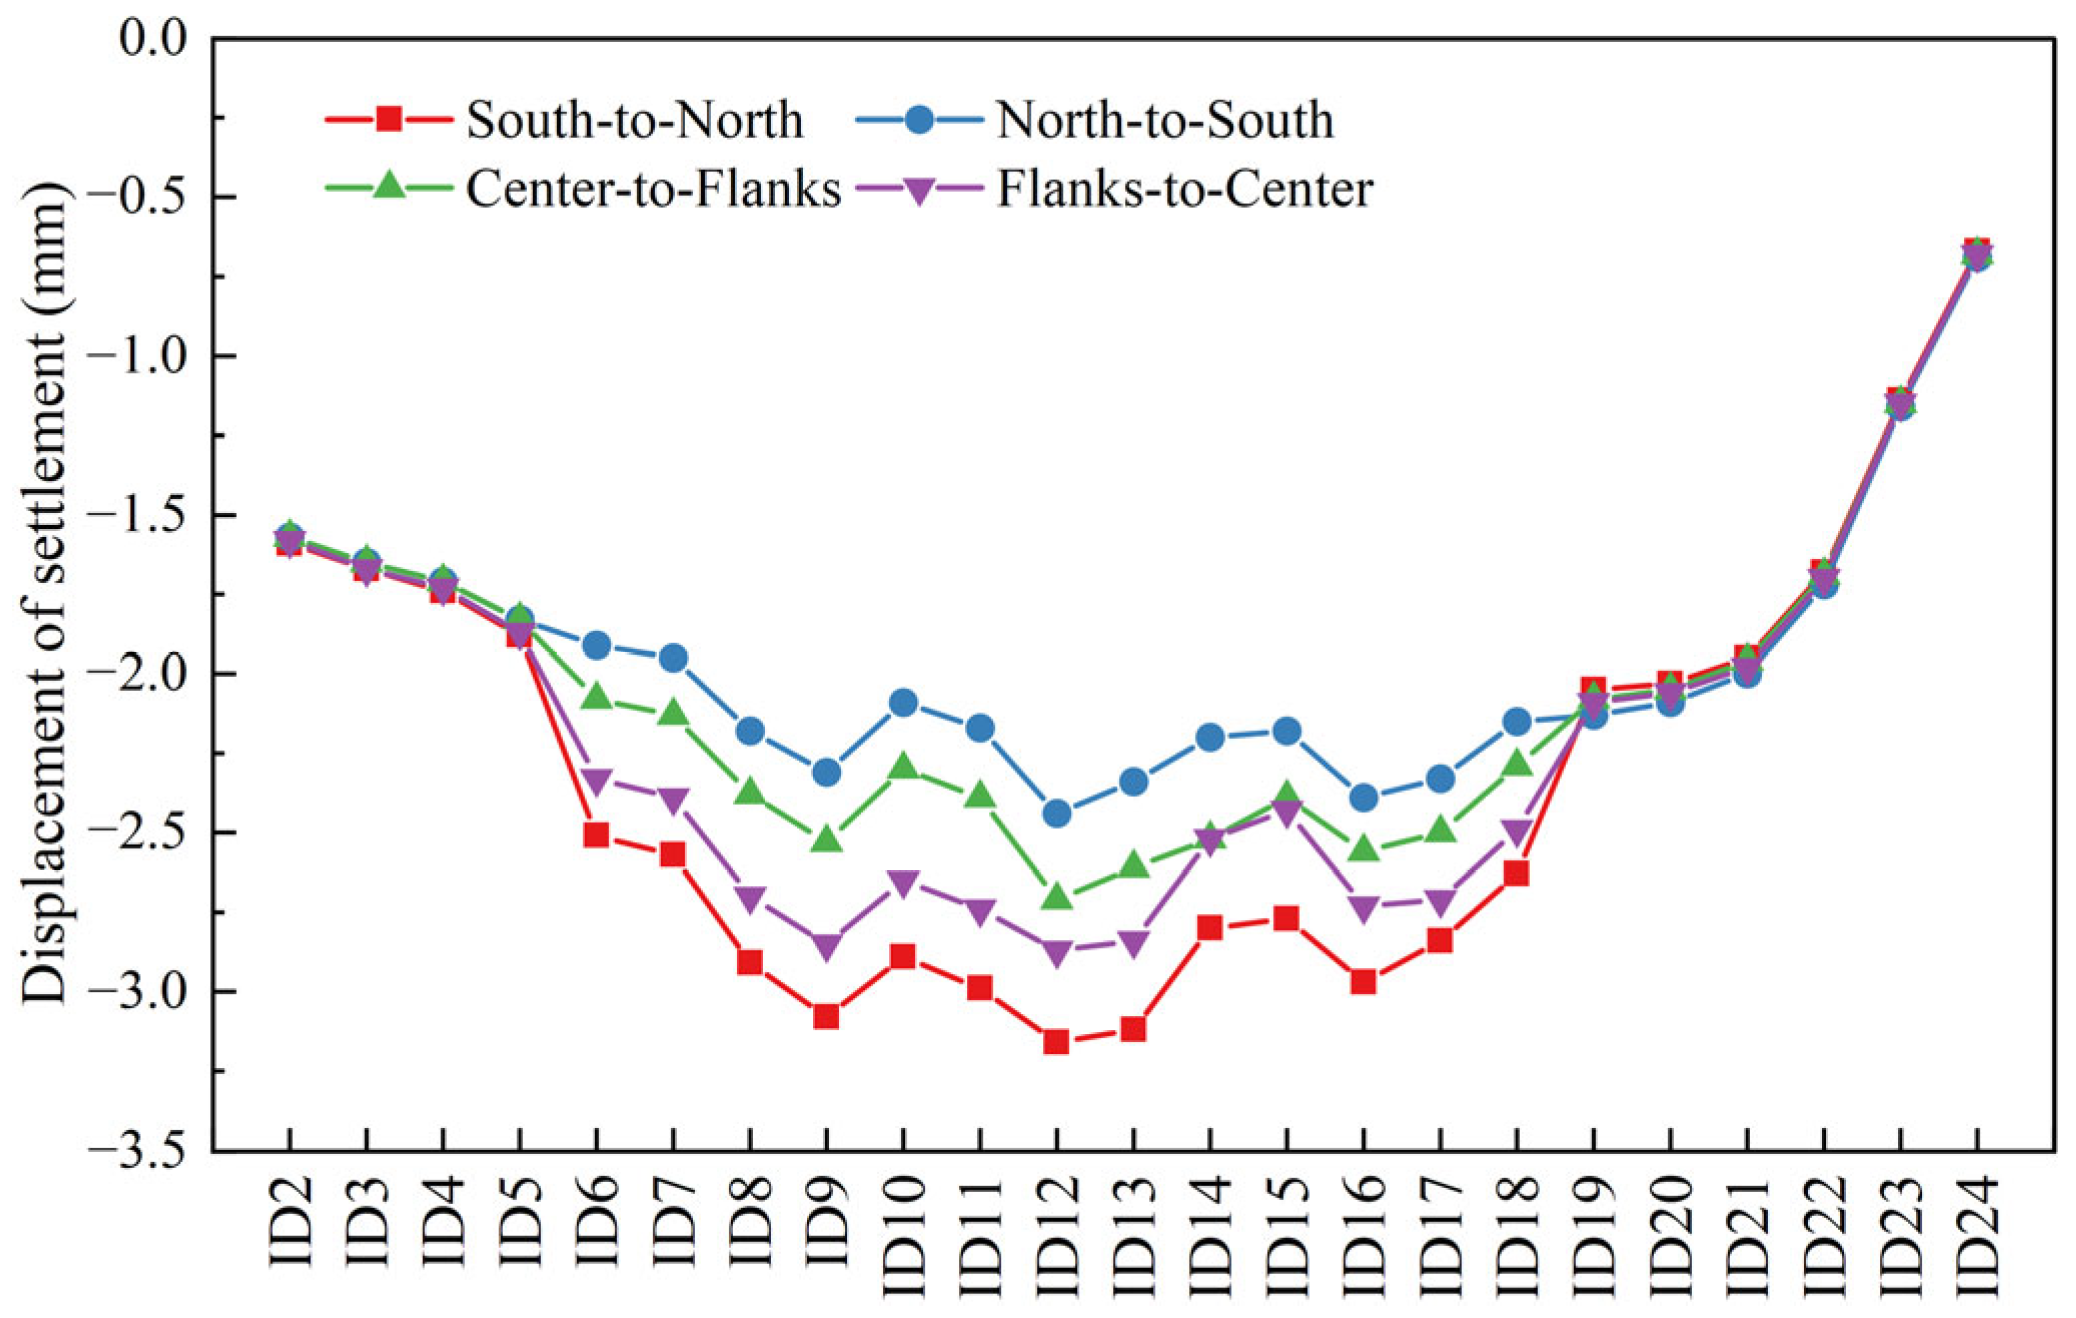
3.2.3. Displacement Response

Figure 14 presents settlement displacement nephograms after stope extraction under different mining sequences. Compared to post-pillar extraction, stope extraction significantly increased settlement displacements across monitoring points and expanded the influence zone, necessitating real-time monitoring of the backfill isolation layer and prompt backfilling post-extraction.
Settlement displacement variation curves at slope monitoring points and backfill isolation layer monitoring points during stope extraction are illustrated in Figure 15 for slope points ID7 and ID18 and isolation layer points ID10 and ID15. Gradual displacement accumulation was observed during stope extraction, without abrupt deformations. By comparing the displacement evolution curves of the four mining sequences, it was observed that the center-to-flank scheme exhibited the most significant cumulative settlement increments, particularly within the backfill isolation layer, where settlement values reached their peak earliest during the mining process. The south-to-north and flank-to-center sequences displayed similar displacement evolution trends, with moderate settlement increments and an accumulation rate that initially increased before gradually slowing down. Notably, throughout the entire stope extraction process, the north-to-south sequence consistently achieved the lowest displacement values at both the slope and isolation layer monitoring points. Among the four mining schemes, the settlement displacements recorded at monitoring points on the slope were consistently smaller than those on the isolation layer. After the completion of stope extraction, the settlement displacements at slope monitoring points ranged from 6 to 7 mm, while those at isolation layer monitoring points ranged from 9 to 10 mm.
Settlement displacement statistics for monitoring points after stope mining are summarized in Table 5, with corresponding displacement curves illustrated in Figure 16. Settlement displacements increased compared to pillar extraction, particularly at monitoring points within the backfill isolation layer, where displacements rose by 5–8 mm. The monitoring points with larger settlement displacements were ID9, ID10, ID15, and ID16, with values ranging from 10 to 12 mm. In contrast, the settlement displacements of the open-pit slope increased only slightly, remaining within the range of 1 to 3 m. This calculation result supports the findings of Tao et al. [21] and Cao et al. [22], whose computed stope settlement displacements ranged between 9.3 mm and 13.2 mm.
The difference between the isolation layer and the slope displacement reflects the relatively lower stiffness and greater deformability of the isolation layer materials, especially in unconsolidated backfill zones. Although the overall compressive stress state of the isolation layer remained within safe limits, its cumulative deformation and sensitivity to stress redistribution were more pronounced, indicating higher vulnerability under continuous mining-induced disturbances.
Cumulative settlement displacements across the four stope mining sequences ranked as follows: center-to-flank > south-to-north > flank-to-center > north-to-south. Therefore, based on settlement deformation analysis of the open-pit slope and isolation layer, the north-to-south mining sequence is recommended as the optimal strategy.

3.3. Determination of Optimal Mining Sequence

Comprehensive stress and displacement response analyses of pillar and stope extraction reveal significant variations in rock mass stability across different mining sequences. Pillar stress variations decrease sequentially in the following order: center-to-flank > flank-to-center > south-to-north > north-to-south. Displacement responses during pillar mining exhibit maximum cumulative deformation (53.65 mm) under the south-to-north sequence and minimum deformation (45.22 mm) under the north-to-south sequence. For stope extraction, the center-to-flank sequence yields the highest cumulative tensile stress (1.942 MPa) and displacement (179.02 mm), while the north-to-south sequence reduces these values to 1.467 MPa and 164.22 mm, respectively, demonstrating marked stability improvements. Overall stability rankings are north-to-south > south-to-north > flank-to-center > center-to-flank.
Despite the north-to-south scheme demonstrating superior mechanical performance, considering that the eastern stope of the −100 m level has already adopted a south-to-north mining sequence, it is recommended that the −150 m level eastern stope continue with the “south-to-north” mining sequence. This ensures synergistic control of mining-induced disturbances across adjacent levels, coherence of the ventilation system, and consistency in production management.

4. Conclusions

An optimization study was conducted using FLAC3D software to determine the optimal mining sequences for pillar and stope extraction at the −150 m level of the eastern panel II orebody in Yongping Copper Mine. Dynamic monitoring of compressive stress, tensile stress, and displacement responses at 23 monitoring points within the backfill isolation layer and open-pit slope yielded the following conclusions:
(1) During pillar extraction, the backfill isolation layer primarily experienced compressive stresses (0.04–2.00 MPa), while localized tensile stresses (maximum 0.47 MPa) occurred on the slope, remaining below the limestone tensile strength threshold (1.51 MPa). Settlement displacements in both the isolation layer and the slope were less than 3 mm, confirming stable conditions without significant deformation or failure.
(2) After the stopes were mined, the settlement displacement of the backfill isolation layer significantly increased to 9–10 mm, while the displacement increment of the open-pit slope remained within 1–3 mm. The isolation layer was still primarily under compressive stress, and the overall tensile stress values showed a decreasing trend. Therefore, both the backfill isolation layer and the slope remained stable during stope extraction.
(3) The north-to-south mining sequence demonstrated optimal mechanical performance (cumulative displacements: 45.22 mm for pillars, 164.22 mm for stopes). However, considering the existing south-to-north sequence implemented at the −100 m level, the south-to-north sequence is recommended for the −150 m eastern panel to ensure coordinated disturbance control, ventilation system continuity, and operational consistency.

Author Contributions

Y.W.: conceptualization, methodology, formal analysis, investigation, writing—original draft, data curation, software, validation, visualization. A.J.: supervision, funding acquisition, project administration, writing—review and editing. All authors have read and agreed to the published version of the manuscript.

Funding

This study was funded by the National Natural Science Foundation of China (No. 51774326).

Data Availability Statement

Some or all data, models that support the findings of this study are available from the corresponding author upon reasonable request.

Conflicts of Interest

Author Yu Wang was employed by the Changsha Mining Research Institute Co., Ltd. The remaining authors declare that the research was conducted in the absence of any commercial or financial relationships that could be construed as a potential conflict of interest. The Changsha Mining Research Institute Co., Ltd. had no role in the design of the study; in the collection, analyses, or interpretation of data; in the writing of the manuscript, or in the decision to publish the results.

References

  1. Zhou, K.; Zhang, C.; Shuai, J.; He, W.; Ren, G.; Cheng, R. Optimization Study of Mining Scheme for the Residual Ore Body under the Complex Back-Fill. Met. Mine 2017, 12, 14–20. [Google Scholar]
  2. Dintwe, T.K.M.; Sasaoka, T.; Shimada, H.; Hamanaka, A.; Moses, D. Evaluating the Influence of Underground Mining Sequence under an Open Pit Mine. J. Min. Sci. 2022, 58, 35–43. [Google Scholar] [CrossRef]
  3. Eremenko, A.A.; Klishin, V.I.; Eremenko, V.A.; Filatov, A.P. Feasibility study of a geotechnology for underground mining at Udachnaya kimberlite pipe under the opencast bottom. J. Min. Sci. 2008, 44, 271–282. [Google Scholar] [CrossRef]
  4. Zhang, Y.; Huang, Q.; Yan, M. Development and Problems of Mining Similar Simulation Experiment Technique. Coal Technol. 2008, 1, 1–3. [Google Scholar]
  5. Qi, W.; Zhu, Q.; Zhao, X.; Li, W. Numerical simulation of stability control of fractured rock mass in southwest wing of Xinli Mining area, Sanshandao Gold Mine. Nonferrous Met. 2019, 71, 88–94. [Google Scholar]
  6. Deng, H.; Yang, Y.; Deng, J.; Liu, C.; Zhao, Y. Study on Mining Sequence of Deep Orebody Under High Stress Environment Below Goaf. Gold Sci. Technol. 2017, 25, 62–69. [Google Scholar]
  7. Gao, F.; Zhou, K.-P.; Dong, W.-J.; Su, J.-H. Similar material simulation of time series system for induced caving of roof in continuous mining under backfill. J. Cent. South Univ. Technol. 2008, 15, 356–360. [Google Scholar] [CrossRef]
  8. Ye, Y.; Shi, Y.; Wang, Q.; Liu, Y.; Yao, N.; Lu, F. Experimental study of deformation of wall rock and stoping sequence in mining gently inclined and multilayer deposits by backfill mining. J. Min. Saf. Eng. 2015, 32, 407–413. [Google Scholar]
  9. Cui, F.; Jia, C.; Lai, X. Study on Deformation and Energy Release Characteristics of Overlying Strata under Different Mining Sequence in Close Coal Seam Group Based on Similar Material Simulation. Energies 2019, 12, 4485. [Google Scholar] [CrossRef]
  10. Moosavi, E.; Gholamnejad, J. Optimal extraction sequence modeling for open pit mining operation considering the dynamic cutoff grade. J. Min. Sci. 2016, 52, 956–964. [Google Scholar] [CrossRef]
  11. Zhou, K.; Gu, D. Optimization of stoping sequence in underground mine by using genetic algorithm method. China Min. 2001, 5, 52–56. [Google Scholar]
  12. Sears, M.M.; Slaker, B.; Rashed, G.; Miller, J. Analysis of the Impacts of Mining Sequence and Overburden Depth on Stability at a Dipping Limestone Mine. Min. Met. Explor. 2021, 38, 959–965. [Google Scholar] [CrossRef]
  13. Jiang, N.; Wang, C.; Pan, H.; Yin, D.; Ma, J. Modeling study on the influence of the strip filling mining sequence on mining-induced failure. Energy Sci. Eng. 2020, 8, 2239–2255. [Google Scholar] [CrossRef]
  14. Wang, P.; Li, H.; Li, Y.; Cheng, B. Stability analysis of backfilling in subsiding area and optimization of the stoping sequence. J. Rock Mech. Geotech. Eng. 2013, 5, 478–485. [Google Scholar] [CrossRef]
  15. GB 50771-2012; Code for Design of Nonferrous Metal Mining. Ministry of Housing and Urban-Rural Development of the People’s Republic of China: Beijing, China, 2012.
  16. Chen, Y.; Lin, H. Consistency analysis of Hoek–Brown and equivalent Mohr–coulomb parameters in calculating slope safety factor. Bull. Eng. Geol. Environ. 2019, 78, 4349–4361. [Google Scholar] [CrossRef]
  17. Maciej, B.; Jan, G.; Krzysztof, W. Numerical Simulation of Dry Ice Compaction Process: Comparison of the Mohr–Coulomb Model with the Experimental Results. Materials 2022, 15, 7932. [Google Scholar] [CrossRef] [PubMed]
  18. Banda, S.U. Geotechnical Approach for Slope Design and Management Strategy for Nchanga Open Pit, Zambia. Earth Sci. Front. 2009, 16, 241. [Google Scholar]
  19. Stacey, T.R. Slope stability in high stress and hard rock conditions. In Proceedings of the 2007 International Symposium on Rock Slope Stability in Open Pit Mining and Civil Engineering: Australian Centre for Geomechanics, Perth, Australia, 12–14 September 2007; pp. 187–200. [Google Scholar]
  20. Deng, K.; Chen, M.; Yan, P.; Leng, Z.; Yang, G. Analysis of Toe Formation in Stress-Concentration Zones on High Rock Slopes. KSCE J. Civ. Eng. 2022, 26, 966–976. [Google Scholar] [CrossRef]
  21. Tao, M.; Luo, F. Analysis of Pillar Stability and Optimization of Mining Sequence in Ningdu Pyrite. Min. Technol. 2016, 16, 25–29. [Google Scholar]
  22. Cao, Y.; Liu, Y.; Deng, H. Optimization and Application of Stope Mining Sequence in Deep Orebody of Xiadian Gold Mine. Min. Res. Dev. 2021, 41, 1–7. [Google Scholar]
Figure 1. The corresponding relationship between the geographical location of Yongping Copper Mine and the longitudinal projection of the eastern section of the −150 m level: (a) geographical location of Yongping Copper Mine, (b) open-pit boundary plan, (c) spatial relationship of stopes and pillars at −150 m level.
Processes 13 02296 g001
Figure 2. Open-pit mine model: (a) orebody model, (b) fault model, (c) mining area model.
Processes 13 02296 g002
Figure 3. The overall three-dimensional model of the mining area.
Processes 13 02296 g003
Figure 4. The FLAC3D model of the mining area and stopes and pillars at the −150 m level: (a) open-pit model, (b) model of stopes and pillars.
Processes 13 02296 g004
Figure 5. Compressive stress cloud maps after pillar mining under different schemes: (a) south-to-north mining sequence, (b) north-to-south mining sequence, (c) center-to-flank mining sequence, (d) flank-to-center mining sequence.
Processes 13 02296 g005aProcesses 13 02296 g005b
Figure 6. Tensile stress cloud maps after pillar mining under different schemes: (a) south-to-north mining sequence, (b) north-to-south mining sequence, (c) center-to-flank mining sequence, (d) flank-to-center mining sequence.
Processes 13 02296 g006
Figure 7. Tensile stress variation curves at slope monitoring points and backfill isolation layer monitoring points during pillar extraction under different mining sequences: (a) south-to-north mining sequence, (b) north-to-south mining sequence, (c) center-to-flank mining sequence, (d) flank-to-center mining sequence.
Processes 13 02296 g007
Figure 8. Settlement displacement cloud maps after pillar mining under different schemes: (a) south-to-north mining sequence, (b) north-to-south mining sequence, (c) center-to-flank mining sequence, (d) flank-to-center mining sequence.
Processes 13 02296 g008aProcesses 13 02296 g008b
Figure 9. Settlement displacement variation curves at slope monitoring points and backfill isolation layer monitoring points during pillar extraction under different mining sequences: (a) south-to-north mining sequence, (b) north-to-south mining sequence, (c) center-to-flank mining sequence, (d) flank-to-center mining sequence.
Processes 13 02296 g009
Figure 10. Post-mining monitoring point settlement and displacement curve of pillar.
Processes 13 02296 g010
Figure 11. Compressive stress cloud maps after stope mining under different schemes: (a) south-to-north mining sequence, (b) north-to-south mining sequence, (c) center-to-flank mining sequence, (d) flank-to-center mining sequence.
Processes 13 02296 g011
Figure 12. Tensile stress cloud maps after stope mining under different schemes: (a) south-to-north mining sequence, (b) north-to-south mining sequence, (c) center-to-flank mining sequence, (d) flank-to-center mining sequence.
Processes 13 02296 g012
Figure 13. Tensile stress variation curves at slope monitoring points and backfill isolation layer monitoring points during stope extraction under different mining sequences: (a) south-to-north mining sequence, (b) north-to-south mining sequence, (c) center-to-flank mining sequence, (d) flank-to-center mining sequence.
Processes 13 02296 g013
Figure 14. Settlement displacement cloud maps after stope mining under different schemes: (a) south-to-north mining sequence, (b) north-to-south mining sequence, (c) center-to-flank mining sequence, (d) flank-to-center mining sequence.
Processes 13 02296 g014
Figure 15. Settlement displacement variation curves at slope monitoring points and backfill isolation layer monitoring points during stope extraction under different mining sequences: (a) south-to-north mining sequence, (b) north-to-south mining sequence, (c) center-to-flank mining sequence, (d) flank-to-center mining sequence.
Processes 13 02296 g015
Figure 16. Post-mining monitoring point settlement and displacement curve of stope.
Processes 13 02296 g016
Table 1. Physical and mechanical parameters of treated ore and rock.
Lithologyρ (kg/m3)UCS (MPa)σt (MPa)E (GPa)ν (MPa)c (MPa)φ (°)K (GPa)G (GPa)
Limestone269733.661.5112.650.245.5139.348.115.10
Migmatite268029.251.7716.990.256.7849.7711.336.80
Ore313120.971.2211.880.264.347.198.294.71
Consolidated backfill221030.550.230.6536.03.092.03
Unconsolidated backfill20000.50.022.50.290.1030.01.980.97
Note: Density (ρ), uniaxial compressive strength (UCS), tensile strength (σt), modulus of elasticity (E), Poisson’s ratio (ν), cohesion (c), angle of internal friction (φ), bulk modulus (K), shear modulus (G).
Table 2. The situation of tensile stress at monitoring points of each pillar stoping scheme (MPa).
Monitoring PointSouth-to-NorthNorth-to-SouthCenter-to-FlankFlank-to-Center
ID30.1550.1460.1690.163
ID50.1290.1170.1350.136
ID170.3410.3080.3780.338
ID220.1520.1430.1730.155
ID230.1740.1630.1990.178
ID240.5520.5120.6290.554
Summation1.5031.3881.6841.524
Table 3. Post-mining monitoring point settlement and displacement statistics of pillar (mm).
Monitoring PointSouth-to-NorthNorth-to-SouthCenter-to-FlankFlank-to-Center
ID2−1.59−1.57−1.57−1.58
ID3−1.67−1.65−1.65−1.67
ID4−1.74−1.71−1.71−1.73
ID5−1.88−1.83−1.83−1.87
ID6−2.51−1.91−2.08−2.33
ID7−2.57−1.95−2.13−2.39
ID8−2.91−2.18−2.38−2.70
ID9−3.08−2.31−2.53−2.85
ID10−2.89−2.09−2.30−2.65
ID11−2.99−2.17−2.39−2.74
ID12−3.16−2.44−2.71−2.87
ID13−3.12−2.34−2.61−2.84
ID14−2.80−2.20−2.52−2.52
ID15−2.77−2.18−2.39−2.43
ID16−2.97−2.39−2.56−2.73
ID17−2.84−2.33−2.50−2.71
ID18−2.63−2.15−2.29−2.49
ID19−2.05−2.13−2.08−2.09
ID20−2.03−2.09−2.05−2.06
ID21−1.95−2.00−1.96−1.98
ID22−1.68−1.72−1.69−1.70
ID23−1.14−1.16−1.15−1.15
ID24−0.67−0.69−0.68−0.68
Summation−53.65−45.22−47.75−50.75
Note: The monitoring points ID8~ID17 are the monitoring points of the backfill isolation layer, and the other monitoring points are slope monitoring points.
Table 4. The situation of tensile stress at monitoring points of each stope stoping scheme (MPa).
Monitoring PointSouth-to-NorthNorth-to-SouthCenter-to-FlankFlank-to-Center
ID30.1540.1460.1540.158
ID50.2070.1820.2150.221
ID170.4050.2540.4630.283
ID220.1040.0720.1160.078
ID230.2430.2270.2770.247
ID240.7080.6880.8180.742
Summation1.7211.4671.9421.629
Table 5. Post-mining monitoring point settlement and displacement statistics of stope (mm).
Monitoring PointSouth-to-NorthNorth-to-SouthCenter-to-FlankFlank-to-Center
ID2−4.27−3.70−3.99−4.23
ID3−4.77−4.31−4.64−4.73
ID4−5.08−4.68−5.03−5.04
ID5−5.75−5.47−5.87−5.71
ID6−7.02−6.88−7.38−6.98
ID7−7.24−7.13−7.64−7.20
ID8−8.29−8.35−8.93−8.28
ID9−11.17−10.59−11.36−11.10
ID10−10.76−9.85−10.54−10.69
ID11−10.58−9.68−10.37−10.49
ID12−10.33−9.91−10.74−10.15
ID13−10.32−9.65−10.57−10.03
ID14−10.35−9.60−10.98−10.30
ID15−11.68−9.72−11.53−10.45
ID16−12.07−10.06−11.70−11.08
ID17−8.59−7.66−8.53−9.40
ID18−7.85−7.09−7.90−7.53
ID19−6.85−6.39−6.94−6.73
ID20−6.66−6.30−6.76−6.63
ID21−6.47−6.19−6.54−6.52
ID22−5.60−5.44−5.66−5.75
ID23−3.55−3.62−3.61−3.82
ID24−1.78−1.94−1.81−2.04
Summation−177.03−164.22−179.02−174.89
Note: The monitoring points ID8~ID17 are the monitoring points of the backfill isolation layer, and the other monitoring points are slope monitoring points.
Disclaimer/Publisher’s Note: The statements, opinions and data contained in all publications are solely those of the individual author(s) and contributor(s) and not of MDPI and/or the editor(s). MDPI and/or the editor(s) disclaim responsibility for any injury to people or property resulting from any ideas, methods, instructions or products referred to in the content.

