Abstract
This paper explores the complex dynamics of mixed convective flow in a Casson fluid saturated in a non-Darcy porous medium, focusing on the influence of gyrotactic microorganisms, internal heat generation, and multiple convective mechanisms. Casson fluids, known for their non-Newtonian behavior, are relevant in various industrial and biological contexts where traditional fluid models are insufficient. This study addresses the limitations of the standard Darcy’s law by examining non-Darcy flow, which accounts for nonlinear inertial effects in porous media. The governing equations, derived from conservation laws, are transformed into a system of no linear ordinary differential equations (ODEs) using similarity transformations. These ODEs are solved numerically using a finite differencing method that incorporates central differencing, tridiagonal matrix manipulation, and iterative procedures to ensure accuracy across various convective regimes. The reliability of this method is confirmed through validation with the MATLAB (R2024b) bvp4c scheme. The investigation analyzes the impact of key parameters (such as the Casson fluid parameter, Darcy number, Biot numbers, and heat generation) on velocity, temperature, and microorganism concentration profiles. This study reveals that the Casson fluid parameter significantly improves the velocity, concentration, and motile microorganism profiles while decreasing the temperature profile. Additionally, the Biot number is shown to considerably increase the concentration and dispersion of motile microorganisms, as well as the heat transfer rate. The findings provide valuable insights into non-Newtonian fluid behavior in porous environments, with applications in bioengineering, environmental remediation, and energy systems, such as bioreactor design and geothermal energy extraction.
1. Introduction
The study of fluid dynamics in porous media has been a topic of significant interest due to its wide-ranging applications in engineering, biology, and environmental sciences. In particular, the behavior of non-Newtonian fluids, such as Casson fluids, in porous environments has garnered attention for its relevance to industrial processes, biomedical applications, and natural phenomena [1,2]. Casson fluid, which exhibits non-Newtonian behavior with a yield stress, affects mixed convection by altering the flow dynamics and heat transfer characteristics compared to Newtonian fluids. The presence of yield stress can reduce the fluid’s ability to flow easily, leading to changes in the velocity and temperature profiles within the convection system [3,4]. This unique property makes Casson fluids suitable for modeling materials like blood, chocolate, and certain polymer solutions, where traditional Newtonian fluid models fail to capture complex rheological behavior.
Casson fluids have been explored under various conditions to understand their complex behavior. Initial research often focused on fundamental aspects, such as the work by Yadav et al. [5,6], who observed chemical reactions in thermohaline convection and investigated rotation effects in a permeable layer. In a similar manner, Hussain et al. [7] observed the effects of chemical reactions and mass transfer over a permeable wedge in the presence of Casson fluid.
A significant step toward more realistic modeling involves accounting for the porous medium’s structure. In many practical situations, the flow of fluids through porous media cannot be accurately described by Darcy’s law, which assumes a linear relationship between the fluid velocity and the pressure gradient. Instead, a more generalized non-Darcy model is required to account for inertial effects and nonlinearity, particularly in cases where the flow velocity is high or the medium has complex geometrical structures. The study of non-Darcy flow in porous media [8,9,10] is crucial for applications such as petroleum recovery and chemical reactor design. Research in this area includes the work of Hemalatha et al. [11], who observed mixed convective flow through non-Darcy porous vertical cylinders and found that spherical nanoparticles increase the fluid temperature. Umavathi et al. [12] proposed a mathematical formulation for mixed convection fluid flow and heat transfer considering the surface at convective conditions and found that the thermal Grashof number enhances the flow through buoyancy and dissipation. Bejawada et al. [13], on the other hand, discussed the impact of thermal radiation on a non-Darcy nanofluid model, finding that the Lewis number accelerates mass transfer. This amplification happens when the nanofluid flow is aided as well as when it is resisted. Further combining these concepts, Seth et al. [14] analyzed the hydromagnetic thin film flow of a Casson fluid within a non-Darcy medium, considering Joule dissipation and partial slip conditions. Additionally, Jat et al. [15] investigated the significance of Darcy–Forchheimer Casson fluid flow past a curved stretching sheet, considering the impacts of heat and mass transfer.
To incorporate additional dynamical behavior relevant to biological and environmental systems, researchers have incorporated the effects of motile gyrotactic microorganisms. These microorganisms can actively swim and orient themselves in response to external stimuli like gravity and light, resulting in a non-uniform distribution that profoundly modifies the fluid properties and introduces intricate variations into the flow dynamics [16,17,18]. Several studies have focused on this bioconvection in the presence of Casson fluid. For instance, Gangadhar et al. [19] observed slip effects on Casson biofluid, finding that the Prandtl number has the highest contribution to the heat transmission rate. Usman [20] investigated the effects of the thermal radiation parameter and magnetic field on non-Newtonian Casson fluid flow, accounting for gyrotactic microorganisms using the spectrum relaxation technique. They found that the Eckert number causes the temperature profile to rise. While studying the gyrotactic microorganisms exposed to an extended sheet, Sarma and Sarma [21] discovered that the density profile of microorganisms decreases with the Peclet number. Elhag’s [22] 3D Darcy–Forchheimer simulation revealed that the porosity parameter decreases the velocity profile. In related work, Nima and Ferdows [23] developed a computational model for gyrotactic free–forced bioconvective flow, highlighting the influence of various slip effects on the system.
Concurrently with these advancements, heat transfer characteristics, particularly the role of internal heat generation, have been a significant area of investigation. Heat generation within the fluid can occur due to chemical reactions, biological processes, or external heating, and it plays a critical role in determining the temperature distribution [24,25]. The interaction between fluid flow, heat transfer, and microbial activity is of particular interest in fields such as bioengineering, where maintaining optimal temperature conditions is essential for the growth and function of microorganisms. Various researchers have investigated microbial flow with heat generation influence, including Kotha et al. [26] and Jumana and Balla [27]. Elbashbeshy et al. [28] observed heat generation effects on bioconvection with nanofluids, and they found that an inclination angle below 45 degrees accelerates skin friction, heat transfer rates, and the Sherwood number. Meanwhile, Nagendramma et al. [29] studied Casson nanofluid-saturated microbial flow with Cattaneo–Christov heat absorption. They discovered that gyrotactic microorganisms are significantly stimulated as the Casson fluid parameter falls. Notably, velocity profiles with a positive Casson fluid parameter are greater than those with a negative or infinite Casson fluid parameter.
A crucial theme across all these areas is the mode of heat transfer, be it free, forced, or mixed convection. Understanding the interplay between these regimes is essential for accurately simulating real-world processes. In industrial stretching and coating processes, forced convection is more common than free convection, which is driven by buoyancy in thermally active environments. In many real-world scenarios, mixed convection, which blends the two phenomena, is employed. A detailed study is essential for applications in manufacturing, energy systems, and biomedical engineering, as the non-Newtonian characteristics of the Casson fluid and the additional resistance brought on by non-Darcy effects significantly alter flow behavior. Makanda et al. [30] examined the effects of radiation on MHD free convection from a cylinder with partial slip in a Casson fluid in a non-Darcy porous medium because of their useful applications. Using a bivariate quasi-linearization (BQLM) approach, they found that the Lorentz force decreases the velocity profile. In the context of mixed convection, Baitharu et al. [31] developed a solution for non-Darcy mixed convective flow of a non-Newtonian fluid past a vertical surface in the presence of a volumetric heat source and discovered that a decrease in surface cooling from pseudoplasticity to dilatancy through Newtonian occurs when all flow and heat transfer parameters are increased. Ashraf et al. [32] documented that the Casson parameter helps lower skin friction intensity for unsteady mixed convection flow. Prasad et al. [33] analyzed the double diffusive effects on mixed convection Casson fluid flow past a wavy inclined plate within a Darcian porous medium.
Other studies have addressed a range of complex phenomena within these convection regimes. Animasaun et al. [34] conducted a simulation of electrically conducting Casson thin film fluid, discovering that velocity slip tends to decrease fluid velocity. Humane et al. [35] found that a magnetic field can be used to regulate flow motion on an inclined surface containing microorganisms. In forced convection, Qawasmeh et al. [36] discovered that an increase in porosity lowers heat transfer rates for Casson nanofluid on a flat plate, while Farooq et al. [37] found that an increase in the porous resistance parameter raises the velocity profile in a non-similar model. More recently, Saha et al. [38] studied MHD Oldroyd B fluid flow using the Darcy–Forchheimer–Brinkman model with microorganisms exposed to a permeable sheet. This problem was solved computationally using an effective numerical methodology called the finite difference method, and the study showed that bio-convection parameters improve the transfer of motile microorganisms and lower the local Nusselt number.
Recent advancements in CFD coupling research have significantly enhanced the understanding of non-Newtonian fluid dynamics in porous media. For instance, Sadeghi et al. [39] conducted CFD simulations to analyze turbulent non-Newtonian slurry flows in horizontal pipelines, providing insights into flow behavior under varying conditions. Similarly, Jithin et al. [40] utilized the lattice Boltzmann method for pore-scale simulations of shear-thinning fluid flow, emphasizing the impact of microstructural features on macroscopic flow properties. These studies underscore the importance of coupling techniques in accurately modeling complex fluid behaviors.
Building upon these developments, the current research explores the combined effects of non-Darcy flow, Casson fluid behavior, gyrotactic microorganisms, and heat generation in a porous medium over inclined surfaces. While numerous studies have addressed bioconvection in the presence of Casson fluid [21] and through non-Darcy porous media [41] separately, the integration of multiple convective phenomena on bioconvective Casson fluid flow through non-Darcy porous media for inclined surfaces is novel. Additionally, this study examines different flow profiles over vertical and horizontal surfaces for the entire region of free and forced convection, providing a comprehensive view of how surface orientation affects the system dynamics.
A primary motivation for this theoretical investigation is its application in modeling biological systems. Casson fluids, characterized by a yield stress that must be exceeded before flow can occur, are particularly suitable for representing fluids like blood, where red blood cell aggregation contributes to non-Newtonian behavior. Although the model is primarily designed for blood, its scope can be extended to other biological fluids with similar characteristics, such as synovial fluid, cerebrospinal fluid, and interstitial fluid. The framework established in this study therefore holds potential for broad application in bio-fluid dynamics.
To highlight the innovation of this study, Table 1 presents a comparison of the major parameters and convection mechanisms considered in previous studies, emphasizing the unique approach of the current research in integrating multiple factors such as surface orientation, non-Darcy terms, and microbial effects.

Table 1.
Comparative analysis of existing studies with the present study.
This comparison demonstrates how the present study goes beyond previous work, offering a holistic approach to understanding the interplay of these complex physical phenomena.
Overall, this research seeks to address several key questions:
- How do Biot numbers influence the flow profiles of bioconvective Casson fluid through non-Darcy porous media?
- What are the comparative impacts of inclined, vertical, and horizontal surfaces on velocity, temperature, and microbial distributions?
- How do variations in mixed convection parameters affect the interplay between forced and free convection regimes in the presence of gyrotactic microorganisms?
By developing a comprehensive mathematical model and employing robust computational techniques, this research aims to capture the intricate dynamics of the system. The findings not only advance the understanding of non-Newtonian fluid dynamics in porous media but also offer practical implications. In bioengineering, the insights can inform the design of bioreactors and systems where fluid flow and microbial activity are critical. In environmental engineering, the results contribute to strategies for managing microbial populations in soil and water systems. Furthermore, in energy systems, understanding heat transfer in porous materials is vital for applications like geothermal energy extraction and thermal management. This study’s holistic approach to examining the interplay between fluid flow, heat transfer, and microbial dynamics represents a significant contribution to the field.
2. Mathematical Modeling
2.1. Flow Model
To mathematically formulate the problem of mixed convective Casson fluid flow in a non-Darcy porous medium, a physical model is developed based on a set of foundational assumptions. These assumptions are carefully chosen to accurately represent the essential physics of the system while ensuring the resulting governing equations are tractable. The key factors defining the model are detailed below, and the corresponding flow geometry is depicted in Figure 1.
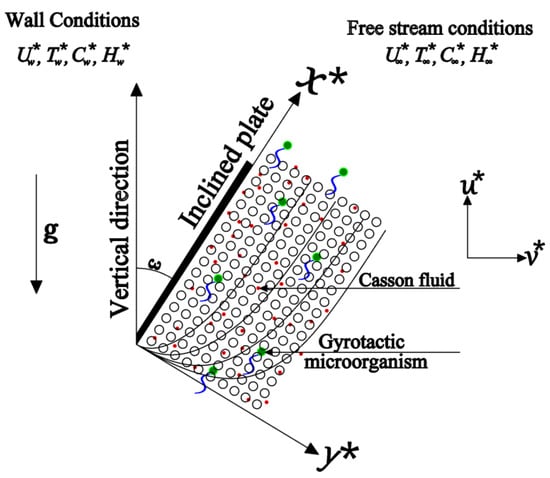
Figure 1.
Flow diagram and graphical system.
- a.
- Steady Two-Dimensional Laminar Non-Darcy Flow Model: The flow is assumed to be steady and laminar, suitable for low Reynolds number conditions. The use of a non-Darcy model accounts for the inertial effects in the porous medium, making it applicable to a wider range of flow conditions beyond the linear Darcy regime.
- b.
- Boussinesq Approximation: The density variation is considered only in the buoyancy term, which is a standard assumption for free and mixed convection analysis, ensuring mathematical simplicity without significant loss of accuracy for moderate temperature differences.
- c.
- Free, Mixed, and Forced Convection in an Incompressible Casson Fluid Over an Inclined Surface: The model captures the combined effects of buoyancy (free convection), external driving forces (forced convection), and their interaction (mixed convection). Casson fluid, representing a non-Newtonian fluid with yield stress, is selected to model complex biological fluids like blood.
- d.
- Coordinate System Definition: The -axis is taken along the inclined surface, and the -axis is perpendicular to it. This coordinate system aligns with the flow direction, providing a clear understanding of the velocity and temperature distributions.
- e.
- Slip Condition at Surface: A velocity slip condition is introduced at the surface, accounting for real-world scenarios where the fluid does not perfectly adhere to the surface, enhancing the model’s flexibility.
- f.
- Non-Darcy Porous Medium Saturated with Gyrotactic Microorganisms: The porous medium is isotropic, ensuring uniform permeability, and it is populated with gyrotactic microorganisms (e.g., Chlamydomonas nivalis), which align and swim in response to external stimuli like gravity.
- g.
- Convective Boundary Conditions at Surface: Convective boundary conditions are applied, allowing the surface to exchange heat with the surrounding fluid, making the model more adaptable to practical scenarios like geothermal reservoirs or bioreactors.
- h.
- Model Validity for Low Reynolds Number: The model is particularly suitable for low Reynolds number conditions, ensuring that the flow remains laminar and avoiding complexities of turbulence.
By formulating an isotropic and incompressible flow model for Casson fluid, the rheological equation of state has been derived as demonstrated by Jat et al. [15] and Prasad et al. [33].
Here, , is the deformation rate of the component, is the product based on the non-Newtonian fluid, is a critical value of the product, and is the plastic dynamic viscosity of the non-Newtonian fluid,
And the Kinematic viscosity of Casson fluid is expressed as follows:
2.2. Governing Equations and Boundary Conditions
Based on the assumptions outlined above and the fundamental principles established in the works of Seth et al. [14], Jat et al. [15], and Nima and Ferdows [23], the governing equations for continuity, momentum, energy, concentration, and microorganism density are formulated as follows:
With the boundary conditions are of the following form:
Here, are the dimensional temperature, concentration, and volume fraction of motile microorganisms, respectively. is the constant permeability factor, g is the acceleration due to gravity, is the effective thermal diffusivity of the porous medium, is the thermal conductivity of the fluid, is the solute diffusivity, and is the diffusivity of the microorganism.
The microorganism equation integrates fluid dynamics with microbial behavior by incorporating parameters such as the chemotaxis constant and microbial cell speed to explain how microorganisms migrate and proliferate. The swimming speed of the cells determines how rapidly microorganisms can move through the fluid, affecting their responsiveness to environmental variations. Additionally, microorganism diffusivity represents the random movement of micro-organisms, which plays a crucial role in accurately modeling their dispersion within the fluid.
The governing partial differential Equations (4)–(8) with their associated boundary conditions (9) to (10) form a complex system that is challenging to solve in its dimensional form. To facilitate a solution, a similarity transformation is employed. This powerful technique converts the system of PDEs into a set of nonlinear ordinary differential equations, which are more suitable for numerical computation. This is achieved by defining a similarity variable (ξ) and rewriting the velocity, temperature, concentration, and microorganism profiles as dimensionless functions. The specific dimensionless quantities used for this transformation are defined in Equation (11).
The governing equations transformed using (11) are as follows:
And the transformed boundary conditions are as follows:
The defining parameters are as follows:
Finally, following Ferdows et al. [42], flow transfer rates can be defined as follows:
3. Numerical Methodology
The system of nonlinear ordinary differential Equations (12)–(15) along with the boundary conditions (16) is solved using two distinct numerical approaches. This section details the primary method, an efficient finite difference scheme, and the secondary method used for validation, the built-in bvp4c solver in MATLAB.
3.1. The Kafoussias–Williams Method:
To handle boundary layer issues and similarity difficulties in fluid mechanics, this study adopts an efficient numerical approach devised by Kafoussias and Williams [43]. This method is recognized for being simple, quick, and accurate when compared to other contemporary numerical techniques. Following the implementation method used by Kafoussias and Williams [43], this technique is a multi-step process that combines:
- (i)
- the common finite difference method with central differencing;
- (ii)
- a tridiagonal matrix modification;
- (iii)
- a final iterative procedure to ensure convergence.
According to this study, at first momentum, Equation (12) can be rewritten as follows:
Now, by setting , Equation (19) is formed as follows, which represents a second-order differential equation:
where
Following [43], the numerical procedure will begin with a few initial assumptions which ultimately satisfy the given boundary conditions between and , given as follows:
These selected curves meet the boundary requirements. Integrating yields the distribution of . The momentum Equation (12) is solved using a tridiagonal technique, resulting in a new approximation . is then kept. The distribution of is updated by integrating the new estimate . The updated and profiles are applied to fresh inputs, among other things. As a result, the momentum Equation (12) is iteratively solved until convergence is achieved. The convergence criteria include the values of the physically significant gradient . Iterations halt when the difference in the values of between two subsequent iterations is smaller than a small number .
After obtaining , we solve the energy Equation (13) with boundary conditions (16) using the same approach, but without iterations. The energy Equation (13) is linear and may be represented as follows:
To put Equation (15) in second-order linear differential equation form, set as follows:
where
Similarly, the concentration and microorganism Equations, i.e., (14) and (15), respectively are written as follows, as already discussed.
Taking , Equation (27) is transferred as follows:
where
And, by setting , the microorganism equations are written as follows:
where
The numerical technique uses a step size of , with and . The solution converges with an approximation of 10−3.
3.2. The bvp4c Technique
To validate the results from the primary finite difference scheme, a second solution was generated using the robust bvp4c function, a standard solver in MATLAB. A prerequisite for using this solver is the reduction of the governing higher-order ODEs (12) to (15) into an equivalent system of first-order ODEs. This conversion is accomplished through the following variable substitutions:
Along with the following boundary conditions:
The system of first-order Equation (34) with the transformed boundary conditions (35) is then solved directly using the bvp4c function in MATLAB.
3.3. Validation
To ensure the accuracy and reliability of the numerical results presented in this study, a multi-faceted validation process was undertaken. This process involved three key steps: a comparative analysis of two independent numerical methods, a grid independence test to ensure solution stability, and a direct comparison of results against previously published and well-regarded studies.
Numerical method comparison: First, the system of governing equations was solved using two distinct numerical techniques. The primary method, an efficient finite difference scheme, was compared against the well-established bvp4c solver in MATLAB. The comparisons were performed for key physical quantities, namely the wall shear stress, , and the heat transfer rate, , across a range of values for the Casson fluid parameter and the mixed convection parameter (. The results, detailed in Table 2, Table 3, Table 4 and Table 5, demonstrate a high level of agreement between the two numerical approaches. This strong correlation confirms the accuracy and reliability of both methods in solving this complex boundary value problem.
Table 2.
Comparison of for different values of when: ,
,
,
,
,
,
,
,
.
Table 3.
Comparison of for different values of when: ,
,
,
,
,
,
,
,
.
Table 4.
Comparison of for different values of when: ,
,
,
,
,
,
,
,
,
.
Table 5.
Comparison of for different values of when: ,
,
,
,
,
,
,
,
,
.
Grid independence test: Second, a grid independence test was conducted to determine the optimal grid resolution necessary for achieving stable and accurate solutions. As shown in Table 6, the numerical solution was tested with various step sizes (Δη) for different Grashof numbers .
Table 6.
Grid independence test for and when: ,
,
,
,
,
,
,
.
Based on the analysis, a step size of was found to produce satisfactorily accurate results across the entire range of flow conditions considered. While this fine step size requires slightly more CPU computation time, its superior precision and ability to reliably capture the essential flow characteristics justified its use for all computations in this study.
Comparative validation with published literature: Finally, while direct experimental data for the combined effects of Casson fluid, non-Darcy flow, and gyrotactic microorganisms on an inclined surface is not available, the validity of our model is further substantiated by comparing its results with established findings from the literature under limiting conditions.
- A graphical comparison of the velocity profile and shear stress profile was made against the results reported by Bhattacharyya et al. [44] for mixed convective boundary layer slip flow. As illustrated in Figure 2, the outcomes of the present study show an excellent correlation with their published data, confirming the accuracy of the underlying mathematical and computational framework.
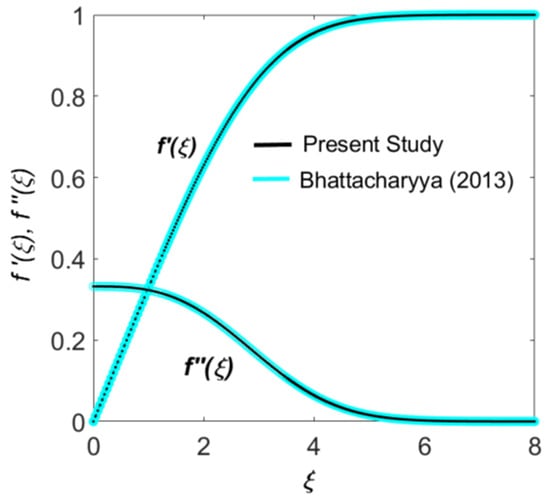 Figure 2. Comparison of and with Bhattacharyya (2013) [44].
 - Furthermore, a comparative analysis for the velocity profile , surface temperature , and heat transfer rate was conducted against the findings of Nima and Ferdows [23]. This comparison, shown in Table 7, also revealed remarkable compatibility, providing additional confidence in the model’s predictive capabilities.
Table 7. Comparison of for when: , , , , , , , , .
The rigorous, multi-step validation process presented above, which combines internal consistency checks with external benchmarking against established literature, provides strong support for the accuracy and physical relevance of the results obtained in this research.
4. Results and Discussion
The analysis begins by examining the skin friction at the surface, a key measure of shear stress. As shown in Table 8, skin friction increases with a higher velocity slip parameter (B) across all convection regimes. This is because greater slip at the boundary creates a steeper velocity gradient near the surface, leading to higher shear stress. This effect is most pronounced in the free convection region () compared to the forced convection region . In free convection, buoyancy forces dominate the flow behavior, enhancing natural circulation and increasing the velocity near the surface. This leads to a stronger velocity gradient at the boundary layer, amplifying skin friction. In contrast, in the forced convection region, external forces primarily drive the flow, reducing the reliance on boundary-layer interactions, thus diminishing the relative impact of velocity slip on skin friction.
Table 8.
Variation of skin friction for different values of slip parameter in the region of pure forced, mixed, and free convection when: ,
,
,
,
,
,
,
,
,
,
,
,
,
,
,
,
.
It is also observed that the surface inclination significantly influences skin friction, particularly in mixed and free convection, as detailed in Table 9. While skin friction is unchanged by inclination in the pure forced convection region, it is observed to be higher for horizontal surfaces compared to inclined and vertical surfaces in the mixed and free convection regimes. This is because, in these regions, buoyancy forces act more directly along the horizontal surface, enhancing velocity gradients and shear stress. In contrast, for inclined and vertical surfaces, the component of buoyancy forces acting parallel to the surface decreases with increasing inclination, reducing the velocity gradients and, consequently, the skin friction.
Table 9.
Variation of skin friction for different inclinations of surfaces in the region of pure forced, mixed, and free convection when: ,
,
,
,
,
,
,
,
,
,
,
,
,
,
,
,
.
The velocity profile in the fluid flow system exhibits a significant dependence on the permeability parameter of the porous medium, as illustrated in Figure 3a. The parameter k1 is the inverse of the medium’s permeability when it comes to flow through porous media; hence, a rise in k1 is associated with a fall in permeability and an increase in flow resistance. The non-Darcy (Forchheimer) model adds an extra inertial resistance element that is proportional to the square of the velocity, in contrast to Darcy’s law, which only considers linear drag. At higher speeds and in areas close to the stretched surface, where velocity gradients are severe, this quadratic drag becomes very noticeable. This inertial resistance grows in magnitude as k1 increases, providing a larger opposing force to the fluid motion. As seen in Figure 3a, this results in a noticeable decrease in fluid velocity inside the boundary layer. Physically, a thinner boundary layer and lower overall flow velocities are the results of the higher resistance, which inhibits momentum transfer away from the wall. When is zero, representing a non-porous medium, the velocity reaches its peak due to minimal resistance. This behavior is crucial in applications such as filtration, oil recovery, and biological transport, where controlled fluid movement through porous media is necessary for optimal performance.
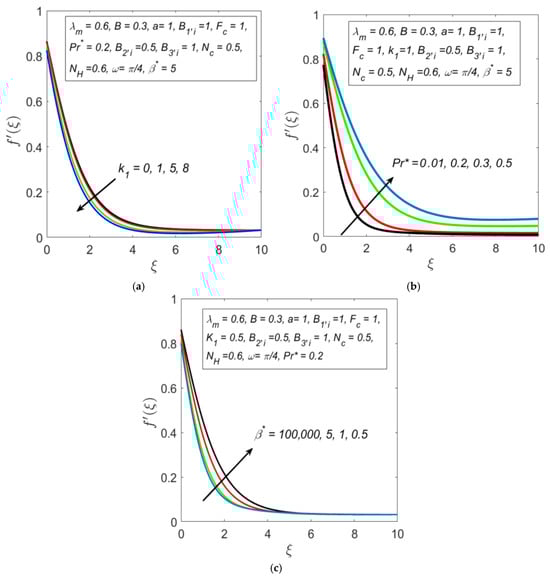
Figure 3.
Observations of velocity profile for different values of (a) (b) , and (c) .
The ratio of momentum diffusivity (kinematic viscosity) to thermal diffusivity, or , is known as the Prandtl number. Fluids with lower thermal diffusivity (like oil) have higher values, whereas fluids with higher thermal diffusivity (like gases and air) have lower values. The fluid transmits heat less effectively as rises, which thins the thermal boundary layer. This increases buoyant forces in flows with thermal coupling (like free or mixed convection) by steepening the temperature gradient close to the wall. Stronger thermal gradients cause more thermal energy to be converted to kinetic energy close to the wall, which speeds up the fluid and raises its velocity inside the momentum barrier layer. Because of the stronger thermal driving force, this explains the pattern shown in Figure 3b, where velocity rises with increasing Prandtl number. When buoyancy terms are present, this interaction is more important since temperature gradients have a direct impact on momentum transfer.
Figure 3c illustrates the critical role of the fluid’s non-Newtonian nature by examining the Casson parameter, β∗. A decrease in β∗ corresponds to an increase in fluid’s yield stress, which enhances the internal resistance to flow. Consequently, the velocity profile is suppressed. This phenomenon is vital in biomedical applications like microcirculation, where the yield stress of blood dictates flow behavior in small vessels. The results underscore the significance of considering Casson fluid dynamics in engineering and biomedical contexts, ensuring accurate modeling and optimization of fluid flow systems.
The rate of heat transfer is significantly influenced by porous media and thermal parameters, as shown in Figure 4. An increase in either the Forchheimer constant or the heat generation parameter is observed to decrease the heat transfer rate [Figure 4a,b]. This phenomenon can be attributed to the fact that the Forchheimer constant represents the inertial resistance in porous media, which disrupts the convective heat transfer by impeding fluid flow. Meanwhile, the heat generation parameter adds internal energy to the system, creating thermal stratification that reduces the overall heat transfer efficiency. The effects of both parameters are particularly prominent in the forced convection regime (mixed convection parameter range: 0 to 0.5), where external forces dominate. In the mixed convection region, where both natural and forced convection coexist, the rate of heat transfer reduction is comparatively slower due to the interplay of buoyancy and forced flow effects. However, in the free convection region, where buoyancy forces dominate, an increment in heat transfer rate is noted, and the influence of the Forchheimer constant and heat generation parameter becomes negligible, as natural convection mechanisms overpower the resistive effects introduced by these parameters.
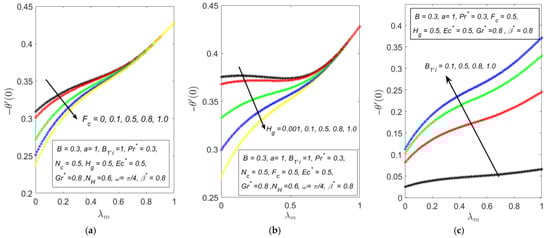
Figure 4.
Observations of heat transfer rate in the region of forced to free convection for different values of (a) (b) and (c) .
In contrast, Figure 4c shows that the heat transfer rate increases with a rising heat transfer Biot number , with the most significant increment occurring in the free convection region. This behavior can be explained by the fact that the represents the ratio of internal thermal resistance within the fluid to the thermal resistance at the boundary surface. As increases, it indicates improved thermal conductivity at the surface, enhancing the rate of heat transfer between the fluid and the boundary. In the free convection region, buoyancy-driven flow dominates, which naturally enhances heat transfer. The combination of increased surface heat transfer due to higher and the buoyancy-driven mechanisms in free convection leads to a more pronounced rise in the overall heat transfer rate. Conversely, in forced convection regimes, the external forces already dominate heat transfer, making the impact of Biot number less significant.
The thermal behavior of the fluid is detailed in Figure 5, which illustrates the temperature profile’s response to various parameters. As shown in Figure 5a,b, the temperature profile decreases with increasing modified Grashof and Eckert numbers . The represent the ratio of buoyancy to viscous forces in the fluid. As the increases, buoyancy forces dominate, enhancing fluid motion and promoting convective heat transfer. This results in more efficient heat dissipation from the fluid, leading to a decrease in the temperature profile. Similarly, the Eckert number quantifies the ratio of kinetic energy to enthalpy. A higher indicates increased viscous dissipation, where more kinetic energy is converted into heat, but this process also enhances the movement of fluid layers, facilitating heat diffusion and reducing the overall temperature.
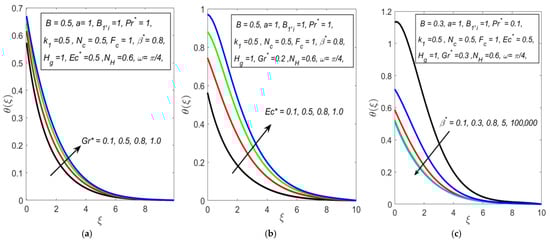
Figure 5.
Observations of temperature profile for different values of (a) (b) , and (c) .
Furthermore, the non-Newtonian nature of the fluid plays a key role, as seen in Figure 5c. It is observed that the temperature profile decreases with increasing Casson fluid parameter . reflects the fluid’s yield stress, with higher values indicating more resistance to flow. As increases, the fluid’s ability to flow freely is reduced, leading to lower convective heat transfer efficiency. The restricted flow limits the transport of thermal energy within the fluid, causing a pronounced decrease in the temperature profile.
The study of mass transfer, depicted in Figure 6 and Figure 7, reveals how solute transport is affected by fluid properties. The rate of mass transfer at the surface is enhanced by both a higher Lewis number () and a higher Casson parameter (), as shown in Figure 6a,b. represents the ratio of thermal diffusivity to mass diffusivity. A higher indicates that thermal diffusion dominates mass diffusion. This creates steeper concentration gradients within the fluid, enhancing the mass transfer rate. Essentially, the slower diffusion of mass compared to heat promotes stronger concentration differences, which drives a more efficient mass transfer process. Similarly, a higher restricts fluid motion, as the yield stress increases, reducing internal mixing. This restriction leads to sharper concentration gradients in the fluid, which in turn enhances the mass transfer rate. The stronger concentration gradients act as a driving force, pushing mass transfer more effectively despite the limited fluid flow. These effects directly influence the concentration profile within the boundary layer, as seen in Figure 7.
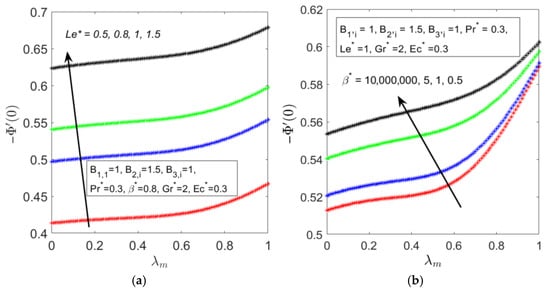
Figure 6.
Observations of mass transfer rate in the region of forced to free convection for different values of (a) and (b) .
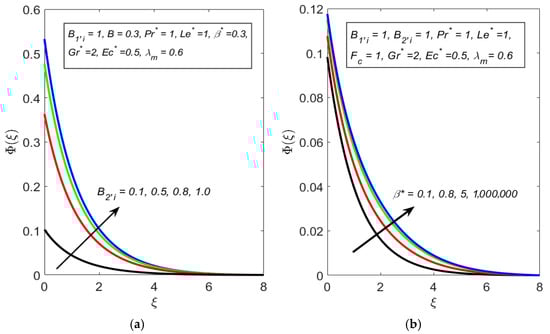
Figure 7.
Observations of concentration profile for different values of (a) and (b) .
The concentration profile is observed to increase with the Biot number of mass transfer , as depicted in Figure 7a. An increase in indicates that the rate of mass transfer at the boundary is more effective compared to the internal diffusion within the fluid. This enhanced boundary mass transfer facilitates a greater influx of species into the fluid, leading to a buildup of concentration near the boundary layers and throughout the fluid domain. Similarly, Figure 7b illustrates that the concentration profile increases with . As the Casson parameter rises, it restricts internal mixing, causing transported particles to accumulate, thus increasing the overall concentration profile. The reduced mobility of the fluid prevents uniform dispersion, allowing concentration gradients to become more pronounced.
The dynamics of the gyrotactic microorganisms, from their transfer at the surface to their distribution within the fluid, are detailed in Figure 8 and Figure 9. The transfer rate of motile microorganisms at the surface, shown in Figure 8, is governed by their diffusive and advective properties. Figure 8a shows that the transfer rate increases with the bioconvection Lewis number (). This number represents the ratio of thermal diffusivity to microorganism diffusivity. A higher indicates that microorganisms diffuse more slowly relative to heat, leading to the formation of a sharper microorganism concentration gradient near the surface and thus a higher transfer rate. Similarly, Figure 8b demonstrates that the transfer rate is enhanced by a larger bioconvection Peclet number (). The Peclet number is the ratio of transport by directed cell swimming (advection) to transport by random diffusion. As increases, the directed swimming of microorganisms toward the surface dominates over diffusion, causing them to accumulate in the boundary layer and increasing the transfer rate. These surface transfer rates directly influence the overall concentration of motile microorganisms within the boundary layer, as depicted in Figure 9.
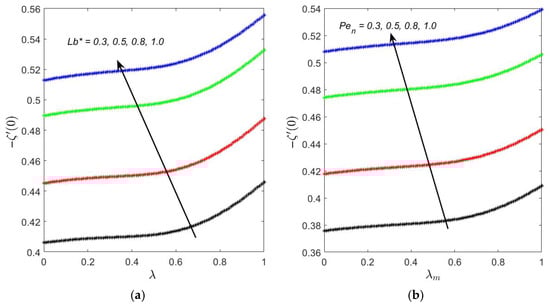
Figure 8.
Observations of motile microorganism transfer rate in the region of forced to free convection for different values of (a) and (b) .
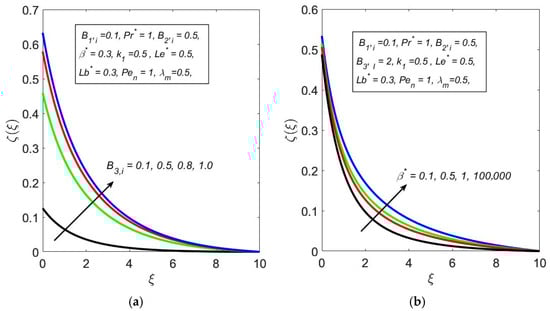
Figure 9.
Observations of microorganism profile for different values of (a) , and (b) .
An increase in the Biot number for microorganism transfer () enhances the efficiency of microorganism influx from the boundary into the fluid, thereby increasing the overall profile, as seen in Figure 9a. Furthermore, the fluid’s rheology plays a significant role.
Figure 9b shows that the microorganism profile also increases with the Casson parameter (). A higher corresponds to greater yield stress, which restricts fluid flow and reduces internal mixing. This diminished flow allows microorganisms to accumulate rather than being uniformly dispersed. Additionally, the reduced fluid shear can favor the formation of stable bioconvective patterns, further increasing localized microorganism concentration.
5. Conclusions
This study presented a comprehensive analysis of the mixed convective flow of a Casson fluid containing gyrotactic microorganisms over inclined, vertical, and horizontal surfaces. The analysis revealed that velocity profiles are suppressed by increased permeability and the fluid’s yield stress (Casson parameter), while temperature profiles decrease with enhanced buoyancy (Grashof number) and viscous dissipation (Eckert number). In terms of transport phenomena, the heat transfer rate was significantly enhanced by the Biot number in the free convection regime, while mass and microorganism transfer rates increased with higher Lewis and Peclet numbers, respectively. Furthermore, skin friction was found to be highest on horizontal surfaces in buoyancy-driven flows, an important consideration for practical applications.
While this study is theoretical, the findings provide a strong basis for future experimental work. The model has significant potential for validation through methods such as microchannel flow experiments to simulate blood flow, Micro-PIV (Particle Image Velocimetry) for detailed flow visualization, and rheometric measurements to quantify the fluid’s shear stress behavior. The use of analog fluids could also offer a controlled validation pathway before any in vivo studies are considered.
Building on this work, future theoretical research could extend the model to include more complex physics. Important avenues for exploration include investigating unsteady flow conditions to better simulate real-world applications, searching for dual or multiple solutions to understand system stability, and expanding the model to include nanofluids or magnetohydrodynamic effects to broaden its applicability in biomedical engineering and advanced energy systems.
Author Contributions
Conceptualization, N.I.N. and R.A.R.; methodology, N.I.N. and J.A.; software, N.I.N. and J.A.; validation, N.I.N. and J.A.; formal analysis, M.A.H. and R.A.R.; investigation, J.A. and M.A.H.; resources, N.I.N. and R.A.R.; data curation, M.A.H. and N.I.N.; writing—original draft preparation, N.I.N., writing—review and editing, M.A.H., visualization, N.I.N.; supervision, M.A.H.; project administration, M.A.H., funding acquisition, M.A.H. All authors have read and agreed to the published version of the manuscript.
Funding
This research received no external funding.
Data Availability Statement
The data presented in this study are available upon request from the corresponding author due to the confidentiality of the ongoing research.
Conflicts of Interest
The authors declare no conflicts of interest.
Nomenclature
| Microorganism concentration difference parameter | |
| Slip coefficient | |
| Slip parameter | |
| Biot number of heat transfer | |
| Biot number of mass transfer | |
| Biot number of microorganism transfer | |
| Volume fraction of oxygen species | |
| Wall volume fraction of oxygen species | |
| Ambient volume fraction of oxygen species | |
| Modified Eckert number | |
| Forchheimer constant | |
| Modified Grashof number | |
| Acceleration due to gravity | |
| Heat generation parameter | |
| Permeability parameter | |
| Bioconvection Lewis number | |
| Lewis number | |
| Buoyancy ratio parameter | |
| Buoyancy ratio parameter | |
| Volume fraction of gyrotactic motile microorganisms | |
| Ambient concentration of motile microorganism | |
| Bioconvection Peclet number | |
| Prandtl number | |
| Rayleigh number for the porous medium | |
| Reynolds number | |
| Temperature | |
| Wall temperature | |
| Ambient temperature | |
| Maximum cell swimming speed | |
| Velocity components along axes | |
| Cartesian coordinates (x-axis aligned along the horizontal surface and y-axis is normal to it) | |
| Thermal diffusivity of the porous medium | |
| Buoyancy parameter due to temperature | |
| Buoyancy parameter due to concentration | |
| Buoyancy parameter due to motile microorganisms | |
| Dimensionless oxygen species concentration distribution | |
| Similarity variable | |
| Mixed convection parameter | |
| Casson fluid parameter | |
| Dimensionless temperature | |
| Dynamic viscosity of fluid | |
| Kinematic viscosity of fluid | |
| Fluid density | |
| Dimensionless density of gyrotactic motile microorganisms |
References
- Shahzad, H.; Wang, X.; Ghaffari, A.; Iqbal, K.; Hafeez, M.B.; Krawczuk, M.; Wojnicz, W. Fluid structure interaction study of non-Newtonian Casson fluid in a bifurcated channel having stenosis with elastic walls. Sci. Rep. 2022, 12, 12219. [Google Scholar] [CrossRef] [PubMed]
- Tawalbeh, M.; Shomope, I.; Al-Othman, A. Comprehensive Review on Non-Newtonian Nanofluids, Preparation, Characterization, and Applications. Int. J. Thermofluids 2024, 22, 100705. [Google Scholar] [CrossRef]
- Ali, A.; Farooq, H.; Abbas, Z.; Bukhari, Z.; Fatima, A. Impact of Lorentz force on the pulsatile flow of a non-Newtonian Casson fluid in a constricted channel using Darcy’s law: A numerical study. Sci. Rep. 2020, 10, 10629. [Google Scholar] [CrossRef] [PubMed]
- Israel-Cookey, C.; Davies, O.A.; Ngeri, A.P. Magnetohydrodynamic forced convection and heat transfer of a Casson fluid flow in an anisotropic porous channel with Isoflux boundaries. World J. Adv. Res. Rev. 2023, 18, 1332–1347. [Google Scholar] [CrossRef]
- Yadav, D.; Nair, S.B.; Awasthi, M.K.; Ragoju, R.; Bhattacharyya, K. Linear and nonlinear investigations of the impact of chemical reaction on the thermohaline convection in a permeable layer saturated with Casson fluid. Phys. Fluids 2024, 36, 014106. [Google Scholar] [CrossRef]
- Yadav, D.; Awasthi, M.K.; Singh, A.K.; Ravi, R.; Bhattacharyya, K.; Mahabaleshwar, U.S. Thermal boundary conditions and rotation effects on the onset of casson fluid convection in a permeable layer produced by purely interior heating. Numer. Heat Transf. Part B Fundam. 2024, 1–15. [Google Scholar] [CrossRef]
- Hussain, M.; Shoaib, M.A.; Ranjha, Q.; Shoaib Anwar, M.; Ahmad, Z.; Inc, M. Numerical solution to flow of Casson fluid via stretched permeable wedge with chemical reaction and mass transfer effects. Mod. Phys. Lett. B 2024, 38, 2341008. [Google Scholar] [CrossRef]
- Elsanoose, A. Non-Darcy Flow Through Synthetic Porous Media and Development of Non-Darcy Coefficient Correlations. Ph.D. Thesis, Memorial University of Newfoundland, St. John’s, NL, Canada, 2023. [Google Scholar]
- Menni, Y.; Chamkha, A.J.; Azzi, A. Nanofluid transport in porous media: A review. Spec. Top. Rev. Porous Media Int. J. 2019, 10, 49–64. [Google Scholar] [CrossRef]
- Lopez-Hernandez, H.D. Experimental Analysis and Macroscopic and Pore-Level Flow Simulations to Compare Non-Darcy Flow Models in Porous Media. Master’s Thesis, Colorado School of Mines, Golden, CO, USA, 2007. [Google Scholar]
- Hemalatha, R.; Kameswaran, P.K.; Murthy, P.V.S.N. Effect of nanoparticle shape on the mixed convective transport over a vertical cylinder in a non-Darcy porous medium. Int. Commun. Heat Mass Transf. 2022, 133, 105962. [Google Scholar] [CrossRef]
- Umavathi, J.C.; Buonomo, B.; Manca, O.; Sheremet, M.A. Heat transfer of chemically reacting mixed convection fluid using convective surface condition: Non-Darcy model. Therm. Sci. Eng. Prog. 2021, 25, 101044. [Google Scholar] [CrossRef]
- Bejawada, S.G.; Reddy, Y.D.; Jamshed, W.; Eid, M.R.; Safdar, R.; Nisar, K.S.; Isa, S.S.P.M.; Alam, M.M.; Parvin, S. 2D mixed convection non-Darcy model with radiation effect in a nanofluid over an inclined wavy surface. Alex. Eng. J. 2022, 61, 9965–9976. [Google Scholar] [CrossRef]
- Seth, G.S.; Tripathi, R.; Mishra, M.K. Hydromagnetic thin film flow of Casson fluid in non-Darcy porous medium with Joule dissipation and Navier’s partial slip. Appl. Math. Mech. 2017, 38, 1613–1626. [Google Scholar] [CrossRef]
- Jat, K.; Sharma, K.; Choudhary, P.; Soni, P.; Ali, R.; Ganesh, M. Significance of Darcy–ForchheimerCasson fluid flow past a non-permeable curved stretching sheet with the impacts of heat and mass transfer. Case Stud. Therm. Eng. 2024, 61, 104907. [Google Scholar] [CrossRef]
- Chen, X.; Wu, Y.; Zeng, L. Migration of gyrotactic micro-organisms in water. Water 2018, 10, 1455. [Google Scholar] [CrossRef]
- Ahmad, S.; Younis, J.; Ali, K.; Rizwan, M.; Ashraf, M.; Abd El Salam, M.A. Impact of swimming gyrotactic microorganisms and viscous dissipation on nanoparticles flow through a permeable medium: A numerical assessment. J. Nanomater. 2022, 2022, 4888128. [Google Scholar] [CrossRef]
- Li, Y.; Leng, Y.; Baazaoui, N.; Arain, M.B.; Ijaz, N.; Hassan, A.M. Exploring the dynamics of active swimmers microorganisms with electromagnetically conducting stretching through endothermic heat generation/assimilation flow: Observational and computational study. Case Stud. Therm. Eng. 2023, 51, 103560. [Google Scholar] [CrossRef]
- Gangadhar, K.; SujanaSree, T.; Wakif, A. Generalized slip impact of Cassonnanofluid through cylinder implanted in swimming gyrotactic microorganisms. Int. J. Mod. Phys. B 2024, 38, 2450380. [Google Scholar] [CrossRef]
- Usman, A. Examinations of viscous dissipation, magnetic field and thermal radiation on the systematic flow of Casson fluid with gyrotactic microorganisms. ITM Web Conf. 2024, 67, 01049. [Google Scholar] [CrossRef]
- Sarma, A.K.; Sarma, D. Unsteady magnetohydrodynamic bioconvection Casson fluid flow in presence of gyrotactic microorganisms over a vertically stretched sheet. Numer. Heat Transf. Part A Appl. 2024, 1–24. [Google Scholar] [CrossRef]
- Elhag, S.H. Numerical Study on 3D MHD Darcy-Forchheimer Flow Caused by Gyrotactic Microorganisms of the Bio-Convective CassonNanofluid across a Stretched Sheet. Front. Heat Mass Transf. 2024, 22, 377–395. [Google Scholar] [CrossRef]
- Nima, N.I.; Ferdows, M. A sustainable computational modeling on gyrotactic free forced bioconvective flow with various slip effects. J. Interdiscip. Math. 2022, 25, 1989–1997. [Google Scholar] [CrossRef]
- Faghri, A.; Zhang, Y.; Howell, J.R. Advanced Heat and Mass Transfer; Global Digital Press: Kanpur, India, 2010. [Google Scholar]
- Miralles, V.; Huerre, A.; Malloggi, F.; Jullien, M.C. A review of heating and temperature control in microfluidic systems: Techniques and applications. Diagnostics 2013, 3, 33–67. [Google Scholar] [CrossRef] [PubMed]
- Kotha, G.; Kolipaula, V.R.; VenkataSubba Rao, M.; Penki, S.; Chamkha, A.J. Internal heat generation on bioconvection of an MHD nanofluid flow due to gyrotactic microorganisms. Eur. Phys. J. Plus 2020, 135, 600. [Google Scholar] [CrossRef]
- Jamuna, B.; Balla, C.S. Bioconvection in a porous square cavity containing gyrotactic microorganisms under the effects of heat generation/absorption. Proc. Inst. Mech. Eng. Part E J. Process Mech. Eng. 2021, 235, 1534–1544. [Google Scholar] [CrossRef]
- Elbashbeshy, E.M.; Asker, H.G.; Nagy, B. The effects of heat generation absorption on boundary layer flow of a nanofluid containing gyrotactic microorganisms over an inclined stretching cylinder. Ain Shams Eng. J. 2022, 13, 101690. [Google Scholar] [CrossRef]
- Nagendramma, V.; Raju, C.S.K.; Mallikarjuna, B.; Shehzad, S.A.; Leelarathnam, A. 3D Cassonnanofluid flow over slendering surface in a suspension of gyrotactic microorganisms with Cattaneo-Christov heat flux. Appl. Math. Mech. 2018, 39, 623–638. [Google Scholar] [CrossRef]
- Makanda, G.; Shaw, S.; Sibanda, P. Effects of radiation on MHD free convection of a Casson fluid from a horizontal circular cylinder with partial slip in non-Darcy porous medium with viscous dissipation. Bound. Value Probl. 2015, 2015, 75. [Google Scholar] [CrossRef]
- Baitharu, A.P.; Sahoo, S.; Dash, G.C. Numerical approach to non-Darcy mixed convective flow of non-Newtonian fluid on a vertical surface with varying surface temperature and heat source. Karbala Int. J. Mod. Sci. 2020, 6, 332–343. [Google Scholar] [CrossRef]
- Ashraf, S.; Mushtaq, M.; Jabeen, K.; Farid, S.; Muntazir, R.M.A. Heat and mass transfer of unsteady mixed convection flow of Casson fluid within the porous media under the influence of magnetic field over a nonlinear stretching sheet. Proc. Inst. Mech. Eng. Part C J. Mech. Eng. Sci. 2023, 237, 20–38. [Google Scholar] [CrossRef]
- Prasad, D.K.; Chaitanya, G.K.; Raju, R.S. Double diffusive effects on mixed convection Casson fluid flow past a wavy inclined plate in presence of Darcian porous medium. Results Eng. 2019, 3, 100019. [Google Scholar] [CrossRef]
- Animasaun, I.L. Effects of thermophoresis, variable viscosity and thermal conductivity on free convective heat and mass transfer of non-darcian MHD dissipative Casson fluid flow with suction and nth order of chemical reaction. J. Niger. Math. Soc. 2015, 34, 11–31. [Google Scholar] [CrossRef]
- Humane, P.P.; Patil, V.S.; Shamshuddin, M.D.; Rajput, G.R.; Patil, A.B. Role of bioconvection on the dynamics of chemically active Cassonnanofluid flowing via an inclined porous stretching sheet with convective conditions. Int. J. Model. Simul. 2024, 44, 232–251. [Google Scholar] [CrossRef]
- Qawasmeh, B.R.; Alrbai, M.; Al-Dahidi, S. Forced convection heat transfer of Casson fluid in non-Darcy porous media. Adv. Mech. Eng. 2019, 11, 1687814018819906. [Google Scholar] [CrossRef]
- Farooq, U.; Hussain, M.; Ijaz, M.A.; Khan, W.A.; Farooq, F.B. Impact of non-similar modeling on Darcy-Forchheimer-Brinkman model for forced convection of Cassonnano-fluid in non-Darcy porous media. Int. Commun. Heat Mass Transf. 2021, 125, 105312. [Google Scholar] [CrossRef]
- Saha, K.C.; Saha, G.; Alhazmi, H.; Mohammed, N.A.; Khan, W.A.; Aljohani, A.F.; Khan, I. Finite difference simulations for Darcy–Forchheimer–Brinkman model of MHD Oldroyd B fluid flow past a permeable sheet containing microorganisms. ZAMM-J. Appl. Math. Mech. Z. Mech. 2024, e202300945. [Google Scholar] [CrossRef]
- Sadeghi, M.; Sontti, S.G.; Zheng, E.; Zhang, X. Computational fluid dynamics (CFD) simulation of three–phase non–Newtonian slurry flows in industrial horizontal pipelines. Chem. Eng. Sci. 2023, 270, 118513. [Google Scholar] [CrossRef]
- Jithin, M.; Siddharth, S.; Das, M.K.; De, A. Simulation of coupled heat and mass transport with reaction in PEM fuel cell cathode using lattice Boltzmann method. Therm. Sci. Eng. Prog. 2017, 4, 85–96. [Google Scholar] [CrossRef]
- Saeed, R.; Gul, T. Bioconvection Casson nanofluid flow together with Darcy–Forchheimer due to a rotating disk with thermal radiation and Arrhenius activation energy. SN Appl. Sci. 2021, 3, 77. [Google Scholar] [CrossRef]
- Ferdows, M.; Alshuraiaan, B.; Nima, N.I. Effects of non-Darcy mixed convection over a horizontal cone with different convective boundary conditions incorporating gyrotactic microorganisms on dispersion. Sci. Rep. 2022, 12, 16581. [Google Scholar] [CrossRef] [PubMed]
- Kafoussias, N.G.; Williams, E.W. An improved approximation technique to obtain numerical solutionof a class of two-point boundary value similarity problems in fluid mechanics. Int. J. Numer. Methods Fluids 1993, 17, 145–162. [Google Scholar] [CrossRef]
- Bhattacharyya, K.; Mukhopadhyay, S.; Layek, G.C. Similarity solution of mixed convective boundary layer slip flow over a vertical plate. Ain Shams Eng. J. 2013, 4, 299–305. [Google Scholar] [CrossRef]
Disclaimer/Publisher’s Note: The statements, opinions and data contained in all publications are solely those of the individual author(s) and contributor(s) and not of MDPI and/or the editor(s). MDPI and/or the editor(s) disclaim responsibility for any injury to people or property resulting from any ideas, methods, instructions or products referred to in the content. |
© 2025 by the authors. Licensee MDPI, Basel, Switzerland. This article is an open access article distributed under the terms and conditions of the Creative Commons Attribution (CC BY) license (https://creativecommons.org/licenses/by/4.0/).