
A Model and the Characteristics of Gas Generation of the Longmaxi Shale in the Sichuan Basin

 ,
,
Abstract
1. Introduction
2. Sample and Methods
2.1. Sample
2.2. Methods
3. Results
3.1. Geochemical and Mineralogical Information of the Starting Sample
3.2. Gas Yield
3.3. Gas Compositions
3.4. Carbon Isotopic Composition
4. Discussion
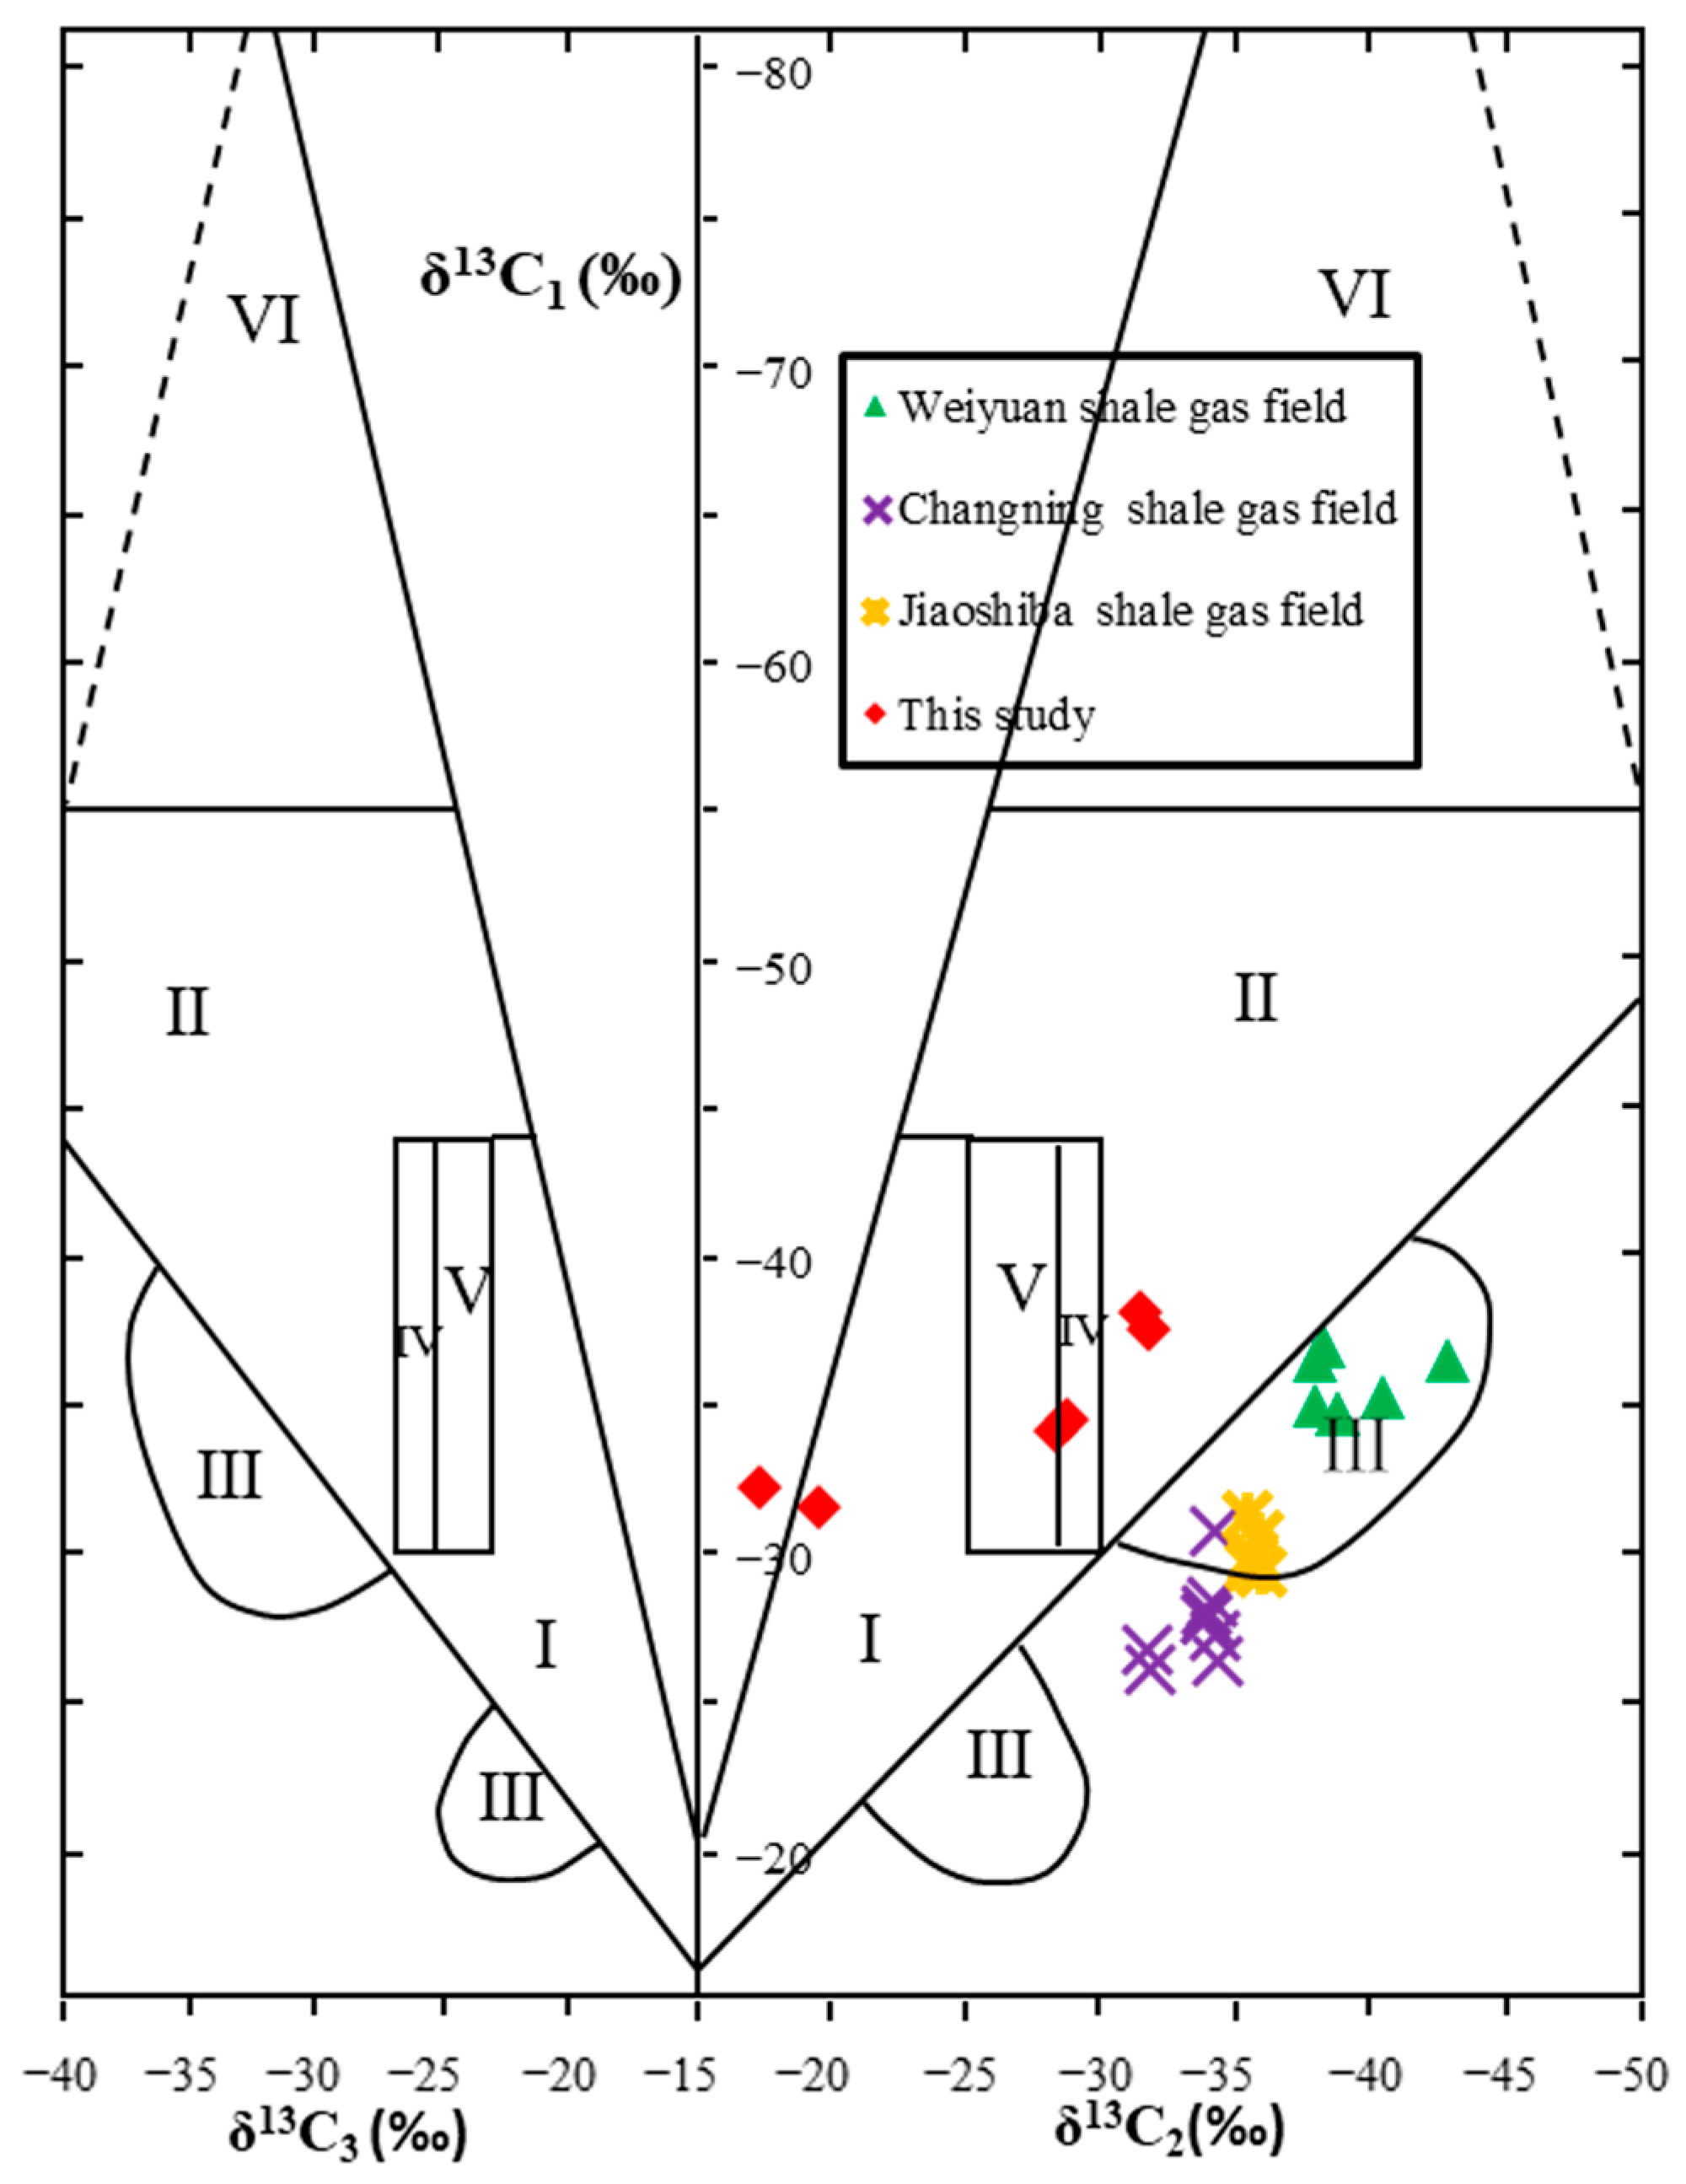
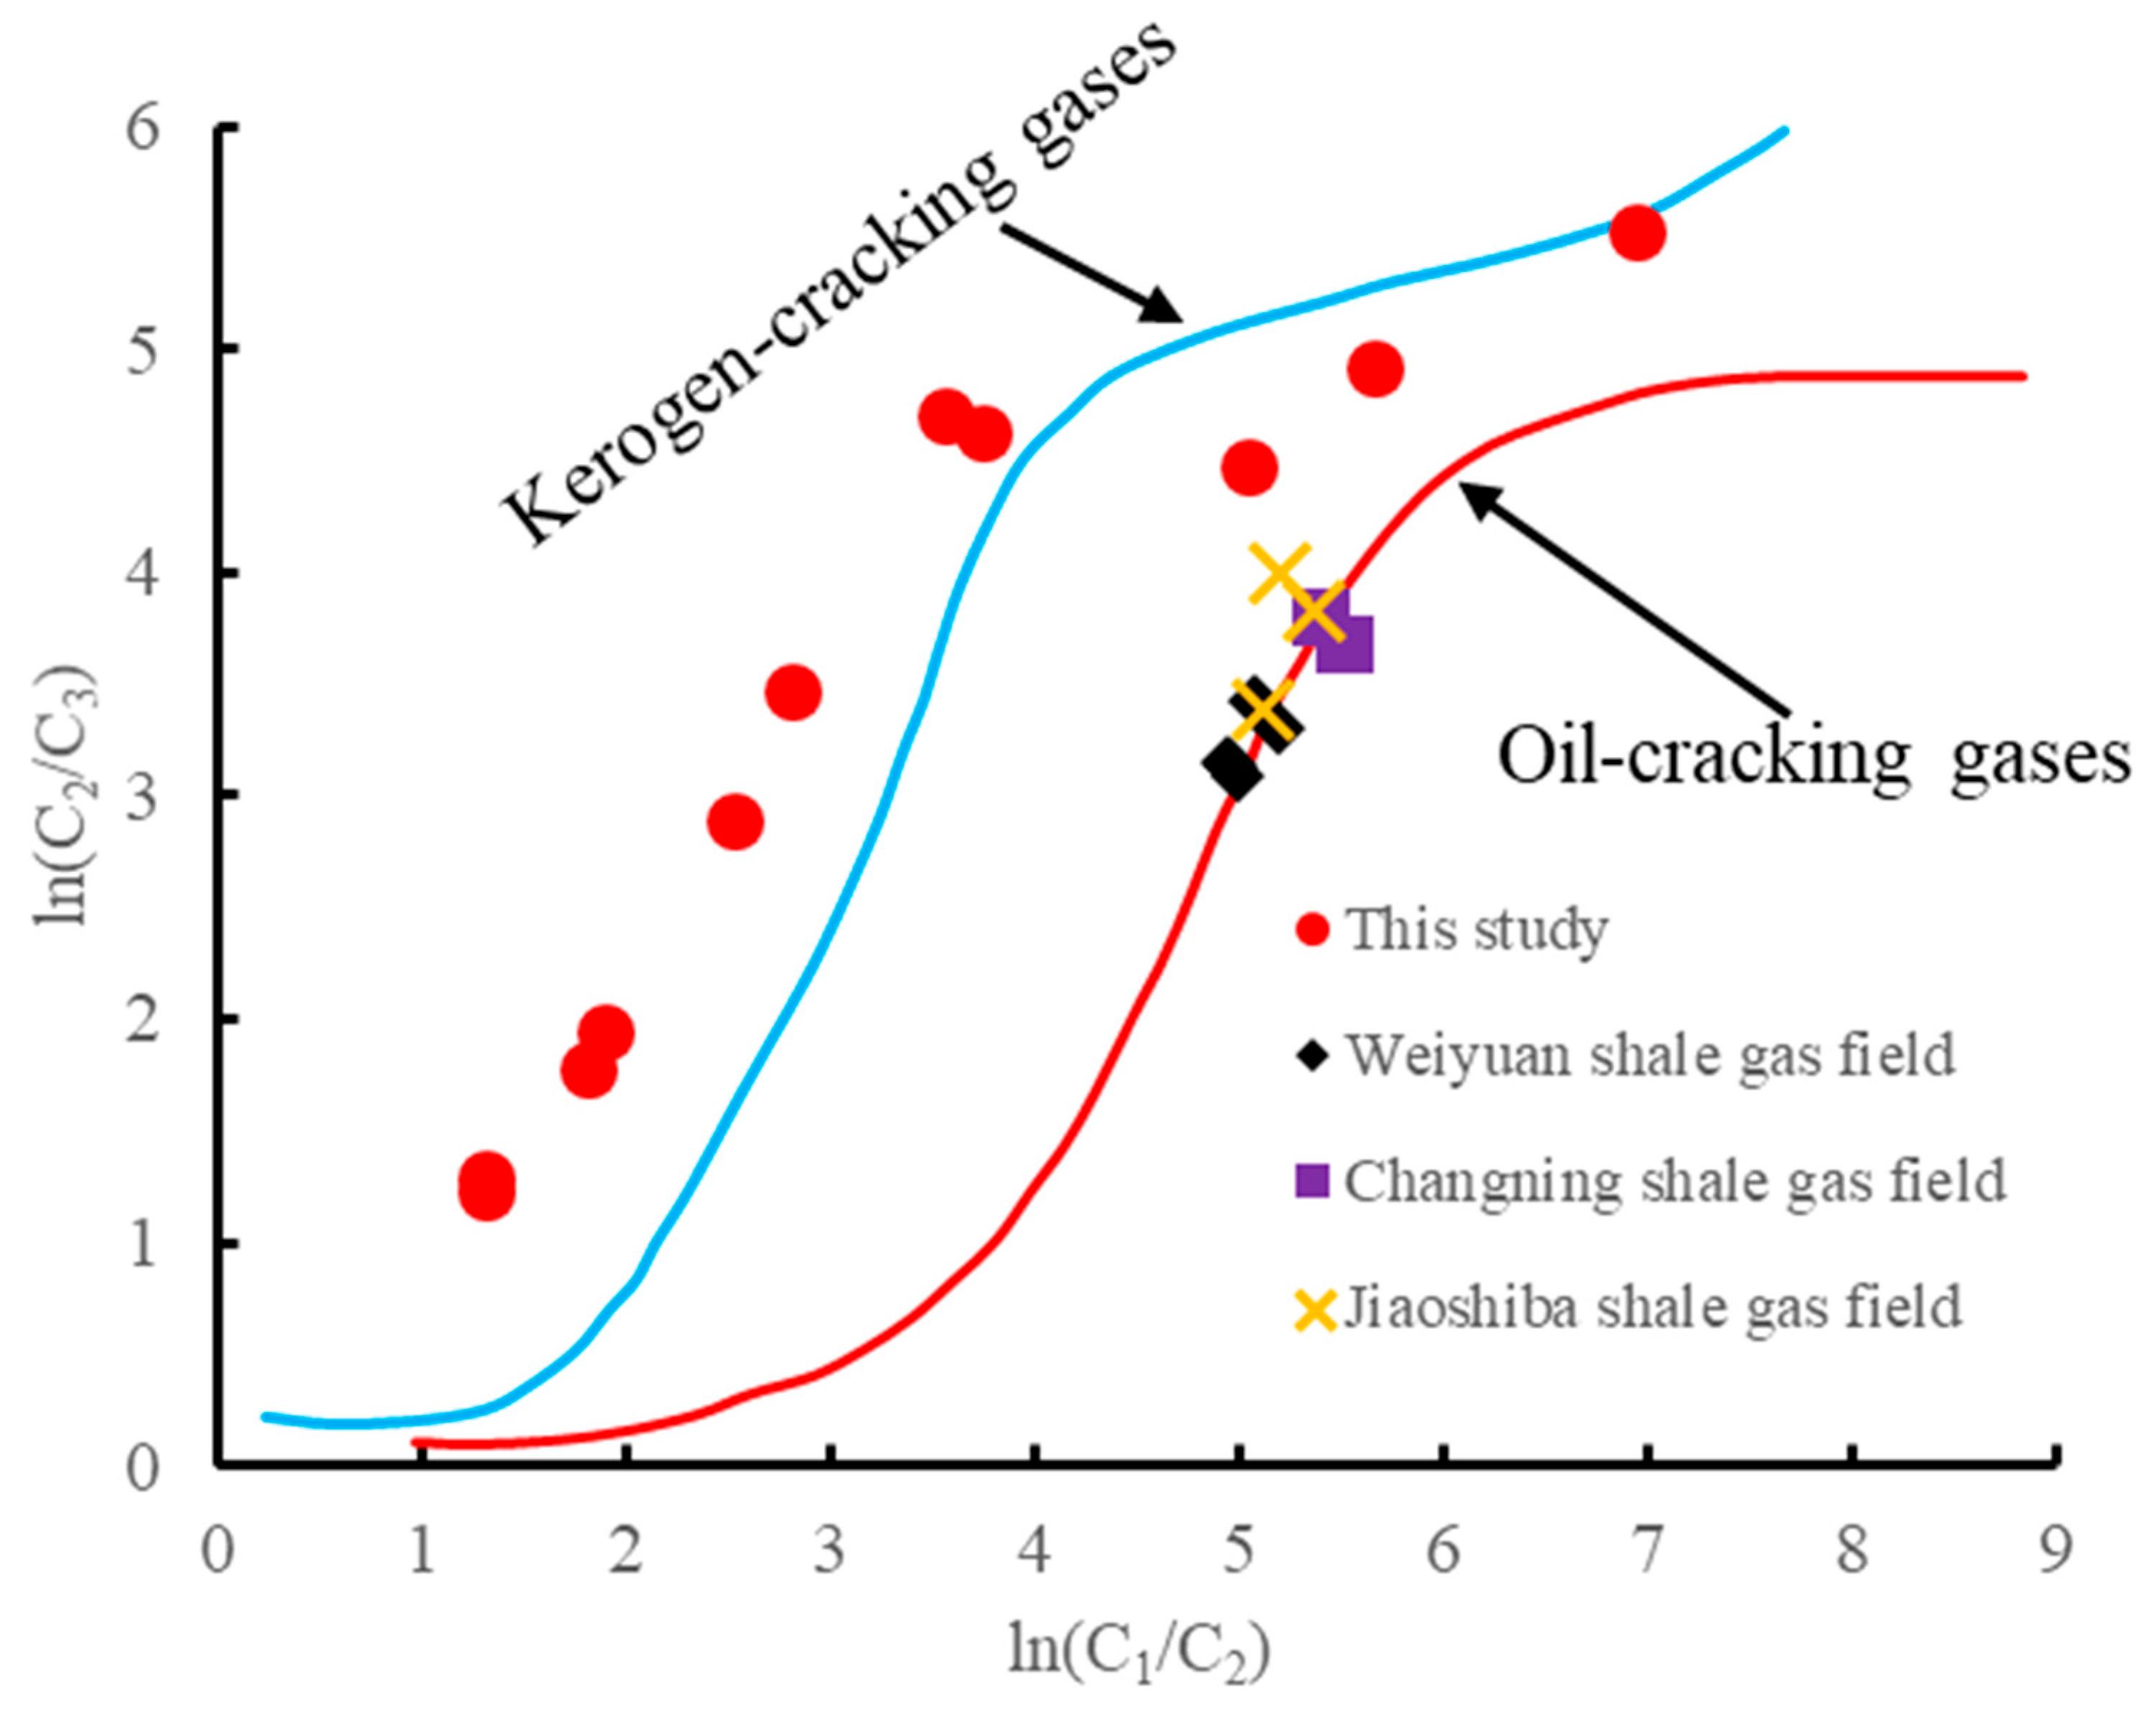
4.1. Origin of Gas
4.2. Gas Generation Model
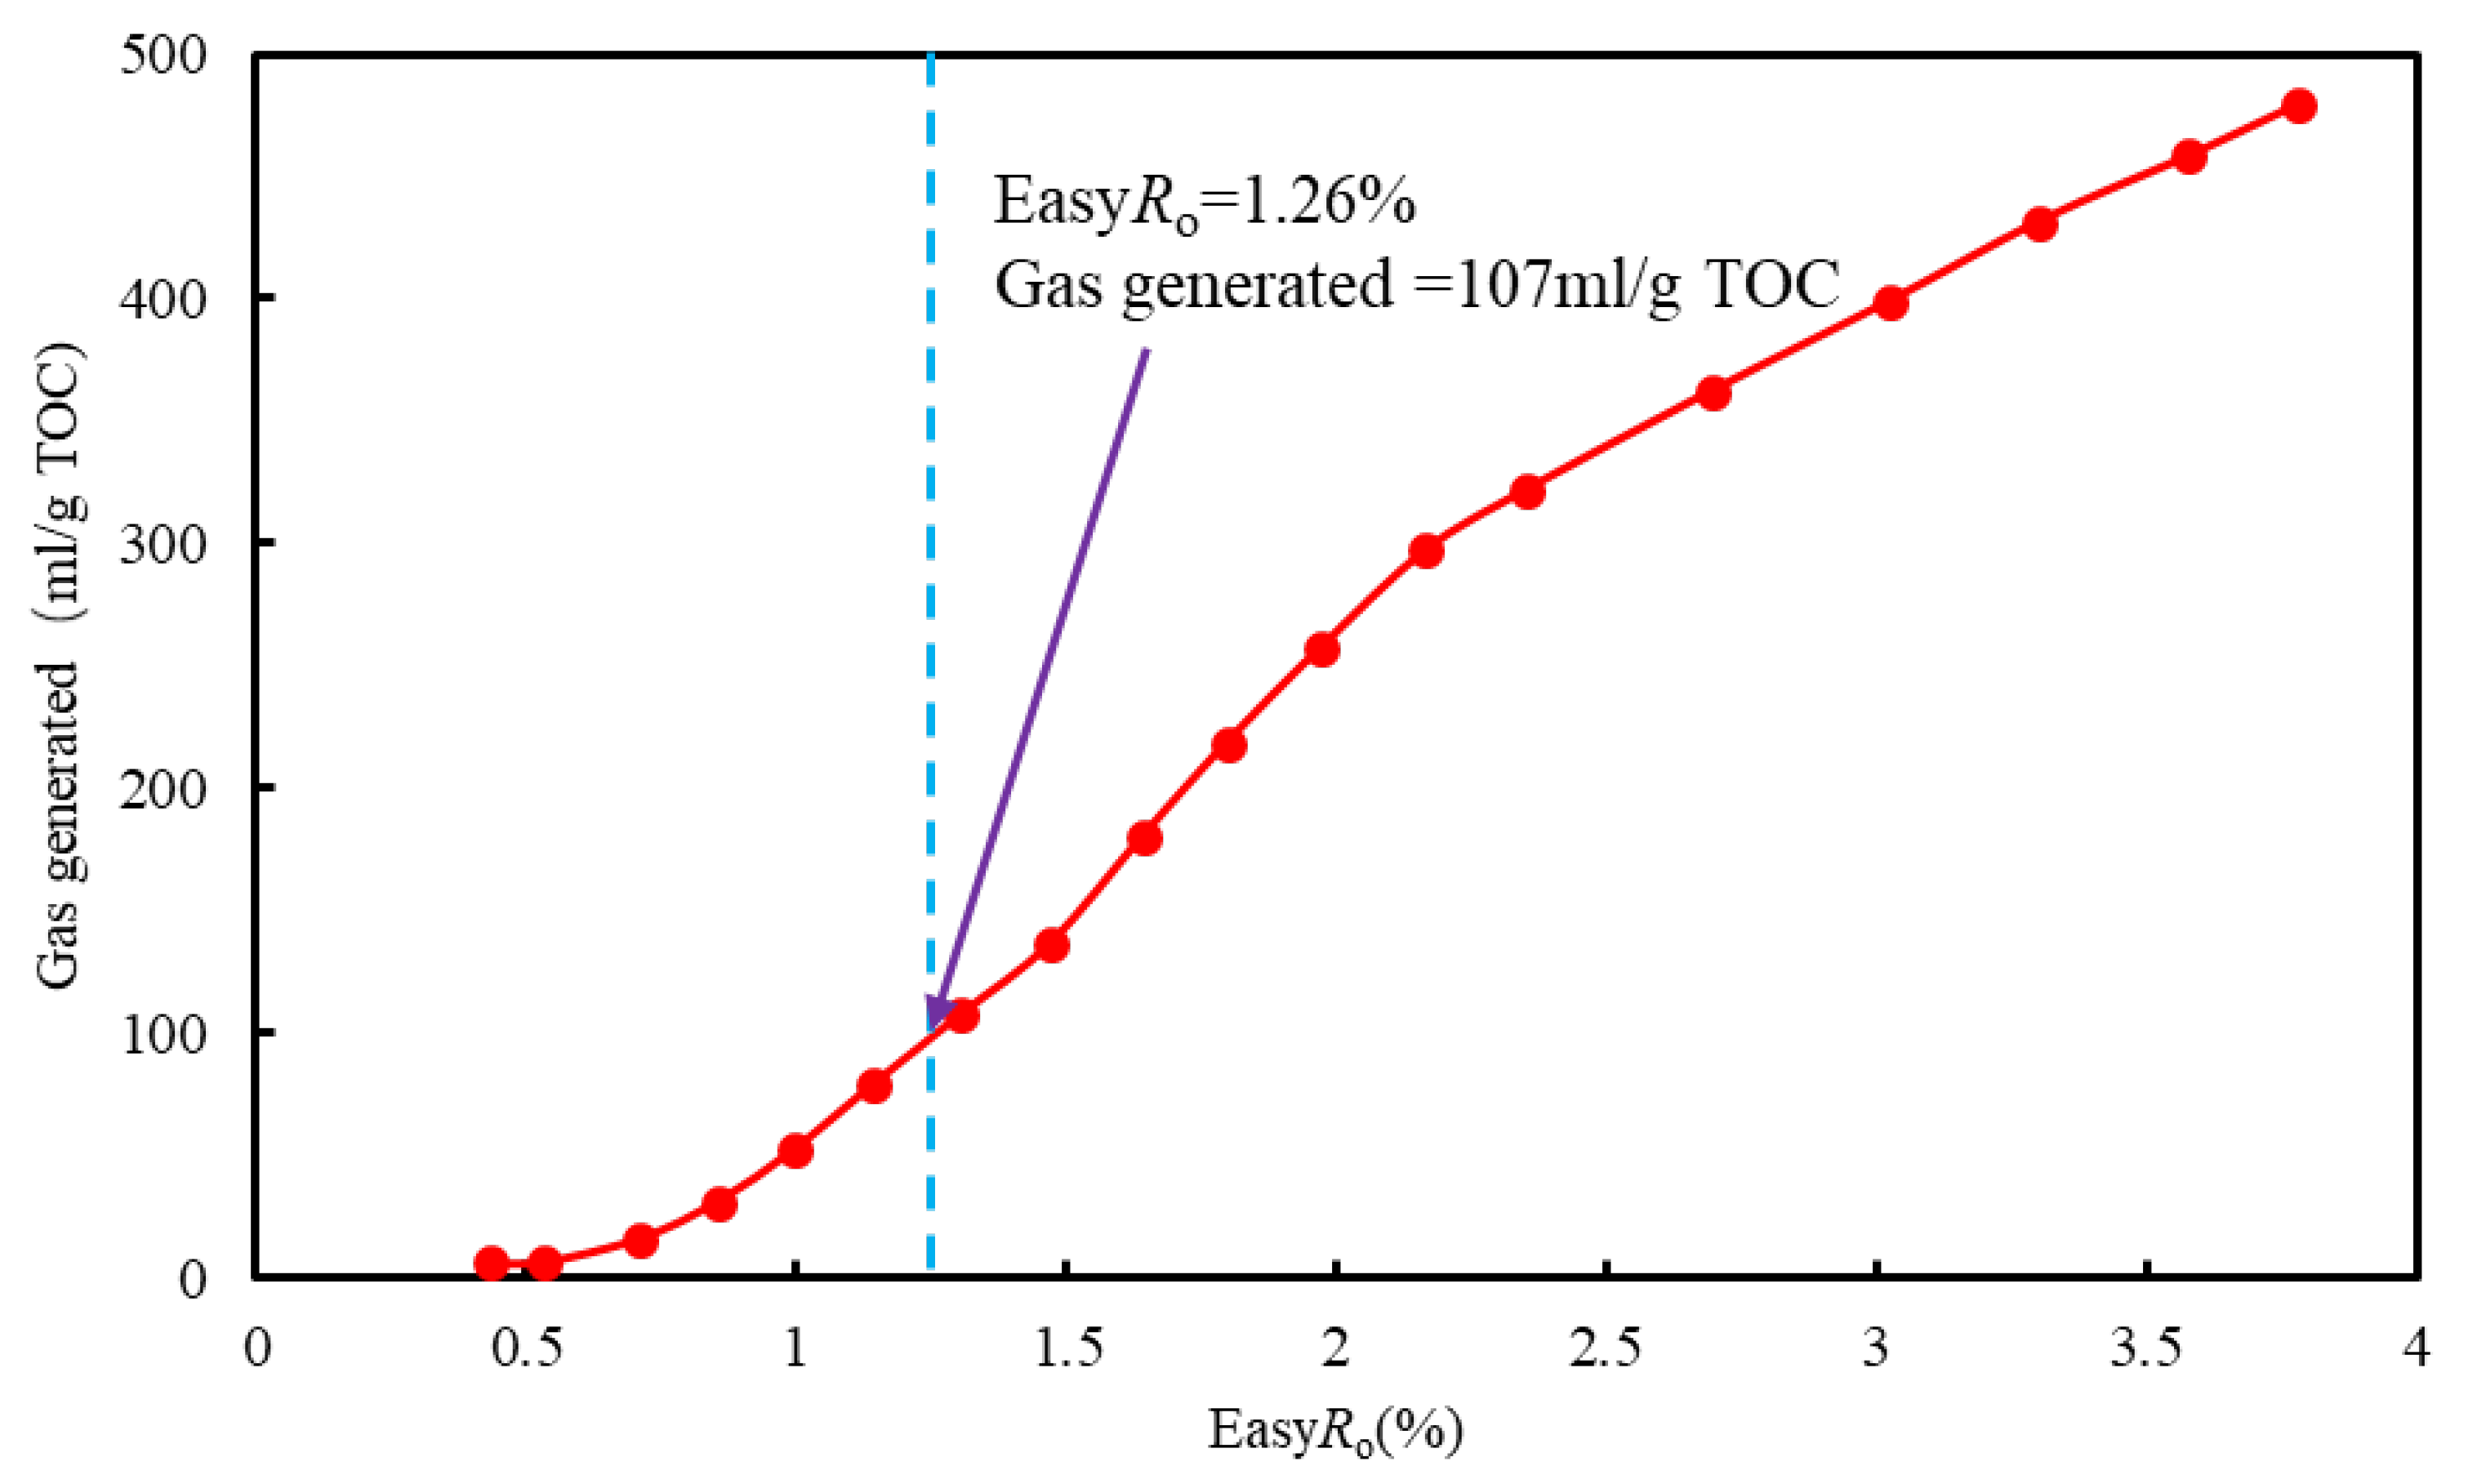
4.3. Application
5. Conclusions
- (1)
- The gases generated in our thermal simulations were mainly oil-type gases and kerogen-cracking gases.
- (2)
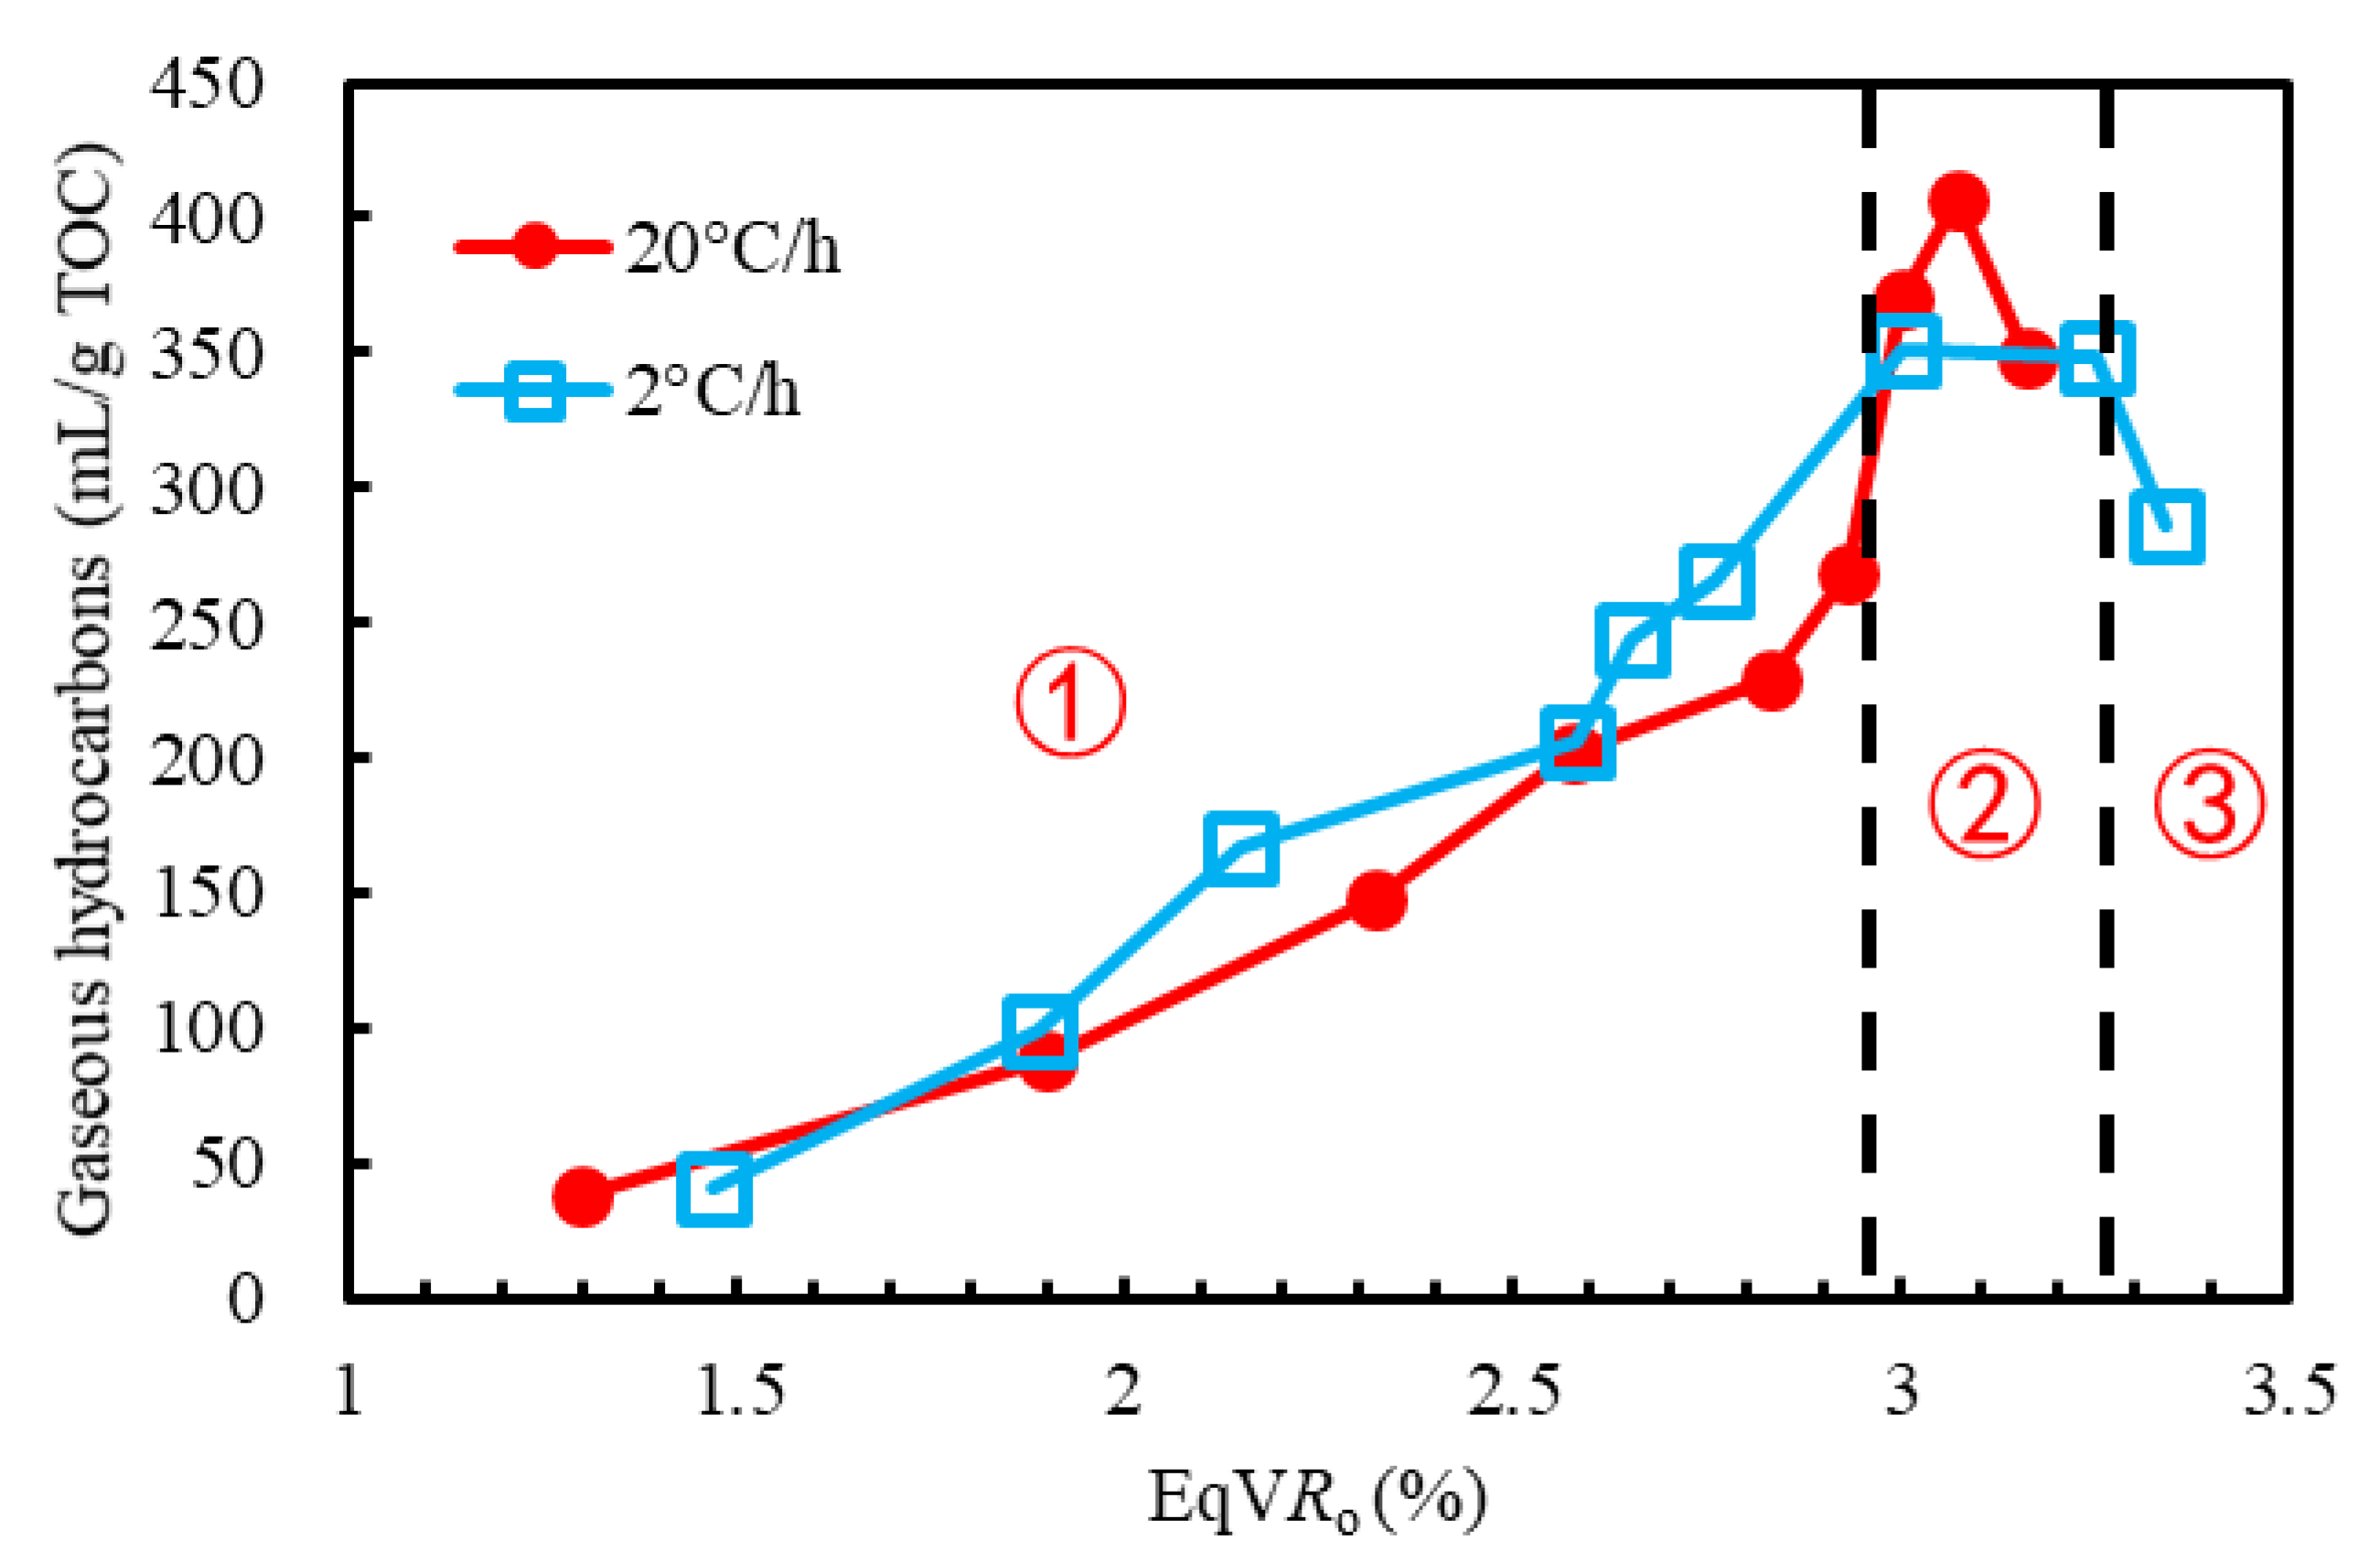
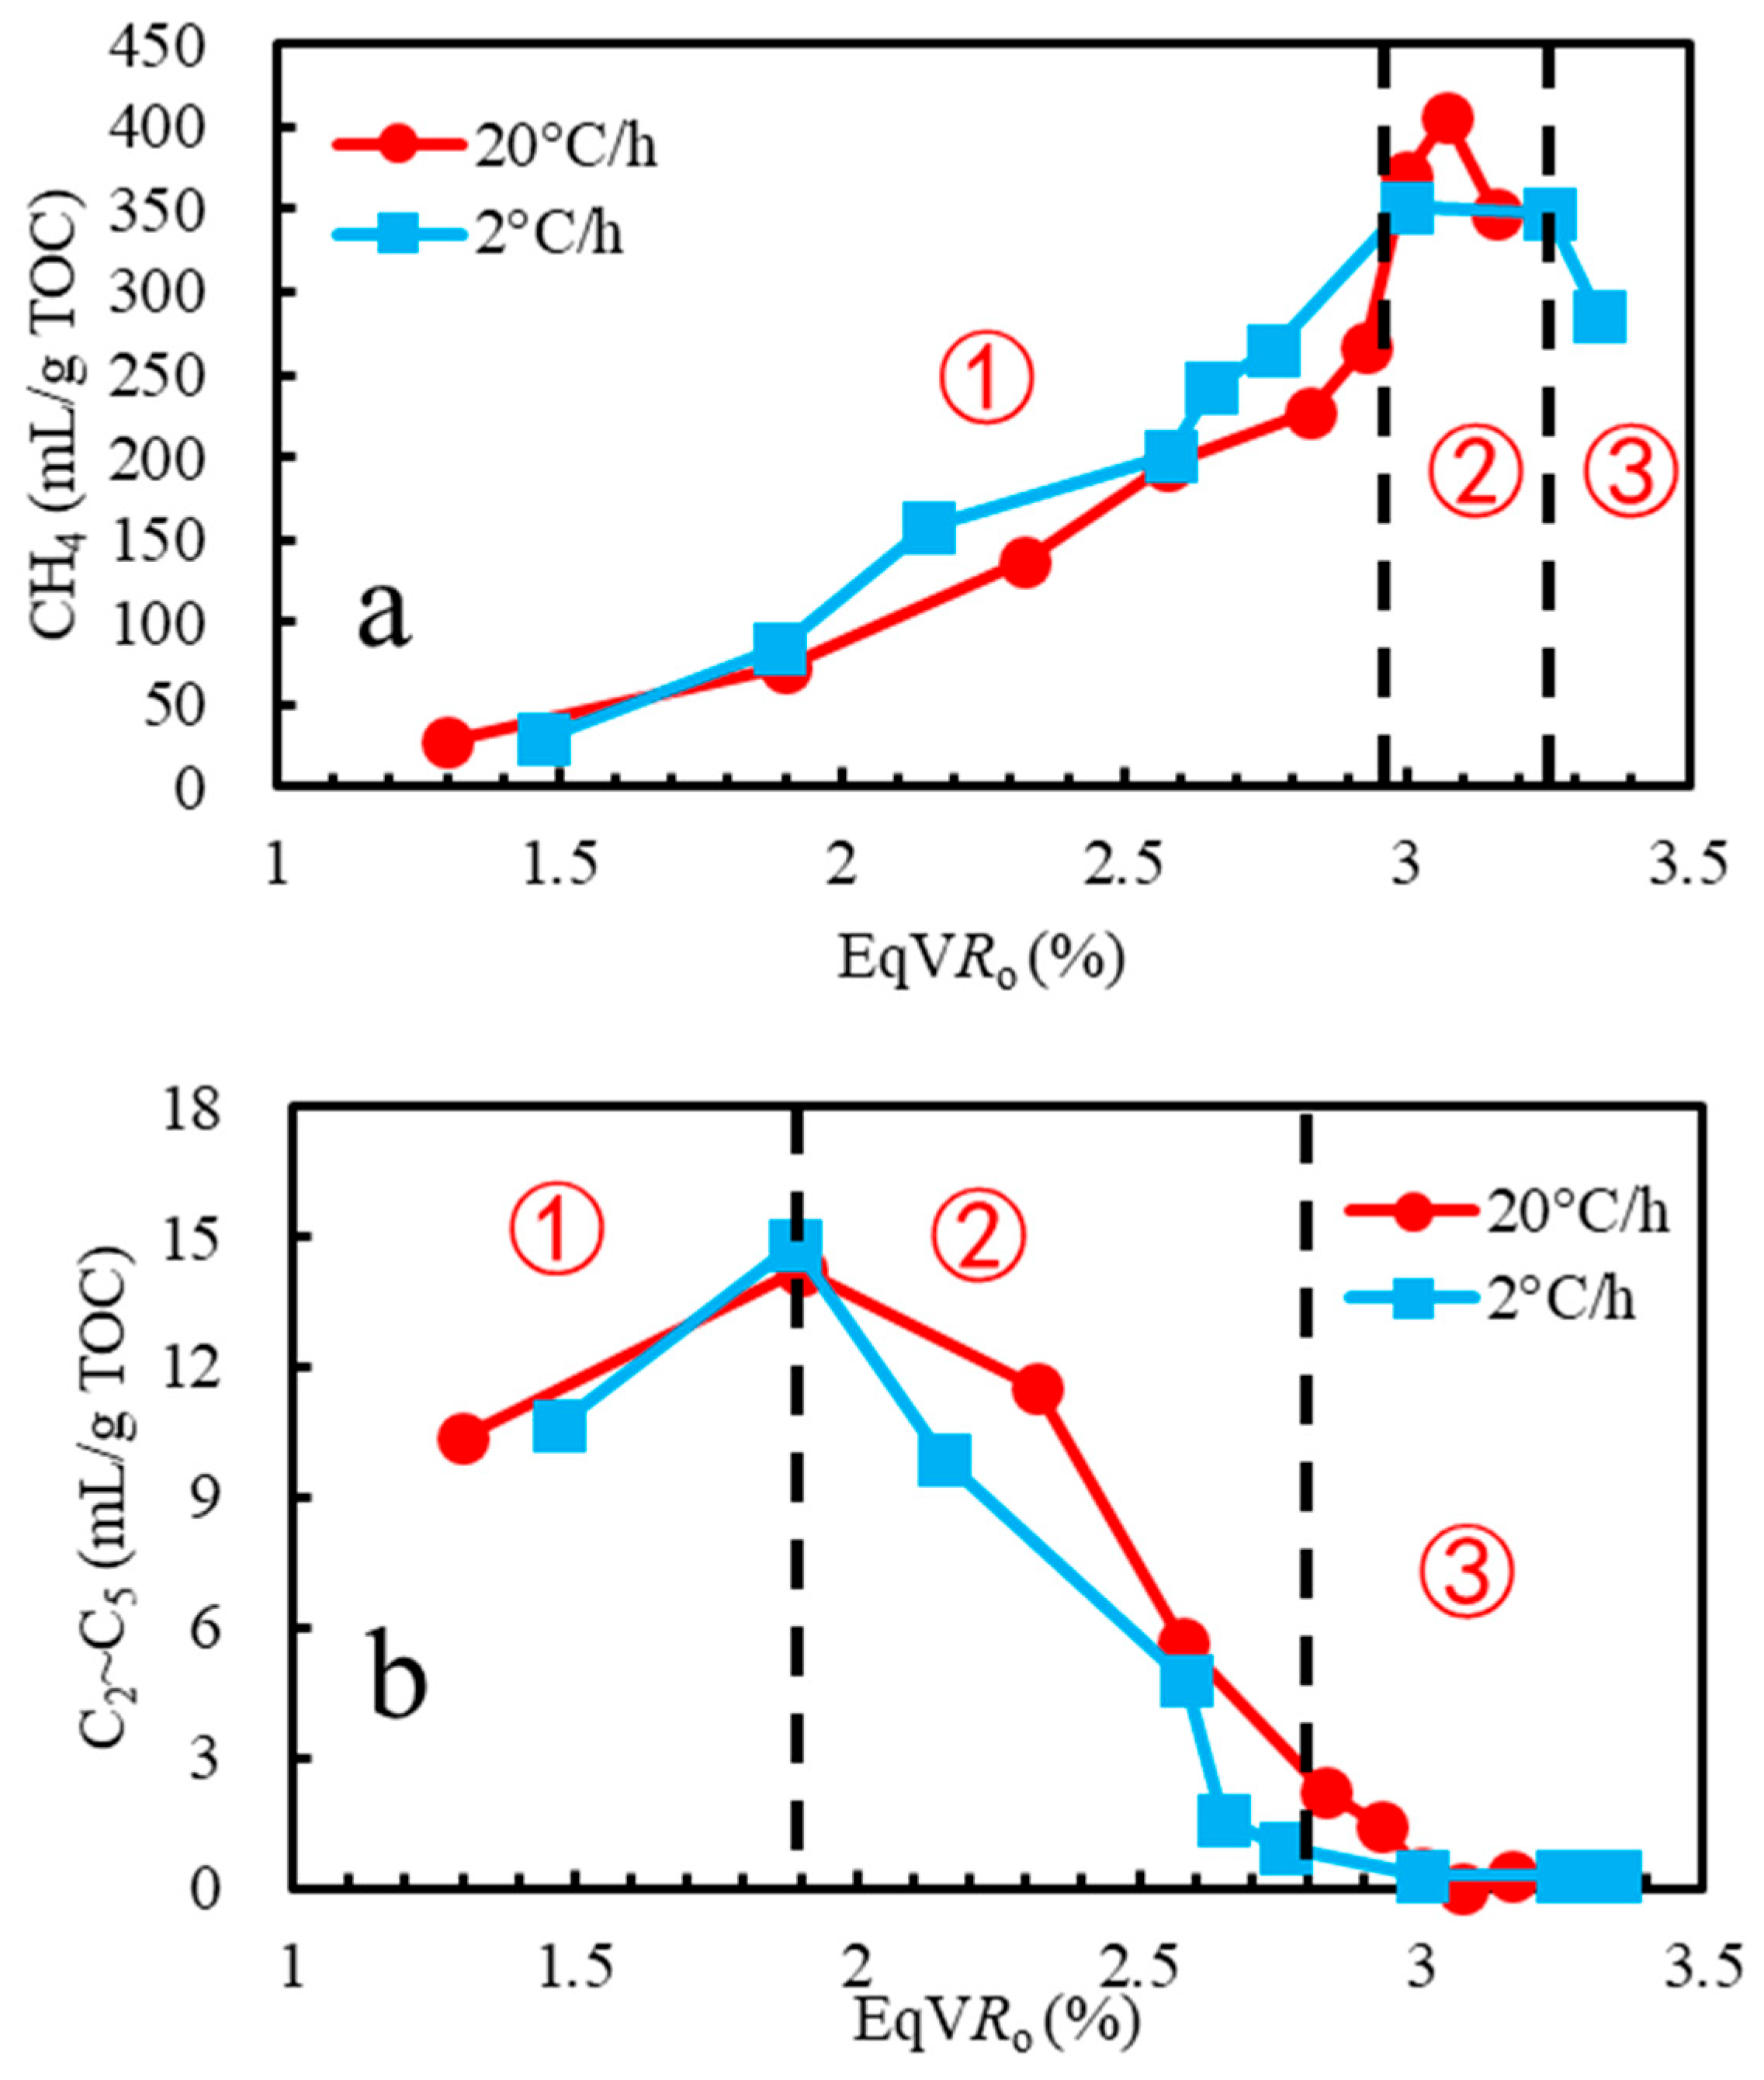
- The gas generation process of the Longmaxi shale included three stages: (a) the gases were generated quickly in the equivalent vitrinite reflectance (EqVRo) range of 0.5–3.0%; (b) the amount of gas generated was stable in the EqVRo range of 3.0–3.25%; and (c) the amount of gas generated decreased when EqVRo exceeded 3.25%.
- (3)
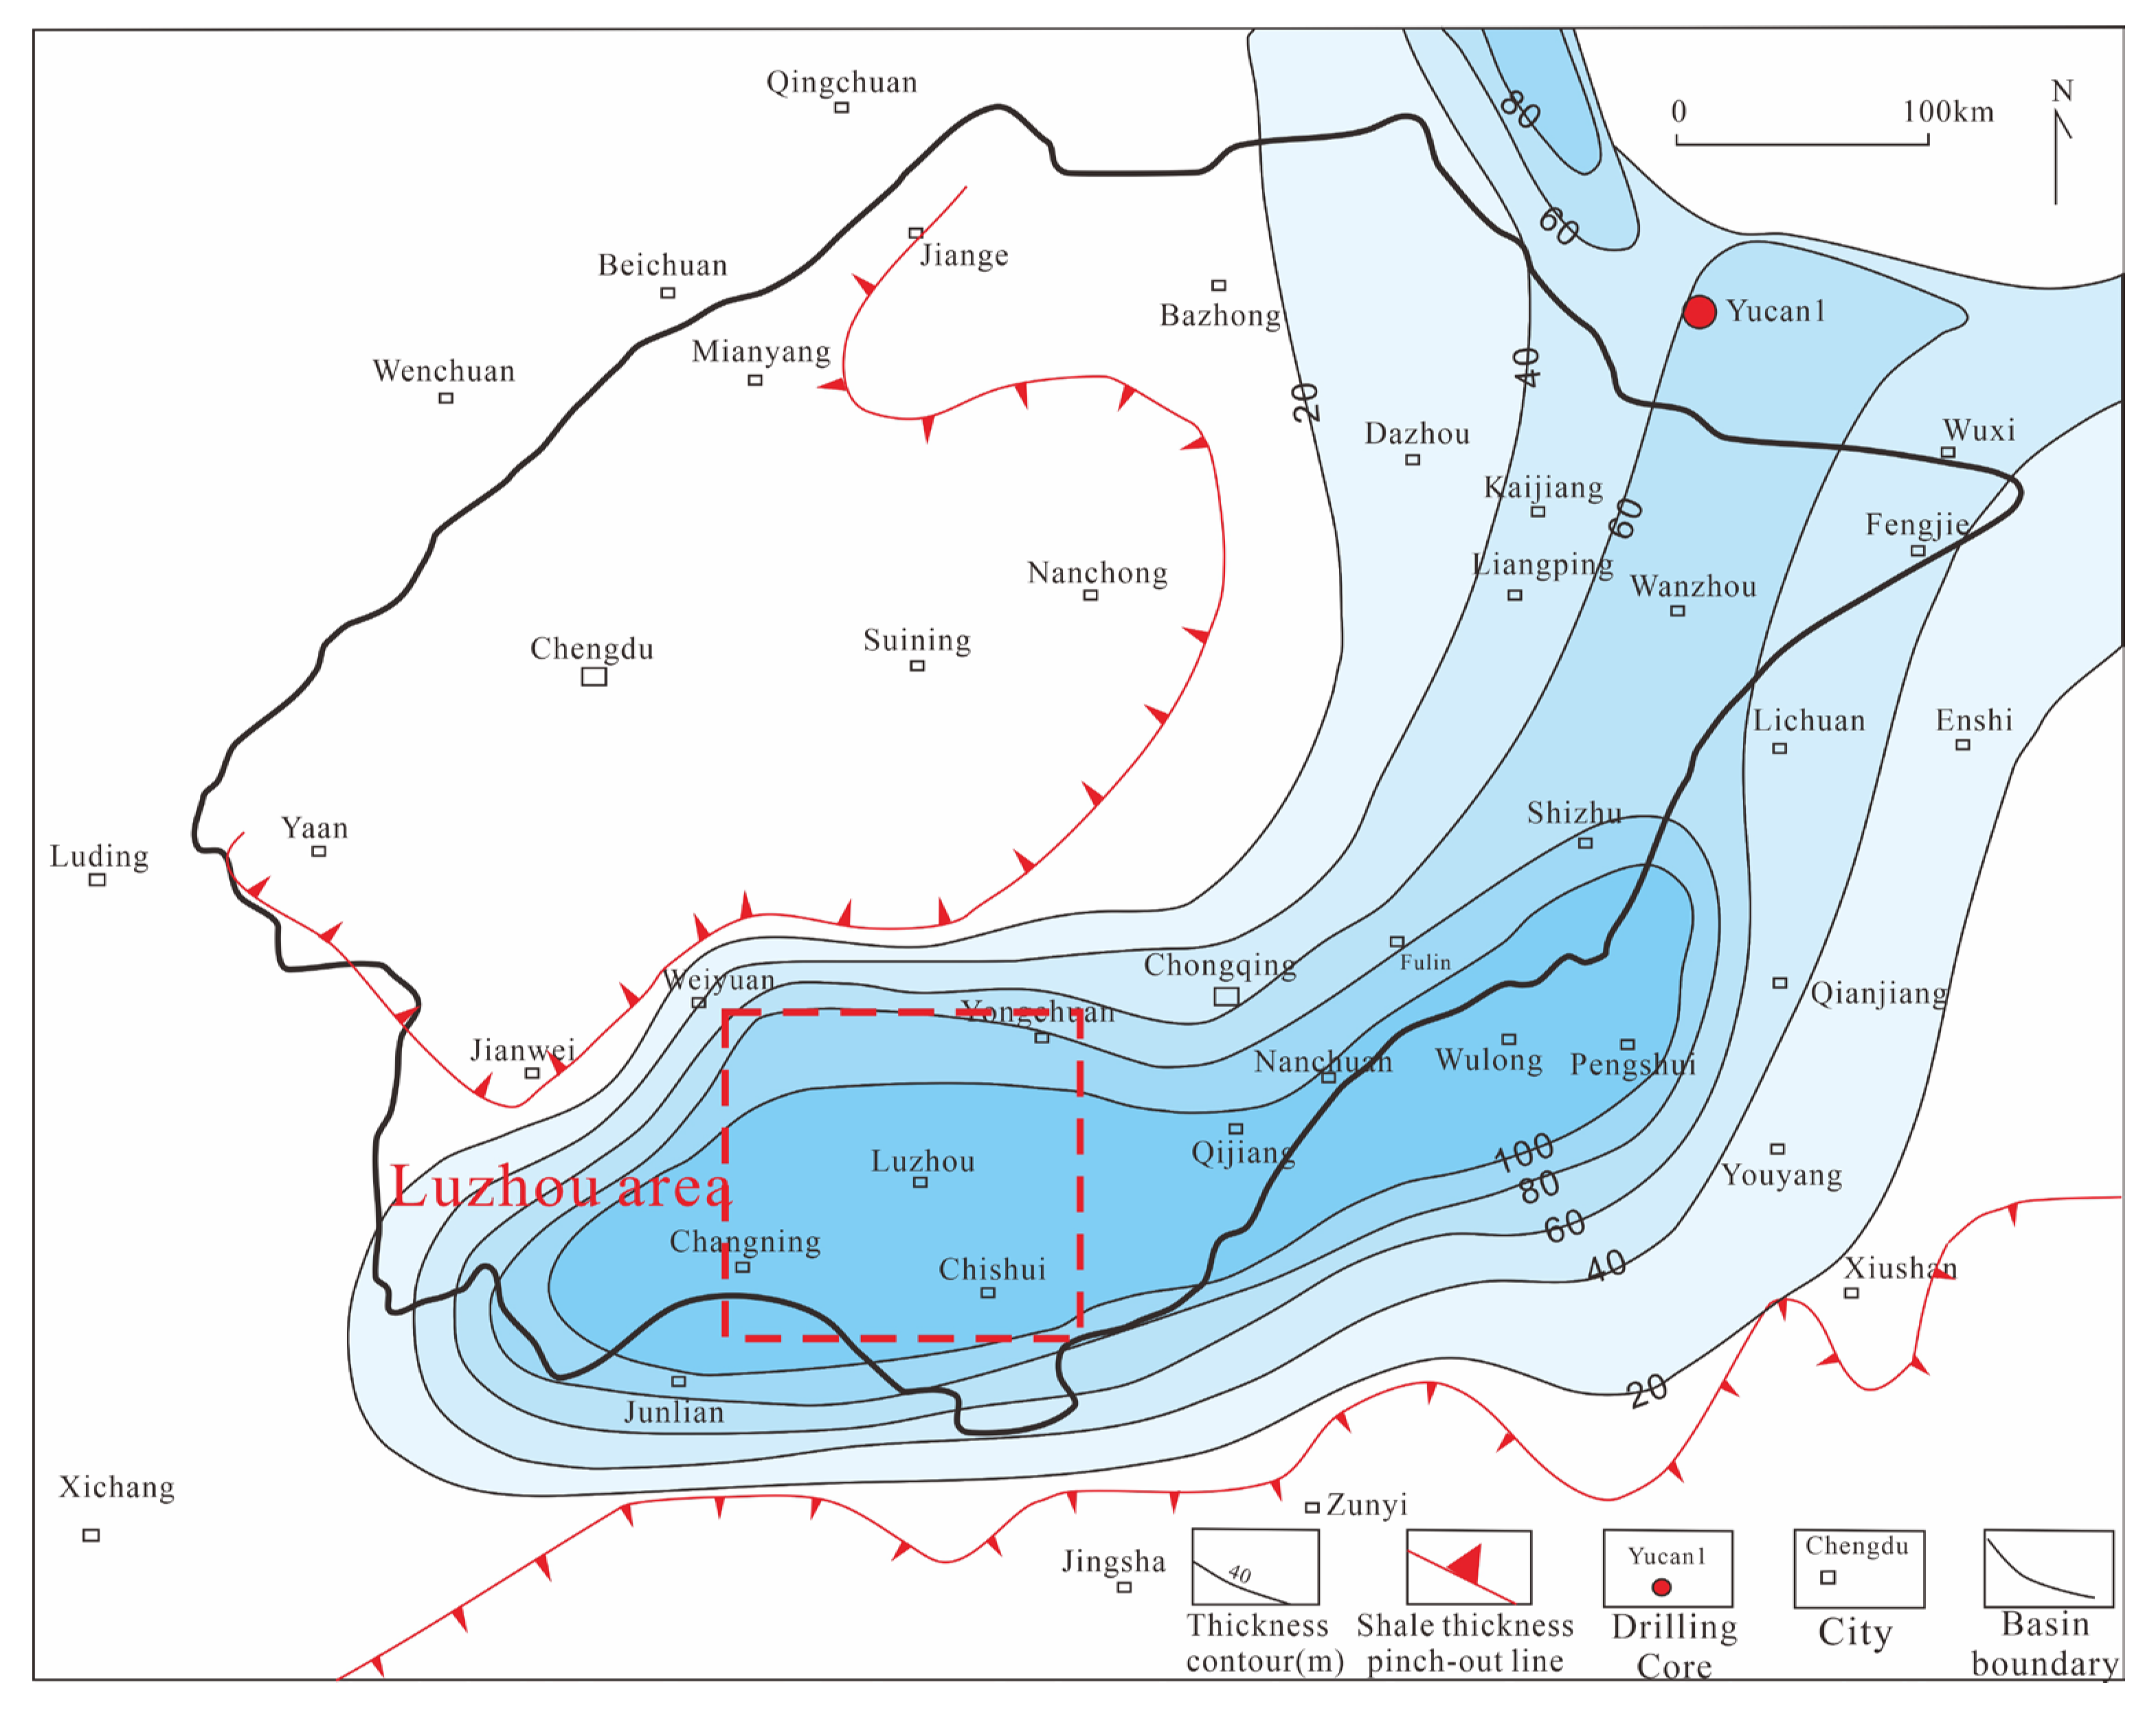
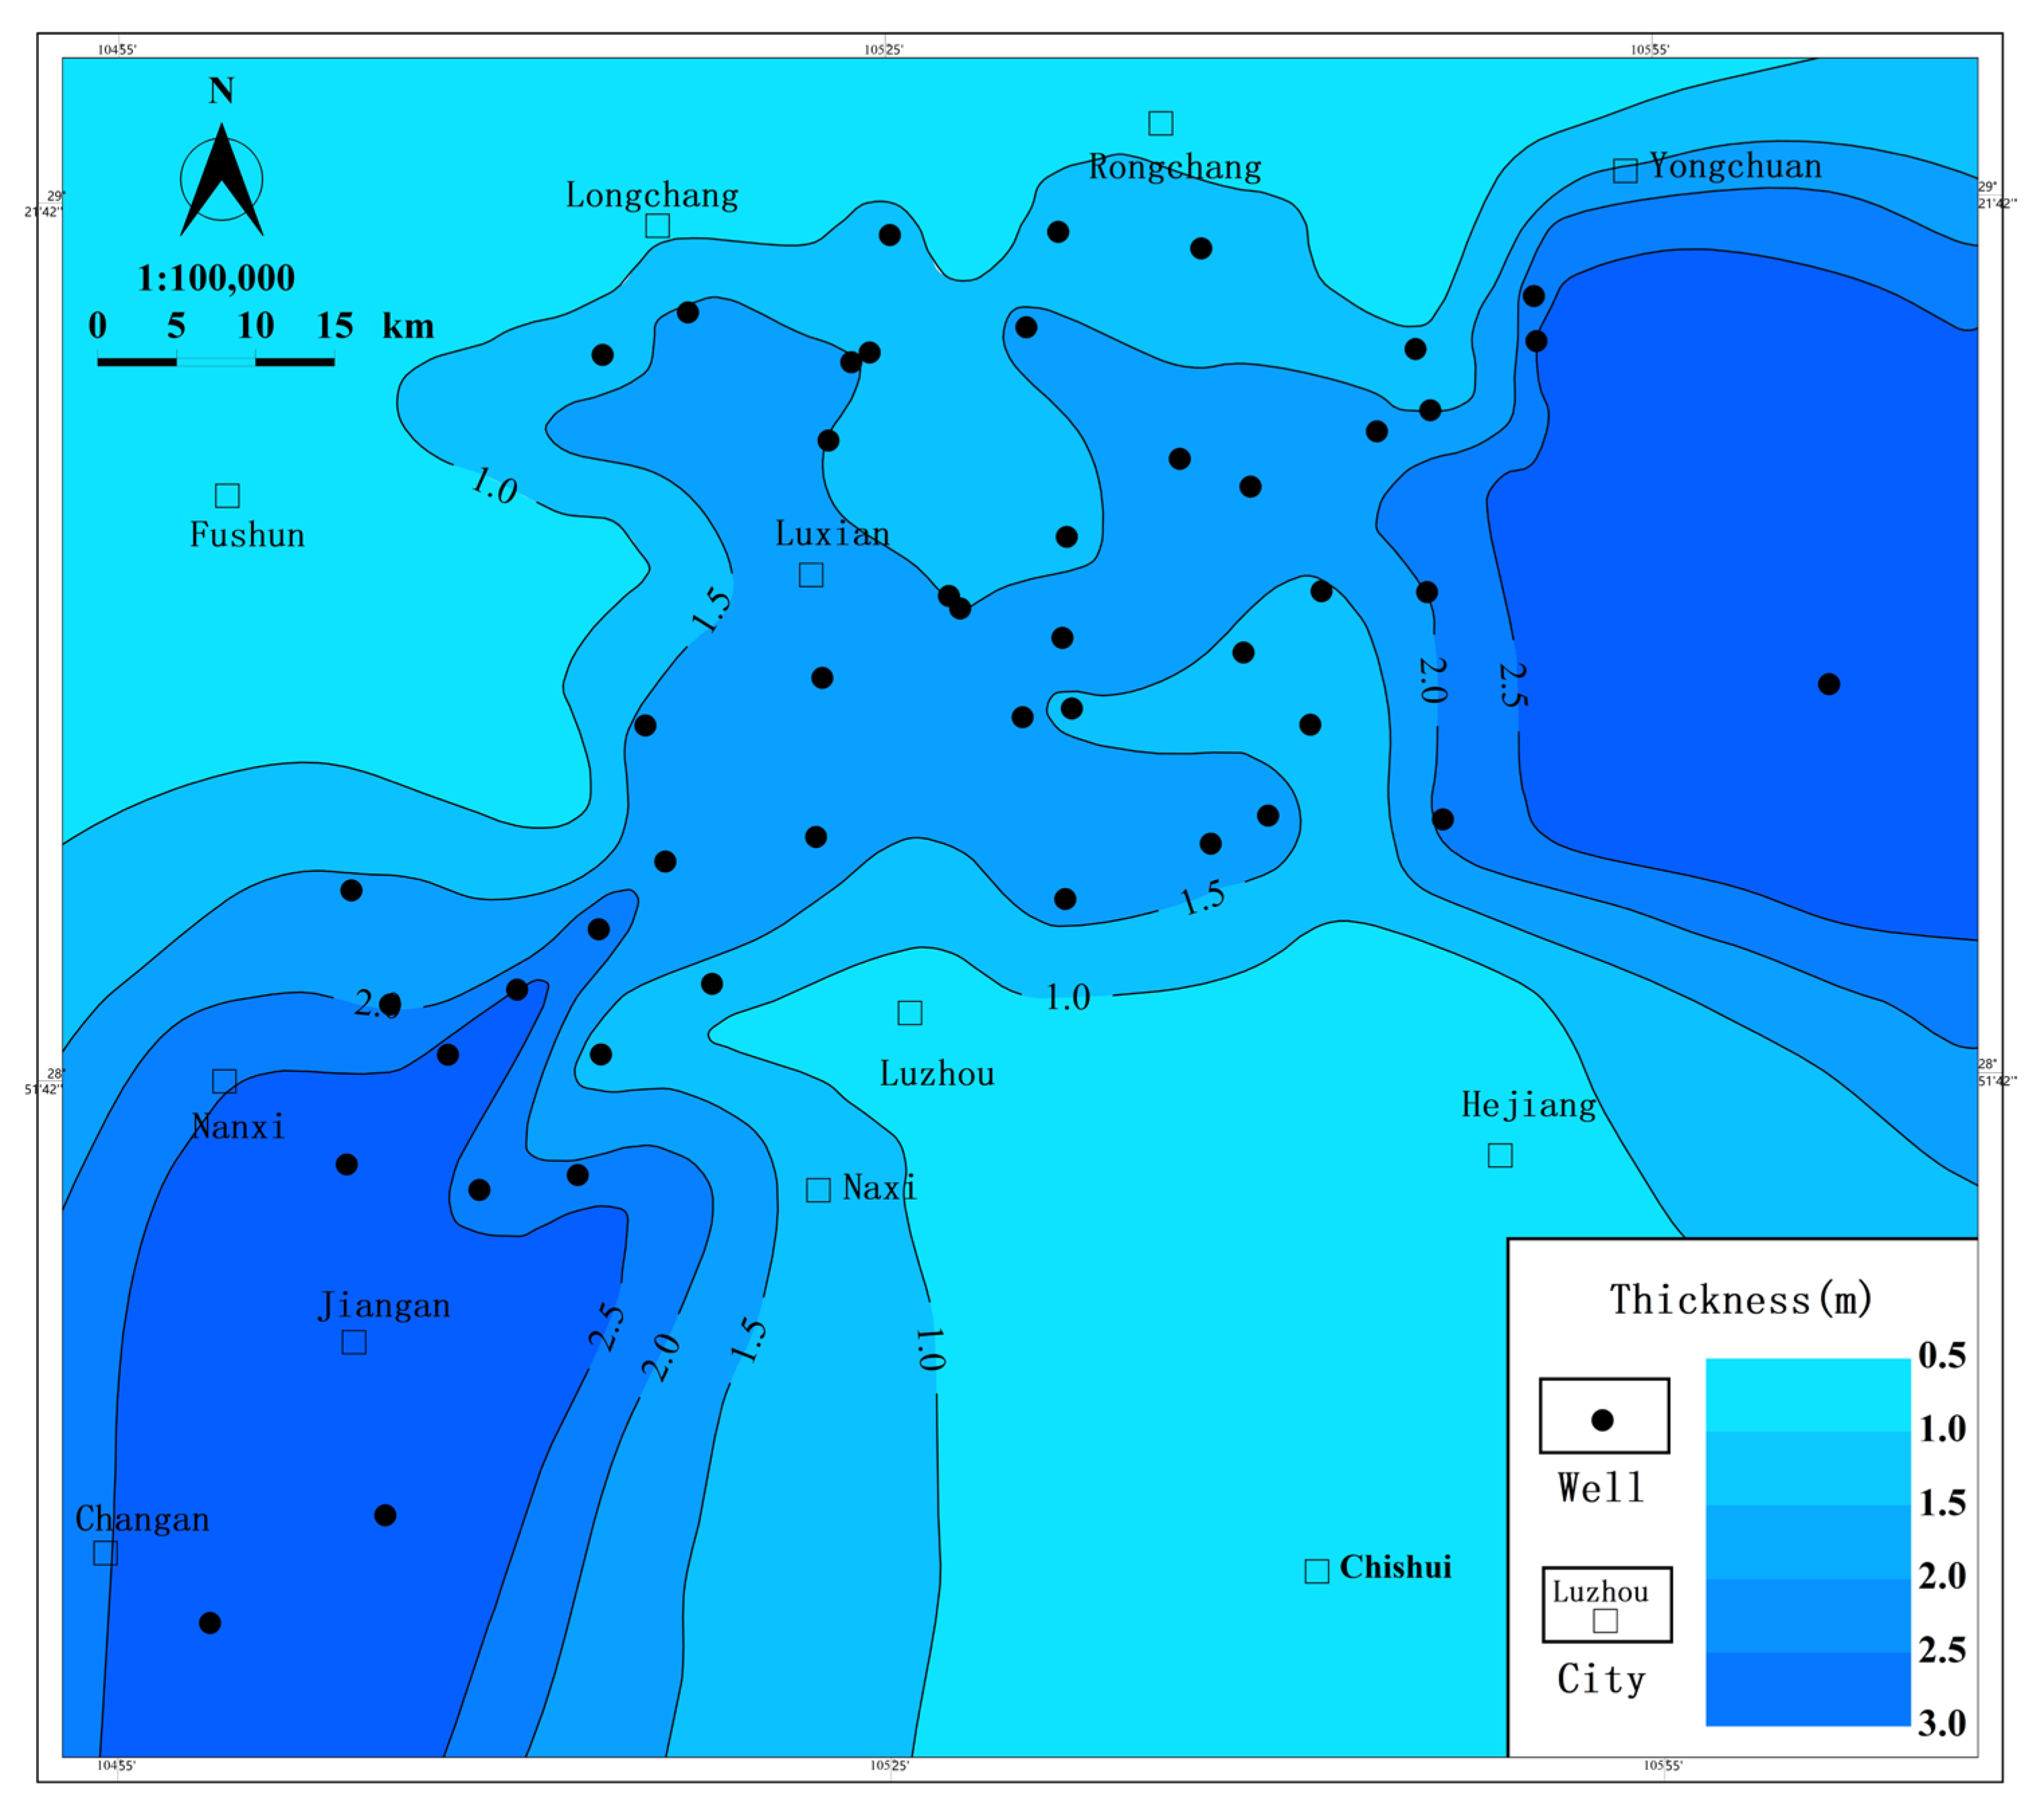
- The calculation results show that the total amount of gas generated in sub-layer 1 of Long11 in the Luzhou area was about 1.0 × 10¹² m3, and the gas generation intensities were in the range of 0.4 × 10⁸ m3/km2–1.6 × 108 m3/km2. In a comparison with the results obtained using other gas generation models, it was found that the accuracy of the gas generation estimation of the Longmaxi shale significantly improved.
Author Contributions
Funding
Data Availability Statement
Conflicts of Interest
References
- Tissot, B.P.; Welte, D.H. Petroleum Occurrence and Formation; Springer: Berlin, Germany, 1984; p. 699. [Google Scholar]
- Zhao, W.Z.; Wang, Z.Y.; Wang, H.J.; Li, Y.X.; Hu, G.Y.; Zhao, C.Y. Further discussion on the connotation and significance of the natural gas relaying generation model from organic materials. Pet. Explor. Dev. 2011, 38, 129–135. [Google Scholar] [CrossRef]
- Hill, R.J.; Zhang, E.; Katz, B.J.; Tang, Y. Modeling of gas generation from the Barnett Shale, Fort Worth Basin, Texas. AAPG Bull. 2007, 91, 501–521. [Google Scholar] [CrossRef]
- Ungerer, P. State of the art of research in kinetic modelling of oil formation and expulsion. Org. Geochem. 1990, 16, 1–25. [Google Scholar] [CrossRef]
- Pepper, A.S.; Corvi, P.J. Simple kinetic models of petroleum formation. Part I: Oil and gas generation from kerogen. Mar. Petrol. Geol. 1995, 12, 291–319. [Google Scholar] [CrossRef]
- Behar, F.; Vandenbroucke, M.; Tang, Y.; Marquis, F.; Espitalie, J. Thermal cracking of kerogen in open and closed systems: Determination of kinetic parameters and stoichiometric coefficients for oil and gas generation. Org. Geochem. 1997, 26, 321–339. [Google Scholar] [CrossRef]
- Lewan, M.D.; Winters, J.C.; McDonald, J.H. Generation of oil-like pyrolyzates from organic-rich shales. Science 1979, 203, 897–899. [Google Scholar] [CrossRef] [PubMed]
- Behar, F.; Kressmann, S.; Rudkiewicz, J.L.; Vandenbroucke, M. Experimental simulation in a confined system and kinetic modeling of kerogen and oil cracking. Org. Geochem. 1992, 19, 173–189. [Google Scholar] [CrossRef]
- Li, Y.; Zhang, J.L.; Xu, Y.H.; Chen, T.; Liu, J.S. Improved understanding of the origin and accumulation of hydrocarbons from multiple source rocks in the Lishui Sag: Insights from statistical methods, gold tube pyrolysis and basin modeling. Mar. Petrol. Geol. 2021, 134, 105361. [Google Scholar] [CrossRef]
- Liu, J.L.; Yang, X.Z.; Liu, K.Y.; Xu, Z.P.; Jia, K.; Zhou, L.; Wei, H.X.; Zhang, L.; Wu, S.J.; Wei, X.Z. Differential hydrocarbon generation and evolution of typical terrestrial gas-prone source rocks: An example from the Kuqa foreland basin, NW China. Mar. Petrol. Geol. 2023, 152, 106225. [Google Scholar] [CrossRef]
- Tannenbaum, E.; Huizinga, B.J.; Kaplan, I.R. Role of minerals in thermal alteration of organic matter. Part II: A material balance. AAPG Bull. 1986, 70, 1156–1165. [Google Scholar]
- Chen, Z.H.; Guo, Q.L.; Jiang, C.Q.; Liu, X.J.; Reyes, J.; Mort, A.; Jia, Z.K. Source rock characteristics and Rock-Eval-based hydrocarbon generation kinetic models of the lacustrine Chang-7 Shale of Triassic Yanchang Formation, Ordos Basin, China. Int. J. Coal Geol. 2017, 182, 53–65. [Google Scholar] [CrossRef]
- Wu, Y.; Zhang, Z.; Sun, L.; Li, Y.; Su, L.; Li, X.; Xu, H.; Tu, Y. The effect of pressure and hydrocarbon expulsion on hydrocarbon generation during pyrolyzing of continental type-III kerogen source rocks. J. Pet. Sci. Eng. 2018, 170, 958–966. [Google Scholar] [CrossRef]
- Gai, H.F.; Tian, H.; Xiao, X.M. Late gas generation potential for different types of shale source rocks: Implications from pyrolysis experiments. Int. J. Coal Geol. 2018, 193, 16–29. [Google Scholar] [CrossRef]
- Lewan, M.D. Experiments on the role of water in petroleum formation. Geochem. Cosmochim. Acta 1997, 61, 3691–3723. [Google Scholar] [CrossRef]
- Burnham, A.K. Comment on “Experiments on the role of water in petroleum formation” by M.D. Lewan. Geochem. Cosmochim. Acta 1998, 62, 2207–2210. [Google Scholar]
- Stainforth, J.G. Practical kinetic modeling of petroleum generation and expulsion. Mar. Petrol. Geol. 2009, 26, 552–572. [Google Scholar] [CrossRef]
- Saxby, J.D.; Riley, K.W. Petroleum generation by laboratory-scale pyrolysis over six years simulating conditions in a subsiding basin. Nature 1984, 308, 177–179. [Google Scholar] [CrossRef]
- Weller, S.; Pelipetz, M.G.; Friedman, S. Kinetics of coal hydrogenation: Conversion of anthraxylon. Ind. Eng. Chem. 1951, 43, 1575–1579. [Google Scholar] [CrossRef]
- Cheng, P.; Xiao, X.M.; Wang, X.; Sun, J.; Wei, Q. Evolution of water content in organic-rich shales with increasing maturity and its controlling factors: Implications from a pyrolysis experiment on a water-saturated shale core sample. Mar. Petrol. Geol. 2019, 109, 291–303. [Google Scholar] [CrossRef]
- Nie, H.K.; Jin, Z.J.; Li, P.; Katz, B.J.; Dang, W.; Liu, Q.Y.; Ding, J.H.; Jiang, S.; Li, D.H. Deep shale gas in the Ordovician-Silurian Wufeng-Longmaxi formations of the Sichuan Basin, SW China: Insights from reservoir characteristics, preservation conditions and development strategies. J. Asian Earth Sci. 2023, 244, 105521. [Google Scholar] [CrossRef]
- Wang, Y.; Qiu, N.; Borjigin, T.; Shen, B.; Xie, X.; Ma, Z.; Lu, C.; Yang, Y.; Yang, L.; Cheng, L.; et al. Integrated assessment of thermal maturity of the Upper Ordovician–Lower Silurian Wufeng–Longmaxi shale in Sichuan Basin, China. Mar. Petrol. Geol. 2019, 100, 447–465. [Google Scholar] [CrossRef]
- Horsfield, B.; Zou, C.N.; Li, J.; Yang, S.Y.; Mahlstedt, N.; Misch, D.; Gross, D.; Ma, W.; Wang, Y.F.; Tan, J.Q. Prediction of the gas-generating characteristics of the Qiongzhusi and Longmaxi Formations, Yangtze Platform, southern China, using analogues. AAPG Bull. 2021, 105, 945–985. [Google Scholar] [CrossRef]
- Luo, Q.Y.; Hao, J.Y.; Skovsted, C.B.; Luo, P.; Khan, I.; Wu, J.; Zhong, N.N. The organic petrology of graptolites and maturity assessment of the Wufeng-Longmaxi Formations from Chongqing, China: Insights from reflectance cross-plot analysis. Int. J. Coal Geol. 2017, 183, 161–173. [Google Scholar] [CrossRef]
- Liu, Y.; Li, C.; Algeo, T.; Fan, J.; Peng, P. Global and regional controls on marine redox changes across the Ordovician-Silurian boundary in South China. Palaeogeogr. Palaeoclimatol. Palaeoecol. 2016, 463, 180–191. [Google Scholar] [CrossRef]
- Zhang, Z.B.; Guo, Y.H.; Zheng, W.Q.; Zeng, C.L.; Li, Y.; Zhao, D.P.; Zhang, J.M. Geochemical characteristics and organic matter enrichment model of Wufeng-Longmaxi formations shale in northeast Sichuan China. Coal Sci. Technol. 2024, 52, 124–138, (In Chinese with English abstract). [Google Scholar]
- Han, H.; He, C.C.; Xiao, S.Q.; Chen, J.T.; Kalmykov, A.; Wu, W.J.; Wang, Y.X.; Wang, J. The Formation of organic matter pores in shales: Implications from combined thermal heating and scanning electron microscopy imaging. Minerals 2025, 15, 336. [Google Scholar] [CrossRef]
- Liu, D.H.; Xiao, X.M.; Tian, H.; Min, Y.S.; Zhou, Q.; Cheng, P.; Shen, J.G. Sample maturation calculated using Raman spectroscopic parameters for solid organics: Methodology and geological applications. Chin. Sci. Bull. 2013, 58, 1285–1298. [Google Scholar] [CrossRef]
- ISO 7404-2:2009; Methods for the Petrographic Analysis of Coals-Part 2: Methods of Preparing Coal Samples. International Organization for Standardization: Geneva, Switzerland, 2009.
- ASTM D7708-14; Standard Test Method for Microscopical Determination of the Reflectance of Vitrinite Dispersed in Sedimentary Rocks. ASTM International: West Conshohocken, PA, USA, 2014. Available online: www.astm.org (accessed on 1 May 2014).
- Sweeney, J.J.; Burnham, A.K. Evaluation of a simple model of vitrinite reflectance based on chemical kinetics. AAPG Bull. 1990, 74, 1559–1570. [Google Scholar] [CrossRef]
- Wang, Z.X.; Wang, Y.L.; Wu, B.X.; Wang, G.; Sun, Z.P.; Xu, L.; Zhu, S.Z.; Sun, L.N.; Wei, Z.F. Hydrocarbon gas generation from pyrolysis of extracts and residues of low maturity solid bitumens from the Sichuan Basin, China. Org. Geochem. 2017, 103, 51–62. [Google Scholar] [CrossRef]
- Jacob, H. Classification, structure, genesis and practical importance of natural solid oil bitumen (“migrabitumen”). Int. J. Coal Geol. 1989, 11, 65–79. [Google Scholar] [CrossRef]
- Dai, J.X. Identification of various alkane gases. Sci. China Ser. B Chem. Life Sci. Earth Sci. 1992, 22, 185–193, (In Chinese with English abstract). [Google Scholar]
- Dai, J.X.; Zou, C.N.; Dong, D.Z.; Ni, Y.Y.; Wu, W.; Gong, D.Y.; Wang, Y.M.; Huang, S.P.; Huang, J.L.; Fang, C.C.; et al. Geochemical characteristics of marine and terrestrial shale gas in China. Mar. Petrol. Geol. 2016, 76, 444–463. [Google Scholar] [CrossRef]
- Li, J.; Li, Z.S.; Wang, X.B.; Wang, D.L.; Xie, Z.Y.; Li, J.; Wang, Y.F.; Han, Z.X.; Ma, C.H.; Wang, Z.H.; et al. New indexes and charts for genesis identification of multiple natural gases. Petrol. Explor. Dev. 2017, 44, 535–543. [Google Scholar] [CrossRef]
- Ma, Z.L.; Shen, B.J.; Pan, A.Y.; Teng, G.; Ning, C.X.; Zheng, L.J. Origin and carbon isotope reversal of shale gas in Wufeng-Longmaxi formations, Sichuan Basin: Implication from pyrolysis experiments. Petrol. Geol. Exp. 2020, 42, 428–433. [Google Scholar]
- Zdanaviciute, O.; Lazauskiene, J. Hydrocarbon migration and entrapment in the Baltic Syneclise. Org. Geochem. 2004, 35, 517–527. [Google Scholar] [CrossRef]
- Dow, W.G. Kerogen studies and geological interpretations. J. Geochem. Explor. 1977, 7, 79–99. [Google Scholar] [CrossRef]
- Waples, D. Time and temperature in petroleum formation: Application of Lopatin’s method to petroleum exploration. AAPG Bull. 1980, 64, 916–926. [Google Scholar]
- Xie, Z.Y.; Li, Z.S.; Wei, G.Q.; Li, J.; Wang, D.L.; Wang, Z.H.; Dong, C.Y. Experimental research on the potential of sapropelic kerogen cracking gas and discrimination of oil cracking gas. Nat. Gas Geosci. 2016, 27, 1057–1066. [Google Scholar] [CrossRef]
- Guo, X.S.; Li, Y.P.; Tenger, B.; Wang, Q.; Yuan, T.; Shen, B.J.; Ma, Z.L.; Wei, F.B. Hydrocarbon generation and storage mechanisms of deep-water shales of Ordovician Wufeng Formation-Silurian Longmaxi Formation in Sichuan Basin, China. Petrol. Explor. Dev. 2020, 47, 193–201. [Google Scholar] [CrossRef]


| Heating Rate (°C/h) | Confined Pressure (MPa) | Final Temperature (°C) | EasyRo (%) | Time at Final Temperature (h) |
|---|---|---|---|---|
| 20 | 15 | 460 | 1.50 | 0 |
| 20 | 490 | 2.00 | 0 | |
| 25 | 520 | 2.50 | 0 | |
| 30 | 550 | 3.02 | 0 | |
| 35 | 575 | 3.48 | 0 | |
| 40 | 609 | 4.01 | 0 | |
| 45 | 610 | 4.53 | 12 | |
| 50 | 610 | 4.68 | 24 | |
| 55 | 610 | 4.69 | 48 | |
| 2 | 15 | 420 | 1.52 | 0 |
| 20 | 450 | 1.98 | 0 | |
| 25 | 480 | 2.30 | 0 | |
| 30 | 500 | 2.91 | 0 | |
| 35 | 530 | 3.49 | 0 | |
| 35 | 560 | 3.98 | 0 | |
| 40 | 600 | 4.53 | 0 | |
| 50 | 600 | 4.63 | 12 | |
| 60 | 600 | 4.68 | 48 |
| TOC (%) | Tmax (°C) | S1 (mg/g) | S2 (mg/g) | S3 (mg/g) | HI (mg/g TOC) | OI (mg/g TOC) | * EqVRo1 (%) | ** EqVRo2 (%) |
|---|---|---|---|---|---|---|---|---|
| 4.17 | 472 | 0.36 | 2.71 | 0.32 | 64.99 | 7.67 | 1.26 | 1.49 |
| Quartz (%) | Feldspar (%) | Dolomite (%) | Pyrite (%) | Kaolinite (%) | Chlorite (%) | Illite (%) | ** I/S (%) | *** C/S (%) |
|---|---|---|---|---|---|---|---|---|
| 37.3 | 11.4 | 6.8 | 8.3 | 0.35 | 1.33 | 2.12 | 31.1 | 1.3 |
| Heating Rate (°C/h) | Final Temperature (°C) | EqVRo (%) | Generated Gas (mL/g TOC) | ||||||
|---|---|---|---|---|---|---|---|---|---|
| Methane (C1) | Ethane (C2) | Propane (C3) | Butane (C4) | Pentane (C5) | C2–5 | C1–5 | |||
| 20 | 460 | 1.3 | 28.45 | 7.70 | 2.26 | 0.31 | 0.02 | 10.37 | 38.82 |
| 490 | 1.9 | 73.89 | 12.06 | 2.03 | 0.15 | 0.00 | 14.27 | 88.16 | |
| 520 | 2.32 | 136.52 | 10.88 | 0.61 | 0.01 | 0.00 | 11.51 | 148.03 | |
| 550 | 2.58 | 196.01 | 5.60 | 0.05 | 0.00 | 0.00 | 5.66 | 201.66 | |
| 575 | 2.83 | 226.87 | 2.26 | 0.01 | 0.00 | 0.00 | 2.27 | 229.14 | |
| 609 | 2.93 | 267.09 | 1.43 | 0.00 | 0.00 | 0.00 | 1.43 | 268.52 | |
| 610 | 3 | 370.04 | 0.42 | 0.00 | 0.00 | 0.00 | 0.42 | 370.46 | |
| 610 | 3.07 | 407.13 | 0.00 | 0.00 | 0.00 | 0.00 | 0.00 | 407.13 | |
| 610 | 3.16 | 348.47 | 0.33 | 0.00 | 0.00 | 0.00 | 0.33 | 348.80 | |
| 2 | 420 | 1.47 | 29.85 | 8.06 | 2.24 | 0.31 | 0.03 | 10.65 | 40.50 |
| 450 | 1.89 | 84.37 | 12.85 | 1.85 | 0.14 | 0.00 | 14.85 | 99.22 | |
| 480 | 2.15 | 157.21 | 9.56 | 0.30 | 0.01 | 0.00 | 9.87 | 167.07 | |
| 500 | 2.58 | 201.13 | 4.79 | 0.05 | 0.00 | 0.00 | 4.84 | 205.97 | |
| 530 | 2.65 | 242.42 | 1.56 | 0.02 | 0.00 | 0.00 | 1.58 | 244.00 | |
| 560 | 2.76 | 265.02 | 0.92 | 0.01 | 0.00 | 0.00 | 0.93 | 265.95 | |
| 600 | 3 | 350.77 | 0.34 | 0.00 | 0.00 | 0.00 | 0.34 | 351.11 | |
| 600 | 3.25 | 347.71 | 0.34 | 0.00 | 0.00 | 0.00 | 0.34 | 348.05 | |
| 600 | 3.34 | 286.05 | 0.29 | 0.00 | 0.00 | 0.00 | 0.29 | 286.34 | |
| Heating Rate (°C/h) | Final Temperature (°C) | EqVRo (%) | Stable Carbon Isotope Values (‰, PDB) | ||
|---|---|---|---|---|---|
| Methane (δ13C1) | Ethane (δ13C2) | Propane (δ13C3) | |||
| 20 | 460 | 1.3 | −38.43 | −31.43 | −28.45 |
| 490 | 1.9 | −34.93 | −28.7 | −25.37 | |
| 520 | 2.32 | −32.01 | −19.43 | ||
| 550 | 2.58 | −30.46 | −12.37 | ||
| 575 | 2.83 | −30.43 | |||
| 609 | 2.93 | −30.63 | |||
| 610 | 3 | −31.1 | |||
| 610 | 3.07 | −33.69 | |||
| 610 | 3.16 | −32.97 | |||
| 2 | 420 | 1.47 | −37.91 | −31.68 | −29.5 |
| 450 | 1.89 | −34.57 | −28.29 | −25.36 | |
| 480 | 2.15 | −32.7 | −17.3 | ||
| 500 | 2.58 | −32.32 | |||
| 530 | 2.65 | −31.59 | |||
| 560 | 2.76 | −31.48 | |||
| 600 | 3 | −31.68 | |||
| 600 | 3.25 | −30 | |||
| 600 | 3.34 | −30.21 | |||
Disclaimer/Publisher’s Note: The statements, opinions and data contained in all publications are solely those of the individual author(s) and contributor(s) and not of MDPI and/or the editor(s). MDPI and/or the editor(s) disclaim responsibility for any injury to people or property resulting from any ideas, methods, instructions or products referred to in the content. |
© 2025 by the authors. Licensee MDPI, Basel, Switzerland. This article is an open access article distributed under the terms and conditions of the Creative Commons Attribution (CC BY) license (https://creativecommons.org/licenses/by/4.0/).
Share and Cite
Shi, X.; Li, Y.; Jiang, Y.; Zhang, Y.; Wu, W.; Zhang, Z.; Wang, Z.; Yin, X.; Fu, Y.; Gu, Y. A Model and the Characteristics of Gas Generation of the Longmaxi Shale in the Sichuan Basin. Processes 2025, 13, 2294. https://doi.org/10.3390/pr13072294
Shi X, Li Y, Jiang Y, Zhang Y, Wu W, Zhang Z, Wang Z, Yin X, Fu Y, Gu Y. A Model and the Characteristics of Gas Generation of the Longmaxi Shale in the Sichuan Basin. Processes. 2025; 13(7):2294. https://doi.org/10.3390/pr13072294
Chicago/Turabian StyleShi, Xuewen, Yi Li, Yuqiang Jiang, Ye Zhang, Wei Wu, Zhiping Zhang, Zhanlei Wang, Xingping Yin, Yonghong Fu, and Yifan Gu. 2025. "A Model and the Characteristics of Gas Generation of the Longmaxi Shale in the Sichuan Basin" Processes 13, no. 7: 2294. https://doi.org/10.3390/pr13072294
APA StyleShi, X., Li, Y., Jiang, Y., Zhang, Y., Wu, W., Zhang, Z., Wang, Z., Yin, X., Fu, Y., & Gu, Y. (2025). A Model and the Characteristics of Gas Generation of the Longmaxi Shale in the Sichuan Basin. Processes, 13(7), 2294. https://doi.org/10.3390/pr13072294