Article

Photoelectrochemical CO2 Reduction Measurements of a BiOI Coating Deposited onto a Non-Conductive Glass Support as a Platform for Environmental Remediation

by
J. Manuel Mora-Hernandez
1,* and
A. Hernández-Ramírez
2
1
Secihti—Universidad Autónoma de Nuevo León (UANL), Facultad de Ingeniería Civil, Departamento de Ecomateriales y Energía. Av. Universidad S/N Ciudad Universitaria, San Nicolás de los Garza C.P. 66455, Nuevo León, Mexico
2
Universidad Autónoma de Nuevo León, Facultad de Ciencias Químicas, Av. Universidad S/N Ciudad Universitaria, San Nicolás de los Garza C.P. 66455, Nuevo León, Mexico
*
Author to whom correspondence should be addressed.
Processes 2025, 13(7), 2292; https://doi.org/10.3390/pr13072292
Submission received: 18 June 2025 / Revised: 15 July 2025 / Accepted: 15 July 2025 / Published: 18 July 2025
(This article belongs to the Special Issue Advanced Application of Photoelectrocatalysis for Energy Conversion)

Abstract

Aiming to contribute to environmental remediation strategies, this work proposes a novel fabrication of photoelectrocatalytic electrodes containing a BiOI coating deposited onto non-conductive glass (NCG) for CO2 conversion applications. When BiOI electrodes are not deposited onto fluorine-doped tin oxide (FTO) or indium tin oxide (ITO) conductive supports, the electrochemical measurements enable the registration of the (photo)electrochemical response for bare BiOI, thereby excluding remnant signals from the conductive supports and reporting an exclusive and proper photoelectrocatalytic BiOI response. A systematic procedure was carried out to improve the physicochemical properties of BiOI through a simple variation in the amount of reagents employed in a solvothermal synthesis, thus increasing the crystallite size and surface area of the resulting material (BiOI-X3-20wt.%). The tailored BiOI coating on a non-conductive support showed activity in performing CO2 photoelectroreduction under UV–Vis irradiation in aqueous media. Finally, the BiOI-X3-20wt.% sample was evaluated for photocatalytic CO2 conversion in gaseous media, producing CO as the primary reaction product. This study confirms that BiOI is a suitable and easily synthesized material, with potential applications for CO2 capture and conversion when employed as a photoactive coating for environmental remediation.

1. Introduction

The greenhouse effect (GHE) is crucial for allowing life on our planet as it is responsible for maintaining an adequate temperature and making the Earth habitable. However, the exponential increase in greenhouse gases (GHGs) after the post-industrial era has led to a critical global temperature rise, causing negative impacts associated with climate change [1]. Among the GHGs are carbon dioxide (CO2), nitrous oxide (N2O), methane (CH4), fluorinated gases (FGs), and water vapor; however, CO2 is the most significant GHG because it is produced by the combustion of fossil fuels, including oil, coal, and natural gas [2]. In addition, deforestation and other anthropogenic human activities have contributed to the increase in CO2, thereby promoting global warming, which is responsible for extreme weather events, ecosystem disruption, rising sea levels, and threats to human health and wellbeing [3].
Several efforts have been made to mitigate the greenhouse effect, such as transitioning to renewable energy, improving industrial processes, implementing governmental policies, and exploring new and clean energy sources. This last strategy involves new energy generation processes [4]. In this way, photocatalysis has emerged as a novel technology for environmental remediation, harnessing the power of light and utilizing catalytic materials to purify air and water. It harnesses photons to generate superficial charge carriers (electron-hole pairs), which drive chemical reactions that break down harmful and contaminant substances into harmless reaction products [5]. As photocatalytic reactions are superficial, coatings are an effective strategy for optimizing semiconductor deposition. Photocatalytic coatings can be applied to various surfaces, including concrete, ceramics, and glass, to harness sunlight and generate charge carriers, thereby contributing to environmental remediation [6].
In recent years, photocatalytic coatings have been increasingly utilized in novel photocatalytic surface technologies for environmental applications, thereby leveraging the technology to create surfaces with self-cleaning, air-purifying, and antimicrobial properties. The primary advantage of coatings is their ease of application to various substrates, including glass, ceramics, metals, polymers, and composites, creating active, functional surfaces that interact with surrounding pollutants [7]. Although photocatalytic coatings are primarily used in self-cleaning applications, they can also be employed to enhance air quality by reacting with and decomposing harmful contaminants, such as nitrogen oxides (NOx) or volatile organic compounds (VOCs), into harmless substances like water and carbon dioxide [8]. If coatings are applied to surfaces exposed to outdoor air, such as facades, building surfaces, or glass windows, they can help to eliminate contaminants present in air pollution. The main challenges for photocatalytic coatings are optimizing their efficiency in real-world conditions and enhancing their stability and durability. Photocatalytic coatings have become a versatile and sustainable solution for enhancing environmental air conditions [9]. However, optimizing challenges such as efficiency and stability, reducing costs, scaling production, and integrating photocatalytic developments into existing infrastructure are necessary to make photoactive coatings a common-use technology.
On the other hand, the critical component of a photocatalytic coating is the photoactive material. Bismuth oxyiodide (BiOI) is a novel material that has garnered significant attention in recent years due to its wide range of applications, particularly in optoelectronics, photovoltaics, and photocatalysis. It also presents unique properties that make it attractive in technological developments [10]. BiOI presents a crystal arrangement consisting of a layered structure where bismuth atoms are “sandwiched” between the iodine and the oxygen atoms. Such a specific arrangement confers particular semiconductor properties and enables its diverse functionalities [11]. Due to its narrow bandgap (1.9 to 2.1 eV), BiOI is known for its excellent photoactivity under visible light irradiation; additionally, through variations in its synthesis method, surface modification, and doping strategies, it is possible to tailor its physicochemical properties to meet specific requirements and applications [12]. BiOI exhibits significant promise in various domains; however, current research in photocatalytic applications focuses on enhancing its performance, stability, and scalability for real-world applications.
Regarding electrode characterization, the classical methodology for evaluating the electrochemical response of semiconductor materials involves depositing photoactive powders onto a conductive support, commonly fluorine-doped tin oxide (FTO) or indium tin oxide (ITO), for this purpose [13,14]. However, as FTO and ITO contain SnO2 and In2O3, they already present photoactive properties that can interfere if the studied coating is not homogeneously deposited onto this surface; even when the surface seems to cover the substrate, fissures or the material’s porosity can allow FTO or ITO exposure, thus interfering with the electrochemical measurements and registering data coming from the substrate. In this way, it is desirable to cover the substrate appropriately or modify the electrode fabrication process to ensure that the electrochemical signals registered are obtained from the semiconductor material deposited over the support.
The present work aims to fabricate a photocatalytic coating that contains BiOI as the photoactive material. The coating was deposited onto non-conductive glass (NCG) to avoid substrate interference signals, and the electrodes were electrochemically characterized and evaluated towards the carbon dioxide reduction reaction (CO2RR). The photoactive material exhibited photoelectrochemical and photocatalytic activity, enabling the reaction to occur under UV–Vis irradiation and generating CO as the reaction product. The material improvement in, novel electrode fabrication method of, and photoactivity presented by the BiOI coating make it a promising material for environmental remediation applications.

2. Materials and Methods

2.1. Synthesis of Bismuth Oxyiodide

The fabrication of the BiOI photocatalyst was achieved following a solvothermal methodology. In short, 1 mmol of bismuth nitrate (Bi(NO3)3⋅5H2O, 99.99%; Sigma Aldrich, Merk KGaA, Darmstadt, Germany) and 1 mmol of potassium iodide (KI, 99.3%; FERMONT, Productos Quimicos Monterrey S.A de C.V., Monterrey, Mexico) were added into a Teflon reactor employing 10 mL of ethylene glycol as the solvent. The Teflon reactor was placed into a stainless-steel reactor. Four synthesis conditions were studied to analyze the effect of temperature on the reaction. The solvothermal reactor was heated to 140 °C, 150 °C, 160 °C, and 170 °C for 12 h. After annealing, the reactor was kept inside until it reached room temperature (≈25 °C). Then, the reaction products were rinsed with ethanol (20 mL) and water (20 mL) to remove ethylene glycol from the final samples. The resulting orange powder was dried for 4 h at 60 °C in an air atmosphere. Once dried, the powders were ground in an agate mortar and finally stored. In a second stage, aiming to obtain higher amounts of BiOI, the above procedure was followed, but this time the reagent amounts were doubled (X2) and tripled (X3) at 160 °C. Regarding the ratio of product yield to the increase in reagent amount, the average values were 85.6%, 82.9%, and 86.7%, thus revealing that an increase in reagents does not substantially affect the product yield. The resulting powders were characterized to determine if this procedure modification resulted in any physicochemical changes.

2.2. Preparation of the Electrodes with a Conductive Support

The electrodes were fabricated as follows: (i) FTO glass was cut to obtain rectangular pieces (10 × 15 mm); (ii) silver conductive paint was deposited at the end of the FTO glass to cover an area of 5 × 5 mm; (iii) hot welding was deposited onto the silver conductive paint (SPI supplies); (iv) a copper wire was welded to the FTO glass; and (v) the silver paint and welding regions were covered with hot silicone to leave only the FTO glass exposed. Afterwards, 10 mg BiOI, 250 µL Nafion (5 wt.%), and 1250 µL ultra-pure water (18 MΩ∙cm) were mixed to obtain an electrocatalytic ink. Next, 10 µL of the catalytic ink was deposited via spin-coating onto conductive FTO glass (1 cm2). The ink-deposited electrodes were dried under N2 at 25 °C. The electrode fabrication scheme is depicted in Figure S1a.

2.3. Preparation of the Electrodes with a Non-Conductive Support

The electrodes were fabricated as follows: (i) NCG was cut to obtain rectangular pieces (10 × 15 mm); (ii) silver conductive paint was deposited at the end of the NCG to cover an area of 5 × 10 mm; (iii) hot welding was deposited onto the silver conductive paint (SPI supplies); (iv) a copper wire was welded to the NCG; and (v) the silver paint and welding regions were covered with hot silicone; however, an area of 5 × 5 mm of silver conductive paint remained uncovered on purpose on the NCG. Afterwards, a paint coating was fabricated by mixing 400 mg BiOI, 500 mg calcium hydroxide (ACS reagent, ≥95%; Sigma Aldrich), and 2 mL of a 5 wt.% polyvinyl alcohol (PVA) solution (99+ % hydrolyzed; Sigma Aldrich). The resulting coating was applied by brushing the paint onto the NCG electrode (1 cm2). The ink-deposited electrodes were dried under N2 at 25 °C. The electrode fabrication scheme is depicted in Figure S1b.

2.4. Instrumentation

X-ray diffraction (XRD) measurements were performed using a Bruker D8 diffractometer (Billerica, MA, USA) operating at 40 kV and 40 mA with Cu Kα radiation (λ = 1.5406 Å) and a step size of 0.05°, with a counting time of 0.05 s per step, over a 2θ range of 15° to 70°. The morphology of the materials was analyzed using a scanning electron microscope (SEM; JEOL 6490LV, JEOL USA Inc., Peabody, MA, USA) in secondary electron mode under high vacuum and an accelerating voltage of 20 kV. The surface area determination (SBET) was obtained using physical nitrogen adsorption with a Belsorp II mini-instrument. Before registering the N2 adsorption–desorption plots, the materials were degassed at 130 °C for 2 h under vacuum. The electrochemical measurements were carried out in an AUTOLAB PGSTAT302N (Utrecht, The Netherlands) potentiostat/galvanostat coupled to the FRA32M module to carry out the electrochemical impedance spectroscopy (EIS) analysis in potentiostatic and potentiodynamic modes (Mott–Schottky at 1000 Hz). We employed a standard three-electrode electrochemical cell at 25 °C and a nitrogen-saturated 0.1 M KHCO3 aqueous solution was used as the electrolyte; meanwhile, a CO2-saturated 0.1 M KHCO3 solution was employed to evaluate the CO2 reduction reaction (CO2RR). The (photo)electrochemical (PEC) measurements were carried out using a quartz photoelectrochemical cell (RRPG147 PINE-Research, Durham, NC, USA) with a Pt plate and a Ag/AgCl 3 M KCl electrode as the counter electrode and reference electrode, respectively. The PEC measurements were performed under UV–Vis illumination (Newport 66884, QTH lamp; 250 W output, Irvine, CA, USA). The experiments were carried out at 25 °C. All potential values were converted and reported against the reference hydrogen electrode (RHE), and the density current was normalized to the geometric surface area of the electrode. Finally, to perform the CO2 conversion in the gaseous phase, the experiments were conducted in a CEL-GPRT100 photocatalytic reactor (Beijing, China), which was connected online to a gas chromatography system (GC-FID/TCD; Agilent Technologies 8890, Poway CA, USA) to analyze the generated products.
Diluted CO2 was fed to the reactor (He 10% v/v balance) at a flow rate of 2 mL min−1 and passed through a bubbler to obtain the water vapor (50% relative humidity). The photoreactor was covered with a quartz window to harvest photons from a 300 W Xe lamp (150 mW cm−2) used as an irradiation source (λ = 300–1100 nm). To ensure the system’s hermeticity, the chamber was He-saturated at a pressure of 2 bar for 30 min. Before the photocatalytic tests, the semiconductor material was pretreated with a helium flow rate of 30 mL min−1 at 80 °C for 1 h.

3. Results and Discussion

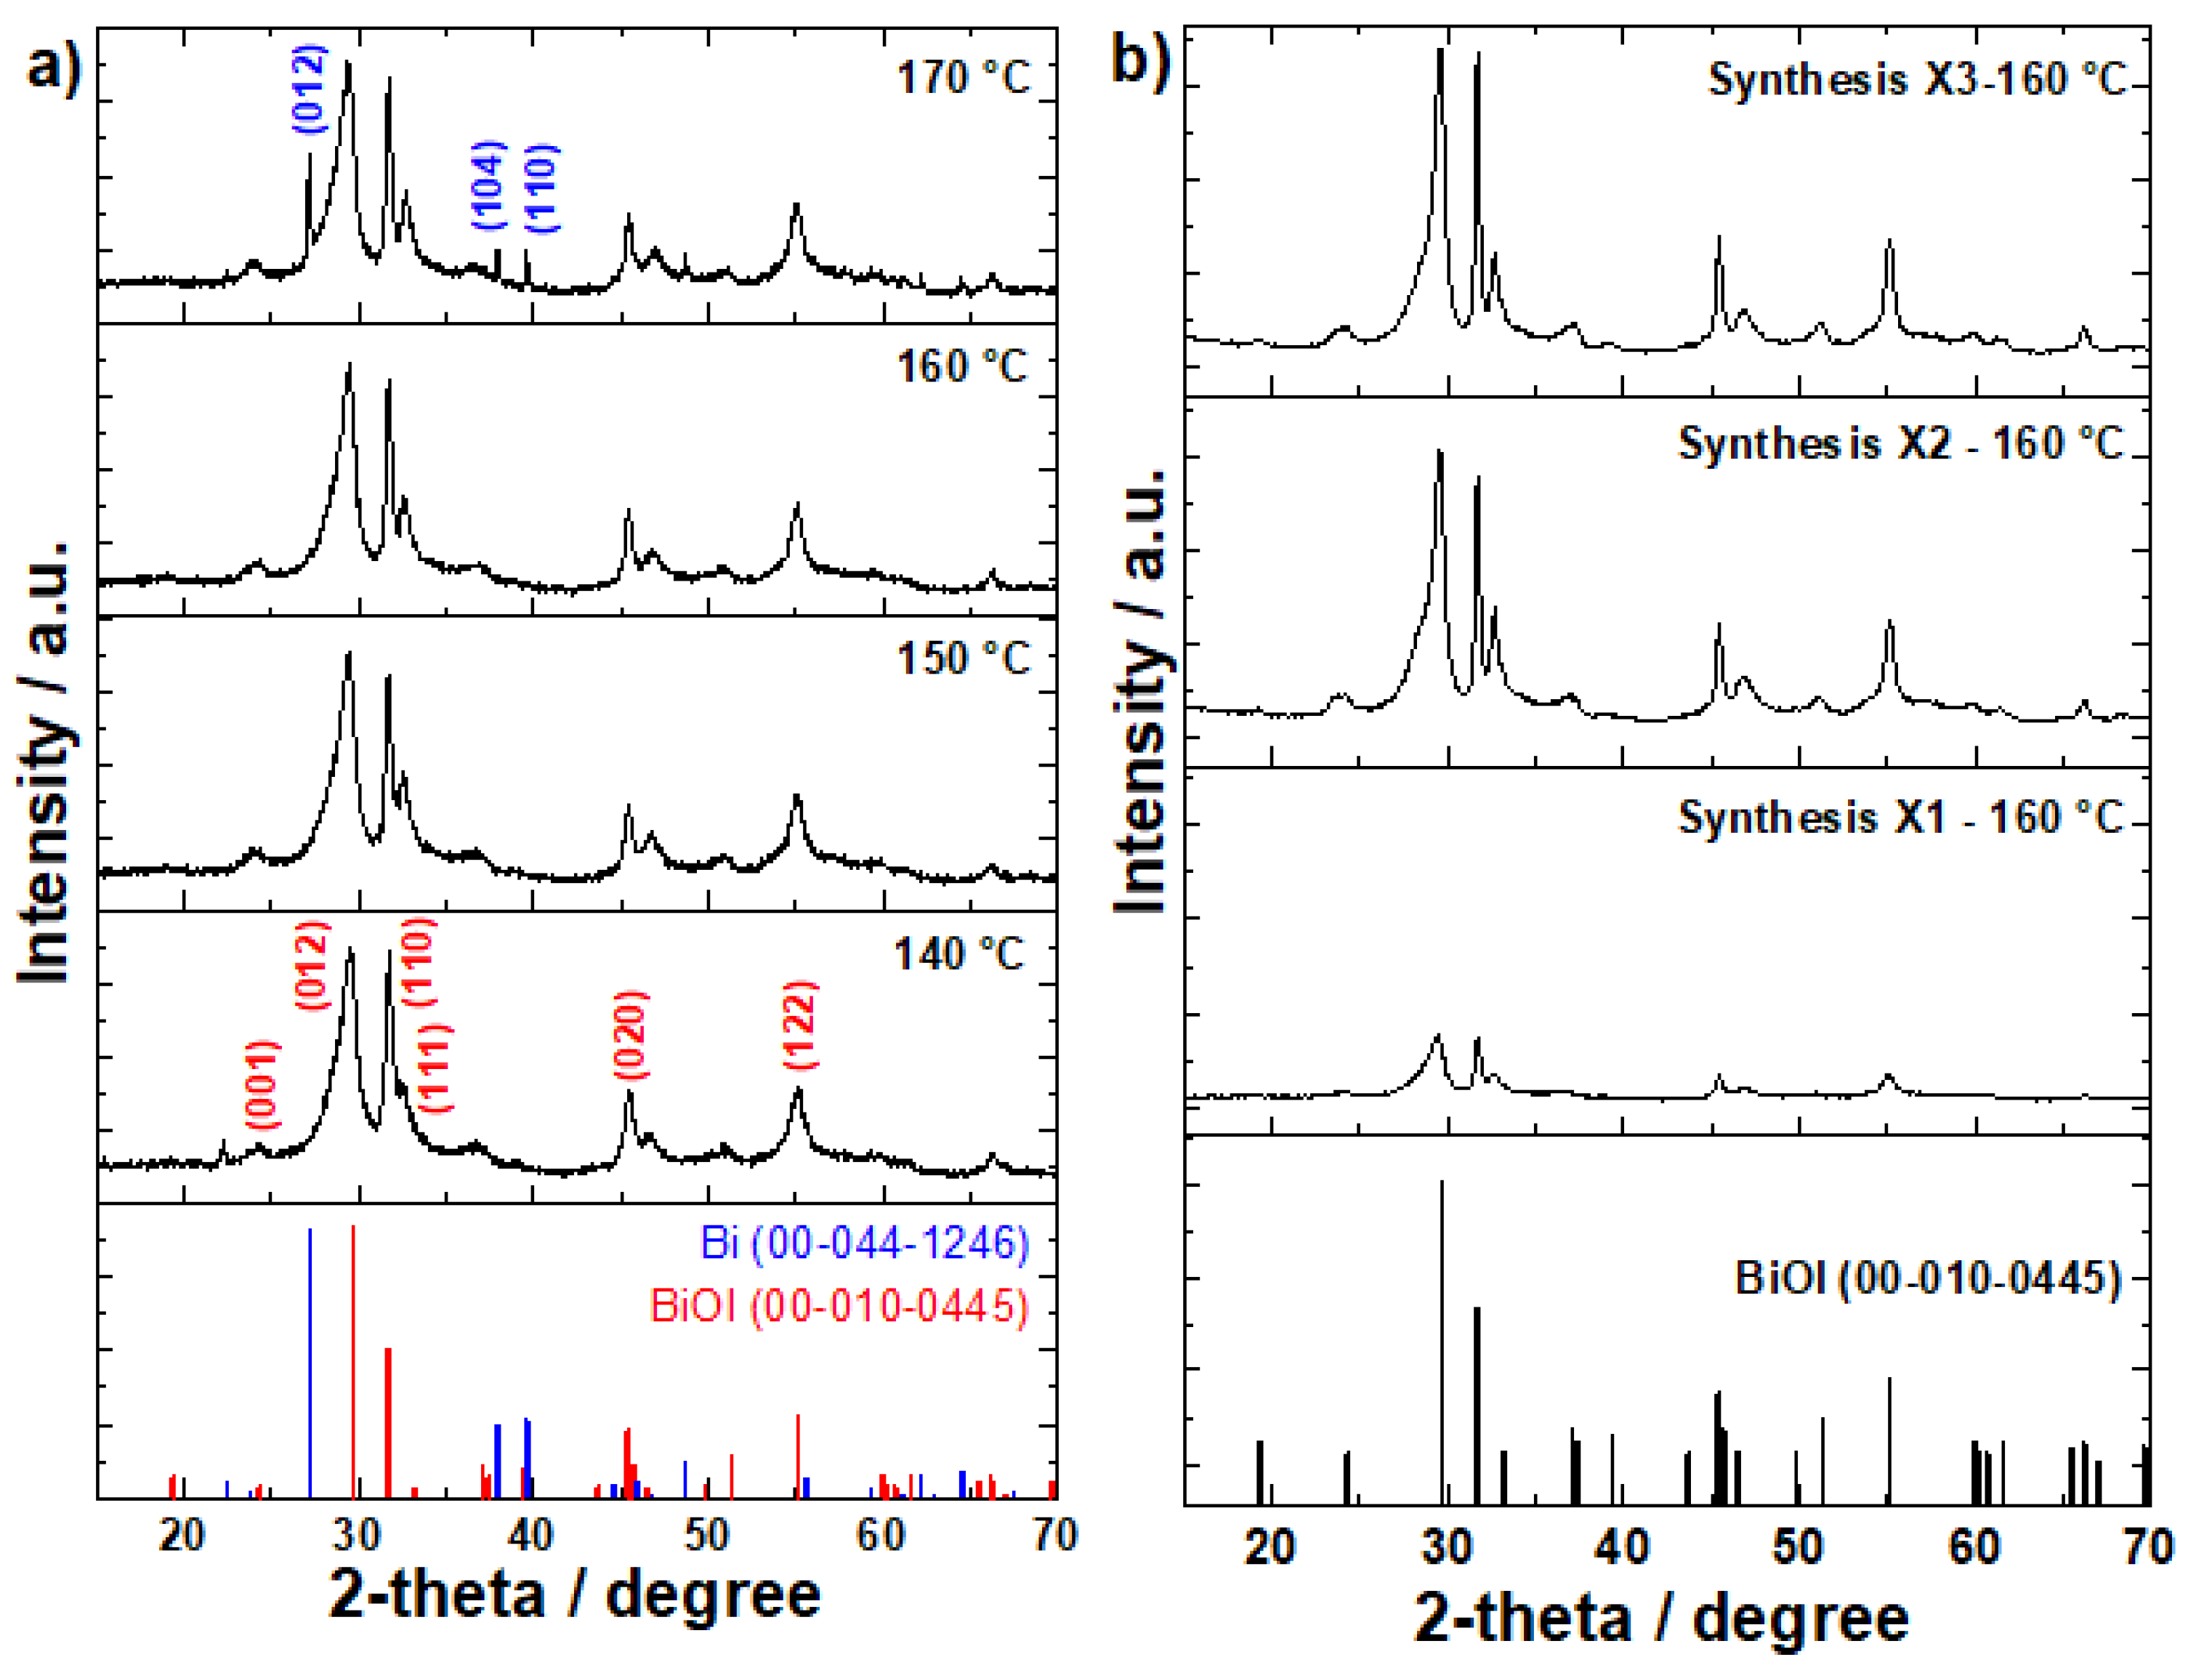
3.1. X-Ray Diffraction Analysis

The X-ray diffraction (XRD) measurements for BiOI synthesized at different temperatures are depicted in Figure 1a. All the samples showed the main BiOI XRD signals at ca. 24.3°, 29.5°, 31.8°, 32.6°, 45.5°, and 55.1°, corresponding with the planes (001), (012), (110), (111), (020), and (122), respectively (ICDD 00-010-0445). However, the samples synthesized at 170 °C exhibited additional signals at 27.1°, 37.9°, and 39.7°, corresponding with the presence of undesirable bismuth metal traces (ICDD 00-044-1246) generated by a partial thermal decomposition of BiOI. This indicates that a high-temperature reaction is not beneficial as it promotes the appearance of an additional Bi phase [15]. Even when the BiOI synthesized at 140 °C, 150 °C, and 160 °C presented a pure BiOI phase, the last sample exhibited a rougher surface (Figure S2), which could enhance the catalytic activity of this material [16]. As mentioned in Section 2.1, the reagents employed to synthesize BiOI were doubled (X2) and tripled (X3) following the solvothermal method at 160 °C. Figure 1b shows the XRD signals determining the changes caused by this procedure modification. A reagent increase does not generate the presence of non-desirable products or phases; all diffraction peaks correspond with BiOI. However, the synthesis of X2 and X3 increases the intensity of BiOI diffraction signal peaks, thus indicating an increase in crystallite size. This was calculated using the full width at half maximum (FWHM) peaks and the Scherrer equation L = kλ/βcos(θ), where L corresponds with the crystallite size, k represents the Scherrer constant (0.9), λ is the wavelength of the X-ray radiation (0.15418 nm for Cu Kα), β is the full width at half maximum (FWHM) of the diffraction peak at 2θ, and θ is the preferential angle diffraction peak [17]. The crystallite sizes for BiOI-X1, BiOI-X2, and BiOI-X3 were 45.6 nm, 61.1 nm, and 63.5 nm, respectively. Such a result indicates that an increase in reagents affects the crystallite size proportionally. The fundamental catalytic principles indicate that materials with large crystallites, a high surface area, and a narrow band gap present enhanced photocatalytic activity in the visible spectrum [18,19,20,21]; in addition, semiconductor materials presenting larger crystal sizes tend to produce a specific product when they perform the CO2 reduction reaction in gaseous media [22,23]. Thus, BiOI-X3 could benefit from large crystallite features.

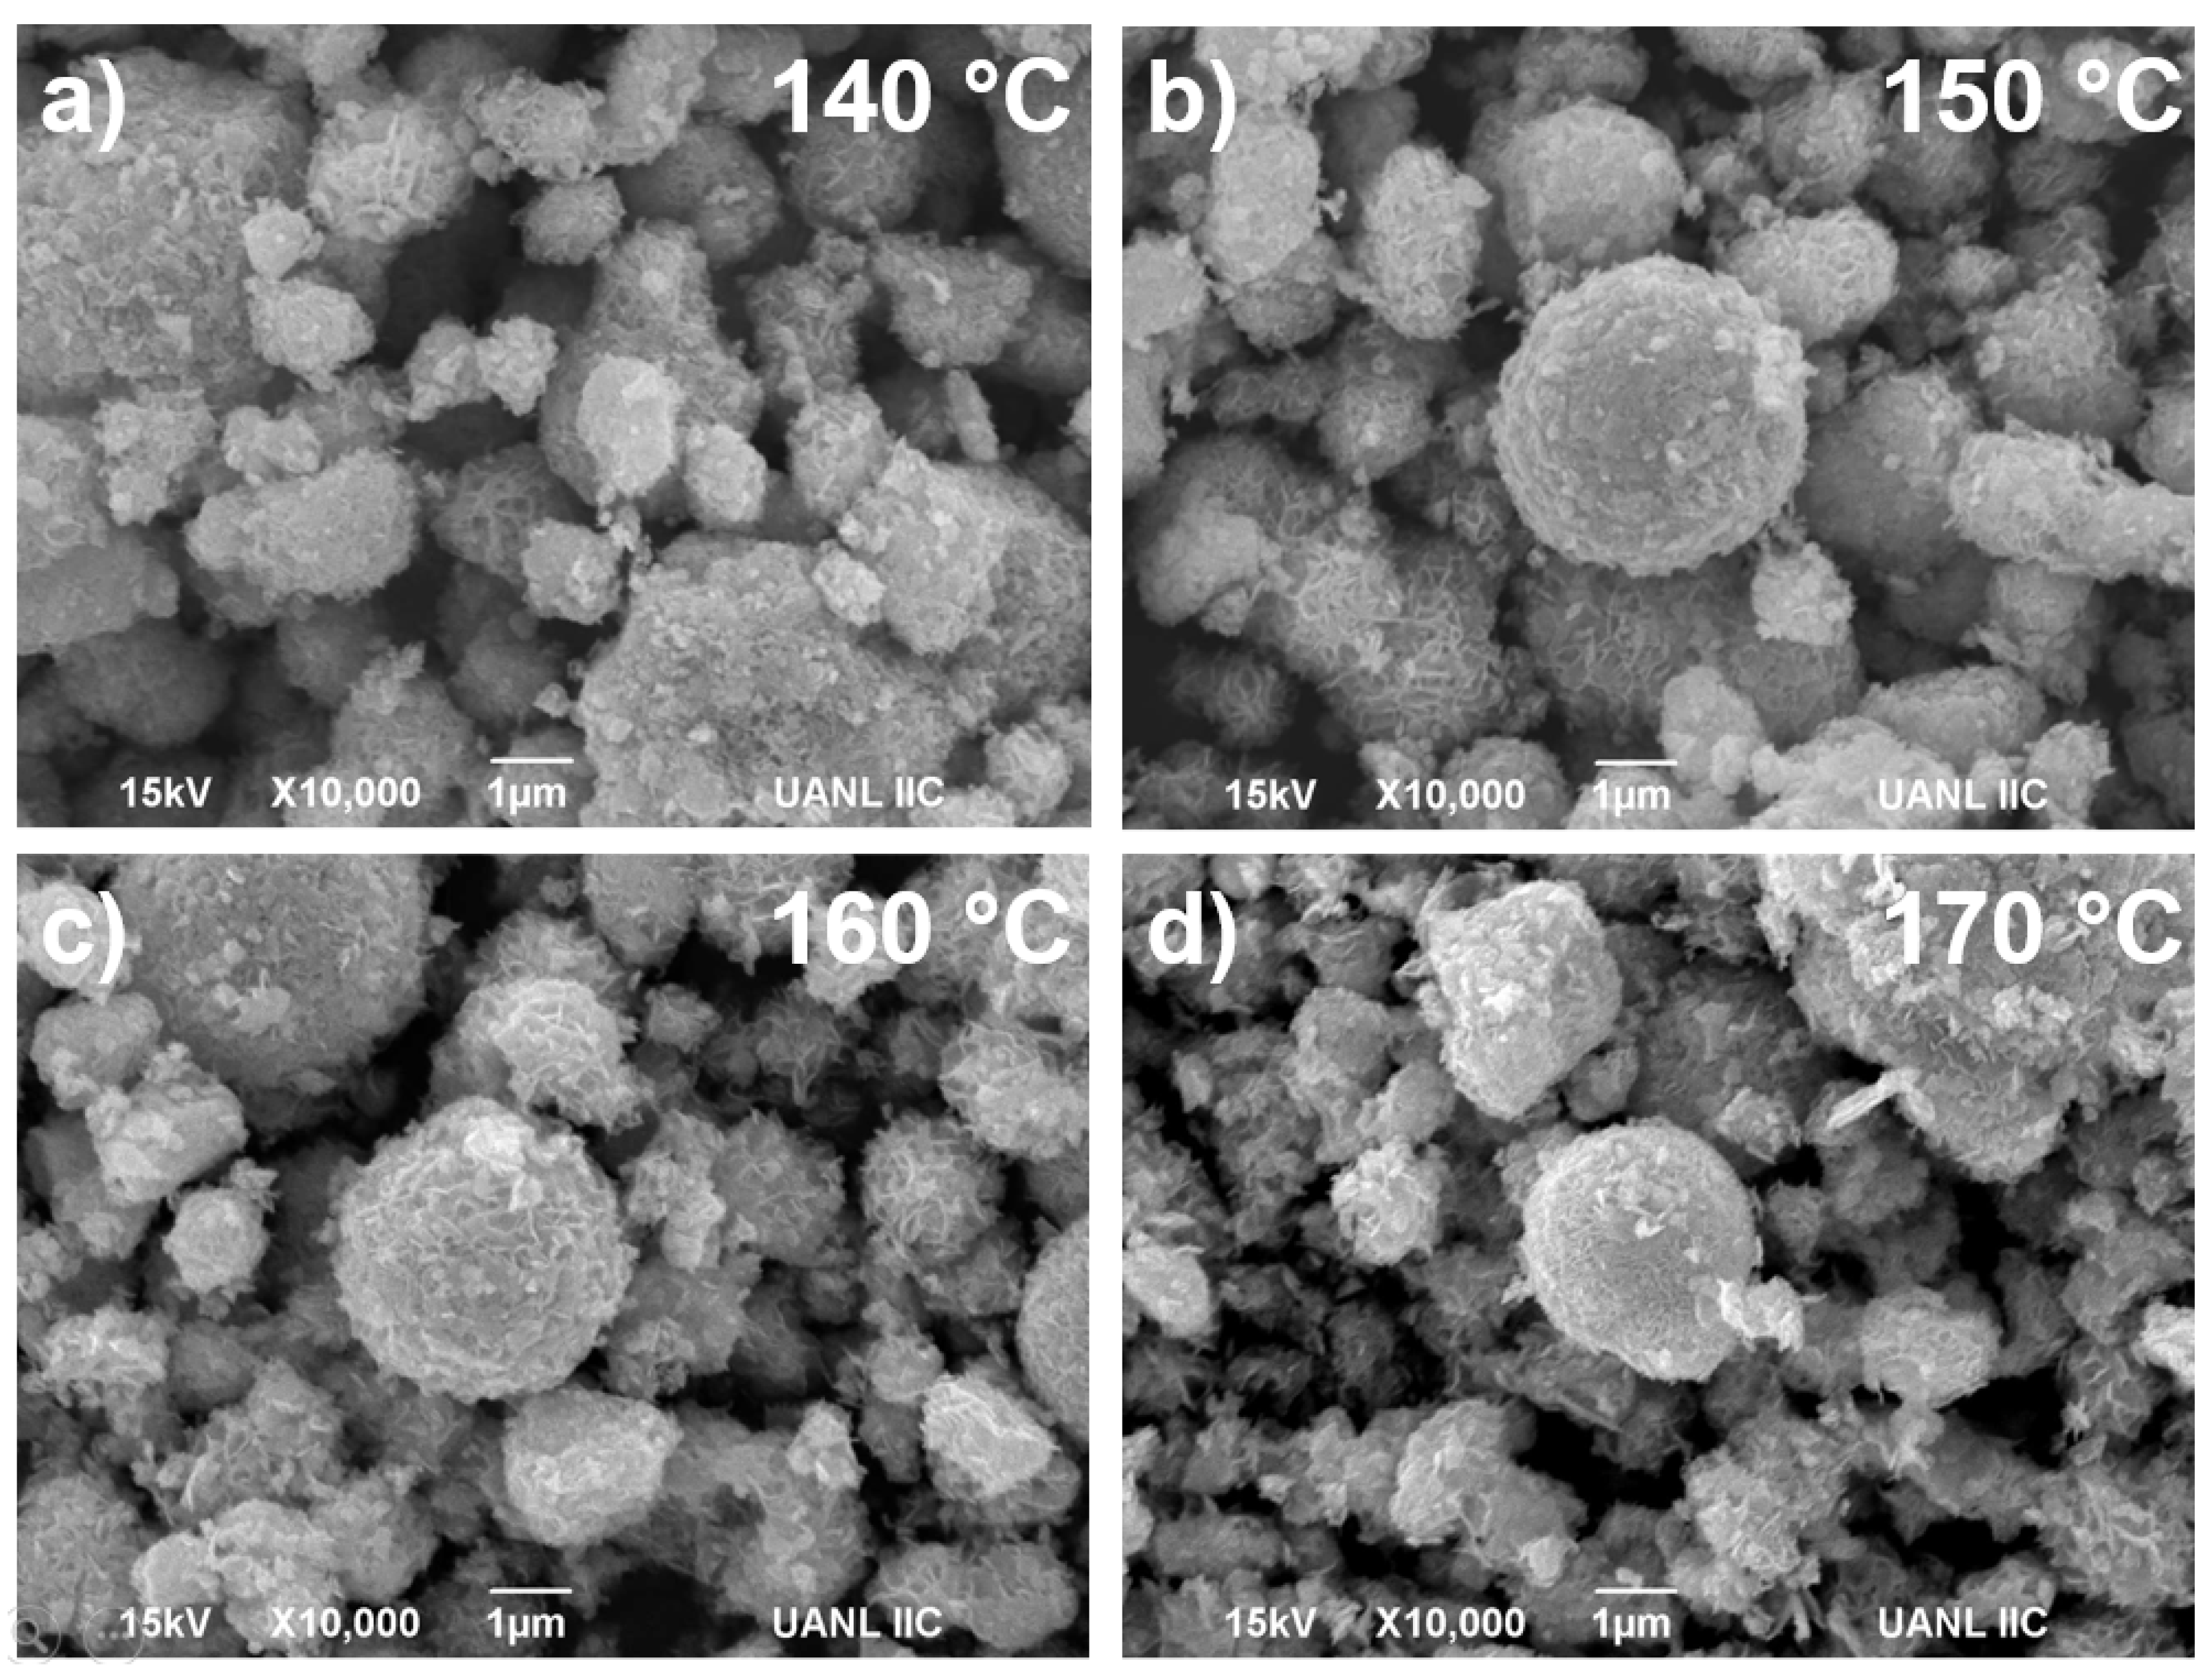
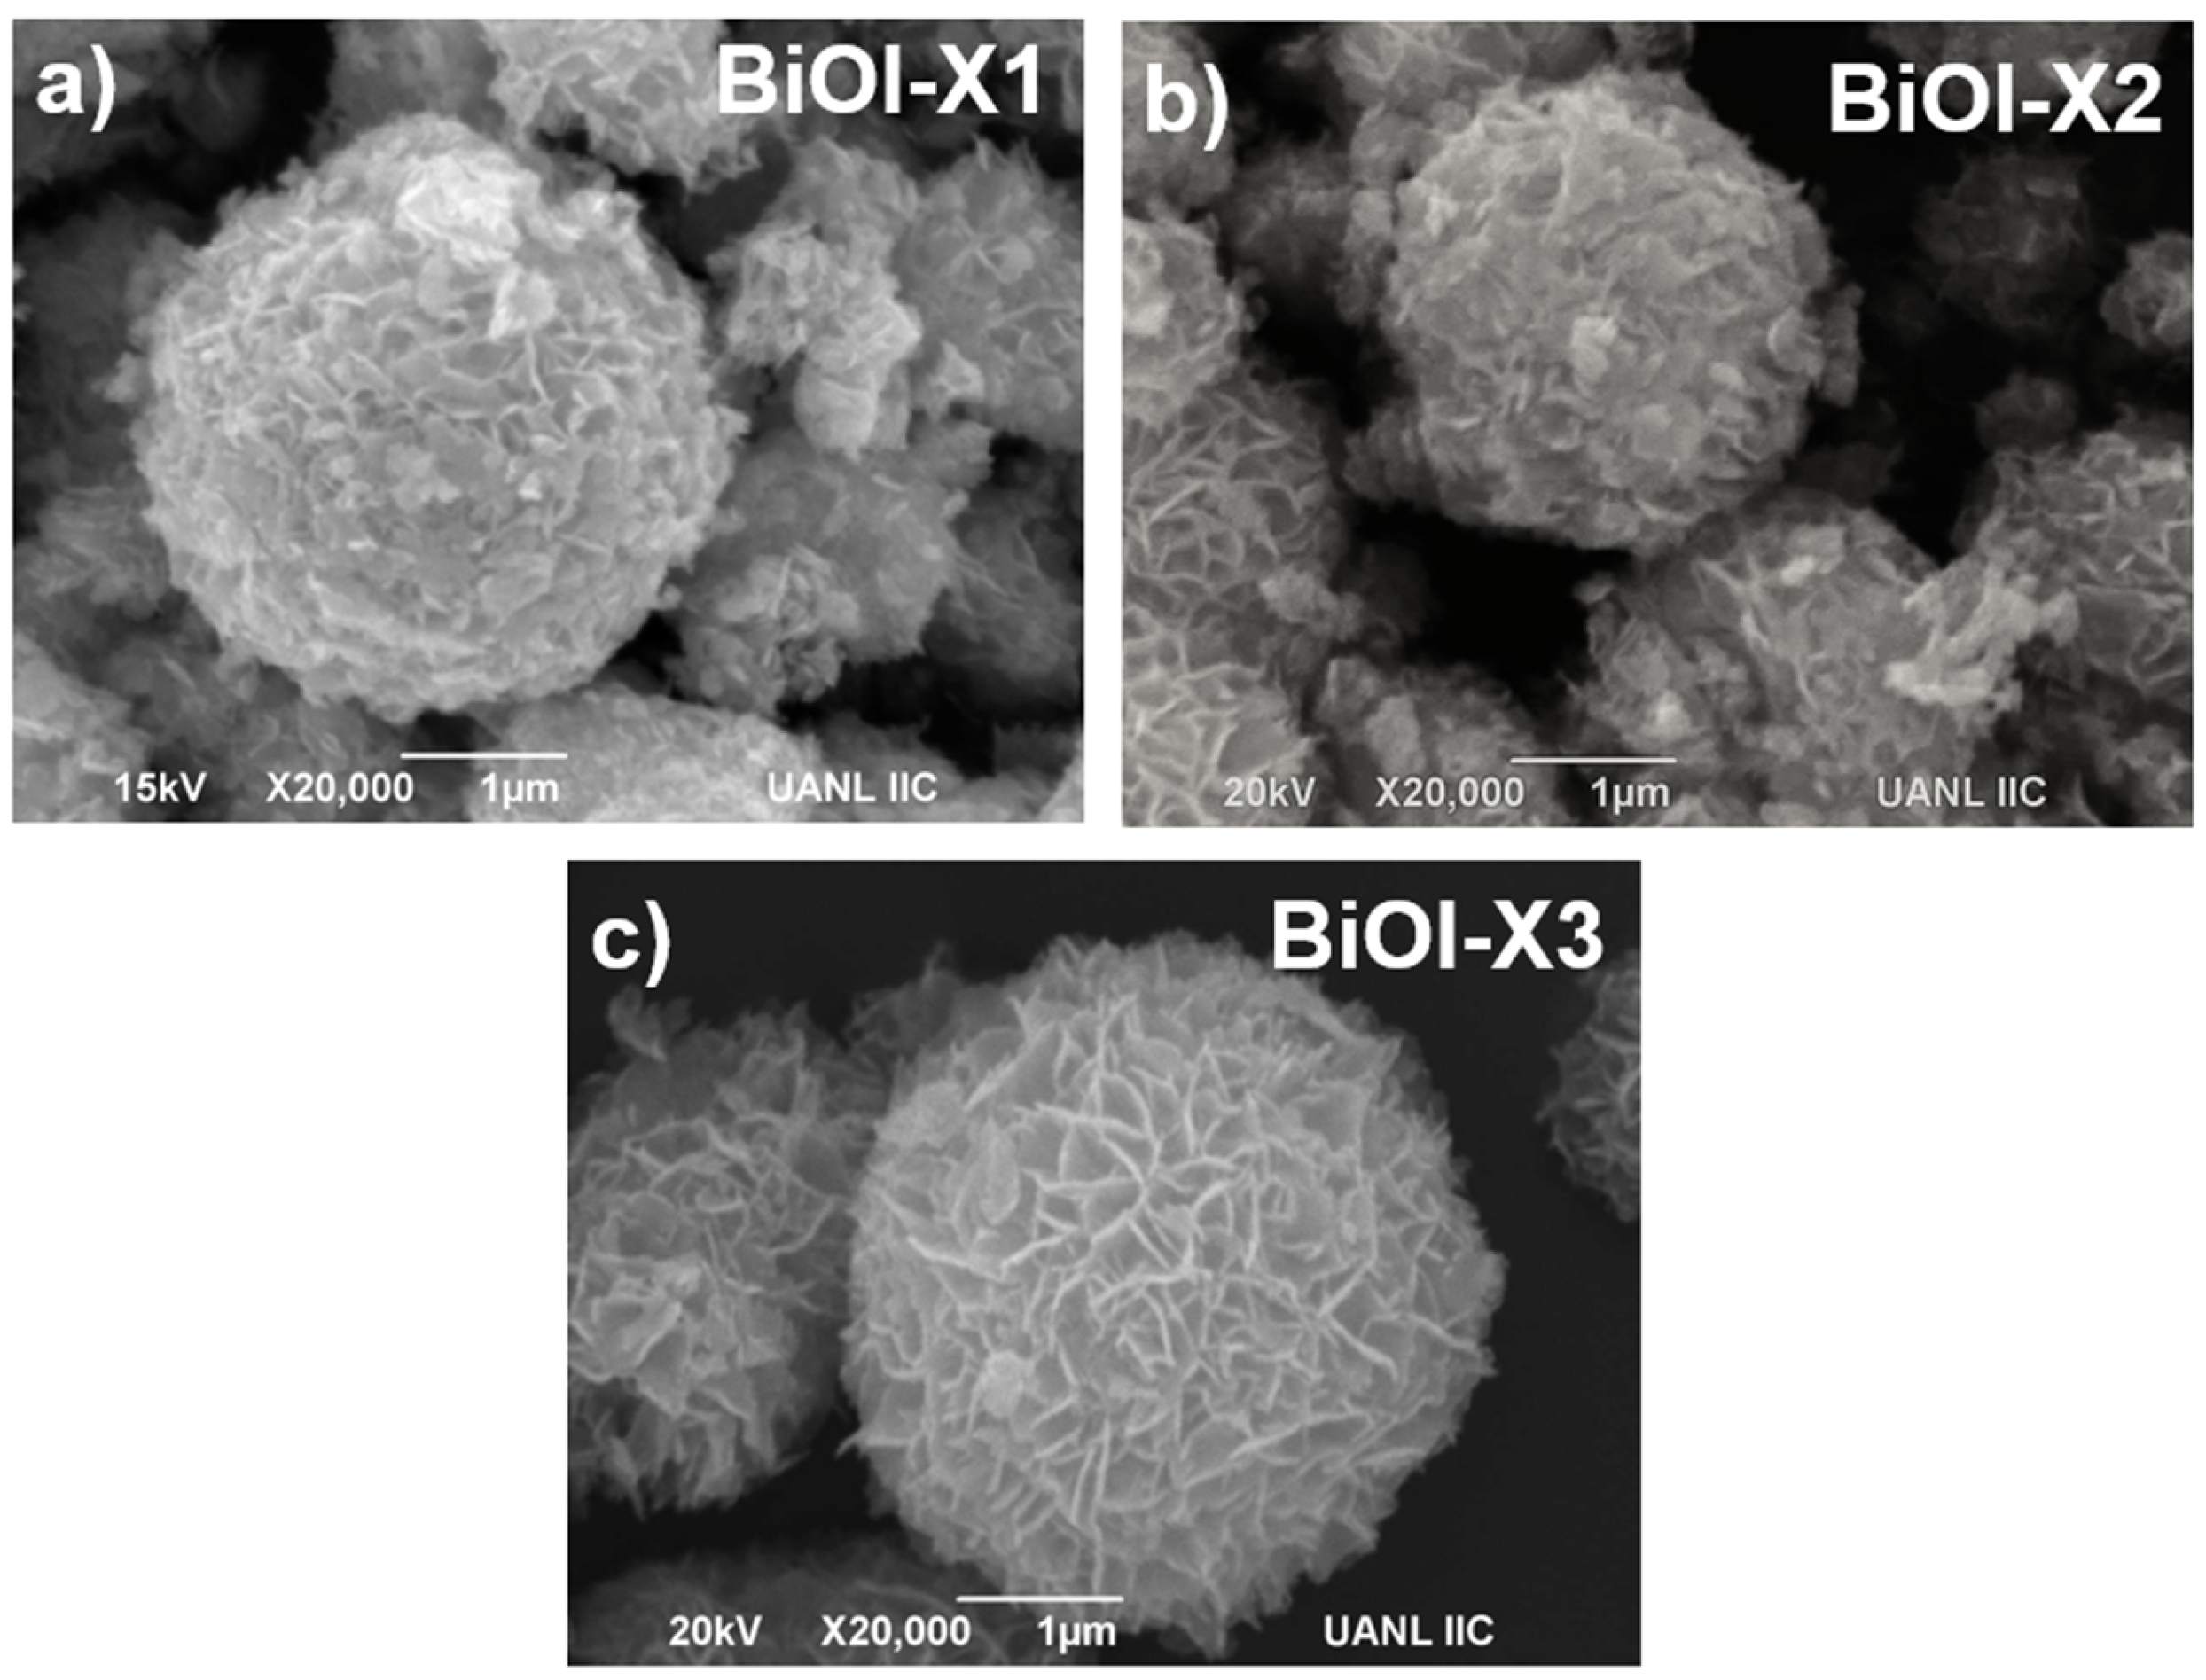
3.2. Microscopy Characterization

Figure 2 shows the scanning electron microscopy images for BiOI synthesized at different temperatures. BiOI-140 °C (Figure 2a) presents poorly defined particles. On the other hand, BiOI-150 °C exhibits a more defined morphology, characterized by micrometric rough spheres (Figure 2b). Similarly, BiOI-160 °C (Figure 2c) exhibits micrometric spherical particles; although these spheres are rougher, they appear to have a sponge-ball-like morphology, suggesting a higher surface area. Finally, Figure 2d depicts BiOI-170 °C, where scarce smooth quasi-spheres are observed. Considering the superior roughness presented by BiOI-160 °C, the synthesis process at 160 °C was repeated, but with the reagent amounts for X2 and X3 being proportionally increased (see Section 2.1). Figure 3a–c show the micrographs for the BiOI-X1, BiOI-X2, and BiOI-X3 samples, respectively. Compared with the original sample synthesized at 160 °C (BiOX-X1), BiOI-X2 exhibits the same morphology; however, even when the crystallite size for BiOX-X2 increased, the apparent particle size observed via SEM slightly decreased, possibly due to fragmentation or agglomeration effects. In contrast, BiOI-X3 slightly increased its apparent particle size and displays a more defined rough surface, which could be advantageous for catalytic purposes.

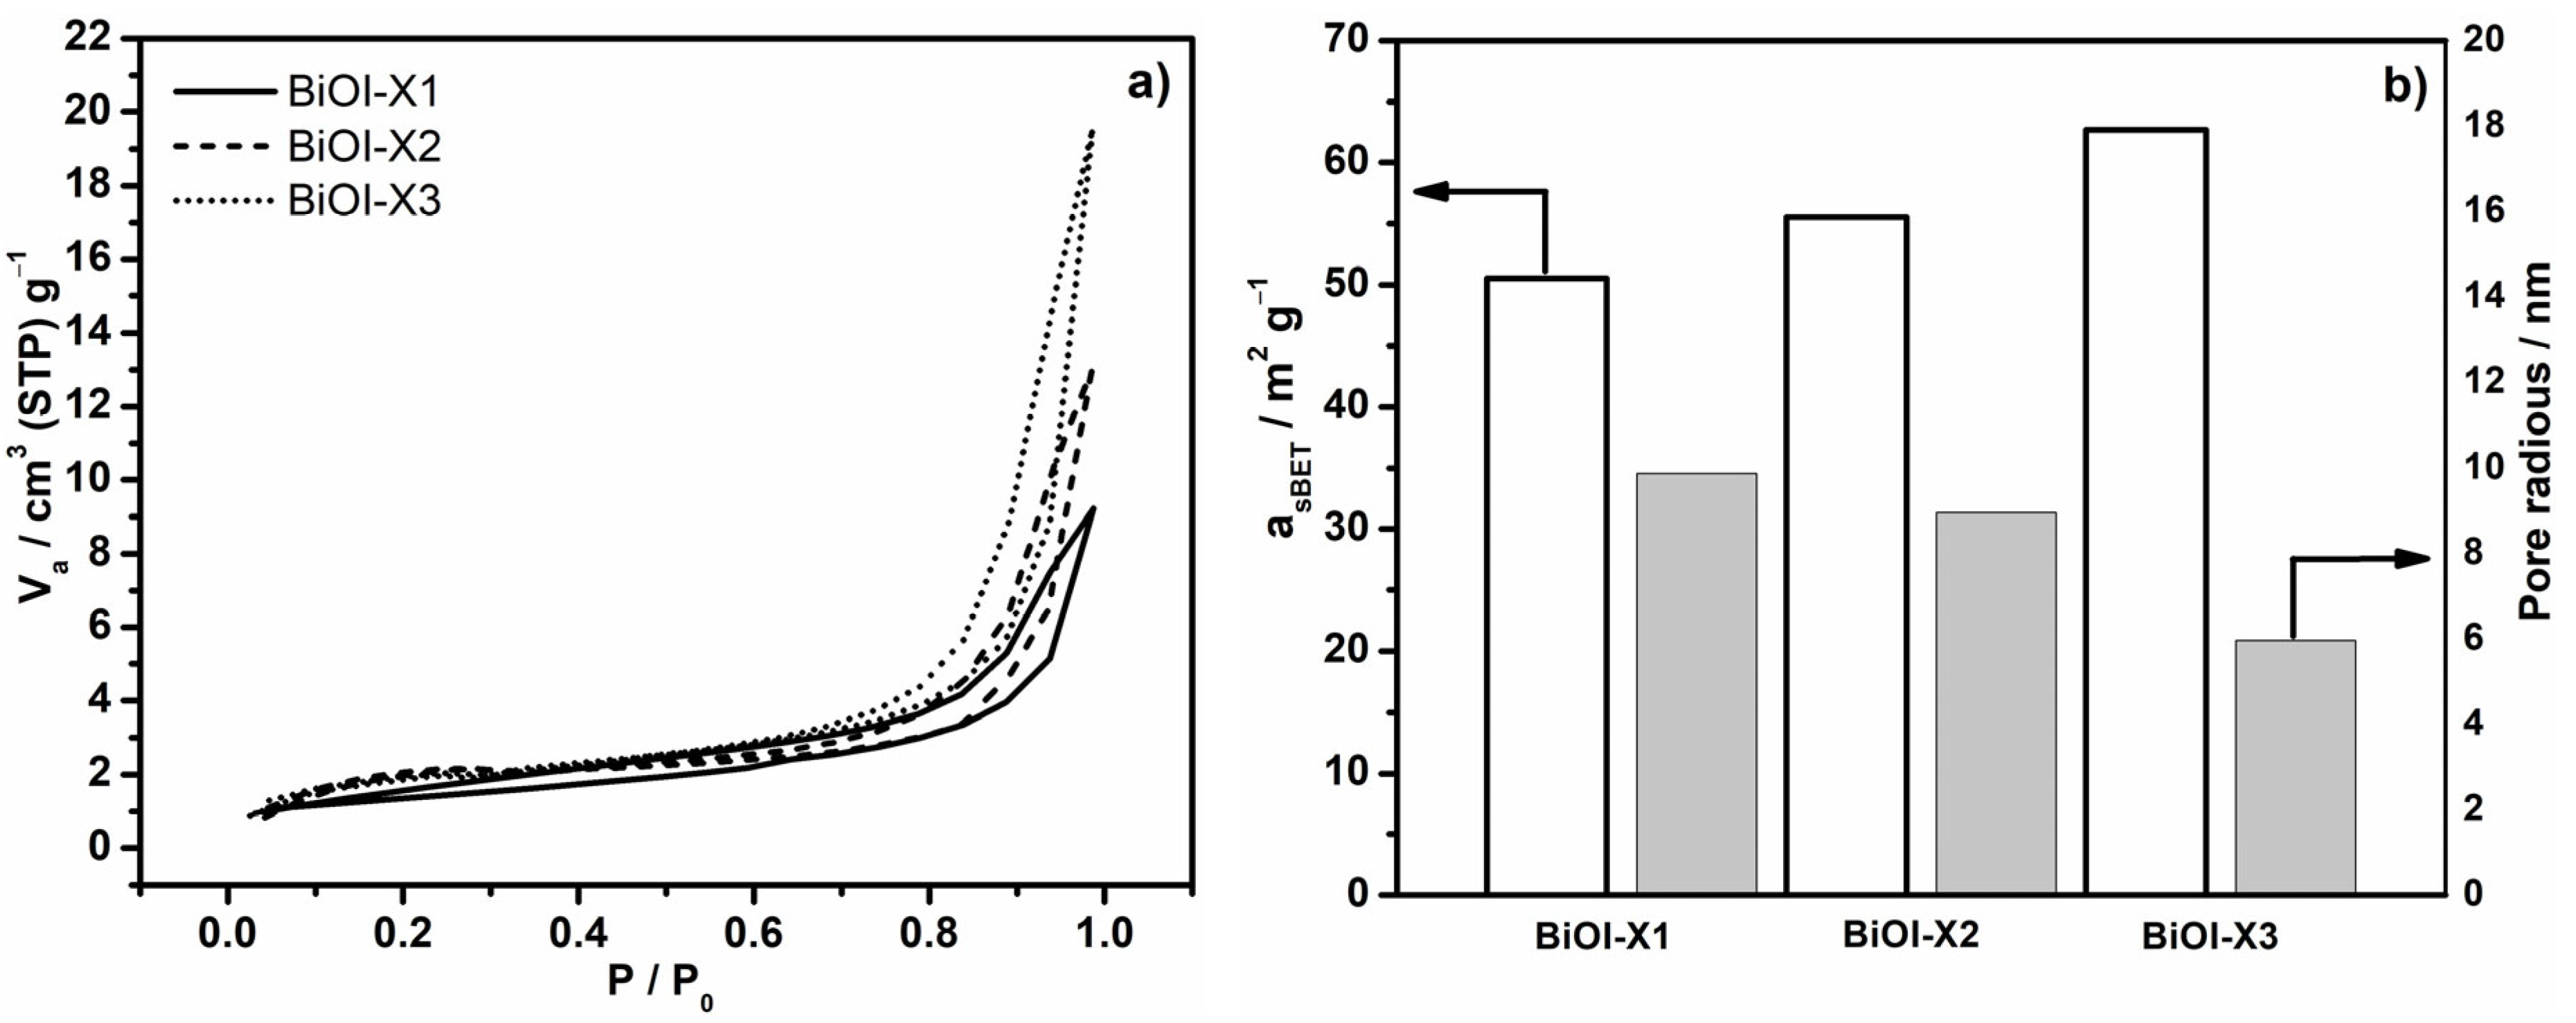
3.3. BET Area (asBET) and Pore Radius Estimations

N2 adsorption–desorption isotherms were obtained to calculate the specific surface area (asBET) using the Brunauer, Emmett, and Teller method. Additionally, the pore diameter was determined using the Barrett–Joyner–Halenda (BJH) model, and the results are shown in Figure 4a and Figure 4b, respectively. The three samples exhibit the characteristic shape of a Type IV isotherm, commonly associated with macroporous adsorbents [24,25,26]. BiOI-X1, BiOI-X2, and BiOI-X3 presented surface areas of 50.5 m2 g−1, 55.5 m2 g−1, and 62.7 m2 g−1, respectively, which is consistent with the higher N2 uptake observed in the isotherms. In agreement with the BET surface area, the pore diameter decreases when the BET area increases: BiOI-X1, BiOI-X2, and BiOI-X3 had pore radii of 9.9 nm, 8.9 nm, and 6 nm. A smaller pore radius could enhance catalytic performance, depending on reactant diffusion and surface accessibility; thus, BiOI-X3 tended to be the most efficient catalytic material [27]. Subsequently, BiOI-X3 was selected to perform the (photo)electrochemical measurements and CO2 photo(electro)reduction.

3.4. Electrochemical Characterization

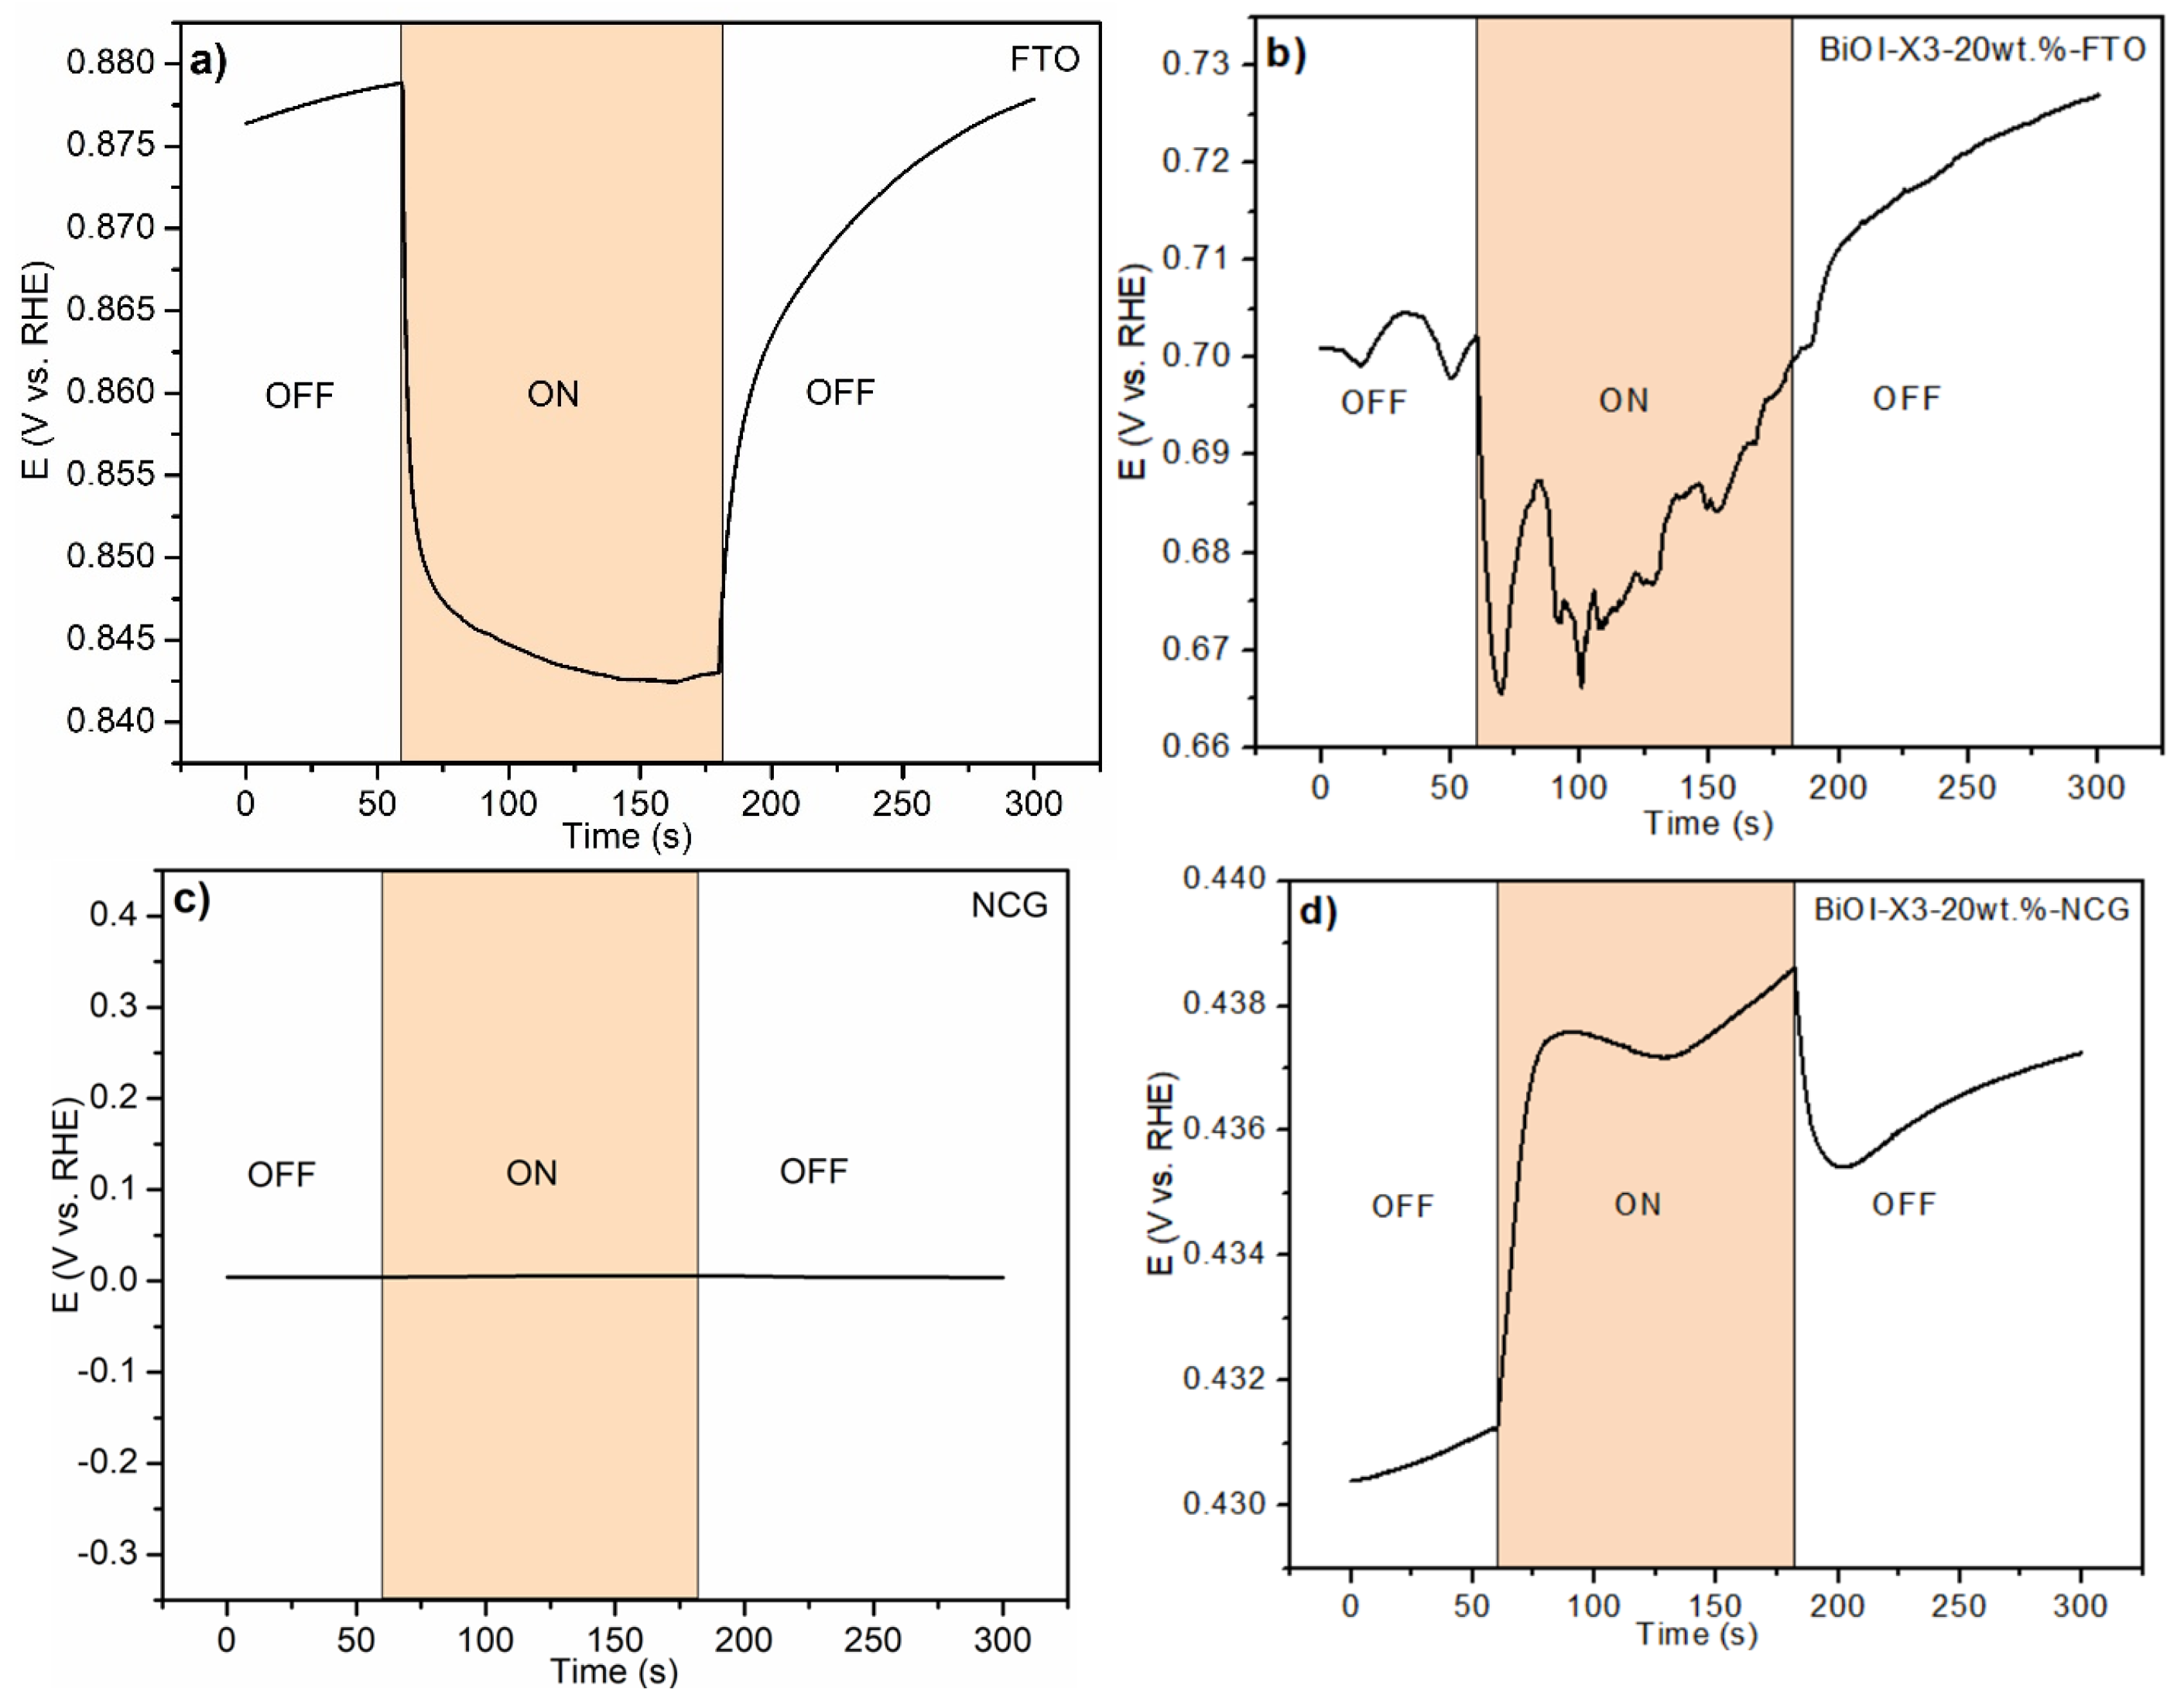
3.4.1. Open-Circuit Potential Transients

Open-circuit potential (OCP) transient measurements were performed to determine the charge carrier separation efficiency and identify the semiconductor type. In general, when a semiconductor electrode is exposed to sufficiently energetic photons, electrons in the material can be excited and promoted to the conduction band. If this excitation takes place within the bulk of the semiconductor, the excited electrons and the resulting holes often recombine, releasing energy as heat. However, if the excitation occurs in the depletion region, the electric field there can drive the separation of these charge carriers [28].
In an n-type semiconductor under light irradiation, the static electric field drives the photo-generated electrons inward towards the bulk, while the holes move towards the solution. As charge separation continues, the electric field in the depletion region gradually weakens and eventually vanishes. During this process, the Fermi level shifts upward (closer to the conduction band) from the redox potential level. Once an equilibrium is reached and no net electric field remains, the separated charge carriers begin to recombine within the depletion region. This charge separation results in the generation of a potential, known as the photovoltage, which stabilizes at a specific value under equilibrium conditions. Finally, in a p-type semiconductor under illumination, the electrostatic field forces electrons to move to the solution and holes to the interior of the semiconductor. Therefore, the static electric field of the depletion region is reduced until it becomes zero due to charge separation, and the Fermi energy level decreases to closer to the valence band [29]. Summarizing, under illumination, if the semiconductor material exhibits an n-type behavior, the curve displays a potential decrease due to electron accumulation on the material’s surface, whereas a p-type semiconductor depicts a potential increase as the presence of holes is the signal registered on the semiconductor surface [30,31,32].
The sample used for the electrochemical measurements was BiOI synthesized at 160 °C with a threefold increase in the initial reagent amount (BiOI-X3). Figure 5 presents the electrochemical response of two electrodes fabricated using different methodologies (see Section 2.2 and Section 2.3). Figure 5a and Figure 5b show the OCP response of the bare FTO support and the electrode fabricated by depositing the electrocatalytic ink containing 20 wt.% BiOI-X3 (BiOI-X3-20wt.%-FTO), respectively. On the other hand, Figure 5c and Figure 5d depict the OCP response of the NCG electrode and an electrode deposited with an active coating containing 20 wt.% BiOI-X3 onto the NCG (BiOI-X3-20wt.%-NCG), respectively. The samples mentioned above were used to represent the electric response depicted when FTO or NCG were used to fabricate electrodes; however, all the OCP transient plots for electrodes containing 1 to 15 wt.% BiOI-X3 presented the same behavior (Figure S3).
The bare FTO response (Figure 5a) shows a potential decrease when the electrode is irradiated; such behavior is in agreement with the n-type feature of FTO electrodes [33]. However, when BiOI is deposited onto an FTO electrode (Figure 5b), the signal is not stable and it is possible to observe periods where the potential tends to decrease, even when the material is under irradiation. As BiOI is reported to be a p-type semiconductor, BiOI photoactivation should promote a potential increase. Such instability results from a non-homogeneous BiOI deposition over the FTO support (Figure S4). On the other hand, Figure 5c presents the OCP response for the NCG; as expected, there is no electric signal. However, when this electrode is modified by adding BiOI (Figure 5d), an evident potential variation occurs under irradiation, indicating the p-type feature of BiOI. Although this signal is less intense than the response of the BiOI/FTO electrode, it does not exhibit potential inverse signals, indicating a clear signal that corresponds with the BiOI semiconductor. This electrode fabrication procedure is, therefore, a suitable tool for conducting accurate PEC measurements on semiconductor materials.

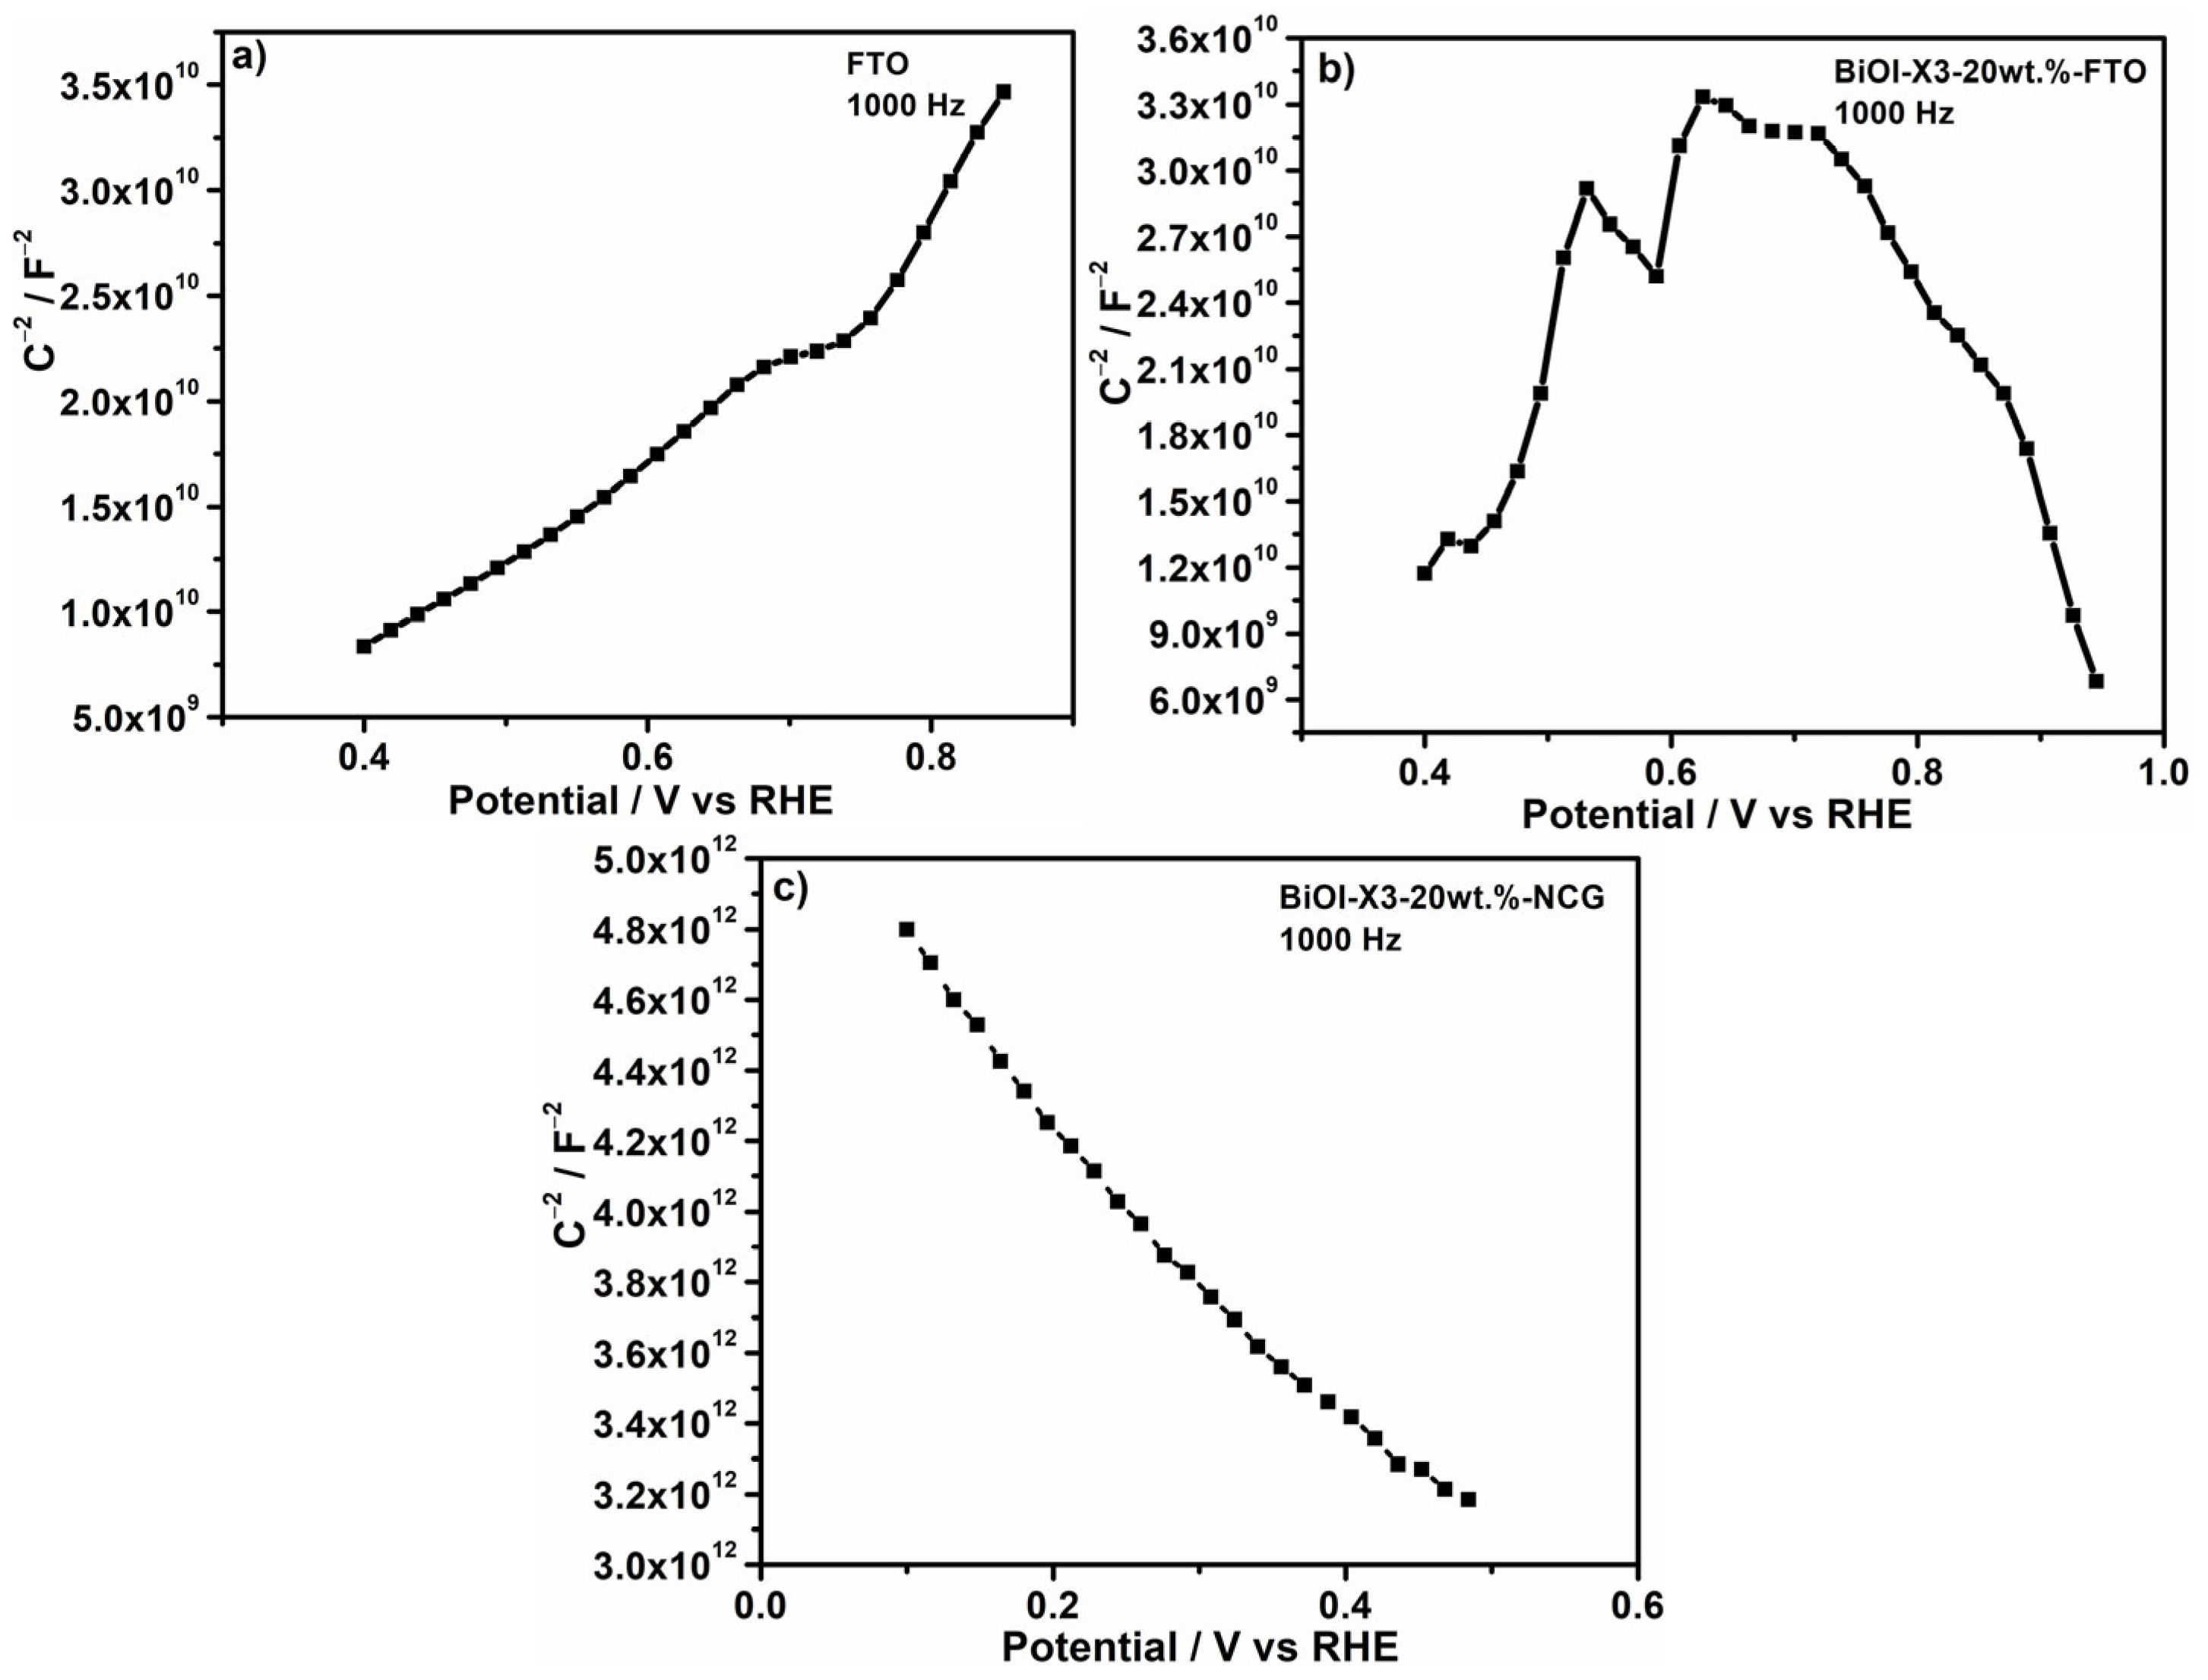
3.4.2. Mott–Schottky Measurements

To confirm the intrinsic semiconductor features, Mott–Schottky plots were obtained from potentiodynamic electrochemical impedance tests, measuring the capacitive response at 1000 Hz in a non-faradic region and substituting it in the equation as follows:
1 C s c 2 = 2 q N A 2 Ɛ Ɛ 0 E E f b k T q
where Csc is the capacity of the charge space, N is the concentration of charge carriers (an electron donor for n-type or a hole acceptor for p-type semiconductors), q is the electronic charge, Ɛ is the relative electric permittivity, Ɛ0 is the electric permittivity of the vacuum, A is the surface area, k is the Boltzmann constant, T is the absolute temperature, Efb is the flat potential, and E is the applied potential [34]. Using this approximation method, when 1/Csc2 vs. E is plotted, it is possible to obtain a straight line with a positive or negative slope. The negative slope observed in this plot indicates a p-type semiconductor layer as it is inversely related to the acceptor concentration. Conversely, a positive slope in the same plot signifies the presence of an n-type semiconductor [35,36,37].
Figure 6a, Figure 6b and Figure 6c depict the Mott–Schottky plots for FTO, BiOI-X3-20wt.%-FTO, and BiOI-X3-20wt.%-NCG, respectively. As mentioned in the OCP tests, the positive slope for the FTO electrode confirms the n-type nature of the material. In contrast, BiOI-X3-20wt.%-NCG exhibits a negative 1/Csc2 slope, indicating a p-type response. Regarding the BiOI-X3-20wt.%-FTO electrode, the resulting plot shows a poorly defined correlation because it presents curves with both positive and negative slopes caused by the material’s duality. This is because BiOI (p-type) was deposited onto an FTO (n-type) support, thus corroborating that BiOI deposition onto FTO is a good strategy to avoid the FTO support contribution.

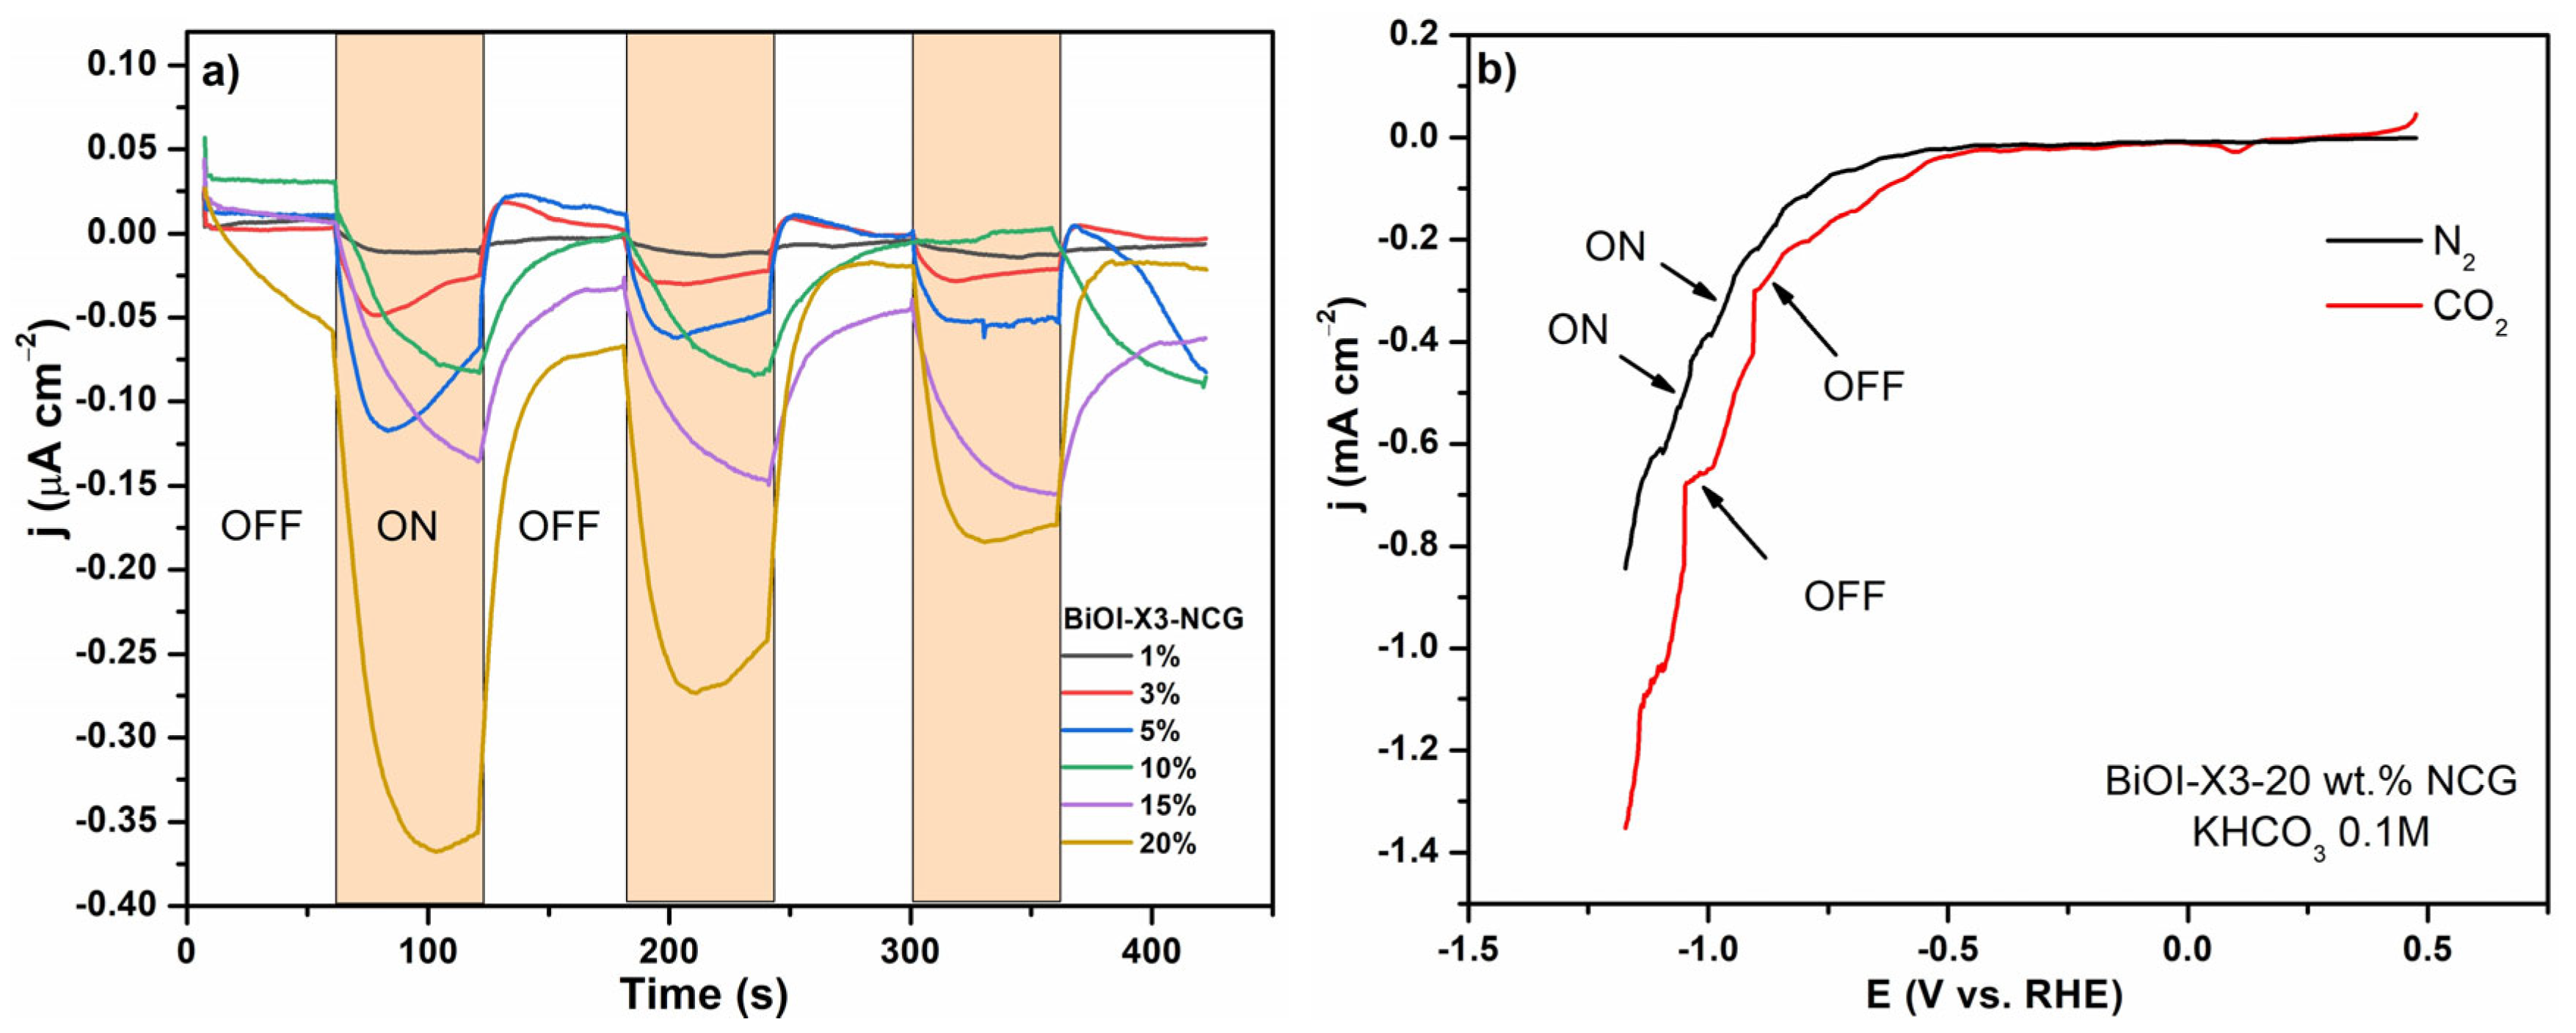
3.4.3. Photo(electro)chemical Response

The photocurrent response was obtained for electrodes where BiOI-X3 (1, 3, 5, 10, 15, and 20 wt.%) was deposited onto NCG (Figure 7a). Electrodes were immersed in a 0.1 M KHCO3 solution at the equilibrium potential. KHCO3 plays the role of an electrolyte and, more importantly, is a source of bicarbonate ions (HCO3), which facilitates the reduction of CO2. KHCO3 acts as a CO2 carrier, improving its adsorption on the electrode surface. Finally, this solution helps to maintain a stable pH, thereby controlling the reaction system [38,39]. From this plot, it is evident that electrodes exhibit photoactivity when exposed to light. As the electrodes were not fabricated from FTO glass, the signals confirm the p-type semiconductor feature of BiOI [40]. To ensure that the electrochemical response is caused by electron transfer across the BiOI coating, the OCP response of the bare electrode with the silver paint exposed and then covered by the BiOI coating was ascertained, and is presented in Figure S5. The plot reveals that the silver plate exhibits a slight potential decrease, whereas the electrode with the BiOI coating displays a positive shift under light irradiation conditions, thereby confirming that the p-type signal originates from the BiOI coating.
According to the BiOI amount, the electrodes exhibited a quasi-proportional increase in photocurrent; however, it is worth mentioning that high BiOI concentrations could lead to the aggregation or poor adhesion of the material. Notwithstanding, the sample containing 20 wt.% showed the highest photocurrent value.
BiOI-X3-20wt.%-NCG was used to evaluate the PEC CO2 reduction activity. Figure 7b depicts the LSV, where it is possible to observe the BiOI electrode in a solution, both (i) N2-saturated and (ii) CO2-saturated. In the first condition, the electrochemical reduction signal is attributed to the PEC hydrogen evolution reaction (HER); however, under CO2 saturation conditions, it is possible to observe the following three features in the current–potential curve: (i) a shift in the onset potential towards more positive values, (ii) the reduction current shifts towards a less negative potential, and (iii) the final current at −1.17 V vs. RHE increases from −0.85 to −1.35 mA cm−2, thus indicating PEC CO2 reduction activity for BiOI-X3-20wt.%-NCG.

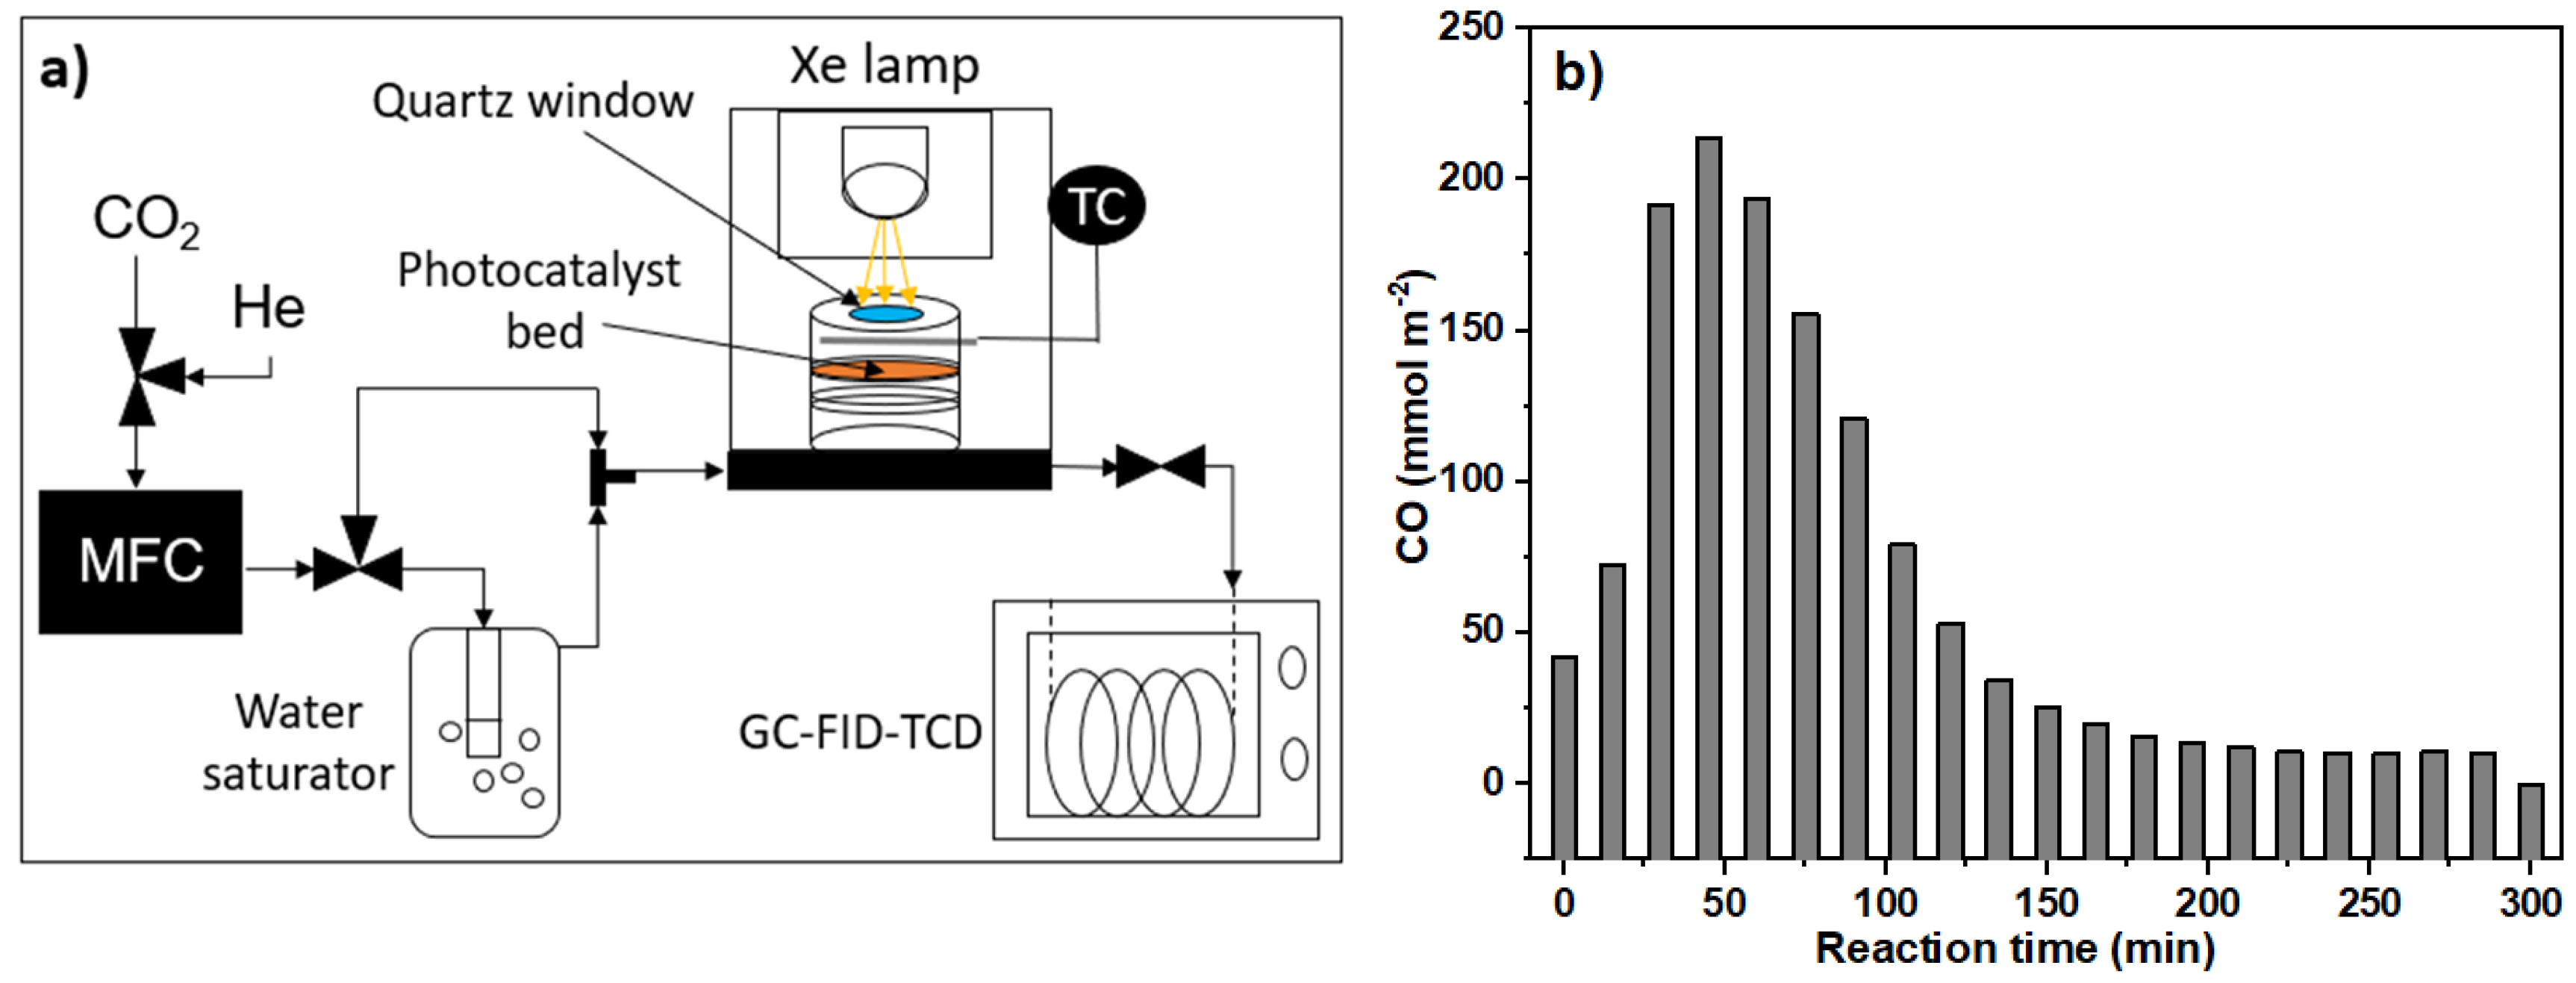
3.4.4. Photocatalytic Activity in Gaseous Media

The photocatalytic CO2 conversion reaction was conducted using a continuous-flow system. The reactor effluent was analyzed using a gas chromatograph, as shown in Figure 8a. The CEL-GPRT100 reactor consists of a glass container with a gas-diffusion glassy porous filter (4.5 cm in diameter), where the photocatalytic material (250 mg) was evenly supported.
The test was performed at 80 °C using an electronic proportional–integral–derivative temperature control (TC). The reactor feed and effluent were analyzed using a gas chromatograph (GC) equipped with a flame ionization detector (FID) and a thermal conductivity detector (TCD) connected to a GS-Gaspro column (30 m × 0.32 mm) for product separation. As a result of the photocatalytic test, as shown in Figure 8b, it is possible to observe that CO was the main reduction product detected; the maximum CO production (214 mmol m−2) was achieved within the first 150 min. After this period, the production rate dropped significantly, with only ~25 mmol m−2 produced in the second half of the experiment (150–300 min). Such an evaluation confirms that BiOI-X3 exhibits photocatalytic activity towards CO2 reduction in gaseous media. To ensure material stability, a new XRD measurement was performed after the photocatalytic test, revealing that the material does not undergo structural modification (Figure S6). This suggests that BiOI-X3 is a suitable and stable material for preparing photoactive coatings for CO2 conversion.
Considering the physicochemical properties, electrochemical characterization, and photo(electro)catalytic tests, BiOI-X3-20wt.%-NCG (material synthesized by tripling the reagents at 160 °C, containing 20 wt.% BiOI, and supported on NCG) depicted photocatalytic activity to perform the CO2RR. Such performance is boosted by a smaller pore size, rougher surface, and enhanced surface area, which are promoted by the modification in the synthesis parameters. As expected, the photocatalytic test in gaseous media revealed that BiOI presents activity in converting CO2 to CO. In this way, electro- and photocatalytic tests confirmed the promising application of BiOI oxyhalide as a photocatalytic coating for air pollution remediation.

4. Conclusions

A modification to the solvothermal synthesis process, consisting of an equimolar increase (tripling) in reagents, allowed the fabrication of a BiOI compound (BiOI-X3) with a narrow pore size, rougher particles, and a higher surface area. Such enhanced properties were exploited to fabricate a photocatalytic BiOI coating deposited onto NCG, which was electrochemically characterized through the fabrication of electrodes. Fabricating non-conventional electrodes using non-conductive supports enabled the registration of the electrochemical response of pure BiOI, thereby avoiding photocatalytic signals from the conductive supports (FTO or ITO) typically used for electrode fabrication. The photoelectrocatalytic response of the coatings revealed that the electrodes containing 20 wt.% BiOI showed the highest photocurrent. In the presence of an aqueous solution containing CO2, BiOI-X3-20wt.%-NCG presented sufficient activity to perform a photoelectrochemical CO2RR. Finally, the photoactive BiOI material was evaluated for photocatalytic CO2 conversion in a gaseous phase. The evaluation showed an effective conversion registering CO as the reaction product; the results allow the consideration of BiOI as a valuable material for coating fabrication for environmental remediation.

Supplementary Materials

The following supporting information can be downloaded at: https://www.mdpi.com/article/10.3390/pr13072292/s1, Figure S1: Fabrication of (a) FTO and (b) non-conductive glass electrodes; Figure S2: BiOI synthesized at 150 °C (a) and 160 °C (b); Figure S3: OCP transients for electrodes containing a BiOI coating (1 to 15 wt.% BiOI-X3) onto FTO and NCG; Figure S4: Transversal cut for a BiOI-coated FTO electrode; Figure S5: OCP transients for the NCG + Ag paint vs. NCG + Ag paint + BiOI coating; Figure S6: XRD measurement performed after the photocatalytic evaluation.

Author Contributions

Conceptualization, J.M.M.-H.; Methodology, J.M.M.-H. and A.H.-R.; Validation, J.M.M.-H. and A.H.-R.; Formal analysis, J.M.M.-H.; Investigation, J.M.M.-H.; Resources, J.M.M.-H. and A.H.-R.; Data curation, J.M.M.-H. and A.H.-R.; Writing—original draft, J.M.M.-H.; Writing—review and editing, J.M.M.-H. and A.H.-R.; Visualization, J.M.M.-H. All authors have read and agreed to the published version of the manuscript.

Funding

The authors thank Secihti for financial support for this research from the following project: Investigadoras e Investigadores por Mexico Secihti—ID7708.

Data Availability Statement

The original contributions presented in this study are included in the article/Supplementary Materials. Further inquiries can be directed to the corresponding author.

Acknowledgments

We thank L.Q.I. and Milton Ronaldo Perez Magdaleno for the technical assistance in conducting the photocatalytic tests.

Conflicts of Interest

The authors declare no conflict of interest.

References

  1. Fernandez-Guzman, D.; Lavarello, R.; Yglesias-González, M.; Hartinger, S.M.; Rojas-Rueda, D. A scoping review of the health co-benefits of climate mitigation strategies in South America. Lancet Reg. Health Am. 2023, 26, 100602. [Google Scholar] [CrossRef]
  2. Filonchyk, M.; Peterson, M.P.; Zhang, L.; Hurynovich, V.; He, Y. Greenhouse gases emissions and global climate change: Examining the influence of CO2, CH4, and N2O. Sci. Total. Environ. 2024, 935, 173359. [Google Scholar] [CrossRef]
  3. Prăvălie, R. Major perturbations in the Earth’s forest ecosystems. Possible implications for global warming. Earth-Sci. Rev. 2018, 185, 544–571. [Google Scholar] [CrossRef]
  4. Deng, H.-M.; Liang, Q.-M.; Liu, L.-J.; Anadon, L.D. Co-benefits of greenhouse gas mitigation: A review and classification by type, mitigation sector, and geography. Environ. Res. Lett. 2017, 12, 123001. [Google Scholar] [CrossRef]
  5. Chakravorty, A.; Roy, S. A review of photocatalysis, basic principles, processes, and materials. Sustain. Chem. Environ. 2024, 8, 100155. [Google Scholar] [CrossRef]
  6. Atacan, K.; Güy, N.; Özacar, M. Recent advances in photocatalytic coatings for antimicrobial surfaces. Curr. Opin. Chem. Eng. 2022, 36, 100777. [Google Scholar] [CrossRef]
  7. Pichat, P. 4.16—Photocatalytic Coatings. In Comprehensive Materials Processing; Hashmi, S., Ed.; Elsevier: Oxford, UK, 2014; pp. 413–423. [Google Scholar]
  8. Brattich, E.; Barbano, F.; Pulvirenti, B.; Pilla, F.; Bacchetti, M.; Di Sabatino, S. The effect of photocatalytic coatings on NOx concentrations in real-world street canyons. Build. Environ. 2021, 205, 108312. [Google Scholar] [CrossRef]
  9. Gandolfo, A.; Bartolomei, V.; Truffier-Boutry, D.; Temime-Roussel, B.; Brochard, G.; Bergé, V.; Wortham, H.; Gligorovski, S. The impact of photocatalytic paint porosity on indoor NOx and HONO levels. Phys. Chem. Chem. Phys. 2020, 22, 589–598. [Google Scholar] [CrossRef]
  10. Yu, X.; Yang, J.; Ye, K.; Fu, X.; Zhu, Y.; Zhang, Y. Facile one-step synthesis of BiOCl/BiOI heterojunctions with exposed {001} facet for highly enhanced visible light photocatalytic performances. Inorg. Chem. Commun. 2016, 71, 45–49. [Google Scholar] [CrossRef]
  11. Jagt, R.A.; Huq, T.N.; Börsig, K.M.; Sauven, D.; Lee, L.C.; MacManus-Driscolla, J.L.; Hoye, R.L.Z. Controlling the preferred orientation of layered BiOI solar absorbers. J. Mater. Chem. C 2020, 8, 10791–10797. [Google Scholar] [CrossRef]
  12. Liu, J.; Shi, J.; Deng, H. Current status of research on BiOX-based heterojunction photocatalytic systems: Synthesis methods, photocatalytic applications and prospects. J. Environ. Chem. Eng. 2023, 11, 110311. [Google Scholar] [CrossRef]
  13. Zhang, X.; Lou, B.; Li, D.; Hong, W.; Yu, Y.; Li, J.; Wang, E. A universal method for the preparation of functional ITO electrodes with ultrahigh stability. Chem. Commun. 2015, 51, 6788–6791. [Google Scholar] [CrossRef] [PubMed]
  14. de la Cruz, P.T.S.; Irikura, K.; Lachgar, A.; Cardoso, J.C.; Cavero, H.A.; Zanoni, M.V.B. Preparation of FTO/CU2O Electrode Protected by PEDOT:PSS and Its Better Performance in the Photoelectrocatalytic Reduction of CO2 to Methanol. Electrocatalysis 2020, 11, 546–554. [Google Scholar] [CrossRef]
  15. Chang, C.; Zhu, L.; Fu, Y.; Chu, X. Highly active Bi/BiOI composite synthesized by one-step reaction and its capacity to degrade bisphenol A under simulated solar light irradiation. Chem. Eng. J. 2013, 233, 305–314. [Google Scholar] [CrossRef]
  16. Sriwong, C.; Choojun, K.; Sriwong, S. High photocatalytic performance of 3D porous-structured TiO2@natural rubber hybrid sheet on the removal of indigo carmine dye in water. SN Appl. Sci. 2019, 1, 864. [Google Scholar] [CrossRef]
  17. Burton, A.W.; Ong, K.; Rea, T.; Chan, I.Y. On the estimation of average crystallite size of zeolites from the Scherrer equation: A critical evaluation of its application to zeolites with one-dimensional pore systems. Microporous Mesoporous Mater. 2009, 117, 75–90. [Google Scholar] [CrossRef]
  18. Nandiyanto, A.B.D.; Zaen, R.; Oktiani, R. Correlation between crystallite size and photocatalytic performance of micrometer-sized monoclinic WO3 particles. Arab. J. Chem. 2020, 13, 1283–1296. [Google Scholar] [CrossRef]
  19. Devi, L.G.; Kottam, N.; Kumar, S.G. Preparation and Characterization of Mn-Doped Titanates with a Bicrystalline Framework: Correlation of the Crystallite Size with the Synergistic Effect on the Photocatalytic Activity. J. Phys. Chem. C 2009, 113, 15593–15601. [Google Scholar] [CrossRef]
  20. Devi, L.G.; Murthy, B.N.; Kumar, S.G. Photocatalytic activity of TiO2 doped with Zn2+ and V5+ transition metal ions: Influence of crystallite size and dopant electronic configuration on photocatalytic activity. Mater. Sci. Eng. B 2010, 166, 1–6. [Google Scholar] [CrossRef]
  21. Wang, X.; Sø, L.; Su, R.; Wendt, S.; Hald, P.; Mamakhel, A.; Yang, C.; Huang, Y.; Iversen, B.B.; Besenbacher, F. The influence of crystallite size and crystallinity of anatase nanoparticles on the photo-degradation of phenol. J. Catal. 2014, 310, 100–108. [Google Scholar] [CrossRef]
  22. Murillo-Sierra, J.; Hernández-Ramírez, A.; Pino-Sandoval, D.; Ruiz-Ruiz, E.; Martínez-Hernández, A. Promoting multielectron CO2 reduction using a direct Z-scheme WO3/ZnS photocatalyst. J. CO2 Util. 2022, 63, 102122. [Google Scholar] [CrossRef]
  23. Chico-Vecino, M.; Murillo-Sierra, J.C.; Pino-Sandoval, D.A.; Hinojosa-Reyes, L.; Maya-Treviño, M.L.; Contreras, D.; Hernández-Ramírez, A. Preparation of WO3/In2O3 heterojunctions and their performance on the CO2 photocatalytic conversion in a continuous flow reactor. J. Environ. Chem. Eng. 2023, 11, 110372. [Google Scholar] [CrossRef]
  24. Rahman, M.; Shafiullah, A.Z.; Pal, A.; Islam, A.; Jahan, I.; Saha, B.B. Study on Optimum IUPAC Adsorption Isotherm Models Employing Sensitivity of Parameters for Rigorous Adsorption System Performance Evaluation. Energies 2021, 14, 7478. [Google Scholar] [CrossRef]
  25. Thommes, M.; Kaneko, K.; Neimark, A.V.; Olivier, J.P.; Rodriguez-Reinoso, F.; Rouquerol, J.; Sing, K.S.W. Physisorption of gases, with special reference to the evaluation of surface area and pore size distribution (IUPAC Technical Report). Pure Appl. Chem. 2015, 87, 1051–1069. [Google Scholar] [CrossRef]
  26. Rosa, D.; Cimini, G.; Bracciale, M.P.; Felici, A.C.; Di Palma, L. Iron-doped titania nanoparticles supported on polystyrene for photocatalytic treatment of contaminated water in a continuous system. J. Photochem. Photobiol. A Chem. 2024, 447, 115241. [Google Scholar] [CrossRef]
  27. Karthik, P.; Vinoth, R.; Babu, S.G.; Wen, M.; Kamegawa, T.; Yamashita, H.; Neppolian, B. Synthesis of highly visible light active TiO2-2-naphthol surface complex and its application in photocatalytic chromium(vi) reduction. RSC Adv. 2015, 5, 39752–39759. [Google Scholar] [CrossRef]
  28. Berglund, S.P.; Abdi, F.F.; Bogdanoff, P.; Chemseddine, A.; Friedrich, D.; van de Krol, R. Comprehensive Evaluation of CuBi2O4 as a Photocathode Material for Photoelectrochemical Water Splitting. Chem. Mater. 2016, 28, 4231–4242. [Google Scholar] [CrossRef]
  29. Muhibbullah, M.; Haleem, A.M.A. Estimation of the Open Circuit Voltage of a pn Junction Based on Photoelectrochemical Measurements. Trans. Mater. Res. Soc. Jpn. 2015, 40, 247–252. [Google Scholar] [CrossRef]
  30. Juodkazis, K.; Juodkazytė, J.; Šebeka, B.; Savickaja, I.; Juodkazis, S. Photoelectrochemistry of silicon in HF solution. J. Solid State Electrochem. 2013, 17, 2269–2276. [Google Scholar] [CrossRef]
  31. Hu, E.; Chen, Q.; Gao, Q.; Fan, X.; Luo, X.; Wei, Y.; Wu, G.; Deng, H.; Xu, S.; Wang, P.; et al. Cyano-Functionalized Graphitic Carbon Nitride with Adsorption and Photoreduction Isosite Achieving Efficient Uranium Extraction from Seawater. Adv. Funct. Mater. 2024, 34, 2312215. [Google Scholar] [CrossRef]
  32. Zare, M.; Solaymani, S.; Shafiekhani, A.; Kulesza, S.; Ţălu, Ş.; Bramowicz, M. Evolution of rough-surface geometry and crystalline structures of aligned TiO2 nanotubes for photoelectrochemical water splitting. Sci. Rep. 2018, 8, 10870. [Google Scholar] [CrossRef] [PubMed]
  33. Kafle, B.P. Effect of Precursor Fluorine Concentration Optical and Electrical Properties of Fluorine Doped Tin Oxide thin Films. Mater. Today Proc. 2021, 47, 6389–6397. [Google Scholar] [CrossRef]
  34. Kumar, S.; Ahirwar, S.; Satpati, A.K. Insight into the PEC and interfacial charge transfer kinetics at the Mo doped BiVO4photoanodes. RSC Adv. 2019, 9, 41368–41382. [Google Scholar] [CrossRef] [PubMed]
  35. Karazehir, T.; Ates, M.; Sarac, A.S. Mott–Schottky and Morphologic Analysis of Poly(Pyrrole-N-Propionic Acid) in various electrolyte systems. Int. J. Electrochem. Sci. 2015, 10, 6146–6163. [Google Scholar] [CrossRef]
  36. Xin, C.; Wang, Y.; Zhang, S.; Xu, L.; Yu, Y.; Xiang, H.; Wu, W.; Hua, J. Energy Band Transition and Voltage Compensation via Surface Stoichiometry Alteration in p-Type Dye-Sensitized Solar Cells. Phys. Status Solidi (RRL)—Rapid Res. Lett. 2017, 11, 1700258. [Google Scholar] [CrossRef]
  37. Saber, S.; Mollar, M.; El Nahrawy, A.; Khattab, N.; Eid, A.; Abo-Aly, M.; Marí, B. Annealing study of electrodeposited CuInSe2 and CuInS2 thin films. Opt. Quantum Electron. 2018, 50, 248. [Google Scholar] [CrossRef]
  38. Zhong, H.; Fujii, K.; Nakano, Y. Electroactive species study in the electrochemical reduction of CO2 in KHCO3 solution at elevated temperature. J. Energy Chem. 2016, 25, 517–522. [Google Scholar] [CrossRef]
  39. Zhong, H.; Fujii, K.; Nakano, Y. Effect of KHCO3 Concentration on Electrochemical Reduction of CO2 on Copper Electrode. J. Electrochem. Soc. 2017, 164, F923. [Google Scholar] [CrossRef]
  40. Mora-Hernandez, J.M.; Herrera, L.A.A.; Garay-Rodriguez, L.F.; Torres-Martínez, L.M.; Hernandez-Perez, I. An enhanced photo(electro)catalytic CO2 reduction onto advanced BiOX (X = Cl, Br, I) semiconductors and the BiOI–PdCu composite. Heliyon 2023, 9, e20605. [Google Scholar] [CrossRef]
Figure 1. X-ray diffraction patterns for (a) BiOI synthesized at different temperatures and (b) BiOI synthesized at 160 °C, doubling (X2) and tripling (X3) the reagent amount.
Processes 13 02292 g001
Figure 2. Scanning electron microscopy at 10,000× for BiOI synthesized at (a) 140 °C, (b) 150 °C, (c) 160 °C, and (d) 170 °C.
Processes 13 02292 g002
Figure 3. Scanning electron microscopy at 20,000× for BiOI at 160 °C: (a) (X1) and after (b) doubling (X2) and (c) tripling (X3) the reagent amount.
Processes 13 02292 g003
Figure 4. (a) N2 adsorption–desorption isotherms and (b) surface area (asBET) and pore radius estimations.
Processes 13 02292 g004
Figure 5. OCP transient measurements for (a) FTO glass, (b) BiOI on FTO glass, (c) NCG, and (d) BiOI on NCG.
Processes 13 02292 g005
Figure 6. Mott–Schottky plots for FTO (a), BiOI-X3-20wt.%-FTO (b), and BiOI-X3-20wt.%-NCG obtained (c) at 1000 Hz in a nitrogen-saturated 0.1 M KHCO3 aqueous solution.
Processes 13 02292 g006
Figure 7. (a) Chronoamperometry transient measurements at the equilibrium potential of electrode loading from 1 to 20 wt.% BiOI; (b) linear scan voltammetry of the BiOI-X3-20wt.%-NCG sample in the presence of N2- and CO2-saturated solutions.
Processes 13 02292 g007
Figure 8. (a) Experimental arrangement for the photocatalytic evaluation in gaseous media; (b) CO photocatalytic production in gaseous media.
Processes 13 02292 g008
Disclaimer/Publisher’s Note: The statements, opinions and data contained in all publications are solely those of the individual author(s) and contributor(s) and not of MDPI and/or the editor(s). MDPI and/or the editor(s) disclaim responsibility for any injury to people or property resulting from any ideas, methods, instructions or products referred to in the content.

