Abstract
This study focuses on the multiphase flow in horizontal wells based on distributed acoustic sensing (DAS) monitoring. Through laboratory experiments and field data analysis, it was found that the micro-seismic differences in flow patterns can be clearly observed in the fiber optic micro-seismic waterfall chart. In the case of slug flow, the DAS acoustic energy decreases when the inclination angle increases. The performance of annular flow is similar to that of bubble flow, with the DAS energy increasing as the inclination angle increases. Overall, the order of DAS acoustic energy from the strongest to weakest is slug flow, followed by annular flow, and then bubble flow. The research shows that fiber optic DAS monitoring signals can effectively identify differences in gas volume, well inclination, and flow pattern, which provides an important technical basis and research foundation for the monitoring and analysis of multiphase flow in horizontal wells.
1. Introduction
Multiphase flow phenomena are widespread in nature and industrial applications, especially in the field of petroleum engineering. The multiphase flow state in horizontal wells plays a crucial role in the efficiency and safety of oil and gas extraction [1,2,3]. Traditional multiphase flow monitoring methods, such as tomographic imaging [4], ultrasonic measurements [5], the high-speed camera method [6,7] and the radioactive attenuation methods [8], have demonstrated some utility in addressing production needs. However, these methods exhibit significant limitations, including complex equipment requirements, high maintenance costs, and challenges in achieving real-time, continuous, and high-precision monitoring. Given these constraints, the development of novel monitoring technologies is critical for advancing the surveillance and management of multiphase flow in horizontal wells (Table 1 below presents a comparative analysis of the performance of flow pattern exploration methods).

Table 1.
Performance comparison of flow pattern exploration technologies.
In recent years, the rapid advancement of fiber optic sensing technology has positioned distributed acoustic sensing (DAS) as a promising solution for multiphase flow monitoring in horizontal wells, owing to its distinctive advantages [9,10,11]. Utilizing optical fibers as sensing elements, it can continuously monitor changes in acoustic signals along the length of the optical fiber and convert them into electrical signals to acquire information on variations in physical quantities, such as temperature, strain, and vibration [12,13]. Beyond the real-time monitoring of fluid flow dynamics within the wellbore, DAS provides high-resolution spatial and temporal information, thereby offering a robust technical foundation for the optimized development and management of oil and gas fields.
In China, research on multiphase flow monitoring in horizontal wells based on DAS is undergoing rapid development. A multitude of scientific research institutions and universities have actively conducted studies in this field, achieving significant advancements. For instance, Professor Rao Yunjiang’s team at the University of Electronic Science and Technology of China [14,15,16] has focused on enhancing the sensing performance of DAS systems. By optimizing fiber lasers and detectors, they have enhanced the system’s signal acquisition and processing capabilities. Meanwhile, Professor Cai Haiwen’s team, at the CAS Shanghai Institute of Technical Physics [17], has concentrated on DAS signal demodulation algorithms, proposing multiple efficient signal processing methods to extract multiphase flow information more accurately. In addition, some oil companies and research institutions have also actively explored the practical application of DAS technology for multiphase flow monitoring in horizontal wells. Through field tests and data analysis, they have verified the feasibility and effectiveness of DAS technology in actual production [18,19].
Research on the development and application of distributed acoustic sensing (DAS) technology abroad began relatively earlier and has maintained a leading position globally. OptaSense, a UK-based company, is one of the world’s leading suppliers of DAS technology [20]. Its DAS systems have been extensively deployed in perimeter security, pipeline leak detection, and other fields [21,22], demonstrating exceptional performance in multiphase flow monitoring for horizontal wells. These systems enable the real-time monitoring of parameters, such as pressure, temperature, and flow rate in wellbores, providing comprehensive monitoring solutions for oil and gas production [23]. AP Sensing Company, a German company, also boasts extensive experience in DAS technology research and application [24]. Its DAS systems are characterized by high precision, reliability, and adaptability, effectively addressing multiphase flow monitoring challenges in complex environments. In addition, many universities and research institutions in the United States, Canada, and other countries have also conducted numerous fundamental and applied studies in DAS technology, driving continuous innovation and advancement in this field.
In summary, significant progress has been made domestically and internationally in the research of multiphase flow monitoring in horizontal wells based on DAS, but there are still some challenges, including enhancing monitoring accuracy, reducing system costs, and optimizing signal processing algorithms. In the future, with the continuous development and refinement of fiber optic sensing technology, it is anticipated that the application of DAS technology in multiphase flow monitoring will become more extensive and sophisticated, thereby delivering greater economic and social benefits to the petroleum industry. This paper aims to conduct in-depth research on multiphase flow monitoring in horizontal wells based on DAS, explore its feasibility and effectiveness in practical applications, lay a foundation for promoting the wide application of this technology in the petroleum industry, and thus drive the intelligent development of oilfield monitoring technology.
2. Fiber Optic Monitoring Experiment of Multiphase Flow in Horizontal Wells
2.1. Experimental Setup
Materials and apparatus required for this experiment are as follows: 1—simulated wellbore and adjustable-angle steel frame; 2—water storage container; 3—water pump and air pump; 4—pipe layout area; 5—electromagnetic flowmeter; 6—pressure stabilizing tube; 7—DAS conditioner; 8—optical fiber. The schematic diagram of the experimental setup is shown in Figure 1, where the inner diameter of the pipe is 127 mm and the outer diameter is 140 mm. Both the oil tube and the casing tube are made of transparent material to facilitate flow pattern observation and holdup measurement.
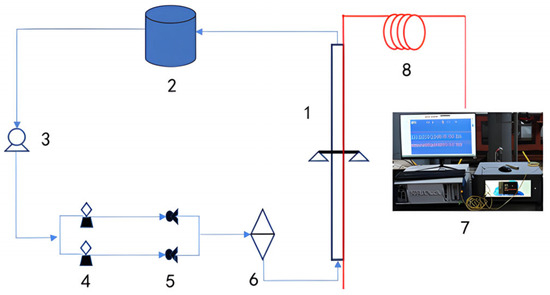
Figure 1.
Schematic diagram of the experimental setup.
Before the experiment, the water storage container was filled with water, and the water pump was installed inside the water storage container. A flexible hose was used to seal and connect the water storage container to the inlet of the glass steel pipe. Additionally, the air pump was sealed and connected to the glass pipe via a small-diameter hose. The liquid circulating through the pipe was tap water, which was pumped from the storage container into the glass steel pipe by the water pump. At the start of the experiment, the control panel was used to set the gas flow rate and liquid flow rate according to the experimental scheme. The fluid flowed from the water storage container through the pipe while air was injected into the pipe. It passed through the pressure pump and entered the simulated wellbore from the hose, and finally, it flowed back into the water storage container from the tail end of the simulated wellbore. The gas was discharged outside the pipe, forming a closed system, as shown in Figure 2. During the experiment, the optical fiber was spirally wound on the outer wall of the simulated wellbore, with a total length of 103.4 m.
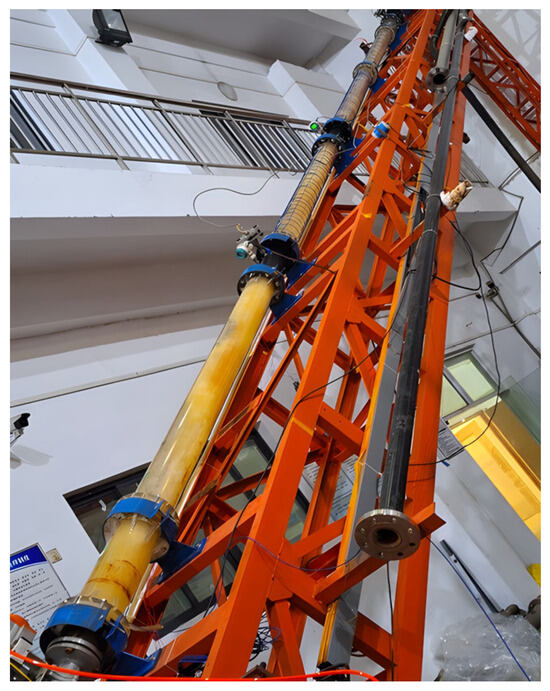
Figure 2.
Photos of the experimental site.
2.2. Experimental Scheme
In this experiment, the optical fiber was arranged and fixed outside the simulated wellbore in various winding methods. The experimental variables were limited to the pipeline horizontal angle and the fluid flow pattern, which were systematically controlled to isolate their effects. The distributed optical fiber acoustic wave sensing system was employed to collect data for subsequent analysis. When analyzing the influence of the pipeline horizontal angle on the fluid flow pattern within the monitoring section, the flow pattern was maintained consistently to ensure reliable comparisons. Similarly, when analyzing the influence of different fluid flow patterns on the monitoring section, the horizontal angle of the pipeline horizontal angle was kept constant to maintain uniform experimental conditions. The experimental scheme is shown in Table 2.
Table 2.
Experimental scheme.
Since the pipeline in this experiment was installed on an automatic lifting platform, the horizontal angle of the pipeline could be directly controlled. In that experiment, there were two situations for controlling the horizontal angle of the pipeline, which were 15° and 30°. The flow pattern in the pipeline was realized by adjusting the proportion of water and gas volume pumped into the pipeline according to the inner diameter size of the pipeline. This experiment simulates three different flow states, namely bubbly flow, slug flow, and annular flow. The fluid media used in the experiment were air and tap water, and the environment had a normal temperature and pressure.
3. Analysis of Experimental Results
3.1. Influence of Gas Flow Rate on Acoustic Response
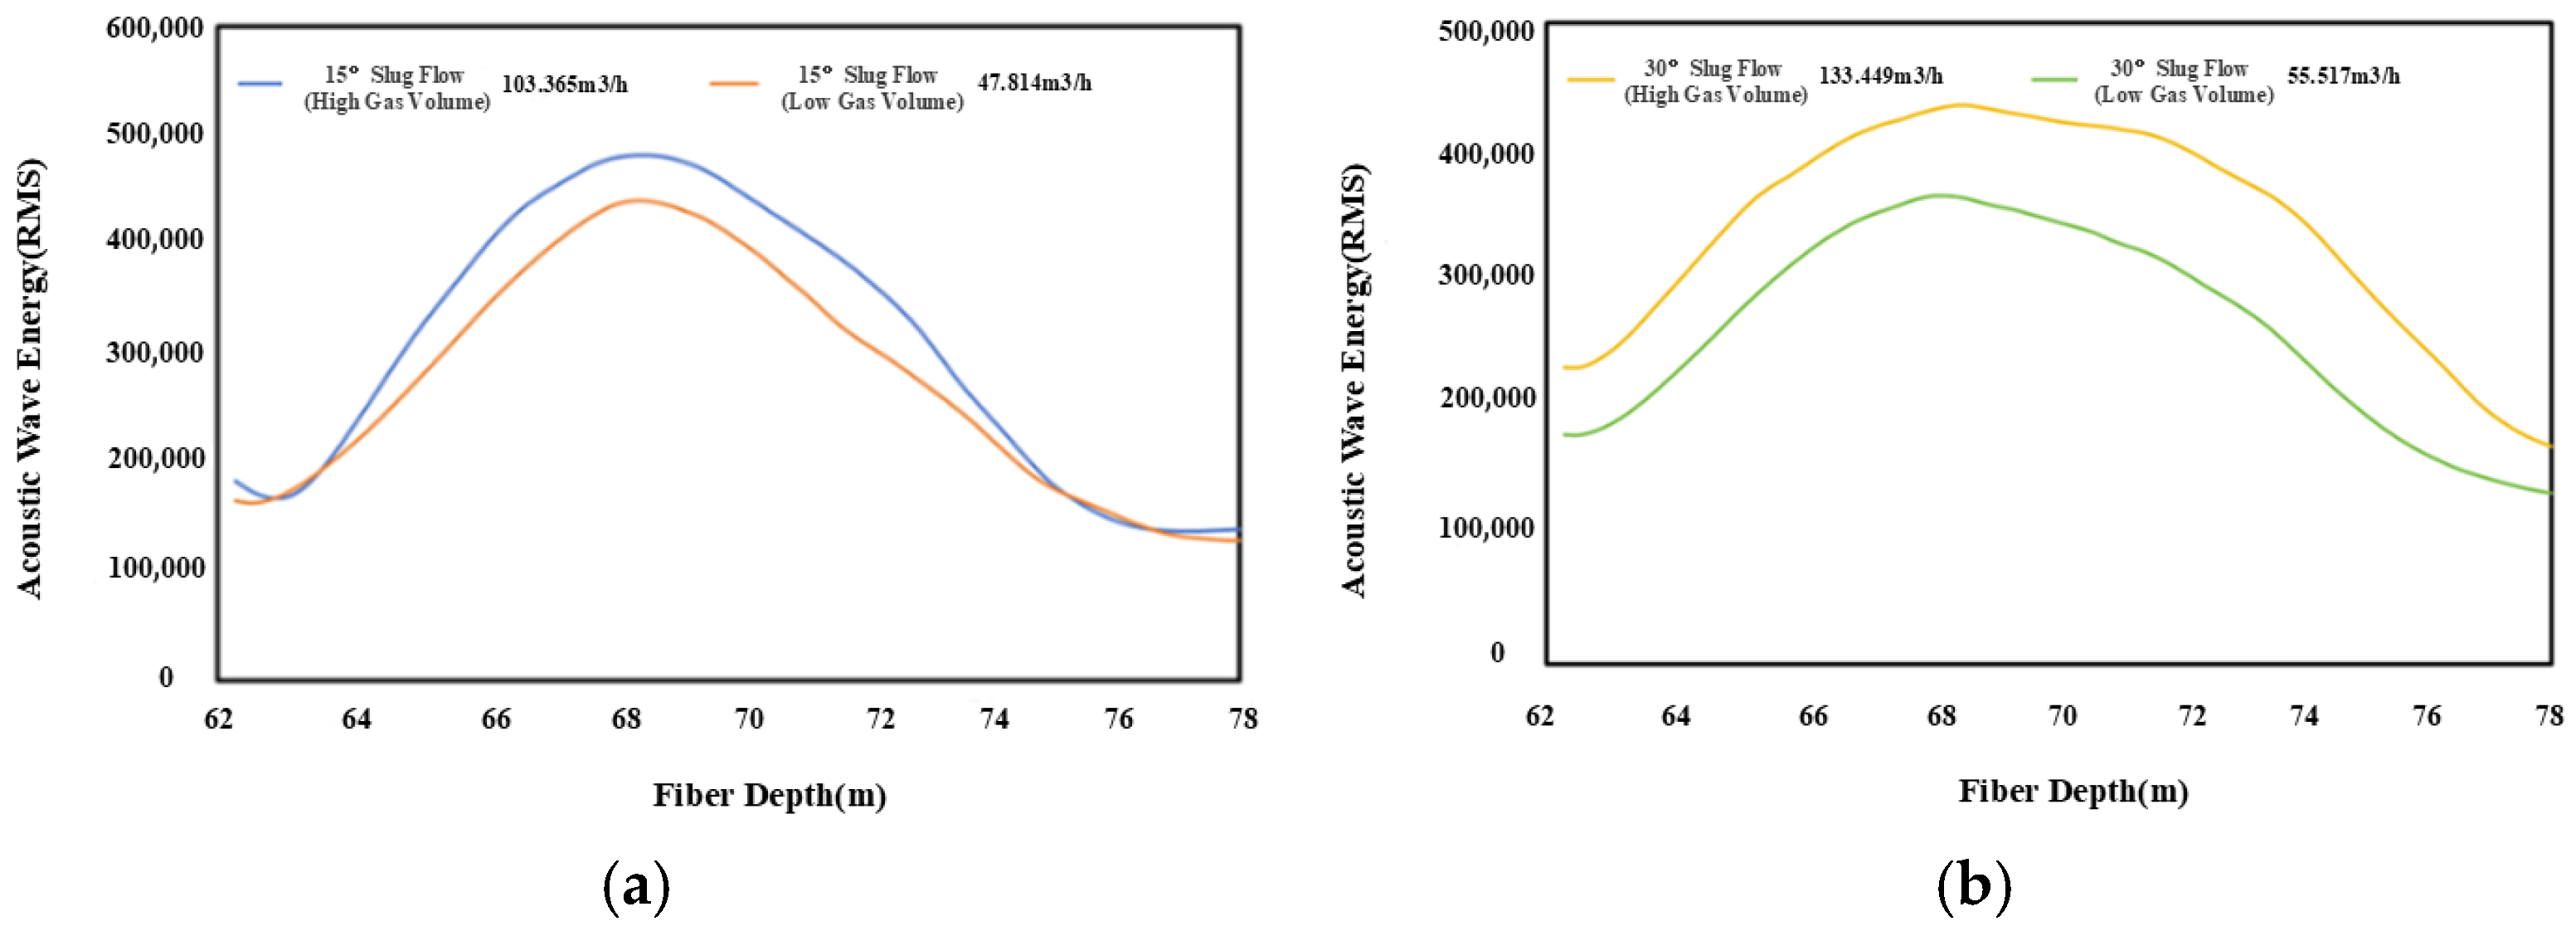
To compare the DAS response characteristics under different gas production rates, this paper analyzed the DAS data under the simulated working conditions of slug flow. As shown in Figure 3, they are the DAS acoustic energy distribution maps in the target test section (62–78 m) under the simulated working conditions of slug flow with high gas volume and slug flow with low gas volume, respectively.
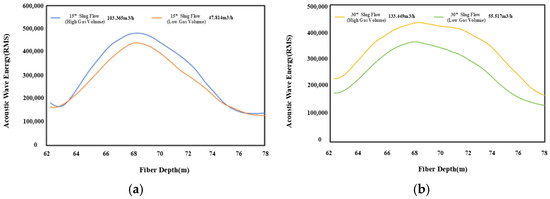
Figure 3.
Simulated wellbore DAS energy distribution under different gas volumes. (a) Inclination angle of 15°. (b) Inclination angle of 30°.
As shown in the figures, with the increase in the gas production rate, the DAS acoustic energy was significantly higher, and the DAS acoustic energy was positively correlated with the gas volume. In the slug flow pattern, no matter what the inclination angle was, the trend that DAS energy increases with the increase in the gas production rate remained unchanged.
3.2. Influence of Inclination Angle on Acoustic Response
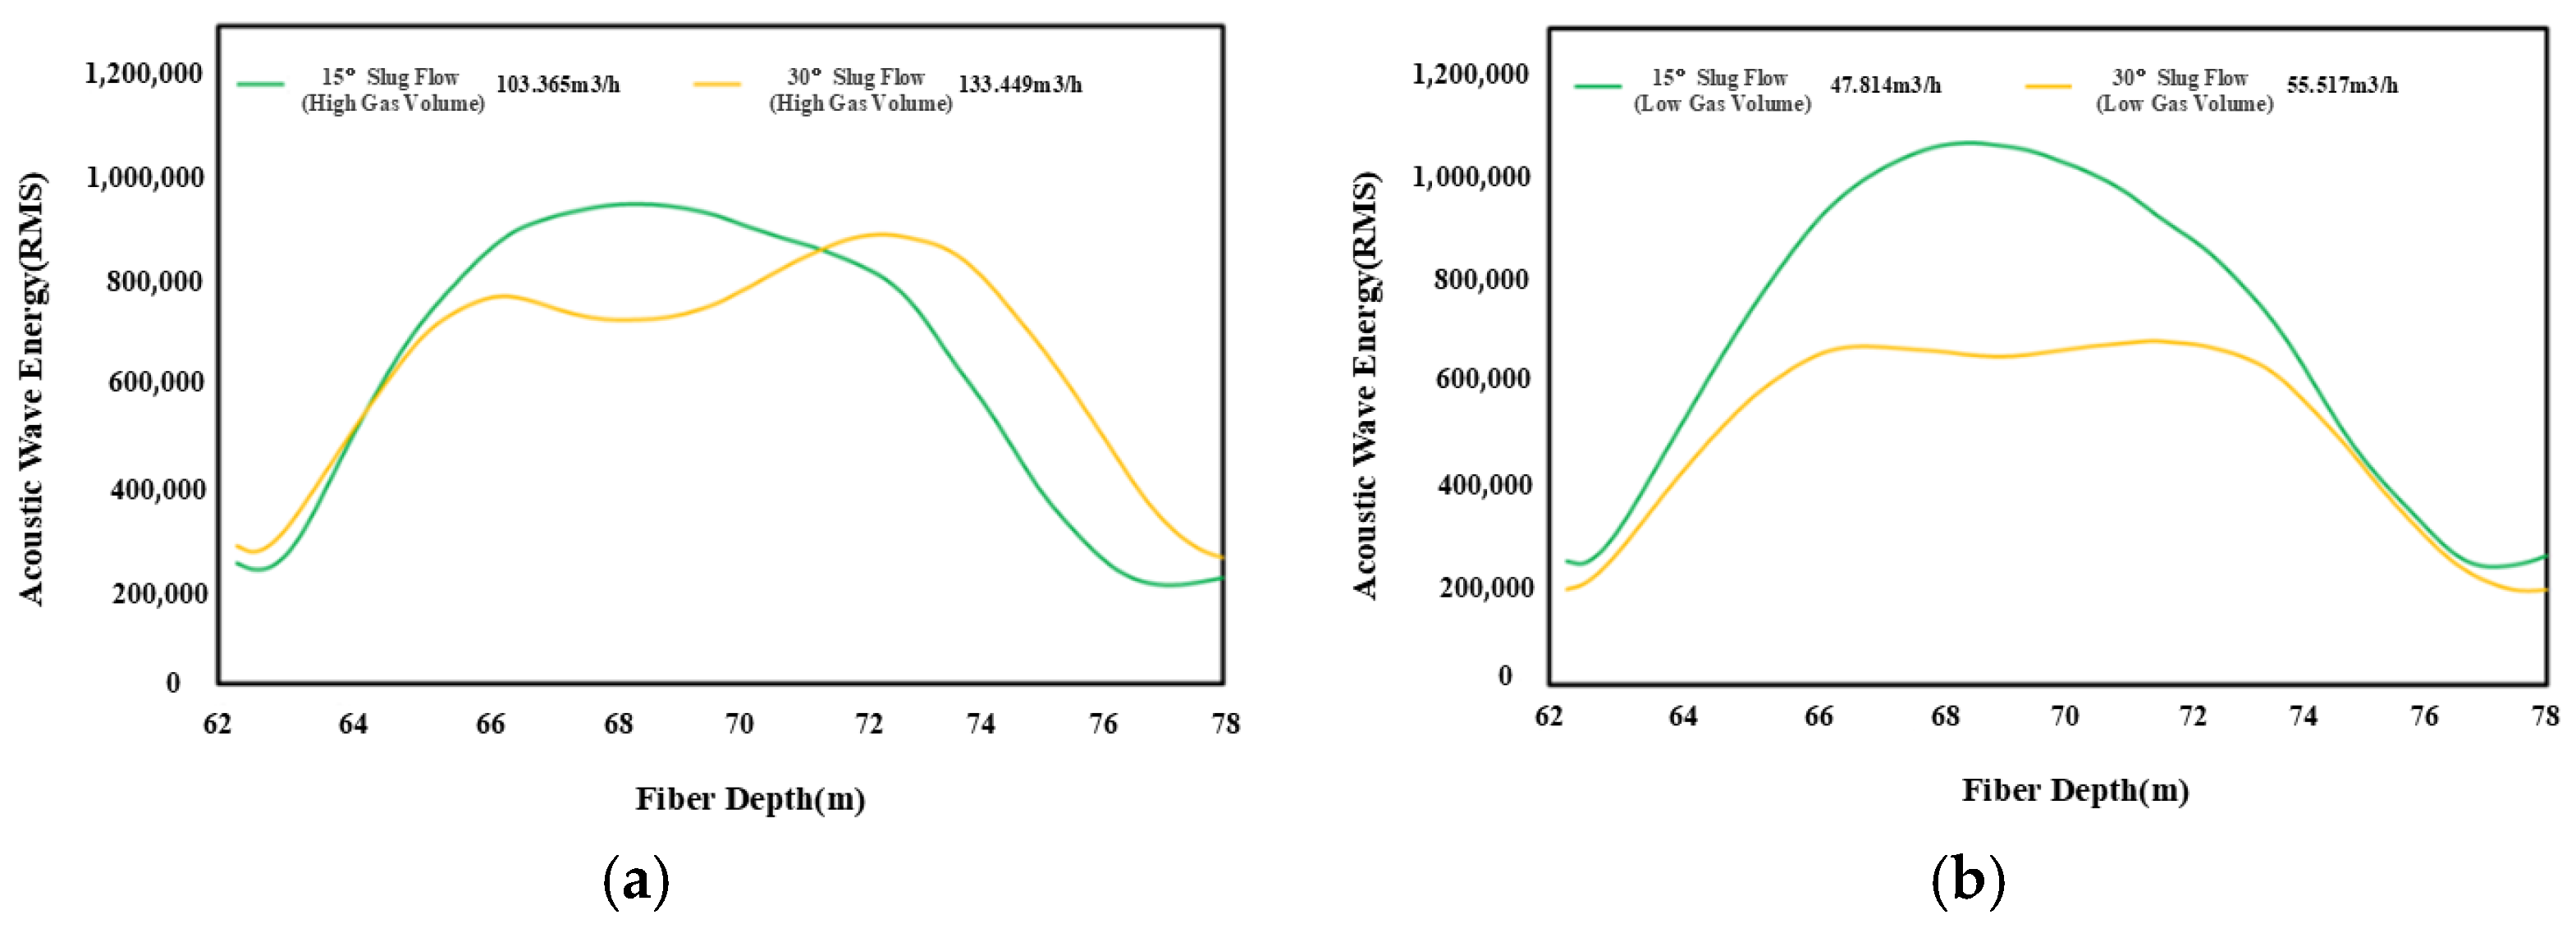
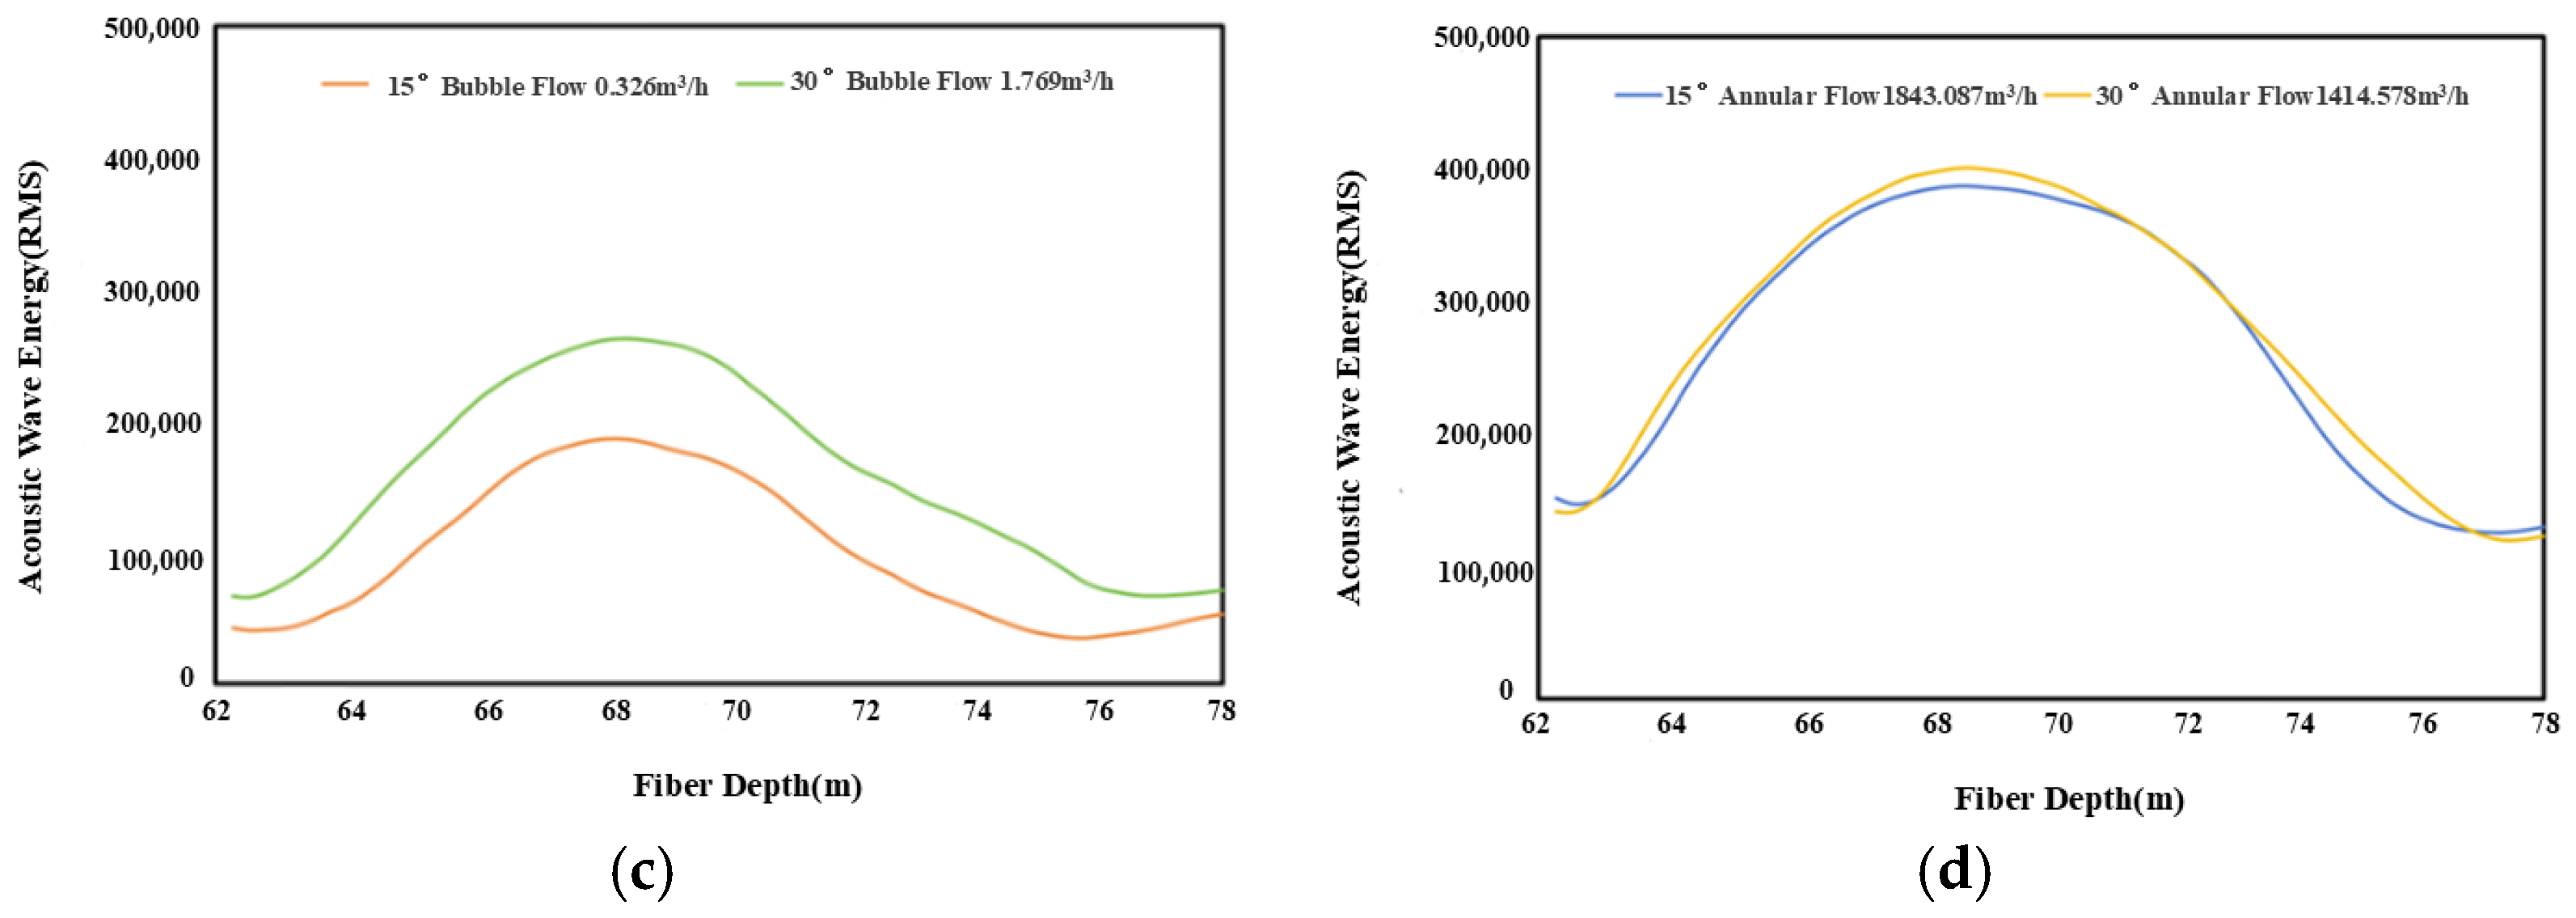
In this paper, the DAS signals under the wellbore angles of 15° and 30° were studied. The influence of the inclination angle on the DAS response under different flow patterns is shown in Figure 4.
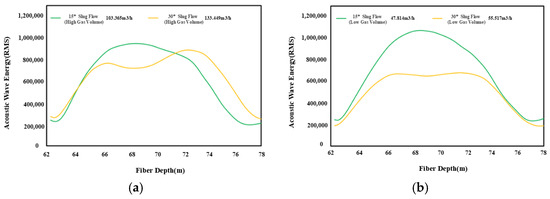
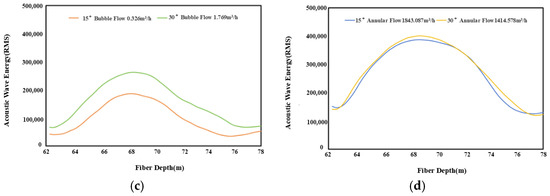
Figure 4.
Comparison of the DAS Responses under different inclination angles. (a) Slug flow (high gas volume). (b) Slug flow (low gas volume). (c) Bubble flow. (d) Annular flow.
This study investigated the DAS signals at wellbore inclinations of 15° and 30° (Figure 4 illustrates the influence of inclination angle on the DAS response under different flow patterns). To better explain the observed trends, we provided a detailed analysis of the working principles and mechanisms involved.
In slug flow (Figure 4a,b), the total DAS energy decreases with an increasing inclination angle, despite higher gas flow rates at 30°. This counterintuitive trend arises from the interplay between gravitational forces and slug dynamics. At steeper angles, gravity accelerates liquid slugs downward, reducing their impact velocity and shortening the duration of pressure fluctuations. Consequently, the acoustic energy generated by slug–wall interactions diminishes. Additionally, the inclined geometry alters acoustic wave propagation pathways, potentially reducing wave reflection and transmission efficiency. These combined effects lead to lower DAS energy at 30° compared to 15°, despite the higher gas flow rate.
For bubble flow (Figure 4c), DAS energy increases with the inclination angle, though this trend may be conflated with the significantly elevated gas flow rate at 30°. The rise of gas bubbles against the liquid phase is critical here: steeper angles enhance buoyancy-driven bubble velocities and coalescence rates, amplifying pressure fluctuations. However, the coupling of inclination angle with gas flow rate complicates interpretation. To isolate the effect of inclination, future experiments should fix gas flow rates while varying the angle. Nonetheless, the observed energy increase suggests that bubble dynamics dominate over wave propagation effects in this regime.
In annular flow (Figure 4d), DAS energy also rises with the inclination angle, though the monotonicity of this trend remains uncertain. Here, gravitational forces induce greater turbulence in the liquid film lining the pipe wall, increasing shear stress and acoustic emissions. The inclined geometry further amplifies wave reflection and refraction phenomena, enhancing energy capture. However, potential non-monotonic behavior at extreme angles hints at complex interactions, such as flow regime transitions or secondary flow patterns, which require further exploration across a broader range of inclinations (0° to 90°).
Underlying these observations are two key mechanisms: flow dynamics and acoustic wave propagation. The inclination angle disrupts the balance between gravitational and inertial forces, altering slug formation, bubble rise, and liquid film stability. Concurrently, the wellbore’s geometry reshapes acoustic wave behavior, modulating signal attenuation and reflection. For instance, in slug flow, reduced slug–wall interactions at steeper angles suppress acoustic energy, whereas in annular flow, enhanced liquid film turbulence amplifies it. These mechanisms highlight the sensitivity of DAS responses to both multiphase interactions and geometric constraints.
Future work will address confounding variables by decoupling the inclination angle from flow rate effects. By fixing gas and liquid flow rates, while varying the inclination from 0° to 90°, we aimed to clarify the role of geometry alone on DAS signals. Additionally, exploring extreme angles will reveal whether non-monotonic trends emerge due to flow regime transitions or other phenomena. This refined experimental design will deepen the understanding of DAS sensitivity to wellbore orientation, enabling more robust applications in subsea monitoring and multiphase flow diagnostics.
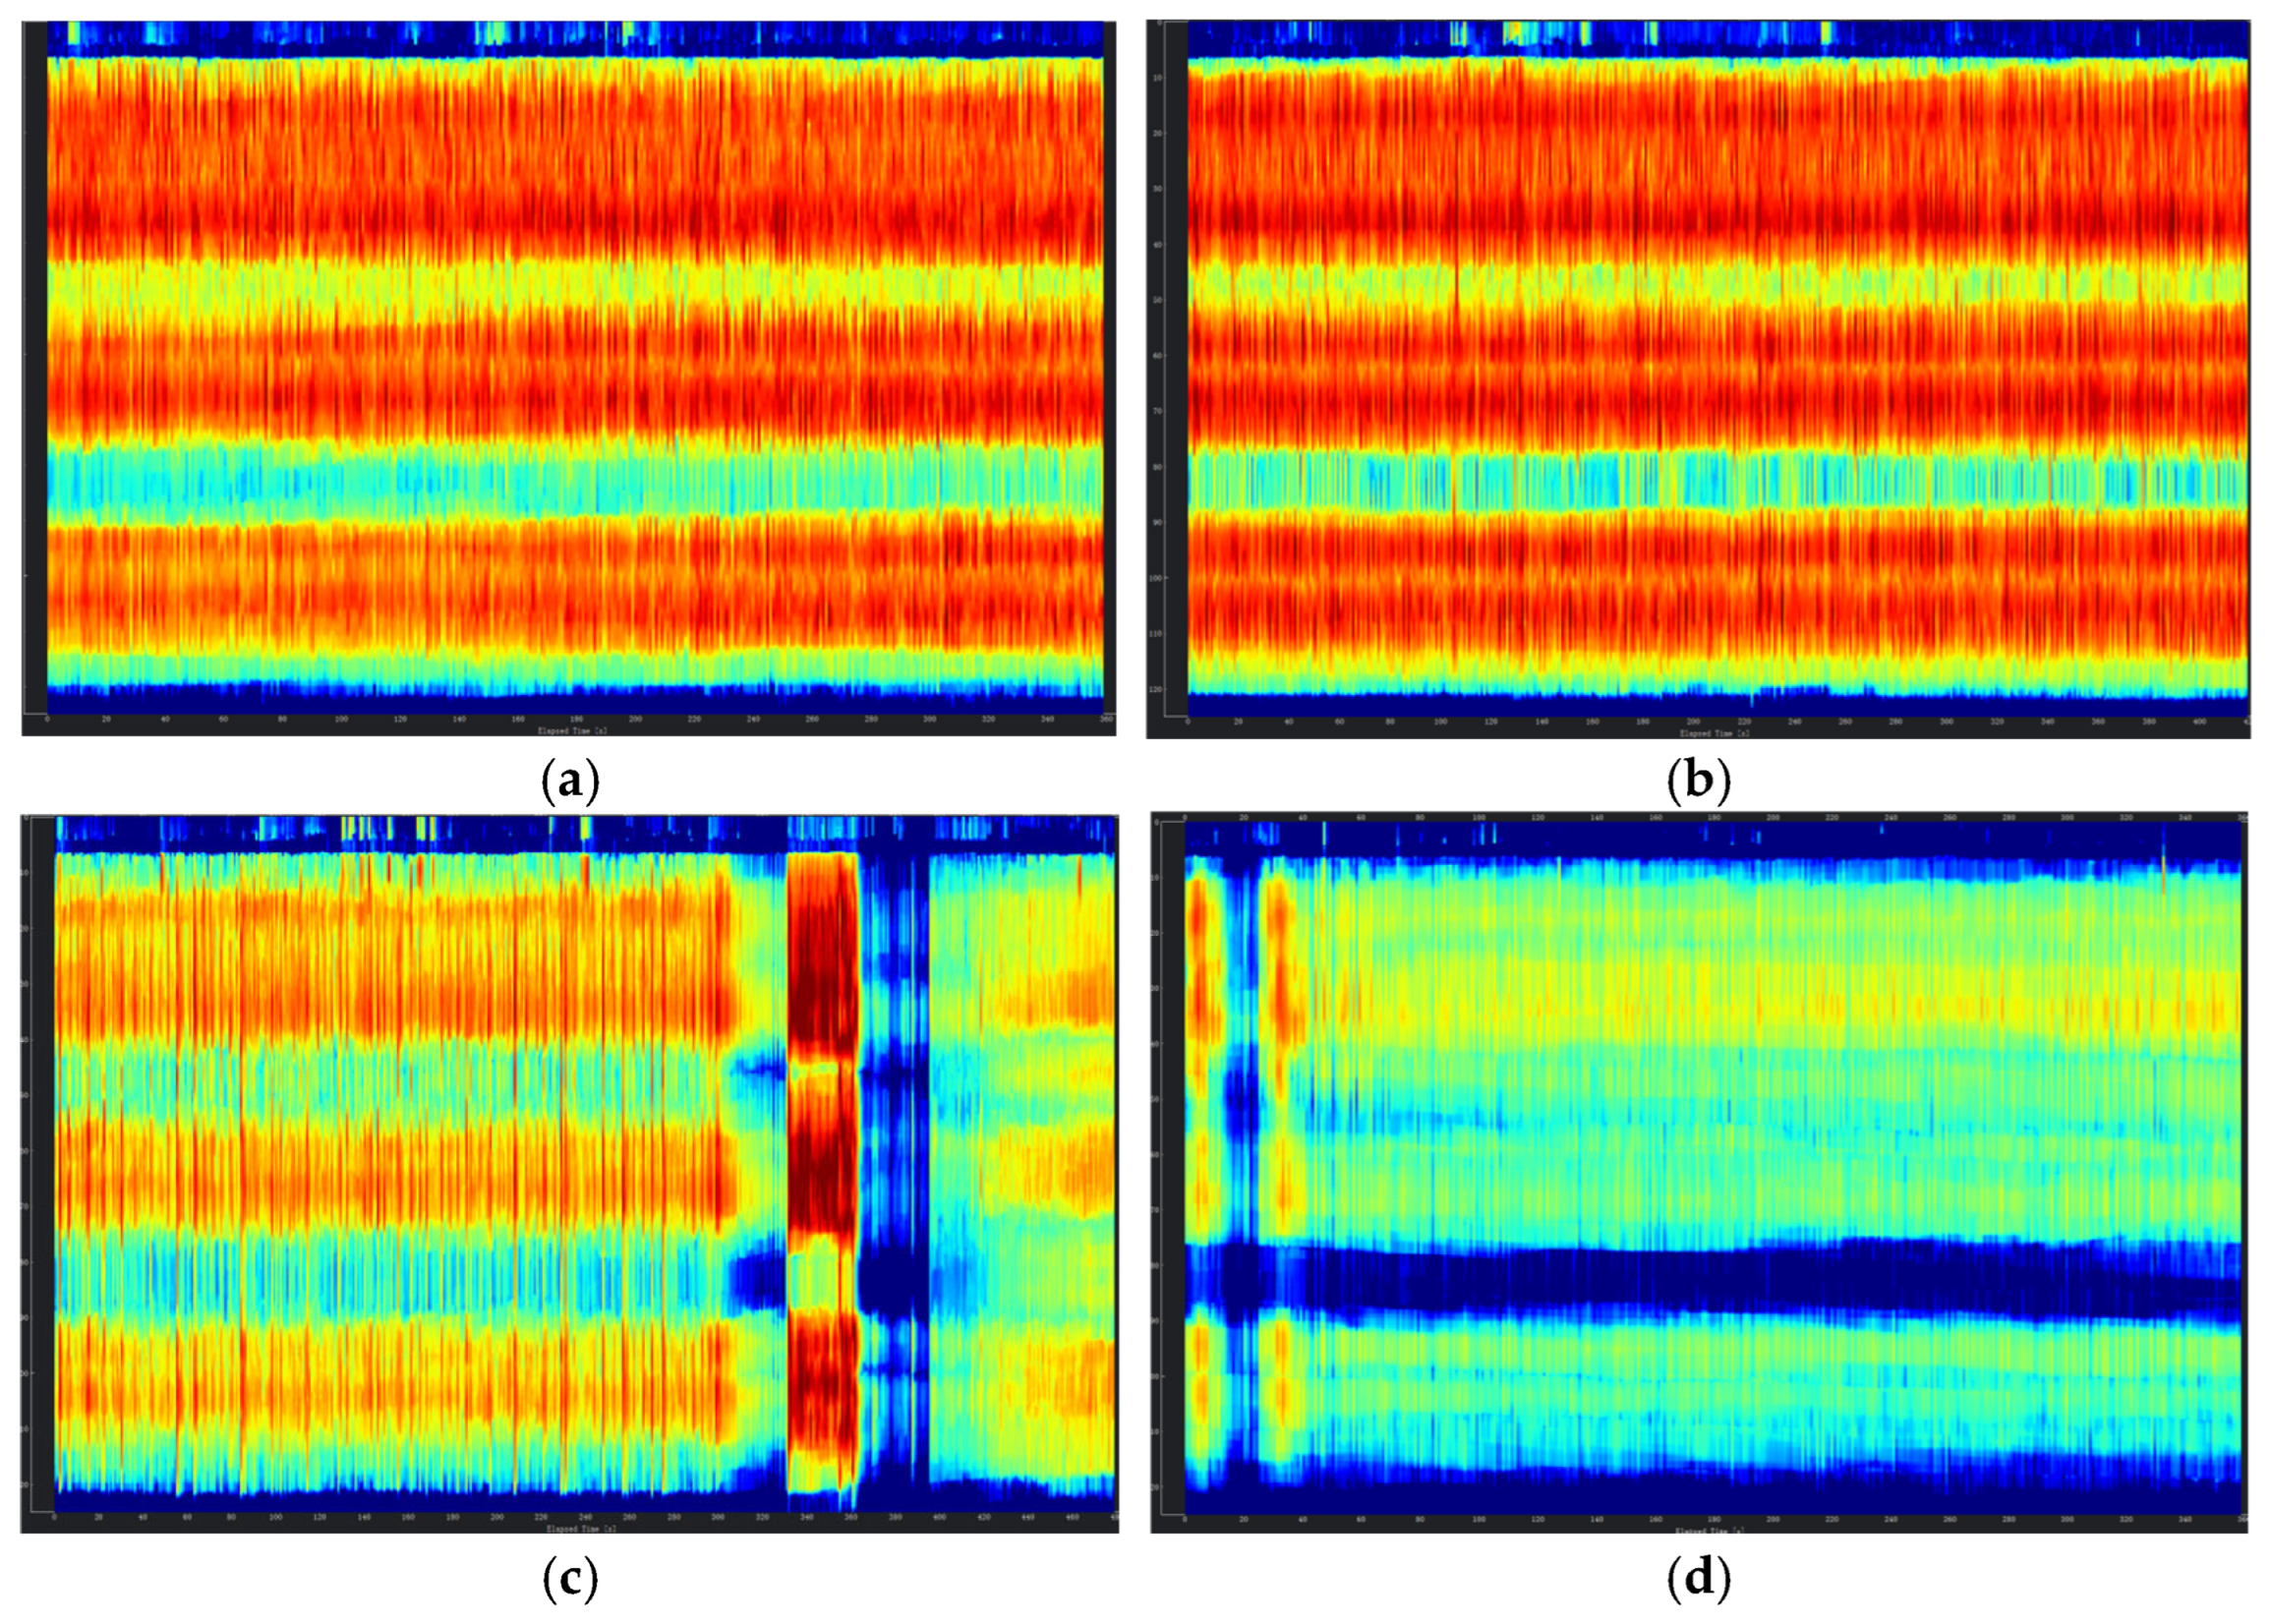
3.3. Influence of Flow Pattern on Acoustic Response
Figure 5 illustrates that the overall magnitude of the DAS energy was highest in slug flow, followed by annular flow, and it was found to be the lowest in bubble flow. This ranking primarily results from the gas flow rate that was designed in the experiment. The gas flow rate for bubble flow was significantly lower than that for slug and annular flows. However, despite the slug flow having a lower gas flow rate compared to the annular flow, the DAS energy of the slug flow remained notably higher than that of annular flow.
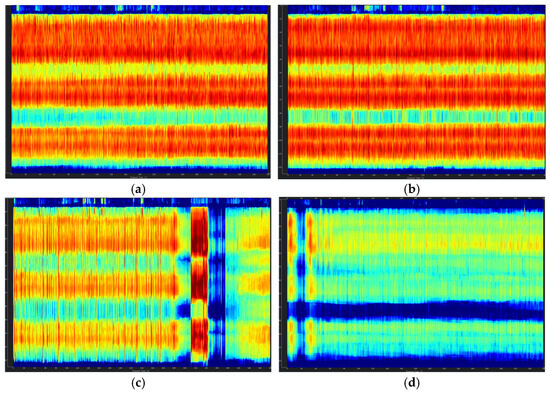
Figure 5.
Waterfall charts of different flow regimes. (a) Slug flow (high gas volume). (b) Slug flow (low gas volume). (c) Bubble flow. (d) Annular flow.
It is inevitable that the flow regime will have an impact on the DAS response. A simple qualitative analysis can be conducted based on the experimental data mentioned above. For further analysis of the DAS response energy under specific flow regimes and its variation with gas flow rate, water cut, etc., more experiments under different flow rates and water cuts should be designed. High-speed cameras should be used to determine the fluid flow, as multiphase fluids are not uniformly distributed along the wellbore. The correspondence between the DAS data collection time and the actual flow regime may lead to deviations in the experimental conclusions.
The experimental analysis shows that the DAS monitoring data analysis has reference value for identifying multiphase flow regimes in the wellbore, analyzing and interpreting multiphase flow in the wellbore, etc.
4. Field Case Analysis
4.1. Well X
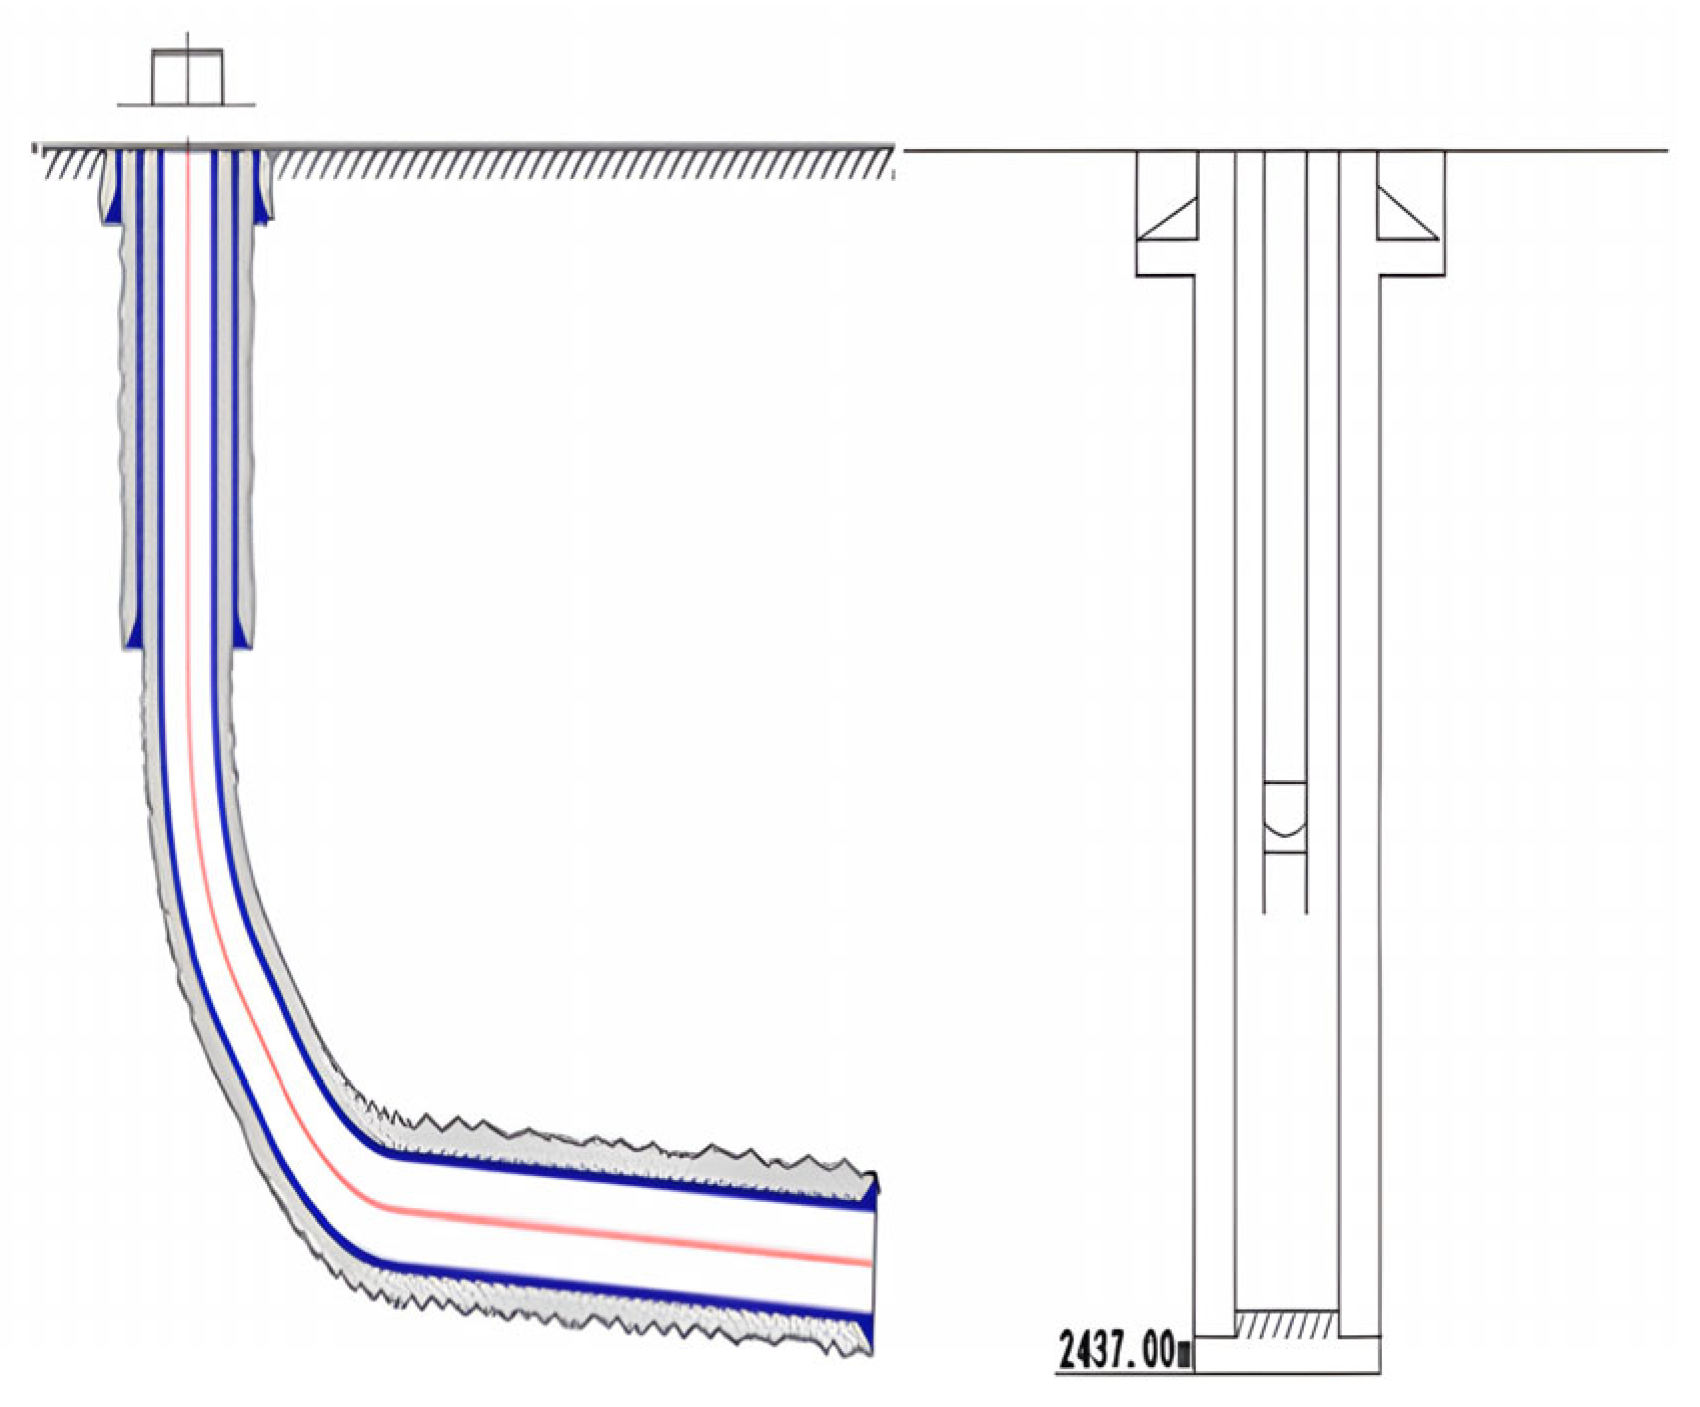
The well depth at Point A of X was 1780.00 m, with a vertical depth of 1068.59 m. At Point B, the well depth was 2980.00 m and the vertical depth was 1005.74 m. The actual completed well depth was 3020 m, with a horizontal section length of 1200 m. The artificial well depth was 2975.77 m, and the completion interval was in the Longmaxi Formation. According to the laboratory guidance conclusions, during field testing, the logging fiber optic cable was deployed along the wellbore trajectory and data was collected, as shown in Figure 6. The red line represents the logging optical cable, which contains two multimode fibers and one single-mode fiber inside. The production test data of Well X was converted into an energy spectrum and frequency spectrum for typical flow pattern comparison and analysis.

Figure 6.
Wellbore structure diagram of Well X.
The energy waterfall diagram of DAS for Well X was obtained through the energy spectrum conversion. From the waterfall diagram, it can be seen that from 2600 m to 1800 m, it was in the horizontal section and the overall DAS energy was weak. Under stable flow conditions, the flow patterns were mainly laminar flow or wavy laminar flow. In the horizontal wellbore section, oil, gas, and water were more likely to form a gas–water stratification. It is widely recognized that the end of the horizontal section is mainly characterized by laminar flow or wavy laminar flow, which has been proven by the many downhole television monitoring videos that have been conducted in the horizontal section.
Within the range of 2000–2200 m in the horizontal section, the energy was relatively strong, indicating that the water output in this range may have been large (or long sections of laminar flow with short sections of slug flow). From 1800 m to 1530 m, the DAS energy gradually increased, and from 1530 m to 400 m, the DAS energy reached its strongest level. From 400 m to the wellhead, the DAS energy gradually decreased. According to the indoor flow pattern experiment conclusions, the overall DAS energy performance was characterized by slug flow being the largest, annular flow being the second, and bubble flow being the smallest, resulting in the values shown in Figure 7.
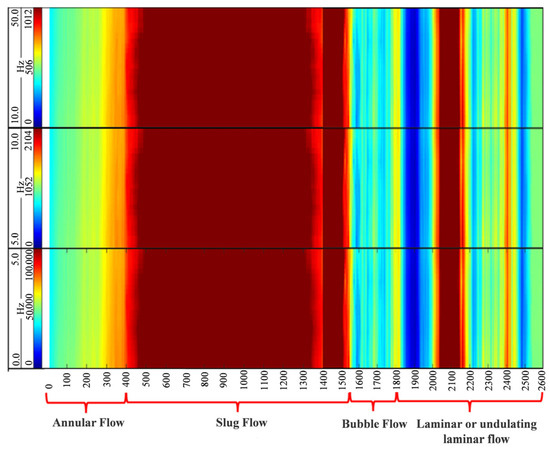
Figure 7.
Flow pattern classification in the DAS waterfall diagram of Well X.
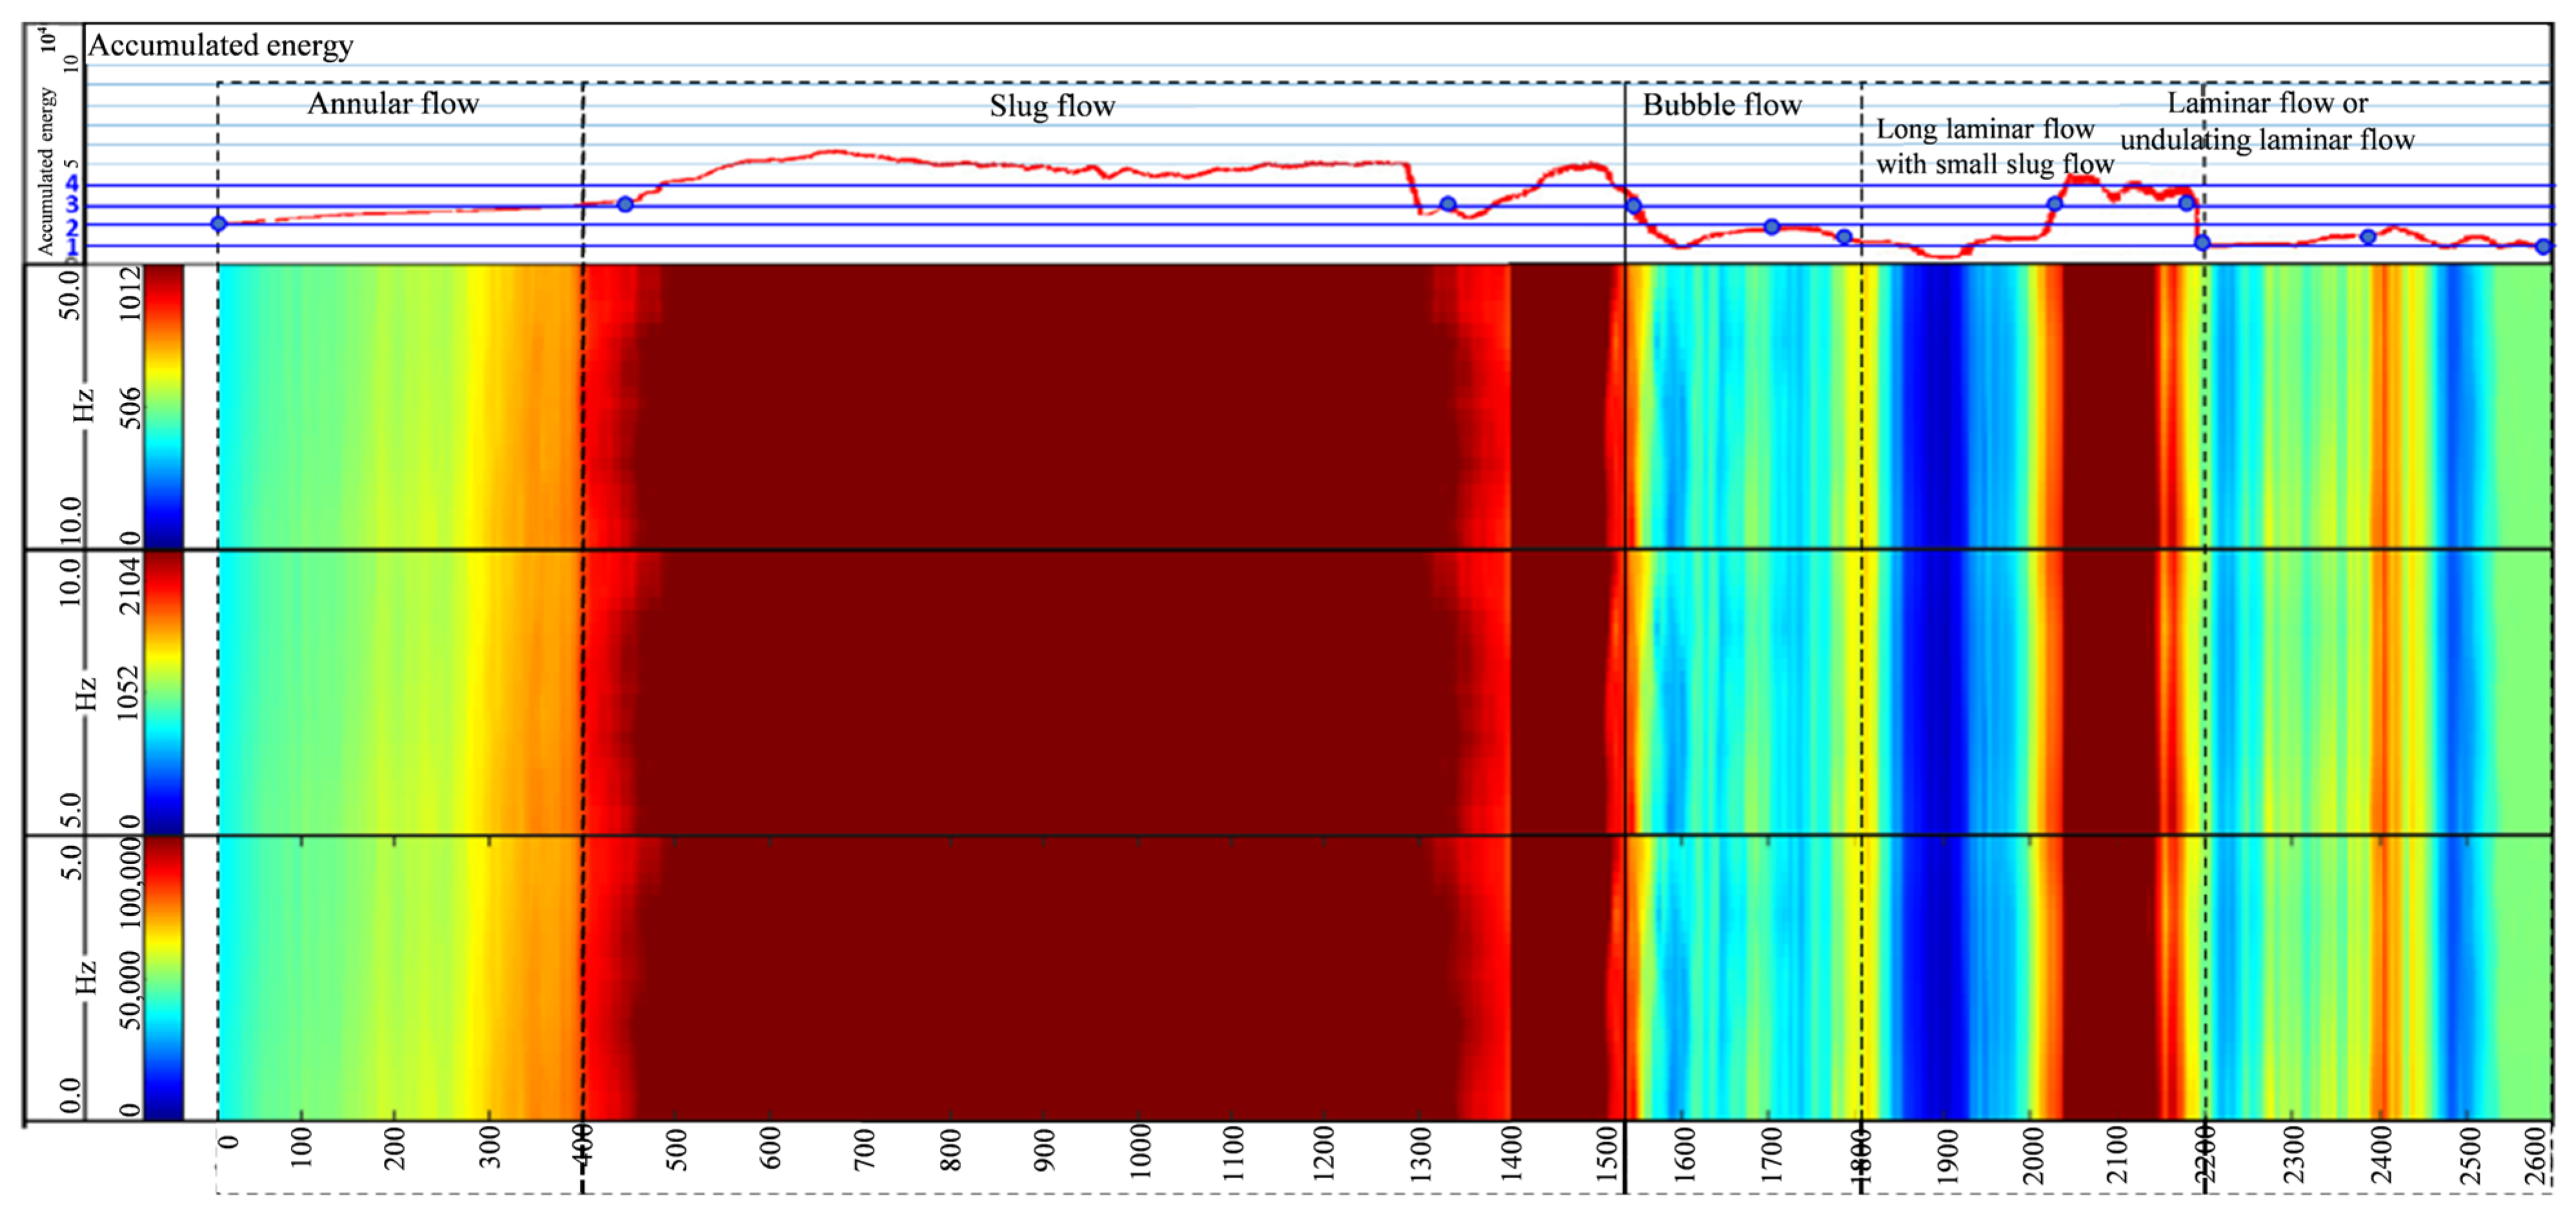
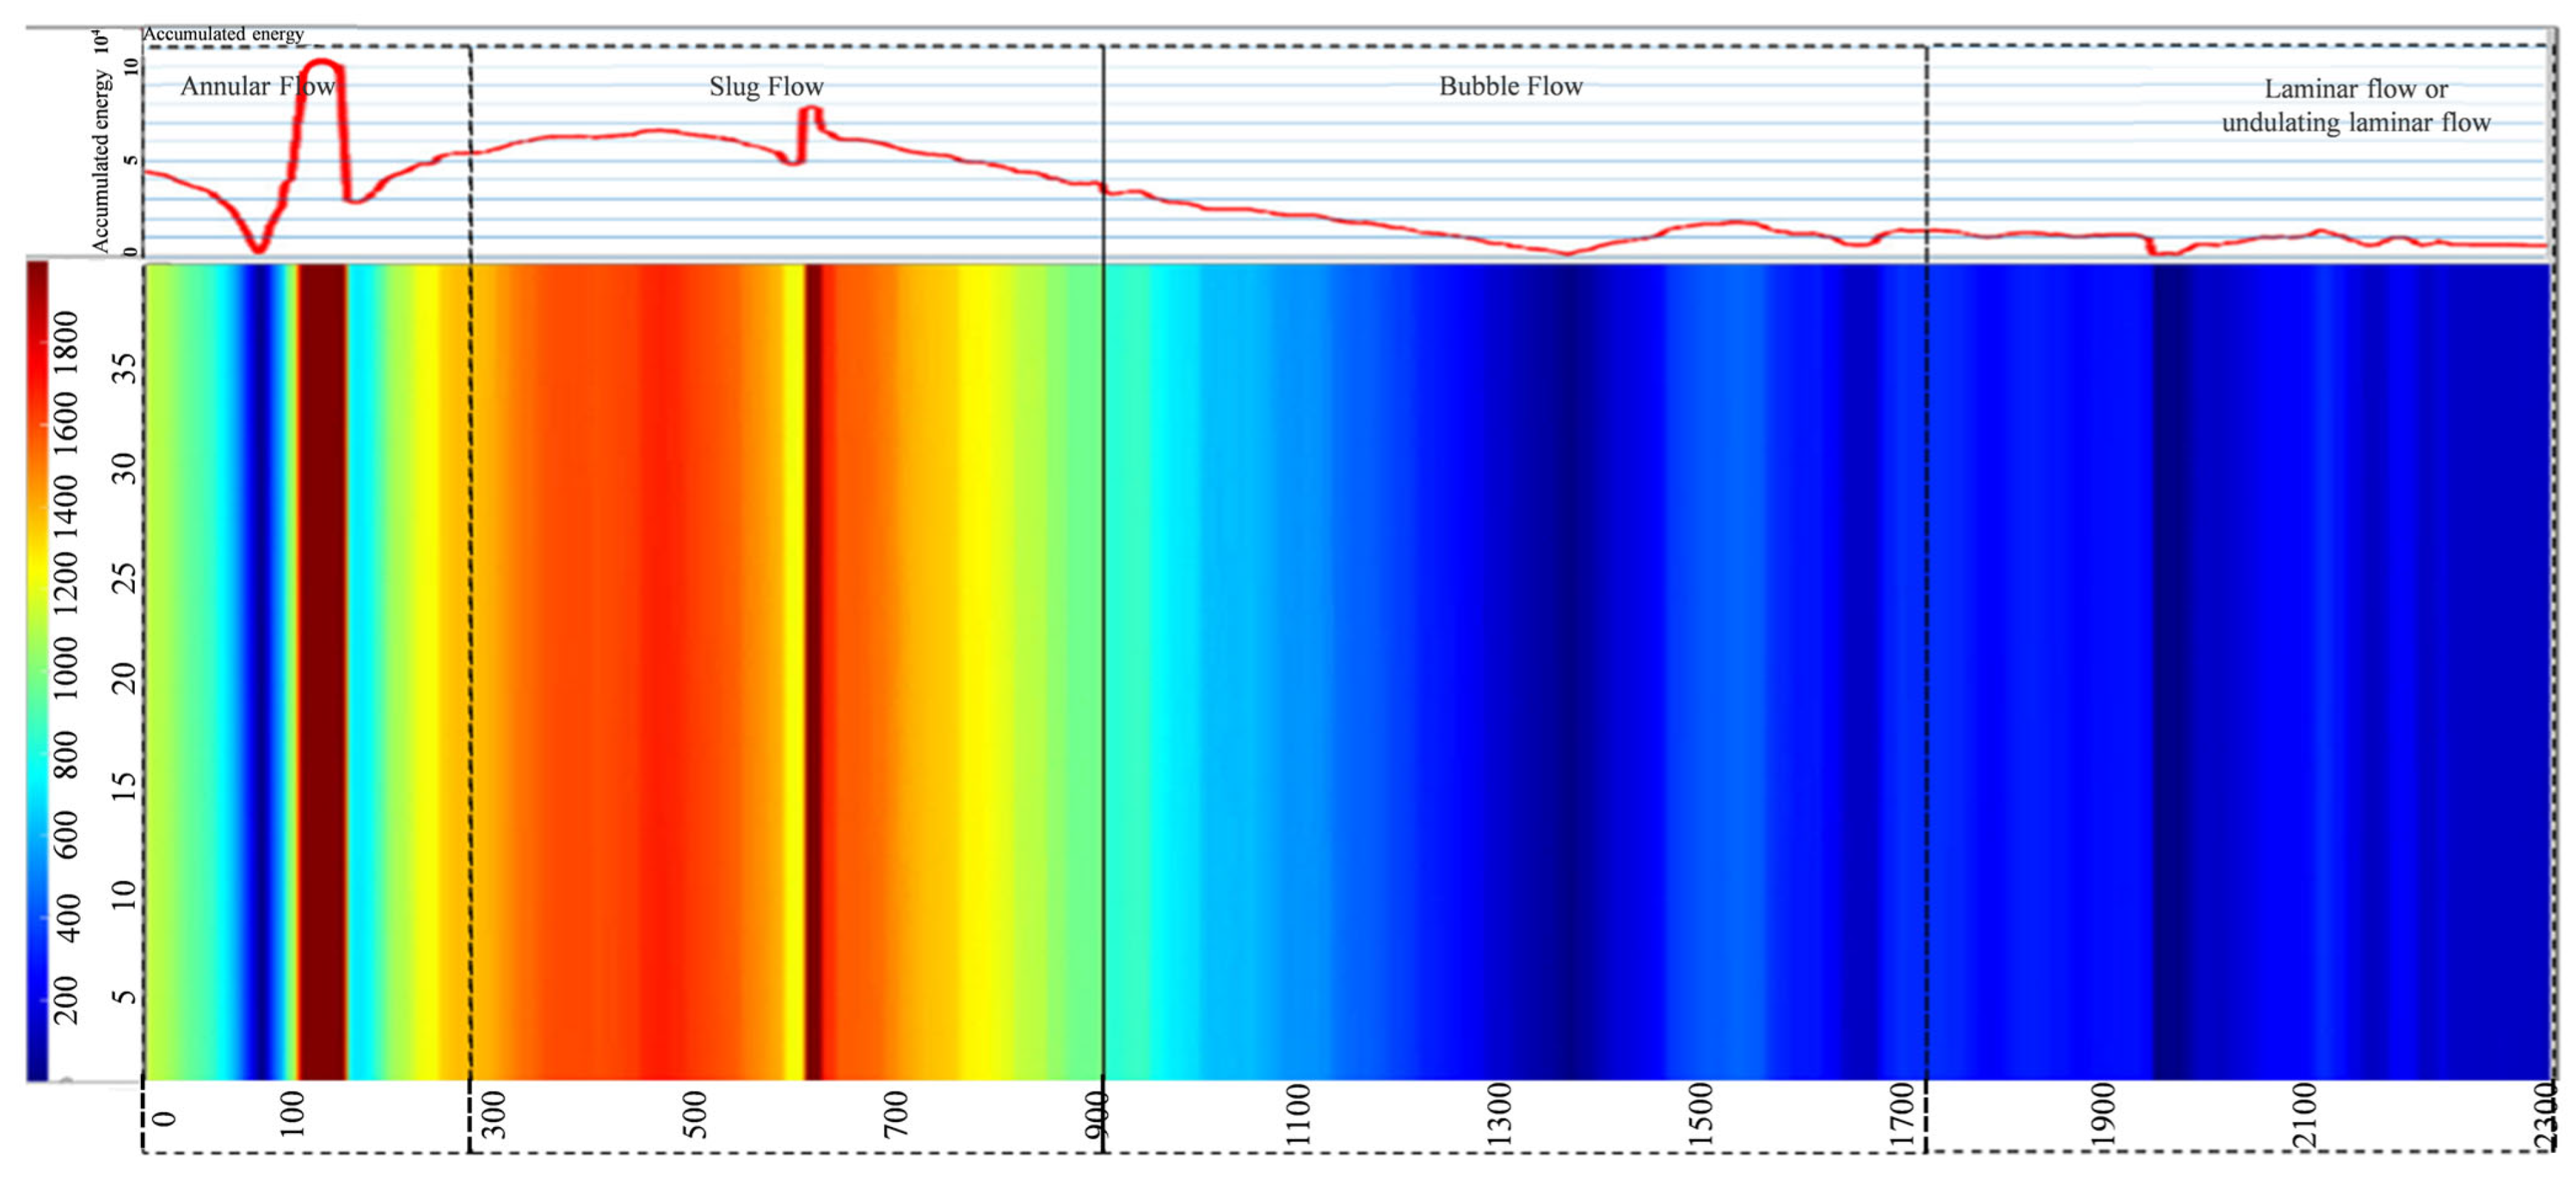
By subjecting the fiber optic monitoring DAS data of Well X to frequency spectrum conversion, a comparison between the well depth waterfall diagram and the fluid acoustic energy diagram could be obtained, as shown in Figure 8. Carefully comparing the waterfall diagram and the fluid acoustic energy diagram of Well X, more details can be seen: in the current state, different well sections of this well exhibited different typical flow pattern characteristics. The acoustic response energy corresponding to each flow pattern followed the rule that the slug flow had the highest energy, annular flow had the second highest, and bubble flow had the lowest. Moreover, the cumulative acoustic energy of each flow pattern corresponded to different RMS thresholds. Therefore, the acoustic energy (RMS) range of each flow pattern in each section could be determined, as shown in Table 3.
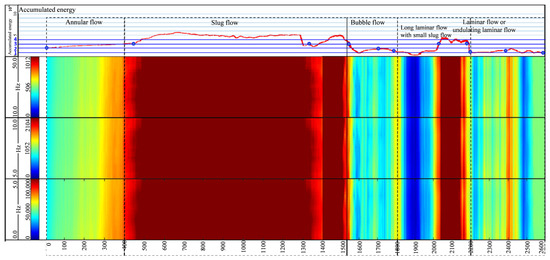
Figure 8.
Waterfall diagram of Well X vs. cumulative acoustic energy (in the direction of depth).
Table 3.
Range of flow pattern acoustic energy (RMS) for Well X.
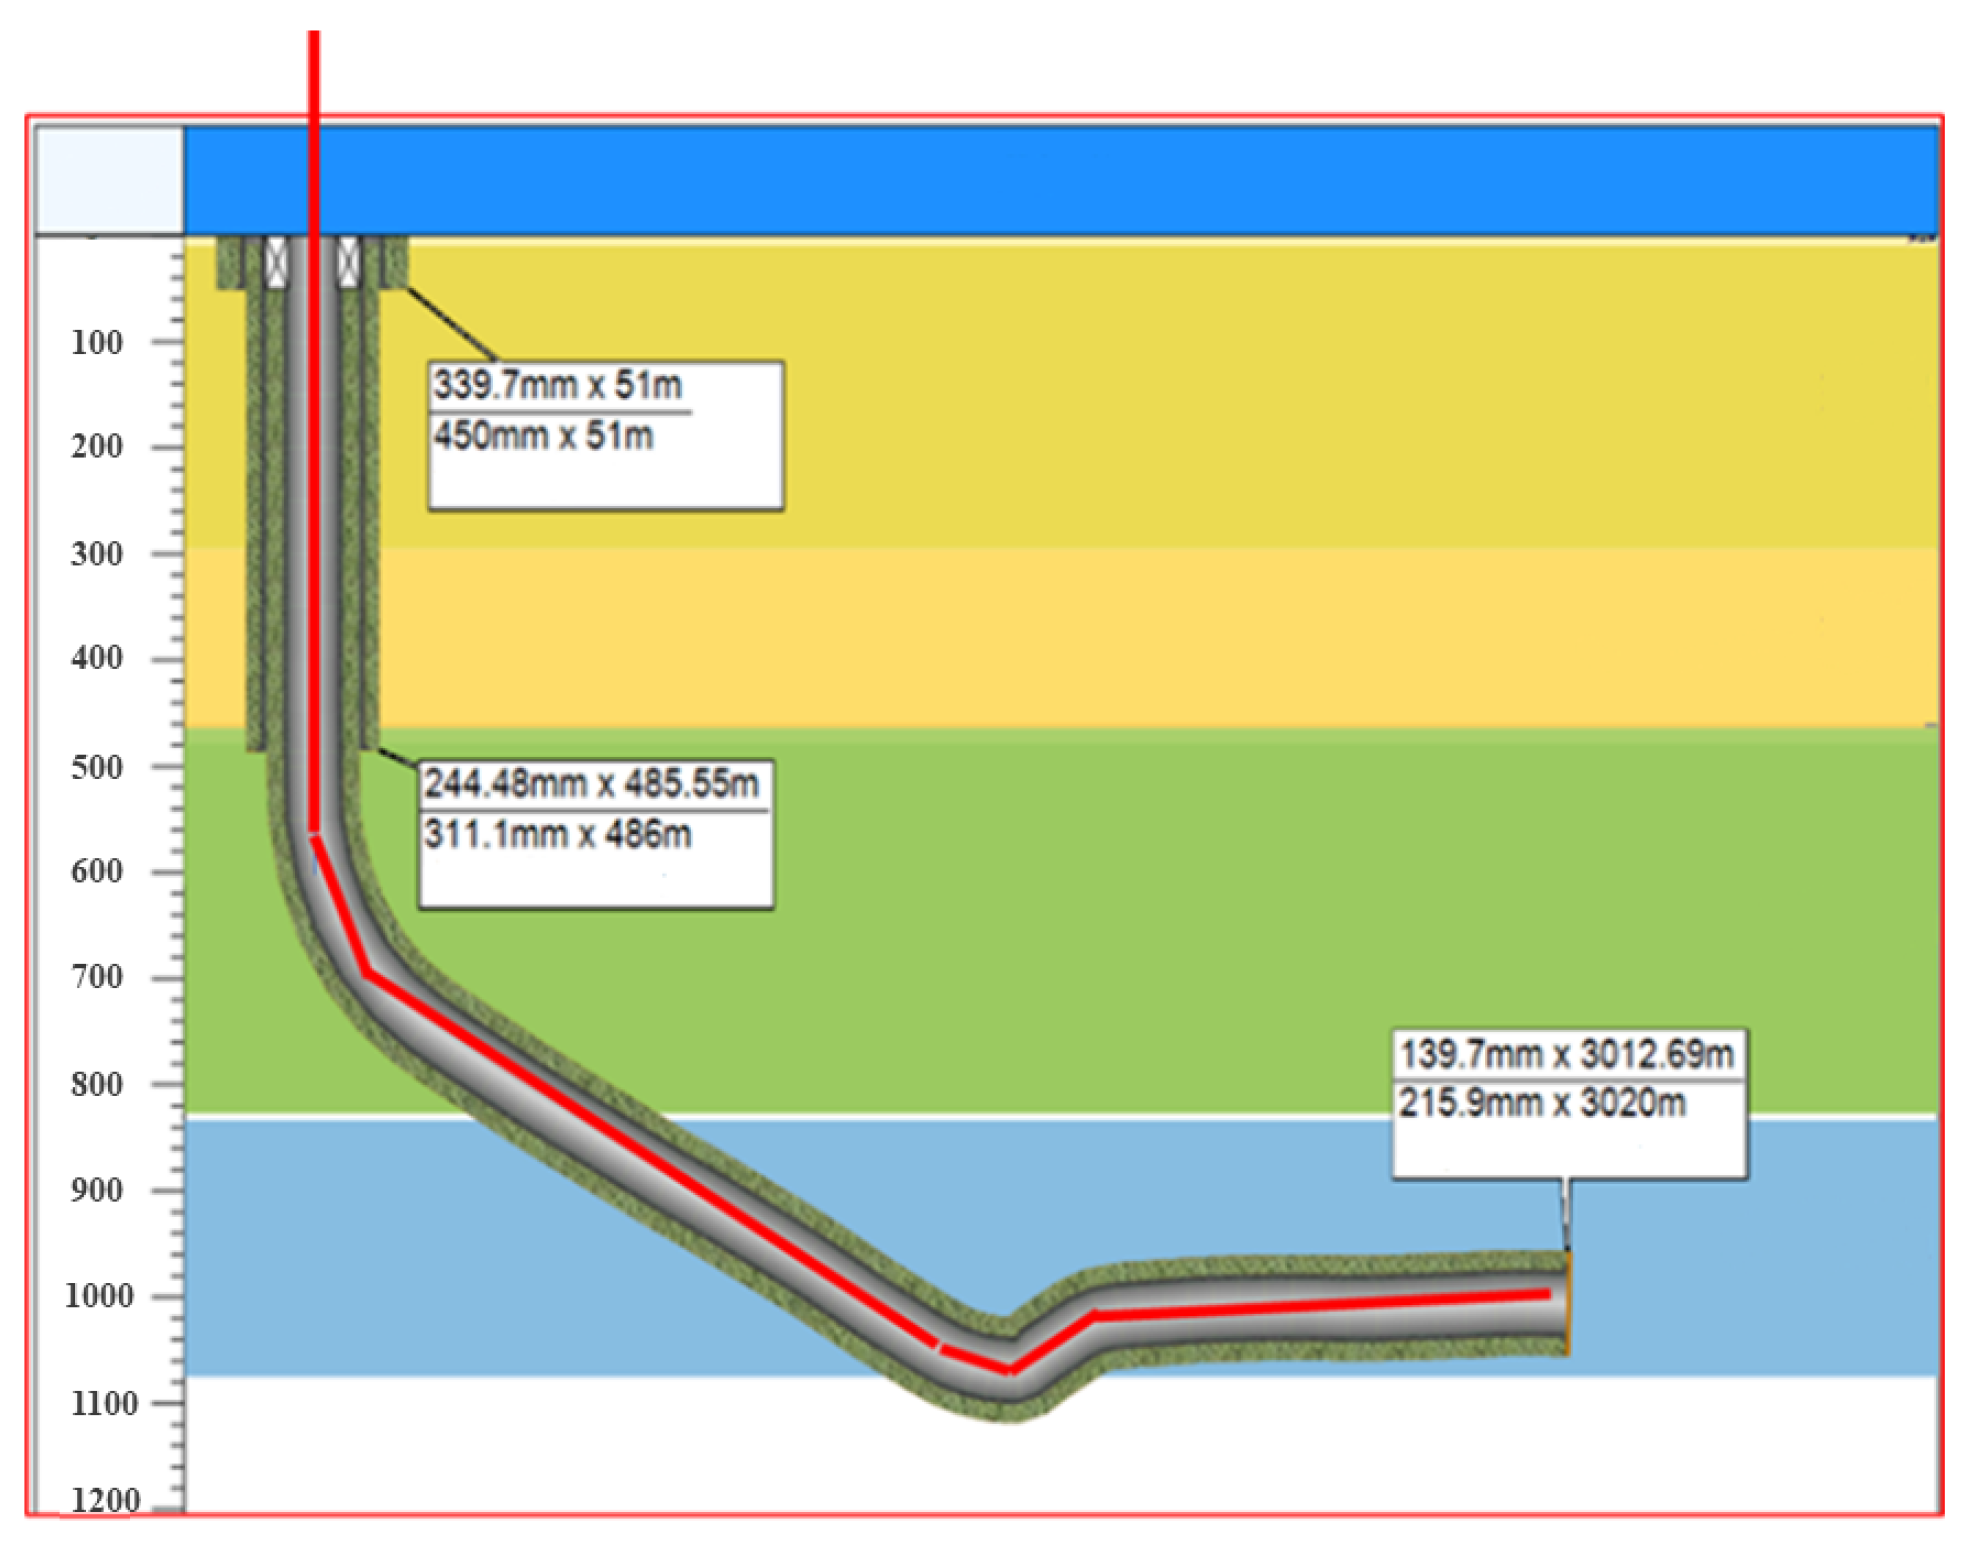
4.2. Well Y
The wall thickness of the completed well of Well Y was 10.54 mm, the inner diameter was 118.62 mm, and the casing was lowered to a depth of 2428.88 m. According to the laboratory guidance conclusions, during field testing, the logging fiber optic cable was deployed along the wellbore trajectory length direction and data was collected, as shown in Figure 9. The red line represents the logging optical cable, which contained two multimode fibers and one single-mode fiber inside. The production test data of Well Y in 2022 was converted into an energy spectrum and frequency spectrum, and typical flow pattern comparison and analysis was conducted.

Figure 9.
Wellbore structure and production string diagram of Well Y.
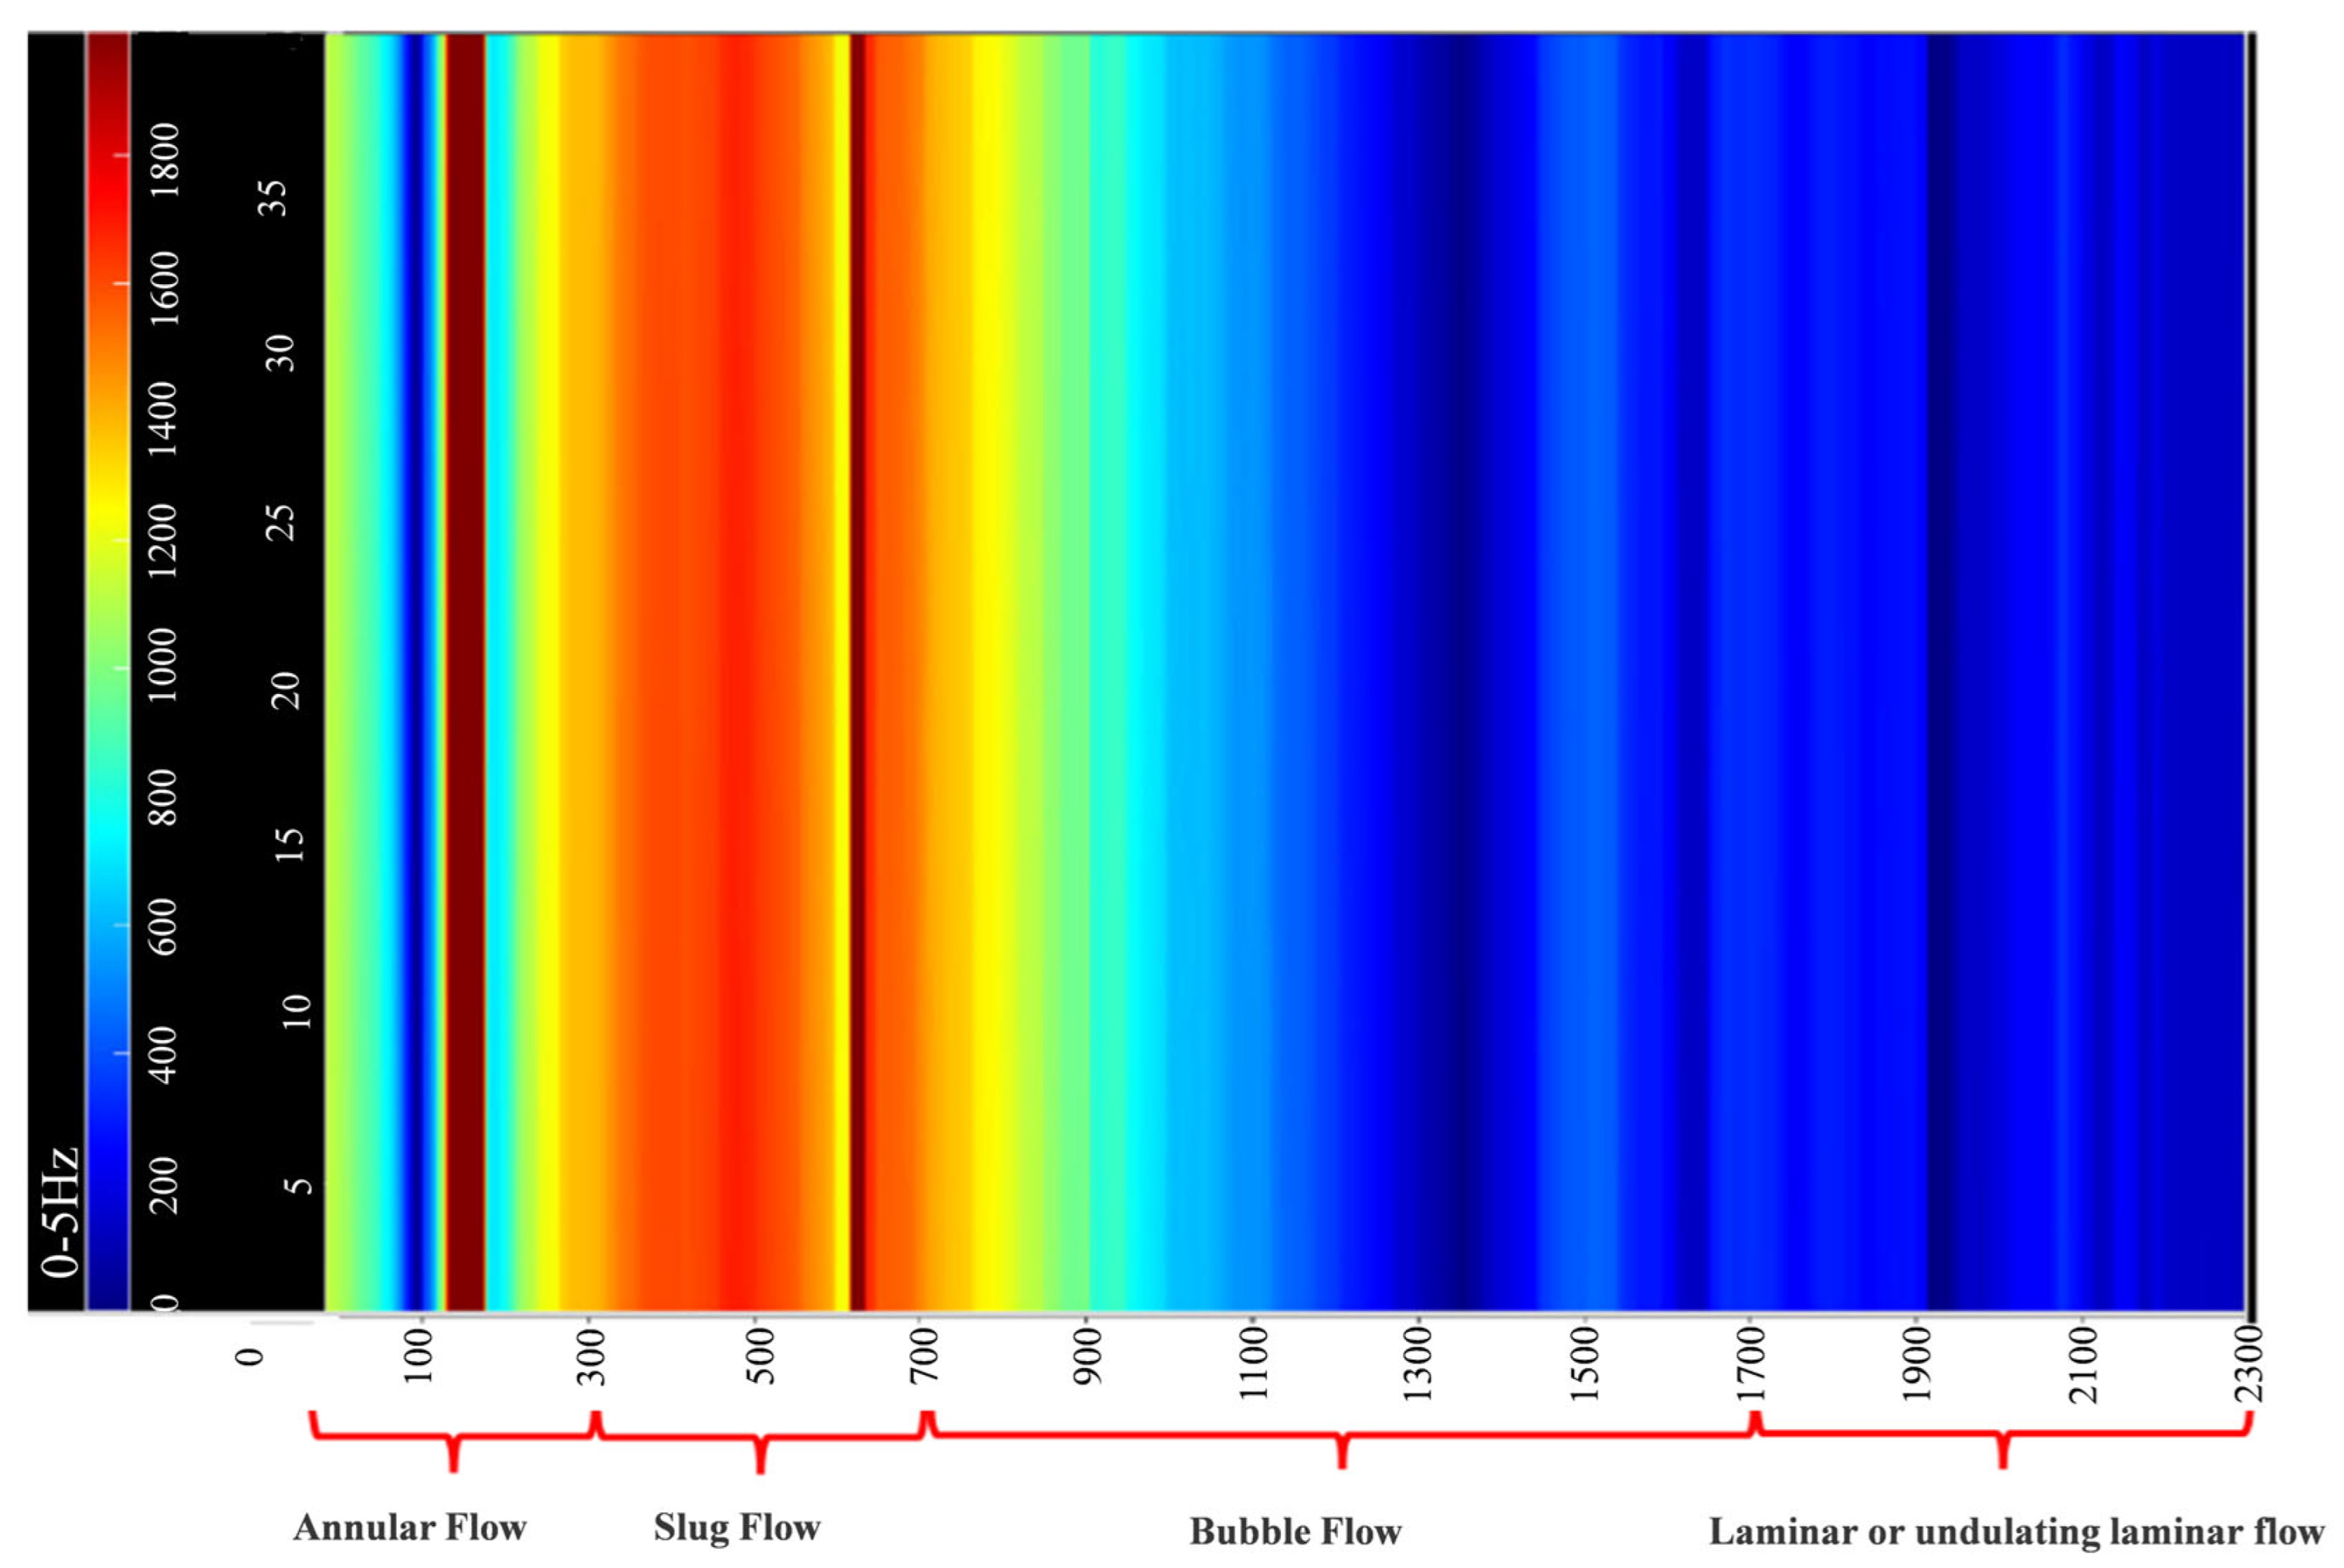
The DAS energy waterfall diagram of Well Y was obtained through energy spectrum conversion. The diagram reveals the following characteristics: The section from 1700 m to 2300 m was in the horizontal section, and the overall DAS energy is weak. Under stable flow conditions, the flow patterns were mainly laminar flow or wavy laminar flow. In the horizontal wellbore section, oil, gas, and water were more likely to form a gas–water stratification. It is widely recognized that the end of the horizontal section was mainly characterized by laminar flow or wavy laminar flow, which has been proven by many downhole TV monitoring videos in the horizontal section. In the range of 1700–700 m, the DAS energy gradually increased. In the range of 700–300 m, the DAS energy reached its maximum, and in the range of 300–0 m (near the wellhead), the DAS energy gradually decreased. According to the indoor flow pattern experiment conclusions, the overall performance of DAS energy strength showed that slug flow had the highest energy, annular flow had the second highest, and bubble flow had the lowest. Based on this, the results shown in Figure 10 were obtained.
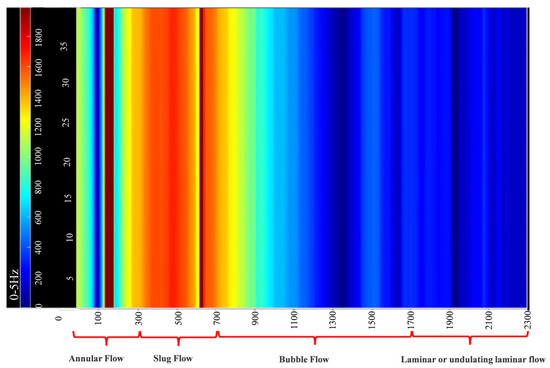
Figure 10.
DAS waterfall diagram of Well Y.
By subjecting the fiber optic monitoring DAS data of Well Y to frequency spectrum conversion, a comparison between the well depth waterfall diagram and the fluid acoustic energy diagram could be obtained, as shown in Figure 11. Carefully comparing the waterfall diagram and the fluid acoustic energy diagram of Well Y, more details can be seen: In the current state, different well sections of this well exhibited different typical flow pattern characteristics. The acoustic response energy corresponding to each flow pattern followed the rule that the slug flow had the highest energy, annular flow had the second highest, and bubble flow had the lowest. Moreover, the cumulative acoustic energy of each flow pattern corresponded to different RMS thresholds. Therefore, the acoustic energy (RMS) range of each flow pattern in each section could be determined, as shown in Table 4. Among them, in the initial sections of 0–20 m, 200–250 m, and 780–850 m, the acoustic energy was between the slug flow and annular flow, though more laboratory data was needed for evaluation.

Figure 11.
Waterfall diagram of Well Y vs. cumulative acoustic energy (in the direction of depth).
Table 4.
Range of flow pattern acoustic energy (RMS) for Well Y.
5. Conclusions
This study systematically examined potential sources of error, including environmental noise and temporal synchronization discrepancies. Fluctuations in the DAS signals caused by environmental noise (e.g., electromagnetic interference) were localized and did not significantly affect the overall flow interpretation. Manual synchronization between visual observations and DAS data acquisition introduced temporal offsets, which, while small compared to the characteristic timescales of the observed flow phenomena, could theoretically impact event timing precision. These errors did not compromise the validity of the core conclusions. While this research has advanced horizontal well multiphase flow studies under wellbore inclinations of 15° and 30°, it is crucial to recognize its limitations, particularly the insufficient consideration of geological strata inclination variability. As a critical factor shaping wellbore deviation patterns, the role of geological strata inclination requires deeper investigation to enhance the universal applicability of the findings. To address these limitations and advance the theory and technology of multiphase flow DAS monitoring, future research should focus on the following directions:
(a) Extending the experimental wellbore inclination range to 0–90° is crucial to systematically reveal the influence of inclination angle on DAS response. This would provide a more comprehensive theoretical foundation for optimizing horizontal well designs.
(b) Designing experiments with varied flow velocities, water cuts, and gas–liquid ratios will enable in-depth analysis of DAS energy variation under specific flow regimes. This will facilitate the development of refined models for multiphase flow DAS monitoring.
(c) Integrating active noise reduction techniques (e.g., adaptive filtering) could further improve data quality by mitigating environmental interference, facilitating the development of refined models for multiphase flow DAS monitoring.
(d) Incorporating high-speed cameras to observe fluid distribution in real time can address the discrepancies between the DAS data acquisition and actual flow patterns caused by non-uniform multiphase fluid distribution, thereby enhancing the reliability of experimental results.
(e) Combining specialized experiments with defined geological strata inclination gradients (low to high) and simulations to analyze the impact of formation inclination on DAS response and wellbore deviation. By integrating DAS technology, acoustic wave propagation mechanisms under complex geological conditions can be elucidated. Concurrently, diverse geological samples and field validations should be incorporated to enhance data reliability, providing a robust foundation for refining models and guiding practical engineering applications.
Through the research on multiphase flow in horizontal wells based on DAS monitoring, it is strongly recognized that this technology has an important position and broad application prospects in the petroleum industry. DAS technology can not only compensate for the shortcomings of traditional monitoring methods, but it can also provide more accurate and comprehensive data support for the development and management of oil and gas fields. At the same time, it is also recognized that the development of technology requires continuous innovation and investment, and new methods and means need to be continuously explored to solve the problems encountered in practical applications. In addition, interdisciplinary cooperation is crucial for promoting the progress of DAS technology, which requires the integration of knowledge and technology in multiple fields, such as optics, electronics, signal processing, etc., to jointly overcome technical difficulties and promote the widespread application and continuous development of this technology in the petroleum industry.
Author Contributions
Writing—review and editing, R.Z. and L.F.; Conceptualization, D.Y. and Q.D.; Formal analysis, R.Z. and L.F.; Methodology, D.Y. and Q.D. All authors have read and agreed to the published version of the manuscript.
Funding
This research received no external funding.
Data Availability Statement
Data are contained within the article.
Acknowledgments
This study was supported by the Open Foundation of Cooperative Innovation Center of Unconventional Oil and Gas, Yangtze University (Ministry of Education & Hubei Province), No. UOG2024-06; the Open Foundation project of the Key Laboratory of Polar Geology and Marine Mineral Resources (China University of Geosciences, Beijing), Ministry of Education, No. PGMR-2024-106; the Key Program of the Hubei Provincial Department of Education, No. D20221303; and the Natural Science Foundation of Hubei Province, No. 2022CFB700.
Conflicts of Interest
Author Rui Zheng is employed by the PetroChina Zhejiang Oilfield Company. The remaining authors declare that the research was conducted in the absence of any commercial or financial relationships that could be construed as a potential conflict of interest.
References
- Alkhalifeh, K.; Rmili, H.; Hakim, B.; Sobahi, N.; AL-Turki, Y. Design of Microwave Antenna Array for Imaging of Multiphase Flows in Polypropylene Pipes. Int. J. Antennas Propag. 2021, 2021, 6636885. [Google Scholar] [CrossRef]
- Wu, Y.Y. Study on Intelligent Imaging Method of Multiphase Flow Production Profile Logging for Horizontal Wells. Ph.D. Thesis, Yangtze University, Jingzhou, China, 2024. Available online: https://kns.cnki.net/kcms2/article/abstract?v=oWJgMrFo8ufxU0raR8JOkHom1iD23NLjsh3_TNE0DQnx9U3Zp6R8xV_K9bhz-4esJiy6kd6v3Dmn2bztK_-5uVgreuzOaxm-8s8j1ac1sG8R3gsUStI8lV18TEsx6XWJPIq0dgidHjogVZJUfIjkFEnTyiT5nHm-OAWMh8bw8_PLQvoQhDX1xA==&uniplatform=NZKPT (accessed on 23 March 2025).
- Shams, R.; Tavakoli, A.; Shad, S. Experimental Investigation of Two-Phase Flow in Horizontal Wells: Flow Regime Assessment and Pressure Drop Analysis. Exp. Therm. Fluid Sci. 2017, 88, 55–64. [Google Scholar] [CrossRef]
- Qi, G. Study on Two-Phase Flow Pattern Recognition Based on Feature Extraction Method of Cross-Sectional Measurement Information. Ph.D. Thesis, Tianjin University, Tianjin, China, 2006. Available online: https://kns.cnki.net/kcms2/article/abstract?v=oWJgMrFo8uexzoEv6aXt_Xku5UkzwfCroGOcf7o-QF_ylhVBSK55ee1tVvh-oSR6DyrQnNjt94Vizd4hf8_eE8qcbK6oRrvLZPtpEyLzsCmnbGL8UKSZbh0DROopuaZA3fMWFA-OjlCoZmXd89Q65rX4Yi8AdsP18gjau4OHR1M=&uniplatform=NZKPT (accessed on 5 April 2025).
- Zhao, D.; Cao, X.; Zhang, Y.; Cui, M.; Zhang, N. Gas-Liquid Two-Phase Flow Pattern Recognition Method Based on Ultrasonic Technology in Horizontal Pipes. Oil Gas Storage Transp. 2014, 33, 165–171. [Google Scholar]
- Huang, C.H.; Hu, J.H.; Liu, X.B.; Yu, C.D.; Luo, S.Y. Experimental Analysis of Oil-Water Two-Phase Flow Pattern Based on High-Speed Camera and Multi-Parameter Combination. Logging Technol. 2014, 38, 526–529. Available online: https://kns.cnki.net/kcms2/article/abstract?v=oWJgMrFo8ud2x7FRLplGrBk7zS_kfsW83onuDXjjeczqyBwmfO4frPVHbL8ltEO-jCNoC3cerXpDpYzy2QFTi5PjAkLaYM25lxDj2RlJVJinKgQzQ-7lXTqAQrKtAp8ZG2WQMUrmMxtvygFXX2yep59oEhOjhLAgHAEEXAqUX3g=&uniplatform=NZKPT (accessed on 25 March 2025).
- Chang, D.K.; Xue, T.; Zhang, Y.T. Fuzzy Recognition of Gas-Liquid Two-Phase Flow Pattern Based on High-Speed Photography Sensor. Sens. Microsyst. 2016, 35, 58–60. [Google Scholar]
- Li, Z.B.; Wu, Y.X. Application of Gamma Ray Attenuation Method in Identification of Horizontal Gas-Liquid Two-Phase Flow Pattern. J. Shipbuild. China 2007, 48, 398–404. Available online: https://kns.cnki.net/kcms2/article/abstract?v=oWJgMrFo8ufgmXiJifKsQOAbmomcpzlgbngRzx8wxjziT_8PtVdbDT0JligXgX0Bdmq_yo8LUGMxvsCn53h1sT9lxHePll9zkurIsRFNSfQNt9zm4vzORbN-MybjQqKZ0SeUi4jX2B2WBGCZyJbVfEY5YA4iRionz_Wsn2867wY=&uniplatform=NZKPT (accessed on 8 April 2025).
- Liu, H.; Wang, S.; Ye, Z.Y.; Zhou, W.; Li, Q. Application of Fiber Optic Sensing Technology in Oil and Gas Field Development. Pet. Geophys. 2024, 63, 707–717. [Google Scholar]
- Liu, H.; Mu, L.J.; Qi, Y.; Chen, W.B.; Bai, J.; Tu, Z.Y. Evaluation and Optimization Suggestions for Multi-Cluster Balance of Staged Fracturing Based on Fiber Optic Monitoring. Drill. Prod. Eng. 2024, 47, 1–7. Available online: https://kns.cnki.net/kcms2/article/abstract?v=oWJgMrFo8ucW-8zBB-XgUmbm_3nNHvnOdbBm0xnorT0bvHWcRAYSW83aMcd3SbXusEwkS_41je2QaSuTI4oOGj5DOk6J8wTgJH4JuhPL0t_UAMKJqzk8V9T1ctXLglGxf-AzJ4ShzEJxeq10Oima8ulgqtJf_mL712BfXOQuYWo=&uniplatform=NZKPT (accessed on 8 April 2025).
- Yuan, L.B.; Tong, W.J.; Jiang, S.; Yang, Y.H.; Meng, Z.; Dong, Y.K.; Rao, Y.J.; He, Z.Y.; Jin, W.; Liu, T.Y.; et al. Development Roadmap of Fiber Optic Sensing Technology in China. Acta Opt. Sin. 2022, 42, 9–42. [Google Scholar]
- Yu, G.; Sun, Q.; Ai, F.; Yan, Z.; Li, H.; Li, F. Micro-Structured Fiber Distributed Acoustic Sensing System for Borehole Seismic Survey. In Proceedings of the 2018 SEG International Exposition and Annual Meeting, Anaheim, CA, USA, 14–19 October 2018; OnePetro: Richardson, TX, USA, 2018. [Google Scholar]
- Shang, Y.; Sun, M.; Wang, C.; Yang, J.; Du, Y.; Yi, J.; Zhao, W.; Wang, Y.; Zhao, Y.; Ni, J. Research progress in distributed acoustic sensing techniques. Sensors 2022, 22, 6060. [Google Scholar] [CrossRef] [PubMed]
- Rao, Y.J. Research Progress on Long-Distance Distributed Fiber Optic Sensing Technology. Acta Phys. Sin. 2017, 66, 158–176. [Google Scholar]
- Wang, Z.; Zhang, B.; Xiong, J.; Fu, Y.; Lin, S.; Jiang, J.; Chen, Y.; Wu, Y.; Meng, Q.; Rao, Y. Distributed acoustic sensing based on pulse-coding phase-sensitive OTDR. IEEE Internet Things J. 2018, 6, 6117–6124. [Google Scholar] [CrossRef]
- Xiong, J.; Wang, Z.; Wu, Y.; Rao, Y. Single-shot COTDR using sub-chirped-pulse extraction algorithm for distributed strain sensing. J. Light. Technol. 2020, 38, 2028–2036. [Google Scholar] [CrossRef]
- Cai, H.W.; Ye, Q.; Wang, Z.Y.; Lu, B. Distributed Fiber Optic Acoustic Sensing Technology Based on Coherent Rayleigh Scattering. Laser Optoelectron. Prog. 2020, 57, 9–24. [Google Scholar]
- Liu, L.X. Experimental Study on Sound Monitoring of Wellbore Flow State. Ph.D. Thesis, China University of Petroleum, Qingdao, China, 2020. Available online: https://kns.cnki.net/kcms2/article/abstract?v=oWJgMrFo8uet4VbFUNgisT6pD3T8BjifS03YdviqDe-vI0gvGWdNqeq16fIvr2GekTM146i2X7T9Djpc-j0wkh-Acfa1WH2q_BMbOeV0nSocg9ZLW4Sk8FqR9ACX3AXFsXPQlDGEne1CC4tQmn6VWk0u_v8D7EmByKYoYXugp5c=&uniplatform=NZKPT (accessed on 17 June 2024).
- Liu, J.; Han, Y.; Wang, Z.; Liu, M. Identification method of wellbore fluid types based on distributed fiber optic acoustic monitoring data and machine learning. J. China Univ. Pet. (Ed. Nat. Sci.) 2023, 47, 107–114. [Google Scholar]
- Masoudi, A.; Newson, T.P. High Spatial Resolution Distributed Optical Fiber Dynamic Strain Sensor with Enhanced Frequency and Strain Resolution. Opt. Lett. 2017, 42, 290–293. [Google Scholar] [CrossRef] [PubMed]
- Silkina, T. Application of Distributed Acoustic Sensing to Flow Regime Classification. Master’s Thesis, Institutt for Petroleumsteknologi og Anvendt Geofysikk, Trondheim, Norway, 2014. [Google Scholar]
- Vahabi, N.; Selviah, D.R. Convolutional neural networks to classify oil, water and gas wells fluid using acoustic signals. In Proceedings of the 2019 IEEE International Symposium on Signal Processing and Information Technology (ISSPIT), Ajman, United Arab Emirates, 10–12 December 2019; IEEE: Piscataway, NJ, USA, 2019; pp. 1–6. [Google Scholar]
- Zhong, C.; Chen, J.; Leung, J.Y. Analysis of Downhole Temperature-Strain Response in Hydraulic Fracturing—A Coupled Geomechanics-Thermal-Flow Simulation Approach. Geoenergy Sci. Eng. 2025, 247, 213710. [Google Scholar] [CrossRef]
- Urmantseva, L.; Lees, G.; Wilma, K.; Godefroy, C.; Gysen, A.; Mao, Y. Production Profiling Optimization Enabled by the Development of Distributed Acoustic Sensing Technology. In Proceedings of the Abu Dhabi International Petroleum Exhibition and Conference, Abu Dhabi, United Arab Emirates, 2–5 October 2023; SPE: Tulsa, OK, USA, 2023; p. D031S084R008. [Google Scholar]


Disclaimer/Publisher’s Note: The statements, opinions and data contained in all publications are solely those of the individual author(s) and contributor(s) and not of MDPI and/or the editor(s). MDPI and/or the editor(s) disclaim responsibility for any injury to people or property resulting from any ideas, methods, instructions or products referred to in the content. |
© 2025 by the authors. Licensee MDPI, Basel, Switzerland. This article is an open access article distributed under the terms and conditions of the Creative Commons Attribution (CC BY) license (https://creativecommons.org/licenses/by/4.0/).