Abstract
This work aims to assess the droplets produced by a novel evaporation process, proposed as an alternative for managing tequila vinasses, using a spectral camera with three spectral bands and a thermal camera mounted on an unmanned aerial vehicle (UAV). High-resolution satellite images with seven spectral bands complemented this characterization. The spectral characterization was conducted by comparing three experimental conditions: the background of the study area without droplets, the droplets generated from purified water, and the droplets produced from tequila vinasses. Two monitoring campaigns, conducted in November 2024 and January 2025, revealed that the tequila vinasse droplets exhibited a maximum influence radius of 16 m, primarily regulated by wind speed conditions (6–16 km/h). Thermal analysis identified the droplet plume as a zone with a lower temperature, creating a thermal contrast of up to 6.6 °C against the average background temperature of 36.6 °C. No significant difference was observed in the influence radius between the droplets generated from vinasse and those from potable water. Spectral analysis of the UAV and satellite images showed significant (p < 0.05) differences in reflectance when the droplets were present (e.g., the coastal blue band increased from an average of 14.43 to 95.59 when vinasse droplets were present). This suggests that the presence of chemical compounds altered light absorption and reflection. However, the instrument’s sensitivity limited the detection of organic compounds at concentrations below its detection limit. The monitoring data presented in this manuscript is crucial for developing strategies to mitigate the potential environmental impacts of the droplets emitted by this novel process.
1. Introduction
Tequila vinasses are acidic, organic-rich effluents generated during the distillation phase of tequila production [1]. Their complex composition is a direct consequence of the fermentation of sugars, leading to wastewaters characterized by extremely high concentrations of chemical oxygen demand (COD) [2,3]. Their primary organic constituents include residual sugars and alcohols, but the main environmental concern stems from a diverse array of more recalcitrant and volatile organic compounds. As identified by Rodríguez-Félix et al. [4], tequila vinasses contain at least 111 different volatile compounds. Among the most abundant are furanic compounds such as furfural and 5-(hydroxymethyl)furfural, which are by-products of sugar degradation under heat and acidic conditions. The high concentration of organic acids, with acetic acid and butyric acid being predominant, also contributes to the low pH and corrosive nature of the effluents. The presence of these, along with various phenolic compounds, makes vinasse particularly difficult to treat. Since an estimated 10–12 L of tequila vinasses are generated for every liter of tequila produced, their management represents a critical environmental challenge, compelling the industry to seek sustainable disposal and treatment solutions [5].
Recently, low-carbonization wastewater processes have been designed to treat wastewater while minimizing the release of carbon emissions. These technologies aim to reduce the carbon footprint of wastewater treatment by reducing energy-intensive processes that contribute significantly to greenhouse gas emissions. The most popular low-carbonization technologies for treating tequila vinasses include the use of activated sludge [5], constructed wetlands [6], and anaerobic digesters [7], but coagulation–flocculation [8], electrocoagulation processes [9], or the use of oxidizing reagents [10] are considered the most efficient methods for the degradation of recalcitrant organic compounds contained in vinasse. Advanced oxidation systems based on nanoparticles are also reported for treating tequila vinasses [11]. However, many of these processes are rejected for production plants with a large volume of vinasse emissions due to their high costs.
Droplet evaporation as a technique for tequila vinasse disposal does not appear to be documented or implemented at an industrial scale. A comprehensive study of 110 tequila factories by Zurita et al. [12] confirmed that the most common disposal methods are direct discharge onto soil and clandestine discharges into surface waters. Ramos Reyes et al. [13] provide 72 different vinasse treatment strategies and dismissed conventional, energy-intensive evaporation methods due to technical and economic limitations. However, the technology presented in this manuscript comprises a distinct, low-energy approach based on solar-assisted evaporation, which overcomes the limitations of conventional evaporation methods.
This novel method involves passing vinasse through a nozzle with a small opening, creating a fine mist that is dispersed into the air. The size of the droplets produced varies based on the flow rate and nozzle size, typically ranging from 5 to 30 microns. Because the wastewater particles are small enough, they can behave like an aerosol. This means that the particles remain suspended in the air, with the smallest water droplets evaporating before reaching the ground, particularly under dry and warm conditions. The performance of this system is dependent on design parameters like droplet size and prevailing weather conditions [14,15]. Since its primary operational cost consists of the electricity for running pumps and fans, the process is highly cost-effective [16,17]. Under experimental conditions, this system has demonstrated a water evaporation efficiency of up to 59.42% [18], making it a cost-effective alternative for wastewater volume reduction when compared to the high capital expenses of conventional treatment facilities [19].
This process could be very effective in subtropical, tropical, and arid regions, since their weather conditions (high temperatures, low humidity, and frequent air movement) naturally support faster evaporation and reduce the need for extensive energy inputs. Moreover, in the case of tequila vinasses, this technology could favor the elimination of volatile organic compounds (VOCs) present in wastewater through evaporation due to their low boiling points [20]. However, this technology presents challenges due to the potential release of components harmful to the environment [3]. These particles, dispersed by the wind, could contribute to air pollution and negatively impact terrestrial or aquatic ecosystems [21].
Droplets are very small and difficult to capture with traditional sampling methods. Vaporized wastewater could be sampled by using a refrigerated device in a controlled environment, minimizing droplets evaporation. However, this sampling alternative manifests high costs and severe technical difficulties for design and operation [22]. Therefore, remote sensing represents a viable alternative for monitoring such droplets. The spectral characterization of droplets relies on the interaction between electromagnetic radiation and matter. Materials absorb and reflect light in distinct ways, allowing them to be identified based on these unique spectral signatures [23]. In the visible and near-infrared (VIS/NIR) spectrum, these absorption features can be used to identify and quantify compounds like alcohols, acids, and furans present in the vinasse droplets. Each compound displays a distinct pattern of absorption, creating a unique spectral fingerprint. Moreover, the thermal behavior of the droplets can also be used, since the evaporation of water from the droplets causes localized cooling [24]. The presence of organic compounds in the vinasse alters its thermal properties, leading to a different temperature profile compared to that of pure water droplets. This temperature difference, detectable by thermal infrared (TIR) spectroscopy, can be used to track the plume of vinasse droplets and study their atmospheric dispersion.
This study aims to monitor the droplets generated from tequila vinasses using remote sensing and photogrammetry techniques. To date, there are no studies specifically addressing the issue of wastewater vaporized into the atmosphere. The few studies available in the literature primarily focus on systems or methods that facilitate the droplet evaporation of wastewater [25,26,27]. To monitor the tequila vinasses droplets, visible and near-infrared spectrum spectroscopy (VIS/NIR) was employed using unmanned aerial vehicles (UAVs) and satellite imagery. This analysis could identify the tequila vinasses droplets, distinguishing them from both droplets produced with purified water and the study area background. Additionally, thermal infrared spectrum spectroscopy (TIR) is proposed to study the atmospheric dispersion of the droplets. This study represents a pioneering effort using UAVs and satellite imagery for the remote monitoring of aerosolized wastewater, a field with limited existing research. This study also provides a critical tool to evaluate the efficacy of droplet evaporation as a vinasse treatment technology. By monitoring the dispersion and composition of the generated droplets, operators can optimize the process to maximize wastewater evaporation while minimizing the release of potentially harmful organic compounds. This research also contributes to environmental monitoring by providing a methodology to track the atmospheric transport of pollutants from vaporized wastewater. This is crucial for assessing the potential downwind impacts on air quality, as well as terrestrial and aquatic ecosystems.
2. Materials and Methods
2.1. Study Area
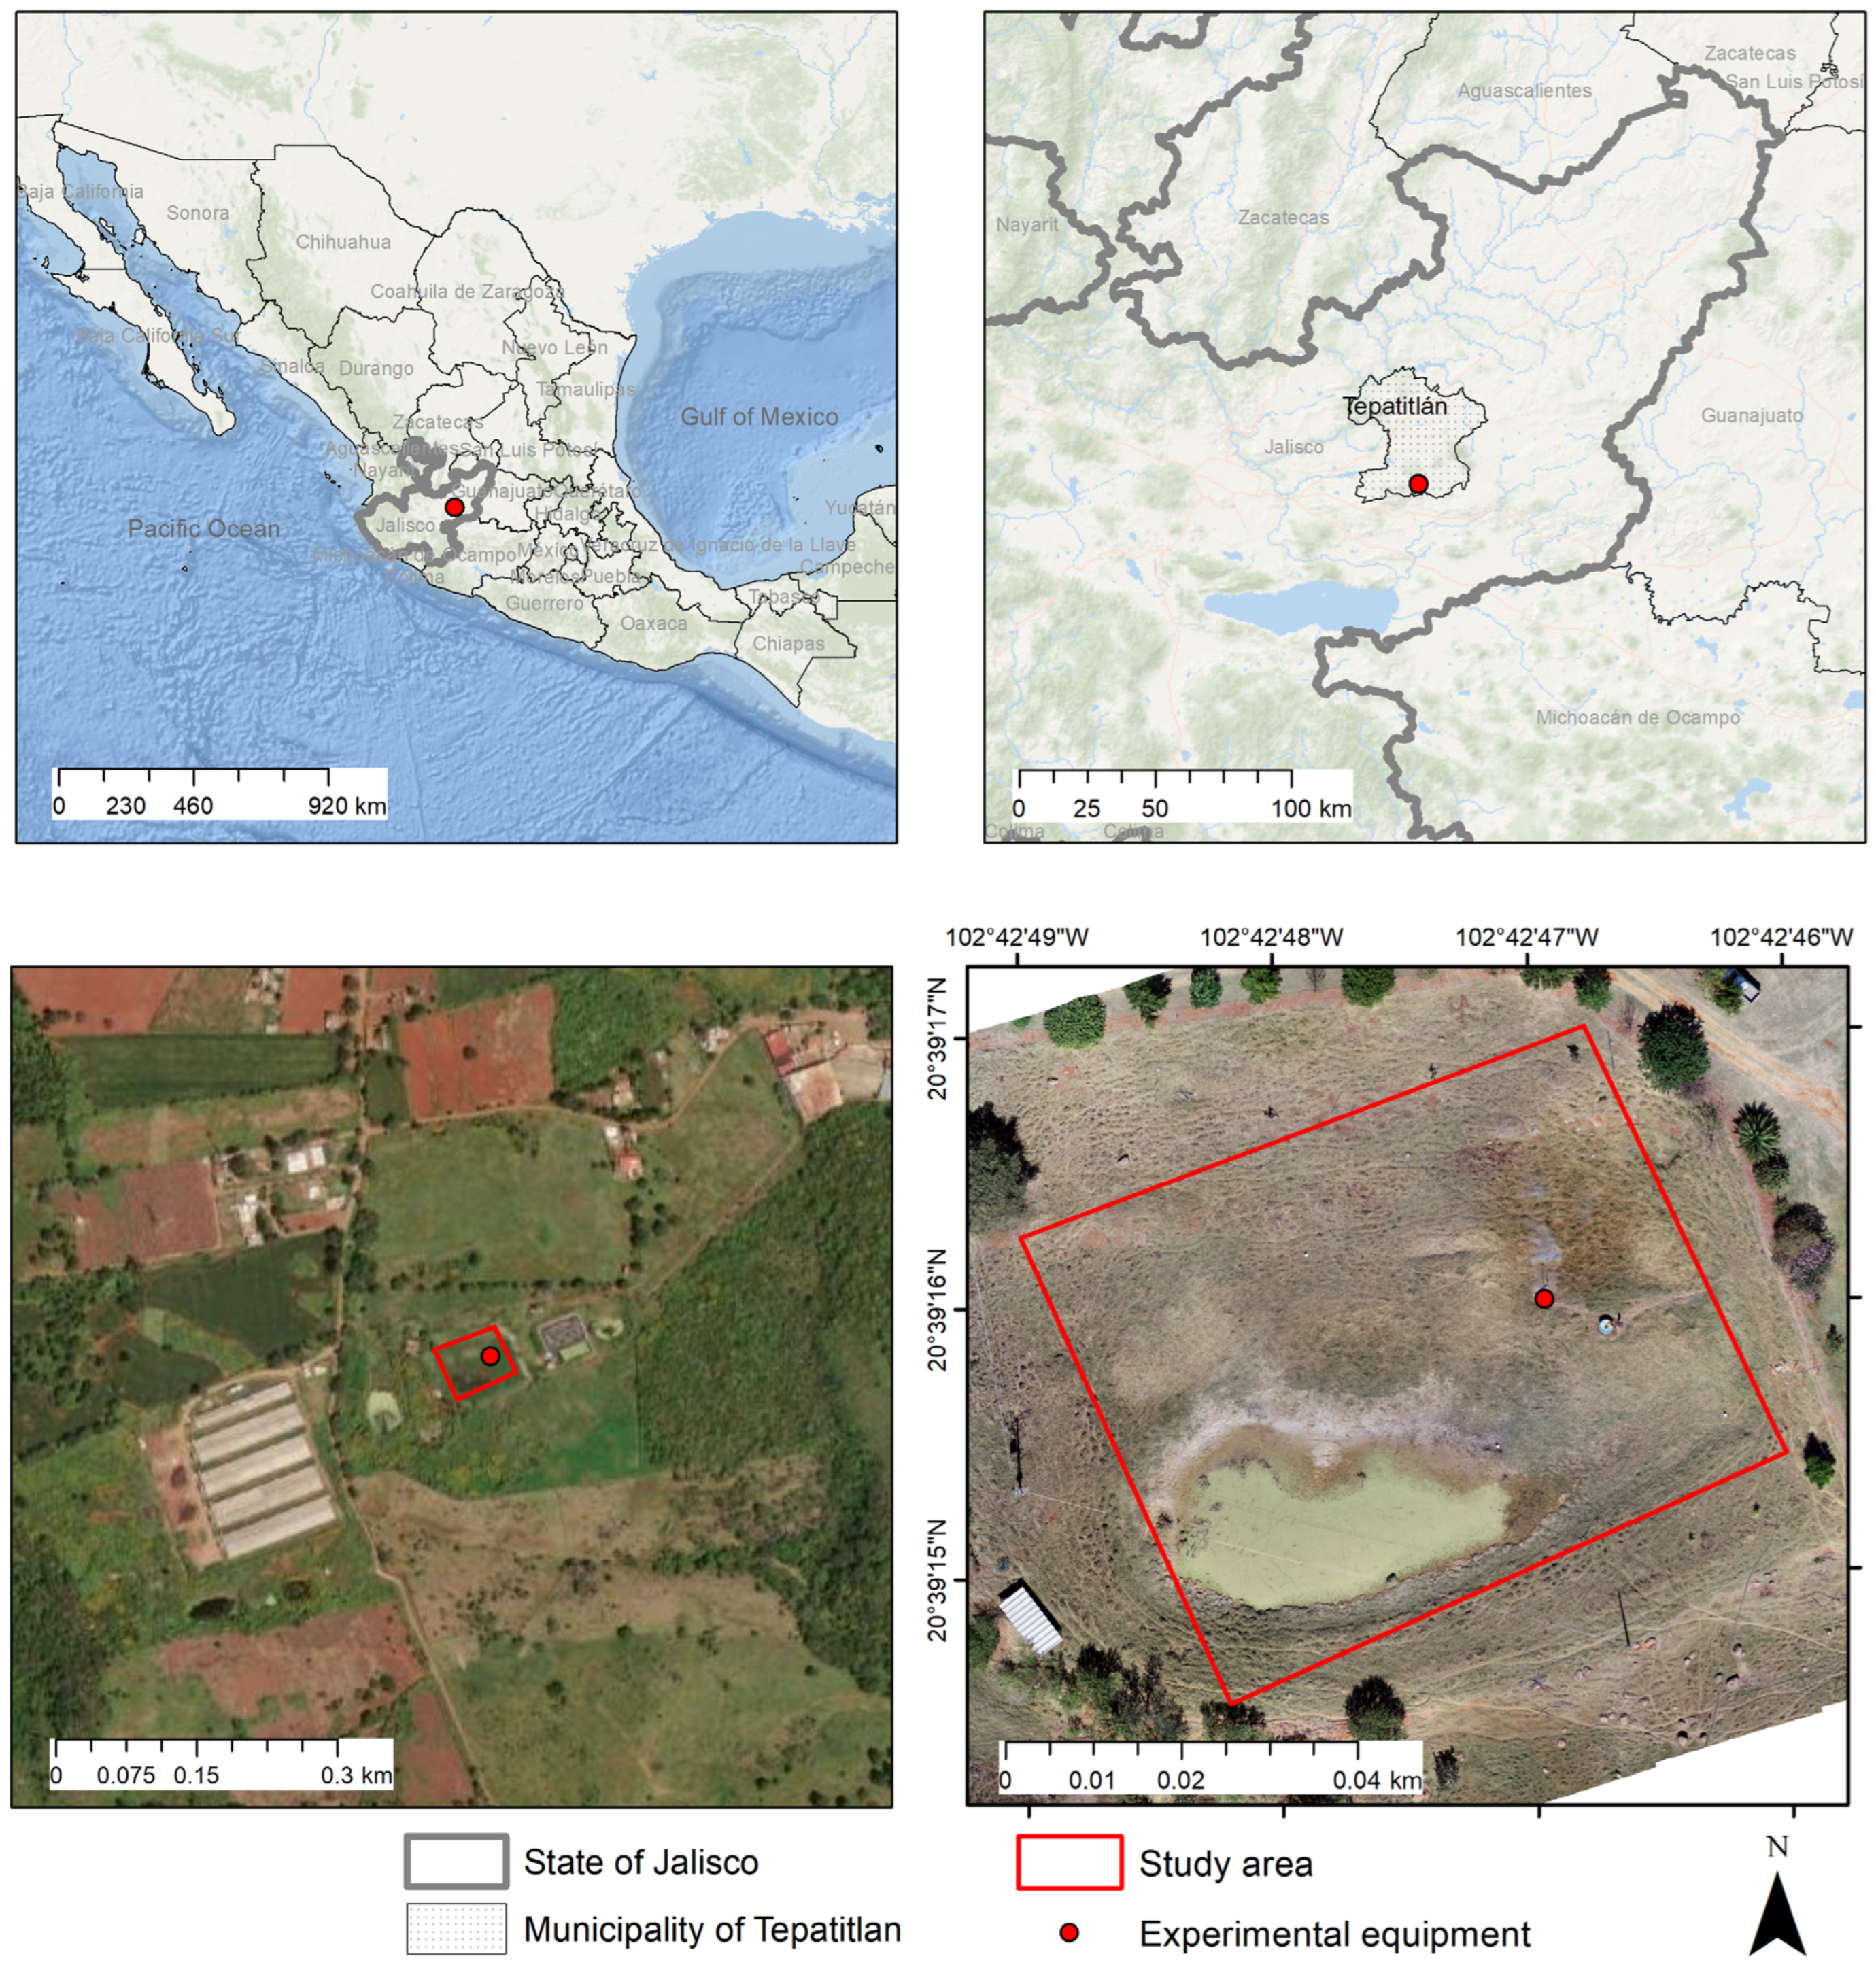
The study area includes the property of a tequila company located in the municipality of Tepatitlán in the state of Jalisco, Mexico. The study area is located between the geographic coordinates 20°39′16.26″ N, 102°42′49.24″ W and 20°39′15.43″ N, 102°42′46.25″ W. (Figure 1). The experimental equipment was installed in that area to carry out experimental tests in a location far from the urban zone, avoiding spectral interference in the measurements.
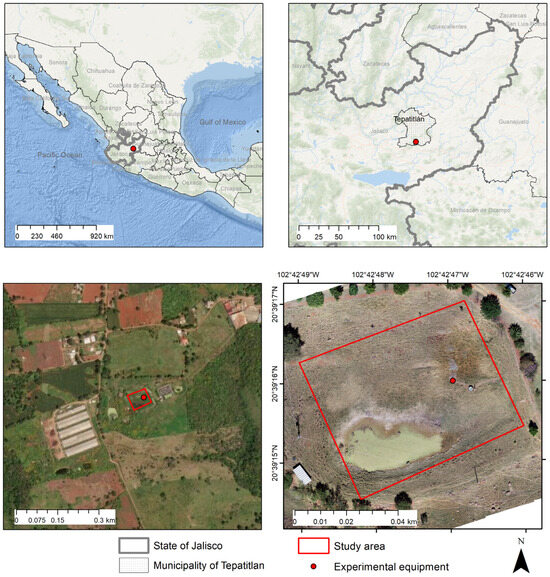
Figure 1.
Geographic location of the study area.
2.2. Droplet Evaporation Equipment
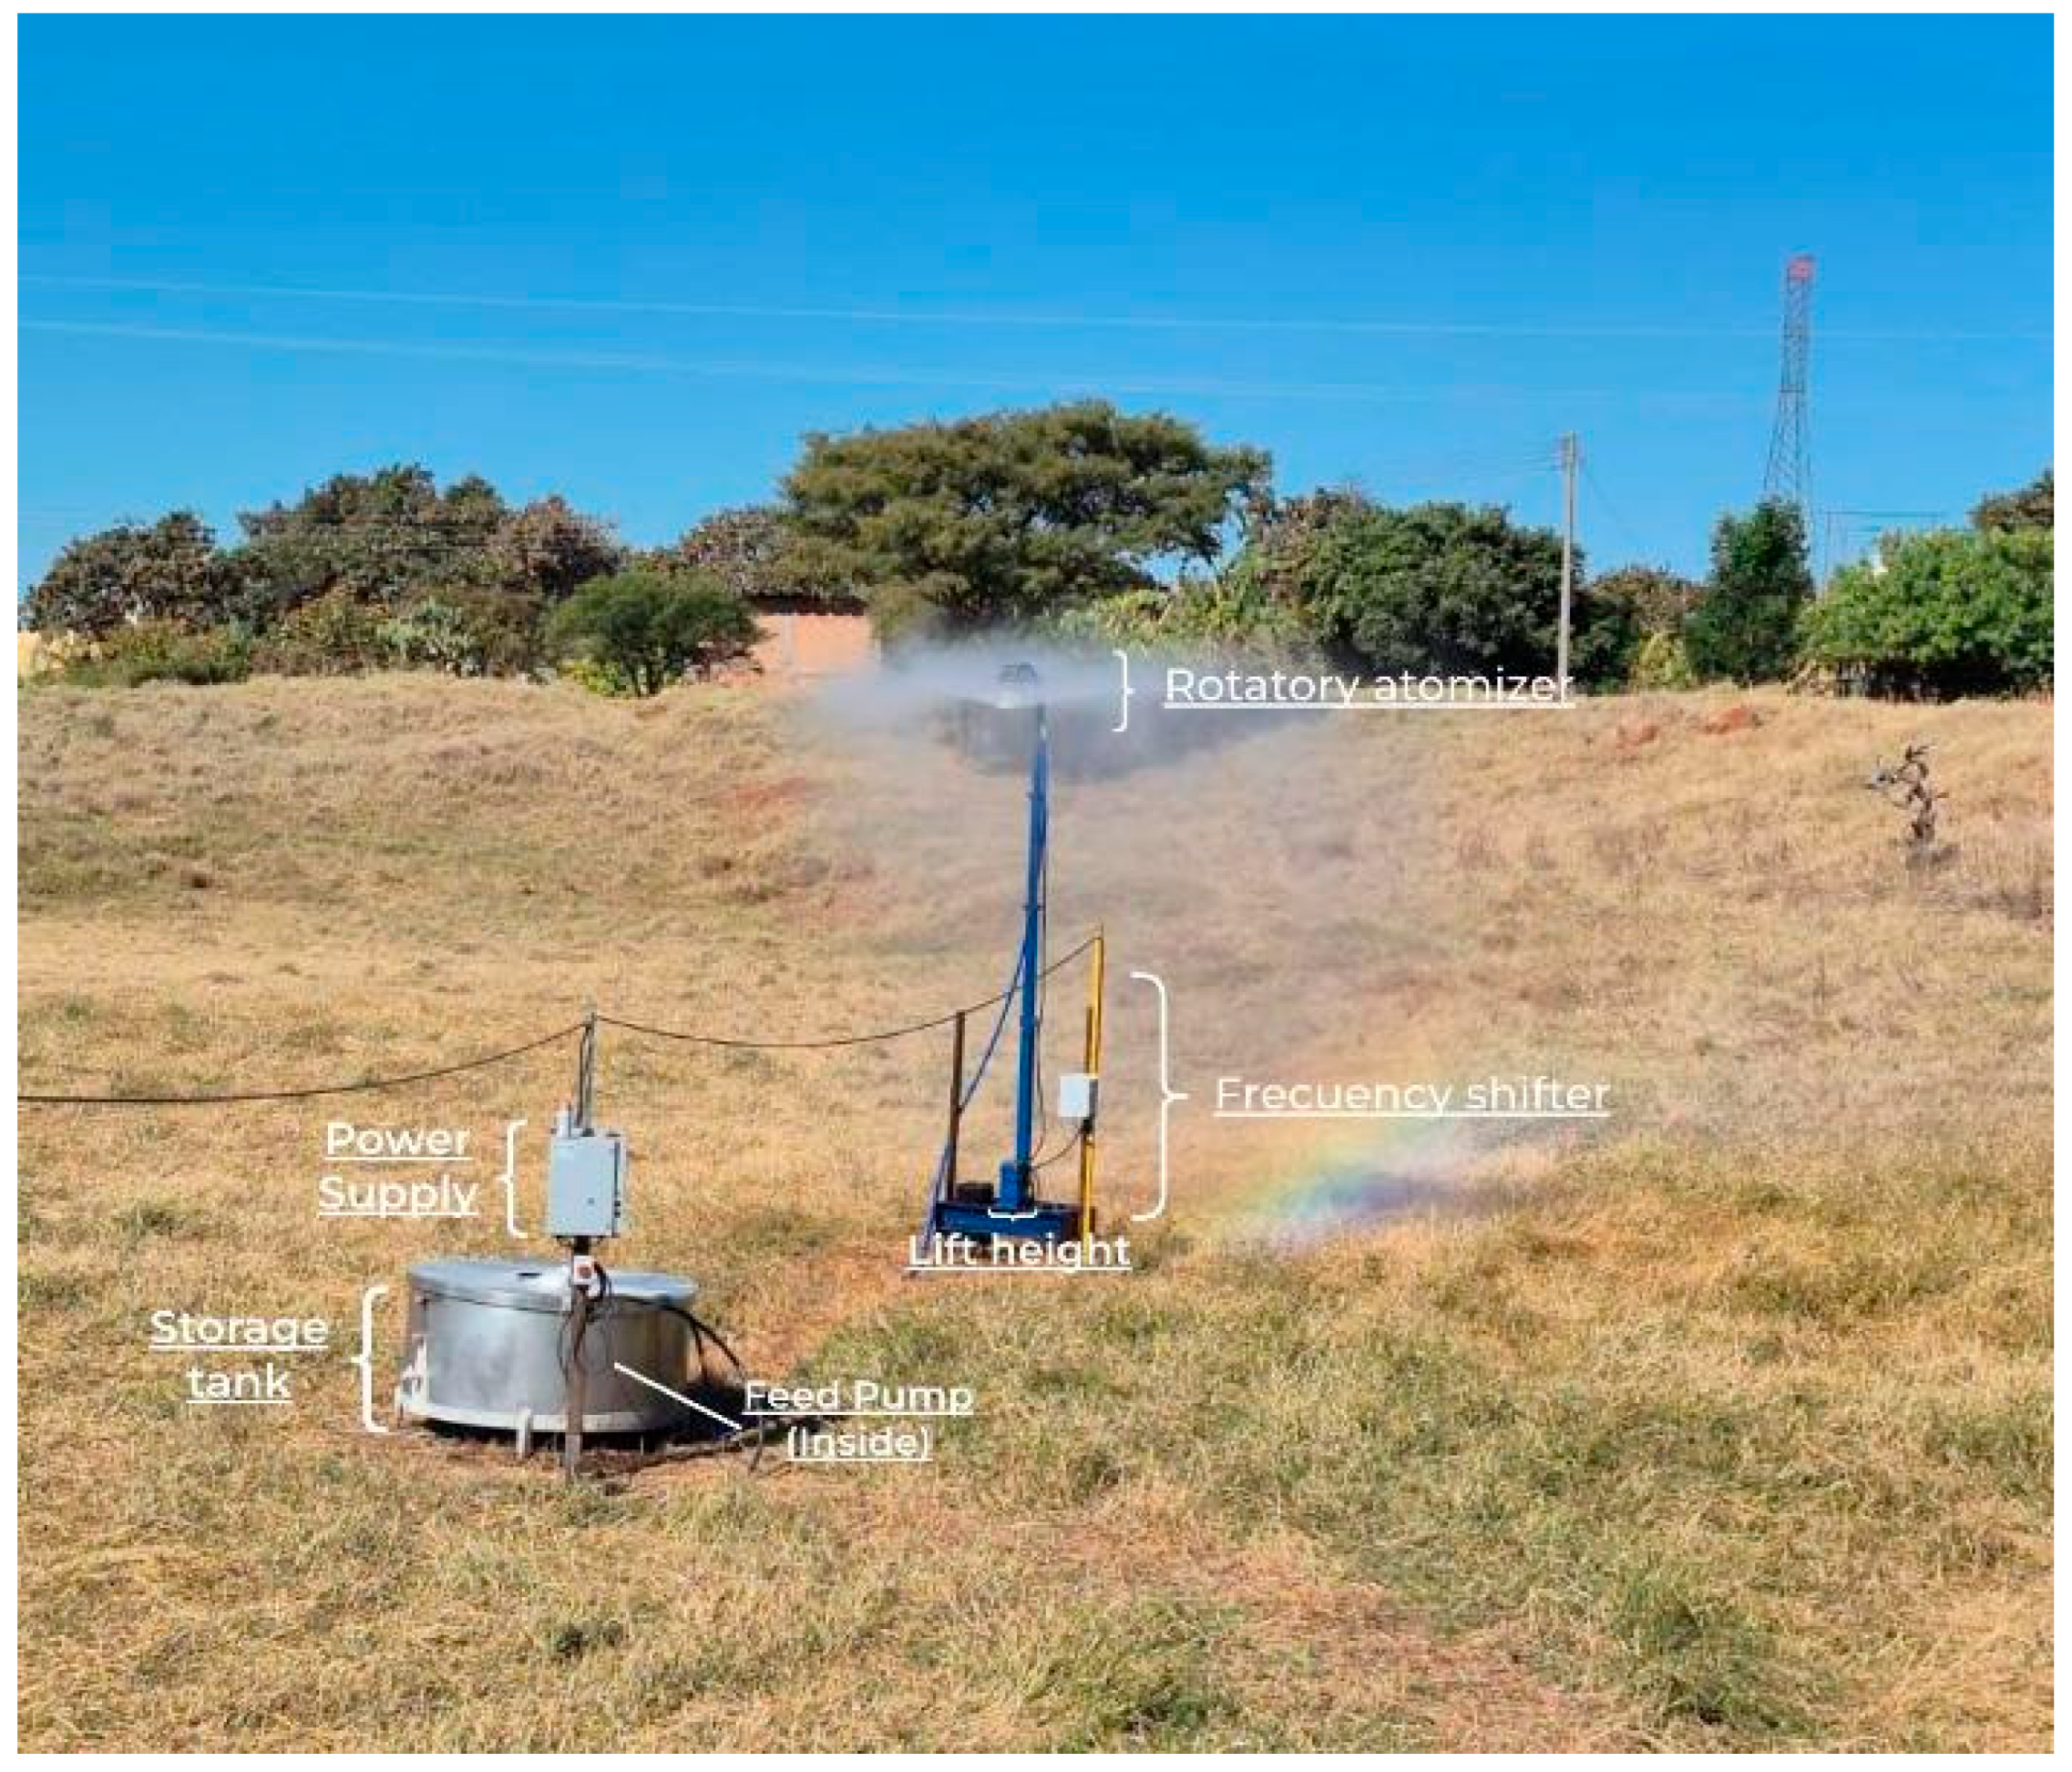
The wastewater droplet evaporation equipment used in this study is shown in Figure 2. This equipment divides the tequila vinasses into fine particles (droplets) that can be evaporated using the energy from the sun. This process accelerates wastewater evaporation by increasing their surface area, which is more exposed to sunlight and air. The equipment consists of a special nozzle that generates small water droplets. This nozzle is located at a height of 3 m (Figure 2). The equipment also features a control panel that activates the pump, directing the vinasse toward the nozzle. A stainless steel container was also required to store the vinasse pumped from the system. The droplets were generated using a flow rate of 20 gallons/min.
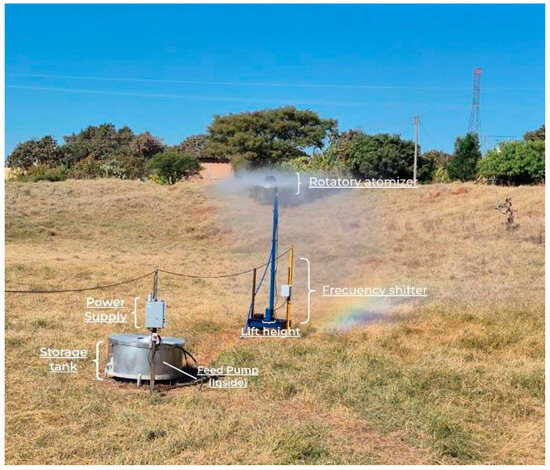
Figure 2.
Photograph of the experimental droplet evaporation equipment.
2.3. Experimental Design
This study was carried out by conducting (1) a spectral analysis of the study area with the equipment off; (2) a spectral analysis of droplets from purified water; and (3) a spectral analysis of droplets from tequila vinasses. To ensure repeatability and reproducibility, two monitoring campaigns were conducted in November 2024 and January 2025. In both campaigns, the line and container used were thoroughly cleaned, eliminating the possibility of cross-contamination.
2.4. Images Acquisition and Calibration
Two Phantom 4 Pro UAVs were used for image acquisition, equipped with a MAPIR Survey 3W (Peau Productions, Inc., San Diego, CA, USA) spectral camera [28] and a FLIR Vue Pro R (FLIR, Middletown, NY, USA) thermal camera [29]. The MAPIR camera captures images in the green (550 nm), red (660 nm), and near infrared (850 nm) spectral bands, while the FLIR camera provides thermal images within the 7500–13,500 nm range. The MAPIR Survey3 was employed as a high-resolution multispectral sensor to capture differences in the spectral reflectance signatures between the tequila vinasse and potable water. Tequila vinasse is a complex effluent containing high concentrations of dissolved organic and inorganic matter, which alters its absorption and reflectance properties compared to those of pure water, particularly in the near-infrared (NIR) and red-edge spectral regions. The FLIR Vue Pro R was selected for its critical capability as a radiometric thermal sensor, enabling the precise, quantitative temperature measurement of individual droplets. This allowed their distinct thermal signatures to be isolated from the ambient temperature of the underlying surface, serving as a highly reliable method for tracking vinasse dispersion. The FLIR and MAPIR camera output images in RAW format with a radiometric resolution of 12 bits.
During the first monitoring campaign (November 2024), multispectral images were captured with a spatial resolution of 1.82 cm/pixel for the multispectral images and 7.6 cm/pixel for the thermal images. The photogrammetric flight with the VIS/NIR camera was conducted at a height of 40 m and a speed of 3.5 m/s, while the TIR camera flight was conducted at the same height but at a speed of 2.2 m/s. In the second monitoring campaign, the flight with the VIS/NIR camera took place at an altitude of 30 m and a speed of 2.6 m/s, while the TIR camera flight took place at an altitude of 30 m and a speed of 1.9 m/s (Table 1). For both campaigns, the cameras were nadir oriented (90°). The second campaign’s images displayed a resolution of 1.4 cm/pixel for multispectral images and 6.0 cm/pixel for thermal images. Therefore, the spatial resolution of the images in the second monitoring campaign is higher.

Table 1.
Characteristics of the VIS/NIR [28] and thermal [29] cameras.
At the end of each flight, the images from the Survey 3W camera were transferred to a computer and post-processed using the Mapir Camera Control open-source software version 10162019 (https://www.mapir.camera/en-gb/products/mapir-camera-control, accessed on 4 March 2025) to generate calibrated TIFF images based on known ground target values, following the procedure outlined by Chávez-Martínez et al. [30]. The thermal camera images were also post-processed by converting the radiometric data into temperature readings using a raster calculator [31].
PlanetScope satellite images [32] were acquired via the Planet Education and Research Program and selected to match the dates of the field campaigns. These images display a spatial resolution of 3.8 m and cover the area where the droplet evaporation equipment was located (Table 2). The chosen images were free from significant cloud coverage and did not show any defects or sensor interferences.
Table 2.
Characteristics of the PlanetScope images.
2.5. Generation of Orthomosaics
The generation of orthomosaics from the images obtained by the UAVs was carried out based using structure for motion algorithms. The workflow is divided into six phases, as proposed by Chavez-Martínez et al. [33]: (1) orientation of the images, (2) configuration of the geographic coordinate system, (3) generation of a dense point cloud, (4) generation of a digital elevation model (DEM), and (5) generation of the orthomosaic. The result of these steps was an orthomosaic in “TIFF” format. TIFF files exhibit a file size between 750 and 850 Mb. To achieve more accurate identification of the droplet wastewater, (6) a supervised classification process was implemented to eliminate background noise (soil, weeds, trees, and other elements) from the thermal orthomosaic. Each pixel value (radiometric value) of the thermal orthomosaic was converted to Celsius by using Equation (1) [34].
where R is the radiometric value obtained from the thermal orthomosaic.
2.6. Spectral and Statistical Analysis
Spectral analysis was performed by measuring the reflectance values for each wavelength captured by the sensors. To quantitatively evaluate the differences between the spectral signatures obtained under the experimental conditions, a rigorous statistical analysis was conducted. This involved using a Z-test for the difference of two means, a statistical procedure ideal for comparing the means of two independent groups when the sample sizes are large or the population variances are known.
The primary purpose of applying the Z-test was to determine whether the observed differences in mean reflectance values at specific wavelengths (e.g., between vinasse droplets and water droplets) were statistically significant or simply due to random chance. The test operates under the null hypothesis (H0) that there is no true difference between the population means from which the samples were drawn (μ1 = μ2). The Z-statistic was calculated using Equation (2) [35]:
where x1 and x2 are the sample means of the reflectance values for the two groups being compared; (μ1 − μ2)0 is the hypothesized difference between the population means under the null hypothesis, which is 0 for this study. σ21 and σ22 are the population variances. Since these are often unknown, the sample variances (s21 and s22) are used as estimates, which is appropriate for large sample sizes. n1 and n2 are the sizes of the respective samples.
A resulting p-value below a predetermined significance level (α = 0.05) allows for the rejection of the null hypothesis, indicating a significant difference between the spectral signatures. In addition to the Z-test, descriptive statistics, including histograms, means, and standard deviations, were generated using R software version 4.3.1 to characterize the data distribution. Furthermore, a Pearson correlation analysis was performed in R to determine the degree of linear relationship between the reflectance values measured by the satellite and UAV sensors.
3. Results and Discussion
3.1. Thermal Analysis
Figure 3 shows the temperature behavior in the study area during the second monitoring campaign. Figure 3a shows the histogram of the temperature in the study area prior to turning on the wastewater droplet equipment. The surface temperature showed normal behavior, with values ranging between 29.4 °C and 50.8 °C, and an average value of 36.6 °C. Figure 3b,c show the temperature behavior during the operation of the droplet evaporation system. The presence of the droplets was identified, as they exhibited different temperatures compared to those of the surrounding area.
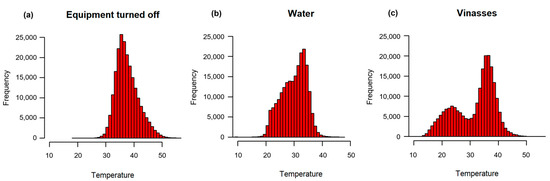
Figure 3.
Temperature behavior in the study area during the second monitoring campaign. Three separate flights were carried out on the same day to identify (a) background conditions with equipment off (10:30), (b) potable water droplets (11:30), and (c) vinasse droplets (12:40). Each flight comprised an approximate duration of 25 min.
The temperature exhibited bimodal behavior, with two distinct peaks or crests (Figure 3c). The peaks in the graph suggest the presence of two distinct groups within the population: one representing the temperature in the droplets zone and the other corresponding to the temperature of the remaining study area. Figure 3b,c also demonstrated that the thermal characteristics of the droplets generated are evident.
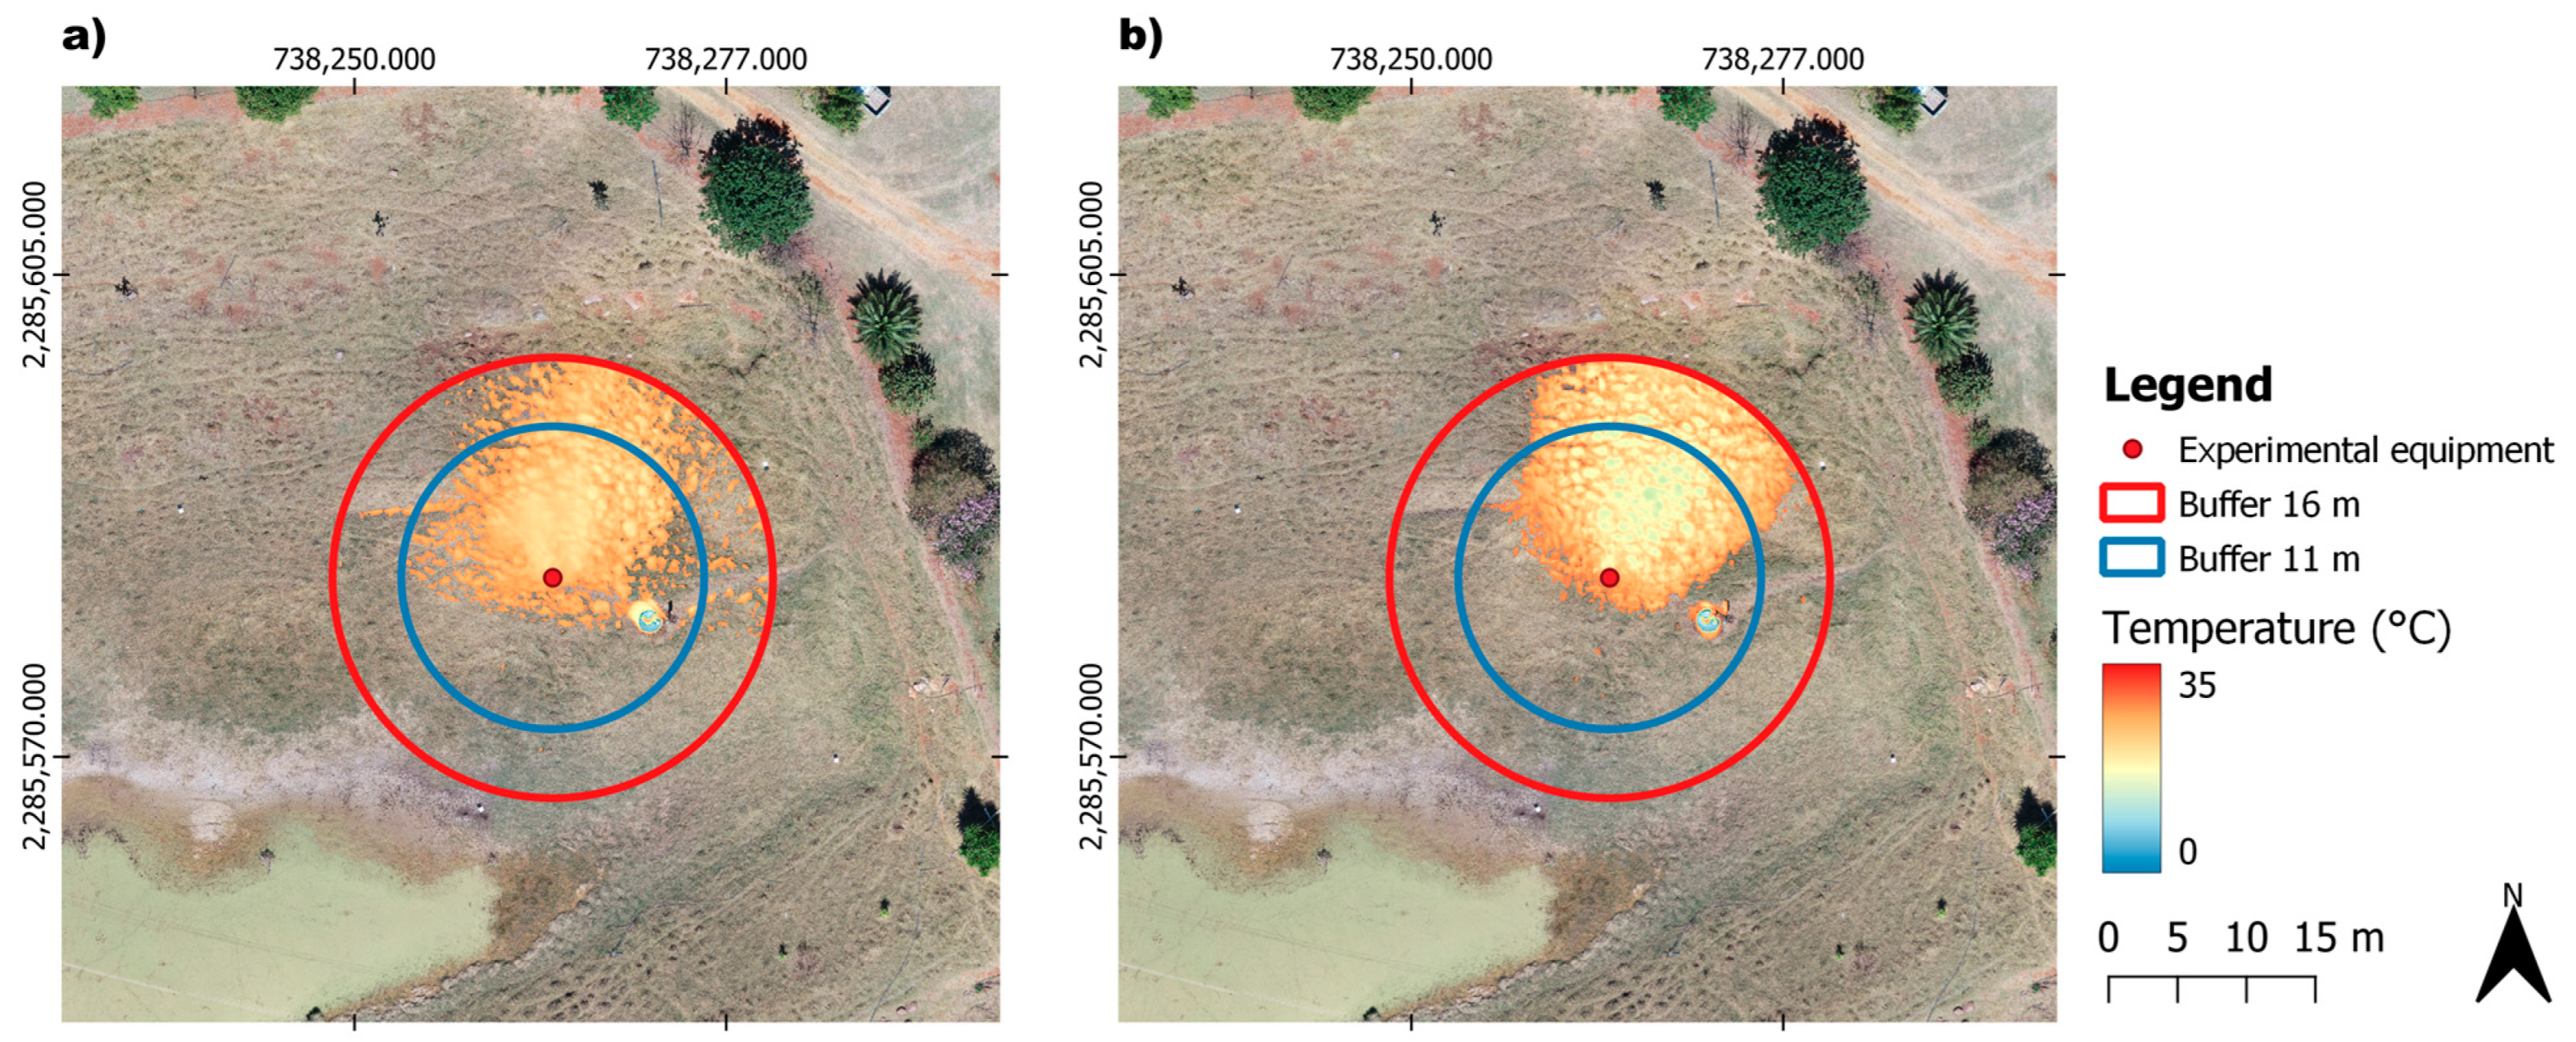
Figure 4 shows the spatial temperature distribution in the study area when the experimental equipment was generating droplets from purified water (Figure 4a) and tequila vinasses (Figure 4b). The temperature differences between the droplets and the ground surface allowed for the identification and determination of the droplets’ influence area, which varied depending on the prevailing meteorological conditions. In this study, the droplet influence radius varied from 11 to 16 m, measured from the aerosol emission point.
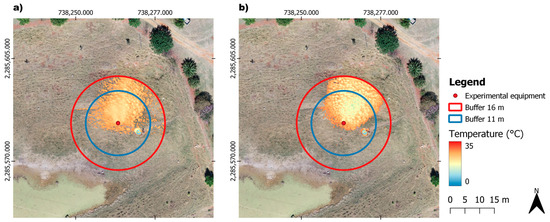
Figure 4.
Spatial behavior of aerosol temperature in the study area during the first monitoring campaign for (a) purified water and (b) vinasse. The analysis is overlaid on a true-color image of the surface, where the color palette represents the thermal dispersion of the aerosol plume.
These results were obtained under the following weather conditions: a sunny day, an ambient temperature range of 18 °C to 24 °C, and wind speeds between 6 and 16 km/h. Therefore, the droplet influence zone can be considered typical, as it was recorded under standard weather conditions for the study area. The data for the droplet influence zone could be used to design a mitigation area to address potential airborne contaminants that may settle on the surface. The droplet influence zone was confirmed in both monitoring campaigns.
3.2. Spectral Analysis of UAV Orthophotos
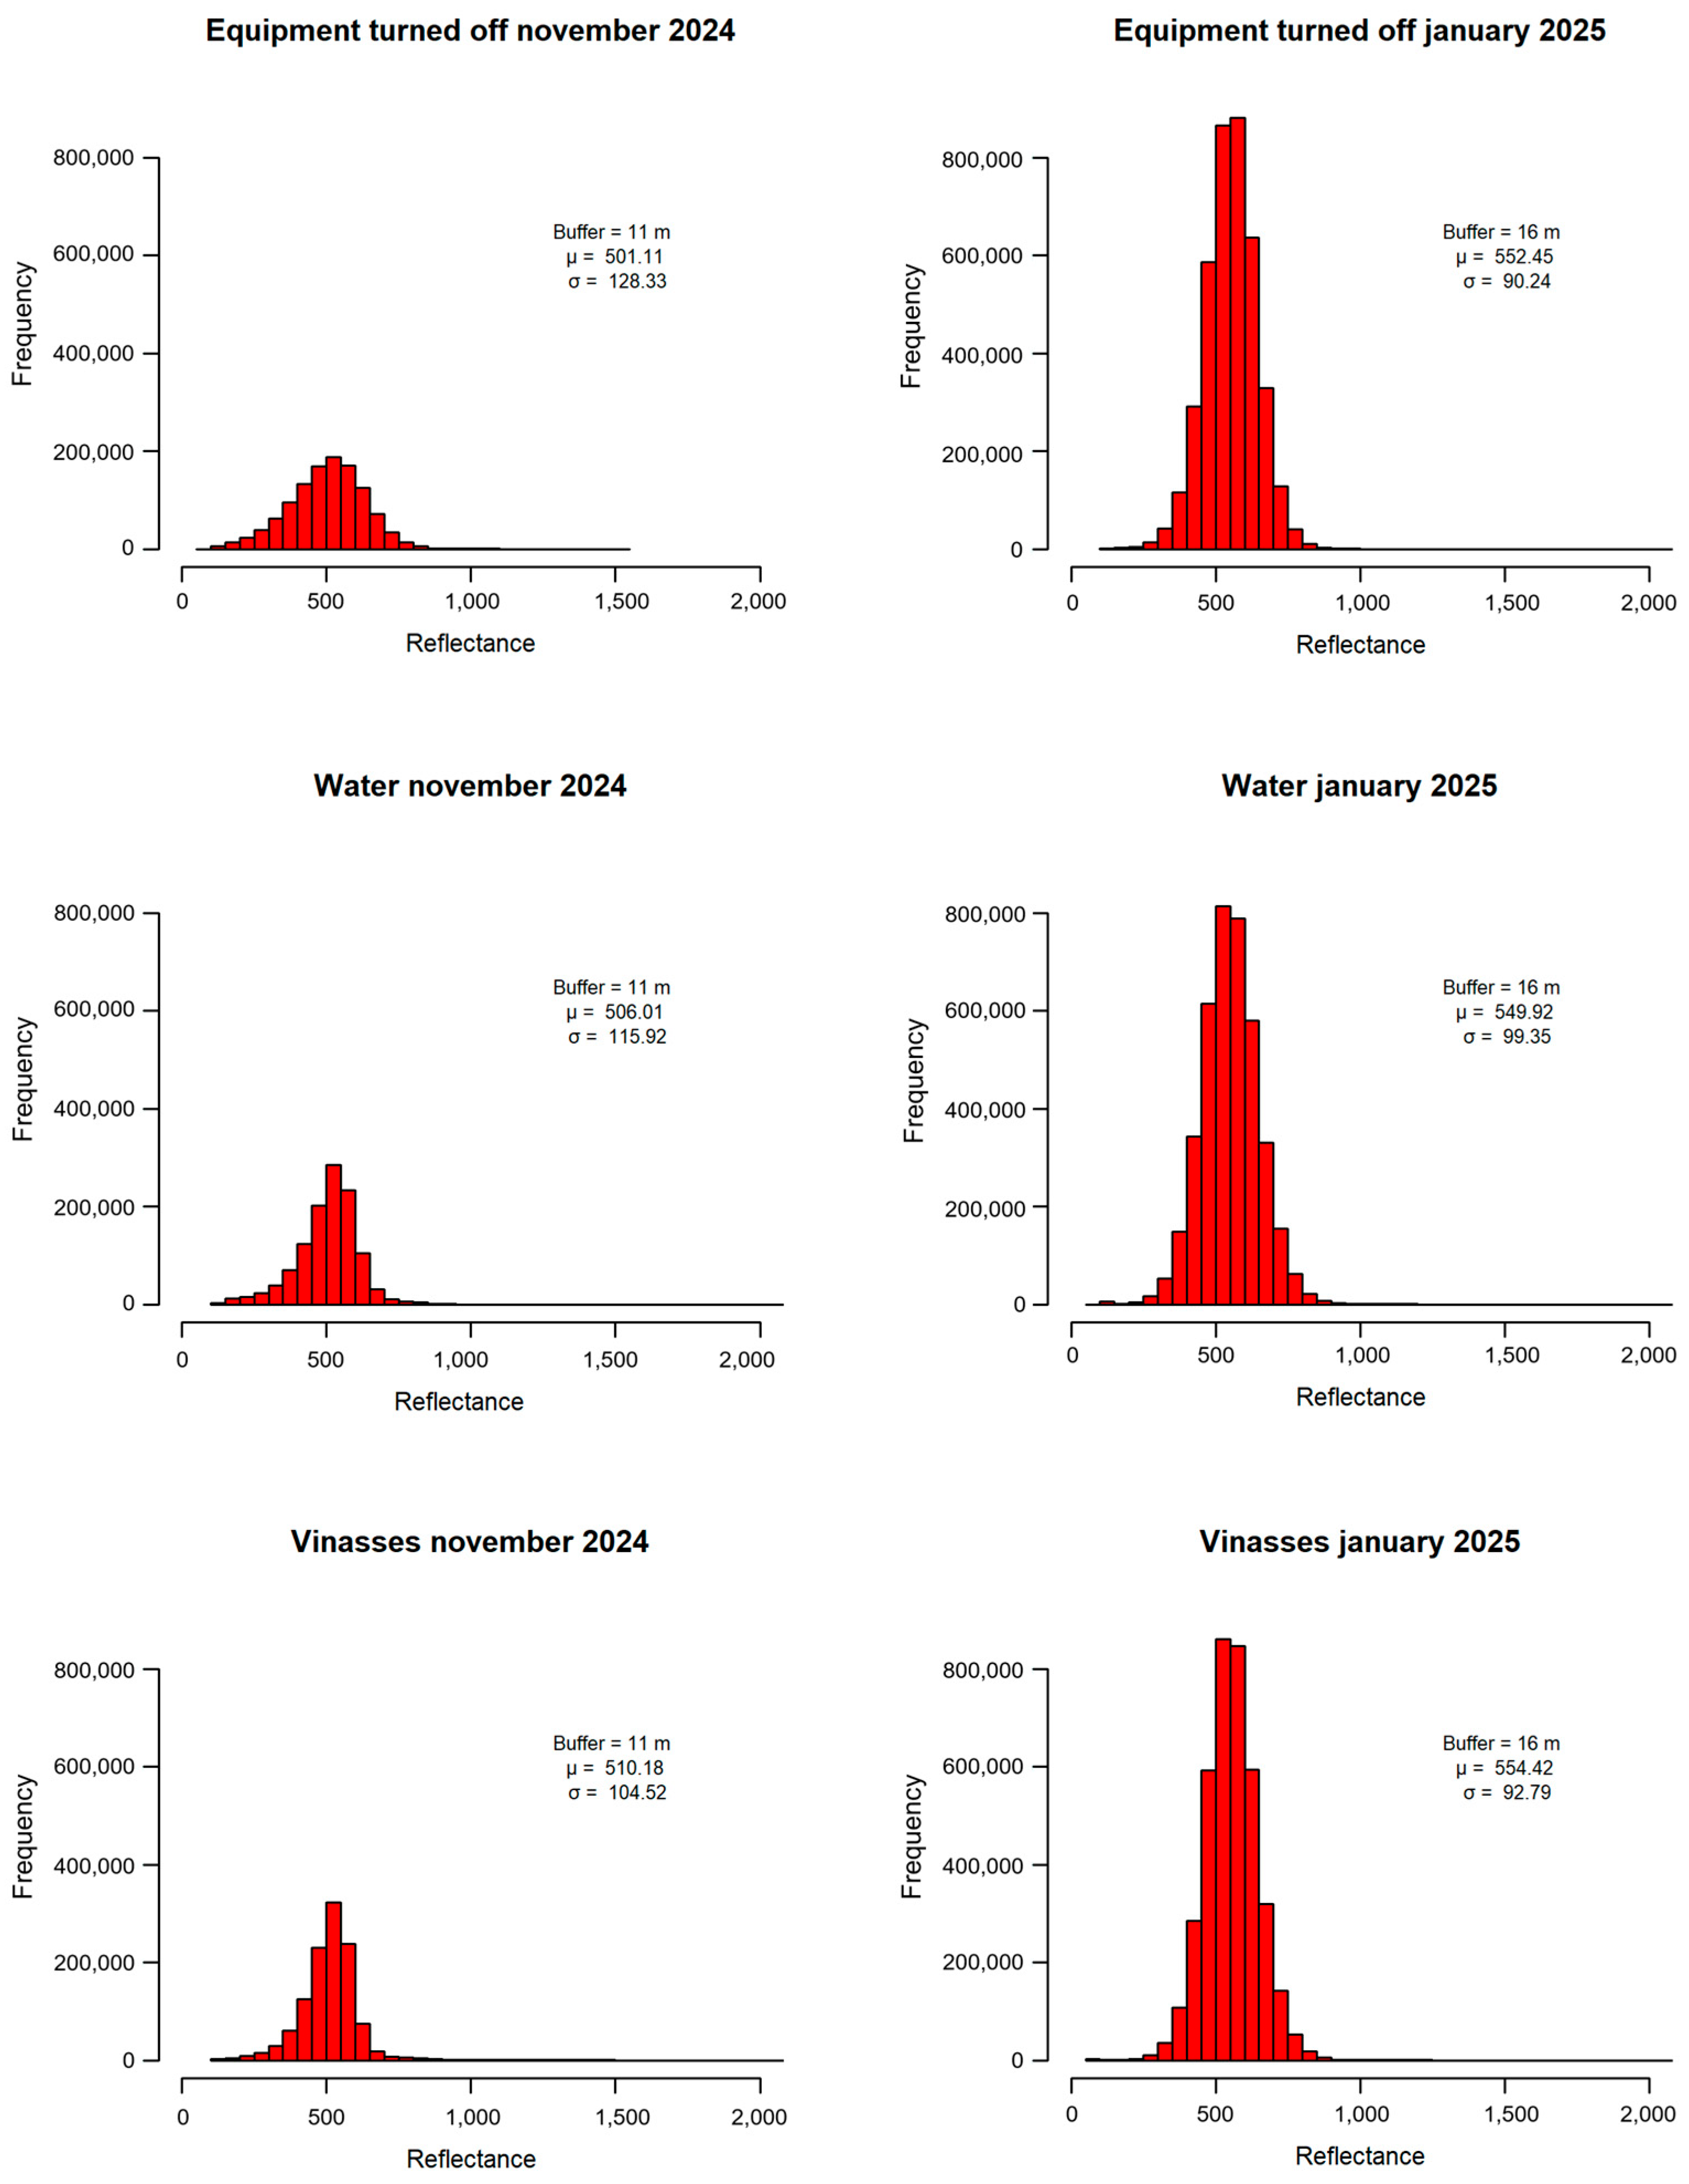
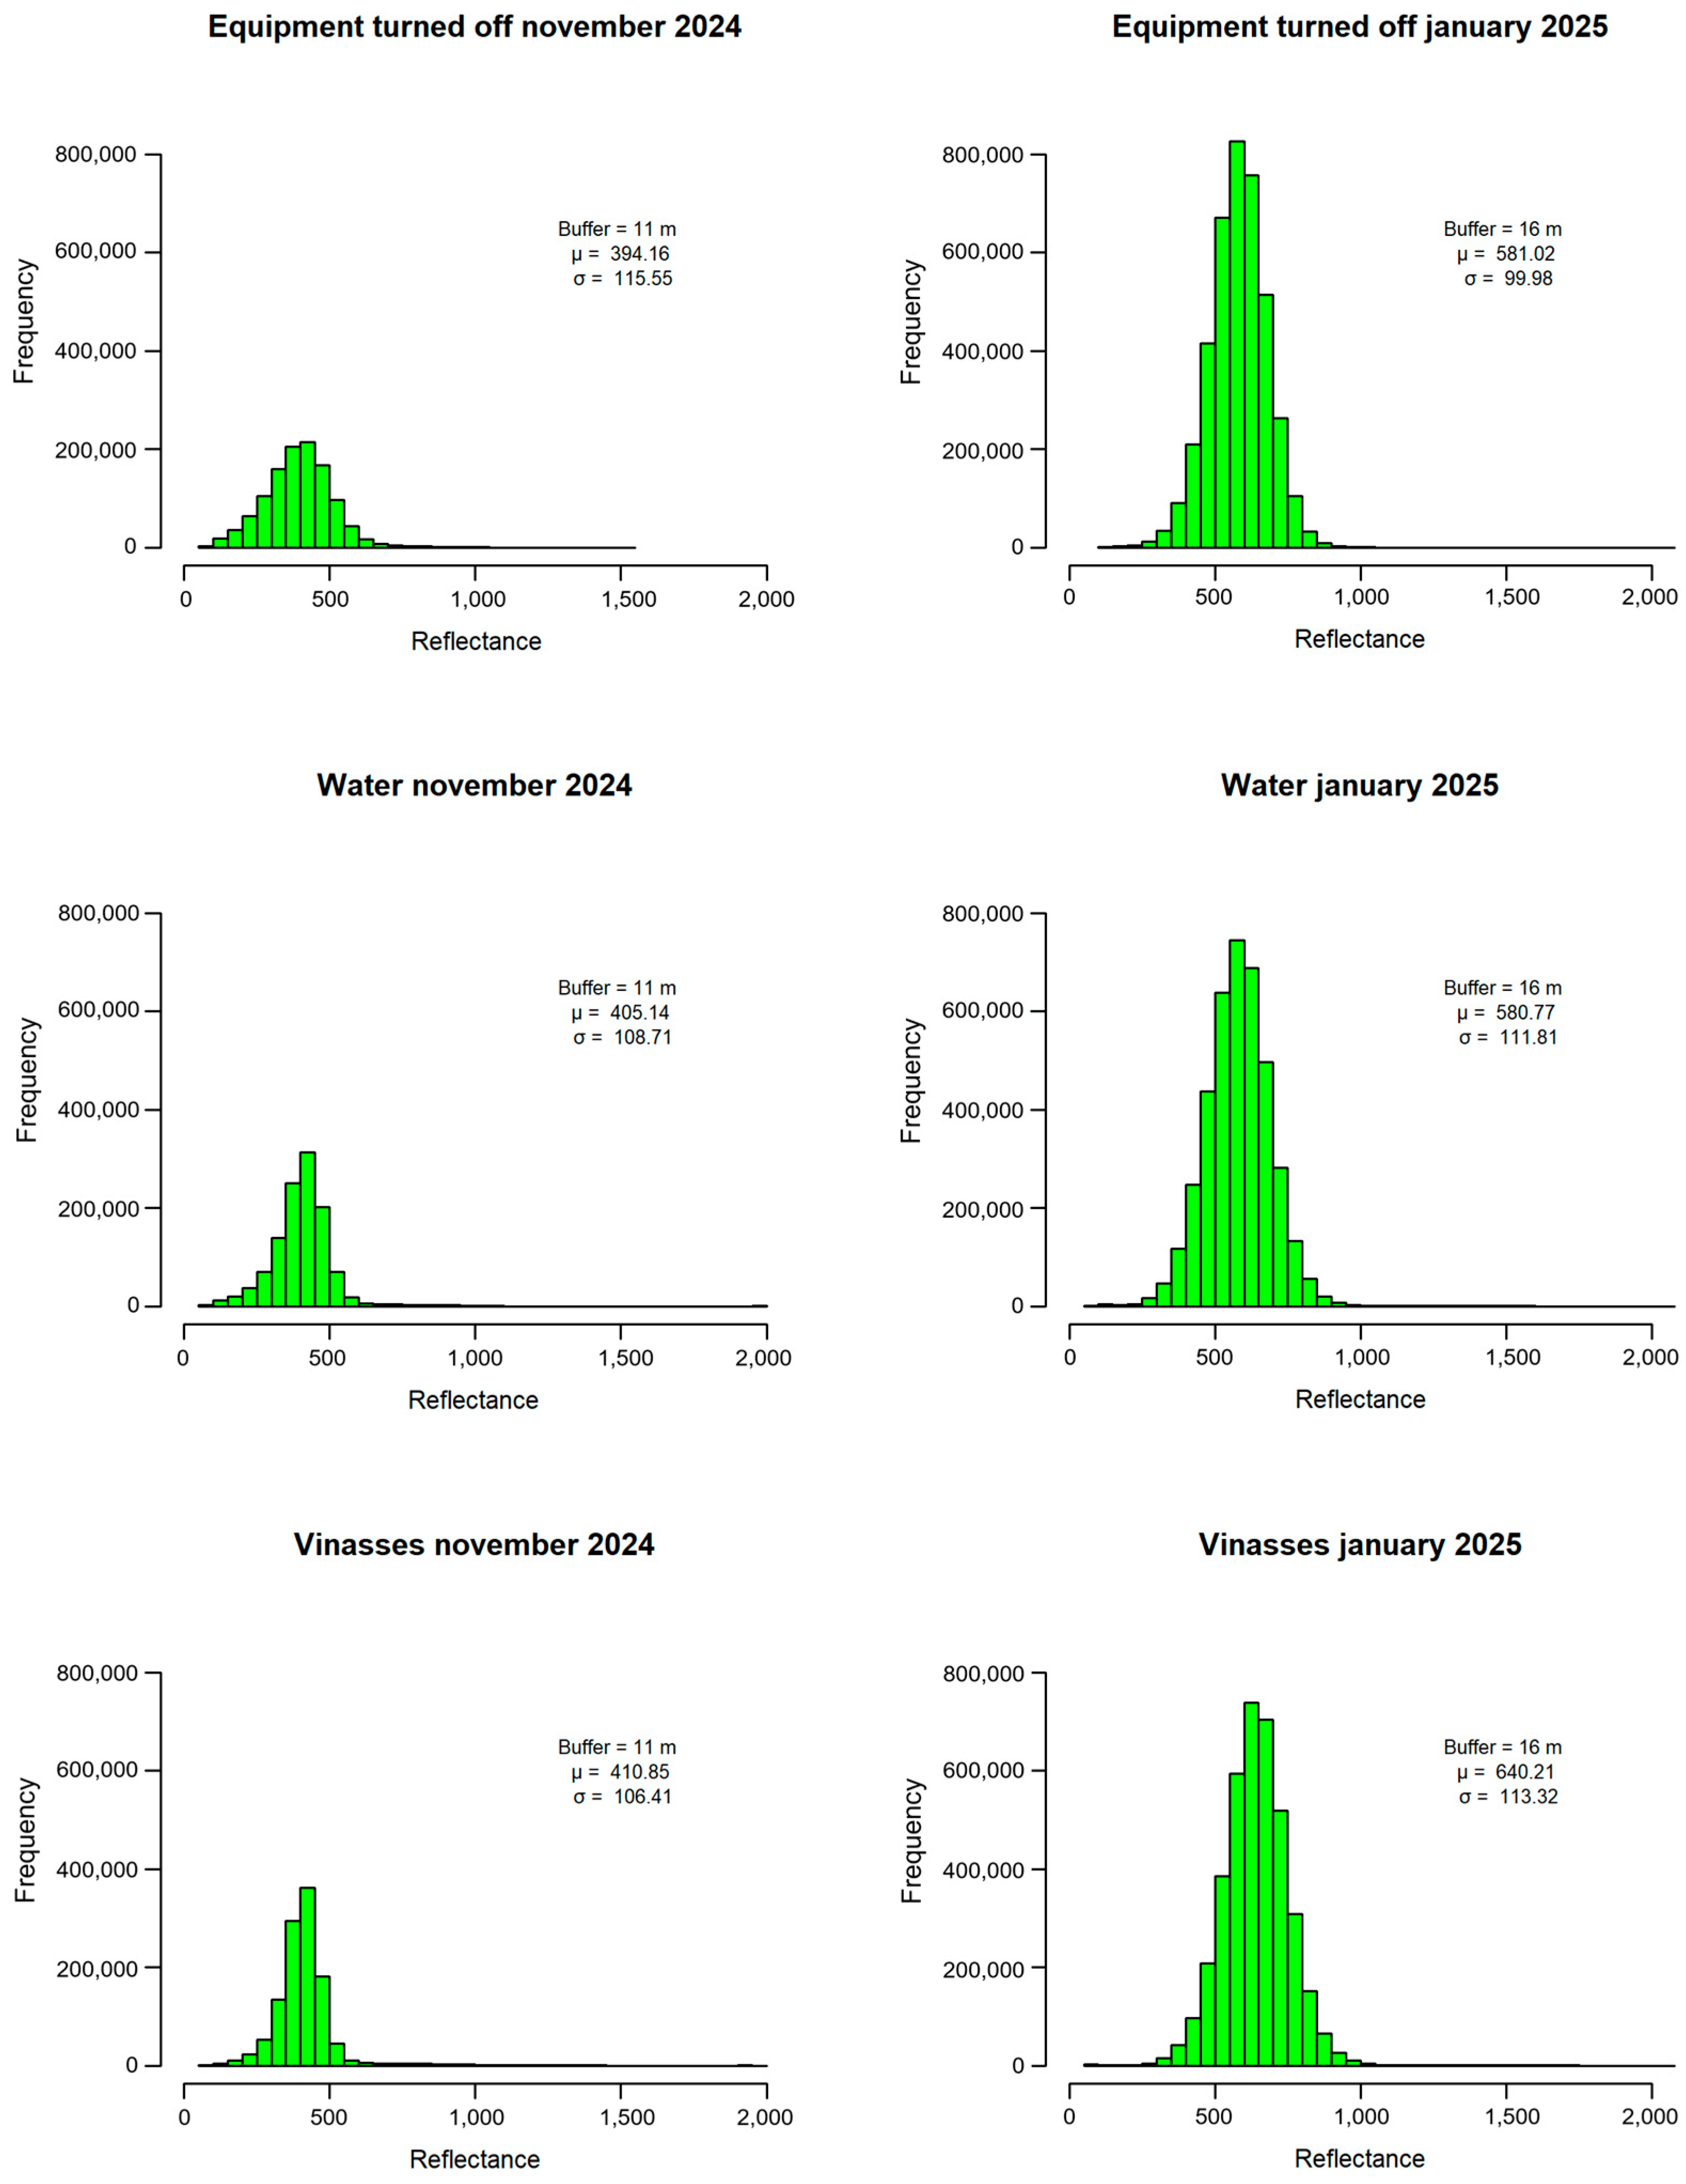
A multispectral analysis was carried out in the droplets influence area. Prior to the spectral analysis, a supervised classification process was carried out to eliminate background noise (vegetation and soil present in the study area). Figure 5, Figure 6 and Figure 7 show the behavior of the red, green, and near infrared (NIR) spectrum bands obtained from the UAV in the droplets influence zone, respectively. The reflectance values in these figures have been scaled to conserve disk space and maintain data precision. Consequently, their values fall outside the typical 0–1 range. UAV reflectance was scaled for comparison with PlanetScope’s products, whose pixel values must be divided by 10,000 to obtain true reflectance.
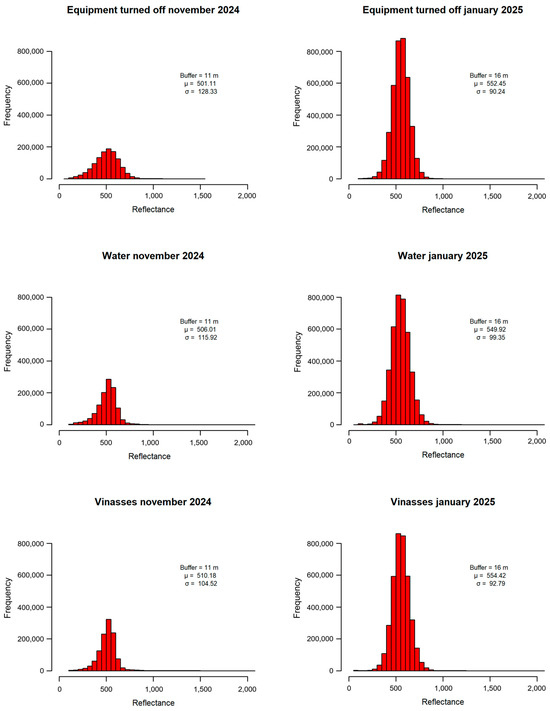
Figure 5.
Reflectance behavior in the red spectral band in both monitoring campaigns.
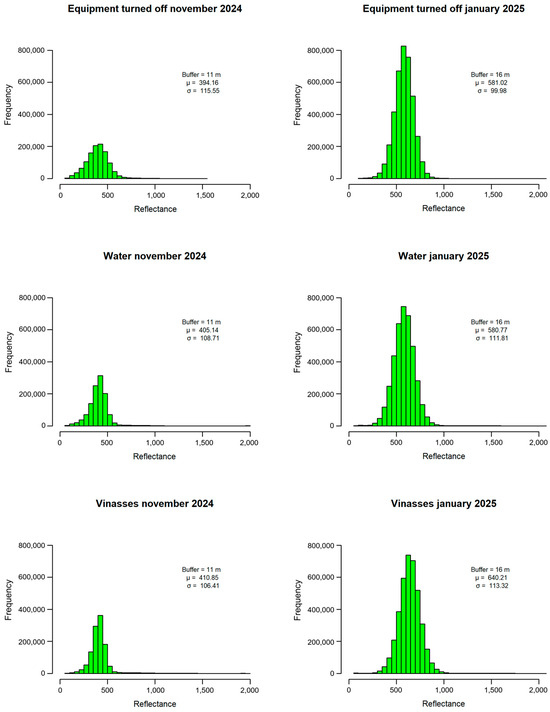
Figure 6.
Reflectance behavior in the green band during November 2024.
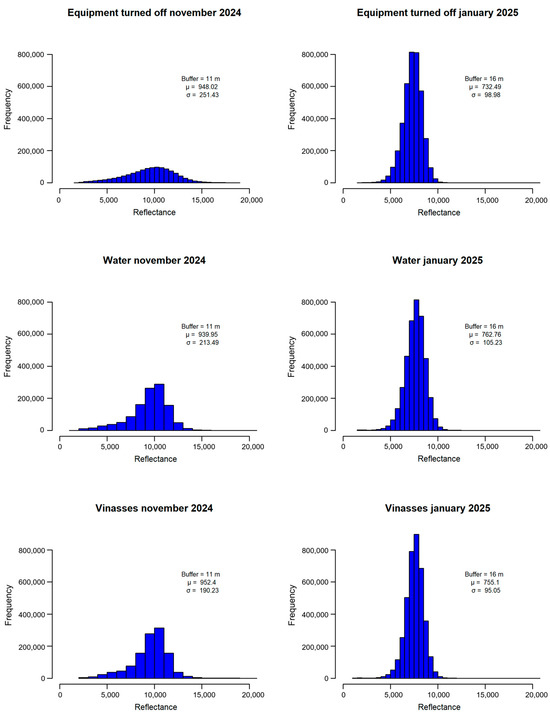
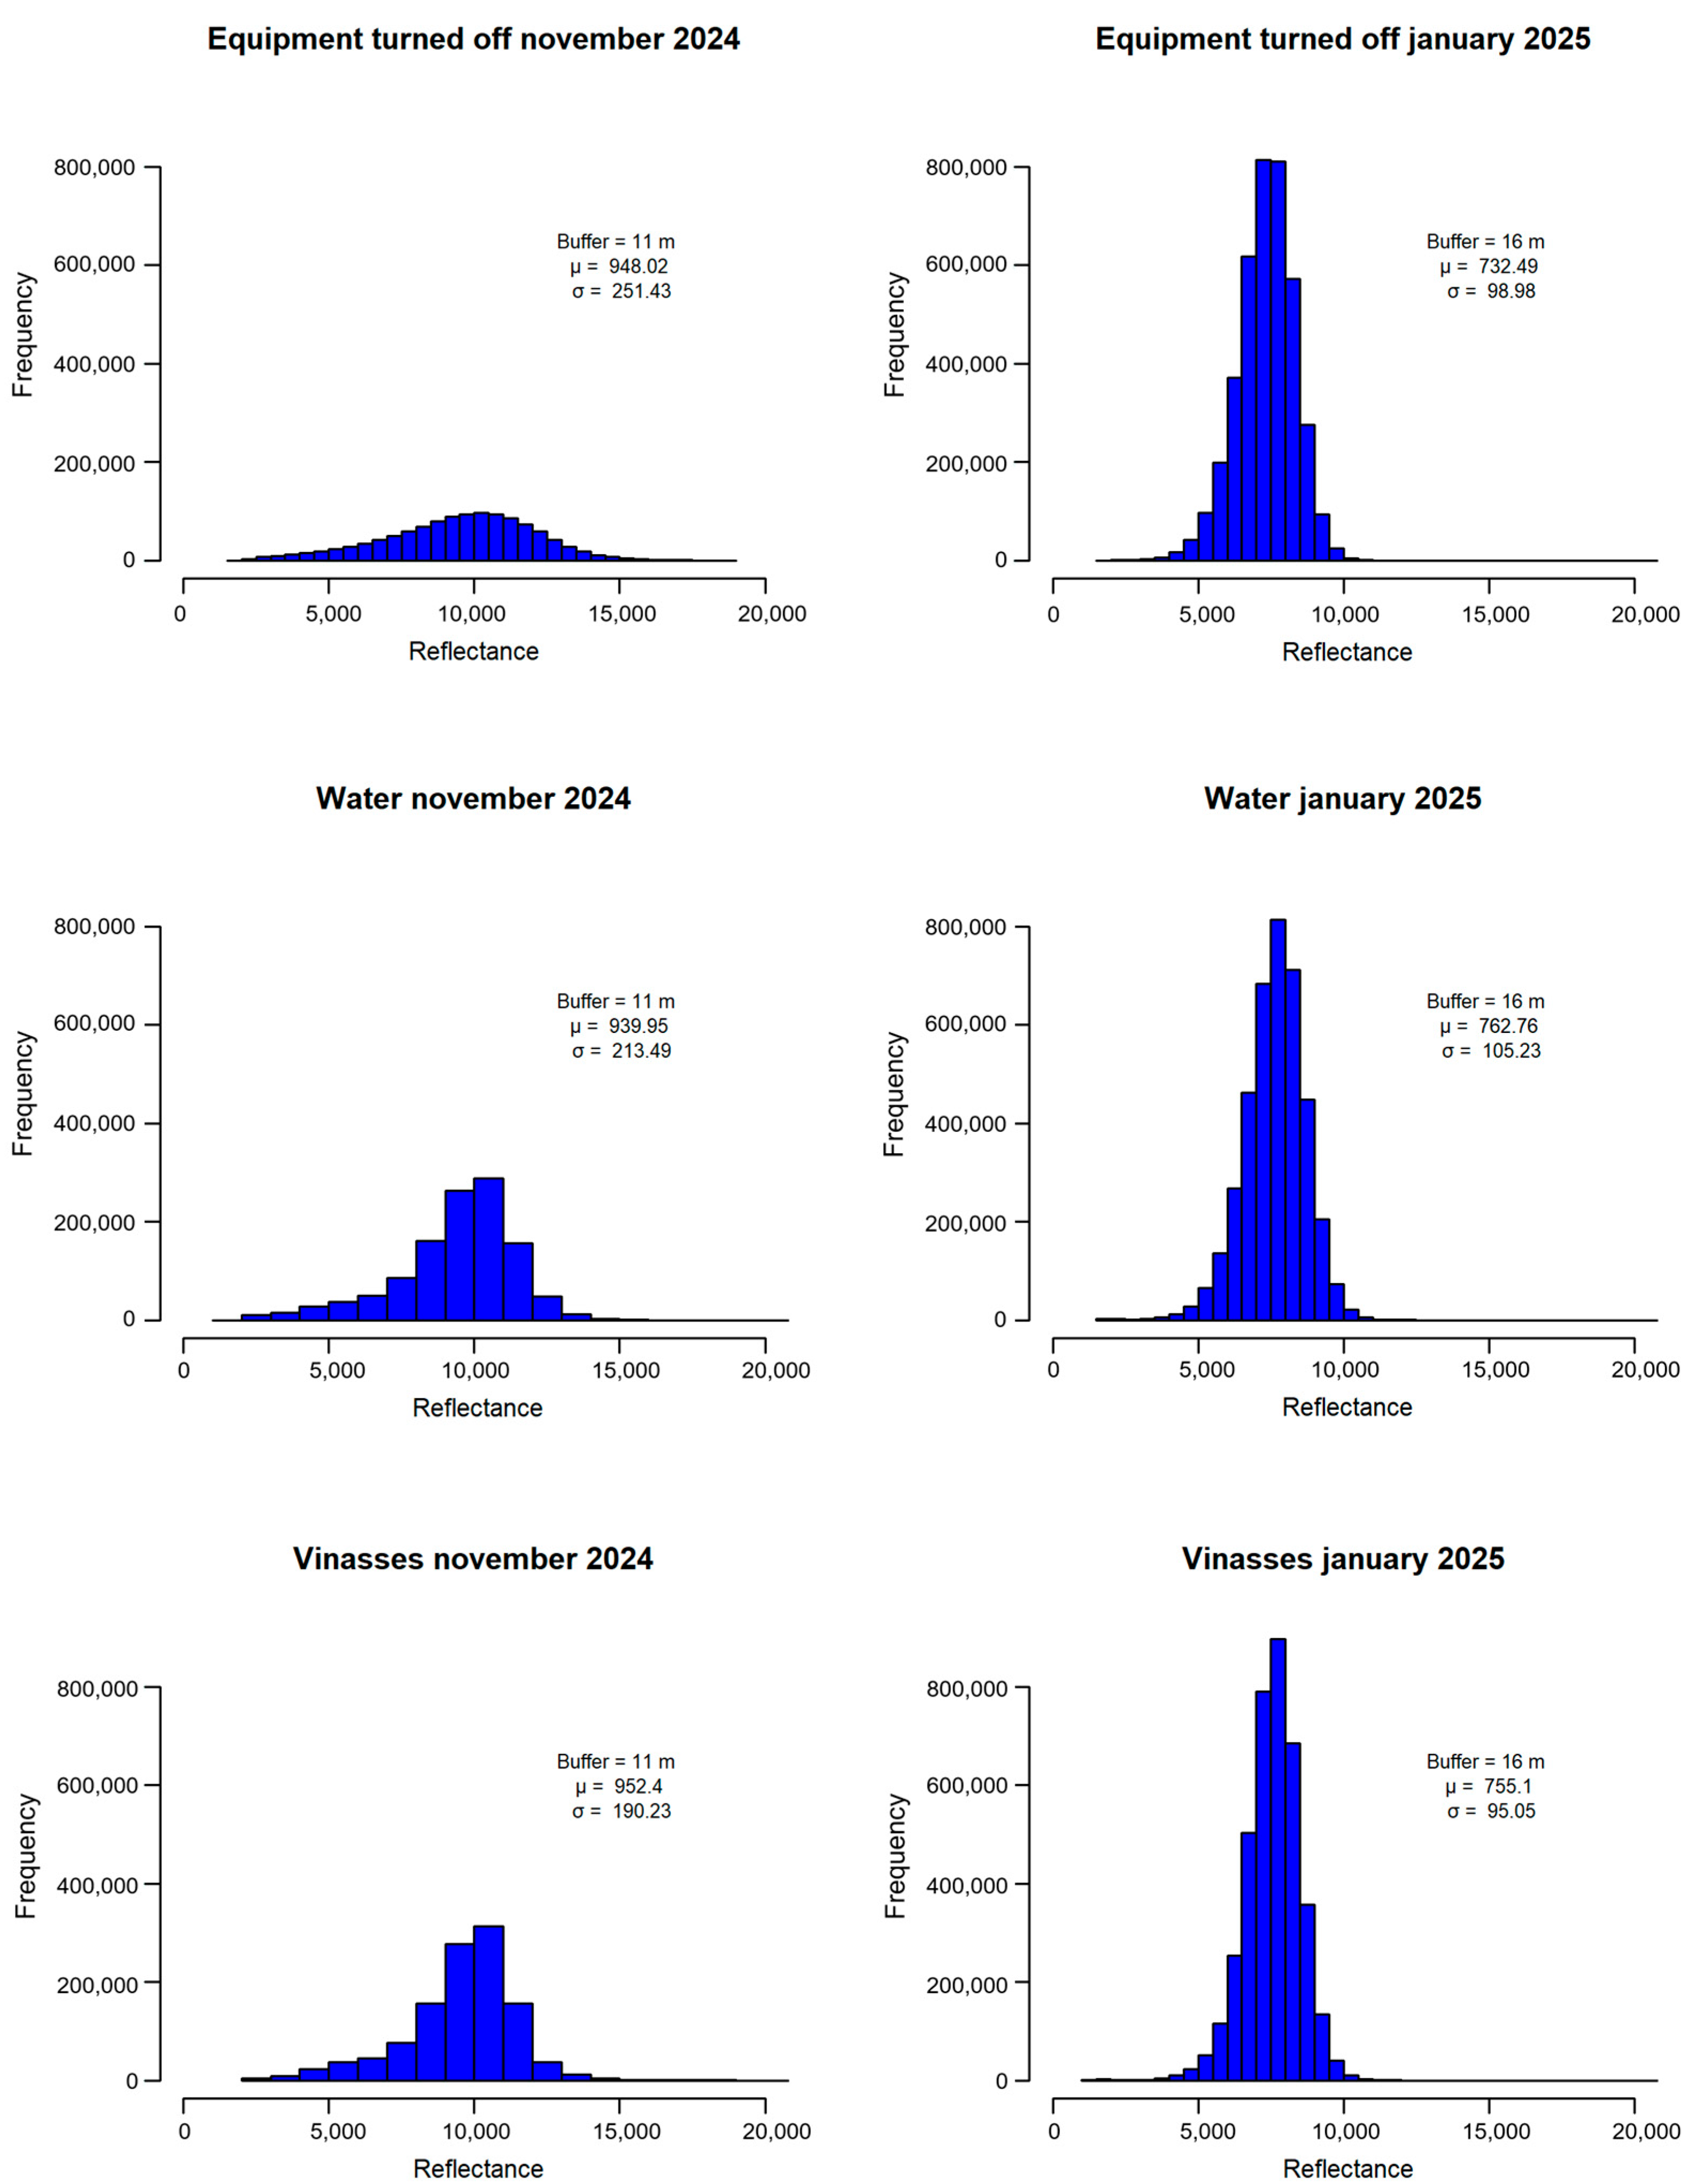
Figure 7.
Reflectance behavior in the NIR band during the monitoring campaigns.
The red band (Figure 5) reveals a difference in reflectance between conditions when the equipment was turned off or on. Reflectance refers to the amount of light an object, in this case, water droplets, reflects. For vinasses, melanoidins can be detected in this region due to their chemical structure, which includes aromatic rings and conjugated double bonds. These brown pigments are responsible for the color of the vinasse formed during fermentation. The Z-test results (Table 3) validated the significant differences between the reflectance responses of purified water and tequila vinasses.
Table 3.
Z-test statistical comparison.
Figure 5 demonstrates that the spectral behavior in the red band was consistent across both campaigns. The mean reflectance of both potable water and tequila vinasses droplets was higher than that observed for the study area in both monitoring campaigns. This result demonstrates the instrument’s ability to detect the dispersed droplets emitted by the experimental equipment. The higher frequency observed in the second campaign resulted from a larger buffer zone (16 m) compared to that in the first campaign (11 m), leading to a greater number of pixels analyzed.
Figure 6 shows the spectral behavior in the green band for both monitoring campaigns. In this region of the spectrum, the presence of agave plant pigments, such as chlorophyll and anthocyanins, could be identified. Significant variations in the spectral behavior at this wavelength might indicate that the agave juice was in contact with the leaves or skin of the agave plant during the extraction process, which is undesirable. Figure 6 also shows that the droplet histograms for drinking water and tequila vinasses exhibited similar spectral behavior. The reflectance mean values were higher in the second monitoring campaign due to the increased biomass in the study area in comparison with that observed in the first campaign. Therefore, the spectral behavior in the green band was predominantly influenced by the vegetation in the study area.
Figure 7 shows the difference in NIR reflectance behavior when the droplet generation equipment is in use compared to when it is off. In the absence of droplet generation, NIR reflectance is minimal, indicating that the study area does not influence the NIR reflectance. However, when droplets are generated, there is a significant increase in NIR reflectance. This variation may be attributed to the sensitivity of NIR reflectance to sugars or the by-products of sugar degradation during the agave thermal treatment process. However, water also exhibits strong absorption in this spectral region [36]. Figure 7 shows that the reflectance behavior of both drinking water and vinasse was statistically similar.
3.3. Spectral Analysis of Satellite Images
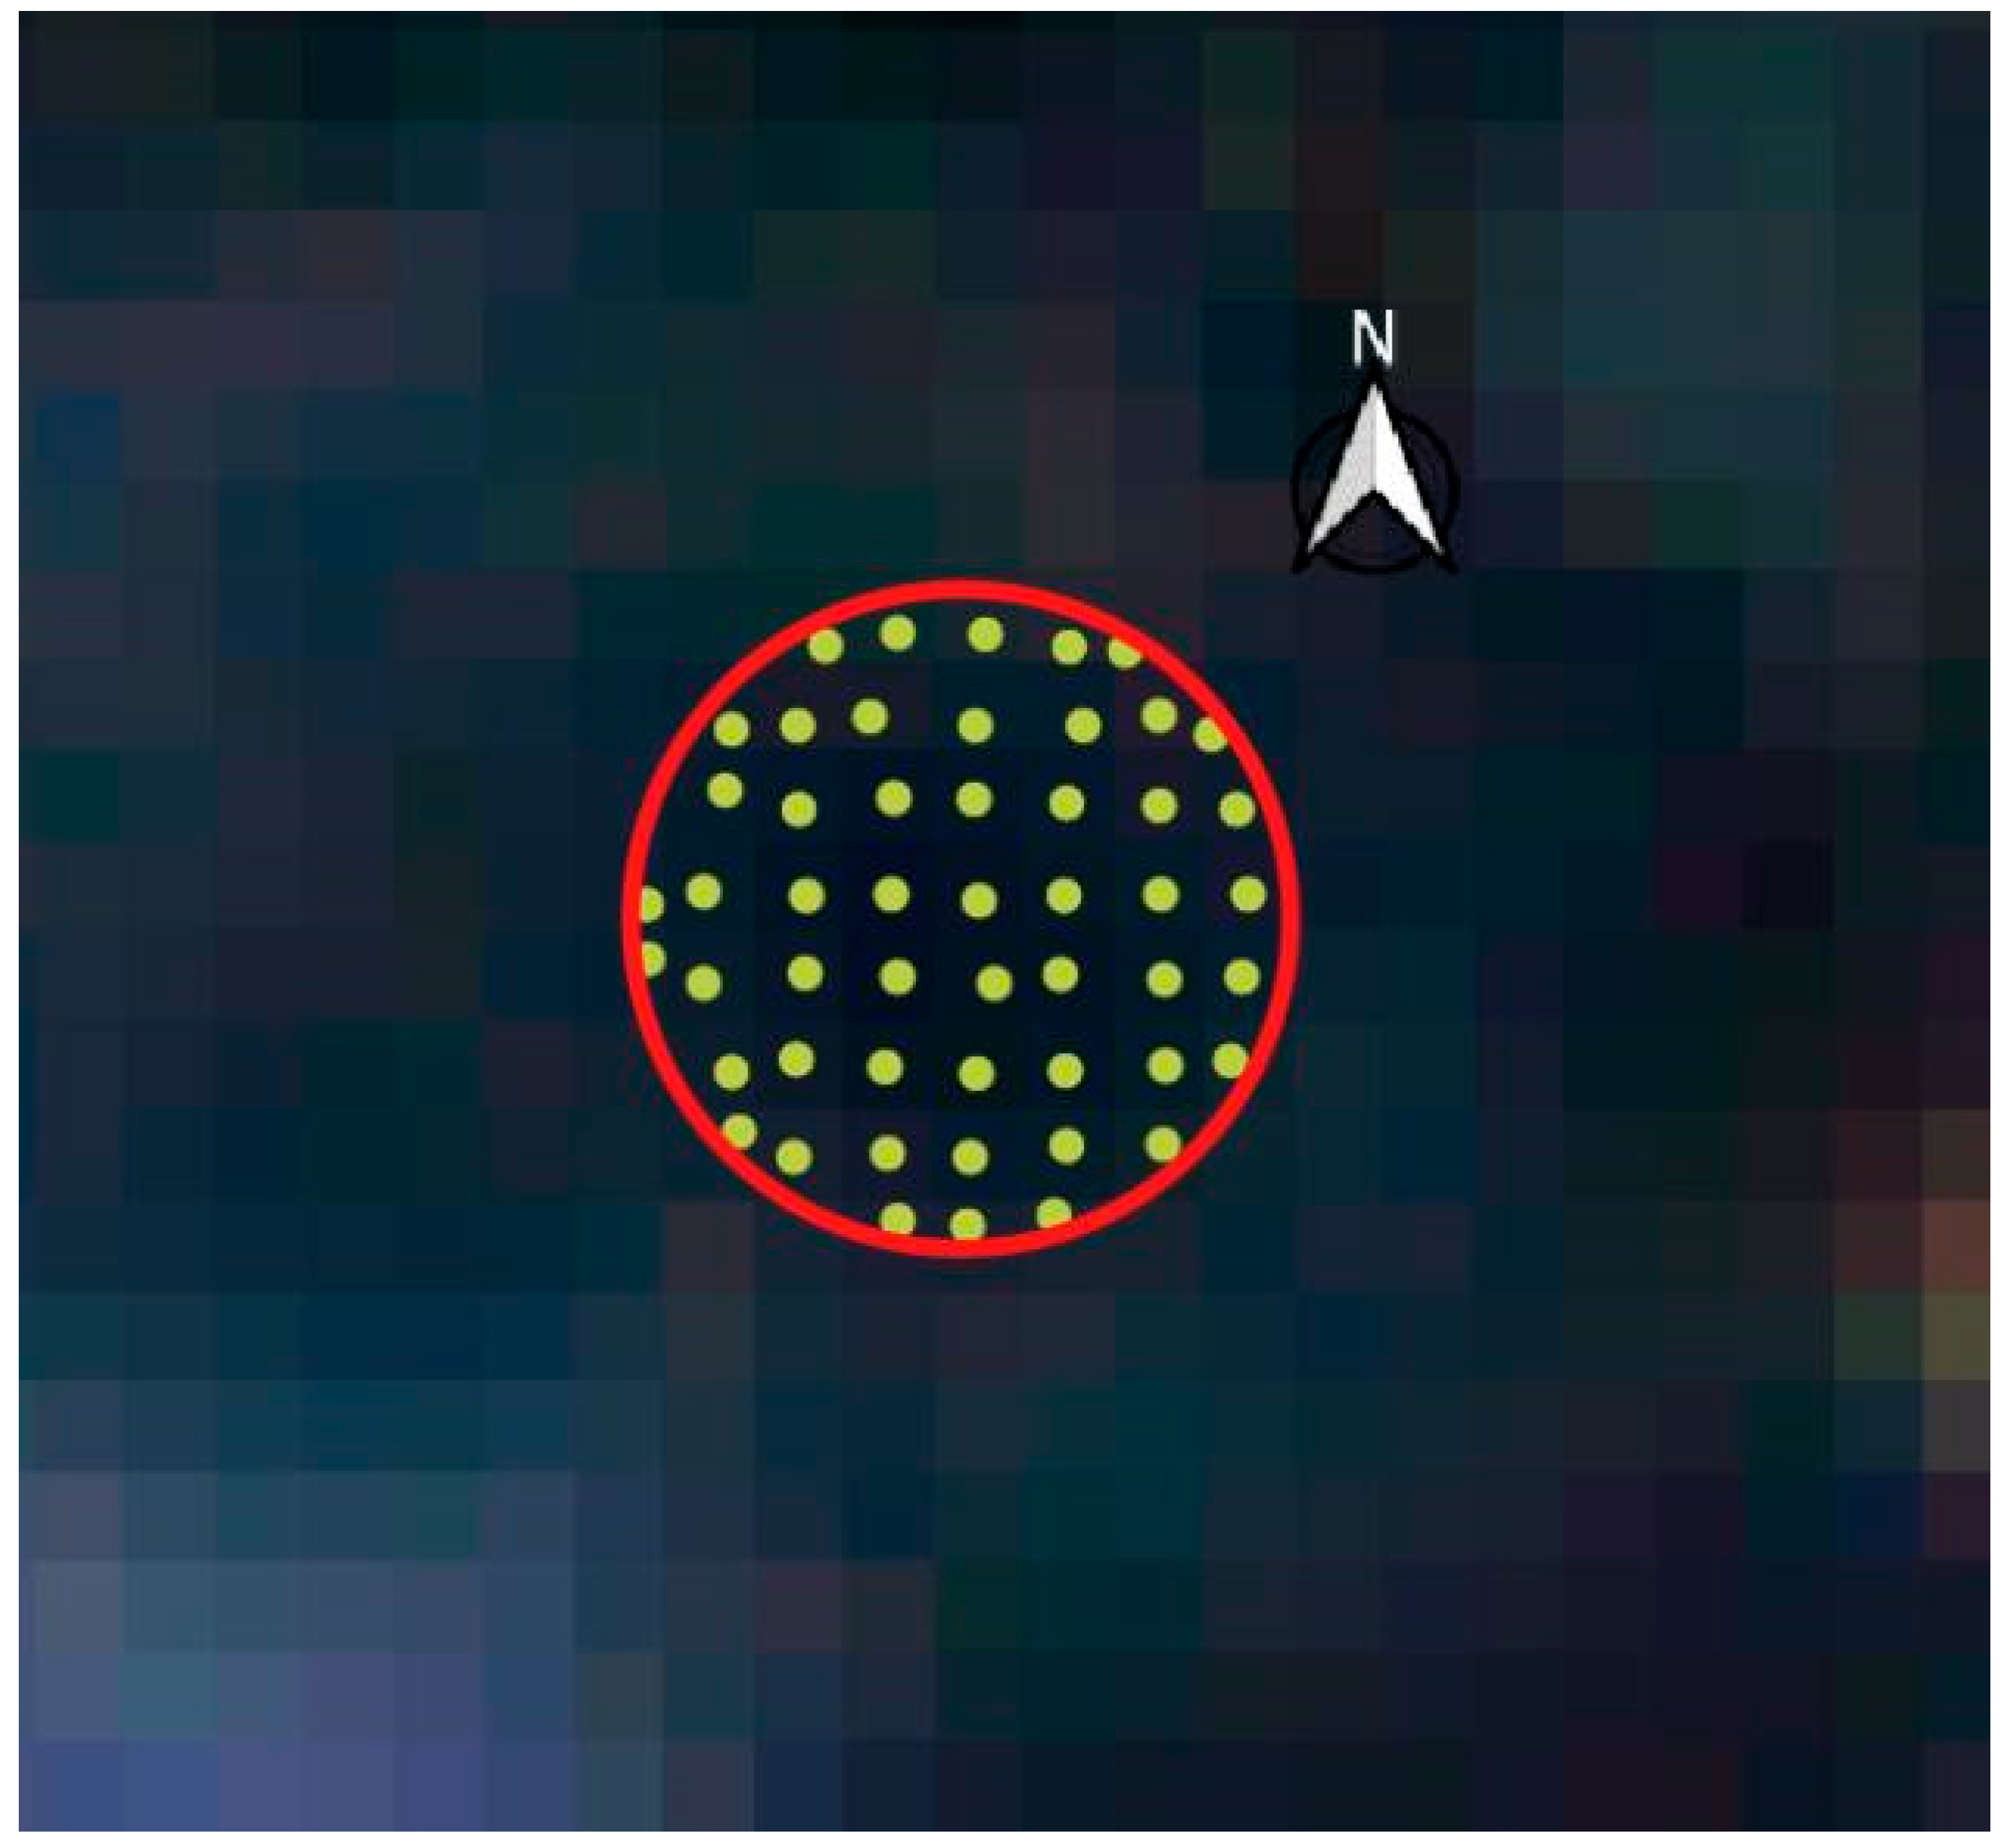
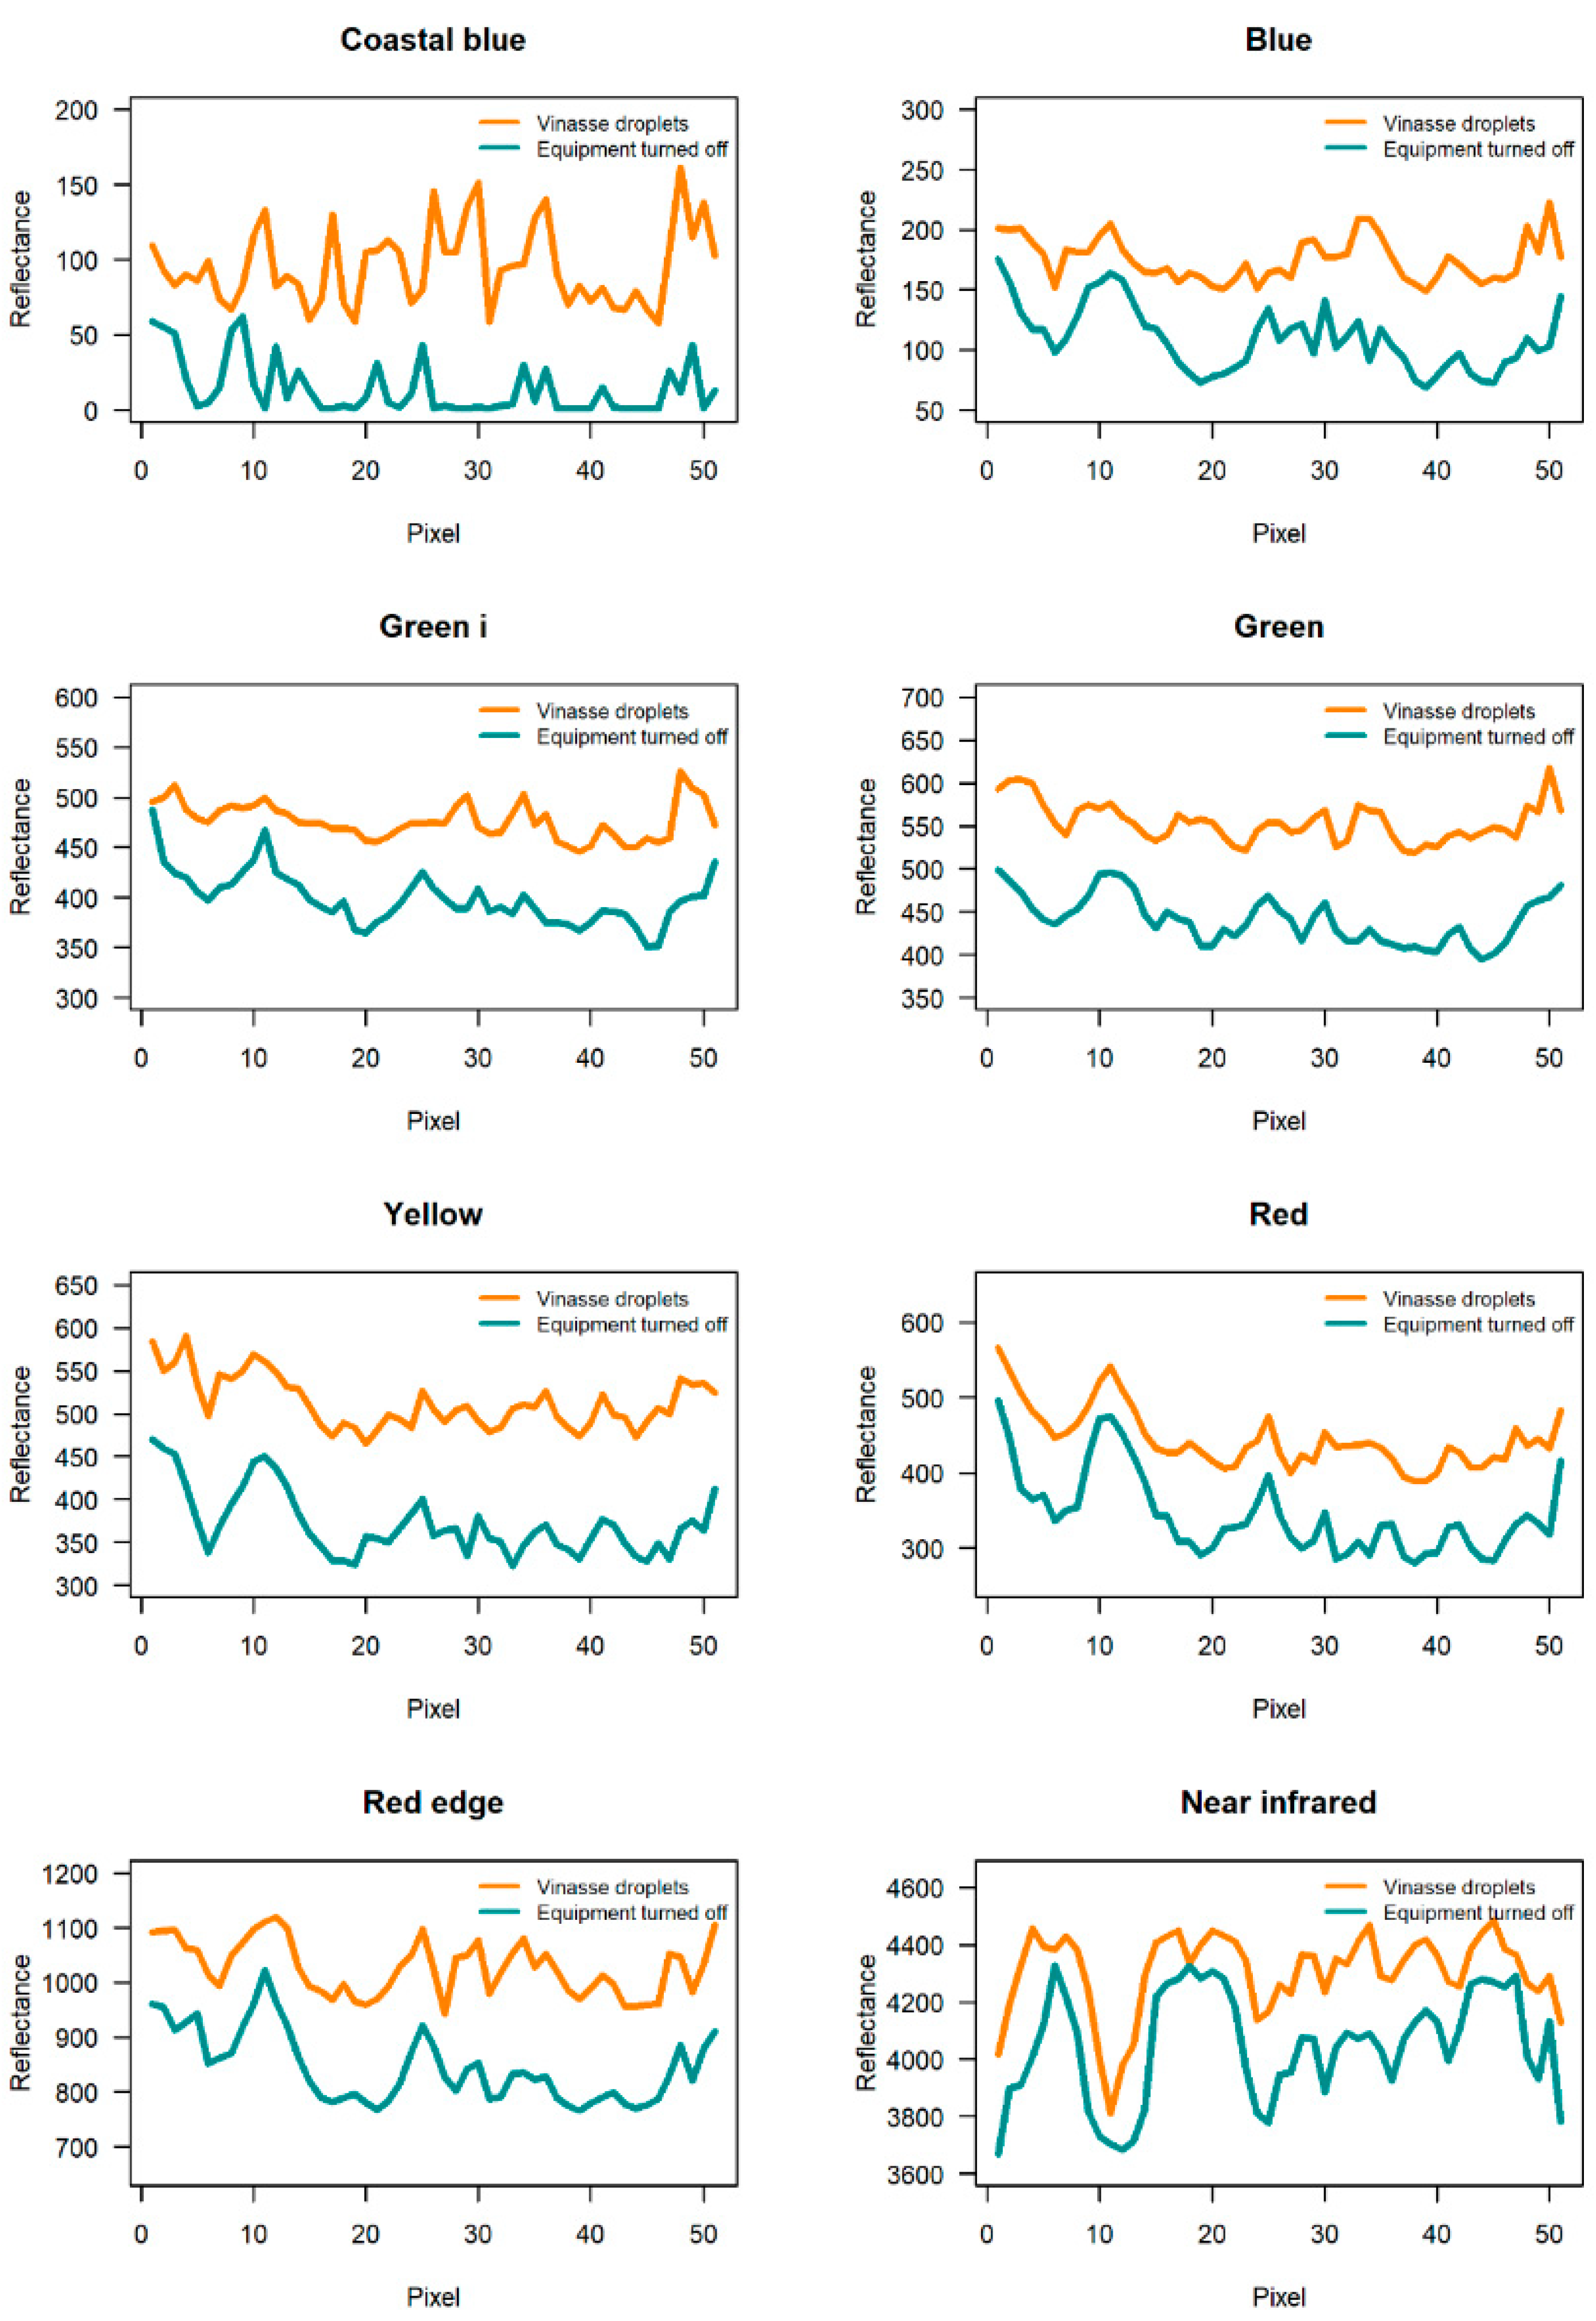
This study was supplemented with a spectral analysis using high-resolution (3.8 m) satellite images from PlanetScope. Figure 8 depicts the droplet influence area in the PlanetScope satellite images. Due to the image resolution, the influence area is represented by only 51 pixels. This limitation, however, is beneficial, as it simplifies geospatial statistical analysis. Figure 9 shows the pixel-by-pixel reflectance behavior within the droplet influence area, confirming the spectral difference between droplets generated from tequila vinasses and the study area in the absence of vinasse droplets. Overall, reflectance values were higher across all pixels and wavelengths when the tequila vinasse droplets were present.
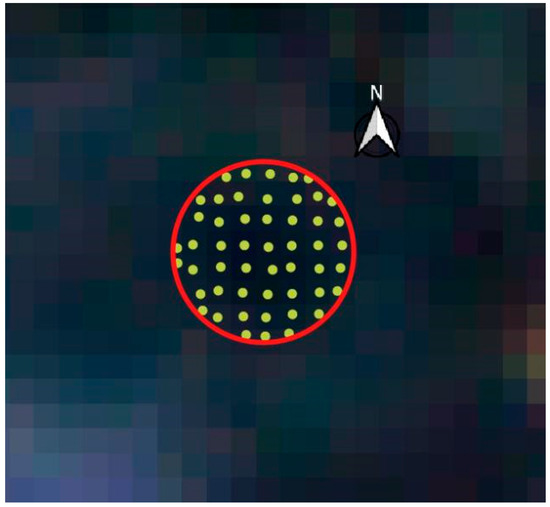
Figure 8.
Pixels within the droplet influence area in the satellite image.

Figure 9.
Pixel-by-pixel comparison of the reflectance observed for the vinasse droplet and the study area using satellite images.
The coastal blue band example is used to explain the reflectance behavior in Figure 9. When the equipment was off, the reflectance values ranged from 0 to 60, with an average of 14.43. When the equipment was on, the reflectance increased to a range of 50 to 160, with an average reflectance value of 95.59. A similar behavior was observed for the rest of the wavelengths analyzed. The reflectance data observed from satellite images confirm earlier findings, showing increased reflectance for the tequila vinasses across all spectral bands.
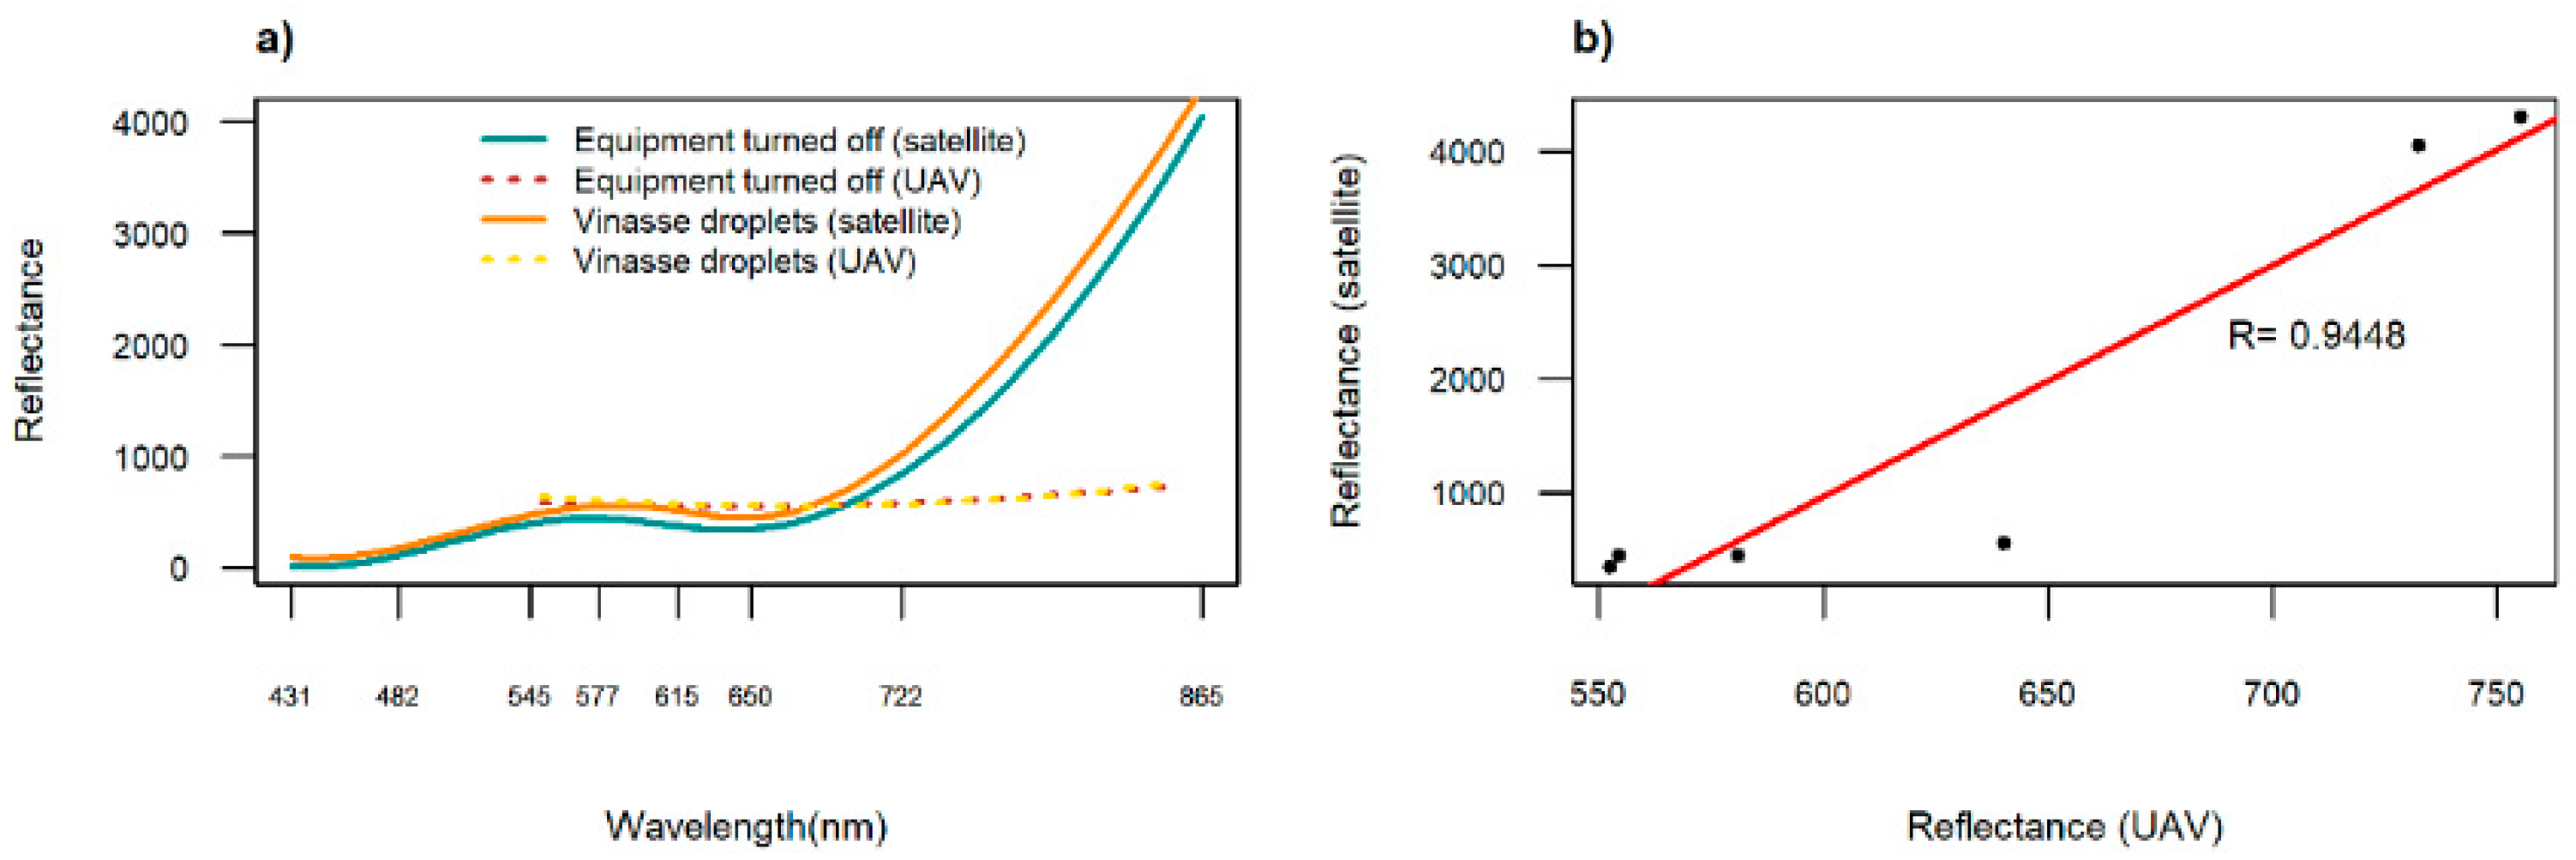
Figure 10 shows the spectral signature of vinasse droplets and the study area when the equipment was turned off. Figure 10a shows similar spectral behavior for both sensors (satellite and UAV), except at NIR wavelengths, where a higher reflectance was registered for the satellite images. The difference in reflectance between the satellite and UAV sensors at NIR wavelengths could be due to atmospheric effects. The satellite sensor operates at a much higher altitude than does the UAV. This means that the signal travels through a significantly thicker layer of atmosphere. Atmospheric scattering and absorption are wave-length-dependent, and NIR wavelengths are particularly susceptible to these effects. The atmosphere might scatter more NIR light towards the satellite sensor, resulting in higher reflectance readings compared to those obtained via the UAV’s closer perspective.

Figure 10.
Comparison of spectral signatures for vinasse droplets and the study area. (a) Spectral signature of vinasse droplets and the study area (evaporation equipment turned off). (b) Pearson correlation between satellite and UAV measurements.
In addition, Figure 10a shows a higher reflectance of vinasse droplets in both sensors. Refraction occurs when light changes direction, influenced by the refractive index of materials, which is related to their chemical composition. Tequila vinasse, due to its organic compounds, has a different refractive index than do air, soil and/or vegetation, causing light refraction and increased reflectance [37]. Finally, Figure 10b shows the Pearson correlation between the reflectance measured by both sensors throughout the wavelengths. According to this figure, satellite images can also be used to identify the dispersion of tequila vinasse droplets.
4. Conclusions
This study evaluated a novel evaporation system for the management of tequila vinasse, analyzing the droplets generated through multispectral and thermal imagery captured by unmanned aerial vehicles (UAVs) and the PlanetScope satellite. The experiments were carried out using potable water and tequila vinasses during two monitoring campaigns and demonstrated that the vinasse droplets display a limited influence area (an 11 to 16 m radius from emission), determined mainly by wind speed. This influence area was clearly identified using the thermal camera mounted on the UAV, which detected a plume showing a bimodal temperature distribution against the background.
The multispectral camera also successfully monitored the dispersion of the tequila vinasse droplets released into the atmosphere, distinguishing them by their unique spectral signature, which was noticeably different from the surrounding area’s spectral signature. Satellite data showed that the average reflectance in the coastal blue band increased from 14.43 (background) to 95.59 (vinasse droplets), with a similar increases across other bands. Furthermore, a strong positive Pearson correlation (R > 0.85) was found between the spectral signatures captured by the UAV and the satellite sensors, validating the use of both platforms for monitoring the dispersion of the organic compounds. The spectral signatures of potable water and tequila vinasse droplets suggest that the low concentration of these compounds limited the instruments’ ability to accurately identify and quantify them. Therefore, these findings establish a crucial remote sensing framework for the operational management of this evaporation technology, enabling the assessment of evaporation rates and the tracking of the droplet plume to mitigate potential off-site impacts when wind carries droplets outside the target area.
5. Future Work
Based on the findings of this study, future research is recommended to further enhance the understanding and application of this technology. First, the use of hyperspectral sensors with higher spectral resolution could enable a more precise identification and quantification of the specific organic compounds within the vinasse droplets. Second, conducting experiments under a wider range of meteorological conditions, such as with higher wind speeds and varying humidity levels, would allow for the development of more robust dispersion models. Third, integrating in situ air quality sensors into the UAV to measure particulate matter and volatile organic compounds directly within the plume would provide crucial data for a comprehensive environmental impact assessment. Finally, long-term monitoring is necessary to evaluate potential cumulative impacts on soil and vegetation within the identified influence zone and to assess the seasonal variability of the system’s performance.
Author Contributions
Conceptualization, J.G.R.-P., S.A.M.-A., O.C.-M. and J.d.A.; methodology, J.G.R.-P., S.A.M.-A. and O.C.-M.; software, S.A.M.-A. and O.C.-M.; validation, J.G.R.-P., S.A.M.-A. and O.C.-M.; formal analysis, J.G.R.-P., S.A.M.-A. and J.d.A.; investigation, J.G.R.-P., S.A.M.-A., O.C.-M. and J.d.A.; resources, J.d.A.; data curation, J.G.R.-P., S.A.M.-A. and O.C.-M.; writing—original draft preparation, J.G.R.-P., S.A.M.-A. and O.C.-M.; writing—review and editing, J.G.R.-P. and J.d.A.; visualization, J.G.R.-P., S.A.M.-A. and O.C.-M.; supervision, J.G.R.-P., S.A.M.-A. and J.d.A.; project administration, J.G.R.-P. and J.d.A.; funding acquisition, J.d.A. All authors have read and agreed to the published version of the manuscript.
Funding
This work was funded by BioDAF Water Technology and Casa San Matias Tequila enterprises.
Data Availability Statement
The data that support the findings of this study are available from the corresponding author [J.G.R.-P.], upon reasonable request.
Acknowledgments
The authors express their gratitude to the Secretaría de Ciencia, Humanidades, Tecnología e Innovación (SECIHTI) for supporting this research through SNII grants. We also acknowledge Kevin King and Evaporation King, owners of the droplet evaporation technology under U.S. Patent Application No. 19/070,320.
Conflicts of Interest
The authors declare no conflicts of interest. The funders had no role in the study design, in the collection, analyses, or interpretation of data; or in the writing of the manuscript.
Abbreviations
The following abbreviations are used in this manuscript:
| UAV | Unmanned Aerial Vehicle |
| VOCs | Volatile Organic Compounds |
| VIS/NIR | Visible and Near-Infrared |
| TIR | Thermal infrared |
| DEM | Digital Elevation Model |
| NIR | Near Infrared |
References
- Hobbs, C.E. The Chemistry of Tequila. In Chemistry of Alcoholic Beverages; Flynn, N., Ed.; ACS Symposium Series: Washington, DC, USA, 2023; Volume 1455, pp. 37–61. [Google Scholar] [CrossRef]
- Ramírez-Ramírez, A.A.; Lozano-Álvarez, J.A.; Gutiérrez-Lomelí, M.; Zurita, F. Tequila Vinasse Treatment in Two Types of Vertical Downflow Treatment Wetlands (with Emergent Vegetation and Ligninolytic Fungi). Water 2024, 16, 1778. [Google Scholar] [CrossRef]
- Contreras-Ramos, S.M.; Owens, X. Thermal Treatment to Obtain 5-Hydroxymethyl Furfural (5-HMF), Furfural and Phenolic Compounds from Vinasse Waste from Agave. Molecules 2023, 28, 1063. [Google Scholar] [CrossRef] [PubMed]
- Rodríguez-Félix, E.; Contreras-Ramos, S.M.; Davila-Vazquez, G.; Rodríguez-Campos, J.; Marino-Marmolejo, E.N. Identification and Quantification of Volatile Compounds Found in Vinasses from Two Different Processes of Tequila Production. Energies 2018, 11, 490. [Google Scholar] [CrossRef]
- López-López, A.; Davila-Vazquez, G.; León-Becerril, E.; Villegas-García, E.; Gallardo-Valdez, J. Tequila vinasses: Generation and full scale treatment processes. Rev. Environ. Sci. Bio/Technol. 2010, 9, 109–116. [Google Scholar] [CrossRef]
- Zurita, F.; Vymazal, J. Opportunities and challenges of using constructed wetlands for the treatment of high-strength distillery effluents: A review. Ecol. Eng. 2023, 196, 107097. [Google Scholar] [CrossRef]
- Arreola-Vargas, J.; Snell-Castro, R.; Rojo-Liera, N.M.; González-Álvarez, V.; Méndez-Acosta, H.O. Effect of the organic loading rate on the performance and microbial populations during the anaerobic treatment of tequila vinasses in a pilot-scale packed bed reactor. J. Chem. Technol. Biotechnol. 2018, 93, 591–599. [Google Scholar] [CrossRef]
- Ojeda-Armaignac, E.; Hing Cortón, R. Tratamiento por electrocoagulación y coagulación–floculación de la vinaza de destilerías. Tecnol. Química 2009, XXIX, 153–161. [Google Scholar]
- Collana, J.T.M.; Ormeño, M.A.; Meza, C.J.; Cuadros, G.M.; Venegas, L.A.C.; Dextre, C.A.A.; Taranco, O.J.R.; Carhuaricra, C.A.; Bravo, P.D.; Pisfil, J.A.M. Processes Coupled to Electrocoagulation for the Treatment of Distillery Wastewaters. Sustainability 2024, 16, 6383. [Google Scholar] [CrossRef]
- Ferral-Pérez, H.; Torres Bustillos, L.G.; Méndez, H.; Rodríguez-Santillan, J.L.; Chairez, I. Sequential Treatment of Tequila Industry Vinasses by Biopolymer-based Coagulation/Flocculation and Catalytic Ozonation. Ozone-Sci. Eng. 2016, 38, 279–290. [Google Scholar] [CrossRef]
- Rodriguez Arreola, A.; Sanchez Tizapa, M.; Zurita, F.; Morán-Lázaro, J.P.; Castañeda Valderrama, R.; Rodríguez-López, J.L.; Carreon-Alvarez, A. Treatment of tequila vinasse and elimination of phenol by coagulation–flocculation process coupled with heterogeneous photocatalysis using titanium dioxide nanoparticles. Environ. Technol. 2020, 41, 1023–1033. [Google Scholar] [CrossRef]
- Zurita, F.; Tejeda, A.; Montoya, A.; Carrillo, I.; Sulbarán-Rangel, B.; Carreón-Álvarez, A. Generation of Tequila Vinasses, Characterization, Current Disposal Practices and Study Cases of Disposal Methods. Water 2022, 14, 1395. [Google Scholar] [CrossRef]
- Ramos-Reyes, M.F.; González-López, M.E.; Barajas-Álvarez, P.; Garcia-Garcia, C.E.; Tuesta-Popolizio, D.A.; Mussatto, S.I.; Gradilla-Hernández, M.S. Exploring the Potential of Distillery Vinasses through Upcycling: Pathways to a Circular Economy. Environ. Technol. Innov. 2025, 38, 104072. [Google Scholar] [CrossRef]
- Günay, A.A.; Kim, M.K.; Yan, X.; Miljkovic, N.; Sett, S. Droplet evaporation dynamics on microstructured biphilic, hydrophobic, and smooth surfaces. Exp. Fluids 2021, 62, 1–14. [Google Scholar] [CrossRef]
- Tan, H.; Diddens, C.; Lv, P.; Kuerten, J.G.; Zhang, X.; Lohse, D. Evaporation-triggered microdroplet nucleation and the four life phases of an evaporating Ouzo drop. Proc. Natl. Acad. Sci. USA 2016, 113, 8642–8647. [Google Scholar] [CrossRef] [PubMed]
- Druetta, P.; Aguirre, P.; Mussati, S. Minimizing the total cost of multi effect evaporation systems for seawater desalination. Desalination 2014, 344, 431–445. [Google Scholar] [CrossRef]
- Mabrouk, A.A.; Nafey, A.S.; Fath, H.E.S. Thermoeconomic analysis of some existing desalination processes. Desalination 2007, 205, 354–373. [Google Scholar] [CrossRef]
- Chen, Q.; Thu, K.; Bui, T.D.; Li, Y.; Ng, K.C.; Chua, K.J. Development of a model for spray evaporation based on droplet analysis. Desalination 2016, 399, 69–77. [Google Scholar] [CrossRef]
- Shihong, T.; Ravindra, A.; Shaohua, J.; Jinhui, P.; Lihua, Z.; Lei, G.; Ling, L.X. Flash evaporation intensified by microwave energy and performance analysis. Appl. Therm. Eng. 2020, 165, 114471. [Google Scholar] [CrossRef]
- Zhou, L.; Liang, Z.; Qin, Y.M.; Chan, C.K. Evaporation-Induced Transformations in Volatile Chemical Product-Derived Secondary Organic Aerosols: Browning Effects and Alterations in Oxidative Reactivity. Environ. Sci. Technol. 2024, 58, 10881–11204. [Google Scholar] [CrossRef]
- Li, Z.; Chen, H.; Zhan, L.; Zheng, S.; Wu, H.; Yang, L. Review of Migration, Transformation, and Control of Volatile Components during Desulfurization Wastewater Evaporation: Advances and Perspectives. Energy Fuels 2023, 37, 15248–15266. [Google Scholar] [CrossRef]
- Gregson, F.K.A.; Sheikh, S.; Archer, J.; Symons, H.E.; Walker, J.S.; Haddrell, A.E.; Orton, C.M.; Hamilton, F.W.; Brown, J.M.; Bzdek, B.R.; et al. Analytical challenges when sampling and characterising exhaled aerosol. Aerosol Sci. Technol. 2022, 56, 160–175. [Google Scholar] [CrossRef]
- Guo, B. Enriching absorption features for hyperspectral materials identification. Opt. Express 2020, 28, 4127–4144. [Google Scholar] [CrossRef]
- Chandramohan, A.; Weibel, J.A.; Garimella, S.V. Spatiotemporal infrared measurement of interface temperatures during water droplet evaporation on a nonwetting substrate. Appl. Phys. Lett. 2017, 110, 041605. [Google Scholar] [CrossRef]
- Knight, M.F.; Knight, C. System and Method for Wastewater Vaporization. 2016. Available online: https://www.freepatentsonline.com/y2016/0376167.html (accessed on 4 March 2025).
- Shiner, S.M.; Hanebuth, C. Containerized System and Method for Spray Evaporation of Water. 2016. Available online: https://patents.google.com/patent/US20160362307A1/ja (accessed on 4 March 2025).
- Mcbride, W. Solar-Powered Buoyant Evaporation System. 2020. Available online: https://patents.justia.com/patent/11834349 (accessed on 4 March 2025).
- MAPIR, Inc. Mapir Survey3 Datasheet. Available online: https://www.mapir.camera/en-gb/pages/survey3-cameras (accessed on 1 July 2025).
- FLIR Systems, Inc. FLIR Vue Pro and Vue Pro R User Guide. Available online: https://www.termocam.it/pdf/termocamere/flir-vue-pro/flir-vue-pro-manuale.pdf (accessed on 1 July 2025).
- Chávez-Martínez, O.; Monjardin-Armenta, S.A.; Rangel-Peraza, J.G.; Sanhouse-García, A.J.; Mora-Felix, Z.D.; Plata-Rocha, W. Use of different vegetation indices for the evaluation of the kinetics of the cherry tomato (Solanum lycopersicum var. cerasiforme) growth based on multispectral images by UAV. Open Agric. 2024, 9, 20220357. [Google Scholar] [CrossRef]
- Sagan, V.; Maimaitijiang, M.; Sidike, P.; Eblimit, K.; Peterson, K.T.; Hartling, S.; Esposito, F.; Khanal, K.; Newcomb, M.; Pauli, D.; et al. UAV-Based High Resolution Thermal Imaging for Vegetation Monitoring, and Plant Phenotyping Using ICI 8640 P, FLIR Vue Pro R 640, and thermoMap Cameras. Remote Sens. 2019, 11, 330. [Google Scholar] [CrossRef]
- Planet Team. Planet Team. Planet Application Program Interface. In Space for Life on Earth; Planet Labs PBC: San Francisco, CA, USA, 2017; Available online: https://api.planet.com (accessed on 4 March 2025).
- Chávez-Martínez, O.; Monjardin-Armenta, S.A.; Rangel-Peraza, J.G.; Mora-Felix, Z.D.; Sanhouse-García, A.J. Dataset of aerial photographs acquired with UAV using a multispectral (green, red and near-infrared) camera for cherry tomato (Solanum lycopersicum var. cerasiforme) monitoring. Data Brief 2025, 58, 111256. [Google Scholar] [CrossRef]
- Henn, K.A.; Peduzzi, A. Surface Heat Monitoring with High-Resolution UAV Thermal Imaging: Assessing Accuracy and Applications in Urban Environments. Remote Sens 2024, 16, 930. [Google Scholar] [CrossRef]
- Yeom, J.; Jung, J.; Chang, A.; Ashapure, A.; Maeda, M.; Maeda, A.; Landivar, J. Comparison of Vegetation Indices Derived from UAV Data for Differentiation of Tillage Effects in Agriculture. Remote Sens. 2019, 11, 1548. [Google Scholar] [CrossRef]
- Lee, Y.; Han, S.H. Feasibility of nondestructive sugar content analysis of Korean pears by using near-infrared diffuse-reflectance spectroscopy. Bull. Korean Chem. Soc. 2016, 37, 166–173. [Google Scholar] [CrossRef]
- Loaiza, J.G.; Rangel-Peraza, J.G.; Monjardín-Armenta, S.A.; Bustos-Terrones, Y.A.; Bandala, E.R.; Sanhouse-García, A.J.; Rentería-Guevara, S.A. Surface Water Quality Assessment through Remote Sensing Based on the Box–Cox Transformation and Linear Regression. Water 2023, 15, 2606. [Google Scholar] [CrossRef]

Disclaimer/Publisher’s Note: The statements, opinions and data contained in all publications are solely those of the individual author(s) and contributor(s) and not of MDPI and/or the editor(s). MDPI and/or the editor(s) disclaim responsibility for any injury to people or property resulting from any ideas, methods, instructions or products referred to in the content. |
© 2025 by the authors. Licensee MDPI, Basel, Switzerland. This article is an open access article distributed under the terms and conditions of the Creative Commons Attribution (CC BY) license (https://creativecommons.org/licenses/by/4.0/).