Article

Acoustic Characterization of Leakage in Buried Natural Gas Pipelines

1
PipeChina Institute of Science and Technology, Tianjin 300457, China
2
College of Mechanical and Transportation Engineering, China University of Petroleum, Beijing 102249, China
3
Wuhan Marine Machinery Plant Co., Ltd., Wuhan 430084, China
*
Author to whom correspondence should be addressed.
Processes 2025, 13(7), 2274; https://doi.org/10.3390/pr13072274
Submission received: 9 June 2025 / Revised: 7 July 2025 / Accepted: 11 July 2025 / Published: 17 July 2025
(This article belongs to the Special Issue Design, Inspection and Repair of Oil and Gas Pipelines)

Abstract

To address the difficulty of locating small-hole leaks in buried natural gas pipelines, this study conducted a comprehensive theoretical and numerical analysis of the acoustic characteristics associated with such leakage events. A coupled flow–acoustic simulation framework was developed, integrating gas compressibility via the realizable k-ε and Large Eddy Simulation (LES) turbulence models, the Peng–Robinson equation of state, a broadband noise source model, and the Ffowcs Williams–Hawkings (FW-H) acoustic analogy. The effects of pipeline operating pressure (2–10 MPa), leakage hole diameter (1–6 mm), soil type (sandy, loam, and clay), and leakage orientation on the flow field, acoustic source behavior, and sound field distribution were systematically investigated. The results indicate that the leakage hole size and soil medium exert significant influence on both flow dynamics and acoustic propagation, while the pipeline pressure mainly affects the strength of the acoustic source. The leakage direction was found to have only a minor impact on the overall results. The leakage noise is primarily composed of dipole sources arising from gas–solid interactions and quadrupole sources generated by turbulent flow, with the frequency spectrum concentrated in the low-frequency range of 0–500 Hz. This research elucidates the acoustic characteristics of pipeline leakage under various conditions and provides a theoretical foundation for optimal sensor deployment and accurate localization in buried pipeline leak detection systems.

1. Introduction

Natural gas is an important component of the global energy consumption mix [1] and makes a significant contribution to the transition toward a low-carbon economy [2]. In recent years, worldwide natural gas consumption has grown rapidly, establishing it as a preferred energy source [3]. The continuing shift of global energy demand toward natural gas has fueled a global surge in pipeline construction activity [4,5]. As of early 2023, 86% of all pipelines planned or under construction carried natural gas [6], placing unprecedented demands on pipeline transport safety [4]. According to incident reports from the European Gas Pipeline Incident Data Group (EGIG), gas pipeline leaks are classified as pinholes, holes, or ruptures. Pinhole leaks, with effective orifice diameters ≤ 20 mm, are the most common form of leakage in gas pipelines [5]. In practice, the subsurface environment is far more variable and complex than above-ground conditions, making underground leak detection more difficult. Consequently, early leak detection and consequence assessment based solely on flow field analysis cannot deliver the accuracy required for buried pipeline leak detection. Minor leaks in buried natural gas pipelines are difficult to detect using traditional methods, each of which has its own advantages and limitations. For instance, manual surveys using handheld detectors are highly sensitive and are widely used in urban gas distribution systems, yet they are labor-intensive and limited by environmental conditions and coverage speed [7]. Aerial surveillance, though effective for identifying large-scale surface anomalies in rural areas, often fails to capture small, subsurface gas releases [8]. More advanced methods, such as vehicle-mounted or drone-based methane sensors, offer enhanced sensitivity and efficiency but are constrained by high operational costs and a reliance on favorable weather and terrain conditions [9]. Acoustic and fiber-optic sensing technologies provide continuous monitoring and higher spatial accuracy, but their deployment is typically limited to high-priority pipeline segments due to their installation complexity and cost [10,11]. Internal detection methods, including mass balance and real-time pressure monitoring, offer useful system-level insights but lack the resolution needed to pinpoint low-rate leaks [12]. These limitations highlight the urgent need for integrated, multi-modal leak detection strategies that combine the strengths of various techniques to ensure accurate, timely, and cost-effective identification of minor leaks in buried natural gas pipelines. Acoustic detection, however, is currently the most widely adopted technique, offering high sensitivity, a long detection range, low false-alarm rates, rapid response, and excellent real-time capability [13,14]. For this reason, the acoustic characteristics of buried pipeline leaks are attracting growing research interest.
International research on natural gas pipeline leakage, particularly in theoretical modeling and detection technologies, began earlier and has produced substantial work in the field of acoustic detection [15]. While external leakage detection technologies in China have largely caught up with those in developed countries, notable gaps remain in areas such as defect localization accuracy, data utilization efficiency [16], and the practical application of results to guide large-scale maintenance [17]. These gaps stem from the later large-scale construction of natural gas pipelines in China, an insufficient theoretical foundation for pipeline leakage studies [18,19], and a lack of comprehensive theoretical and data support for acoustic leak detection technologies. As a result, the technology is not yet fully mature, and the necessary equipment has not entered mass production or widespread field trials. Recent studies have utilized Computational Fluid Dynamics (CFD) to simulate high-pressure natural gas leaks from buried pipelines, revealing key insights into gas’s migration through soil and dispersion into the atmosphere. These simulations often model the soil as a porous medium and employ transient 3D RANS approaches using tools like ANSYS Fluent 2020R2. Zhang [20] validated their model with experiments, showing that shallower burial depths lead to faster gas breakthrough and higher surface concentrations. Bagheri and Sari [21] developed soil-classified empirical models to estimate leak rates under various conditions. Yue [22] highlighted how proximity to confined underground spaces can significantly increase explosion risks, proposing safety distance thresholds. Overall, these CFD-based studies provide essential guidance for leak detection, risk assessment, and emergency planning in pipeline safety management. Studies on the acoustic characteristics of gas leaking into soil are scarce, most existing computational models employ limited domains, leak orifices are comparatively large, and some investigations even treat natural gas as an incompressible fluid [23]. To construct a model that better reflects the engineering reality and yields more reliable simulation results, this work establishes a 10 m × 10 m × 10 m physical domain and fully accounts for gas’s compressibility during leakage. This study presents a theoretical investigation of leakage in buried natural gas pipelines from both flow field and acoustic field perspectives. Compressible flow governing equations and their acoustic analogy counterparts were developed to model the leakage process. Numerical simulations and analysis were carried out to examine how the pipeline pressure, leakage hole diameter, soil medium, and leakage direction affect the flow field dynamics, acoustic source behavior, and resulting sound field characteristics.

2. Simulation Methods

Following a pipeline leakage event, the flow field undergoes dynamic changes, which, in turn, give rise to evolving acoustic sources. Once the leakage flow stabilizes, the acoustic source likewise reaches a steady state and enters a continuous emission regime [24,25,26,27,28]. Accordingly, this study first simulated the flow field until a steady state was achieved; the resulting flow field was then analyzed to determine the acoustic source characteristics. Finally, the steady-state solution was adopted as the initial condition for a time-domain simulation of sound propagation within the computational domain, yielding the spatial distribution of the acoustic field.
Research on buried natural gas pipeline leakage is inherently interdisciplinary, spanning safety engineering, fluid dynamics, aeroacoustics, and computational modeling. Compared with leakage in open air, leakage within soil environments introduces additional physical complexity. The flow and sound fields in such scenarios are highly intricate, making them difficult to resolve through purely analytical approaches. With continuous advancements in numerical methods and the increasing maturity of simulation software, it is now possible to obtain reliable distributions of the flow and sound fields in buried pipeline leakage through theoretical analysis combined with numerical simulation. This study first conducts theoretical analysis of the flow and acoustic fields associated with buried pipeline leakage, and then it establishes a set of governing equations for compressible real gas flow, laying a solid foundation for subsequent investigations.

2.1. Computational Domain and Boundary Conditions

Based on typical pipeline dimensions reported in engineering practice, a pipeline with an outer diameter of 711 mm was selected. Leak orifice diameters of 1 mm, 2 mm, 3 mm, 4 mm, 5 mm, and 6 mm were considered. The pipe length was set to 10 m, the burial depth to 1.5 m, and the wall thickness to 10 mm. The entire computational domain measured 10 m × 10 m × 10 m. A 3D physical model was established, as illustrated in Figure 1.
The model consists of three regions: the internal pipeline fluid, the fluid in the leakage hole area, and the surrounding soil fluid region. The soil is assumed to be an isotropic and homogeneous porous medium, with the physical properties detailed in Table 1. The leakage holes are modeled in three orientations: at the top, bottom, and side of the pipeline’s centerline.
To reduce the computational complexity, the following assumptions are made in this study:
(1)
The spatial structure of the soil is assumed to remain unchanged throughout the leakage process. No chemical reactions occur between the leaking gas and the surrounding soil, and the influence of gravity on fluid flow within the porous medium is neglected.
(2)
The soil pores are considered to be filled with air, and the soil moisture content is neglected.
(3)
The natural gas inside the pipeline is modeled as pure methane, based on the fact that methane typically comprises 75–98% of natural gas.
Natural gas flows from left to right in the model, with the applied boundary conditions summarized in Table 2. For compressible flow simulations, the inlet boundary is typically defined as a pressure inlet. Initially, the soil pores are filled with air, and the gas within the pipeline is modeled as pure methane. Consequently, the initial concentration and velocity of natural gas in the soil are both set to zero, and the initial pressure is atmospheric pressure. The fluid within the pipeline is set to the operating pressure of the system. All walls are modeled as adiabatic, with no-slip conditions, and both the inlet and outlet are defined as pressure boundaries.

2.2. Mathematical Model

The leakage from buried natural gas pipelines is governed by the three fundamental equations of fluid mechanics and is described using compressible flow equations. The porous medium is modeled by introducing a momentum source term Si into the standard fluid flow equations. This source term comprises two components: the viscous loss term and the inertial loss term, corresponding to the first and second terms on the right-hand side of Equation (1), respectively. For a simple, homogeneous porous medium, Equation (1) can be simplified to Equation (2):
S i = ( j = 1 3 D i j μ u j + j = 1 3 C i j 1 2 ρ u u j )
S i = ( μ α u i + C 2 1 2 ρ u u j )
In Equations (1) and (2), Si denotes the source term in the i-th momentum equation, where i = x, y, z. The viscous resistance coefficient is 1/ α ; D and C are prescribed matrices; the inertial resistance coefficient is C2; and u represents the velocity magnitude in meters per second.
In turbulent flow conditions, packed beds are modeled using permeability and inertial loss coefficients. Based on semi-empirical correlations that are valid across a wide range of Reynolds numbers and applicable to many types of packing materials [5], the viscous resistance coefficient 1/ α and the inertial resistance coefficient C2 for each component can be represented by Equations (3) and (4), respectively:
1 α = 150 D p 2 ( 1 ε ) 2 ε 3
C 2 = 3.5 D p ( 1 ε ) ε 3
In Equations (3) and (4), P denotes the pressure of the gas mixture, μ is the dynamic viscosity of the gas, ε represents the porosity of the soil, and Dp represents the average particle diameter.
Table 3 summarizes the properties of three typical soil types. To evaluate the influence of different soil media, the corresponding resistance parameters for each soil type, calculated using Equations (3) and (4), are presented in Table 4.
Due to the intermolecular forces present in natural gas and the finite size of gas molecules, the ideal gas law is not directly applicable. While the ideal gas equation provides reasonable accuracy under low-pressure and high-temperature conditions, its reliability diminishes significantly under high-pressure or low-temperature environments. Given that natural gas pipelines typically operate under high pressures, the use of the ideal gas law is unsuitable.
The Peng–Robinson (PR) equation accounts for both intermolecular interactions and the finite molecular volume of gases, offering superior performance in predicting volumetric properties compared to other equations of state. Accordingly, the PR equation (Equation (5)) is adopted in this study as the governing equation of state for the gas.
P = R T V b a ( T ) V ( V + b ) + V ( V b )
In Equation (5), P denotes the gas pressure, V is the molar volume of the gas, T is the temperature (K), R is the universal gas constant, and a and b are empirical constants.

2.2.1. Governing Equations

(1)
Species Transport Model
Leakage from buried natural gas pipelines involves both natural gas and air, which are in the same gaseous phase. As such, the use of a multiphase flow model is inappropriate. Since the leaked gas and ambient air share the same phase and do not exhibit a clearly defined interface but instead form a mixed state, it is therefore suitable to apply the species transport model.
The species transport model is based on component transport equations, which describe the spatial and temporal variation in the concentrations of different species within a fluid. These equations are capable of capturing complex transport phenomena, and their general form is given in Equation (6):
ε t ( ρ φ ) + ( ρ φ u g ) = ( ρ D φ ) + S
In Equation (6), ρ denotes the density of the gas mixture, t is time, ug is the velocity of gas diffusion within the soil, D is the diffusion coefficient, ϕ is a scalar quantity representing species concentration or mass fraction, and S is the source term.
(2)
Realizable k-ε Model
Acoustic field simulations are conducted based on the underlying flow field. Therefore, it is necessary to obtain a stable and accurate flow field prior to acoustic modeling, as the precision of the flow field directly influences the reliability of subsequent acoustic calculations.
In the steady-state flow field simulation, the realizable k-ε turbulence model is employed. This model is suitable for compressible flows and provides high computational accuracy, though at a slightly higher computational cost. It is applicable to various flow scenarios, including jet flows, mixing flows, internal pipe flows, and boundary layer flows [29], which align well with the characteristics of flow resulting from buried pipeline leakage.
The transport equations for turbulent kinetic energy and its dissipation rate in the realizable k-ε model are given as follows:
ρ D k D t = x j μ + μ t σ k k x j + G k + G b ρ ε Y M + S k
ρ D ε D t = x j μ + μ t σ k ε x j + ρ C 1 S ε ρ C 2 ε 2 k + v ε + C 1 ε ε k C 3 ε G b + S ε
C 1 = max 0.43 · η η + 5
η = S k / ε
S = 2 S i j S i j
In Equations (7) and (8), Gk denotes the production of turbulent kinetic energy due to the mean velocity gradients, while Gb represents the contribution from buoyancy-induced turbulence. YM accounts for the effect of compressible turbulence fluctuations on the overall dissipation rate. The turbulent viscosity is given by μ t = ρ C μ k / ε , with Cμ = 0.09. The constants C1ε and C2, along with the turbulent Prandtl numbers σk and σε, are empirical values: C1ε = 1.44, C2 = 1.9, σk = 1.0, and σε = 1.3. Sk and Sε are user-defined source terms. The definitions of these coefficients are provided in Equations (9)–(11).
(3)
LES Model
After obtaining a stable flow field, a corresponding stable acoustic source can be identified. As the acoustic source enters a continuous emission phase, transient numerical calculations are employed to simulate the sound propagation. These transient simulations require greater computational accuracy than steady-state simulations in order to capture acoustic signals based on the flow field. Consequently, the turbulence model used in the transient acoustic simulations is switched to the Large Eddy Simulation (LES) model.
The LES model offers higher accuracy and can capture many unsteady flow features that conventional turbulence models fail to resolve. It is relatively insensitive to boundary geometry and flow type, although it incurs higher computational costs.
The LES method begins with the construction of a mathematical filtering model [30], which filters out eddies smaller than the filter scale from the instantaneous turbulent equations. This process yields a set of equations describing the dynamics of large eddies. In LES, each flow variable is decomposed into two parts using a filtering function. The large-scale averaged component ϕ ¯ represents the filtered quantity and is directly solved in the simulation. This is a spatial (not temporal) average and can be obtained through Equation (12):
ϕ ¯ = D ϕ G ( x , x ) d x
where D denotes the flow domain, x is the spatial coordinate, and G(x, x′) is the filter function, which defines the scale of the eddies that are resolved in the simulation.
By applying the filtering operation to the instantaneous Navier–Stokes equations and the continuity equation, the filtered forms represented by Equations (13) and (14) are obtained:
t ( ρ u ¯ i ) + x j ( ρ u ¯ u ¯ i ) = p ¯ x i + x j ( μ u ¯ i x j ) τ i j x j
ρ t + x i ( ρ u ¯ i ) = 0
τ i j = ρ u i u j ¯ + ρ u i u ¯ j ¯
In Equations (13) and (14), the overlined variables represent the filtered field quantities. The term τij denotes the subgrid-scale (SGS) stress, as defined in Equation (18). This stress accounts for the influence of unresolved small-scale eddy motions on the resolved-scale equations of motion.
To incorporate the effects of these filtered-out small eddies on the large-scale eddies, an additional stress term—referred to as the SGS stress—is introduced into the governing equations of the large-eddy flow field. Since the SGS stress is not directly known, it must be modeled using appropriate physical quantities, forming what is known as a subgrid-scale model.
τ i τ k k δ i j = 2 μ t s ¯ y
The evaluation of SGS stress is a critical component of LES. The first SGS model was proposed by Smagorinsky [31], who assumed that the SGS stress can be expressed in the form given by Equation (16). The specific derivation is omitted here.

2.2.2. Acoustic Field Calculation Model

Based on the flow characteristics associated with leakage from buried natural gas pipelines, the resulting noise is primarily attributable to viscous stress interactions between gas molecules, which generate turbulence. In the vicinity of the leakage orifice, quadrupole sound sources are formed that radiate acoustic waves, while the interaction between the gas and the pipe wall gives rise to dipole sound sources. These two types of sources superimpose to form the overall noise source associated with pipeline leakage.
(1)
Broadband Noise Source Model
Using the steady-state flow field obtained from the flow simulations, the results are imported into the broadband noise source model to determine the sound power level distribution of the leakage noise and to analyze the acoustic source characteristics. The broadband noise source model operates using steady-state flow data and does not require time-resolved flow information, thereby minimizing computational resource demands and offering advantages in terms of efficiency [32]. In Fluent’s broadband noise model, turbulence parameters are obtained through Reynolds-averaged equations, and the noise power of surface or volume elements is calculated using various semi-empirical models, including the Proudman model, boundary layer noise source model, linear Euler equation source term model, and Lilley equation source term model [33,34,35,36,37].
Proudman [38] and Lilley later derived the sound power expressions presented in Equation (17), based on Lighthill’s acoustic analogy theory originally proposed by James Lighthill.
P = α ρ ( u 3 l ) u 5 c 5
In Equation (17), C is a constant, u denotes the turbulent velocity, l is the turbulence length scale, and c is the speed of sound.
To more effectively represent and compare the radiated energy of different acoustic sources, Sarkarhe and Hussainni [39] introduced the concept of sound power level, as defined in Equation (18):
L p = 10 log ( P P r e f )
In Equation (18), Pref denotes the reference sound power, which is typically taken as the standard reference value in air, equal to 1 × 10⁻¹² W/m3.
(2)
FW-H Model
The acoustic field is derived from Lighthill’s theory and the general form of the acoustic analogy, formulated by the Ffowcs Williams–Hawkings (FW-H) equation [40]. The FW-H model captures the temporal variations in relevant flow field variables and, through subsequent analysis, provides the required acoustic parameters. It is well suited for transient simulations.
Building on Lighthill’s foundational work, Williams and Hawkings [41] employed generalized function theory to solve the problem of acoustic radiation caused by pipe vibrations in a fluid medium, resulting in the development of the widely adopted FW-H model.
2 ρ t 2 c 0 2 2 ρ = t ρ 0 u i f x i δ ( f ) x i ( p δ i j ) f x i δ ( f ) + 2 T i j x i x j
In Equation (19), the far-field acoustic pressure is defined as p = p p 0 , where p′ is the sound pressure.
This study investigates the steady-state leakage behavior of a buried natural gas pipeline after leakage has occurred for some time, without considering the process of wall rupture. As there is no relative motion between the solid wall and the fluid, the monopole source can be neglected [42]. Therefore, Equation (19) can be reduced to the simplified form shown in Equation (20):
2 ρ t 2 c 0 2 2 ρ = x i ( p δ i j ) f x i δ ( f ) + 2 T i j x i x j

2.3. Numerical Method

A pressure-based solver was used in this study, and the numerical simulation included both steady-state and transient components. Following the onset of leakage, the flow field evolves, giving rise to and continuously altering the acoustic source. When the leakage flow field reaches a stable state, the acoustic source also stabilizes and transitions into a continuous emission phase. The steady-state results—comprising the stabilized flow field and corresponding acoustic source—were used as initial conditions for the transient simulation. An appropriate time step was selected to simulate the propagation of sound within the computational domain over a defined period.
The realizable k-ε model was employed for steady-state turbulence modeling, and the broadband noise model was used for acoustic analysis. Pressure–velocity coupling was handled using the SIMPLEC scheme, and pressure interpolation was performed using the PRESTO! method. Gradients were discretized using a cell-based least-squares approach, and all other terms were discretized using a second-order upwind scheme. The residual convergence criterion was set between 1 × 10⁻⁶ and 1 × 10⁻¹⁰ to ensure numerical accuracy.
The initial conditions play a critical role in the convergence of subsequent computations. A hybrid initialization was first applied, followed by local initialization. Prior to leakage, the pipeline contains pure methane at the operational pressure, while the leakage orifice and surrounding soil are filled with air at atmospheric pressure (101,325 Pa). The transient simulation conditions are detailed in Table 5.
For transient turbulence modeling, the LES model was used in conjunction with the broadband noise model. Pressure–velocity coupling was handled using the coupled scheme. Given the high accuracy of the selected turbulence model, the transient formulation was set to bounded second-order implicit to enhance numerical stability.
Since the time step’s size determines the maximum frequency that can be captured in acoustic analysis, a time step of 5 × 10⁻⁴ s was used in this study, enabling the simulation of acoustic signals in the ~1000 Hz frequency range. The steady-state results were employed as the initial conditions for the transient simulation, and all other discretization schemes remained consistent with those used in the steady-state simulation. The conditions for the transient simulation are presented in Table 6.
During the transient simulation, acoustic signal receiving points must be defined. Figure 2 presents a schematic layout of these receiving points, which enables the characterization of the acoustic field distribution within the computational domain. The specific x, y, and z coordinates of the receiving points are listed in Table 7. As shown in Figure 2, the vertical distances between adjacent planes are 0.5 m, 0.5 m, 4 m, and 4 m, respectively.
To facilitate the analysis of physical models with different leakage directions, the coordinate system was kept consistent, while the position of the leakage hole varied. The schematic layout of the receiving points is shown in Figure 3, and their specific coordinates are provided in Table 8. As depicted in Figure 3, the receiving points were arranged along concentric circles centered on the pipeline, with a radial interval of 0.1 m.
When the leakage hole is located at the top of the pipeline, the leakage point coordinates are (5, 5, 8.8555); when it is at the bottom, the coordinates are (5, 5, 8.1445); and when it is on the side of the pipeline, the coordinates are (5.3555, 5, 8.5).
During acoustic field simulation, different types of acoustic source surfaces can be defined, and their configuration plays a critical role. The characteristics of the resulting sound field depend on how these source surfaces are combined. As shown in Table 9, two acoustic source surfaces were selected: the contact surface between the leakage hole and the soil region (Holefluid-Soilfluid), labeled as Source 1; and the wall surface at the hole location (Wall-Hole), labeled as Source 2. The combination of these two surfaces is referred to as Source 3.
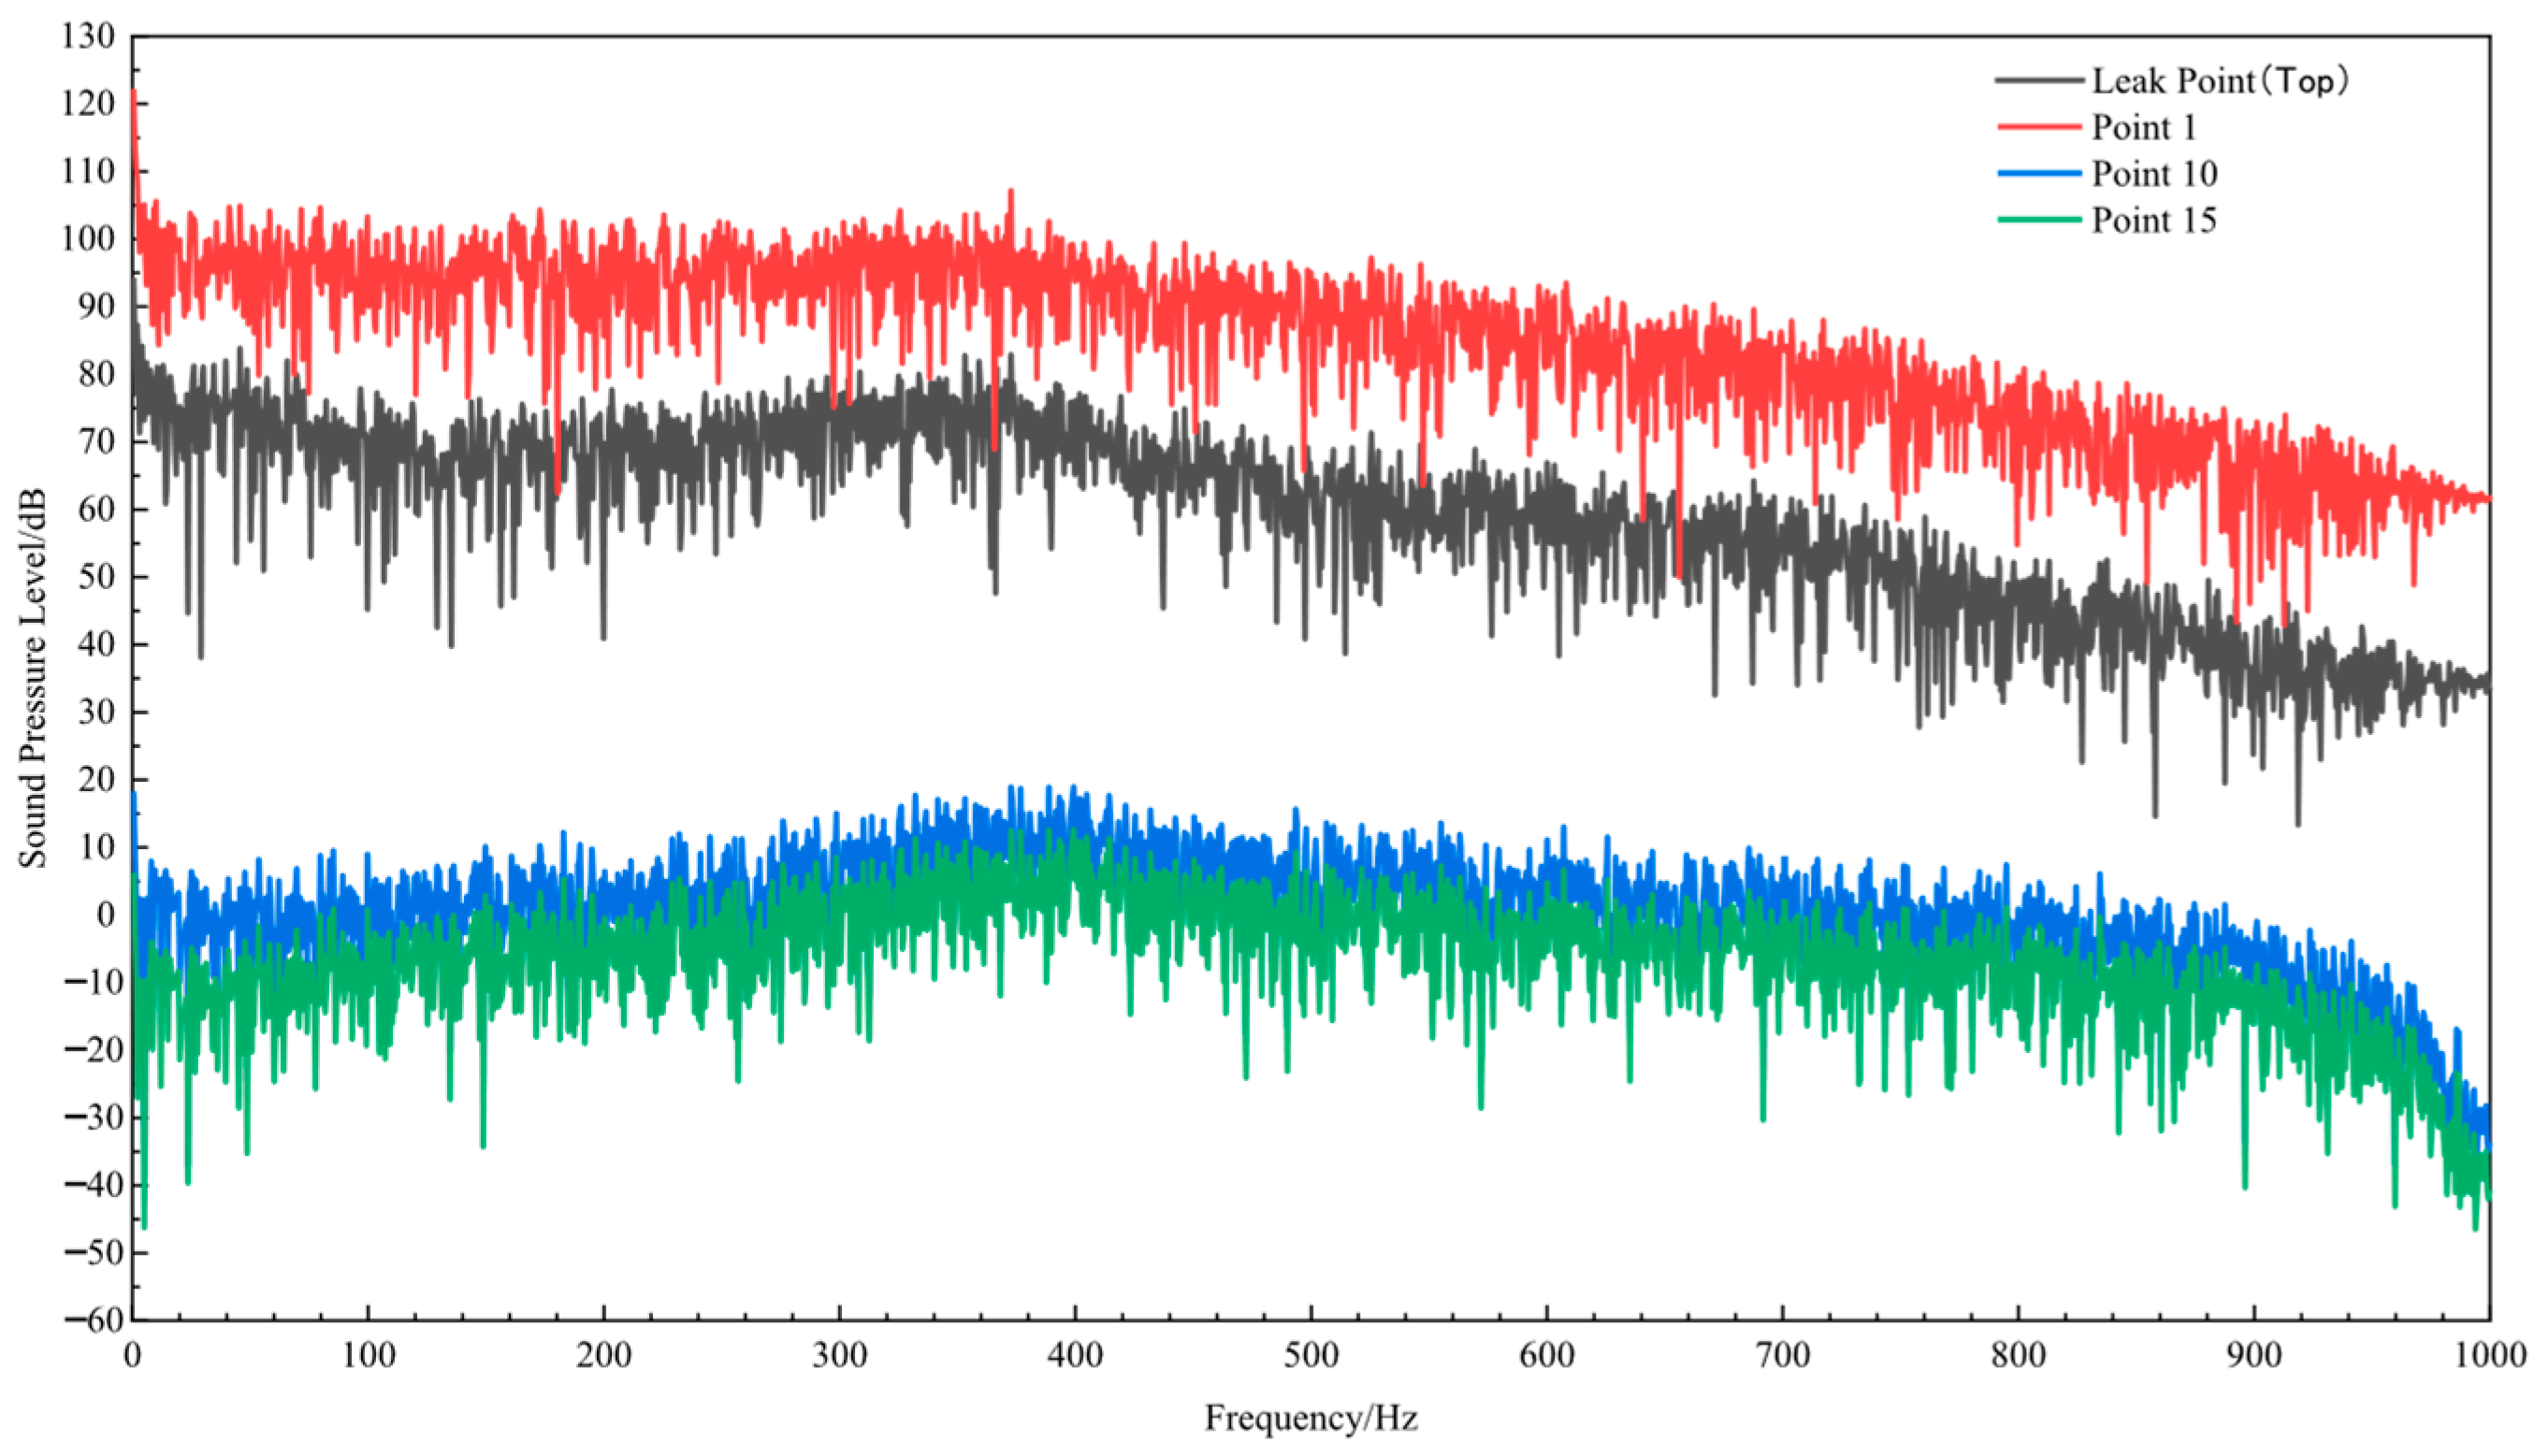
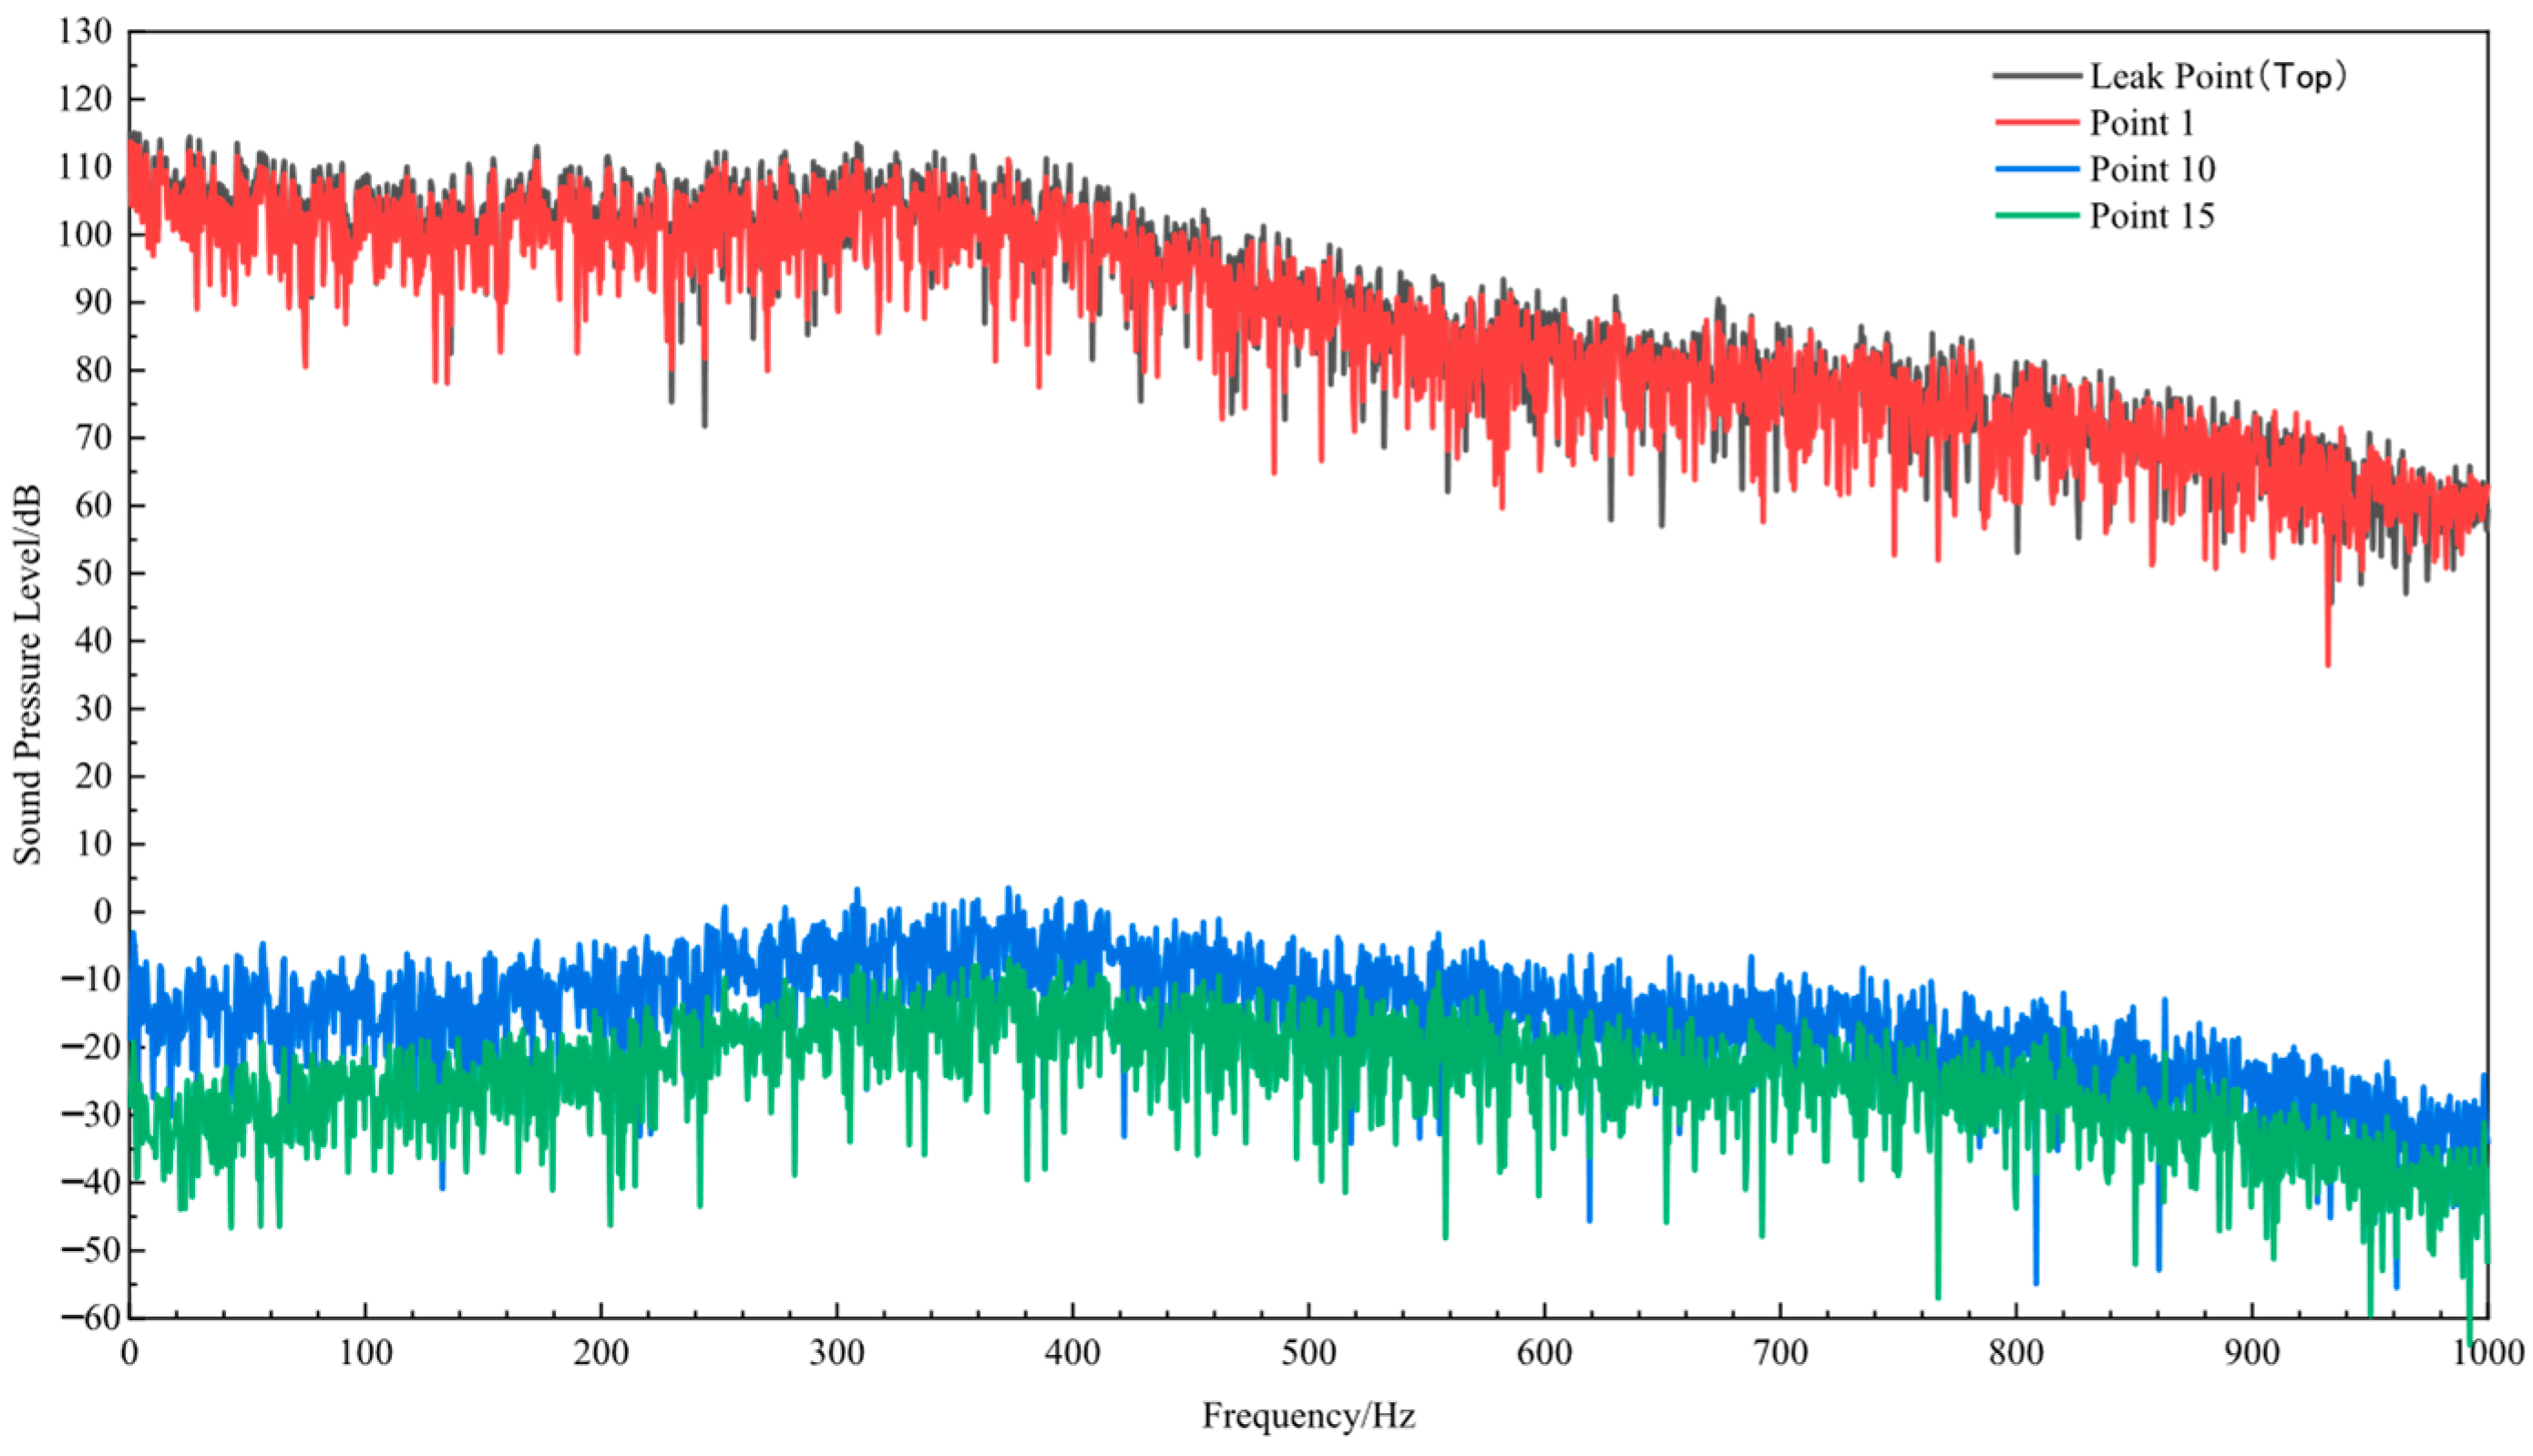
The sound pressure level (SPL) spectrum was obtained by applying a Fourier transform to the time-domain results from the Transient Case 3 simulation. Figure 4, Figure 5 and Figure 6 present the SPL spectra at receiving points along the axial direction of the leakage hole for different acoustic source surface configurations.
A comparative analysis reveals that when Source 1 is used as the acoustic source surface, the SPL spectrum attenuates the slowest with increasing distance along the axial direction. In contrast, using Source 2 results in the fastest attenuation. When Source 3 is used, the SPL amplitude is the highest, and the attenuation rate is moderate. Therefore, Source 3 was selected as the acoustic source surface for the subsequent acoustic field study.

2.4. Mesh Independence Verification

To ensure the accuracy of the numerical results and eliminate the potential influence of mesh resolution on the computed physical quantities, grid independence verification was carried out prior to the subsequent simulations. In this study, ten mesh configurations were generated for the same physical model to perform the verification, as summarized in Table 10.
Due to the need for local mesh refinement around the leakage hole, mesh independence cannot be assessed based solely on the total cell count. Instead, appropriate minimum and maximum element sizes were determined based on the variation in average velocity at the leakage hole and the average SPL.
Analysis of Table 10 shows that, when the minimum cell size is below 1 mm and the maximum cell size is below 500 mm, the mesh has negligible impact on the simulation outcomes, with the total number of cells exceeding 900,000. Considering that the smallest leakage hole diameter is 1 mm, and balancing model applicability with computational accuracy, the final mesh configuration adopted a minimum element size of 0.05 mm and a maximum element size of 100 mm.

3. Numerical Results and Discussion

3.1. Leakage Flow Field Analysis

Figure 7 shows the velocity and pressure contours on the plane y = 5, which is parallel to the XZ plane, under the condition where the leakage hole diameter is 1 mm, the pipeline pressure is 6 MPa, the leakage occurs at the top of the pipe, and the surrounding soil is loam (denoted as 1 mm-6 MPa-Top-Loam).
The flow analysis indicates that the velocity distribution near the leakage hole is radial and symmetric about the hole’s axis. As natural gas escapes from the pipeline, the pressure differential between the interior and exterior of the pipe causes a rapid acceleration of flow through the leakage hole. Upon entering the surrounding soil, the flow velocity decreases due to the resistive effect of the porous medium, leading to a gradual attenuation of flow energy.
Farther from the leakage site, the velocity and pressure fields become more uniform. Significant changes in both parameters are localized near the leakage hole, where sharp gradients are observed. The velocity at the leakage point is markedly higher than in the surrounding areas.

3.1.1. Effect of Varying Pipeline Pressure on Flow Field Characteristics

The impact of varying pipeline operating pressures on the flow field was investigated for pressures of 2 MPa, 4 MPa, 6 MPa, 8 MPa, and 10 MPa, with the leakage hole diameter fixed at 6 mm. Figure 8 presents the velocity and pressure distributions along the central axis of the leakage hole under different pressure conditions.
Because velocity and pressure remain relatively uniform in areas far from the leakage hole but exhibit steep gradients in its vicinity, the analysis focuses on the 8.83–8.90 m segment along the hole’s axis. Two reference lines, positioned at 8.8455 m and 8.8555 m, denote the inlet and outlet of the leakage hole, respectively. As such, the region to the left of these lines corresponds to the internal pipeline fluid, the central region represents the fluid within the leakage hole, and the right side corresponds to the fluid in the surrounding porous soil medium.
From the pipeline interior to the inside of the leakage hole, the flow velocity gradually increases, reaching its maximum within the hole, and then decreases. A slight increase in velocity is observed at the leakage hole outlet, followed by a gradual decrease as the flow enters the soil region, where it eventually stabilizes.
Within the leakage hole, at identical positions, an increase in pipeline pressure results in a decrease in velocity. After entering the soil, the velocity initially increases slightly, and then it steadily decreases. At greater distances from the leakage point (approximately 8.858 m), higher pipeline pressures lead to higher velocities at corresponding positions. In the localized soil region near the leakage hole, higher pipeline pressures produce steeper velocity and pressure gradients with respect to distance.
Despite the varying pipeline pressures, the velocity distribution curves along the leakage hole axis are very similar. The maximum difference in leakage velocity is 1.068 m/s, and the maximum difference in peak velocity along the axis is 1.827 m/s, indicating minimal variation. These findings suggest that, within a leakage hole of fixed size, pipeline pressure has a relatively limited influence on the axial velocity distribution.

3.1.2. Influence of Leakage Hole Size on the Flow Field

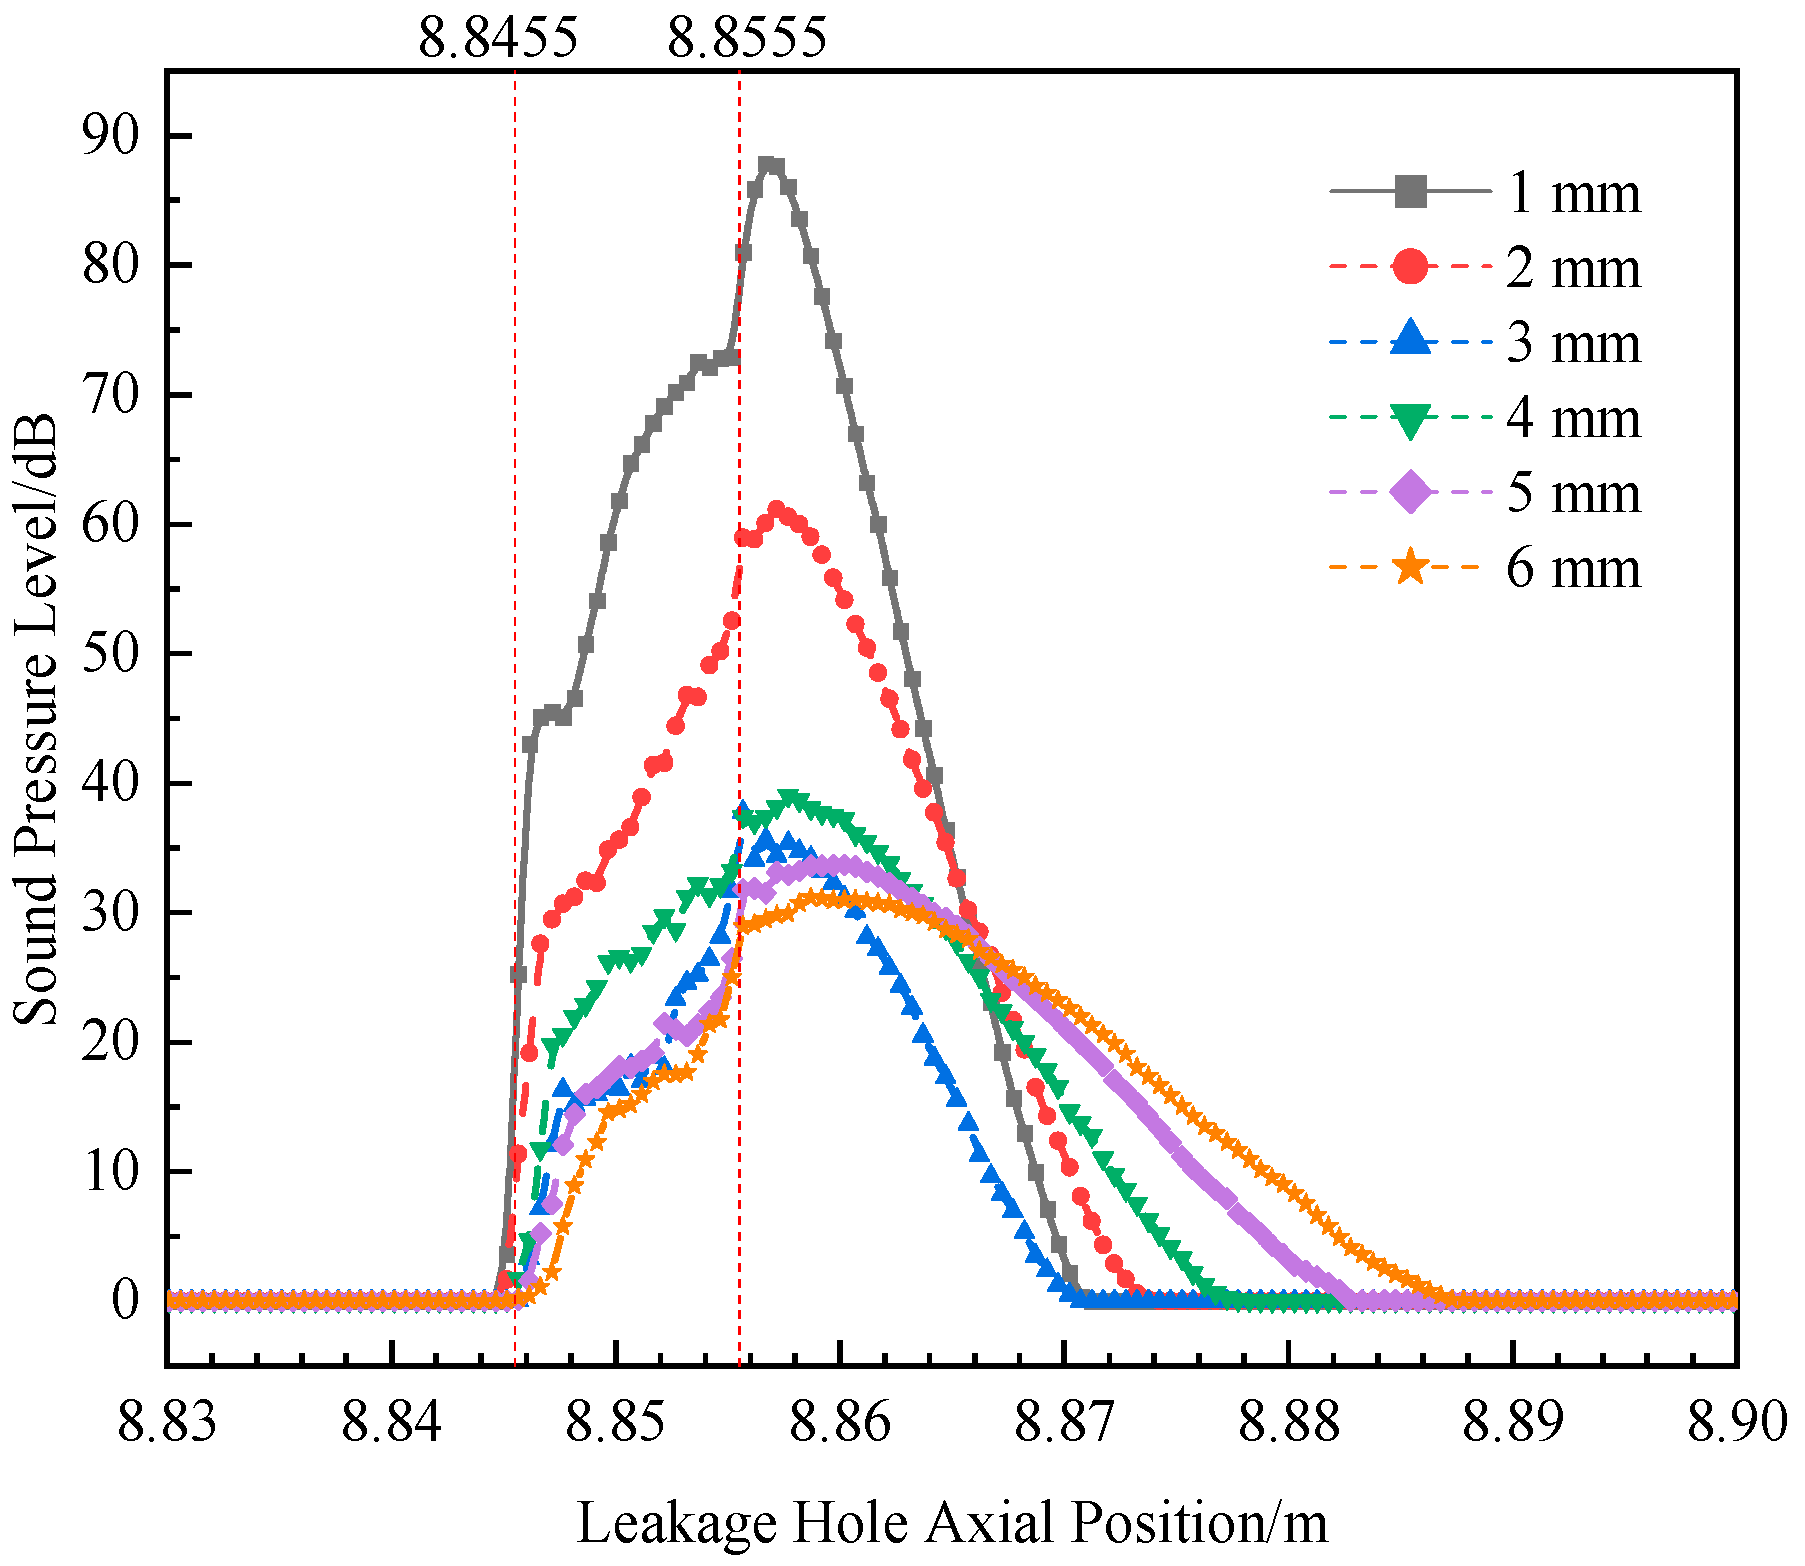
The effect of the leakage hole size on the flow field was examined under a constant pipeline pressure of 6 MPa, with hole diameters of 1 mm, 2 mm, 3 mm, 4 mm, 5 mm, and 6 mm. Figure 9 illustrates the velocity and pressure profiles along the axis of the leakage hole for each case. Compared to the results shown in Figure 8, the influence of the hole size on the flow field is more significant. The maximum difference in leakage velocity reaches 25.801 m/s, while the peak axial velocity along the leakage hole varies by up to 44.685 m/s—indicating a substantial impact.
Flow variations are mainly concentrated within the leakage hole and in the adjacent soil region. Although the overall pressure drop remains consistent across different hole sizes, larger leakage holes show smaller spatial gradients in both velocity and pressure near the hole, leading to slower attenuation with distance.
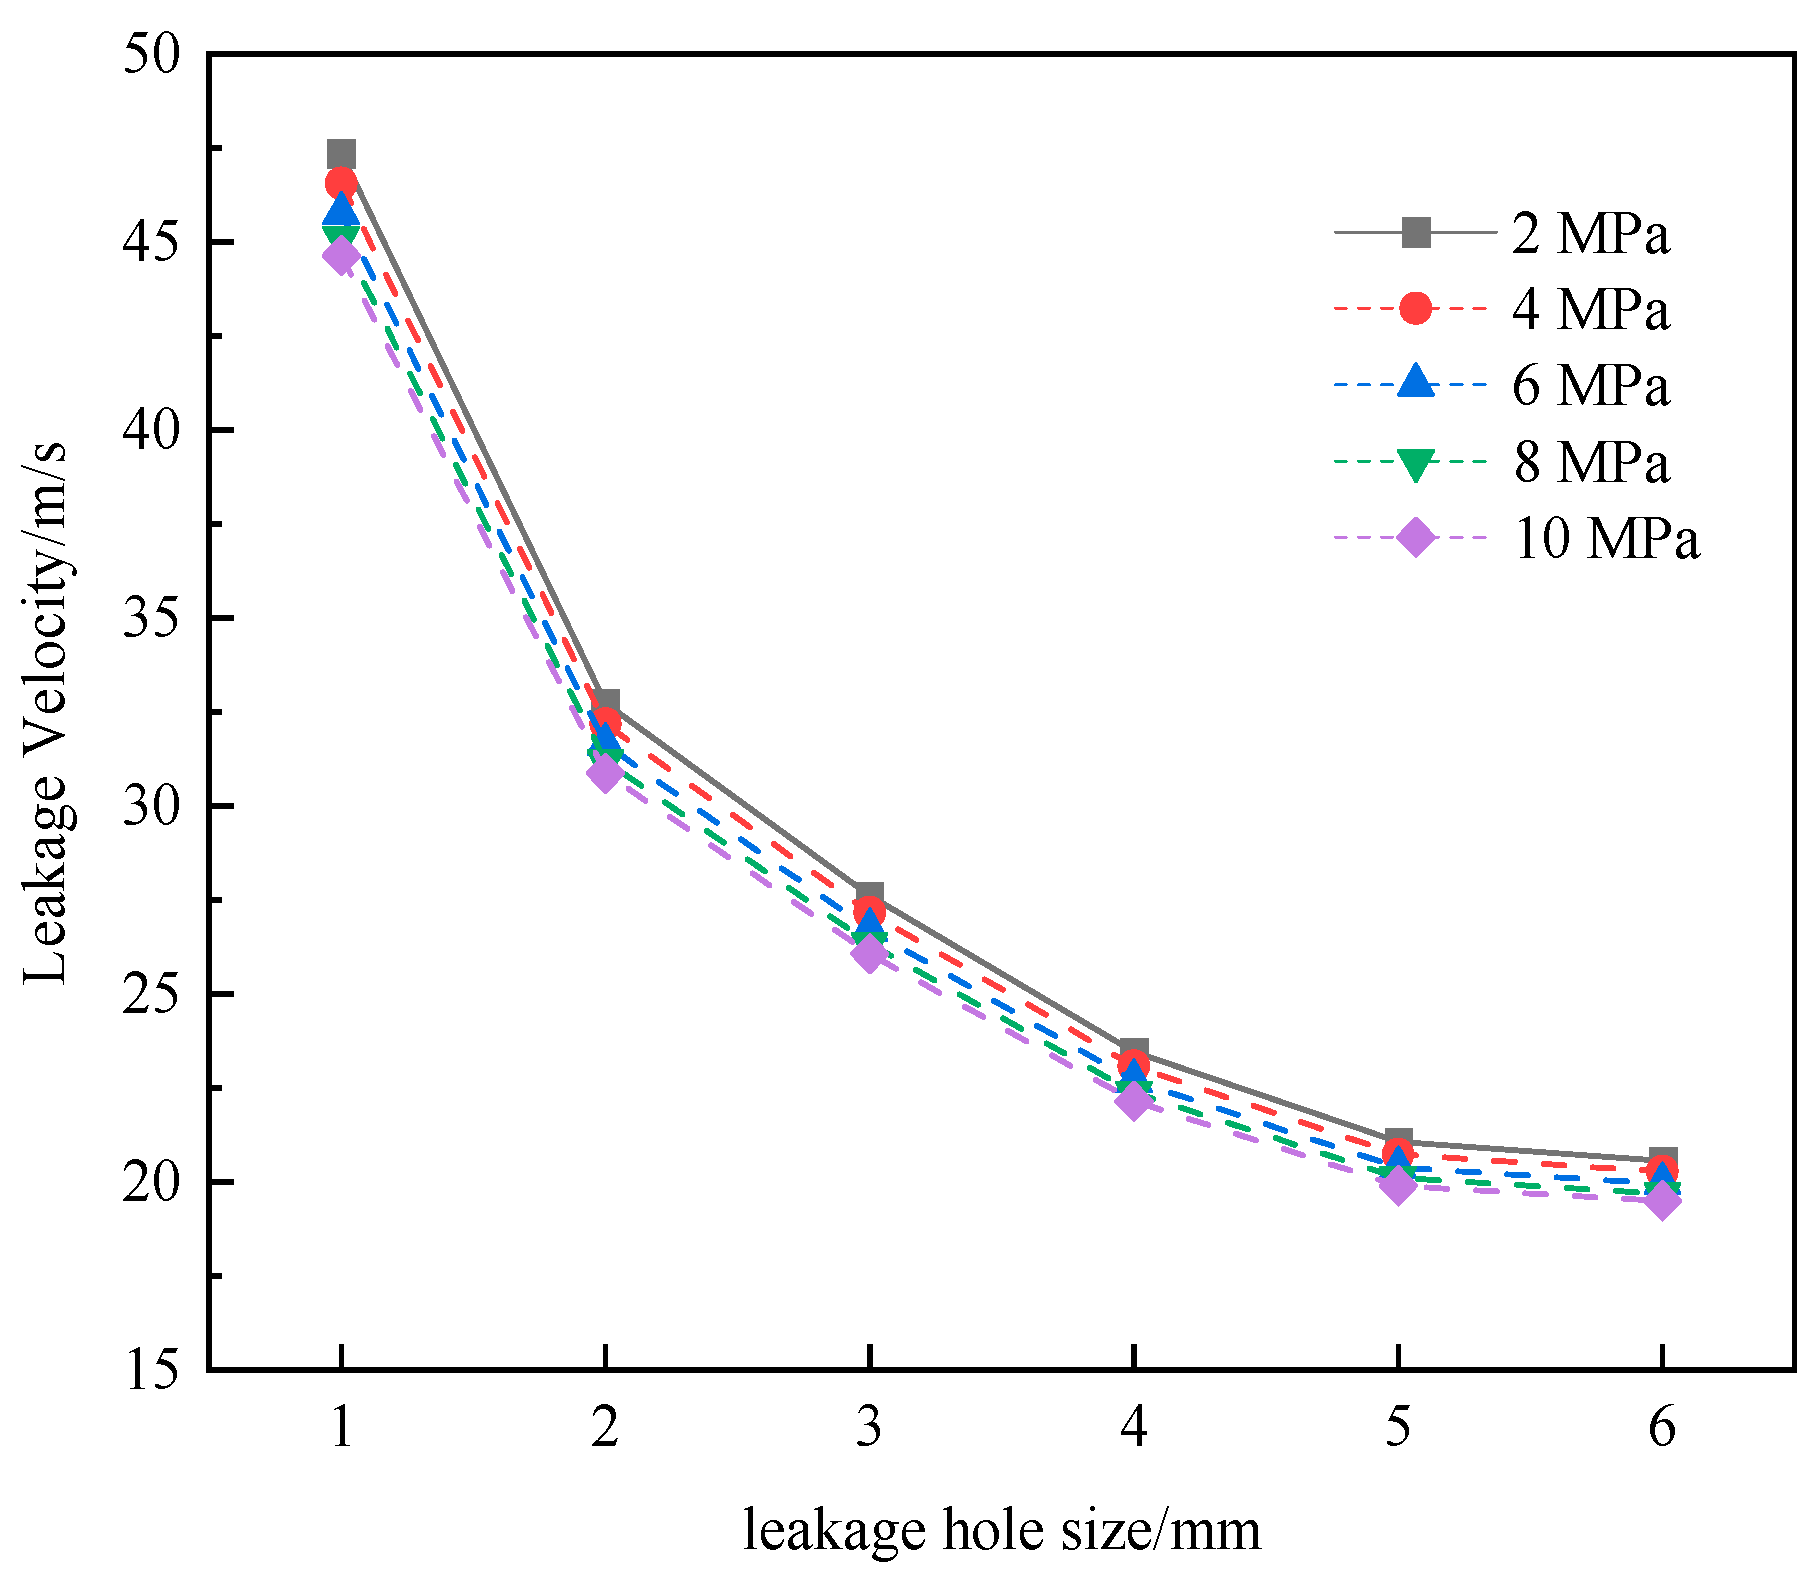
Figure 10 presents a comparison of the leakage velocities for various leakage hole sizes under different pipeline pressure conditions. The results show that, across all pressure levels, the leakage velocity consistently decreases as the leakage hole diameter increases.
For a given leakage hole size, the leakage velocity also tends to decrease with increasing pipeline pressure. However, the variation in leakage velocity across different pressures for the same hole size is relatively small, while the variation across different hole sizes under the same pressure is significantly larger.
These findings indicate that the pipeline operating pressure has a comparatively minor influence on the flow field, whereas the leakage hole size plays a more dominant role. Furthermore, as the leakage hole size increases, the influence of pressure on the leakage velocity becomes progressively less significant.

3.1.3. Influence of Soil Type on the Flow Field

The impact of soil type on the flow field was evaluated under a pipeline operating pressure of 6 MPa and a leakage hole diameter of 6 mm, with three soil media considered: sandy, loam, and clay. As illustrated in Figure 11, the velocity and pressure distributions along the leakage hole axis showed substantial variation across the different soil types. The influence range of velocity was greatest in sandy soil and smallest in clay.
Similarly, the pressure contours differ noticeably. The pressure influence ranges for sandy soil and loam are comparable, while clay exhibits the widest pressure distribution range. These differences are closely related to the resistance characteristics of the soil, with the resistance ranking as clay > loam > sandy and the corresponding gas leakage velocity ranking as sandy > loam > clay. The measured leakage velocities were 80.65 m/s, 19.96 m/s, and 5.99 m/s, respectively, with a maximum difference of 74.66 m/s. The maximum velocities reached were 101.56 m/s for sandy soil, 32.59 m/s for loam, and 9.90 m/s for clay, yielding a maximum difference of 91.66 m/s.
In the vicinity of the leakage hole, at the same location along the leakage axis, lower soil resistance results in higher gas velocities.
Within the leakage hole, the pressure distribution along the axial direction is identical when the surrounding soil is either loam or clay. However, in the case of sandy soil, a distinct pressure drop of approximately 0.2 MPa is observed along the axis. This can be attributed to the lower resistance of sandy soil, where the leakage region effectively acts as a coupling zone between the internal pipeline fluid and the soil fluid, causing the pressure to rapidly drop to atmospheric levels.
Once the flow enters the soil region, the pressure distributions along the leakage axis for loam and sandy soils are similar. In contrast, when the soil is clay, the highest resistance results in the smallest pressure gradient, and the pressure decreases more gradually with increasing distance.

3.1.4. Influence of Leakage Direction on the Flow Field

This section explores the impact of the leakage direction—top, bottom, or side—on the flow field, under conditions of a pipeline operating pressure of 6 MPa, a leakage hole diameter of 6 mm, and a loam soil environment.
Theoretically, since the soil was modeled as a homogeneous and isotropic porous medium, the local flow fields near the leakage holes were expected to be similar across different leakage directions. Using the pipeline center as the origin, the analysis considered a 0.5 m range along the axis of each leakage hole. Figure 12 displays the velocity and pressure distributions along the leakage hole axis for each leakage direction.
Analysis of Figure 12 shows that the velocity and pressure distribution curves along the leakage hole axis are nearly identical across different leakage directions. Velocity exhibits significant variation within the 0.30–0.50 m range from the pipeline center, while the pressure drop is mainly concentrated between 0.34 m and 0.44 m.
Along the central axis of each leakage hole, the maximum difference in leakage velocity is 0.452 m/s, the maximum difference in peak velocity is 0.504 m/s, and the maximum difference in average velocity is 0.5475 m/s, indicating that the variations are minimal. This confirms that the leakage direction has a negligible influence on the local flow field around the leakage hole, which is consistent with the theoretical expectation.

3.2. Analysis of Leakage Acoustic Source Characteristics

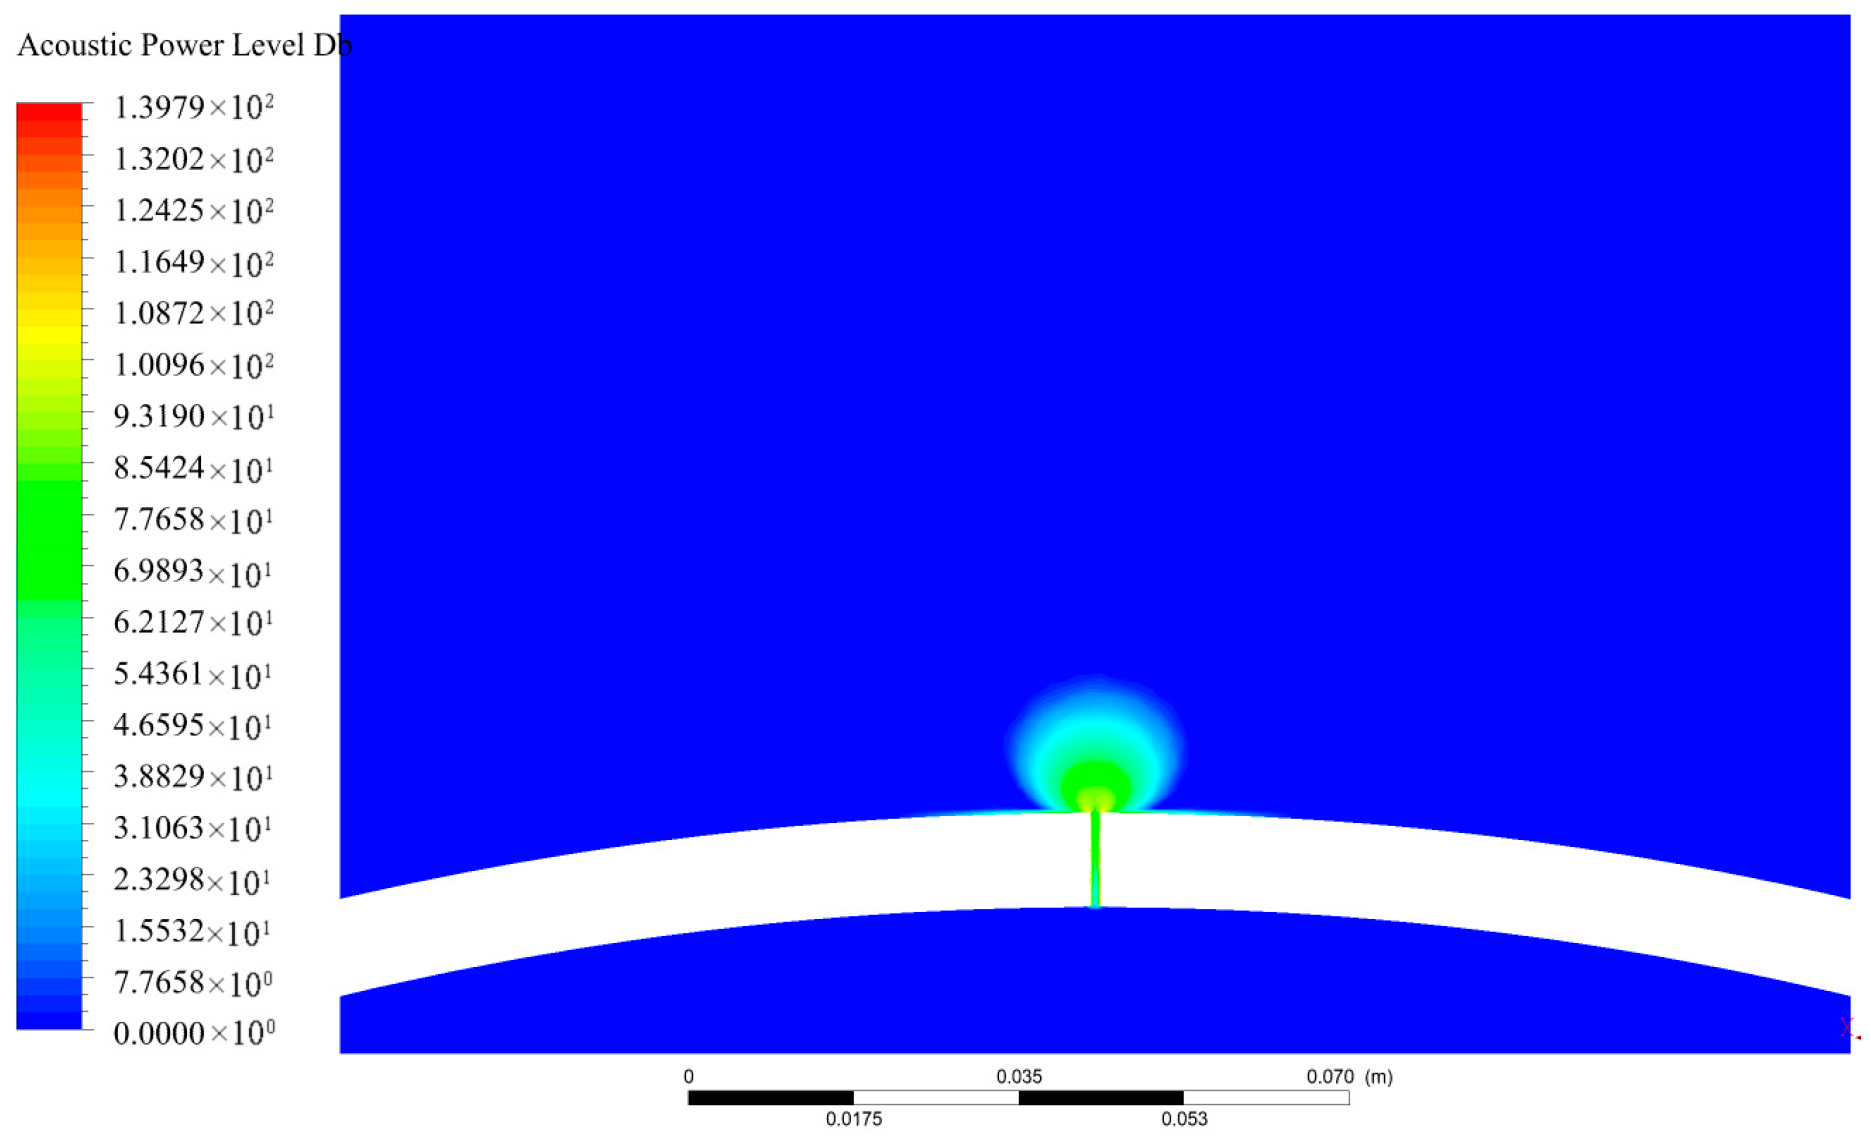
Figure 13 presents the sound power level contour for the 1 mm-6 MPa-Top-Loam case. The results indicate that the sound power level is primarily concentrated in the vicinity of the leakage hole and is symmetrically distributed about its axis.
After the gas enters the soil region, the sound power level along the axis initially continues to increase before gradually decreasing. This pattern arises from the interactions and mutual effects among multiple acoustic sources—once the sound power reaches its peak, it decreases gradually as the acoustic energy dissipates.

3.2.1. Influence of Pipeline Pressure on Acoustic Source Characteristics

The effect of the pipeline operating pressure on the acoustic source characteristics was examined under pressure levels of 2 MPa, 4 MPa, 6 MPa, 8 MPa, and 10 MPa, with the leakage hole diameter fixed at 6 mm. Figure 14 illustrates the axial distribution of the sound power level along the leakage hole for each pressure condition, and Table 11 provides a comparison of the corresponding characteristic values.
As shown in Figure 14, the sound power level along the leakage axis first increases, reaching a peak, and then gradually decreases. With increasing pipeline pressure, the sound power level at the same axial position becomes lower, and the gradient of variation with distance decreases, indicating a slower rate of attenuation.
As shown in Table 11, the characteristic values of sound power level under different pipeline pressures provide a basis for analyzing the contributions of dipole and quadrupole acoustic sources. According to the data, the maximum sound power level within the leakage hole is equal to the maximum overall sound power level of the pipeline, and both are greater than the maximum along the central axis inside the leakage hole. This indicates that the highest sound power level occurs within the fluid domain of the leakage hole, suggesting that the dominant acoustic source in buried pipeline leakage is of the dipole type. Moreover, the sound power level associated with the dipole source is greater than that of the quadrupole source.
For the same leakage hole size (6 mm), the maximum overall sound power level increases by 1.400 dB as the pipeline pressure increases. The variation in the axial sound power level within the leakage hole exceeds that of the overall sound power level. This implies that, with increasing pipeline pressure, the contribution of quadrupole sources to the sound power level gradually decreases, while that of dipole sources increases. This trend can be attributed to the relationship between leakage-induced noise energy and flow field parameters such as density fluctuations, pressure pulsations, and velocity gradients.

3.2.2. Influence of Leakage Hole Size on Acoustic Source Characteristics

To analyze how the leakage hole size affects the characteristics of the acoustic source, simulations were conducted at a constant pipeline pressure of 6 MPa, with the leakage hole diameters set to 1 mm, 2 mm, 3 mm, 4 mm, 5 mm, and 6 mm. Figure 15 illustrates the axial distribution of the sound power level for each leakage size.
The results indicate that within the leakage hole, for diameters in the ranges of 1–3 mm and 4–6 mm, larger holes tend to exhibit lower sound power levels at the same axial positions, and the spatial gradient of the sound power level decreases. However, a notable turning point occurs at 4 mm, where the sound power level along the axis exceeds that of the 3 mm case. After the gas enters the surrounding soil, the sound power level along the axis initially continues to increase before gradually decreasing. At a sufficient distance from the leakage hole, for diameters in the 4–6 mm range, larger holes are associated with higher sound power levels.
As summarized in Table 12, the characteristic sound power level values under different leakage hole sizes were compared. The analysis shows that as the leakage hole diameter increases, both the maximum sound power level along the central axis within the hole and the overall maximum sound power level decrease.
The average sound power level along the central axis first decreases to 17.782 dB, then exhibits a local increase at 4 mm, reaching 24.411 dB, and subsequently declines again to 13.51 dB. This indicates that as the leakage hole size changes, the two types of acoustic sources can transform into each other.
Figure 16 presents a comparison of the average sound power level along the central axis inside the leakage hole for different hole sizes under varying pipeline pressures. The analysis indicates that as the pipeline pressure increases, the average sound power level along the leakage axis tends to decrease. As the leakage hole diameter increases from 1 mm to 3 mm, the sensitivity of the sound power level to pressure variations increases, indicating that the effect of pressure on acoustic power becomes more pronounced. This demonstrates a clear interaction between leakage hole size and pipeline pressure in determining sound power behavior.
At a leakage hole diameter of 4 mm, an inflection point is observed in the average sound power level within the 4–10 MPa pressure range. As the diameter further increases to 6 mm, the change in the sound power level with pressure becomes nearly constant, indicating that the influence of pressure diminishes for larger leakage holes.

3.2.3. Influence of Soil Medium on Acoustic Source Characteristics

This section examines the effect of the soil type—sandy, loam, or clay—on the acoustic source characteristics under a pipeline pressure of 6 MPa and a leakage hole diameter of 6 mm. Figure 17 shows the axial distribution of the sound power level for each soil condition, and Table 13 summarizes the corresponding characteristic values. As shown in the figure, the sound power level distributions along the leakage hole axis are mainly concentrated within the ranges of 8.8440–8.8955 m for sandy soil, 8.8459–8.88925 m for loam, and 8.8484–8.8640 m for clay. The results indicate that lower soil resistance leads to a broader spatial distribution of the acoustic source’s sound power level, and to higher sound power level values along the leakage axis.
From Table 13, it can be seen that as the soil resistance increases, the maximum and average sound power levels along the central axis inside the leakage hole, as well as the overall maximum sound power level, all decrease. The influence of soil type on the acoustic source characteristics is clearly evident. Both quadrupole and dipole sound power levels decrease with increasing soil resistance, leading to an overall reduction in the sound power level of the buried pipeline leakage source. This trend is closely related to the impact of different soil resistances on the flow field behavior.

3.2.4. Influence of Leakage Direction on Acoustic Source Characteristics

This study also examined the effect of the leakage direction—top, bottom, or side—on the acoustic source characteristics, under a fixed pipeline pressure of 6 MPa, leakage hole diameter of 6 mm, and loam as the soil medium. Figure 18 shows the sound power level distribution along the leakage hole axis for each leakage direction, and Table 14 compares the corresponding characteristic values.
Since the acoustic source characteristics are determined based on the flow field, and previous analysis has shown that the leakage direction has minimal influence on the flow field, it is expected that the acoustic source behavior near the leakage hole should also be largely unaffected by leakage direction—aside from differences in emission position and direction. The results in Figure 18 support this theoretical expectation, showing nearly identical sound power level distributions across leakage directions. However, the comparison in Table 14 reveals that slight differences in the characteristic sound power values do exist, indicating that while the effect is small, the leakage direction still introduces minor variations in acoustic source behavior.
When the leakage hole is located at the bottom or side of the pipeline, the overall maximum sound power levels are 105.103 dB and 105.834 dB, respectively, showing minimal differences in characteristic values between the two. In contrast, when the leakage direction is at the top of the pipeline, the dipole sound power level is lower, the quadrupole sound power level is higher, and the overall sound power level of the buried pipeline leakage source is also lower than in the other configurations. This can be attributed to the fact that natural gas is less dense than air and, thus, tends to rise upon leakage. When the leakage hole is not located at the top—such as at the bottom or side—the upward movement of the gas is impeded. This leads to enhanced viscous interactions between gas molecules and a reduced coupling effect between the gas and the pipe wall.

3.3. Leakage Sound Field Characteristics

3.3.1. Influence of Pipeline Pressure on Sound Field Characteristics

To investigate how the pipeline pressure affects the sound field characteristics, simulations were carried out at operating pressures of 2 MPa, 4 MPa, 6 MPa, 8 MPa, and 10 MPa, with a constant leakage hole diameter of 6 mm. Figure 19 shows the SPL spectrum at the receiving point labeled “Leak Point (Top)” under different pressure conditions.
The results indicate that noise energy is mainly concentrated in the low-frequency range of 0–500 Hz, with particularly high SPL amplitudes in the 0–50 Hz and 360–380 Hz intervals. Within the 0–400 Hz range, the SPL generally decreases with increasing frequency, exhibits a minor increase, and then continues to decay.
In the 400–1000 Hz range, the SPL decreases with increasing frequency, in an oscillatory manner. Furthermore, as the pipeline pressure increases, the rate of SPL decay with frequency becomes more pronounced in this high-frequency range.
Figure 20 illustrates the overall SPLs at the receiving points along the z-axis, x-axis, and y-axis under different pipeline pressures, with reference lines corresponding to the positions of the leakage point along these axes. From the analysis, it can be seen that, along the z-axis direction, the overall SPL near the leakage hole exhibits complex variations. In contrast, along the x-axis and y-axis directions, the overall SPL distribution at the receiving points is similar and demonstrates a certain symmetry. The gradient of variation in the overall SPL near the leakage point is higher than at points farther away. As the pipeline pressure increases, the overall SPL at a given position also increases, and the rate of decay in sound pressure with distance becomes slower.

3.3.2. Influence of Leakage Hole Size on Sound Field Characteristics

The effect of leakage hole size on sound field characteristics was studied under a pipeline pressure of 6 MPa, with leakage diameters ranging from 1 mm to 6 mm. Figure 21 presents the SPL spectra at the receiving point Leak Point (Top) for each case. The results indicate that in the low-frequency range (0–400 Hz), smaller leakage holes are associated with slower SPL attenuation as the frequency increases. Conversely, in the higher-frequency range (400–1000 Hz), larger leakage holes exhibit slower SPL decay with frequency.
Figure 22 presents the overall SPLs at receiving points along the z-axis, x-axis, and y-axis directions for different leakage hole diameters. The effect of the leakage hole size on the spatial distribution of overall SPLs is nonlinear and exhibits complex patterns. As the leakage hole diameter increases, the overall SPL at receiving points near the leakage reference—specifically at Leak Point (Top) and Point1—gradually decreases. When the hole size reaches 4 mm, the overall SPL at these points increases, but with further enlargement beyond 4 mm, it decreases again. In general, as the leakage diameter increases, the overall variation in overall SPL becomes smaller. However, at 4 mm, a localized increase in SPL variation is observed, followed by a reduction as the hole continues to enlarge. For hole sizes in the 1–3 mm and 4–6 mm ranges, the larger the hole, the slower the SPL decays with distance. Conversely, smaller leakage holes lead to more rapid attenuation of the SPL over distance.

3.3.3. Influence of Soil Medium on Sound Field Characteristics

This study evaluated the impact of different soil types—sandy, loam, and clay—on the acoustic field characteristics under a pipeline pressure of 6 MPa and a leakage hole diameter of 6 mm. Figure 23 displays the SPL spectra at the receiving point “Leak Point (Top)” for each soil condition. The results show that lower soil resistance leads to higher SPL values at a given frequency and a slower rate of SPL attenuation with increasing frequency.
In Figure 24, the overall SPLs at receiving points along the z-axis, x-axis, and y-axis are shown for different soil media. The effect of soil resistance on the spatial distribution of overall SPL is significant. Specifically, higher soil resistance results in a lower overall SPL at a given location, and the SPL attenuates more rapidly with increasing distance.

3.3.4. Influence of Leakage Direction on Sound Field Characteristics

To evaluate how the leakage direction affects the acoustic field, simulations were conducted for three directions—top, bottom, and side—under a pipeline pressure of 6 MPa, a leakage hole diameter of 6 mm, and loam as the surrounding soil. Figure 24 presents the SPL spectra at receiving points along the axial direction of each leakage hole, while Figure 25 shows the corresponding distribution of overall SPL along each leakage path.
The analysis reveals that the SPL spectra at receiving points along the axial direction of each leakage hole are highly similar across different leakage directions. Moreover, the overall SPL distribution curves along the leakage axes are nearly identical after applying mirroring and spatial translation. These results, as shown in Figure 26, indicate that the leakage direction does not significantly influence the local acoustic field characteristics in the vicinity of the leakage hole.
To evaluate the influence of the leakage direction on a fixed receiving point, the positions of the receivers were held constant—reflecting practical scenarios where sensors or monitoring devices are installed at fixed locations. Figure 27 and Figure 28 show the SPL spectra at receiving points Point 22 and Point 26, respectively, under different leakage directions.
As shown in the figures, when the leakage occurs at the bottom of the pipeline, Point 22—positioned directly above the pipeline’s center—is the farthest from the source, resulting in the lowest received energy. Consequently, its SPL values are the lowest across all frequencies. Similarly, when the leakage occurs on the side, Point 26—located on the opposite side of the pipeline relative to the side leakage direction—is also the farthest from the leakage source. As a result, the SPL at this point is the lowest at the corresponding frequencies.
When the receiving point is located directly above the leakage hole, the SPL spectrum exhibits a pronounced peak in the 350–400 Hz range. Conversely, when the receiving point is positioned opposite the leakage hole, a distinct peak appears in the 650–700 Hz range. This frequency shift may result from the influence of the pipeline structure on sound wave propagation. When the receiving point is situated laterally relative to the leakage direction, two prominent peaks appear in both the 350–400 Hz and 650–700 Hz frequency ranges.

3.4. Relationship Between Leakage Noise and Flow Field Characteristics in Natural Gas Pipelines

As derived in this study and described by Equation (19), dipole acoustic sources arise from interactions between compressible gas within the pipeline and solid boundaries such as the pipe wall and orifice. These sources are characterized by surface pressure fluctuations and can be quantitatively represented by the mean dynamic pressure. In contrast, quadrupole sources are associated with turbulent flow generated by gas ejection from the leakage hole and can be characterized by mean turbulent kinetic energy.
Figure 29 illustrates the variations in mean dynamic pressure and mean turbulent kinetic energy for buried pipelines under different operating pressures and leakage hole diameters. When the leakage hole diameter is fixed at 6 mm and the pipeline pressure increases from 2 MPa to 10 MPa, the mean dynamic pressure rises from 1173 Pa to 45,702 Pa, while the turbulent kinetic energy decreases from 4.146 J/kg to 4.006 J/kg. During this process, the overall SPL increases from 117.908 dB to 140.487 dB, and the rate of SPL attenuation with distance becomes slower. These trends indicate that increasing pipeline pressure strengthens the dipole acoustic source while weakening the quadrupole source, leading to dipole-dominated leakage noise—consistent with the preceding analysis.
Under a constant pipeline pressure of 6 MPa, as the leakage hole diameter increases from 1 mm to 3 mm, the mean dynamic pressure decreases from 17,253 Pa to 3415 Pa, and the turbulent kinetic energy decreases from 13.299 J/kg to 4.109 J/kg. The overall SPL also drops from 148.568 dB to 135.721 dB, and the sound attenuates more gradually with distance for larger leakage holes. When the hole diameter increases to 4 mm, the mean dynamic pressure continues to decline, while the turbulent kinetic energy slightly rises from 5.529 J/kg to 5.783 J/kg. Further increasing the diameter to 6 mm results in a continued decrease in both indicators—down to 3415 Pa and 4.109 J/kg, respectively. These observations suggest that as the leakage hole enlarges, both the dipole and quadrupole source strengths generally diminish. A slight local enhancement of the quadrupole source is observed at 4 mm, followed by further weakening. This behavior is consistent with previous analytical conclusions.
Table 15 summarizes the average dynamic pressure and turbulent kinetic energy for buried pipelines under different soil conditions. The difference in average dynamic pressure between sandy soil and clay is 30,998 Pa, while the difference in average turbulent kinetic energy is 40.971 J/kg. The overall SPL differs by 48.412 dB between these two soils. These substantial differences explain the pronounced effect that the soil type has on acoustic behavior in buried pipeline leakage scenarios.
Table 16 provides the corresponding data for different leakage directions. The maximum variation in average dynamic pressure is only 78.10 Pa, the maximum difference in turbulent kinetic energy is 0.141 J/kg, and the overall SPL varies by no more than 1.144 dB. These minimal differences confirm that the leakage direction has a negligible effect on acoustic output. In conclusion, the average dynamic pressure and turbulent kinetic energy effectively explain variations in the overall SPL caused by buried pipeline leakage. These flow field parameters can be employed to characterize the underlying mechanisms of noise generation in buried natural gas pipeline leaks.

4. Practical Considerations

This study explored the spectral characteristics of leakage noise in buried pipelines under various conditions and established a relationship between leakage noise and the associated flow field. The behavior of the quadrupole sources reflects the turbulent state around the leakage hole, consistent with the assumption of compressible gas flow within the pipeline. The results indicate that, during steady-state leakage, the acoustic field is primarily governed by dipole sources (arising from gas–solid interactions) and quadrupole sources (arising from turbulent gas motion).
Reliable gas leakage detection depends fundamentally on a clear understanding of these acoustic source mechanisms. In practical engineering contexts, however, natural gas pipeline operation is often complex. Therefore, insight into how leakage noise mechanisms vary under different operating conditions provides a valuable foundation for improving the accuracy of leak detection and localization.
The observed trends in leakage noise behavior can be used to enhance the effectiveness of current detection technologies for buried pipelines. In practical applications, because acoustic waves experience relatively low attenuation in soil, the energy of the noise remains concentrated in the low-frequency band and stays within a detectable range.
Nevertheless, this study has several limitations. The computational model assumes a homogeneous and isotropic porous soil medium and neglects the effects of soil moisture content, temperature gradients, and possible chemical interactions between the leaked gas and the surrounding soil, which may influence sound propagation and attenuation. Additionally, although the simulation framework incorporates high-fidelity turbulence and acoustic models, it has not yet been validated against experimental or field data, which limits the confirmation of its predictive accuracy in real-world scenarios. These simplifications, while necessary to maintain computational feasibility, may constrain the direct applicability of the findings to more complex, heterogeneous environments. Future work should consider incorporating more realistic soil characteristics and experimental validation to further improve the robustness and practical relevance of the proposed method.

5. Conclusions

This study investigated the noise generated by small, compressible leaks in buried natural gas pipelines through theoretical modeling and numerical simulation. Compressible flow field governing equations and acoustic analogy-based noise equations were established. Simulations were conducted under varying conditions—including pipeline pressure (2–10 MPa), leakage hole diameter (1–6 mm), soil type, and leakage direction—to study the flow field behavior, acoustic source characteristics, and sound field responses. The main conclusions are as follows:
(1)
Leakage noise in buried natural gas pipelines is primarily composed of dipole sources (caused by gas–solid interactions) and quadrupole sources (arising from turbulent stresses). These noise generation mechanisms can be effectively characterized through key flow field parameters.
(2)
The simulated results under different hole sizes and pipeline pressures reveal that leakage noise energy is predominantly concentrated in the 0–500 Hz frequency range, with SPL values ranging from approximately 20 dB to 160 dB. This confirms the feasibility of acoustic methods for leak detection. Additionally, within a spatial range of 1.5 m above and 4 m below the leakage hole, the overall SPL remains positive, offering a practical reference for sensor placement and experimental design.

Author Contributions

Conceptualization, K.Z.; methodology, Y.C.; writing—original draft, X.G.; data curation, X.Z.; software, X.Z.; visualization, H.Z.; investigation, X.G.; writing—review and editing, Z.X. All authors have read and agreed to the published version of the manuscript.

Funding

This research received no external funding.

Data Availability Statement

The datasets generated or analyzed during this study are available from the corresponding author upon reasonable request.

Conflicts of Interest

Author Xiahua Zhang was employed by the company Wuhan Marine Machinery Plant Co., Ltd. The remaining authors declare that the research was conducted in the absence of any commercial or financial relationships that could be construed as potential conflicts of interest.

References

  1. Rui, Z.; Han, G.; Zhang, H.; Wang, S.; Pu, H.; Ling, K. A New Model to Evaluate Two Leak Points in a Gas Pipeline. J. Nat. Gas Sci. Eng. 2017, 46, 491–497. [Google Scholar] [CrossRef]
  2. Aguilera, R.F. The Role of Natural Gas in a Low Carbon Asia Pacific. Appl. Energy 2014, 113, 1795–1800. [Google Scholar] [CrossRef]
  3. Global Energy Demand Rose by 2.3% in 2018, Its Fastest Pace in the Last Decade. International Energy Agency: Paris, France, 26 March 2019. Available online: https://www.iea.org/news/global-energy-demand-rose-by-23-in-2018-its-fastest-pace-in-the-last-decade (accessed on 8 June 2025).
  4. Halim, S.Z.; Yu, M.; Escobar, H.; Quddus, N. Towards a Causal Model from Pipeline Incident Data Analysis. Process Saf. Environ. Prot. 2020, 143, 348–360. [Google Scholar] [CrossRef]
  5. Wang, X.; Tan, Y.; Zhang, T.; Xiao, R.; Yu, K.; Zhang, J. Numerical Study on the Diffusion Process of Pinhole Leakage of Natural Gas from Underground Pipelines to the Soil. J. Nat. Gas Sci. Eng. 2021, 87, 103792. [Google Scholar] [CrossRef]
  6. Awalt, J. Global Pipeline Construction Outlook 2023: Asia, Europe Pipeline Plans Surge as Russia Sanctions Roil Energy Trade. Pipeline Gas J. 2023, 250. [Google Scholar]
  7. Weller, Z.D.; Hamburg, S.P.; von Fischer, J.C. A National Estimate of Methane Leakage from Pipelines in Natural Gas Local Distribution Systems. Environ. Sci. Technol. 2020, 54, 7515–7524. [Google Scholar] [CrossRef] [PubMed]
  8. Highwood Emissions Management. Leak Detection Methods for Natural Gas Gathering, Transmission, and Distribution Pipelines; Highwood Emissions Management: Calgary, Canada, 2022. [Google Scholar]
  9. Wehnert, P. Overview of Leak Detection Solutions for Improving Gas Safety. Trenchless Technology Magazine, 2021. [Google Scholar]
  10. Korlapati, N.V.S.; Khan, F.; Noor, Q.; Mirza, S.; Vaddiraju, S. Review and Analysis of Pipeline Leak Detection Methods. J. Pipeline Sci. Eng. 2022, 2, 100052. [Google Scholar] [CrossRef]
  11. Sivathanu, Y. Natural Gas Leak Detection in Pipelines—Technology Status Report; U.S. DOE NETL: Pittsburgh, PA, USA, 2004. [Google Scholar]
  12. PHMSA (Pipeline and Hazardous Materials Safety Administration). Pipeline Safety: Requirement of Leak Detection for Gas Pipelines. Dly. J. United States Gov. 2021, 86, 2210. [Google Scholar]
  13. Zhang, K.; Ma, R.; Chen, S.; Gong, Y. Simulation and Experimental Research on the Propagation Mechanisms of Acoustic Energy inside the Pipeline to Detect the Leakage. Geoenergy Sci. Eng. 2024, 243, 213410. [Google Scholar] [CrossRef]
  14. Zhang, Z.; Yuan, H.; Fu, M.; Chen, T.; Gao, Y.; Feng, G. Theoretical Investigation on the Characteristics of Leak Noise for Natural Gas Pipelines. J. Theor. Comput. Acoust. 2020, 28, 2050005. [Google Scholar] [CrossRef]
  15. Lin, T.; Wang, Z.; Hu, B.; Ji, Y.; Liang, X. Simulation and Experimental Study of Buried Natural Gas Pipeline Leak Detection Based on Sound Source Characteristics. Therm. Sci. 2024, 28, 101–113. [Google Scholar] [CrossRef]
  16. Huang, W.; Zhang, X.; Zhang, Y. A Review on the Research and Application of Big Data Technology in Natural Gas Downstream. Oil Gas New Energy 2021, 33, 1–5. [Google Scholar]
  17. Zhang, J.; Lian, Z.; Zhou, Z.; Xiong, M.; Lian, M.; Zheng, J. Acoustic Method of High-Pressure Natural Gas Pipelines Leakage Detection: Numerical and Applications. Int. J. Press. Vessel. Pip. 2021, 194, 104540. [Google Scholar] [CrossRef]
  18. Han, B.; He, J.; Wang, J. Acoustic Detection and Localization Method for Natural Gas Pipeline Leakage. Noise Vib. Control. 2021, 41, 58–64, 146. [Google Scholar]
  19. Shang, W.; Xie, R. Research on Leakage Localization Detection Technology for Natural Gas Pipelines. Petrochem. Technol. 2015, 22, 143–144. [Google Scholar]
  20. Zhang, X.; Wang, J.; Li, H.; Liu, Y. Experimental Validation and CFD Analysis of Methane Leakage Behavior from a Buried High-Pressure Pipeline. J. Nat. Gas Sci. Eng. 2024, 113, 104220. [Google Scholar]
  21. Bagheri, M.; Sari, A. Study of Natural Gas Emission from a Hole on Underground Pipelines Using Optimal De-sign-Based CFD Simulations: Developing Comprehensive Soil Classified Leakage Models. J. Nat. Gas Sci. Eng. 2022, 102, 104583. [Google Scholar] [CrossRef]
  22. Yue, J.; Chen, Y.; He, L. Numerical Investigation of Natural Gas Leakage Diffusion and Risk Evaluation in Buried Pipelines near Underground Structures. Process Saf. Environ. Prot. 2024, 178, 859–873. [Google Scholar]
  23. Jin, H.; Zhang, L.; Liang, W.; Ye, Y.; Ding, Q. Numerical Simulation of Acoustic Source Characteristics and Propagation Mechanism in Natural Gas Pipeline Leakage. Acta Pet. Sin. 2014, 35, 172–177. [Google Scholar] [CrossRef]
  24. Martins, A.F.; Seleghim, P.R. Modeling and Experimental Validation of the Hydrodynamic Transient Associated with Leaks in Pipelines. In Proceedings of the 20th International Congress of Mechanical Engineering (COBEM 2009), Gramado, Brazil, 15–20 November 2009. [Google Scholar]
  25. Oh, Y.G.; Kim, J.T.; Park, J.H. Acoustic Characteristics of a Leak from a Crack in a Pressurized Pipe. Nucl. Eng. Des. 2018, 327, 198–211. [Google Scholar] [CrossRef]
  26. Uchendu, I.C.; Marburg, S.; McDonald, A.G. Leak Detection and Localisation in Pipelines Using Transient Acoustic Signals. In Proceedings of the ISMA2020 International Conference on Noise and Vibration Engineering, Leuven, Belgium, 7–9 September 2020. [Google Scholar]
  27. Xiao, W.; Joseph, P.F.; Li, F. Prediction of Leak Noise Spectra in Plastic and Metal Water Distribution Pipes. J. Sound Vib. 2020, 488, 115646. [Google Scholar] [CrossRef]
  28. Shi, X.; Fan, W.; Lin, B.; Wang, D. Simulation of Pipeline Leakage Flow and Sound Field Based on Fluent and LMS Virtual.Lab. In Proceedings of the 2nd China International Conference on Process Safety (AIChE), Qingdao, China, 28–29 August 2014. [Google Scholar]
  29. Liu, K. Numerical Simulation of Natural Gas Pipeline Leakage Considering Throttling Effect. Ph.D. Thesis, China University of Petroleum, Beijing, China, 2019. [Google Scholar]
  30. Peng, T.; Qian, R. A Review on the Theoretical Research of Large Eddy Simulation (LES). In Proceedings of the 8th National Academic Symposium on Modern Structural Engineering, Tianjin, China, 18–21 July 2008. [Google Scholar]
  31. Smagorinsky, J. General Circulation Experiments with Primitive Equations. Mon. Weather. Rev. 1963, 91, 99–164. [Google Scholar] [CrossRef]
  32. Han, H. Numerical Simulation of Flow Field and Acoustic Field Characteristics in Pipeline Micro-Leakage. Master’s Thesis, North China Electric Power University, Beijing, China, 2018. [Google Scholar]
  33. Bergeron, R.G.; Kim, W.; Kim, J. Broadband Noise Prediction for Aerofoils with a Serrated Trailing Edge Based on Amiet’s Theory. J. Sound Vib. 2021, 512, 116352. [Google Scholar]
  34. Fiore, M.; Daroukh, M.; Montagnac, M. Broadband Noise Prediction of a Counter Rotating Open Rotor Based on LES Simulation with Phase-Lagged Assumption (Draft). J. Sound Vib. 2021, 514, 116431. [Google Scholar] [CrossRef]
  35. Hyeonu, H.; Mathew, S.; Jaehyung, J.; Arup, N. Acoustic Metasurface-Aided Broadband Noise Reduction in Automobile Induced by Tire-Pavement Interaction. Materials 2021, 14, 4240. [Google Scholar] [CrossRef]
  36. Wang, S.; Tang, J.; Qiu, X.; Burrentt, I.S. Broadband Noise Insulation of Windows Using Coiled-up Silencers Consisting of Coupled Tubes. Sci. Rep. 2021, 11, 14023. [Google Scholar] [CrossRef]
  37. Zawadzki, I.; Gély, A.; Rezgui, M.; Michel, R. Analytical Prediction of the Blade Trailing Edge Broadband Noise of a Plug Fan. J. Phys. Conf. Ser. 2021, 1909, 012035. [Google Scholar]
  38. Proudman, I. The Generation of Noise by Isotropic Turbulence. Proc. R. Soc. A 1952, 214, 119–132. [Google Scholar] [CrossRef]
  39. Sarkar, S.; Hussaini, M.Y. Computation of the Sound Generated by Isotropic Turbulence; DTIC: Fort Belvoir, VA, USA, 1993. [Google Scholar]
  40. Mostafapour, A.; Davoodi, S. A Theoretical and Experimental Study on Acoustic Signals Caused by Leakage in Buried Gas-Filled Pipe. Appl. Acoust. 2015, 87, 1–5. [Google Scholar] [CrossRef]
  41. Williams, J.E.F.; Hawkings, D.L. Sound Generation by Turbulence and Surfaces in Arbitrary Motion. Philos. Trans. R. Soc. A 1969, 264, 321–342. [Google Scholar] [CrossRef]
  42. Liu, C.; Li, Y.; Fu, J.; Liu, G. Experimental Study on Acoustic Propagation-Characteristics-Based Leak Location Method for Natural Gas Pipelines. Process Saf. Environ. Prot. 2015, 96, 43–60. [Google Scholar] [CrossRef]
Figure 1. Schematic diagram of the physical model.
Processes 13 02274 g001
Figure 2. Receiving point layout diagram.
Processes 13 02274 g002
Figure 3. Receiving point layout diagram (for different leakage directions).
Processes 13 02274 g003
Figure 4. SPL of the receiving point in the axial direction of the leakage hole (Source 1).
Processes 13 02274 g004
Figure 5. SPL of the receiving point in the axial direction of the leakage hole (Source 2).
Processes 13 02274 g005
Figure 6. SPL of the receiving point in the axial direction of the leakage hole (Source 3).
Processes 13 02274 g006
Figure 7. Cloud diagram of velocity and pressure (1 mm-6 MPa-Top-Loam).
Processes 13 02274 g007
Figure 8. Velocity and pressure distribution on leakage hole axis under different pipeline pressures: (a) velocity; (b) pressure.
Processes 13 02274 g008
Figure 9. Pressure distribution on leakage hole axis under different leak hole sizes: (a) velocity; (b) pressure.
Processes 13 02274 g009
Figure 10. Leakage velocity comparison.
Processes 13 02274 g010
Figure 11. Velocity and pressure distribution on the axis of the leakage hole under different soil types: (a) velocity; (b) pressure.
Processes 13 02274 g011
Figure 12. Velocity and pressure distribution on the axis of the leakage hole under different leakage directions: (a) velocity; (b) pressure.
Processes 13 02274 g012
Figure 13. Cloud diagram of sound power level (1 mm-6 MPa-Top-Loam).
Processes 13 02274 g013
Figure 14. Distribution of sound power level on leakage hole axes under different pipeline pressures.
Processes 13 02274 g014
Figure 15. Distribution of sound power level on leakage hole axes under different leak hole sizes.
Processes 13 02274 g015
Figure 16. Comparison of sound power levels of leakage hole center axis.
Processes 13 02274 g016
Figure 17. Distribution of sound power levels on leakage hole axes under different soil types.
Processes 13 02274 g017
Figure 18. Distribution of SPL on leakage hole axes under different leak directions.
Processes 13 02274 g018
Figure 19. SPL of Leak Point (Top) under different pipeline pressures.
Processes 13 02274 g019
Figure 20. Overall SPL at receiving points along the x-, y-, and z-axes under different pipeline pressures: (a) Location along z-axis. (b) Location along x-axis. (c) Location along y-axis.
Processes 13 02274 g020
Figure 21. SPL of Leak Point (Top) under different leak hole sizes.
Processes 13 02274 g021
Figure 22. Overall SPL at receiving points along the x-, y-, and z-axes under different pipeline pressures: (a) Location along z-axis. (b) Location along x-axis. (c) Location along y-axis.
Processes 13 02274 g022
Figure 23. SPL of Leak Point (Top) under different soil types.
Processes 13 02274 g023
Figure 24. Overall SPL at receiving points along the y-axis under different soil types: (a) Location along z-axis. (b) Location along x-axis. (c) Location along y-axis.
Processes 13 02274 g024
Figure 25. SPL of receiving points along the respective leakage hole axis with different leakage directions: (a) top; (b) bottom; (c) side.
Processes 13 02274 g025
Figure 26. The distribution of the overall SPL at the receiving point along the respective leakage hole axis under different leakage directions.
Processes 13 02274 g026
Figure 27. SPL of receiving point 22 under different leakage directions.
Processes 13 02274 g027
Figure 28. SPL of receiving Point 26 under different leakage directions.
Processes 13 02274 g028
Figure 29. Average dynamic pressure and average turbulent kinetic energy for the buried pipeline: (a) different pipeline pressure; (b) different leak hole size.
Processes 13 02274 g029
Table 1. Properties of soil.
Density
/(kg/m3)
Specific Heat Capacity/J/(kg/K)Thermal Conductivity
/ W / ( m · K )
Porosity
/%
Surface Heat Transfer Coefficient
/ W / ( m 2 · K )
26508400.0180.4511.6
Table 2. Boundary conditions of the simulation model.
Boundary LocationBoundary NameBoundary TypeValue
Pipeline InletInlet-PipelinePressure inlet2–10 MPa
Pipeline OutletOutlet-PipelinePressure outlet101,325 Pa
Ground SurfaceOutlet-TopPressure outlet101,325 Pa
Periphery of the Computational DomainOutlet-AroundPressure outlet101,325 Pa
Bottom of the Computational DomainOutlet-BottomPressure outlet101,325 Pa
Interface Between Leakage Hole Fluid and SoilHolefluid-SoilfluidInterior
Interface Between Leakage Hole Fluid and SoilHolefluid-PipefluidInterior
Outer Wall of the PipelineWall-outsideStationary wall
Inner Wall of the PipelineWall-insideStationary wall
Side Wall of the Leakage HoleWall-holeStationary wall
Table 3. Characteristics of the soils.
Soil TypeAverage Particle Diameter/mmPorosity
Sandy0.5–1.00.25–0.45
Loam0.05–0.50.43–0.54
Clay0.01–0.050.3–0.6
Table 4. The results of soil resistances.
Soil TypeParticle Diameter
/mm
PorosityViscous Resistance
/1/m2
Inertial Resistance
/1/m
Sandy0.60.451.38 × 1093.52 × 104
Loam0.060.451.38 × 10113.52 × 105
Clay0.010.454.98 × 10122.11 × 106
Table 5. Operating conditions of steady cases.
Pipe Diameter
/mm
Leakage Hole Diameter
/mm
Pipeline Pressure
/MPa
Leakage Hole LocationSoil TypeBurial Depth
/m
71112–10TopLoam1.5
71122–10TopLoam1.5
71132–10TopLoam1.5
71142–10TopLoam1.5
71152–10TopLoam1.5
71162–10TopLoam1.5
71166TopSandy1.5
71166TopClay1.5
71166BottomLoam1.5
71166SideLoam1.5
Table 6. Operating conditions of transient cases.
CasePipe Diameter
/mm
Leakage Hole Diameter
/mm
Pipeline Pressure
/MPa
Leakage LocationSoil TypeBurial Depth
/m
171162TopLoam1.5
271164TopLoam1.5
371166TopLoam1.5
471168TopLoam1.5
5711610TopLoam1.5
671116TopLoam1.5
771126TopSandy1.5
871136TopClay1.5
971146TopLoam1.5
1071156TopLoam1.5
1171166TopSandy1.5
1271166TopClay1.5
1371166BottomLoam1.5
1471166SideLoam1.5
Table 7. Receiving point coordinates.
Receiver Pointx/my/mz/m
Leak Point (Top)5.05.08.8555
Point 15.05.08.856
Point 22.55.08.856
Point 30.05.08.856
Point 47.55.08.856
Point 5105.08.856
Point 65.02.58.856
Point 75.00.08.856
Point 85.07.58.856
Point 95.0108.856
Point105.05.09.356
Point 117.55.09.356
Point 12105.09.356
Point 135.07.59.356
Point 145.0109.356
Point 155.05.09.856
Point 167.55.09.856
Point 175.05.04.856
Point 185.07.54.856
Point 195.05.00.856
Point 207.55.00.856
Table 8. Receiving point coordinates (for different leakage directions).
Receiver Pointx/my/mz/m
Leak Point (Top)5.00005.00008.8555
Leak Point (Bottom)5.00005.00008.1445
Leak Point (Side)5.35555.00008.5000
Point 215.00005.00008.9555
Point 225.00005.00009.0555
Point 235.00005.00008.0445
Point 245.00005.00007.9445
Point 254.54455.00008.5000
Point 264.44455.00008.5000
Point 275.45555.00008.5000
Point 285.55555.00008.5000
Table 9. Sound source surface selection.
No.Acoustic Source SurfaceBoundary Type
Source 1Holefluid-SoilfluidInterior
Source 2Wall-HoleStationary wall
Source 3Holefluid-Soilfluid and Wall-HoleCoupled
Table 10. Verification of mesh independence.
No.Min. Element Size/mmMax. Element Size/mmMesh CountMin. Inverse Orthogonal QualityAvg. Velocity at Leakage/m/sAvg. SPL at Leakage/dB
12.50500246,0400.0810.51648.443
22.00500250,5120.2416.53258.480
31.50500256,8810.4117.87658.050
41.00500114,6590.3520.36157.218
51.00300289,7930.2120.16456.499
61.00100966,4460.2020.15756.511
70.50100968,0950.2620.28456.884
80.30100907,1700.3220.08057.212
90.10100930,1520.3220.04556.566
100.05100988,1880.2320.44856.867
Table 11. Comparison of sound power level characteristics under different pipeline pressures.
Pipeline Pressure
/MPa
Centerline SPL in Leakage HoleSPL in Leakage Hole Fluid DomainOverall SPL
Max/dBAverage/dBMax/dBMax/dB
240.62426.178100.777100.777
432.61117.826101.149101.149
627.79213.251101.356101.356
824.37710.388101.545101.545
1021.7468.399102.177102.177
Table 12. Comparison of sound power level characteristics under different leak hole sizes.
Pipeline Pressure
/mm
Centerline SPL in Leakage HoleSPL in Leakage Hole Fluid DomainOverall SPL
Max/dBAve/dBMax/dBMax/dB
178.89259.320142.700142.700
257.58537.196128.979128.979
335.75517.782125.965125.965
436.67524.411110.207110.207
530.17016.280107.259107.259
627.79213.251100.777100.777
Table 13. Comparison of sound power level characteristics under different soil types.
Soil TypeCenterline SPL in Leakage HoleSPL in Leakage Hole Fluid DomainOverall SPL
Max/dBAve/dBMax/dBMax/dB
Sandy46.92232.245141.497141.497
Loam27.79213.251100.777100.777
Clay8.96791.92458.47258.472
Table 14. Comparison of SPL characteristics under different leakage directions.
Leak PositionSPL on Leakage Hole AxesOverall SPL
Max/dBAverage/dBMax/dB
Top27.79213.251100.777
Bottom26.6809.442105.103
Side25.0719.210105.834
Table 15. Average dynamic pressure and average turbulent kinetic energy for the buried pipeline under different soil types.
Soil TypeAverage Dynamic Pressure/PaAverage Turbulent Kinetic Energy/(J/kg)Overall SPL
/dB
Sandy31,31441.326156.151
Loam34154.109132.414
Clay3610.355107.739
Table 16. Average dynamic pressure and average turbulent kinetic energy for the buried pipeline under different leakage directions.
Leak PositionAverage Dynamic Pressure/PaAverage Turbulent Kinetic Energy/(J/kg)Overall SPL
/dB
Top3414.874.109132.414
Bottom3336.773.978132.803
Side3400.813.968131.659
Disclaimer/Publisher’s Note: The statements, opinions and data contained in all publications are solely those of the individual author(s) and contributor(s) and not of MDPI and/or the editor(s). MDPI and/or the editor(s) disclaim responsibility for any injury to people or property resulting from any ideas, methods, instructions or products referred to in the content.