Article

Radial Temperature Distribution Characteristics of Long-Span Transmission Lines Under Forced Convection Conditions

1
Hubei Key Laboratory of Disaster Prevention and Mitigation, China Three Gorges University, Yichang 443002, China
2
College of Civil Engineering and Architecture, China Three Gorges University, Yichang 443002, China
3
College of Electrical Engineering and New Energy, China Three Gorges University, Yichang 443002, China
4
College of Civil Engineering and Architecture, Wuhan Institute of Technology, Wuhan 430074, China
*
Author to whom correspondence should be addressed.
Processes 2025, 13(7), 2273; https://doi.org/10.3390/pr13072273
Submission received: 6 June 2025 / Revised: 9 July 2025 / Accepted: 14 July 2025 / Published: 16 July 2025
(This article belongs to the Section Energy Systems)

Abstract

This study proposes an iterative method based on thermal equilibrium equations to calculate the radial temperature distribution of long-span overhead transmission lines under forced convection. This paper takes the ACSR 500/280 conductor as the research object, establishes the three-dimensional finite element model considering the helix angle of the conductor, and carries out the experimental validation for the LGJ 300/40 conductor under the same conditions. The model captures internal temperature distribution through contour analysis and examines the effects of current, wind speed, and ambient temperature. Unlike traditional models assuming uniform conductor temperature, this method reveals internal thermal gradients and introduces a novel three-stage radial attenuation characterization. The iterative method converges and accurately reflects temperature variations. The results show a non-uniform radial distribution, with a maximum temperature difference of 8 °C and steeper gradients in aluminum than in steel. Increasing current raises temperature nonlinearly, enlarging the radial difference. Higher wind speeds reduce both temperature and radial difference, while rising ambient temperatures increase conductor temperature with a stable radial profile. This work provides valuable insights for the safe operation and optimal design of long-span transmission lines and supports future research on dynamic and environmental coupling effects.

1. Introduction

As electricity demand has increased, improving power quality has become a priority, leading to significant investments in conductor construction and current carrying capacity [1]. Conductor temperature plays a critical role in ensuring the safe operation of transmission systems, as elevated temperatures can affect tension, sag, and mechanical integrity, posing risks such as conductor breakage, insulation damage, power outages, or fires [2]. A notable example of this was a transmission line failure in California in 2018, which caused wildfires and widespread power outages [3]. Therefore, accurate calculation of conductor temperature distribution is essential for safe operation and system reliability [4].
Conductor temperature distribution has been a key focus in transmission line engineering, with various methods developed to model and predict temperature behavior. These methods include measurement-based techniques, thermoelectric equivalent models, numerical simulations, AI-driven models, and analytical approaches. Measurement techniques, like Brillouin optical time-domain reflectometry, offer valuable real-time data on temperature rise but are limited by equipment and scalability [5,6,7]. Thermoelectric models simplify heat transfer within conductors but require detailed system parameters and computational effort [8,9,10,11,12]. Numerical simulations, particularly those using electrothermal coupling and finite element analysis, provide high precision but are limited by boundary conditions and computational constraints [13,14,15,16]. AI-based models, such as particle swarm optimization and neural networks, offer promising results but are limited by data quality and computational resources [17,18].
Analytical methods, such as those by IEEE, CIGRE, and IEC 60853-1 [19,20,21], remain practical for conductor temperature calculations but may lack precision for complex systems. These methods are valued for their simplicity and directness [22]. Several studies have improved temperature monitoring in transmission lines by considering materials and environmental conditions. For example, Liang [23] analyzed insulation impact, Petrov [24] refined hysteresis loss calculations in circular core conductors, Brakelmann [25] studied conductor temperature variations under variable loads based on IEC standards, and Zaręba [26] developed an analytical expression for temperature distribution in parallel conductors, accounting for skin and proximity effects. Black [27] proposed a model for multi-layer conductor temperature gradients. Morgan [28] introduced a method for correcting radial thermal conductivity, while Jakl [29] developed an electromagnetic–thermal coupling model for ACSR conductors. Absi Salas [30] applied particle filtering algorithms for dynamic temperature estimation using infrared data.
These studies provide a strong theoretical foundation for radial temperature distribution, but traditional methods have two key limitations: they treat conductors as isothermal entities and are less suited for large-section conductors, especially in long-span lines where inner and outer layer temperature distribution remains poorly understood. This study proposes a novel method for calculating radial temperature distribution, addressing these limitations. A three-dimensional finite element model of large span is established to analyze the radial temperature distribution characteristics. The study also investigates factors such as current carrying capacity, wind speed, and ambient temperature on temperature stratification. The major novelty of this work lies in its combined use of an iterative thermal equilibrium method and a three-dimensional finite element model that accounts for the helical structure of multi-layer conductors, enabling accurate characterization of radial temperature gradients under forced convection.

2. Calculation of Layered Temperature of Large Span Conductors

This section outlines a method for calculating radial temperature in long-span transmission lines. Accurately determining the heat absorption and dissipation of strands involves factors like solar radiation, current carrying capacity, and convection. These factors are essential for the steady-state thermal balance equation of the conductor. The radial temperature distribution is calculated using an iterative method based on Taylor’s formula. This approach goes beyond traditional methods by deriving an original formula to optimize the expression based on classical heat transfer theory, constructing a system of coupled equations for multilayer strands to solve the conductor’s internal temperature field, and innovatively applying the iterative model to the temperature calculation of transmission conductors, adapting it to specific parameters. These advancements extend the application boundaries of existing methods.

2.1. Wire Heat Dissipation Power

In this study, the electric field strength remained below the corona discharge threshold, so its impact on wire temperature was minimal. By excluding corona heating, the focus shifted to Joule heating and current-induced heat conduction. Figure 1 shows the conductor’s thermal changes, with continuous cycles of heat absorption and dissipation that enable cooling. The conductor’s temperature fluctuates due to solar radiation, Joule heating, heat conduction, and dissipation, with the rate and efficiency influenced by material properties, shape, size, and environmental conditions like temperature, humidity, and wind speed.
Solar radiation intensity varies over time and is influenced by the climate, making it essential to consider the energy absorbed by the conductor in temperature distribution analysis. The amount of solar radiation energy (Qs) absorbed by a conductor depends on its surface absorption coefficient, solar radiation intensity, surface orientation, atmospheric attenuation, and geometric parameters. Among them, atmospheric attenuation and radiation direction have little effect on the calculation results of the conductor temperature, which increases the iteration complexity. Therefore, ignoring these two factors, the following simplified formula is adopted.
Q s = α J D
where α represents the solar heat absorption coefficient of the conductor surface, roughly equal to its radiation heat dissipation coefficient: 0.23~0.43 for new wires and 0.90~0.95 for old, discolored wires. J denotes solar intensity in watts per square meter and can be found using the solar intensity curve [31]. D is the total diameter of the conductor in meters.
According to the thermal effect of electric current, the Joule heat QJ produced by a unit length of wire is
Q J = I 2 R
in which I denote the current through the conductor in amperes. The value of I is determined by the structural characteristics of the steel-core aluminum stranded wire and the resistance’s series-parallel configuration. The total current through the outer aluminum wire and inner steel core of the stranded wire can be calculated separately. R indicates the wire’s resistance per unit length in ohms.
The resistance of a wire is significantly affected by its temperature and can be adjusted according to the temperature coefficient. When direct current flows through a conductor, its resistance per unit length is
R dc = R 20 [ 1 + α 20 ( T n T 0 ) ]
where Rdc denotes the resistance value corresponding to the temperature Tn of the nth layer conductor. The term α20 refers to the temperature coefficient of the material when the conductor’s temperature is 20 degrees Celsius. Specifically, αal is 0.00403 °C−1 for aluminum, while αga is 0.00651 °C−1 for steel. Additionally, R20 represents the direct current resistance of the conductor at a temperature of 20 degrees Celsius. T0 denotes the initial temperature of the conductor, typically set at 20 °C. When no current flows through the conductor, its temperature is equivalent to that of the surrounding medium.
When an alternating current passes through a conductor, the skin effect must be considered in resistance calculations. Alternating current concentrates on the wire’s surface. The wire’s resistance value, Rac, is
R ac = ζ I τ R 20 [ 1 + α 20 ( T n T 0 ) ]
where ζ and τ are the conductor model correction coefficients [32].
During operation, the conductor absorbs Joule heat from thermal radiation and electrical current and undergoes internal heat conduction. This causes heat to transfer from the central steel layer to the outer aluminum strands. This process is linked to the temperature gradient between the conductor’s layers and the material’s thermal conductivity. Let r denote the radius from the center of the conductor to the outer boundary of the nth layer of strands. The total heat conduction power per unit length of two adjacent strands in the largest span transmission line is given by [33]
Q k n = k A ( T n T n 1 ) d n 1
in which TnTn−1 denotes the temperature difference between the interior and exterior of two adjacent layers of wire. The variable k signifies the thermal conductivity of the material, while A represents the heat transfer area of the wire. The heat transfer contact area between the (n − 1)-th layer and the nth layer of wire strands can be approximated as the total lateral surface area of the (n − 1)-th layer of annular wire strands.
A = 2 π r n h
Here, rn represents the distance from the heat transfer area to the center of the wire’s cross-section, while h denotes the axial heat transfer length of the wire. In Equation (5a), dn−1 refers to the distance over which heat is transferred between objects, where the heat transfer distance in the wire corresponds to the center-to-center distance between the two layers of wire strands.
d n 1 = r n + r n 1
where r′n represents the radius of an individual wire in the nth layer. The relationship between different variables during heat conduction is shown in Figure 2.
The conductor will release heat to the environment because of its temperature. This phenomenon is affected by the conductor’s surface and ambient temperatures. The radiation power QR emitted by the conductor during operation is expressed as follows:
Q R = π D ε σ [ T 1 4 T 0 4 ]
where ε is the radiation heat dissipation coefficient of the conductor surface; σ is the Stefan–Boltzmann constant, with a value of σ = 5.67 × 10⁻⁸ W/m; T1 is the surface temperature of the wire; and T0 is the ambient temperature, both in absolute temperature (Kelvin). The values can be converted from degrees Celsius, Ti (K) = ti (°C) + 273, i = 1, 2.
Convection heat dissipation in long-span transmission lines is classified as natural or forced convection. Forced convection heat dissipation is mainly affected by wind speed. The formula for calculating the heat dissipation due to strong convection in conductors is as follows [34]:
Q F = 9 . 92 Δ T ( V D ) 0.485
in which ΔT denotes the temperature difference between the conductor at steady state and its initial state, while V represents the wind speed perpendicular to the conductor, measured in meters per second (m/s).
This study calculates the increase in internal energy of wire strands in response to temperature variations, based on the mass and specific heat capacity of the material. The increase in internal energy of each wire strand layer, ΔUn, reflects the energy absorbed or dissipated during operation. The formula for calculation is below.
Δ U n = m c ( T n T n 1 )
Among the parameters considered, Un denotes the increased internal energy of the nth layer of wire strand per unit length. m signifies the mass of a single wire strand per unit length. Additionally, c represents the specific heat capacity of the wire material, with values of c = 0.88 × 10³ J/(kg·°C) for aluminum and c = 0.46 × 10³ J/(kg·°C) for steel.

2.2. Radial Temperature Heat Balance Equation

In steady-state operation of a long-span transmission line, the conductor’s heat absorption and dissipation achieve thermal equilibrium. Thermal equilibrium is achieved among the strands of the conductor, leading to uniform temperatures throughout [35,36]. The outermost aluminum strands of the conductor are the first layer, and the innermost steel core is the nth layer, as shown in Figure 3. The equations for thermal equilibrium in a long-span overhead conductor with n layers of strands are as follows:
Q J + Q s = Q R + Q F + Δ U Δ U 1 = Δ U 2 + Q k 1 Δ U n 1 = Δ U n + Q k ( n 1 )
By integrating heat sources, dissipation modes, and heat balance equations, the radial temperature of the long-span transmission conductor can be accurately calculated.

2.3. Analytical Model of Radial Temperature in Conductors

Calculating the radial temperature distribution in large-span transmission lines is complex due to nonlinear heat balance equations, which make direct solutions challenging. Traditional iterative methods, such as linearized numerical calculations and stepwise approximation, can estimate temperature distribution under certain conditions. However, they often neglect thermal coupling between layers and the nonlinear effects of convective radiation, leading to less accurate results, particularly for long-span conductors with multi-layer structures and significant thermal conductivity inhomogeneity. An iterative method using Taylor’s expansion achieves high-precision results with few iterations, simplifying the solution of nonlinear equations. The Taylor expansion method approximates functions by expanding them around a specified point, improving the accuracy of the solution [37].
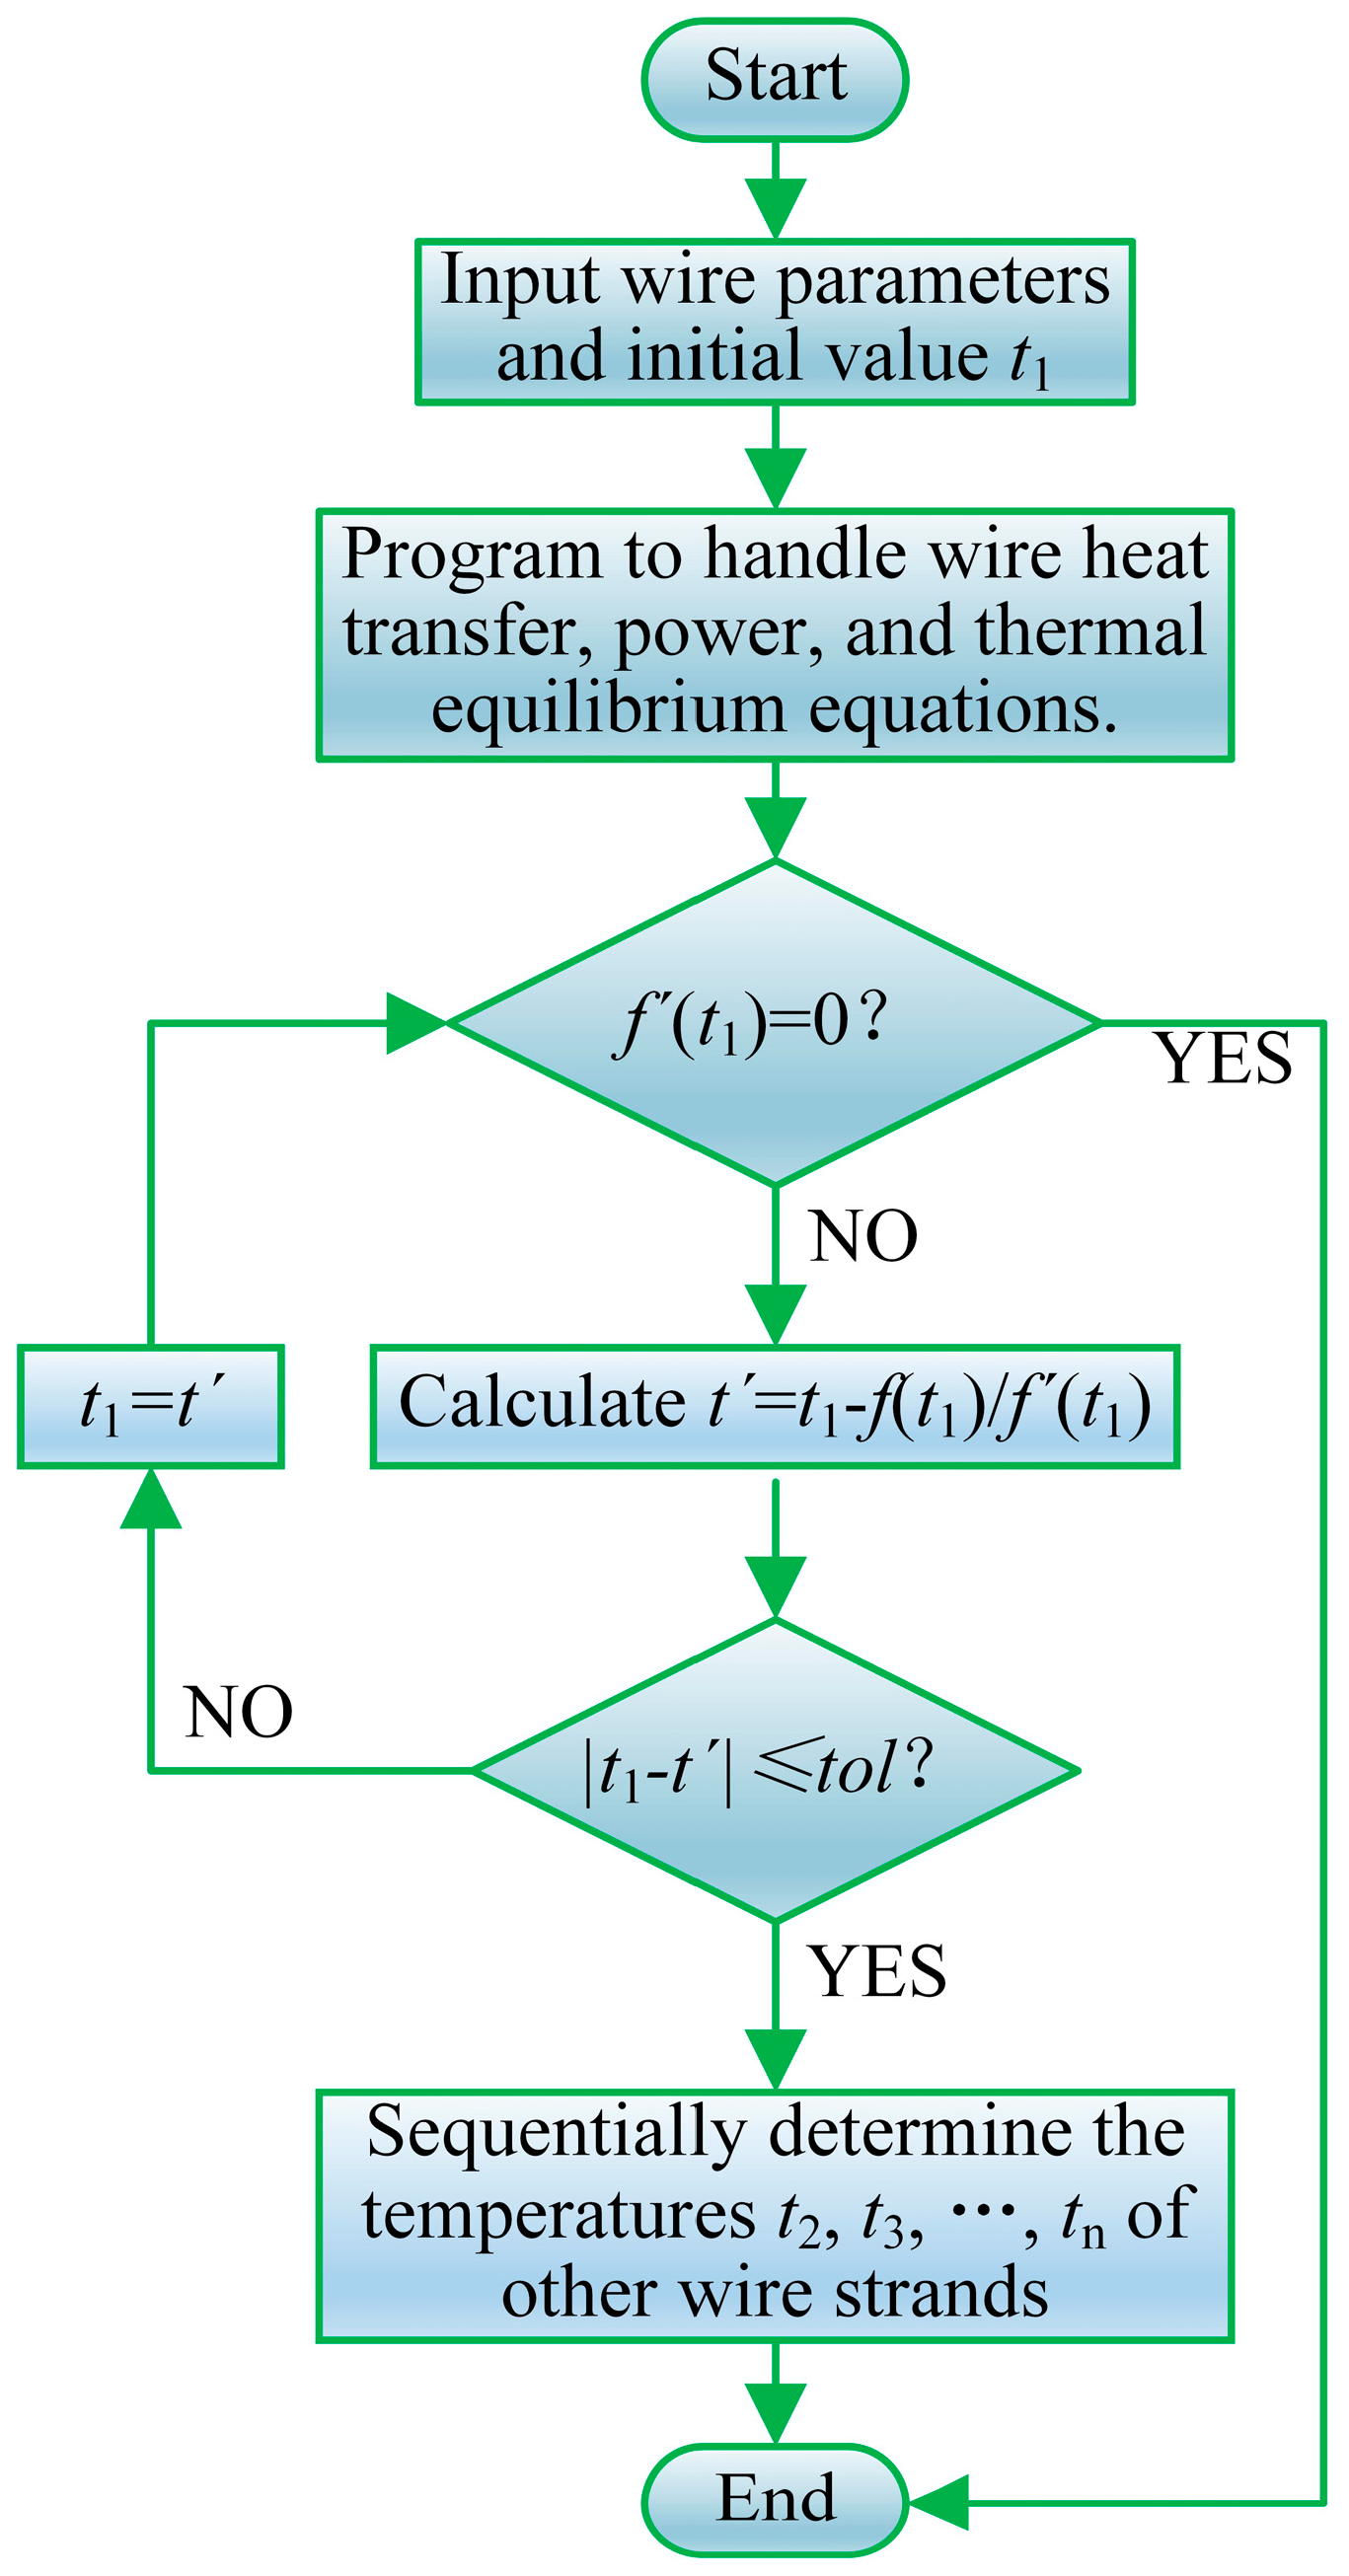
To determine the conductor’s temperature distribution, Equation (10) is used to calculate the temperature of the outermost layer, t1, followed by sequential calculations of temperatures t2, t3, …, tn for each inner layer. This equation is obtained by the equivalent transformation of the first equation of the system of heat balance equations in Equation (9), where the root of the functional expression f(t) on the left side of the equation is the surface temperature of the wire, and on the right side of the equation is the heat source term that has already been solved for in the previous results. The iteration tolerance is set to tol = 1 × 10⁻¹⁰ because it offers a good balance between precision and computational cost. The surface temperature t1 is determined through iterations until the residual is smaller than the specified tolerance.
f ( t ) = Q J + Q s Q R Q F Δ U
In this study, the fsolve function in MATLAB 2022a is employed to solve the nonlinear system arising from the theoretical iterative model. In order to eliminate the concern about the repeatability of the calculation, we choose the default ‘trust region-dogleg’ algorithm of the function, which has robust convergence in nonlinear systems, and set a strict termination error of tol = 1 × 10⁻¹⁰ and maximum iteration limit of 1000 times to balance the computational efficiency and accuracy. The initial value is set to 40 °C based on historical experience. The iterative process for conductor temperature is shown in Figure 4.

3. Finite Element Model of Radial Temperature Field of the Conductor

The finite element method (FEM) is well-established for solving complex heat transfer problems involving intricate geometries and coupled physics. Its capability to accurately model thermal phenomena in conductors has been demonstrated in prior work [38]. Building upon this foundation and leveraging the strengths of FEM in handling complex geometries and boundary conditions, we developed a three-dimensional FEM model specifically tailored to capture the radial temperature distribution within the ACSR conductor, explicitly incorporating the helix angle of the aluminum strands. This section validates the iterative calculation of the conductor’s radial temperature using a finite element model, including boundary conditions, initial temperature settings, and meshing.

3.1. Basic Assumptions and Boundary Conditions

The numerical temperature simulation follows the “Round Wire Concentric Stranded Overhead Conductor” (GB/T 1179-2017) [39]. Each strand material has uniform, linear, isotropic electrical and thermal conductivity, without extrusion or deformation. Convection heat dissipation between strands is neglected, while heat convection between the outer aluminum strands and air is considered forced convection. The conductor is modeled in an infinite space 100 mm long with a three-dimensional geometric model.
In the ANSYS 2022 R1 Icepak simulation, the boundary layer tool is essential for setting up boundary conditions, as it influences heat conduction and convective heat transfer near the conductor surface. Neglecting the boundary layer effect can cause deviations in the temperature distribution, especially near the surface. This study models the temperature field at the conductor strand boundary using the contact thermal resistance model and local mesh refinement to accurately capture heat conduction characteristics. The default assumption of continuous heat flow is suitable for most scenarios.
The primary heat dissipation mechanisms in long-span transmission lines are forced convection and thermal radiation. The thermal exchange between the wire strands and surrounding air follows the three-dimensional steady-state control equation, based on energy conservation and heat transfer principles. This equation accounts for the conductor material’s thermal conductivity and dimensions as well as the temperature difference between the conductor surface and surrounding air. The heat conduction equation, along with the initial and boundary conditions, are as follows:
k ( 2 T x 2   + 2 T y 2   + 2 T z 2   ) + Q J + Q s = ρ c T t T | t = 0 = T 0 q = k T b = h ( T T 0   ) + ε σ ( T 4 T 0 4 ) + α J
in which, x, y, and z denote the three-dimensional rectangular coordinates. The variable T signifies the temperature of the conductor, while ρ represents the density of the conductor material. The variable t indicates the operating time, and q refers to the heat flux per unit area on the outer surface of the conductor. This heat flux encompasses the contributions from convection, radiation, and solar radiation between the conductor and the surrounding medium. Additionally, b is defined as the unit normal vector on the isotherm at the specified point. The convection heat dissipation coefficient h of the aluminum surface of the conductor is positively correlated with the wind speed V.

3.2. Model Building and Meshing

This study examines the ACSR 500/280 steel core aluminum alloy stranded wire. This wire is commonly used in long-distance, high-voltage transmission lines, significantly impacting conductivity and heat dissipation. The stranded wire consists of a multi-layer spiral configuration with four layers of 37 steel wires and two layers of 48 aluminum wires, twisted together. This structure improves the conductor’s mechanical strength, wind resistance, and anti-icing performance, making it ideal for long-span transmission lines. Table 1 shows the technical parameters of the conductor.
Although the three-dimensional model increases computation time by about 20% compared to a two-dimensional model, we chose it for two main reasons. First, the multi-layer helical structure of the ACSR conductor introduces significant three-dimensional heat flow characteristics, with complex axial and radial heat transfer mechanisms. A two-dimensional model cannot fully capture these, particularly the heat transfer between the conductor’s inner and outer layers. Second, the three-dimensional model allows for effective parameter decoupling, enabling independent analyses of variables such as material properties, environmental conditions, and current distribution, which are valuable for future research.
To analyze the three-dimensional temperature field and current distribution accurately, the center of the innermost steel core strand’s cross-section is set as the coordinate system’s origin. A 3D model of the conductor is created in SOLID WORKS by defining parameters like layers, material properties, strand diameter, and spiral angle. This model replicates the conductor’s geometry and internal structure. After creating the 3D model, it is imported into Design Modeler for refinement and optimization to meet the simulation requirements. The model must be converted to an Icepak-compatible format for thermal simulation. This process adjusts the conductor’s material and structural parameters, integrates models across software platforms, and improves simulation accuracy and efficiency.
The H-D Mesher ensures calculation accuracy and improves mesh quality by generating mixed mesh types, such as hexahedral, prismatic, and tetrahedral meshes. In this context, X represents the transverse direction, Z denotes the longitudinal direction, and Y signifies the axial direction of the wire’s cross-section. The maximum grid unit size is 2 mm for X and Z and 5 mm for Y. The minimum grid spacing is 0.1 mm. Three-dimensional cutting meshing is activated, and step and isotropic multi-level meshing are configured. Refining the mesh in critical areas, like heat sources and boundary layers, ensures adequate resolution.
The finite element mesh of the wire model is shown in Figure 5. The wire contains 3,661,772 units in the computational domain, and the image has 2,860,290 nodes. After the meshing process, the skewness method evaluates the mesh quality. A skewness value near zero suggests that the unit’s shape closely resembles a regular hexagon, indicating superior mesh quality. A high skewness value suggests significant distortion, which may compromise calculation accuracy and stability. The skewness method evaluates a unit’s geometric quality, ensuring that the mesh quality meets standards for finite element analysis. This evaluation is vital for the accuracy and efficiency of the simulation.

3.3. Calculation of Heat Source and Heat Dissipation

The primary heat sources are solar radiation and Joule heating. Solar heat generation can be calculated using Equation (1). J = 1000 W/m2 is commonly adopted conservatively. The conductor absorbs light at −135°, corresponding to the coordinates (−1, 1). This value can be entered into the simulation software. The conductor measures 0.1 m, and Joule heat from an individual strand can be calculated using Equations (2)–(4).
Convection and radiation are the main heat dissipation mechanisms in steel-core aluminum conductors. The volumetric heat dissipation rate of the conductor is constant, with the composite heat dissipation coefficient (λ) of the aluminum layer surface cited in [40].
λ = Q R + Q F ( T T 0 ) A
where A is the lateral area of the conductor per unit length.

3.4. Verification of Iterative Method and Finite Element Method

This subsection validates the theoretical iterative and finite element methods by comparing the theoretical temperature results with experimental data for the LGJ-300/40 steel-cored aluminum stranded conductor [41], under identical conditions. The conductor consists of 7 galvanized steel wires and two layers of 24 hard aluminum wires (Table 2). Temperature simulations for the ACSR 500/280 conductor are then performed using ANSYS 2022 R1 ICEPAK, and the results are compared with the theoretical iterative method to verify the simulation accuracy, ensuring the methods’ reliability.
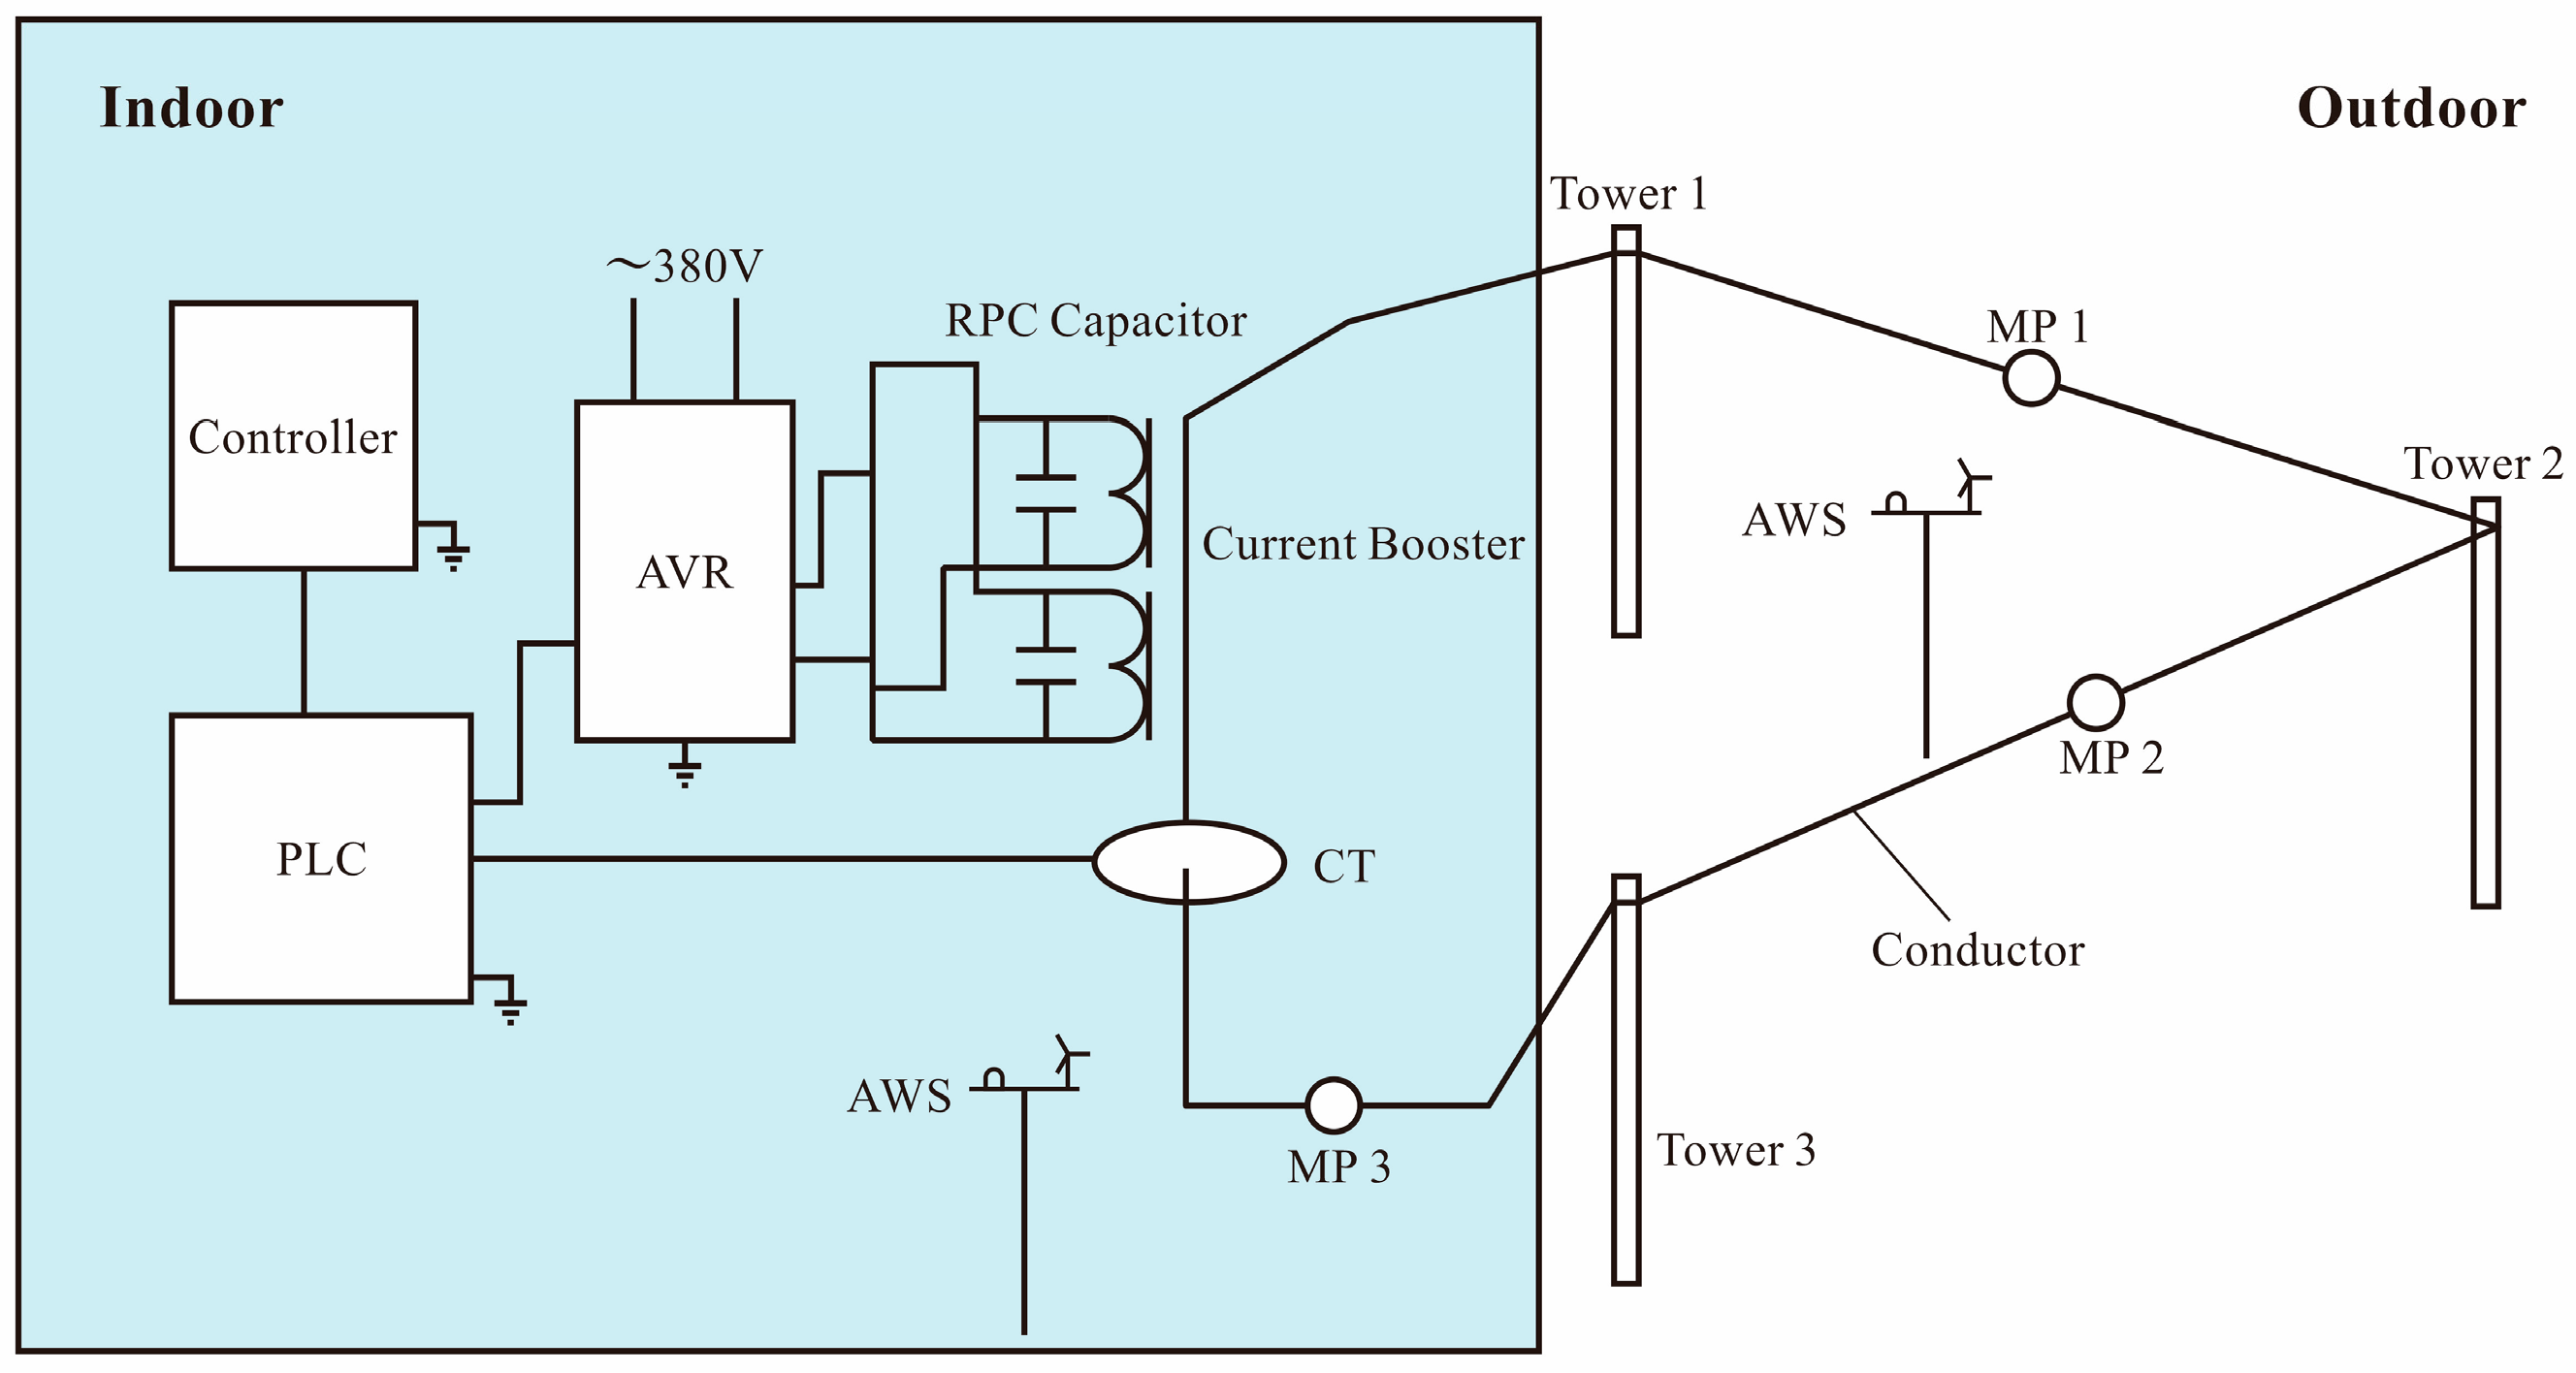
To enhance the verification, this study compares the temperature values of each strand at four current carrying capacities (400 A to 700 A in 100 A steps) and analyzes the absolute error. Figure 6 is a schematic diagram of the high current experimental system device. Among them, the overhead transmission lines used in the experimental system are constructed by three cement towers, connecting indoor and outdoor lines. The system is mainly composed of a steady flow test system, a current lifter, a reactive power compensation power capacitor, a test overhead line, an automatic weather station, and a temperature sensor. The role of reactive power compensation power capacitors is mainly to provide sufficient inductive reactive power to the system so that the system’s up-current capacity is enhanced. The temperature sensor, also known as T-type thermocouple, extends the temperature measuring probe into the wire so that the probe is closely connected with the wire. After the measured temperature value is stable, the data is recorded to improve the reliability of the experiment and reduce the measurement error. The arrangement of temperature measurement points on the surface and within each layer of the wire in the experiment is shown in Figure 7.
The results are shown in Table 3; the absolute error between the theoretical iterative and experimental values is within 3% across all current carrying capacities. The radial temperature variation trend is nearly identical for the same current, and the error meets engineering measurement standards, validating the method’s effectiveness. Potential errors include uniform heat conduction assumptions and measurement inaccuracies, such as sensor placement and precision, which can cause deviations in temperature predictions.
In addition, the maximum error of 2.87% is much smaller than the 21.65% and 14.58% errors from the IEEE and CIGRE maximum standards [42], resulting in an improvement in calculation accuracy of over 80%. This significant improvement in precision is due to the fact that their models simplify the conductor to a concentric cylinder, neglecting the unique internal structure of long-span conductors and the multidimensional heat transfer effects. The simplification used by IEEE and CIGRE overlooks the complex heat distribution in these conductors, which our method captures more effectively by considering the conductor’s detailed structure and the interactions between multiple heat transfer mechanisms. This results in more accurate predictions of temperature distribution, which is crucial for the reliability of long-span transmission line designs. By accounting for these additional complexities, our model provides a much more precise and realistic calculation compared to traditional approaches.
To simulate the temperature distribution of long-span conductors using the finite element method, structural parameters are identified, a three-dimensional solid model is created, the grid is discretized, boundary conditions are applied, and the temperature field is computed. Once accuracy is achieved and convergence is observed, the temperature distribution can be presented.
For verification of the finite element method, the ACSR 500/280 conductor was used with theoretical iterative values as the reference under identical external conditions. At 20 °C ambient temperature, 1 m/s wind speed, and horizontal wind direction along the X-axis, with an effective current of 500 A, the simulation data includes maximum, minimum, and average temperature values for each layer. The average is the temperature across all cross-sections, not the mean of maximum and minimum values. The results are shown in Table 4.
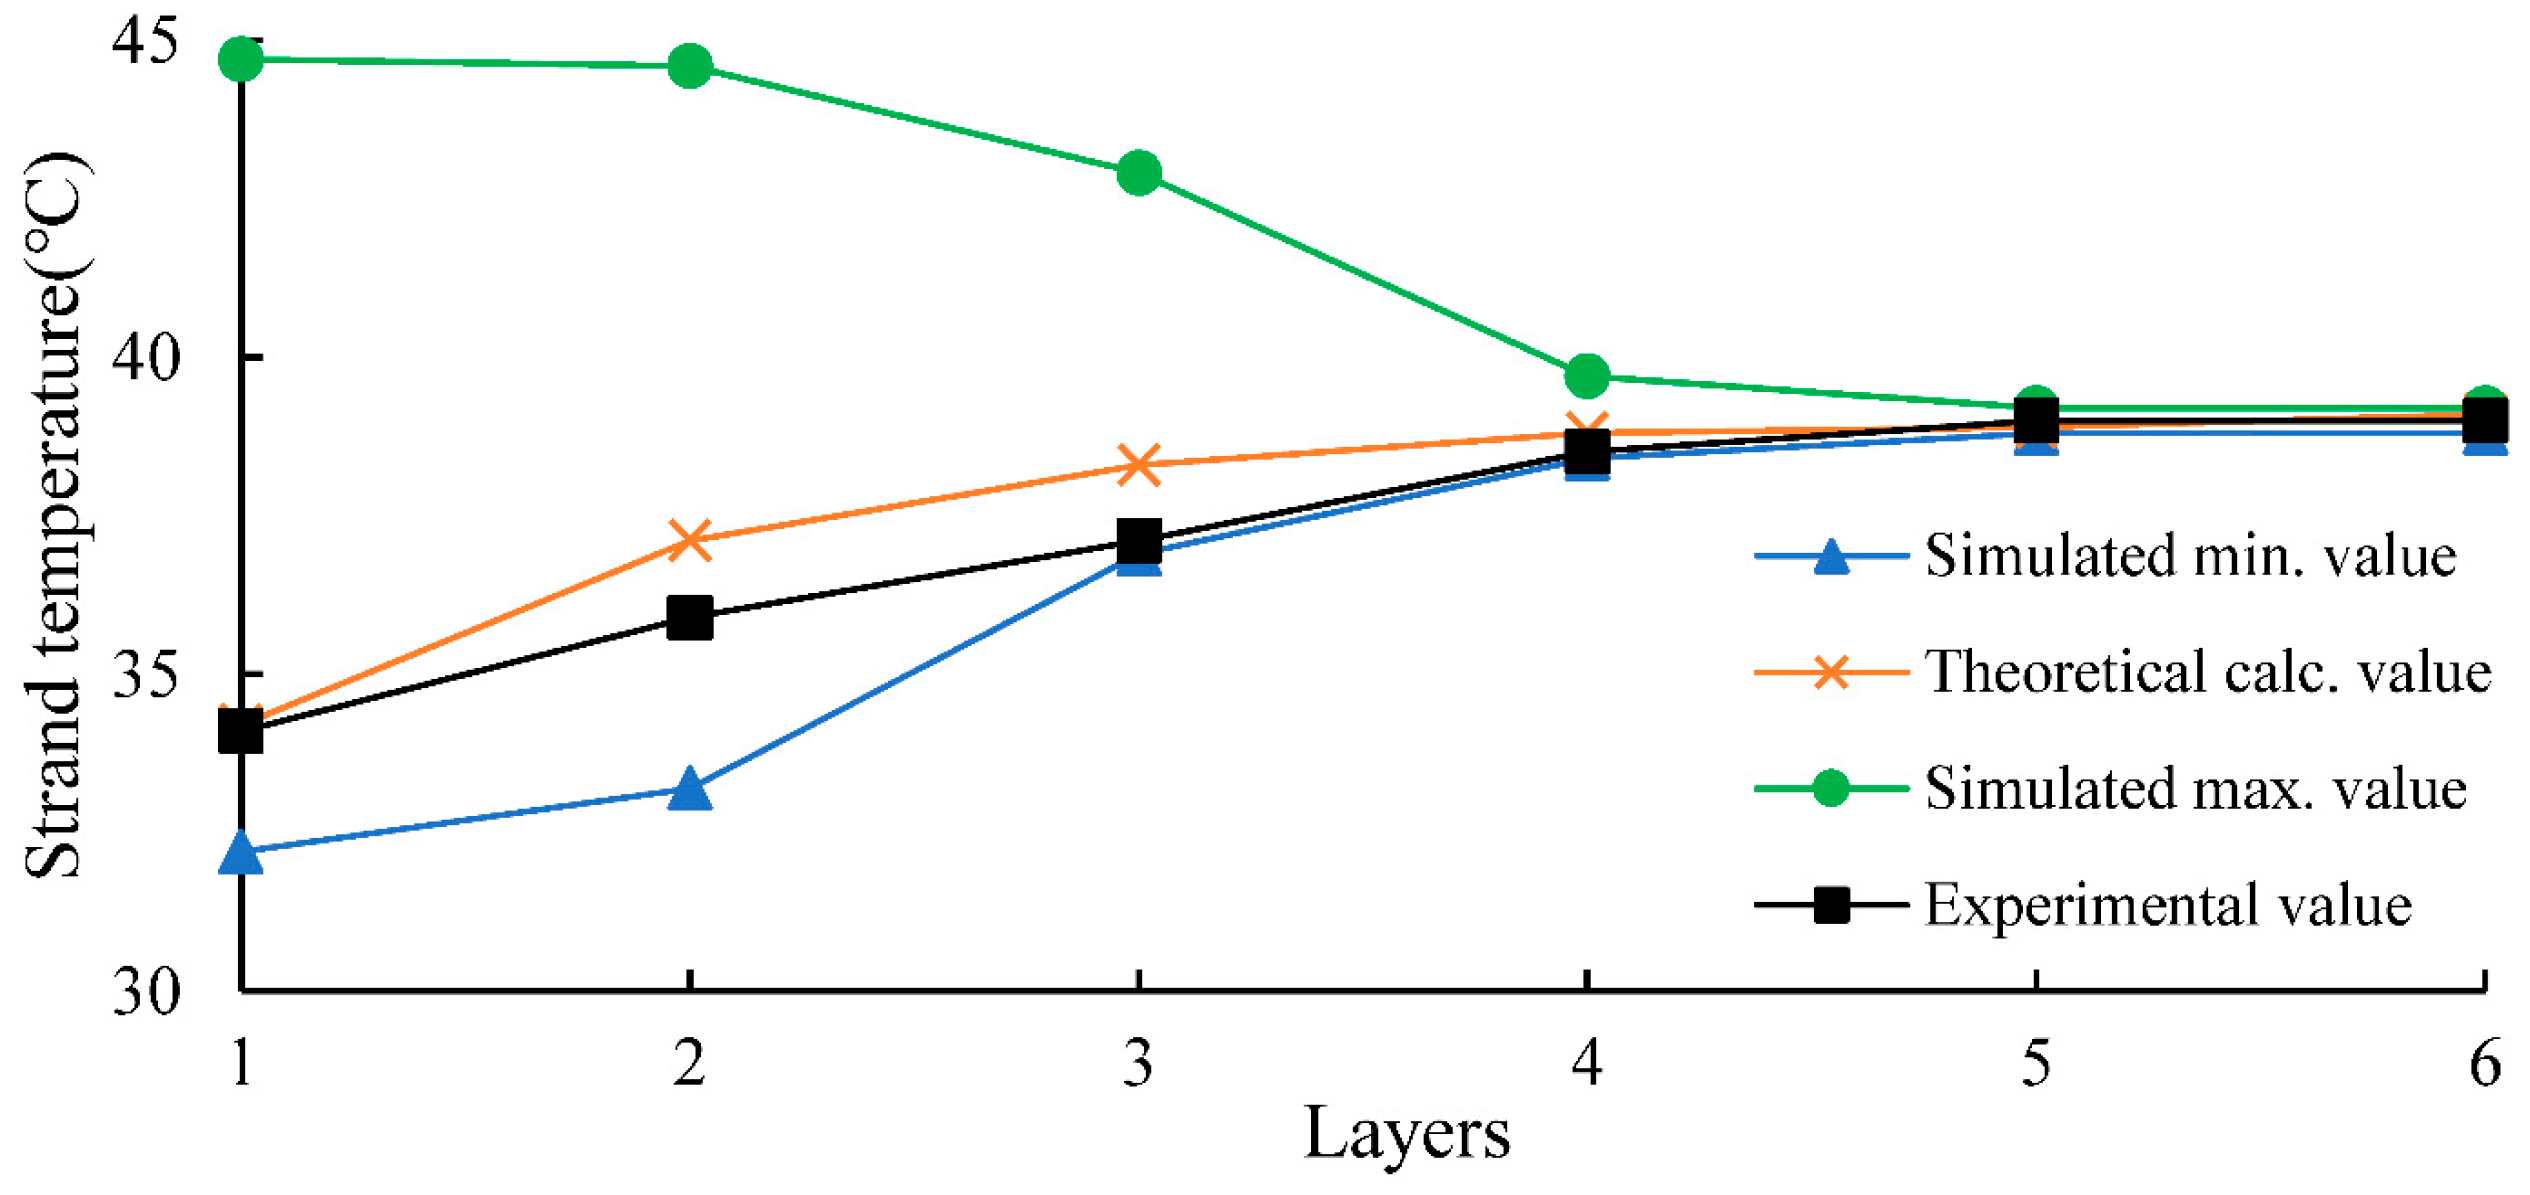
To enable intuitive analysis, the maximum temperature of each conductor strand from Icepak is compared with the theoretical iteration. Figure 8 shows that the theoretical iteration temperatures fall within the simulation’s minimum and maximum values. Additionally, the relative error between the theoretical and simulation average values is under 2.7%, confirming the FEM’s accuracy and validating its effectiveness for analyzing the impact of external conditions on the radial temperature of large-span conductors.
To quantitatively assess the practical value of the proposed method, Table 5 compares the average execution time per simulation case between the theoretical iterative approach and FEM under identical hardware configurations and tolerance. The preprocessing includes the programming of the iterative method and the model construction of the finite element method. The former saves 12 min compared to the latter, and the efficiency is improved by 133%. The iteration time of the theoretical iteration method reaches the level of a few seconds, which is directly obtained through the modular integration program, and the efficiency is improved by several orders of magnitude. The total time efficiency is increased by 255%. This efficiency gain stems from avoiding mesh generation and iterative matrix solving. Such rapid computation enables near-real-time thermal tracking, critical for dynamic line rating systems requiring sub-second updates during transient events like cloud cover shifts. While FEM remains valuable for detailed field analysis, the proposed method offers superior scalability for operational monitoring applications.

3.5. Radial Temperature Analysis

This section analyzes the radial temperature distribution in long-span conductors, focusing on temperature differences between strand layers, key heat transfer processes (i.e., the physical mechanism of heat change, such as heat conduction, radiation, and convection) affecting temperature variation, and a comparison with general conductors (LGJ 240/30).
The temperature distribution in long-span conductors shows significant radial non-uniformity, with the outer aluminum strands at a lower temperature than the inner steel core, resulting in a maximum radial temperature difference of 8 °C. This disparity is due to convective heat dissipation, solar radiation, and the difference in thermal conductivity between aluminum and steel.
Temperature increases from outer to inner layers, reaching saturation. The outer aluminum strands experience more pronounced convective heat dissipation and solar radiation, leading to lower temperatures, while the steel core has minimal temperature variation, with a 0.4 °C radial temperature difference, much smaller than the 7.5 °C difference between the aluminum strands.
The maximum temperature occurs in the conductor’s cross-section where the angle between wind direction and solar radiation is largest. Under conditions of a 0° wind direction and a −135° solar angle, heat accumulation is highest in the leeward area, resulting in the maximum temperature.
The radial temperature distribution shows a three-stage attenuation characteristic. The first three aluminum layers have a steep temperature gradient, with temperatures rising from 32.2 °C to 36.9 °C, accounting for 82% of the overall temperature difference. The fourth layer, at the steel–aluminum interface, shows a sharp drop in the temperature gradient to 0.12 °C/mm. The steel core, in the fifth and sixth layers, has a more uniform temperature distribution, with a minimum temperature difference of 2.3 °C.
This three-stage attenuation mechanism highlights the thermal design challenge: the aluminum layer facilitates heat dissipation but may accelerate material fatigue due to its steep radial gradient, while the steel core buffers temperature variations but may cause axial thermal stress concentration. Finally, a finite element model for the LGJ 240/30 standard conductor was established under identical external conditions [39]. The technical parameters and simulation results are shown in Table 6 and Figure 9.
The simulation results show that under the same environmental conditions, the radial temperature difference in a standard conductor is 1.9 °C, with the outer aluminum strands at 29.6 °C and inner steel strands at 31.5 °C. In contrast, the long-span conductor has a temperature difference of 8 °C, with the outer aluminum strands at 32.2 °C and inner steel strands at 39.2 °C. The long-span conductor exhibits a much higher radial temperature difference and internal temperature, indicating that its unique characteristics are not due to span length alone, but to structural parameters and operating conditions. The large cross-sectional area leads to a nonlinear increase in Joule heat accumulation, and high voltage operation causes the significant radial gradient. Additionally, the kilometer-scale span’s helix angle affects contact thermal resistance. These factors distinguish long-span conductors from the homogeneous thermal behavior of short-span ones. The heat conduction and convective exchange processes in long-span lines are more complex, especially in long-distance transmission. Therefore, while results for standard conductors may be similar, this study focuses on long-span conditions to account for the complexities in practical engineering applications.

4. Analysis of Influencing Factors

This section examines the patterns and mechanisms of the conductor’s radial temperature, considering current carrying capacity, wind speed, and environmental conditions, after verifying the proposed method’s effectiveness. The control variable method analyzes the minimum temperature of each strand, and a finite element model is used for a systematic analysis of influencing factors.

4.1. Effect of Current Carrying Capacity on Radial Temperature of Conductor

The wind affecting the conductor is directed horizontally to the right, with a speed of 1 m/s and an ambient temperature of 20 °C. Since the rated current of a single wire is 610 A when running at 220 KV, the current carrying capacity of the selected wire is increased from 500 A to 750 A in an increment of 50 A. Additional fundamental calculation parameters are in Table 1 and Table 2. The simulation results display the temperature of each conductor layer in a line graph, highlighting the variation in current carrying capacity (Figure 10).
Figure 10 shows that as current carrying capacity increases, the temperature of each strand layer in the large-span conductor rises under forced convection, though not uniformly. The outermost layer heats up more slowly than the innermost layer. As the current increases from 500 A to 750 A, the temperature of the outermost strand rises from 32.2 °C to 41.9 °C (30.1% increase), while the central strands increase from 38.8 °C to 54.8 °C (41.2% increase). The inner strands heat up faster due to reduced heat dissipation, while the outer strands, exposed to ambient air, lose heat through convection and radiation, causing a slower temperature rise.
Figure 10 also shows that increasing current causes a nonlinear rise in the temperature difference between the conductor’s inner and outer strands. When the current carrying capacity is 500 A, the temperature difference between the inner and outer layers is 6.6 °C; when the current carrying capacity is increased to 750 A, the temperature difference is increased to 12.8 °C. This is due to intensified Joule heating in the inner strands, causing rapid heating, while the outer strands heat up more slowly due to heat dissipation. Higher current increases the nonlinear temperature behavior and the differential between the inner and outer layers in large-span conductors.

4.2. Effect of Wind Speed on Radial Temperature of Conductor

In forced convection, heat is removed by moving air. This study examines how varying forced convection conditions affect temperature distribution in large-span conductors while keeping all other parameters constant. The ambient temperature is 20 °C, with an effective current of 500 A through the conductor. The wind speed is aligned with the x-axis and increased from 1 m/s to 11 m/s in 2 m/s increments. The simulation for thermal-fluid coupling in conductors identified the minimum temperature distribution on the windward side of each strand at different wind speeds. The results are shown in Figure 11.
Figure 11 shows that as wind speed increases, the temperature of each strand in the large-span conductor decreases and approaches saturation. The outer layer’s temperature drops less than that of the inner layers. As wind speed increases from 1 m/s to 11 m/s, the outer strands’ temperature decreases by 32.9% (from 32.2 °C to 21.6 °C), while the inner strands’ temperature drops by 39.4% (from 38.8 °C to 23.5 °C). Wind speed enhances heat dissipation, with the outer strands losing heat more rapidly due to air interaction, while the inner strands show a delayed temperature drop due to slower heat transfer.
Figure 11 indicates that the temperature differential between the inner and outer strands decreases nonlinearly with increasing wind speed. At a wind speed of 1 m/s, the temperature difference between the inner and outer layers is 6.6 °C. At a wind speed of 11 m/s, the temperature difference between the inner and outer layers is 1.9 °C. Higher wind speed enhances heat dissipation uniformity from the wire, reducing the temperature gradient between its inner and outer strands. Increased wind speed reduces the temperature nonlinearity of the large-span conductor, resulting in a nonlinear decrease in the temperature difference between its inner and outer layers.

4.3. Effect of Ambient Temperature on Radial Temperature of Conductor

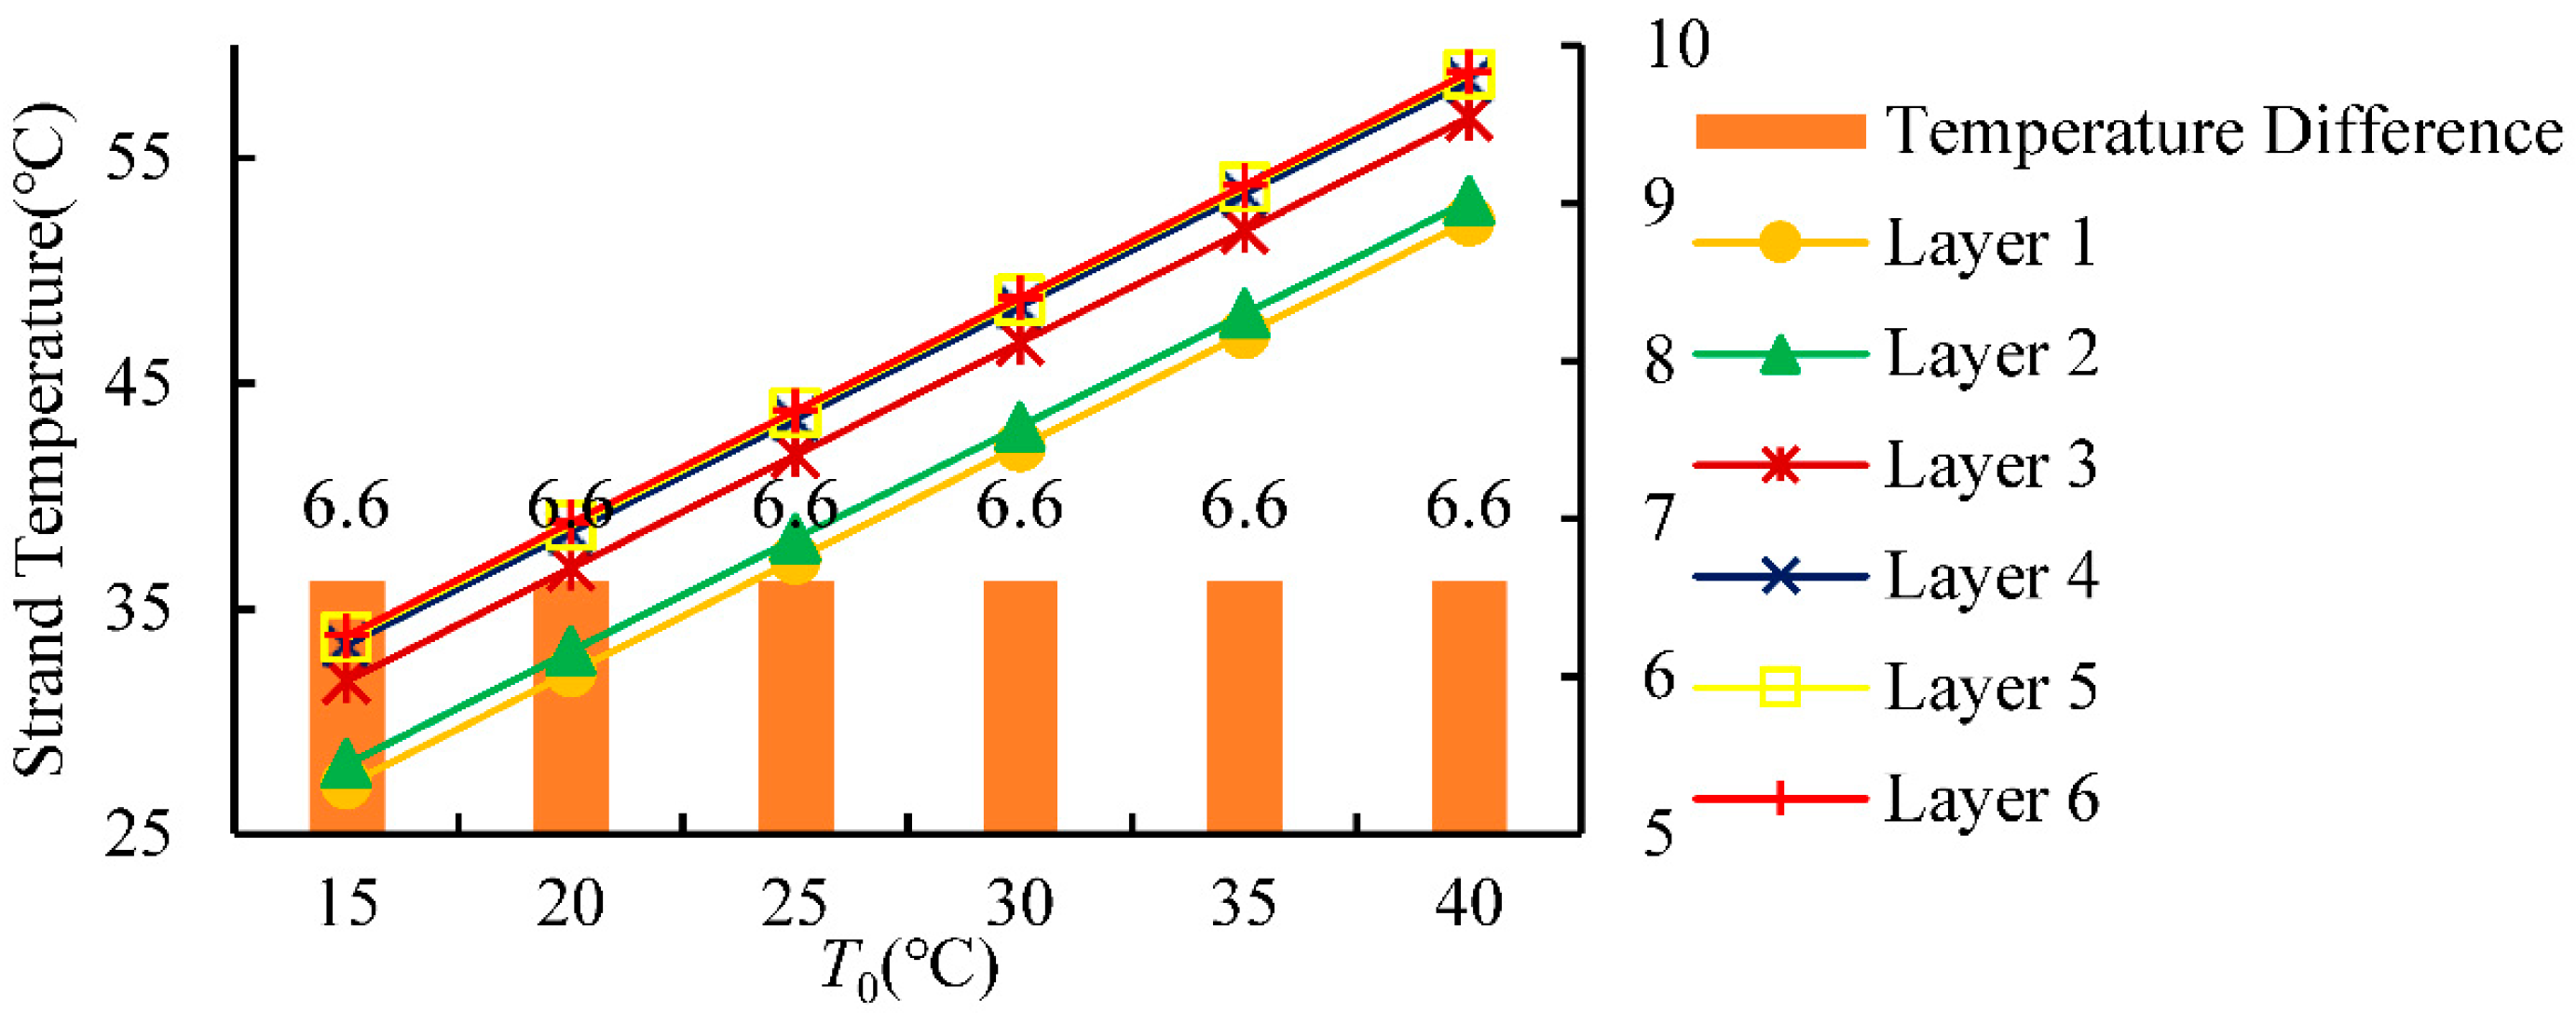
Ambient temperature affects the conductor’s radial temperature. The key influencing factors (i.e., quantitative conditions acting on physical mechanisms, such as strand diameter, thermal conductivity, and wind speed) for temperature field calculation remain constant. The wind blows from left to right at 1 m/s. The effective current through the conductor is 500 A, with the ambient temperature (T0) increasing from 15 °C to 40 °C in 5 °C intervals. The model grid division is set, and the minimum temperature of each conductor strand is calculated for varying ambient temperatures. The calculation results are presented in a line graph. Figure 12 illustrates how ambient temperature affects the conductor’s radial temperature.
Figure 12 shows that higher ambient temperatures increase the temperature of each strand layer in the large-span conductor under forced convection. The temperature differences between the inner and outer layers are roughly equal. As the ambient temperature increases from 15 °C to 40 °C, the outermost strand of the conductor’s temperature rises from 27.2 °C to 52.2 °C. A 25 °C change leads to a 91.9% increase rate. The central strand’s temperature rises from 33.8 °C to 58.8 °C, a 25 °C change and a 73.9% increase. The outcome arises from the conductor’s heat absorption and dissipation properties. The wire material absorbs external heat and dissipates it, resulting in a stable temperature increase.
The figure illustrates that the temperature difference between the conductor’s inner and outer strands remains constant as ambient temperature increases. At 15 °C, the radial temperature difference is 6.6 °C. At 40 m/s, the temperature difference between the inner and outer layers is 6.6 °C. The temperature rise is related to the conductor’s heat generation and dissipation, not the initial ambient temperature. Ambient temperature changes do not affect the temperature differential between a conductor’s inner and outer strands but cause a linear increase in overall temperature. As ambient temperature rises, the large-span conductor’s temperature increases linearly, with a constant difference between its inner and outer layers.

5. Conclusions

The main conclusions of this study are as follows:
(1) It is proved by simulation and experiment that the proposed method can accurately calculate the radial temperature of large-span transmission lines.
(2) The temperature gradient of the outer aluminum wire of the large span conductor is higher than that of the inner steel core, but its temperature value is lower than that of the steel layer. The maximum radial temperature difference is 7, which has three-stage attenuation characteristics.
(3) The ampacity has a nonlinear positive correlation with the conductor temperature and temperature difference, and the wind speed has a negative correlation with it. The increase in ambient temperature will make the wire temperature rise linearly, but the radial temperature difference is almost constant.
The research results provide a theoretical basis for thermal design optimization, increased dynamic capacity for decision-making, and anti-fatigue characteristics analysis of EHV transmission lines. In the future, a more reliable temperature prediction system can be developed in combination with meteorological data.

Author Contributions

Conceptualization, F.W. and C.S.; methodology, F.W. and C.S.; software, C.S. and Z.L.; validation, X.C. and Z.L.; formal analysis, C.S. and Z.L.; investigation, C.S. and Z.L.; resources, F.W.; data, F.W. and C.S.; writing—original draft preparation, C.S.; writing—review and editing, F.W. and X.C.; visualization, C.S.; project administration, F.W. All authors have read and agreed to the published version of the manuscript.

Funding

This study received funding from the National Natural Science Foundation of China (Grant Number 51778343) and the 111 Project of Hubei Province (Grant Number 2021EJD026); Research project of China Energy Construction Group Planning and Design Co., (No. GSKJ2-D03-2020).

Data Availability Statement

The original contributions presented in this study are included in the article. Further inquiries can be directed to the corresponding author.

Conflicts of Interest

The authors declare no known competing financial interests or personal relationships that could have influenced the work reported in this paper.

References

  1. Meyberg, R.A.; de Barros, M.T.C.; Lima, A.C.S. New approach for ampacity calculation of overhead lines with steel-cored conductors. IEEE Trans. Power Deliv. 2022, 38, 1011–1019. [Google Scholar] [CrossRef]
  2. Chen, S.L.; Black, W.Z.; Fancher, M.L. High-temperature sag model for overhead conductors. IEEE Trans. Power Deliv. 2003, 18, 183–188. [Google Scholar] [CrossRef]
  3. Erickson, E.; Slobodin, R.; Poshtan, M.; Taufik, T.; Callenes, J. Using power infrastructures for wildfire detection in California. In Proceedings of the 2020 IEEE Power & Energy Society Innovative Smart Grid Technologies Conference, Washington, DC, USA, 17–20 February 2020; IEEE: Piscataway, NJ, USA, 2020; pp. 1–5. [Google Scholar]
  4. Wang, Y.; Mo, Y.; Wang, M.; Zhou, X.; Liang, L.; Zhang, P. Impact of conductor temperature time–space variation on the power system operational state. Energies 2018, 11, 760. [Google Scholar] [CrossRef]
  5. de Nazaré, F.V.B.; Werneck, M.M. Hybrid optoelectronic sensor for current and temperature monitoring in overhead transmission lines. IEEE Sens. J. 2012, 12, 1193–1194. [Google Scholar] [CrossRef]
  6. Voršič, Ž.; Maruša, R.; Pihler, J. New method for calculating the heating of the conductor. Energies 2019, 12, 2769. [Google Scholar] [CrossRef]
  7. Zhou, J.; Yao, K.; Huang, X.; Zhang, W.; Ashtaq, A.; Hao, Y.; Chen, Y. Temperature calculation and measurement on power cable conductor based on equivalent thermal circuit and BOTDA. In Proceedings of the 2019 IEEE International Conference on Environment and Electrical Engineering and 2019 IEEE Industrial and Commercial Power Systems Europe, Genova, Italy, 11–14 June 2019; IEEE: Piscataway, NJ, USA, 2019; pp. 1–4. [Google Scholar]
  8. Lei, M.; Liu, G.; Lai, Y.-T.; Li, J.-Z.; Li, W.; Liu, Y.G. Study on thermal model of dynamic temperature calculation of single-core cable based on Laplace calculation method. In Proceedings of the 2010 IEEE International Symposium on Electrical Insulation, San Diego, CA, USA, 6–9 June 2010; IEEE: Piscataway, NJ, USA, 2010; pp. 1–7. [Google Scholar]
  9. Feng, K.; Ying, Z.; Tong, X. Radial thermal circuit model for overhead conductors based on parameter identification under natural convection condition. In Proceedings of the 2015 IEEE Power & Energy Society General Meeting, Denver, CO, USA, 26–30 July 2015; IEEE: Piscataway, NJ, USA, 2015; pp. 1–5. [Google Scholar]
  10. Ying, Z.; Kai, F.; Du, Z.; Liu, Y.; Wu, J. Thermal circuit modeling of the relationship between current and axial temperature for high voltage overhead conductor. Proc. CSEE 2015, 35, 2887–2895. [Google Scholar]
  11. Lee, H.B.; Lee, B.C.; Kim, J.H.; Nam, Y.H.; Kang, J.W. Improvement of the conductor temperature calculation algorithm for calculating the allowable current in the underground channel. Trans. Korean Inst. Electr. Eng. 2018, 67, 352–357. [Google Scholar]
  12. Yang, L.; Qiu, W.; Huang, J.; Hao, Y.; Fu, M.; Hou, S.; Li, L. Comparison of conductor-temperature calculations based on different radial-position-temperature detections for high-voltage power cable. Energies 2018, 11, 117. [Google Scholar] [CrossRef]
  13. Yang, X.; Zhu, S.; Qin, S.; Zhan, X.; Zhu, L. Analysis of temperature rise characteristics and current carrying capacity of overhead conductor. In Proceedings of the 2022 IEEE Conference on Electrical Insulation and Dielectric Phenomena (CEIDP), Denver, CO, USA, 30 October–2 November 2022; IEEE: Piscataway, NJ, USA, 2022; pp. 123–126. [Google Scholar]
  14. Kujovič, T.; Ries, R.; Mošať, M.; Gömöry, F. The critical current of REBCO coated conductors subjected to a mechanical loading at varying angles. IEEE Trans. Appl. Supercond. 2023, 33, 1–4. [Google Scholar] [CrossRef]
  15. Zhang, P.; Li, W.; Yang, K.; Feng, Y.; Cheng, P.; Wang, C.; Zhan, H. Condition estimate of contacts of current-carrying conductor in GIS based on the FEM calculation of temperature field. In Proceedings of the 2015 3rd International Conference on Electric Power Equipment—Switching Technology (ICEPE-ST), Busan, Republic of Korea, 25–28 October 2015; IEEE: Piscataway, NJ, USA, 2015; pp. 69–73. [Google Scholar]
  16. Zunec, M.; Ticar, I.; Jakl, F. Determination of current and temperature distribution in overhead conductors by using electromagnetic-field analysis tools. IEEE Trans. Power Deliv. 2006, 21, 1524–1529. [Google Scholar] [CrossRef]
  17. Niu, H.; Jia, Y.; Ye, Y. Calculation of transient cable conductor temperature based on support vector machine optimized by particle swarm optimization algorithm. In Proceedings of the 2016 IEEE International Conference on High Voltage Engineering and Application, Chengdu, China, 19–22 September 2016; IEEE: Piscataway, NJ, USA, 2016; pp. 1–5. [Google Scholar]
  18. Hong, M.; Lu, Y.; Xin, Y. Cable conductor temperature prediction method based on nonlinear auto-regressive model with exogenous inputs neural network. In Proceedings of the 3rd International Conference on Intelligent Power and Systems, Shenzhen, China, 20–22 October 2023; pp. 266–271. [Google Scholar]
  19. IEEE Std 738-2023 (Revision of IEEE Std 738-2012); IEEE Standard for Calculating the Current-Temperature Relationship of Bare Overhead Conductors. IEEE: Piscataway, NJ, USA, 2013.
  20. CIGRE Working Group B2.43. Guide for Thermal Rating Calculation of Overhead Lines; CIGRE: Norwest, NSW, Australia, 2014. [Google Scholar]
  21. IEC 60853-1; Calculation of the Cyclic and Emergency Current Rating of Cables—Part 1: Cyclic Rating Factor for Cables Up to and Including 18/30 (36) kV. IEC: Geneva, Switzerland, 2014.
  22. Kanálik, M.; Margitová, A.; Beňa, Ľ. Temperature calculation of overhead power line conductors based on CIGRE Technical Brochure 601 in Slovakia. Electr. Eng. 2019, 101, 921–933. [Google Scholar] [CrossRef]
  23. Liang, Z.; Jiang, Y. Calculation of electric field and temperature of overhead transmission lines with covered conductors. In Proceedings of the 8th International Conference on Computer Science and Network Technology, Dalian, China, 20–22 November 2020; IEEE: Piscataway, NJ, USA, 2020; pp. 50–54. [Google Scholar]
  24. Petrov, A.; Yang, J. AC Loss Modelling of a CORC Cable via an Analytical Equation and Finite Elements. IEEE Trans. Appl. Supercond. 2023, 33, 1–4. [Google Scholar] [CrossRef]
  25. Brakelmann, H.; Anders, G.J. Transient thermal response of power cables with temperature dependent losses. IEEE Trans. Power Deliv. 2020, 36, 2777–2784. [Google Scholar] [CrossRef]
  26. Zaręba, M.; Szczegielniak, T.; Jabłoński, P. Influence of the skin and proximity effects on the thermal field in a system of two parallel round conductors. Energies 2023, 16, 6341. [Google Scholar] [CrossRef]
  27. Black, W.Z.; Collins, S.S.; Hall, J.F. Theoretical model for temperature gradients within bare overhead conductors. IEEE Trans. Power Deliv. 1988, 3, 707–715. [Google Scholar] [CrossRef]
  28. Morgan, V.T. The radial temperature distribution and effective radial thermal conductivity in bare solid and stranded conductors. IEEE Trans. Power Deliv. 1990, 5, 1443–1452. [Google Scholar] [CrossRef]
  29. Jakl, F.; Žunec, M.; Tičar, I.; Uglešić, I. Distribution of current density in layers of overhead bare conductor. In Proceedings of the Power Systems and Communication Systems Infrastructures for the Future, Beijing, China, 23–27 September 2002; p. 56. [Google Scholar]
  30. Absi Salas, F.M.; Orlande, H.R.; Domingues, L.A.; Barbosa, C.R. Sequential estimation of the radial temperature variation in overhead power cables. Heat Transf. Eng. 2022, 43, 1610–1623. [Google Scholar] [CrossRef]
  31. Mirjalili, S.; Lewis, A. The whale optimization algorithm. Adv. Eng. Softw. 2016, 95, 51–67. [Google Scholar] [CrossRef]
  32. Han, X.; Huang, X.; Zhao, X. Preliminary study on morgan transmission capacity simplified formula of transmission. J. Electr. Power Syst. Autom. 2009, 21, 92–96. [Google Scholar]
  33. Bergman, T.L.; Lavine, A.S.; Incropera, F.P.; DeWitt, D.P. Introduction to Heat Transfer; John Wiley & Sons: Hoboken, NJ, USA, 2011. [Google Scholar]
  34. Li, Y. Calculation of Radial Temperature Difference in Overhead Conductors and Its Impact on Dynamic Capacity Enhancement; Huazhong University of Science and Technology: Wuhan, China, 2018. [Google Scholar]
  35. Liu, J.; Yang, H.; Yu, S.; Wang, S.; Shang, Y.; Yang, F. Real-time transient thermal rating and the calculation of risk level of transmission lines. Energies 2018, 11, 1233. [Google Scholar] [CrossRef]
  36. Maksić, M.; Djurica, V.; Souvent, A.; Slak, J.; Depolli, M.; Kosec, G. Cooling of overhead power lines due to the natural convection. Int. J. Electr. Power Energy Syst. 2019, 113, 333–343. [Google Scholar] [CrossRef]
  37. Argyros, I.K.; Ren, H. A relationship between the Lipschitz constants appearing in Taylor’s formula. Pure Appl. Math. 2011, 18, 345–351. [Google Scholar] [CrossRef]
  38. Brazhenko, V.; Qiu, Y.; Cai, J.; Wang, D. Thermal Evaluation of Multilayer Wall with a Hat-Stringer in Aircraft Design. Stroj. Vestn. -J. Mech. Eng. 2022, 68, 635–641. [Google Scholar] [CrossRef]
  39. GB/T1179-2017; Round Wire Concentric Lay Overhead Electrical Stranded Conductors. Standardization Administration of the People’s Republic of China: Beijing, China, 2017.
  40. Huang, X.; Cui, Y.; Zhu, Y. Analysis of the surface convective heat transfer coefficient of icicle on transmission lines. High. Volt. Eng. 2019, 45, 1975–1981. [Google Scholar]
  41. Liu, Z.L.; Li, H.Z.; Liu, G. Analysis on radial temperature field of overhead conductor based on finite element simulation. Insul. Mater. 2021, 54, 84–90. [Google Scholar]
  42. Hu, J.; Xiong, X.F.; Wang, J. Radial and circumferential temperature calculation method for overhead transmission lines based on thermal network model. Trans. China Electrotech. Soc. 2019, 34, 139–152. [Google Scholar]
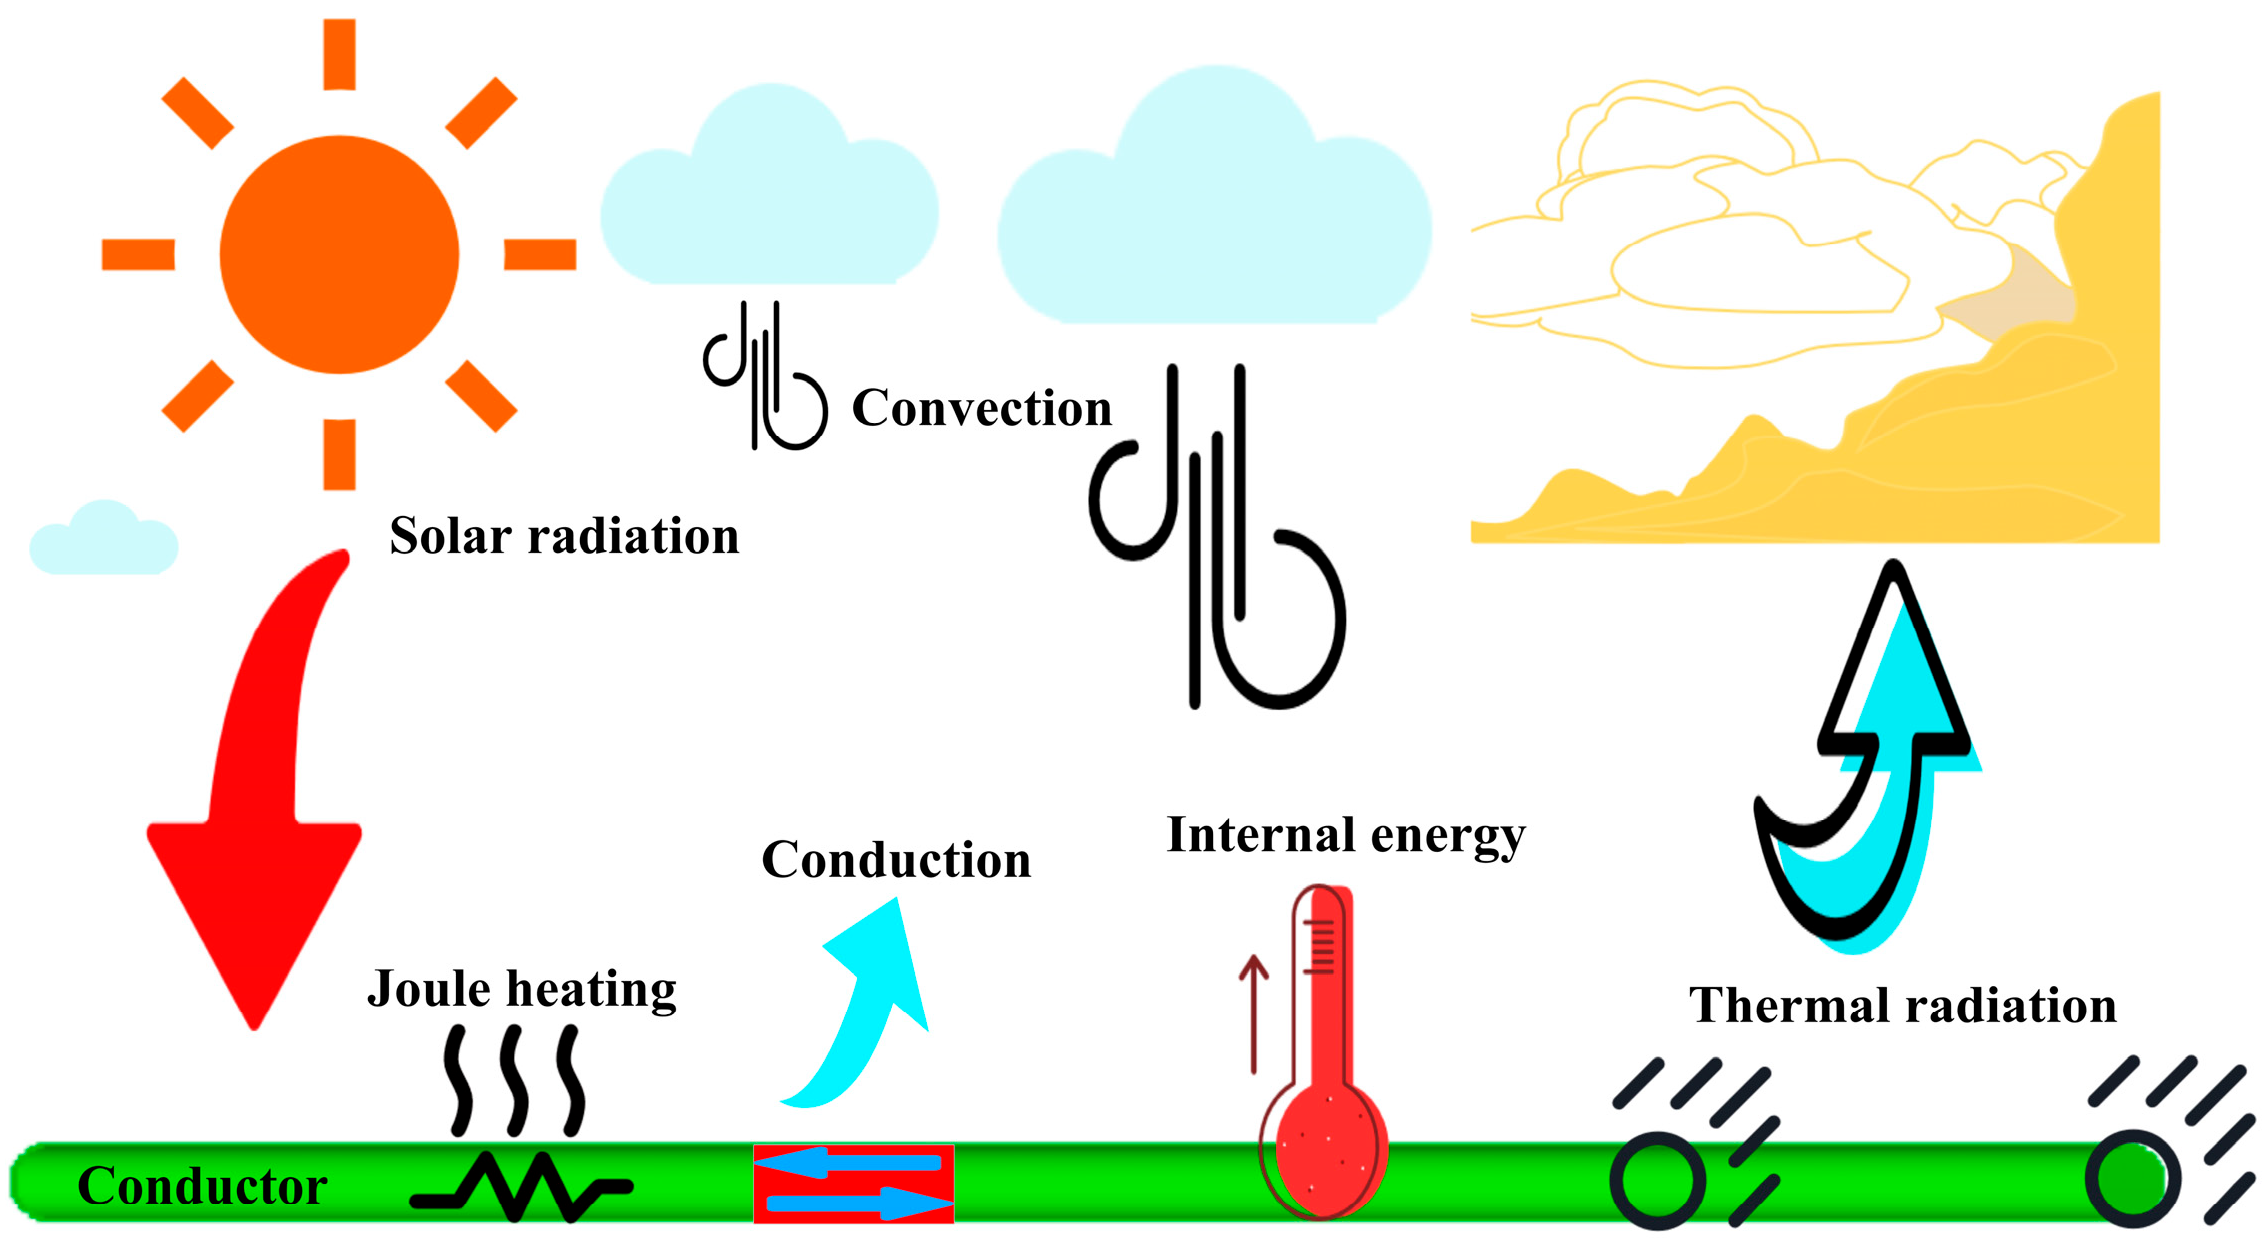
Figure 1. Heat circulation diagram of the conductor.
Processes 13 02273 g001
Figure 2. The variable parameters of heat conduction.
Processes 13 02273 g002
Figure 3. The number of layers in the cross-sectional structure of the ACSR 500/280.
Processes 13 02273 g003
Figure 4. Iterative computational procedure of conductor radial temperature.
Processes 13 02273 g004
Figure 5. The grid division of the conductor.
Processes 13 02273 g005
Figure 6. The schematic diagram of high current up-current system of conductor.
Processes 13 02273 g006
Figure 7. Temperature measurement points for each layer of the conductor.
Processes 13 02273 g007
Figure 8. Conductor temperature from simulation and theoretical solution.
Processes 13 02273 g008
Figure 9. LGJ 240/30 temperature cloud diagram.
Processes 13 02273 g009
Figure 10. Temperature of each conductor layer at different current loads.
Processes 13 02273 g010
Figure 11. Temperature of each conductor layer at different wind speeds.
Processes 13 02273 g011
Figure 12. Temperature of each conductor layer at different ambient temperatures.
Processes 13 02273 g012
Table 1. Technical parameters of ACSR 500/280.
Technical SpecificationsConductor Material
AluminumSteel
Cross-sectional area (mm2)499.5282.88
Structural composition4837
Diameter of single strand (mm)3.643.12
Material density (kg/m3)27007800
Specific heat capacity (J/(kg·K))880460
Electrical resistivity (nΩ·m)16.9826.34
Temperature coefficient (°C−1)0.0040.0065
Thermal conductivity (W/(m·K))22645
Table 2. Technical parameters of LGJ-300/40.
Technical SpecificationsConductor Material
AluminumSteel
Cross-sectional area (mm2)300.0938.9
Structural composition247
Diameter of single strand (mm)3.992.66
Material density (kg/m3)27907780
Specific heat capacity (J/(kg·K))881470
Electrical resistivity (nΩ·m)28.26191.57
Temperature coefficient (°C−1)0.004030.00455
Thermal conductivity (W/(m·K))17043
Table 3. Comparison of theoretical iteration value and experimental value.
Current (A)Experimental Value (°C)Iteration Value (°C)Absolute Value Error (%)
T1T2T3T4T1T2T3T4T1T2T3T4
40036.537.438.438.436.137.538.338.31.100.270.260.26
5004849.450.850.846.848.649.949.92.501.621.771.77
6005961.263.163.158.660.563.963.90.681.141.271.27
70073.476.679.179.172.574.477.877.81.232.871.641.64
Note: Absolute value error = |TiteTexp|/Texp × 100%.
Table 4. Comparison between FEM and theoretical iteration value.
LayersMinimum Value of FEM (°C)Theoretical Iteration Value (°C)Maximum Value of FEM (°C)Average Value of FEM (°C)Average Value
Error (%)
L1 (T1)32.234.244.735.1−2.63%
L2 (T2)33.137.144.636.80.81%
L3 (T3)36.938.342.937.91.04%
L4 (T4)38.438.839.738.80.00%
L5 (T5)38.838.939.239.0−0.26%
L6 (T6)38.839.139.239.00.26%
Table 5. Conductor temperature calculation time.
TypeTheoretical Iteration MethodFEM
Pre-processing time9 min21 min
Iterative computation time2 s11 min
Table 6. Technical parameters of LGJ 240/30.
Technical SpecificationsConductor Material
AluminumSteel
Cross-sectional area (mm2)24030
Structural composition247
Diameter of single strand (mm)3.62.4
Electrical resistivity (nΩ·m)28.26191.57
Temperature coefficient (°C−1)0.004030.00651
Thermal conductivity (W/(m·K))22645
Disclaimer/Publisher’s Note: The statements, opinions and data contained in all publications are solely those of the individual author(s) and contributor(s) and not of MDPI and/or the editor(s). MDPI and/or the editor(s) disclaim responsibility for any injury to people or property resulting from any ideas, methods, instructions or products referred to in the content.