Abstract
When planning distributed intelligent power distribution networks, it is necessary to take into account the interests of various distributed generation (DG) operators and power supply enterprises, thereby diversifying and complicating planning models. Additionally, the integration of a high proportion of distributed resources has triggered a transformation in the power flow pattern of active distribution networks, shifting from the traditional unidirectional flow mode to a bidirectional interactive mode. The intermittent and fluctuating operation modes of distributed photovoltaic and wind power generation have also increased the difficulty of distribution network planning. To address the aforementioned challenges, this paper proposes an active distribution network planning strategy that considers the allocation of diverse flexible resources, exploring scheduling flexibility from both the power supply side and the load side. Firstly, a bi-level optimization model integrating planning and operation is constructed, where the upper-level model determines the optimal capacity of investment and construction equipment, and the lower-level model formulates an economic dispatching scheme. Through iterative solving of the upper and lower levels, the final planning strategy is determined. Meanwhile, to reduce the complexity of problem-solving, this paper employs an improved PSO-CS hybrid algorithm for iterative optimization. Finally, the effectiveness and feasibility of the proposed algorithm are demonstrated through validation using an improved IEEE-33-bus test system. Compared with conventional algorithms, the convergence speed of the method proposed in this paper can be improved by up to 21.4%, and the total investment cost can be reduced by up to 3.26%.
1. Introduction
Driven by dual-carbon strategic goals [1], traditional power systems need to evolve and upgrade into new-type power systems that are highly compatible and deeply coupled with renewable energy generation. The active distribution network (ADN) serves as a key technology for the distribution system within the framework of the new-type power system to extensively accommodate low-carbon green electricity [2]. The high-penetration integration of intermittent distributed generation (DG) sources such as wind and solar power exposes the distribution network to significant uncertainties and operational risks. However, ADN integrates various controllable components, including sources, grids, loads, and storage, enabling it to optimize system operation modes, enhance green electricity consumption, and adapt to extreme scenarios and adverse operating conditions through multi-resource active management and flexible regulation.
Conducting optimal planning within the framework of source–grid–load–storage coordination to achieve friendly interaction among various forms of flexible resources is an important means to enhance the distributed photovoltaic (PV) hosting capacity of distribution networks [3]. The temporal–spatial matching characteristics of sources and loads in distribution networks are key factors influencing the distributed PV consumption capacity. Ref. [4] discusses the impact of different types of loads in distribution network regions on PV penetration rates; ref. [5] further evaluates the influence of flexible regulation capabilities of load-side resources on distributed PV consumption. Distributed energy storage can flexibly coordinate the temporal–spatial matching between distributed sources and loads [6], and ref. [7] establishes an optimization model for the siting and sizing of distributed energy storage, effectively improving the capacity penetration limit of PV grid integration. Additionally, the performance of distribution networks is also a critical factor affecting distributed PV consumption. Ref. [8] conducts an assessment of the distributed PV hosting capacity in distribution networks by considering factors such as network reconfiguration, node voltages, and substation capacities in low-voltage distribution areas. It is evident that for distribution networks to adapt to high-penetration access of distributed PV, there is an urgent need to carry out collaborative optimization of multiple resources, including networks, storage, and loads.
In conjunction with the development of distributed energy resources, the existing research on collaborative planning of networks, storage, and loads considers network structural performance from a relatively singular perspective, primarily based on a given distribution network or a set of candidate new feeders [9,10,11,12], with insufficient consideration for the optimization of the topological structure of connection lines between distributed source and load resources in distribution networks. Ref. [13] establishes a flexible interconnection planning model among substation areas for high-proportion PV penetration scenarios but does not account for the collaborative optimization of flexibility resources on the storage and load sides. Ref. [14] enhances the economic efficiency of village-level distributed PV consumption through public energy storage capacity allocation investment and orderly management of electric vehicle loads. Given the difficulty in solving planning problems, numerous improvements have been proposed for algorithms in existing research. Ref. [15] addresses the issue of excessive decision variables and planning difficulties when considering all load points in large-scale distribution networks at once by proposing a distribution network planning method based on load point clustering and partitioning. Ref. [16] employs modern heuristic optimization calculation methods, combined with genetic algorithms, to solve distribution network planning problems while considering both operating costs and reliability. Ref. [17] proposes an intelligent optimization method for distribution network planning based on a fuzzy ant colony algorithm to ensure stable operation and efficient power distribution. Ref. [18] improves the computational speed of the Dijkstra algorithm in distribution network expansion planning by proposing an improved Dijkstra algorithm based on sorting ideas to address the impact of repeated traversal searches of unordered initial data on computational speed. Ref. [19] proposes a network planning method that balances economic and reliability requirements in a multi-objective manner, considering the planning of connection feeder segments and addressing the issue of generating a large number of infeasible solutions when using genetic algorithms to solve combinatorial optimization problems. Ref. [20] proposes a judgment and repair strategy based on operator theory to repair infeasible solutions that do not meet radiation conditions during the iterative process, using an improved bacterial colony chemotaxis algorithm, achieving one-time repair of islands, isolated chains, and looped networks. Ref. [21] employs an improved particle swarm optimization algorithm to address issues of local convergence, low convergence accuracy, and weak convergence ability in distribution network planning. Ref. [22] applies interval and affine algorithms to handle the adaptability of distribution networks under uncertainty conditions, obtaining planning schemes with low constraint violation risks, high reliability, and strong adaptability. To address the issue of excessive investment in network planning, ref. [23] establishes a dual-layer scenario planning model for investment and operation, generating optimal investment plans. Ref. [24] proposes a new urban distribution network feeder planning model considering practical requirements such as costs, addressing the issue that existing distribution system planning models used in academic research cannot be practically applied. Ref. [25] proposes a hybrid method based on a three-phase bus impedance matrix to solve low-voltage planning problems in three-phase distribution systems, considering the optimal integration of battery energy storage systems and different renewable energy sources. Unfortunately, current methods remain limited in terms of robustness under uncertain scenarios and economic optimality with high-penetration renewable energy integration. To address these issues, this paper proposes an active distribution network planning strategy considering diversified flexible resource allocation. The main innovations of this paper are summarized as follows:
- (1)
- This paper constructs a bi-level optimization model integrating planning and operation for power systems with high renewable energy penetration, breaking through the traditional static planning paradigm by establishing a closed-loop iterative mechanism between the planning and operation layers. This approach addresses the challenges of multi-agent interest coordination and coordinated allocation of flexibility resources on both the generation and demand sides. By dynamically coupling equipment investment with operational economics, the proposed method enhances the dynamic adaptability of planning schemes in high-penetration distributed energy scenarios.
- (2)
- This paper designs a hybrid intelligent solving algorithm to tackle the non-convex and high-dimensional characteristics of the model. An improved PSO-CS hybrid optimization algorithm is developed, combining the global search capability of PSO with the local optimization advantages of CS. Through an adaptive parameter adjustment strategy, the algorithm improves convergence speed and solution accuracy, effectively reducing the computational complexity of multi-stage planning problems under complex constraints.
2. A Bi-Level Planning Model for Distribution Networks Considering the Integration of New Energy Sources
This paper adopts the classic bi-level planning model, which consists of upper-level planning and lower-level operations. The decision objects at the planning level are controllable distributed generation (DG) (rated capacity and connection location) and energy storage (rated power, energy capacity, and connection location). The operation level inherits the scheme from the planning level, determines the daily optimal operation modes of various controllable components in typical scenarios, and provides feedback to the planning level.
2.1. Planning-Level Objective Function and Constraints
Distribution network planning first requires the determination of typical days to characterize the fluctuation patterns and uncertainties of source–load power [26]. Selecting appropriate typical days can both reduce the computational complexity of the problem and improve the economic efficiency of the planning scheme. This paper employs the k-means algorithm to screen typical days. Specifically, the daily load curve, photovoltaic output curve, wind power output curve, temperature time-series data, and other variables are used as input features. The optimal number of clusters is determined through the elbow method combined with silhouette coefficient evaluation to balance the representativeness of typical days and the complexity of the planning model [27]. The clustering results are validated using the silhouette coefficient to assess intra-cluster compactness and inter-cluster separation. Furthermore, economic and reliability indicators of planning schemes under different cluster numbers are compared to determine the final set of typical days. The k-means algorithm is chosen primarily due to its high computational efficiency, fast convergence, and suitability for high-dimensional time-series feature extraction. Compared to hierarchical clustering (high computational complexity) [28], DBSCAN (parameter sensitivity) [29], or Gaussian mixture models (requiring distribution assumptions) [30], k-means offers a better trade-off between clustering performance and computational cost in engineering practice [31]. Additionally, after standardization, the fluctuation characteristics of source–load data can be effectively measured using Euclidean distance, avoiding the limitations of complex kernel functions or probabilistic distribution assumptions, thereby ensuring both the representativeness of typical days and the feasibility of planning solutions [32]. By using time-series data such as output curves of renewables (PV and wind power) and load curves as input features, scenarios with similar fluctuation patterns are clustered into the same group. Compared to complex probability distribution assumptions, k-means relies solely on feature similarity for scenario classification, eliminating the need for predefined distribution forms. This makes it more adaptable to the non-stationary and asymmetric characteristics of renewable energy output.
The objective function of the planning level is to minimize the annual comprehensive economic cost of the distribution network, as shown in Equation (1). The annual comprehensive economic cost mainly includes the annualized investment cost, operation and maintenance cost of various controllable components, and the power purchase cost of the distribution network. The detailed calculation formulas for each part are shown in Equations (2)–(5).
Here, , respectively, represent the annualized investment cost of source–grid–storage controllable components, the operation and maintenance cost of controllable components, and the power purchase cost; i represents the number of distributed power sources. Equation (2) is one component of the comprehensive economic cost (Equation (1)) and is referred to as the annualized investment cost. It is primarily used to calculate the annualized investment costs of distributed renewable energy sources (such as photovoltaic and wind power) and energy storage equipment, including unit power costs, unit energy costs, etc. Equation (1) represents the complete comprehensive economic cost, encompassing investment, operation and maintenance, and electricity purchase costs; d is the conversion coefficient of the annualized value; y is the equipment operation lifespan; r is the discount rate; is the unit power cost of distributed new energy; and are, respectively, the unit energy cost and unit power cost of energy storage; and are, respectively, the conversion coefficients for annual operation and maintenance costs of distributed new energy and energy storage; D is the number of days in a year; is the interactive power between the feeder and the superior grid during period t, with positive values indicating flow towards the feeder and negative values indicating flow towards the superior grid; is the corresponding transaction electricity price. It should be noted that the power purchase cost already covers the grid loss cost and the revenue from energy storage’s low-storage and high-dispatch strategy, so it is not calculated repeatedly; and are, respectively, the active outputs of the photovoltaic and wind power during period t; and are, respectively, their on-grid electricity prices.
The constraints at the planning level include capacity constraints for the controllable components to be planned, with mathematical expressions provided as follows (Equations (6)–(9)):
Here, and , respectively, represent the lower and upper limits of rated active power for DG; and , respectively, represent the lower and upper limits of rated charging (discharging) power for energy storage; and , respectively, represent the lower and upper limits of rated energy capacity for energy storage; and , respectively, represent the lower and upper limits of rated endurance time for energy storage.
2.2. Objective Function and Constraints at the Operational Level
The objective function of the lower-level model primarily takes into account the total network losses and the consumption volume of distributed new energy resources within the ADN system, with the mathematical model presented as Equations (10) and (11) below.
Here, T represents the total number of time periods within the optimization cycle, with a value of 24 taken in this paper; Ploss,t denotes the total network losses across all branches of the ADN during time period t; represents the total load power in the ADN during time period t; N1 signifies the set of all branches in the distribution network; represents the square of the current amplitude on line ij during time period t; Rij indicates the resistance of line ij.
The operation of the distribution network should satisfy the tie–line power constraint (12).
Here, represents the power of the common tie–line in the active distribution network at time period t; and denote the maximum and minimum power for the tie–line interaction, respectively.
To ensure the safe operation of the distribution system, the node voltages and currents flowing through the lines should be controlled within reasonable ranges. The mathematical model for this is provided in Equations (13) and (14).
Here, pr(·) represents the probability that the condition within the parentheses holds true; vi,t denotes the square of the voltage magnitude at node i during time period t; Ui,min and Ui,max are the minimum and maximum allowable voltage values at node i, respectively; is the probability of node voltage violation, which characterizes the confidence level of the chance constraint. Iij,min and Iij,max are the minimum and maximum allowable current values for branch ij, respectively. pr(·) belongs to the chance constraint, which allows for a certain probability of violating the constraint conditions, thus achieving a balance between economy and reliability. pr(·) is a probability constraint function used to handle uncertainty, with the core objective of achieving coordinated optimization of economy and reliability in the planning model by allowing controllable risk levels.
Meanwhile, to reduce the computational complexity of the model, this paper adopts the DistFlow formulation to describe power flow relationships, as shown in Equations (15)–(18). The adopted DistFlow power flow equations (Equations (15)–(18)) are based on the classical branch power flow model, whose mathematical form inherently suits radial distribution networks. These equations implicitly assume the loop-free nature and radial structure of the network through power recursive relationships between parent and child nodes. In the model’s objective function, the optimization process for network losses and node voltage constraints naturally mitigates potential risks from non-radial configurations. Furthermore, practical distribution network planning strictly adheres to radial operation requirements, and this model indirectly reinforces this characteristic through economic objectives. The mathematical form of constraint (14) inherently disregards current direction, focusing solely on magnitude. This enables unified handling of physical limits for both forward and reverse currents, simplifying model complexity.
Here, and represent the active and reactive power at the node i side of line ij during time period t, respectively; Xij is the reactance of line ij; Pj,t and Qj,t represent the active and reactive power injected into node j during time period t, respectively; l denotes the child nodes of node j.
3. Solution Method Based on the PSO-CS Hybrid Algorithm
In active distribution network planning, a series of complex optimization problems need to be addressed, such as determining the capacity of the distribution network and establishing its operational strategies. Solving these problems requires the application of advanced optimization algorithms [33]. The cuckoo search (CS) algorithm is a search algorithm inspired by the brood parasitism behavior of cuckoos. It simulates the cuckoo’s nest-stealing behavior and hatching process by randomly selecting and replacing some solutions, while employing the Lévy flight strategy to enhance the diversity of the search space. Through continuous iterations, it can quickly find the optimal solution in complex optimization problems [34]. Therefore, this study focuses on optimizing the CS algorithm and then integrating the improved CS algorithm with the particle swarm optimization (PSO) algorithm to design a PSO-CS algorithm for solving distribution network planning problems [35]. The flowchart of the CS algorithm is shown in Figure 1 below.
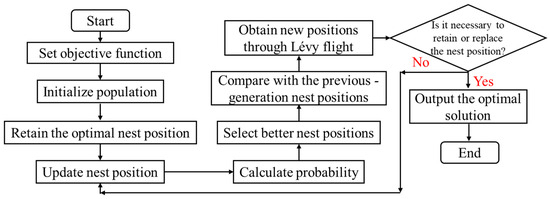
Figure 1.
The flowchart of the CS algorithm.
Taking the objective functions and constraint conditions of the active distribution network as input parameters, and due to the existence of a dual-objective function, the analytic hierarchy process (AHP) is employed to determine the weightings of each objective function. The position of the q-th nest is set as Xq = (xq1, xq2, …, xqn), and the fitness value is calculated to obtain the global optimal solution. The calculation method for updating the nest is shown in Equation (19).
Here, xq(t + 1) represents the position of the q-th nest in the (t + 1)-th generation, while xq(t) denotes the position of the q-th nest in the t-th generation. α signifies the step size factor, ⊕ stands for point-to-point multiplication, and Lévy(η) represents the Lévy flight random search function, with η indicating the relevant exponent of the Lévy flight distribution. Notably, Lévy flight is a type of random walk where the probability distribution of step sizes exhibits a heavy-tailed characteristic, meaning there is a relatively high probability of taking large steps during the random walk. Its calculation method is presented in Equation (20).
Here, Lévy(η)~u represents the distribution of Lévy flight, where u denotes the heavy-tailed power-law distribution function, and r stands for a random number within the range of [−1, 1]. However, the traditional CS algorithm heavily relies on Lévy flight, which tends to result in slower convergence speed. Therefore, the study aims to improve the CS algorithm by optimizing its step size factor. The calculation method for the optimized step size factor is shown in Equation (21).
Here, α0 represents the improved step size factor, xmax denotes the position of the farthest nest, and xmin represents the position of the nearest nest. When a cuckoo’s egg is discovered and abandoned by other birds, the cuckoo will choose to fly a greater distance to lay its egg in a safer location in order to enhance the survival rate of its offspring. This optimization method is referred to as the farthest flight distance optimization. In this scenario, the step size factor can be modified, as shown in Equation (22).
Here, α′0 represents the step size factor for the farthest flight distance optimization. The PSO algorithm is a population-based intelligent optimization algorithm that simulates the behavior of biological swarms, such as bird flocks or fish schools. It searches for the optimal solution by updating the positions and velocities of particles. The calculation methods for the particle velocities and positions are shown in Equation (23).
Here, represents the position of the particle in the m-dimensional space at the (t + 1)-th iteration, while denotes the velocity of the particle in the m-dimensional space at the (t + 1)-th iteration. ω signifies the inertia weight, c1 and c2 represent the acceleration factors, rand (0,1) stands for a random number within the range of [0, 1], represents the best position of the particle, and denotes the current optimal solution of the population. The study aims to enhance the efficiency of optimization problems by integrating the advantages of both algorithms. The flowchart of the PSO-CS algorithm is illustrated in Figure 2.
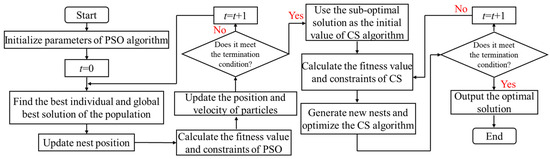
Figure 2.
The flowchart of the CS-PSO algorithm.
The specific values of the constraint boundaries are provided in Table 1.

Table 1.
The specific values of the constraint boundaries.
4. Case Study
This paper employs the IEEE-33 bus system for case validation. The topology of the test system is depicted in Figure 3 below. In this study, the service life of distributed photovoltaic (PV) systems, wind turbine generators, and energy storage systems is set at 10 years. The parameters set are shown in Table 2 below. The IEEE 33-bus system used for case validation is an internationally recognized standard topology for typical radial distribution networks. Its initial structure already satisfies the design requirements of being loop-free and having a single power supply node. During the planning process, the location and capacity optimization of newly added equipment (e.g., distributed generation and energy storage) are based on the existing network topology, without introducing closed-loop structures.
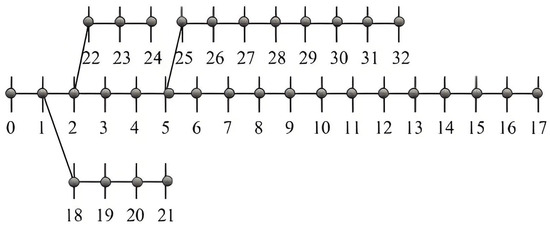
Figure 3.
Topology of the IEEE-33 bus system.
Table 2.
Parameters related to the test system.
To more intuitively demonstrate the advantages of the proposed method in this paper, a comparison of the planning results with other conventional methods [36,37,38] is conducted. The topological structures of the power grid construction under different scenarios are illustrated in Figure 4, Figure 5, Figure 6 and Figure 7 below. Specifically, the planning schemes in Figure 4 and Figure 5 are basically the same, but in this paper’s planning scheme, the distributed power generation is closer to the root node, which is beneficial for reducing network losses. In Figure 6 and Figure 7, distributed power sources are closer to the tail of the grid, such as node 17, which is not conducive to power recovery in case of faults. In extreme cases, it can lead to a reversal of the current, further expanding the scope of the fault.
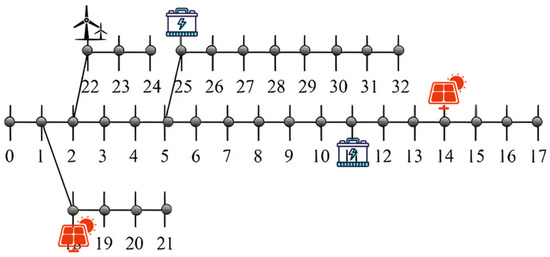
Figure 4.
The planning topology of the IEEE-33 node test system using the proposed method.
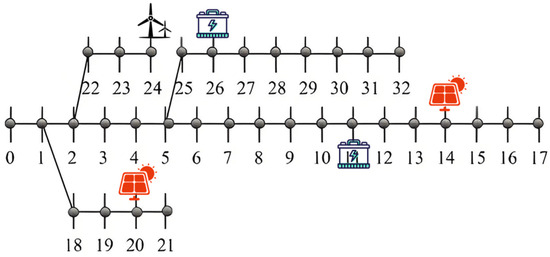
Figure 5.
The planning topology of the IEEE-33 node test system using the method proposed in [36].
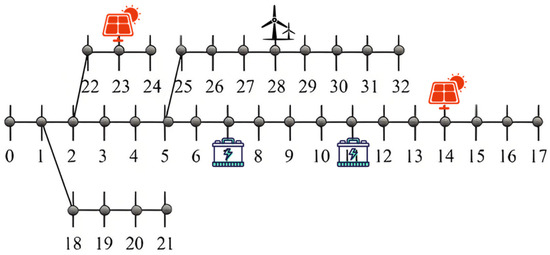
Figure 6.
The planning topology of the IEEE-33 node test system using the method proposed in [37].
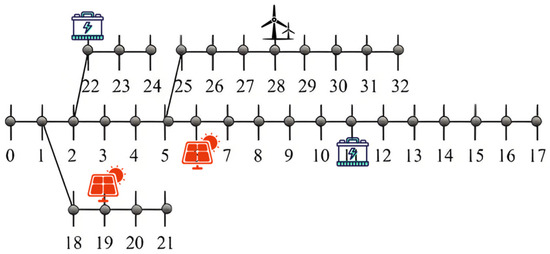
Figure 7.
The planning topology of the IEEE-33 node test system using the method proposed in [38].
Observations reveal that in the distribution network planning scheme proposed in this paper, distributed new energy sources are mostly installed near power source nodes, while energy storage devices are positioned close to heavy load nodes or areas with high power demand. Power source nodes are typically located at pivotal points in the power grid and operate at higher voltage levels. Direct connection of new energy sources to high- or medium-voltage distribution networks can reduce resistance losses during power transmission through low-voltage lines, thereby enhancing overall efficiency. If low-voltage distributed power sources are far from power source nodes, they may require multiple stages of step-up/step-down transformations, increasing losses. Power source nodes possess stronger grid support capabilities, such as large short-circuit capacity and strong voltage regulation ability, enabling better accommodation of the fluctuating output of new energy sources and reducing impacts on the local power grid. Centralized access facilitates unified dispatching and operational control, reducing the complexity of coordination associated with decentralized access. Lines and transformers near power source nodes typically have greater capacity margins, allowing centralized access of new energy sources to fully utilize existing infrastructure and avoid redundant investments. Furthermore, heavy load nodes often exhibit significant peak–valley differences. Energy storage can charge during periods of low load and discharge during peak periods, directly alleviating overloading issues in local lines/transformers and delaying capacity expansion investments. If energy storage is located far from loads, it requires power transmission through the grid for charging and discharging, potentially increasing line burdens and offsetting peak-shaving effects. Heavy load areas are prone to voltage drops, especially during high-load periods. The rapid response capability of energy storage can provide dynamic voltage support, improving power quality. Energy storage systems can collaborate with inverters to provide reactive power, reducing reliance on traditional reactive power compensation equipment. Nearby deployment of energy storage on the load side can reduce power demand from the upstream grid during peak periods, avoiding congestion in transmission and distribution lines. In the event of grid failures, energy storage can serve as a backup power source to supply critical loads, shorten power outage times, and be particularly suitable for power-sensitive users. It should not be overlooked that new energy output is intermittent, and load demand may not align with it. Through temporal and spatial energy shifting, energy storage can maximize the utilization rate of new energy sources. Centralized access to new energy sources and power source nodes reduces the need for modifications to the distribution network, while the deployment of energy storage on the load side delays the expansion of transmission and distribution facilities, both of which synergistically reduce overall investments. Overall, the core of the strategy proposed in this paper is centralized accommodation on the power supply side and flexible regulation on the load side, achieving a balance between technical economy, reliability, and efficiency through optimized resource spatial layout.
To further quantitatively analyze the economic indicators of different schemes, this paper further selects voltage fluctuation rate, network loss, new energy accommodation rate, and operational cost indicators under typical days for analysis and comparison. The relevant calculation results are shown in Table 3 below. The typical days here are determined through the k-means algorithm screening. The calculation of voltage fluctuation rate in distribution networks is typically based on the statistical characteristics or deviation degree of node voltages, which can be quantified by collecting voltage time-series data of each node during the operating cycle and calculating the maximum deviation as a percentage of the rated voltage. The calculation of network losses relies on power flow analysis results, where total system losses are obtained by summing the active power losses of all branches. The core of this method involves numerical approaches such as the Newton–Raphson method to solve the power differences between the sending and receiving ends of each branch, while accounting for Joule losses caused by line resistance and no-load losses of transformers and other equipment, ultimately aggregating these values to form the network loss index. The total operating cost consists of two parts: one is the daily equivalent of annual investment costs, and the other is daily operational expenses, such as electricity purchase/sale costs and penalty fees for network losses.
Table 3.
Comparison of performance metrics among different planning scenarios.
The method proposed in this paper excavates flexibility resources from multiple perspectives, including the power supply side and the load side, and achieves coordinated dispatching through a bi-level optimization model, while the utilization of flexibility resources in other papers is relatively limited. Ref. [36] primarily focuses on carbon emission constraints, with flexibility resources concentrated in power supply side optimization, failing to fully tap the potential on the load side. Ref. [37] emphasizes the coordination of communication and physical systems but lacks adequate modeling of the dynamic regulation capabilities of energy storage and demand response. Ref. [38] focuses on reliability indicators but primarily relies on traditional reserve capacity for flexibility resource dispatching, lacking refined control. This paper significantly enhances system regulation capabilities and reduces operational costs through refined modeling combined with dynamic charging and discharging strategies for energy storage. This paper adopts a bi-level optimization framework, with the upper-level optimizing equipment capacity and the lower-level optimizing economic dispatching, ensuring the optimality of the planning scheme through iterative solution. Ref. [36] employs a spatiotemporal carbon response model but does not form a closed-loop optimization between planning and operation, potentially leading to reduced efficiency during actual operation. Ref. [37] relies on the coordination of cyber–physical systems but has weak coupling between the planning and operational layers, limiting the response speed of flexibility resource dispatching. Ref. [38] adopts multi-stage planning but does not fully consider real-time regulation requirements during the operational stage, resulting in lower utilization rates of flexibility resources. The bi-level model in this paper can dynamically adjust planning schemes to ensure the matching of equipment investment and construction with operational dispatching, thereby reducing network losses and voltage fluctuations.
A larger-scale IEEE 69-node test system was employed to validate the effectiveness and feasibility of the proposed hybrid PSO-CS algorithm, with three wind turbines, three photovoltaic units, and two energy storage systems integrated into the network. The optimized grid planning topology after implementation is illustrated in Figure 8 below.
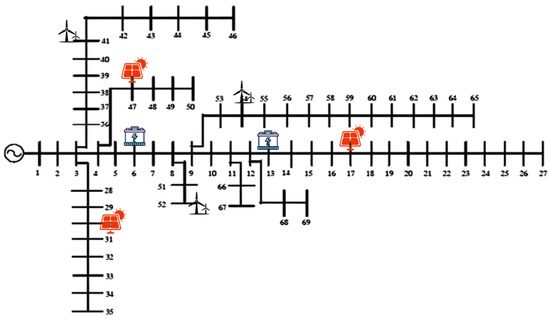
Figure 8.
The planning topology of the IEEE 69-node test system.
The convergence curve data are shown in Figure 9 below.
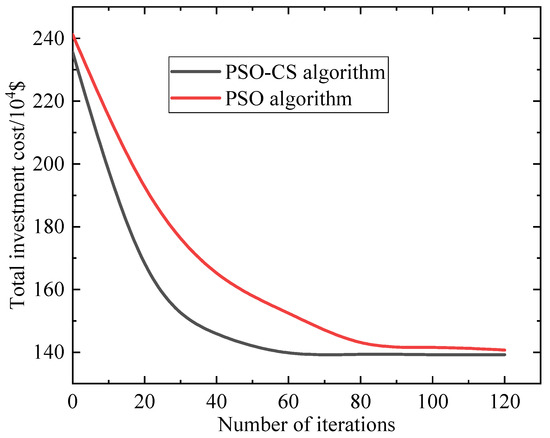
Figure 9.
Comparison of convergence curves for different algorithms.
Analysis of Figure 9 reveals that the improvements in convergence speed and optimization accuracy stem from the dynamic regulation of search behavior through the maximum flight distance mechanism in the hybrid PSO-CS algorithm. While the Lévy flight in traditional CS algorithms can expand the search scope, its randomness often leads to ineffective exploration. Conversely, PSO’s historical best guidance accelerates convergence but risks premature convergence. The improved algorithm dynamically switches between global exploration and local exploitation by introducing an inter-particle maximum distance threshold during mid-iteration. This allows early stage Lévy flights to quickly escape local optima, mid-stage social learning to intensify promising region searches, and late-stage adaptive step-size reduction to balance exploitation precision. This mechanism manifests in the convergence curve as a sharp cost reduction during mid-iteration for the improved algorithm, whereas conventional algorithms exhibit delayed convergence due to rigid mode switching, only entering refined search after 80 iterations. Monte Carlo simulations with 30 trials yielded a low standard deviation of USD ±16,000, further demonstrating the robustness of this mechanism against random initialization.
Figure 10 presents the parameter sensitivity analysis results. The U-shaped distribution of parameter sensitivity reveals the nonlinear impact of Lévy flight step-size factor β on the exploration-exploitation trade-off. When β < 1.3, excessively small steps trap the algorithm in local search, while β > 1.7 sacrifices convergence stability despite enhanced global exploration. At β = 1.4~1.5, the algorithm achieves balanced exploration and exploitation through moderate step sizes, aligning with Lévy flight theory, where β ≈ 1.5 corresponds to heavy-tailed distribution characteristics. This indicates that the improved algorithm adaptively matches parameter settings to the high volatility requirements of distributed generation searches.
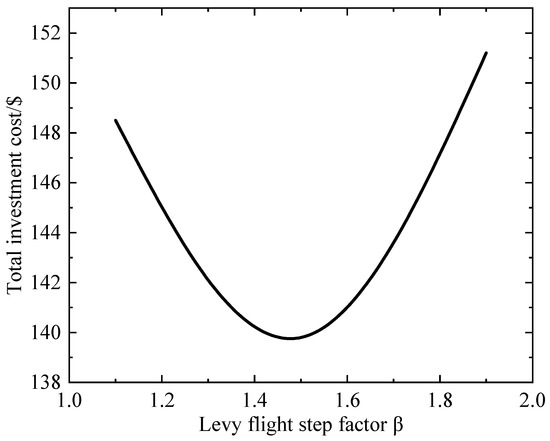
Figure 10.
Parameter sensitivity analysis results.
The number of voltage violation nodes under different renewable energy penetration levels is shown in Figure 11. The robustness advantage of the scenario can be attributed to the hybrid algorithm’s inherent adaptability to bidirectional power flow uncertainty. In high photovoltaic penetration scenarios, conventional algorithms struggle to adapt to voltage violations caused by reverse power flow due to their fixed search patterns. In contrast, the improved algorithm dynamically adjusts the particle swarm topology, such as redefining the neighborhood range based on node voltage sensitivity during iterations, to prioritize optimizing the switching strategies of resources at nodes with violation risks. This approach effectively reduces the number of voltage violation nodes.
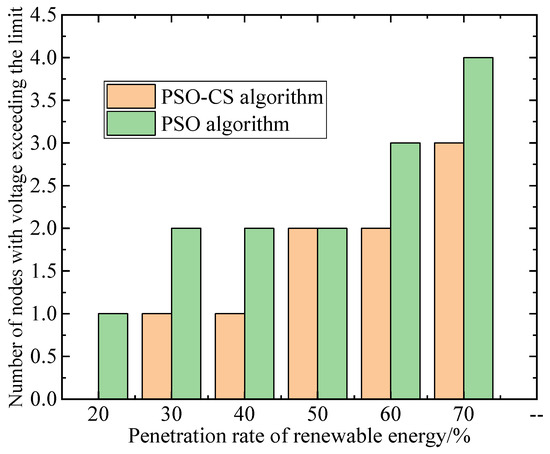
Figure 11.
Number of voltage violation nodes under different renewable energy penetration levels.
5. Conclusions
This paper proposes a bi-level planning strategy for active distribution networks that considers the allocation of multiple flexibility resources. By constructing a coordinated planning–operation optimization model, it achieves the coordinated dispatch of flexibility resources on both the power supply and load sides, and employs an improved PSO-CS hybrid algorithm to efficiently solve complex nonlinear problems. Simulation results indicate that the proposed method can balance the interests of all participating entities while ensuring power supply reliability, significantly enhancing the distribution network’s ability to accommodate distributed energy resources and improving its economic performance. The bi-level optimization framework for planning and operation, solved through iterative upper and lower levels, balances long-term investment economy with short-term operational flexibility, validating the positive role of multiple flexibility resource allocation in reducing system operating costs and enhancing renewable energy accommodation. The improved PSO-CS hybrid algorithm demonstrates strong global optimization capabilities and convergence speed when solving high-dimensional nonlinear programming problems, providing an efficient solution to complex distribution network planning issues. Case analysis based on the IEEE 33-bus system shows that the proposed strategy can effectively reduce network losses and smooth power fluctuations, offering theoretical support and practical references for the flexible planning and coordinated dispatch of actual distribution networks. The experimental results indicate our proposed algorithm achieves two key advantages: (1) a 21.4% improvement in convergence speed, and (2) a 3.26% reduction in total implementation costs compared to existing baseline methods. Future research can further consider multi-time scale dynamic planning, deepening demand-side response mechanisms, and robust optimization under extreme scenarios to enhance the model’s adaptability in more complex environments.
Author Contributions
Conceptualization, M.J., Y.X., D.Z., Y.L., Q.D., X.G., S.Q. and H.Z.; methodology, M.J., Y.X., D.Z., Y.L., Q.D., X.G., S.Q. and H.Z.; software, M.J., Y.X., D.Z., Y.L., Q.D., X.G., S.Q. and H.Z.; investigation, M.J., Y.X., D.Z., Y.L., Q.D., X.G., S.Q. and H.Z.; writing—original draft preparation, M.J., Y.X., D.Z., Y.L., Q.D., X.G., S.Q. and H.Z. All authors have read and agreed to the published version of the manuscript.
Funding
This research is funded by the State Grid Jilin Electric Power Company Limited Science and Technology Project: Research on Target Grid Planning and Project Implementation Strategies for Rural Distribution Networks in Jilin Province under Multi-Factor Integration (Project No. 2024-117).
Data Availability Statement
The original contributions presented in this study are included in the article. Further inquiries can be directed to the corresponding author.
Conflicts of Interest
Authors Minglei Jiang, Dachi Zhang, Yuanqi Liu, Qiushi Du and Xiaofeng Gao were employed by Economic and Technological Research Institute of Jilin Electric Power Co., Ltd. Authors Youqing Xu and Shiwei Qi were employed by State Grid Jilin Electric Power Co., Ltd. The remaining author declares that the research was conducted in the absence of any commercial or financial relationships that could be construed as a potential conflict of interest.
Abbreviations
| Variables and Parameters | Meaning |
| The annualized investment cost of source–grid–storage controllable components, the operation and maintenance cost of controllable components, and the power purchase cost | |
| d | The conversion coefficient for annualized value |
| y | The equipment operation lifespan |
| r | The discount rate |
| The unit power cost of the newly distributed energy | |
| The unit energy cost and unit power cost of energy storage | |
| The conversion coefficients for annual operation and maintenance costs of distributed new energy and energy storage | |
| D | The number of days in a year |
| The interactive power between the feeder and the superior grid during period t | |
| The corresponding transaction electricity price | |
| The active outputs of the photovoltaic and wind power during period t | |
| The on-grid electricity prices for photovoltaic and wind power | |
| The lower and upper limits of rated active power for DG | |
| The lower and upper limits of rated charging (discharging) power for energy storage | |
| The lower and upper limits of rated energy capacity for energy storage | |
| The lower and upper limits of rated endurance time for energy storage | |
| T | The total number of time periods within the optimization cycle |
| Ploss,t | The total network losses across all branches of the ADN during time period t |
| The total load power in the ADN during time period t | |
| N1 | The set of all branches in the distribution network |
| The square of the current amplitude on line ij during time period t | |
| Rij | The resistance of line ij |
| The power of the common tie–line in the active distribution network at time period t | |
| The maximum and minimum power for the tie–line interaction | |
| pr(·) | The probability that the condition within the parentheses holds true |
| vi,t | The square of the voltage magnitude at node i during time period t |
| Ui,min, Ui,max | The minimum and maximum allowable voltage values at node i |
| The probability of node voltage violation, which characterizes the confidence level of the chance constraint. | |
| Iij,min, Iij,max | The minimum and maximum allowable current values for branch ij |
| The active and reactive power at the node i side of line ij during time period t | |
| Xij | The reactance of line ij |
| Pj,t, Qj,t | The active and reactive power injected into node j during time period t |
| l | The child nodes of node j |
| xq(t + 1) | The position of the q-th nest in the (t + 1)-th generation |
| xq(t) | The position of the q-th nest in the t-th generation |
| α | The step size factor |
| ⊕ | Point-to-point multiplication |
| Levy(η) | The Lévy flight random search function |
| η | The relevant exponent of the Lévy flight distribution |
| α0 | The improved step size factor |
| xmax, xmin | The position of the farthest nest and the nearest nest |
| α′0 | The step size factor for the farthest flight distance optimization |
| The position of the particle in the m-dimensional space at the (t + 1)-th iteration | |
| The velocity of the particle in the m-dimensional space at the (t + 1)-th iteration | |
| ω | The inertia weight |
| c1, c2 represent | The acceleration factors |
| The best position of the particle | |
| The current optimal solution of the population | |
| rand(0,1) | A random number within the range of [0, 1] |
References
- Kuaban, G.S.; Nkemeni, V.; Czekalski, P. An Analytical Framework for Optimizing the Renewable Energy Dimensioning of Green IoT Systems in Pipeline Monitoring. Sensors 2025, 25, 3137. [Google Scholar] [CrossRef] [PubMed]
- Dahis, M.D.; Mortazavi, S.S.; Joorabian, M.; Saffarian, A. Bi-Level Resilience-Oriented Sitting and Sizing of Energy Hubs in Electrical, Thermal and Gas Networks Considering Energy Management System. Energies 2025, 18, 2569. [Google Scholar] [CrossRef]
- Yang, L.; Sun, X.; Cao, X.; Chen, M.; Guan, X. Joint chance-constrained coordinated scheduling for electricity-heat coupled systems considering hydrogen storage. Energy Internet 2024, 1, 99–111. [Google Scholar] [CrossRef]
- Zang, T.; Wang, S.; Wang, Z.; Li, C.; Liu, Y.; Xiao, Y.; Zhou, B. Integrated Planning and Operation Dispatching of Source-Grid-Load-Storage in a New Power System: A Coupled Socio-Cyberphysical Perspective. Energies 2024, 17, 3013. [Google Scholar] [CrossRef]
- Liao, J.; Lin, D.; Yu, W.; Yang, L. Research on Energy Storage Configuration of Distribution Network under the Background of County-wide Photovoltaic Development. Distrib. Energy 2022, 7, 12–21. [Google Scholar]
- Zhao, B.; Xiao, C.; Xu, C.; Sun, H. Analysis of Distributed Photovoltaic Grid Connection and Consumption Capacity of Regional Distribution Network Based on Penetration Rate. Autom. Electr. Power Syst. 2017, 41, 105–111. [Google Scholar]
- Gu, T.; Lv, Q.; Fan, Q.; Li, B.; Lin, C.; Zhang, H.; Mao, J. Two-stage Distributionally Robust Assessment Method for Distributed PV Hosting Capacity of Flexible Distribution Networks. Energy Rep. 2024, 11, 2266–2278. [Google Scholar] [CrossRef]
- Li, J.; Ma, H.; Yuan, X.; Xie, K.; Zhou, N. Review of Key Application Technologies for Large-scale Distributed Energy Storage. Power Syst. Technol. 2017, 41, 3365–3375. [Google Scholar]
- Alipour, M.A.; Askarzadeh, A. An Efficient Optimization Framework for Distribution Network Planning by Simultaneous Allocation of Photovoltaic Distributed Generations and Transformers. IET Renew. Power Gener. 2023, 18, 153–168. [Google Scholar] [CrossRef]
- Wang, D.; Liu, Y.; Wang, J. Distribution Network Planning with Distributed Photovoltaic and Electric Vehicle Charging Stations Based on Multi-population Traction Differential Evolution Algorithm. J. Phys. Conf. Ser. 2023, 2474, 012063. [Google Scholar] [CrossRef]
- Liu, H.; Zheng, N.; Ge, S.; Li, Z.; Lin, W. Source-Grid Collaborative Planning of Active Distribution Systems with Embedded Demand Response and Optimized Operation Strategies. Autom. Electr. Power Syst. 2020, 44, 89–97. [Google Scholar]
- Wu, Z.; Liu, Y.; Gu, W.; Hu, B. Multi-Stage Planning of Energy Storage, Distributed Generation, and Distribution Networks Based on Improved Benders Decomposition. Proc. CSEE 2019, 39, 4705–4715, 4973. [Google Scholar]
- Zheng, G.; Zhu, E.; Zhang, H.; Fang, S. Flexible Interconnection Planning of High-Proportion Photovoltaic Distribution Stations Based on Leader-Follower Game Theory. Electr. Power Constr. 2024, 45, 100–110. [Google Scholar]
- Li, H.; Wang, W.; Liao, Y.; Hao, J. Research on Optimization of Public Energy Storage Configuration for Village-Level Photovoltaic Power Generation Systems Based on Electric Vehicle Charging Management. Guangdong Electr. Power 2023, 36, 30–38. [Google Scholar]
- Xiao, B.; Guo, B.; Jiang, Z.; Shao, C. Distribution Network Framework Planning Method Based on Load Point Clustering and Partitioning. Electr. Power Constr. 2018, 39, 85–95. [Google Scholar]
- Yang, X. Distribution Network Framework Planning Based on Improved Genetic Algorithm. Sci. Technol. Innov. Appl. 2022, 12, 64–67. [Google Scholar]
- Guo, Z. Intelligent Optimization Method for Distribution Network Framework Planning Based on Fuzzy Ant Colony Algorithm. Light Light. 2023, 10, 183–185. [Google Scholar]
- Li, N.; Zou, X.; Sun, Z.; Sun, Y. Distribution Network Framework Expansion Planning Based on Improved Dijkstra Algorithm. Electr. Power Sci. Eng. 2020, 36, 38–43. [Google Scholar]
- Nie, M.; Wang, F.; Chen, C.; Huang, W. Multi-Objective Planning of Distribution Network Framework Considering Reliability. J. Electr. Power Syst. Autom. 2016, 28, 10–16. [Google Scholar]
- Fan, P.; Zhang, L.; Xiong, H.; Yu, J. Distribution Network Framework Planning with Microgrids Based on Improved BCC Algorithm. Power Syst. Prot. Control 2022, 40, 12–18. [Google Scholar]
- Zhang, S.; Chen, H.; Tang, C.; Guo, Q. Research on Optimization of Active Distribution Network Framework Based on Improved Particle Swarm Algorithm. Electr. Appl. 2020, 39, 67–73. [Google Scholar]
- Wang, S.X.; Dong, Y.C.; Zhao, Q.Y.; Zhang, X. Bi-level Multi-Objective Joint Planning of Distribution Networks Considering Uncertainties. J. Mod. Power Syst. Clean Energy 2022, 10, 1599–1613. [Google Scholar] [CrossRef]
- Wang, Q.; Liu, J.; Yang, Y. Incremental Distribution Network Framework Planning Considering Active Management Measures. Electr. Meas. Instrum. 2019, 56, 37–43. [Google Scholar]
- Wang, M.Q.; Yang, M.; Fang, Z.; Wang, M.; Wu, Q. A Practical Feeder Planning Model for Urban Distribution System. IEEE Trans. Power Syst. 2023, 38, 1297–1308. [Google Scholar] [CrossRef]
- Deng, S.; Wei, G.; Zhu, L.; Ren, Z. Evaluation of Power Supply Capability of Active Distribution Networks with Integrated Charging and Swapping Stations Based on Interval Theory. Smart Power 2022, 50, 59–65. [Google Scholar]
- Wang, K.; Wang, Y.; Gao, J.; Liang, Y.; Ma, Z.; Liu, H.; Li, Z. Multi-Objective Optimization of Energy Storage Station Configuration in Power Grids Considering the Flexibility of Thermal Load Control. Energies 2025, 18, 2527. [Google Scholar] [CrossRef]
- Rossi, F.; Storti Gajani, G.; Grillo, S.; Gruosso, G. Future Smart Grids Control and Optimization: A Reinforcement Learning Tool for Optimal Operation Planning. Energies 2025, 18, 2513. [Google Scholar] [CrossRef]
- Yu, Q.; Yao, X.; Yuan, L.; Liu, D.; Li, X.; Li, L.; Guo, M. Interaction Scenarios Considering Source–Grid–Load–Storage for Distribution Network with Multiple Subjects and Intelligent Transportation Systems. Electronics 2025, 14, 1860. [Google Scholar] [CrossRef]
- Wang, S.; Luo, Y.; Yu, P.; Yu, R. Integrated Coordinated Control of Source–Grid–Load–Storage in Active Distribution Network with Electric Vehicle Integration. Processes 2025, 13, 1285. [Google Scholar] [CrossRef]
- Valim, N.d.O.; Donadel, C.B. Optimal Allocation and Sizing of Electrical Substations Using an Improved Black Widow Algorithm. Electricity 2025, 6, 18. [Google Scholar] [CrossRef]
- Ma, L.; Jiang, S.; Song, Y.; Si, C.; Li, X. Multi-Time Scale Scenario Generation for Source–Load Modeling Through Temporal Generative Adversarial Networks. Energies 2025, 18, 1462. [Google Scholar] [CrossRef]
- Zhang, S.; Yan, J.; Xie, P.; Zhai, P.; Tao, Y. Power System Loss Reduction Strategy Considering Security Constraints Based on Improved Particle Swarm Algorithm and Coordinated Dispatch of Source–Grid–Load–Storage. Processes 2025, 13, 831. [Google Scholar] [CrossRef]
- Rojas-Galván, R.; García-Martínez, J.R.; Cruz-Miguel, E.E.; Álvarez-Alvarado, J.M.; Rodríguez-Resendiz, J. Performance Comparison of Bio-Inspired Algorithms for Optimizing an ANN-Based MPPT Forecast for PV Systems. Biomimetics 2024, 9, 649. [Google Scholar] [CrossRef] [PubMed]
- Oralhan, Z.; Oralhan, B. Quantum Snowflake Algorithm (QSA): A Snowflake-Inspired, Quantum-Driven Metaheuristic for Large-Scale Continuous and Discrete Optimization with Application to the Traveling Salesman Problem. Appl. Sci. 2025, 15, 5117. [Google Scholar] [CrossRef]
- Gençal, M.C. A New Bipolar Approach Based on the Rooster Algorithm Developed for Utilization in Optimization Problems. Appl. Sci. 2025, 15, 4921. [Google Scholar] [CrossRef]
- Yang, Y.; Qiu, J.; Zhang, C. Distribution Network Planning Towards a Low-Carbon Transition: A Spatial-Temporal Carbon Response Method. IEEE Trans. Sustain. Energy 2024, 15, 429–442. [Google Scholar] [CrossRef]
- Wu, S.; Wang, Q.; Chen, Q.; Yu, C.; Tang, Y. Cyber-Physical Integrated Planning of Distribution Networks Considering Spatial-Temporal Flexible Resources. Prot. Control Mod. Power Syst. 2024, 9, 142–156. [Google Scholar] [CrossRef]
- Liu, J.; Sun, K.; Ding, Z.; Li, K.-J.; Sun, Y. Multi-Stage Planning of Distribution Network with High Penetration Renewable Energy Considering Reliability Index. IEEE Trans. Ind. Appl. 2024, 60, 2344–2356. [Google Scholar] [CrossRef]
Disclaimer/Publisher’s Note: The statements, opinions and data contained in all publications are solely those of the individual author(s) and contributor(s) and not of MDPI and/or the editor(s). MDPI and/or the editor(s) disclaim responsibility for any injury to people or property resulting from any ideas, methods, instructions or products referred to in the content. |
© 2025 by the authors. Licensee MDPI, Basel, Switzerland. This article is an open access article distributed under the terms and conditions of the Creative Commons Attribution (CC BY) license (https://creativecommons.org/licenses/by/4.0/).