Abstract
Sulfur hexafluoride (SF6), an extraordinary gas insulation medium, must be replaced by environmentally friendly gas in electric equipment because of its high global warming potential (GWP). In this research work, the DC breakdown properties of R404a gas and its mixtures with N2 and CO2 are studied under a sphere–sphere electrode configuration and uniform field conditions. The GWP of R404a is 16% of SF6 and its liquefaction temperature is also in the suitable range for practical applications. Nitrogen and carbon dioxide are mixed with R404a to reduce its boiling point and GWP. Other important parameters such as the self-recoverability, liquefaction temperature, GWP, and synergistic effect of R404a/CO2 and R404a/N2 were also studied to complement the insulation performance and the results are comparable to other gas mixtures. As a result, it was found that both the mixtures containing 80% R404a and 20% N2 or 20% CO2 possess a breakdown strength of 0.83 times that of SF6. Mixtures containing an 80% concentration of R404a possess a GWP equal to only 15% of SF6. These properties make gaseous mixtures containing 80% R404a and 20% N2 or CO2 a suitable alternative to SF6 in medium-voltage gas-insulated equipment.
1. Introduction
Due to its phenomenal arc-quenching and insulation properties, sulfur hexafluoride (SF6) is a key component of electrical power equipment. SF6-insulated equipment is usually compact in size because its dielectric strength is high even at lower pressures. Although it offers excellent insulation properties, it is still essential to limit the use of SF6 due to its (1) high global warming potential (GWP) (23,500 years compared to CO2, with over 100 years of atmospheric lifetime) and (2) atmospheric life of 3200 years [1]. The two major factors that contribute to SF6 emissions are the periodic maintenance of the electric equipment that is insulated by SF6 and its recycling. To reduce SF6 emissions, it is very important to use leakage detection equipment, identify the leaks immediately, and employ materials that can restrict SF6 discharge [1,2]. Data indicates that the SF6 content in the atmosphere was 5.64 parts per trillion (ppt) in 2005 and grew to 10.41 ppt in 2020 [3]. The Kyoto Protocol declared SF6 gas as a potential greenhouse gas in order to reduce its usage, enhance its recycling and degradation, and to introduce suitable environment-friendly alternatives that incorporate all the required dielectric properties [4,5,6].
Extensive research work has been carried out by researchers to identify an eco-friendly substitute to SF6 that exhibits all the required properties, such as a higher dielectric strength, low liquefaction temperature, and lower value of GWP. SF6 mixtures with N2, CO2, and air have been under investigation for a long time, and the results have shown that these gases have lower strength in comparison to SF6 [7]. To achieve higher strength, the pressure must be kept high, which in turn increases the equipment size. After the adoption of the Kyoto Protocol, the emphasis of research was diverted to environment-friendly gases. Table 1 presents the important properties of SF6 and its researched substitutes. A gaseous mixture containing 30% CF3I and 70% nitrogen possesses the same dielectric strength as the mixture containing 20% and 80% of SF6 and N2, respectively [8]. In [9], CF3I and its mixtures with N2 and CO2 were studied, but CF3I has a high boiling point and is not suitable for arc-quenching applications due to iodine deposition after discharge. In [10,11], mixtures of C6F12O and C5F10O with N2, O2, and CO2 were studied, but the prime drawback of these gases is their high liquefaction temperature. C4F7N exhibits a dielectric strength 2.74 times that of SF6 and was first used by General Electric (GE) in gas-insulated equipment in 2016 but, due to its high boiling point, it was added with buffer gases [3]. A mixture of C4F7N (3.7%) and CO2 improves the dielectric behavior by a significant amount in comparison to SF6 under AC and lightning impulse voltages [12,13]. Similar results were obtained for a gaseous mixture containing C4F7N and N2 under non-uniform field conditions [14]. The breakdown strength of c-C4F8O is 1.2–1.4 times higher than SF6, and its GWP is approximately one-third of the GWP of SF6. However, due to the high boiling point of c-C4F8O, it was mixed with N2 and CO2. From the result, it was found that gaseous mixtures containing c-C4F8O and nitrogen display more promising dielectric behavior [15].

Table 1.
Breakdown strength and environmental properties of and its proposed substitutes.
Recent studies on refrigerant gases such as R134a (CH2FCF3), R12 (CCl2F2), R22 (CHClF2), R410a (CHCl2F2/C2H4F2/C2HClF4), and R507 (C2HF5/C3H2F5) have shown that these gases possess comparable insulation properties and also have lower GWP values and ozone depletion potential (ODP) [23,26,27,28,29]. For example, R12 mixed with N2, and air offers favorable results, but R12 contains halogen components such as fluorine and chlorine, having a substantial tendency to damage the ozone layer [28]. The breakdown of R410a is also comparable to SF6 when mixed with air/CO2 for both AC/DC voltages [29]. Therefore, it is still necessary to continue investigating the insulation characteristics of other refrigerant gases to find an environment-friendly and sustainable alternative to SF6 that has a suitable and repeatable performance under a variety of protocol conditions experienced by gas-insulated equipment on a system installed in power distribution and transmission systems. Among refrigerant gases, R404a is a member of the hydrofluorocarbons (HFCs) family. The two major factors which make R404a a favorable gas from the environmental point of view are low toxicity and low GWP. The GWP of R404a is 3922, which is only 16% of the GWP of SF6. Moreover, the ODP of R404a is zero. R404a is a mixture of three component gases, namely R125a, R143a, and R134a. Table 2 gives the percentage by weight of each component gas in R404a [30]. R404a is a colorless, non-flammable gas with a sweet ethereal odor and possesses chemical stability up to 250 °C. Due to its non-toxic nature, even prolonged exposure to R404a has no hazardous implications. The allowable exposure limit (AEL) for R404a is 1000 ppm considering 8 h time-weighted averages (TWA) [31]. Table 3 provides the basic chemical and physical properties of R404a [30]. However, a detailed insulation performance analysis of R404a gas has not been explored yet.
Table 2.
Components present in R404a and their percentage by weight.
Table 3.
Important properties of R404a in comparison to SF6.
Based on the above, the major contributions of this research work can be summarized as follows:
- A comprehensive literature review to identify a potential gaseous dielectric alternative to SF6 that incorporates the important properties that an ideal insulation needs, such as (a) higher breakdown strength, (b) chemically inertness, (c) non-toxicity, and (d) being cheaper and easily available.
- DC breakdown properties of R404a in both pure form and mixed with and nitrogen were investigated through experimental work at a pressure range of 0–4 bar and under uniform field configuration.
- The insulation parameters such as self-recoverability, liquefaction temperature, GWP, and synergistic effect of R404a and its optimal mixtures are compared to SF6 to propose the most suitable substitute for SF6.
This study sets the foundation to fill the gap for a deeper, more diverse, and realistic comparison between the two gaseous media, R404a and SF6. The research methodology is then given to describe the test equipment used for experimentation and simulation of uniform electric field configuration. The next section provides the results and their discussion to highlight the key features of the proposed gas mixtures. Finally, the conclusion and future research directions are given.
2. Materials and Methods
2.1. Test Equipment
A mild steel cylindrical pressure chamber was fabricated with an upper-pressure limit of 10 bar. Its dimensions were 500 mm in height, 500 mm in outer radius, and wall thickness of 10 mm. The top surface and bottom surface of the pressure chamber are illustrated in Figure 1a and Figure 1b, respectively. To view the breakdown of the gaseous insulation inside the pressure chamber, a transparent acrylic window was installed in the chamber. Two inlets and two outlets were provided on the top and bottom sides of the chamber for pressurizing and evacuating the chamber. The DC voltages were supplied from a 100 kV and 1 mA DC generator. A sphere–sphere electrodes arrangement was used to perform the DC breakdown studies of R404a and its mixtures with nitrogen and carbon dioxide in a uniform electric field. Each sphere had a diameter of 50 mm, and the inter-electrode gap length was set at 5 mm to maintain the electric field uniform between the electrode’s arrangement. The block diagram and photographic illustration of the experimental setup used for the DC breakdown study is shown in Figure 2. The average breakdown voltage () and standard deviation (s), given in the results section, were calculated using (1) and (2), respectively [32].
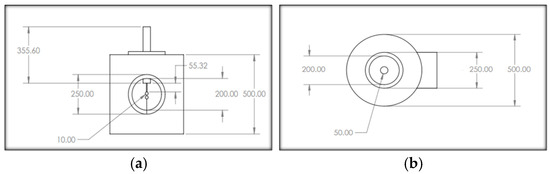
Figure 1.
Schematic diagram of the pressure chamber: (a) front surface; (b) top surface. All dimensions are in mm.
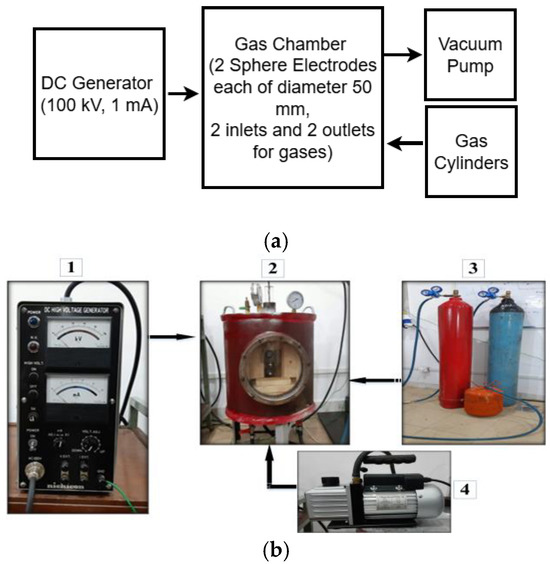
Figure 2.
(a) Block diagram of the experimental test setup and (b) fabricated pressurized gas chamber. 1: DC generator, 2: pressure gas chamber, 3: gases, 4: vacuum pump.
Here indicates the individual breakdown voltage reading, is the average breakdown test voltage, and n is the total number of breakdowns for each reading. In this study, experiments were repeated at least five times to ensure the repeatability of results. Figure 3 provides the flow chart of the research methodology for this study.
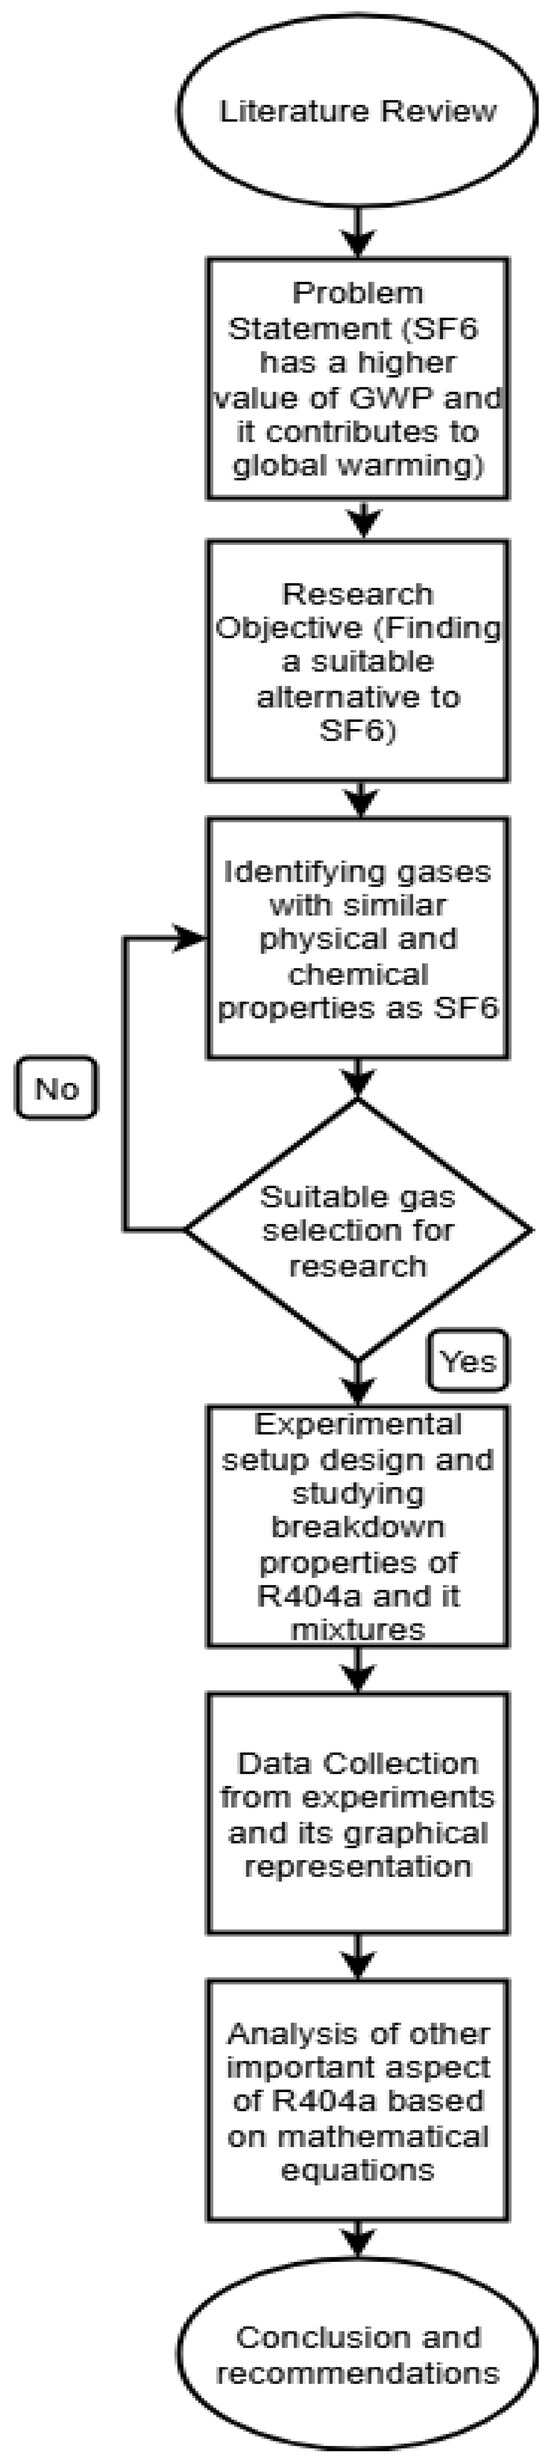
Figure 3.
Flowchart for research methodology.
2.2. Simulation of Uniform Field
To analyze the electric field distribution between sphere–sphere electrodes, a 2D simulation was performed using COMSOL Multi-physics 6.2 software. For simulation study, a voltage of 100 V was applied to one sphere electrode and the other sphere electrode wat set to 0 V as a boundary condition. The constructed electrodes arrangement was placed in a closed rectangle. To obtain the electric field profile, the Gauss law, which gives a relationship between the charge density ρ (C/m3) and the displacement vector D (C/m2), was solved. Figure 4 shows the field distribution between the electrodes at a given gap length of 5 mm. A factor that describes field uniformity is called the field utilization factor, which is mathematically expressed by (3) and (4) [33].
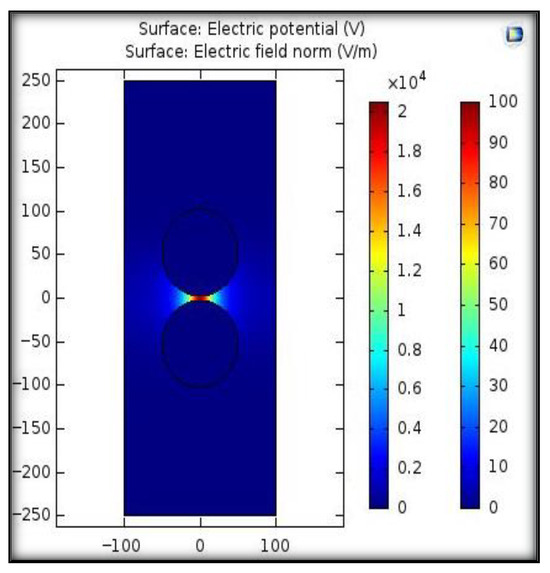
Figure 4.
Electric field distribution between sphere–sphere electrodes using COMSOL Multi-physics.
Here, Eavg denotes the average value of the electric field applied while Emax represents the maximum value of the field. V is the voltage applied to electrodes, and d is the gap length between the sphere–sphere electrodes arrangement. If the value of 3/4 < η < 1, the electric field is considered quasi-uniform; if 1/4 < η < 3/4, it is considered slightly non-uniform, while η ≤ 1/4 represents a highly non-uniform field. For a uniform field, the value of field utilization factor is equal to 1 [33]. The simulation results illustrated that the maximum electric field was 20 kV/m and the calculated value of the utilization factor was 1, representing a uniform electric field condition.
3. Results and Discussion
3.1. Breakdown Characteristics of R404a Mixed with Nitrogen
R404a was mixed with nitrogen to lower the liquefaction temperature as well as GWP of pure R404a. Several mixtures were studied, varying the percentage ratio of R404a ranging from 10% to 80%. Figure 5 shows the dielectric strength of R404a, nitrogen, and its different mixtures when the gap between the electrodes was kept at 5 mm. The breakdown characteristics make it clear that the dielectric strength of a mixture increases when the ratio of R404a increases. This increase was due to the fact that R404a is more electronegative than nitrogen. The breakdown voltage of the mixtures shows an upward trend as mixture pressure increases. This increase was because, at higher pressure, the collision between the free electrons and neutral gas atoms is reduced, thereby reducing the number of free particles. At 1 bar, the breakdown voltage of a mixture containing 50% R404a and 50% nitrogen increases by a significant amount as compared to pure R404a and nitrogen. For example, at 1 bar, the dielectric strength of nitrogen was 22 kV, while that of the mixture containing 50% R404a and 50% nitrogen has 31 kV, which is 1.4 times that of nitrogen. Further increasing the content of R404a in the mixture has no dominant effect on the breakdown voltage. The best breakdown strength of 71 kV was observed for a mixture of 80% R404a and 20% nitrogen at 4 bar.
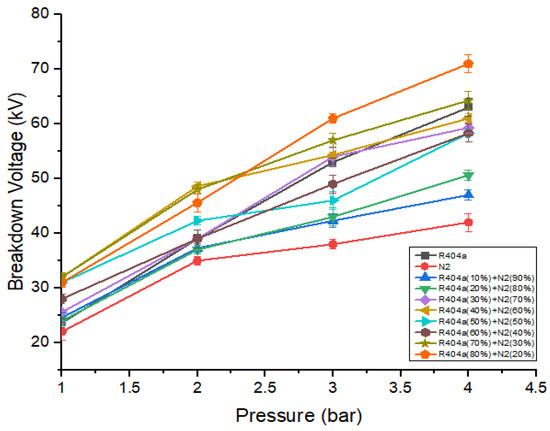
Figure 5.
DC breakdown voltage of R404a and its mixture with at 5 mm gap.
3.2. Breakdown Characteristics of R404a Mixed with Carbon Dioxide
Figure 6 represents the breakdown voltage characteristics of R404a, , and various mixtures of both gases at a 5 mm gap. It can be seen that the breakdown value increases with an increase in gas pressure, and the relationship was almost linear. The breakdown voltage behavior of R404a gas mixed with was similar to that of mixtures containing R404a and . The addition of 50% R404a to causes a significant enhancement in dielectric strength. For example, the mixture consisting of 50% R404a and 50% has a voltage of 32 kV, which is 1.45 times that of . The optimal mixture that shows the best breakdown results was one that contains 80% R404a and 20% . At a pressure of 4 bar, the gaseous mixture of 80% R404a and 20% has the highest breakdown voltage, greater than both R404a and . At 1 bar pressure, gaseous mixture containing 60% R404a and 40% shows the highest value of breakdown voltage. It is worthwhile noting that the breakdown characteristics of gas R404a and its mixtures with CO2, and N2, for the same ratios and pressures using point-plane electrodes configuration with applied DC voltage were also analyzed. As a result, it was found that, with spiked electrodes, the breakdown values were comparatively lower than using sphere–sphere electrodes. Therefore, the results for the latter electrode arrangement are only provided in this study.
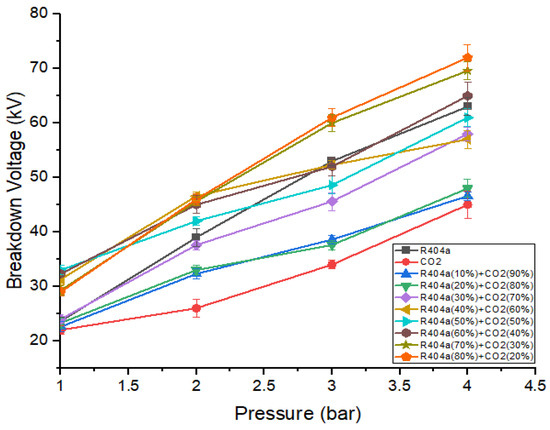
Figure 6.
DC breakdown characteristics of R404a and its mixture with at 5 mm gap.
3.3. Comparison of the Breakdown Characteristics of Optimal Mixtures with
Figure 7 shows the comparison between the dielectric strength of the gaseous mixtures with the highest breakdown strength and pure gases with varying gaseous pressure. It can be seen that gaseous mixtures exhibit higher values of breakdown voltage as compared to R404a, nitrogen, and carbon dioxide. Both gaseous mixtures have almost identical breakdown voltages at 1 bar, 2 bar, and 4 bar but the mixture containing R404a and has a higher value than R404a and mixture at 3 bar. When the pressure was 4 bar, R404a/ mixture possesses the maximum value of breakdown voltage, while exhibits the smallest value. At a pressure of 2 bar, both the gaseous mixtures provide insulating strength of approximately 0.84 times that of [34]. At 3 bar, the gas mixture with 80% R404a and 20% nitrogen offers a breakdown strength of 0.93 times the strength of the mixture with 20% and 80% [34]. The breakdown behaviour of at 1 bar was equivalent to the strength offered by mixtures at 2 bar. The R404a/ mixture at 3 bar possesses the same value of breakdown voltage as at 2 bar, while R404a/ shows higher strength under the same conditions. When the pressure is 4 bar, both the optimal gaseous mixtures offer strength almost equal to the strength offered by at 3 bar.
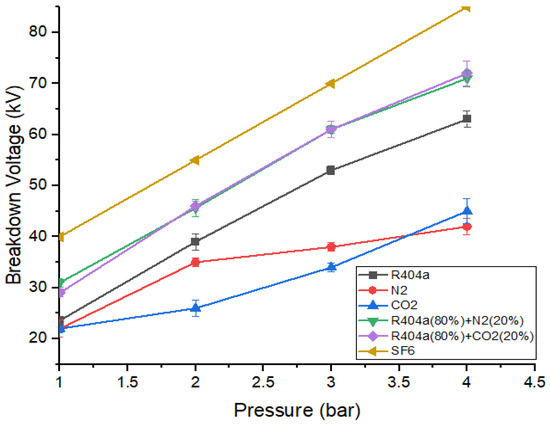
Figure 7.
Comparison of DC breakdown characteristics of optimal mixtures and pure gases.
3.4. Synergistic Effect
The breakdown characteristics of a mixture containing two gases show nonlinear behavior. This nonlinearity in the breakdown characteristics was used to define the degree of synergistic effect exhibited by the gaseous mixture. When an electronegative gas was mixed with another gas, the dielectric performance of a mixture was classified into four different stages as the ratio of the electronegative gas increases in the mixture [26]. If the breakdown voltage of the mixture is higher than the weighted sum of breakdown voltages of the component gases, the mixture has a synergistic effect. On the other hand, if a mixture possesses a lower value of breakdown voltage as compared to the weighted sum of breakdown voltages of the component’s gases, the synergistic effect shown by the mixture is termed as negative synergistic effect. In case of positive synergistic effect, at the same gas pressure, a gaseous mixture shows higher value of breakdown voltage as compared to the weighted sum of the breakdown voltages of constituent gases [35]. The mathematical relationship between the synergistic effect index , mixing ratio of the base gas, and breakdown voltage is shown in Equation (5) [35].
where is the breakdown voltage of the base gas, is the breakdown voltage of the additive gas, is the mixing ratio of the base gas, and is the breakdown voltage of the gaseous mixture. Depending upon the value of , the following conditions are defined:
- If > 1, gaseous mixture exhibits a negative synergistic effect.
- If 1, the breakdown voltage shows a linear relation. In this case, the breakdown voltage of mixture increases from a lower value to a higher value in a linear manner.
- If 0 >< 1, gaseous mixture shows a synergistic effect, and it becomes dominant when the value of the synergistic effect index approaches 0.
- If < 0, gaseous mixture incorporates a positive synergistic effect. The positive synergistic effect is dominant when the value of becomes small.
3.4.1. Synergistic Effect of R404a with Nitrogen
Table 4 indicates the values of calculated for different pressure and mixing ratios of R404a and nitrogen. The value of increases as the gas pressure increases for the same mixing ratio. When pressure remains constant and the mixing ratio is increased, the value of becomes negative, showing a positive synergistic effect. This shows that, when the percentage of R404a in the mixture is increased, the positive synergistic effect becomes dominant, and this explains an important fact that the breakdown strength of the optimal mixture containing 80% R404a and 20% is higher than that of pure R404a as well as nitrogen. For lower values of k, such as 10% and 20%, the value of shows that the mixture exhibits a synergistic effect for pressures higher than 1 bar.
Table 4.
Values of C calculated for various ratio of R404a/ mixtures.
3.4.2. Synergistic Effect of R404a with Carbon Dioxide
Table 5 shows the synergistic effect index values calculated for different values of mixing ratio and pressure for a gaseous mixture containing R404a and carbon dioxide. The analysis shows that the mixtures consisting of R404a and carbon dioxide have similar behavior as that of mixtures containing R404a and nitrogen. For lower values of mixing ratio, such as 10% and 20%, gaseous mixtures show a synergistic effect up to 3 bar but a negative synergistic effect at 4 bar. For the same mixing ratio, the value of decreases and becomes negative. The optimal mixture containing 80% R404a and 20% shows negative values of at all pressures exhibiting a positive synergistic effect. In fact, combined with pressure and increasing concentration of electronegative gas R404a within mixtures containing N2 or CO2, the mean free path of electrons is more compressed. This is inversely proportional to the pressure of the gas and, thus, the electrons’ accumulated kinetic energy are reduced between the two collisions to yield a higher breakdown strength.
Table 5.
Values of C calculated for various ratio of R404a/ mixtures.
3.5. Self-Recoverability Analysis
Self-recoverability is an important feature of gaseous insulation that is generally studied while investigating its dielectric properties for practical applications. The ability of insulation to recover its dielectric properties after a breakdown without any irreversible damage is known as insulation self-recoverability.
Self-Recoverability Assessment of R404a and Mixtures with N2/CO2
To examine the self-recoverability feature of R404a in a uniform field, a DC voltage was applied to the high-voltage electrode inside the pressure vessel, and the electrode gap was set at 5 mm. The number of breakdown shots applied to gas was 20 with an interval of one minute between two consecutive shots. Figure 8 and Figure 9 show the self-recoverability results of R404a mixtures under DC voltage at a pressure of 2 bar. In case of the mixture containing 80% R404a and 20% , the breakdown voltage decreases not much as the number of breakdown shots increases. Initially, the decay in breakdown voltage was small up to the 4th shot but, beyond that, the decrease in the nitrogen and carbon dioxide in uniform field breakdown voltage becomes significant. In the case of 80% R404a and 20% mixture, the decrease in breakdown voltage was observed initially but, after the 5th shot, the gaseous mixtures showed increased breakdown voltage till the 15th shot, and carbon dust deposits on the electrodes were observed. Other possible contributing factors for superior insulation self-recoverability of R404a/N2 mixture may be attributed to higher breakdown behavior of R404a/N2 mixture as the phenomena has been explained in [36]. Overall, both the mixtures show reasonable self-recovery performance.
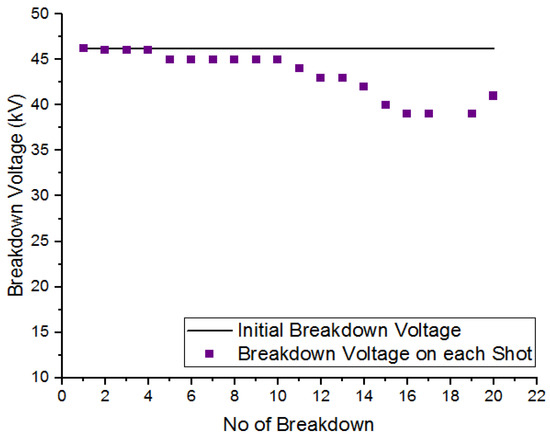
Figure 8.
Self-recoverability testing of R404a/ mixture at 2 bar.
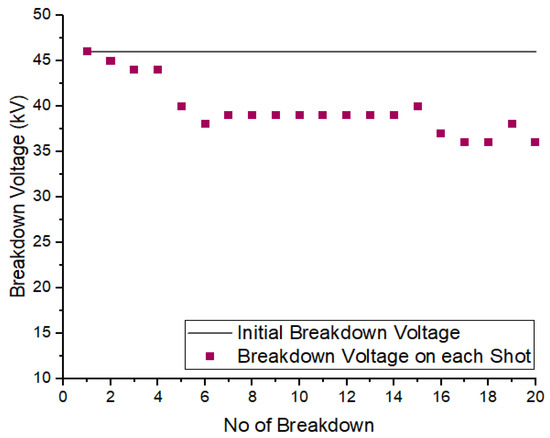
Figure 9.
Self-recoverability testing of R404a/ mixture at 2 bar.
3.6. Liquefaction Analysis
To find out suitable alternatives to , it is important to conduct liquefaction testing on the gas and its mixtures under consideration. The gas-insulated electrical power equipment (GIS) may be installed in cold areas where the temperature has a major impact on the dielectric properties of the gaseous insulation. When temperature drops, it reduces the gas pressure, which, in turn, deteriorates the breakdown properties of the gas insulation.
Liquefaction Testing of R404a and Its Mixtures with /
The boiling point of is −64.3 ° while that of R404a is −47.6 ° at atmospheric pressure [29]. The boiling points of and are −196 ° and −78.46 °, respectively. To overcome this aspect, R404a was mixed with and . These buffer gases, when mixed with R404a, lower its liquefaction temperature. To determine the effect of adding buffer gases on the liquefaction temperature of the base gas, the relation was used as given in (6) [37].
Here, represents the liquefaction temperature of gaseous mixture, the boiling point of base gas (R404a), and k the mixing ratio of R404a. is the vapour pressure. Figure 10 shows the variation in the liquefaction temperature of gaseous mixture with respect to the mixing ratio of R404a for total pressure at 1 bar, 2 bar, 3 bar, and 4 bar. It is apparent from calculations that the liquefaction temperature of the mixture tends to increase when the percentage of R404a in the mixture increases at the same pressure. Similarly, for the same mixing ratio, the liquefaction temperature of mixture increases when the pressure increases from 1 bar to 4 bar. According to data reported in the literature, the minimum operating temperature for medium-voltage GIS is −15 ° [38,39]. Because these mixtures show lower boiling points, all of the mixing ratios can be used, even at higher pressures. Moreover, the mixtures which show the best breakdown results contain 80% R404a and a liquefaction temperature of −21.45 ° at 4 bar. Therefore, in addition to industrial refrigeration, commercial refrigeration, and transportation applications of this base gas, these mixtures can be considered even at higher pressure up to 4 bar in cold areas for practical application.
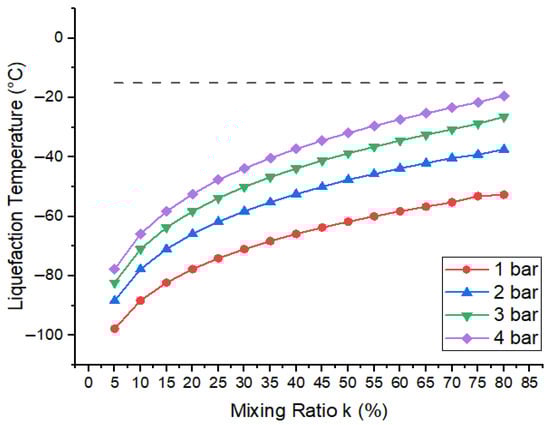
Figure 10.
Liquefaction temperature of R404a gas mixtures with respect to mixing ratio (k). The dashed line indicates the liquefaction temperature of the optimal mixture at 4 bar.
3.7. Global Warming Potential
Pure R404a gas has a GWP of 3922, which is only 16% of the GWP of . The combined GWP of the gaseous mixture can be calculated from the relation given in (7) [40].
where k represents the mixing ratio of base gas in the gaseous mixture. Figure 11 shows the variations in global warming potentials of the gaseous mixtures when R404a was mixed with and and the mixing ratio varies from 0 to 100%. It was found that GWP of the gaseous mixture in both cases shows an upward trend when the ratio of the base gas in the mixture increases from 0 to 100%. Overall, the GWP of R404a/ mixtures were slightly lower in comparison to R404a/ mixtures. For lower values of mixing ratio, k, such as 10%, the GWP of R404a- was 912 or 3.8% of the GWP of . Similarly, R404a- mixture for the same mixing ratio provides a GWP of 1150, which is 4.8% of the GWP of SF6. When the mixing ratio is increased to 80%, both R404a- and R404a- mixtures offer a GWP only 15% of the GWP of . It is obvious that mixing and with R404a effectively reduces the GWP of the gaseous mixture.
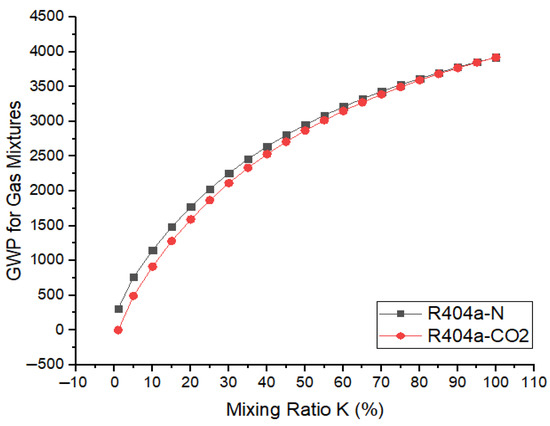
Figure 11.
Variation in GWP with R404a ratio in mixture of N2/CO2.
4. Conclusions
The DC breakdown properties of R404a and its mixtures with and were experimentally investigated using an in-house fabricated test chamber and other equipment. The impact on breakdown voltage by varying the gas pressure for a fixed electrode gap was analyzed in uniform field configurations and the results were compared with . Several important parameters of R404a gas and its mixture were examined and the relevant results are summarized below.
- In the uniform electric field, two gaseous mixtures, R404a (80%)/ and R404a (80%)/, provide the highest values of breakdown voltage. At 2 bar, both the mixtures offer strength up to 83% of . At a pressure of 3 bar, R404a/ mixture exhibits a breakdown voltage equal to that of at 2 bar. Moreover, R404a/ mixture at 3 bar shows more strength than at 2 bar. Optimal mixtures can be considered for insulation in medium-voltage equipment.
- Synergistic effect analysis shows that, when the concentration of R404a is increased in mixtures (with both or ), the synergistic effect index becomes negative, indicating a positive synergistic effect.
- Pure R404a gas as well as its mixtures with and show good self-recoverability performance. R404a/ mixture shows better insulation self-recoverability performance in comparison to R404a/ mixture. This was due to the deposition of carbon dust on the electrodes, which reduces the breakdown strength of gaseous insulation R404a/ mixture.
- Nitrogen and carbon dioxide were mixed in R404a to reduce its boiling point. The optimal mixtures offer lower liquefaction temperature even at high pressure. Low liquefaction makes these mixtures suitable for use in gas-insulated equipment designed for a cold environment.
- R404a gas and its mixtures offer lower GWP as compared to . Even when the content of R404a gas is high in mixtures such as 80%, the mixture possesses GWP equal to only 15% of GWP of . The price of 80% mixing ratio of base gas (R404a) is only 8.2% times the price of SF6.
Additional information such as breakdown characteristics under different voltage types, particularly at higher pressures and large gap distances, and analysis of decomposition products through short- and long-term aging would be beneficial for evaluating their practical applicability.
Author Contributions
Conceptualization, H.R. and M.Z.S.; methodology, H.R.; software, H.R. and M.Z.S.; validation, H.R. and M.Z.S. formal analysis, H.R.; investigation, H.R.; resources, H.R. and M.Z.S.; data curation, H.R. and M.Z.S.; writing—original draft preparation, H.R. and M.Z.S.; writing—review and editing, H.R. and M.Z.S.; visualization, H.R. and M.Z.S.; writing—review and editing, data acquisition, data validation, M.F. All authors have read and agreed to the published version of the manuscript.
Funding
The research work of M. Faheem is funded by VTT Technical Research Centre of Finland.
Data Availability Statement
The data that supports the findings of this study is available and can be provided by the corresponding author upon request.
Acknowledgments
H.R. and M.Z.S. thank Mohammad Akbar for his guidance in conducting this study.
Conflicts of Interest
Muhammad Faheem were employed by the company VTT Technical Research Centre of Finland Ltd. The remaining authors declare that the research was conducted in the absence of any com-mercial or financial relationships that could be construed as a potential conflict of interest.
Abbreviations
The following abbreviations are used in this manuscript:
| GWP | Global warming potential |
| PPT | Parts per trillion |
| GE | General Electric |
| AEL | Allowable exposure limit |
| TWA | Time-weighted averages |
| ODP | Ozone depletion potential |
| HFCs | Hydrofluorocarbons |
| Average breakdown voltage | |
| s | Standard deviation |
| GIS | Gas-insulated electrical power equipment |
References
- Cui, Z.; Liu, Y.; Chen, W. Recent progresses, challenges and proposals on SF6 emission reduction approaches. Sci. Total Environ. 2024, 906, 167347. [Google Scholar] [CrossRef]
- Lin, M.J.; Zhao, X.L.; Wang, L. To research on application and maintenance of sulfur hexafluoride (SF6) circuit breaker. Eur. J. Electr. Eng. 2023, 7, 1–5. [Google Scholar] [CrossRef]
- Ye, F.; Li, X.; Zhang, Y. Effect of O2 on AC partial discharge and decomposition behavior of C4F7N/CO2/O2 gas mixture. IEEE Trans. Dielectr. Electr. Insul. 2021, 28, 1440–1448. [Google Scholar] [CrossRef]
- Zhang, Y.; Liu, J.; Wang, K. Experimental study on the effect of H2O concentration on the degradation of sulfur hexafluoride by two-stage tandem DBD. ACS Omega 2024, 9, 45232–45239. [Google Scholar] [CrossRef]
- Sun, H.; Chen, M.; Guo, Y. Simulation and experimental study on the degradation of the greenhouse gas SF6 by thermal plasma. Environ. Res. 2023, 216, 114411. [Google Scholar] [CrossRef]
- Raza, T.A.; Khan, M.A.; Ahmed, S. Potential of eco-friendly gases to substitute SF6 for electrical HV applications as insulating medium: A review. Turk. J. Electr. Eng. Comput. Sci. 2022, 2, 94–102. [Google Scholar] [CrossRef]
- Zhang, B.; Li, Y.; Zhao, Q. Fundamental physicochemical properties of SF6-alternative gases: A review of recent progress. J. Phys. D: Appl. Phys. 2020, 53, 173001. [Google Scholar] [CrossRef]
- Youping, T.; Zhang, H.; Chen, L. Breakdown characteristics of CF3I and CF3I/N2 gas mixtures in uniform field. In Proceedings of the 11th International Conference on the Properties and Applications of Dielectric Materials (ICPADM), Sydney, Australia, 19–22 July 2015. [Google Scholar]
- Chen, L.; Zhang, X.; Li, H. CF3I gas mixtures: Breakdown characteristics and potential for electrical insulation. IEEE Trans. Power Deliv. 2016, 32, 1089–1097. [Google Scholar] [CrossRef]
- Zeng, F.; Wang, Y.; Liu, Q. Breakdown characteristics of eco-friendly gas C5F10O/CO2 under switching impulse in nonuniform electric field. IEEE Trans. Power Deliv. 2022, 29, 866–873. [Google Scholar] [CrossRef]
- Zhang, X.; Huang, M.; Chen, L. Insulation strength and decomposition characteristics of a C6F12O and N2 gas mixture. Energies 2017, 10, 1170. [Google Scholar] [CrossRef]
- Nechmi, H.E.; Bessaih, Z.; Benabdessadok, M. Fluoronitriles/CO2 gas mixture as promising substitute to SF6 for insulation in high voltage applications. IEEE Trans. Dielectr. Electr. Insul. 2016, 23, 2587–2593. [Google Scholar] [CrossRef]
- Nechmi, H.E.; Bessaih, Z.; Benabdessadok, M. Effective ionization coefficients and limiting field strength of fluoronitriles-CO2 mixtures. IEEE Trans. Dielectr. Electr. Insul. 2017, 24, 886–892. [Google Scholar] [CrossRef]
- Li, Y.; Wu, Y.; Wang, J. Study on the dielectric properties of C4F7N/N2 mixture under highly non-uniform electric field. IEEE Access 2018, 6, 42868–42876. [Google Scholar] [CrossRef]
- Gao, Z.; Liu, J.; Zhang, H. Investigation of synthesis and dielectric properties of c-C4F8O with its CO2/N2 mixtures as SF6 alternatives in gas-insulated applications. IEEE Access 2019, 8, 3007–3015. [Google Scholar] [CrossRef]
- Jiang, T.; Liu, Y.; Zhou, J. The development of SF6 green substitute gas. Sustainability 2021, 13, 9063. [Google Scholar] [CrossRef]
- Owens, J.; Li, Y.; Zhang, Q. Recent development of two alternative gases to SF6 for high voltage electrical power applications. Energies 2021, 14, 5051. [Google Scholar] [CrossRef]
- Xing, H.; Zhao, L.; Wang, X. Review on research progress of C6F12O as a fire extinguishing agent. Fire 2022, 5, 50. [Google Scholar] [CrossRef]
- Cheng, L.; Wu, T.; Zhang, R. Electronic structures and OH-induced atmospheric degradation of CF3NSF2: A potential green dielectric replacement for SF6. J. Phys. Chem. A 2017, 121, 2610–2619. [Google Scholar] [CrossRef]
- Savruckis, D. Machine Learning Approach to Discovering Environmentally Friendly Alternatives to SF6 for Electricity Networks. Master’s Thesis, Department of Electrical and Electronic Engineering, University of Manchester, Manchester, UK, 2024. [Google Scholar]
- Zhong, R.; Liu, Y.; Wang, J. Insulation characteristics of C3F8 ternary gas mixtures from electron transport parameters and microscopic properties. In Proceedings of the IEEE International Conference on High Voltage Engineering and Application (ICHVE), Beijing, China, 6–10 September 2020. [Google Scholar]
- Wang, Y.; Zhang, T.; Liu, Q. Emissions, degradation and impact of HFO-1234ze from China PU foam industry. Sci. Total Environ. 2021, 780, 146631. [Google Scholar] [CrossRef]
- Ahmed, R.; Khan, M.A.; Ali, S. The insulation performance of novel refrigerant gas as an alternative to SF6 for medium voltage switchgear. IEEE Access 2024, 12, 47068–47079. [Google Scholar] [CrossRef]
- Ahmed, R.; Rizwan, M.; Khan, H. Analysis of the insulation characteristics of Hexafluorobutene (C4H2F6) gas and mixture with CO2/N2 as an alternative to SF6 for medium-voltage applications. Appl. Sci. 2023, 13, 8940. [Google Scholar] [CrossRef]
- Gao, Z.; Liu, J.; Xu, H. Investigation on insulation properties of HFO-1336mzz(E) and N2/CO2 mixtures as SF6 substitutes in gas-insulated electrical applications. High Volt. 2023, 8, 48–58. [Google Scholar] [CrossRef]
- Saleem, M.Z.; Ahmad, A.; Khan, I. Investigation on dielectric properties of chlorodifluoromethane and mixture with other N2/CO2/air as a promising substitute to SF6 in high voltage application. Electr. Eng. 2020, 102, 2341–2348. [Google Scholar] [CrossRef]
- Khan, S.A.; Ahmed, N.; Ali, M. R-134a and CO2 mixture as a sustainable alternative to SF6 and CO2. In Proceedings of the International Conference on Electrical Engineering (ICEE), Lahore, Pakistan, 27–28 February 2018. [Google Scholar]
- Rzouq, R.S.; Aljazzar, A.Y.; Saleh, A. Comparison between different gases used as insulation medium in high voltage technology and their effect on the environment. Ecol. Eng. Environ. Technol. 2023, 24, 60–70. [Google Scholar] [CrossRef] [PubMed][Green Version]
- Khan, B.; Ahmed, S.; Malik, M.A. Analysis of the dielectric properties of R410A gas as an alternative to SF6 for high-voltage applications. High Volt. 2019, 4, 41–48. [Google Scholar] [CrossRef]
- R-404A Safety Data Sheet. Available online: https://refrigerants.com/product/r404a/ (accessed on 5 March 2024).
- John, G.; Owens, P.E. Greenhouse gas emission reductions in power equipment through use of a sustainable alternative to SF6. In Proceedings of the IEEE/PES Transmission and Distribution Conference and Exposition (T&D), Denver, CO, USA, 16–19 April 2018. [Google Scholar]
- Montgomery, D.C.; Runger, G.C. Applied Statistics and Probability for Engineers, 7th ed.; Wiley: Hoboken, NJ, USA, 2018. [Google Scholar]
- Zhang, X.; Li, Y.; Wang, H. Experimental studies on power frequency breakdown voltage of CF3I/N2 mixed gas under different electric fields. Appl. Phys. Lett. 2016, 108, 092901. [Google Scholar] [CrossRef]
- Beroual, A.; Khaled, U.; Coulibaly, M.L. Experimental investigation of the breakdown voltage of CO2, N2, and SF6 gases, and CO2–SF6 and N2–SF6 mixtures under different voltage waveforms. Energies 2018, 11, 902. [Google Scholar] [CrossRef]
- Song, X.; Zhang, Y.; Chen, M. AC breakdown characteristics of CF3I/N2 in a non-uniform electric field. IEEE Trans. Dielectr. Electr. Insul. 2016, 23, 2649–2656. [Google Scholar]
- Zhang, X.; Chen, R.; Li, Y. Experimental studies on the power–frequency breakdown voltage of CF3I/N2/CO2 gas mixture. J. Appl. Phys. 2017, 121, 103303. [Google Scholar] [CrossRef]
- Yamamoto, O.; Tanaka, T.; Yamada, S. Applying a gas mixture containing c-C4F8 as an insulation medium. IEEE Trans. Dielectr. Electr. Insul. 2002, 8, 1075–1081. [Google Scholar] [CrossRef]
- Hyrenbach, M.; Zache, S. Alternative insulation gas for medium voltage switchgear. In Proceedings of the Petroleum and Chemical Industry Conference Europe (PCIC Europe), Berlin, Germany, 7–9 June 2016. [Google Scholar]
- Kotsuji, H.; Nakamura, T.; Yamada, K. Investigation of discharge propagation in localized high-temperature SF6 gas with breakdown voltage measurement. IEEE Trans. Plasma Sci. 2023, 51, 429–436. [Google Scholar] [CrossRef]
- Kharal, H.S.; Khan, M.A.; Hussain, S. Environment-friendly and efficient gaseous insulator as a potential alternative to SF6. Processes 2019, 7, 740. [Google Scholar] [CrossRef]


Disclaimer/Publisher’s Note: The statements, opinions and data contained in all publications are solely those of the individual author(s) and contributor(s) and not of MDPI and/or the editor(s). MDPI and/or the editor(s) disclaim responsibility for any injury to people or property resulting from any ideas, methods, instructions or products referred to in the content. |
© 2025 by the authors. Licensee MDPI, Basel, Switzerland. This article is an open access article distributed under the terms and conditions of the Creative Commons Attribution (CC BY) license (https://creativecommons.org/licenses/by/4.0/).