Abstract
The widespread adoption of electric vehicles introduces significant challenges to power grid stability due to uncoordinated large-scale charging and discharging behaviors. By addressing these challenges, mobile energy storage systems emerge as a flexible resource. To maximize the synergistic potential of jointly scheduling electric vehicles and mobile energy storage systems, this study develops a collaborative scheduling model incorporating the prediction of geographically and chronologically varying distributions of electric vehicles. Non-dominated sorting genetic algorithm-III is then applied to solve this model. Validation through case studies, conducted on the IEEE-69 bus system and an actual urban road network in southern China, demonstrates the model’s efficacy. Case studies reveal that compared to the initial disordered state, the optimized strategy yields a 122.6% increase in profits of the electric vehicle charging station operator, a 44.7% reduction in costs to the electric vehicle user, and a 62.5% decrease in voltage deviation. Furthermore, non-dominated sorting genetic algorithm-III exhibits superior comprehensive performance in multi-objective optimization when benchmarked against two alternative algorithms.
1. Introduction
With the increase in global environmental awareness, efficient and clean energy is receiving more and more attention [1,2,3]. At present, governments are promoting the comprehensive popularization of electric vehicles by reducing and exempting the purchase tax and increasing basic charging facilities [4,5]. However, large-scale electric vehicles bring challenges to the stable operation of power systems [6,7]. In addition, with the widespread popularization of vehicle-to-grid technology, the interaction between electric vehicle users and the power grid puts forward higher requirements for power system energy management [8,9]. Therefore, determining how to scientifically reduce the impact of large-scale charging behavior on power grid operation has become an urgent scientific problem to be solved.
Electric vehicle charging and discharging management is the key to achieving stable operation of the power grid under a high electric vehicle penetration rate. In [9], a shared DC fast charging deployment method based on vehicle-to-grid technology is proposed for old residential areas with scarce charging facilities, which solves the problem of old residential areas struggling to withstand a certain electric vehicle penetration rate. However, this method ignores the real-time price guidance for vehicle-to-grid technology, resulting in the insufficient exploration of electric vehicle charging and discharging management methods. At present, the demand response based on the time-of-use tariff is an effective method to manage the orderly charging and discharging of electric vehicles [10]. On this time scale, electric vehicle charging station operators deliver the time-of-use tariff to guide the charging and discharging of electric vehicles, which smoothens the comprehensive load curve by utilizing the energy storage characteristic of electric vehicles. On the spatial scale, the time-of-use tariffs of different electric vehicle charging stations vary, which prompt a decentralized power output and input of electric vehicles to reduce the impact of large-scale charging and discharging behaviors on a single grid node. At present, many studies conduct research on the formulation strategy of time-of-use tariffs. Reference [8] proposes a vehicle-to-grid economic evaluation method based on driving scenario differentiation by constructing an integrated simulation and experimental verification framework, as well as a coupled analysis model of electricity price fluctuations and electric vehicle user driving patterns. The results indicate that the proposed method provides an important basis for the design of time-of-use tariff pricing mechanisms in the electricity market. In addition, research [11] proposes a hierarchical pricing mechanism, including the clearing price between electric vehicle charging stations and the distribution network and the retail price between electric vehicle charging stations and electric vehicle users. In addition, research [12] delivers a distributed coordination strategy based on the Nash bargaining game, which determines the time-of-use tariff while effectively balancing the profits between the distribution network and electric vehicle charging station operators. A multi-mode and dynamic pricing strategy between the distribution network and electric vehicle charging station operators is proposed in [13], which divides the charging behavior of electric vehicles into planned, real-time and emergency modes to optimize the operational efficiency of the distribution network according to indicators such as network loss, load distribution, and renewable energy integration. In addition, research [14] presents an optimal dispatching strategy based on a real-time pricing mechanism. Similarly, by analyzing the actual data of the electric vehicle charging station in the business district, a hierarchical dynamic pricing framework is proposed in [15]. Then, an improved heuristic algorithm is employed to solve the optimization framework, and the final results show that the electric vehicle user costs, electric vehicle charging station profits, and photovoltaic power consumption are balanced. The above studies explore the formulation strategy of the time-of-use tariff, which focuses on the guidance of this tariff on the charging behavior of electric vehicles, ignoring the impact of vehicle-to-grid behavior on the formulation of the tariff.
As an important flexible power supply resource with spatiotemporal transfer characteristics, mobile energy storage systems have attracted much attention [16]. In addition, the mobile energy storage system plays a vital role in the restoration of the power grid after a disaster [17]. At ordinary times, mobile energy storage system operators can utilize the time-of-use tariff mechanism to realize energy arbitrage [18]. Based on reinforcement learning, research [19] proposes a two-level optimal scheduling method for a mobile energy storage system, which realizes adaptive arbitrage under a complex battery model and data uncertainty. Finally, the arbitrage feasibility of the proposed method is verified by applying the real electricity price data of California. In addition, research [20] presents a deep reinforcement learning model based on the knowledge-assisted dual deep Q-network algorithm, which improves the learning efficiency of the algorithm by learning the optimal policy. The simulation results show that the proposed improved deep reinforcement learning algorithm significantly accelerates the learning process compared to the original algorithm and formulates an arbitrage maximization strategy for a mobile energy storage system. The studies [19,20] discuss the arbitrage feasibility of a mobile energy storage system under a time-of-use tariff, but neglect the collaborative scheduling strategy of electric vehicles and mobile energy storage systems. The authors in [21] regard a cluster of electric vehicles as a mobile energy storage system resource and proposes a dual layer reinforcement learning-based energy management framework, which employs different agents to supervise and manage the scheduling of the integrated energy system and electric vehicle charging and discharging strategies. The case studies show that the proposed framework effectively enhances the energy exchange between the integrated energy system and electric vehicle charging station, reducing operating costs. Meanwhile, comparative studies show that adding a mobile energy storage system to scheduling can further reduce costs. However, the description of the electric-traffic coupling model is vague, and the refined model of the dynamic road network is ignored. Considering the spatiotemporal characteristics of the mobile energy storage system and electric vehicles [22] establishes a two-layer interaction model between electric vehicle users and road operators based on a mobile energy storage system and electric vehicle energy management model. The results show that the interaction mechanism effectively solves the problem of new energy consumption, and improves the profits of electric vehicle users, mobile energy storage system operators, and highway operators.
As shown in Table 1, although the above research has explored the optimal scheduling methods of electric vehicles and mobile energy storage systems, there are still some research gaps:

Table 1.
Comprehensive comparison results of existing studies.
(1) The impact of traffic networks and dynamic pricing on the willingness of electric vehicle users is neglected. The decision of charging or discharging locations of electric vehicle users is determined by multiple factors, including the distance to the target electric vehicle charging station, real-time charging and discharging prices, and behavioral willingness. Therefore, a scheduling strategy that considers factors comprehensively is more referenceable.
(2) The joint optimal scheduling of electric vehicles and mobile energy storage systems in complex traffic networks remains underexplored. While the mobility of mobile energy storage systems and the distributed nature of electric vehicles exhibit spatiotemporal complementarity, existing research has predominantly focused on either the scheduling of isolated mobile energy storage systems or the charging management of static electric vehicles.
Therefore, to further explore the coordinated scheduling of mobile energy storage systems and electric vehicles, this paper proposes a joint scheduling model of mobile energy storage systems and electric vehicles considering the prediction of the spatiotemporal distribution of electric vehicles. The specific contributions are as follows:
(1) A time-of-use tariff is employed to guide the optimal scheduling strategy of electric vehicles. In the time-of-use tariff optimization stage, the impacts of traffic conditions, vehicle-to-grid behavior, and willingness of electric vehicle users on price formulation are considered. The actual road network topology and traffic flow model are used to simulate real traffic situations. In addition, a response model of electric vehicle users based on incentive level is adopted to reflect the response of these users to the time-of-use tariff.
(2) The joint optimal scheduling of mobile energy storage systems and electric vehicles is considered. This paper proposes a joint scheduling method for electric vehicles and mobile energy storage systems that dynamically formulates a time-of-use tariff, achieving an orderly charging and discharging of electric vehicles and mobile energy storage systems and ensuring stable system operation while improving the economic efficiency of multiple stakeholders.
The remaining contents of this paper are organized as follows: The road network and traffic flow models are constructed in Section 2. In addition, the spatiotemporal characteristics of electric vehicles and the evaluation models of user response willingness are established in Section 3. Section 4 introduces the coordinative and spatiotemporal scheduling model of electric vehicles and the mobile energy storage system and the solving method. In addition, the case studies are implemented in Section 5. Finally, the main conclusions are summarized in Section 6.
2. Road Network and Traffic Flow Modeling
2.1. Road Topology Model
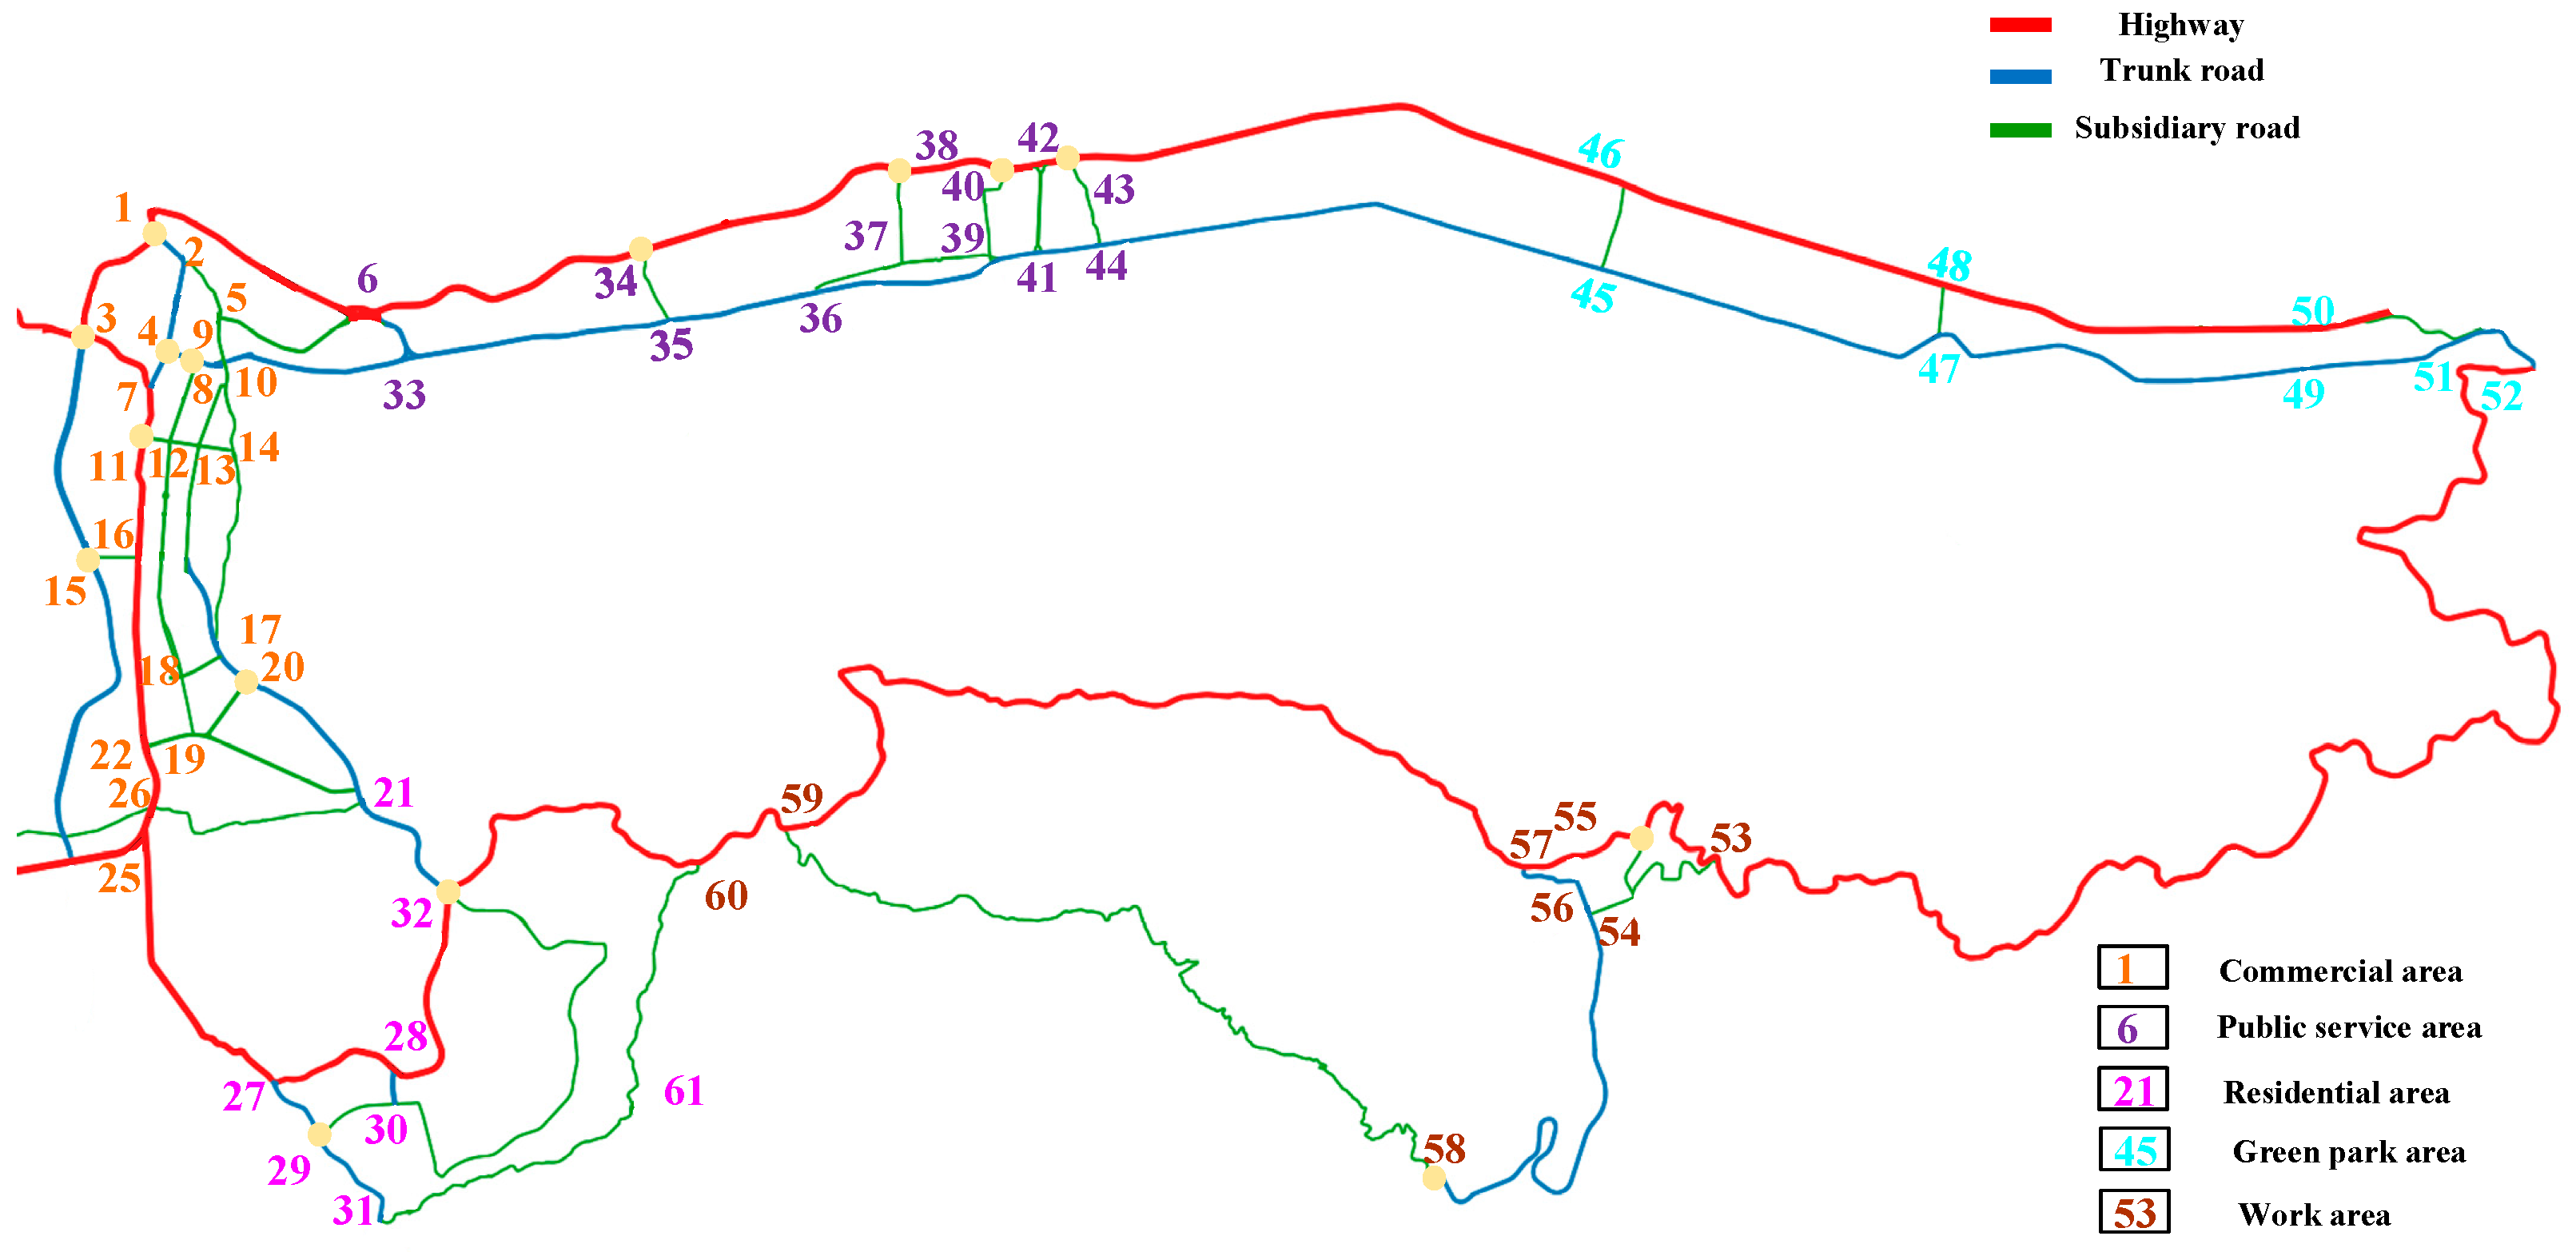
This study takes a typical city in southern China as the research object and carries out construction and visualization of an urban road network topology for the optimization and regulation needs of charging and discharging coordination between electric vehicles and mobile energy storage systems. The road topology is carried out through the following three steps: First, urban road network vector data based on an open-source geographic information platform are obtained, where the original data are filtered, classified, and structured for processing. Second, a visual model of multi-level road networks is implemented on the QGIS platform, with a focus on preserving and highlighting the three levels of road systems. Finally, the node numbers are customized and classified. The topology structure and node classification results of the urban road network formed by the above processing are shown in Figure 1.
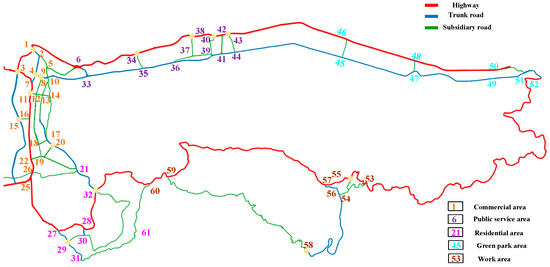
Figure 1.
Processed traffic network model.
2.2. Traffic Flow Model
Dynamic traffic network modeling is the prerequisite and foundation for analyzing electric vehicle behaviors in which the driving path of the electric vehicle is uncertain. To characterize the uncertainties of electric vehicle driving paths, a traffic flow model composed of a traffic-following model and transportation probability matrix is used to characterize uncertainties in this section. Compared to traditional traffic equilibrium models, this traffic flow model can accurately characterize the random behavior of electric vehicles on the road network.
2.2.1. Traffic-Following Model
The key to traffic flow modeling lies in the characterization of electric vehicles. The electric vehicle-following model considers the driving speed of the electric vehicle and the preceding electric vehicle, while the lane changing model of electric vehicles is modeled based on their driving route and surrounding traffic conditions, which can reflect their driving behavior under real traffic conditions [23]. In addition, the following model is a collision-free model based on the safe speed mode. The safe driving speed of electric vehicles is detailed as follows:
where is the speed of the preceding electric vehicle at time ; is the distance between the current and preceding electric vehicle; represents the reaction time of the driver; denotes the driving speed of the current electric vehicle; and is the maximum deceleration speed.
In an actual road network, there is often a maximum driving speed limit on urban roads, and the safe speed of vehicles may exceed the road’s speed limit. Therefore, the expected speed of vehicles is as follows:
where is the maximum driving speed.
Due to the driver’s operational behavior not being idealized enough to achieve the desired speed, it is necessary to subtract the random term from the expected speed. In addition, it is necessary to ensure that the vehicle speed is greater than 0. The final speed is as follows:
where is the random term, .
2.2.2. Transportation Probability Matrix
The analyzed road network is divided into 61 nodes and the simulation time period is divided into several time intervals of 15 min. In addition, the OD analysis method is applied to construct the electric vehicle travel behavior, which describes the number of travel exchanges between all starting and ending points and is a typical method for describing the traffic demand between a given traffic analysis area [24], as follows:
where , , , , and are the node sets located in the commercial area, public service area, residential area, green park area, and working area, and is the transition probability.
In addition, the topology of the road network and related traffic data can be represented through the graph theory method [4]:
where is represents the set of transportation networks; and , respectively, represent road network nodes and road sets in the road network; is the set of weights for each road, determined jointly by the road length and road impedance model; and , respectively, represent the actual length of the road and the set of traffic flow; is the total number of road network nodes; and and are the numbers of road nodes.
3. Spatiotemporal Characteristics of Electric Vehicles and Evaluation Model of User Response Willingness
To characterize the uncertainty of the spatiotemporal distribution and time-of-use tariff response willingness of electric vehicles, this section uses various probability distribution models to characterize the start time and parking time of electric vehicles. In addition, a response willingness evaluation model is used to describe the uncertainty brought by the subjective intention of electric vehicle users.
3.1. Temporal Characteristics of Electric Vehicles
This study analyzes the starting travel time, driving duration, parking time, and charging and discharging time to construct the complete time chain of electric vehicles [25]. The initial travel temporal characteristics of electric vehicles follow the Burl distribution, and the parking duration characteristics vary with the parking area [26]. The specific time distribution characteristics are shown in Table 2.
Table 2.
Time characteristic distribution.
It is worth noting that parameters α, β, C, K, γ, and μ in various probability distribution models are defined in [26].
3.2. Spatial Characteristics of Electric Vehicles
This study assumes that the initial distribution of electric vehicle starting positions is modeled as uniform across different node types. The choice of destination is determined based on the type of starting node, starting travel time, and transition probability matrix. After determining the starting point and destination, the Dijkstra algorithm is employed to solve the optimal path. The optimal path can be expressed as follows:
The driving speed and weather temperature are two key factors that determine the energy consumption per unit mileage. Specifically, different speeds correspond to different motor powers. The change in temperature not only affects the battery loss but also affects the electric vehicle’s air conditioning opening rate . In addition, the motor power of an electric vehicle is related to electric vehicle mass, driving speed, etc. The details can be found in [27].
The air conditioning on–off probability model is referenced in [28], and the air conditioning power is as follows:
where and represent the cooling and heating power of the air conditioner, respectively; and indicate the minimum threshold value of refrigeration and heating start, respectively; and and represent the unit power of refrigeration and heating, respectively.
Therefore, the electric vehicle power consumption can be represented as follows:
where is the driving time, , and and indicate battery capacity and battery efficiency, respectively.
3.3. Evaluation Model of Electric Vehicle User Response Willingness
The essence of user participation behavior is a subjective decision-making process, which is not only subject to the objective constraints such as the physical capacity of charging facilities and the number of adjustable electric vehicles, but also needs to consider the impact of users’ subjective will. Therefore, this paper introduces the response rate index to express the user’s subjective will, and establishes a subjective will evaluation model considering many factors.
3.3.1. User Response Rate Model Considering Incentive Level
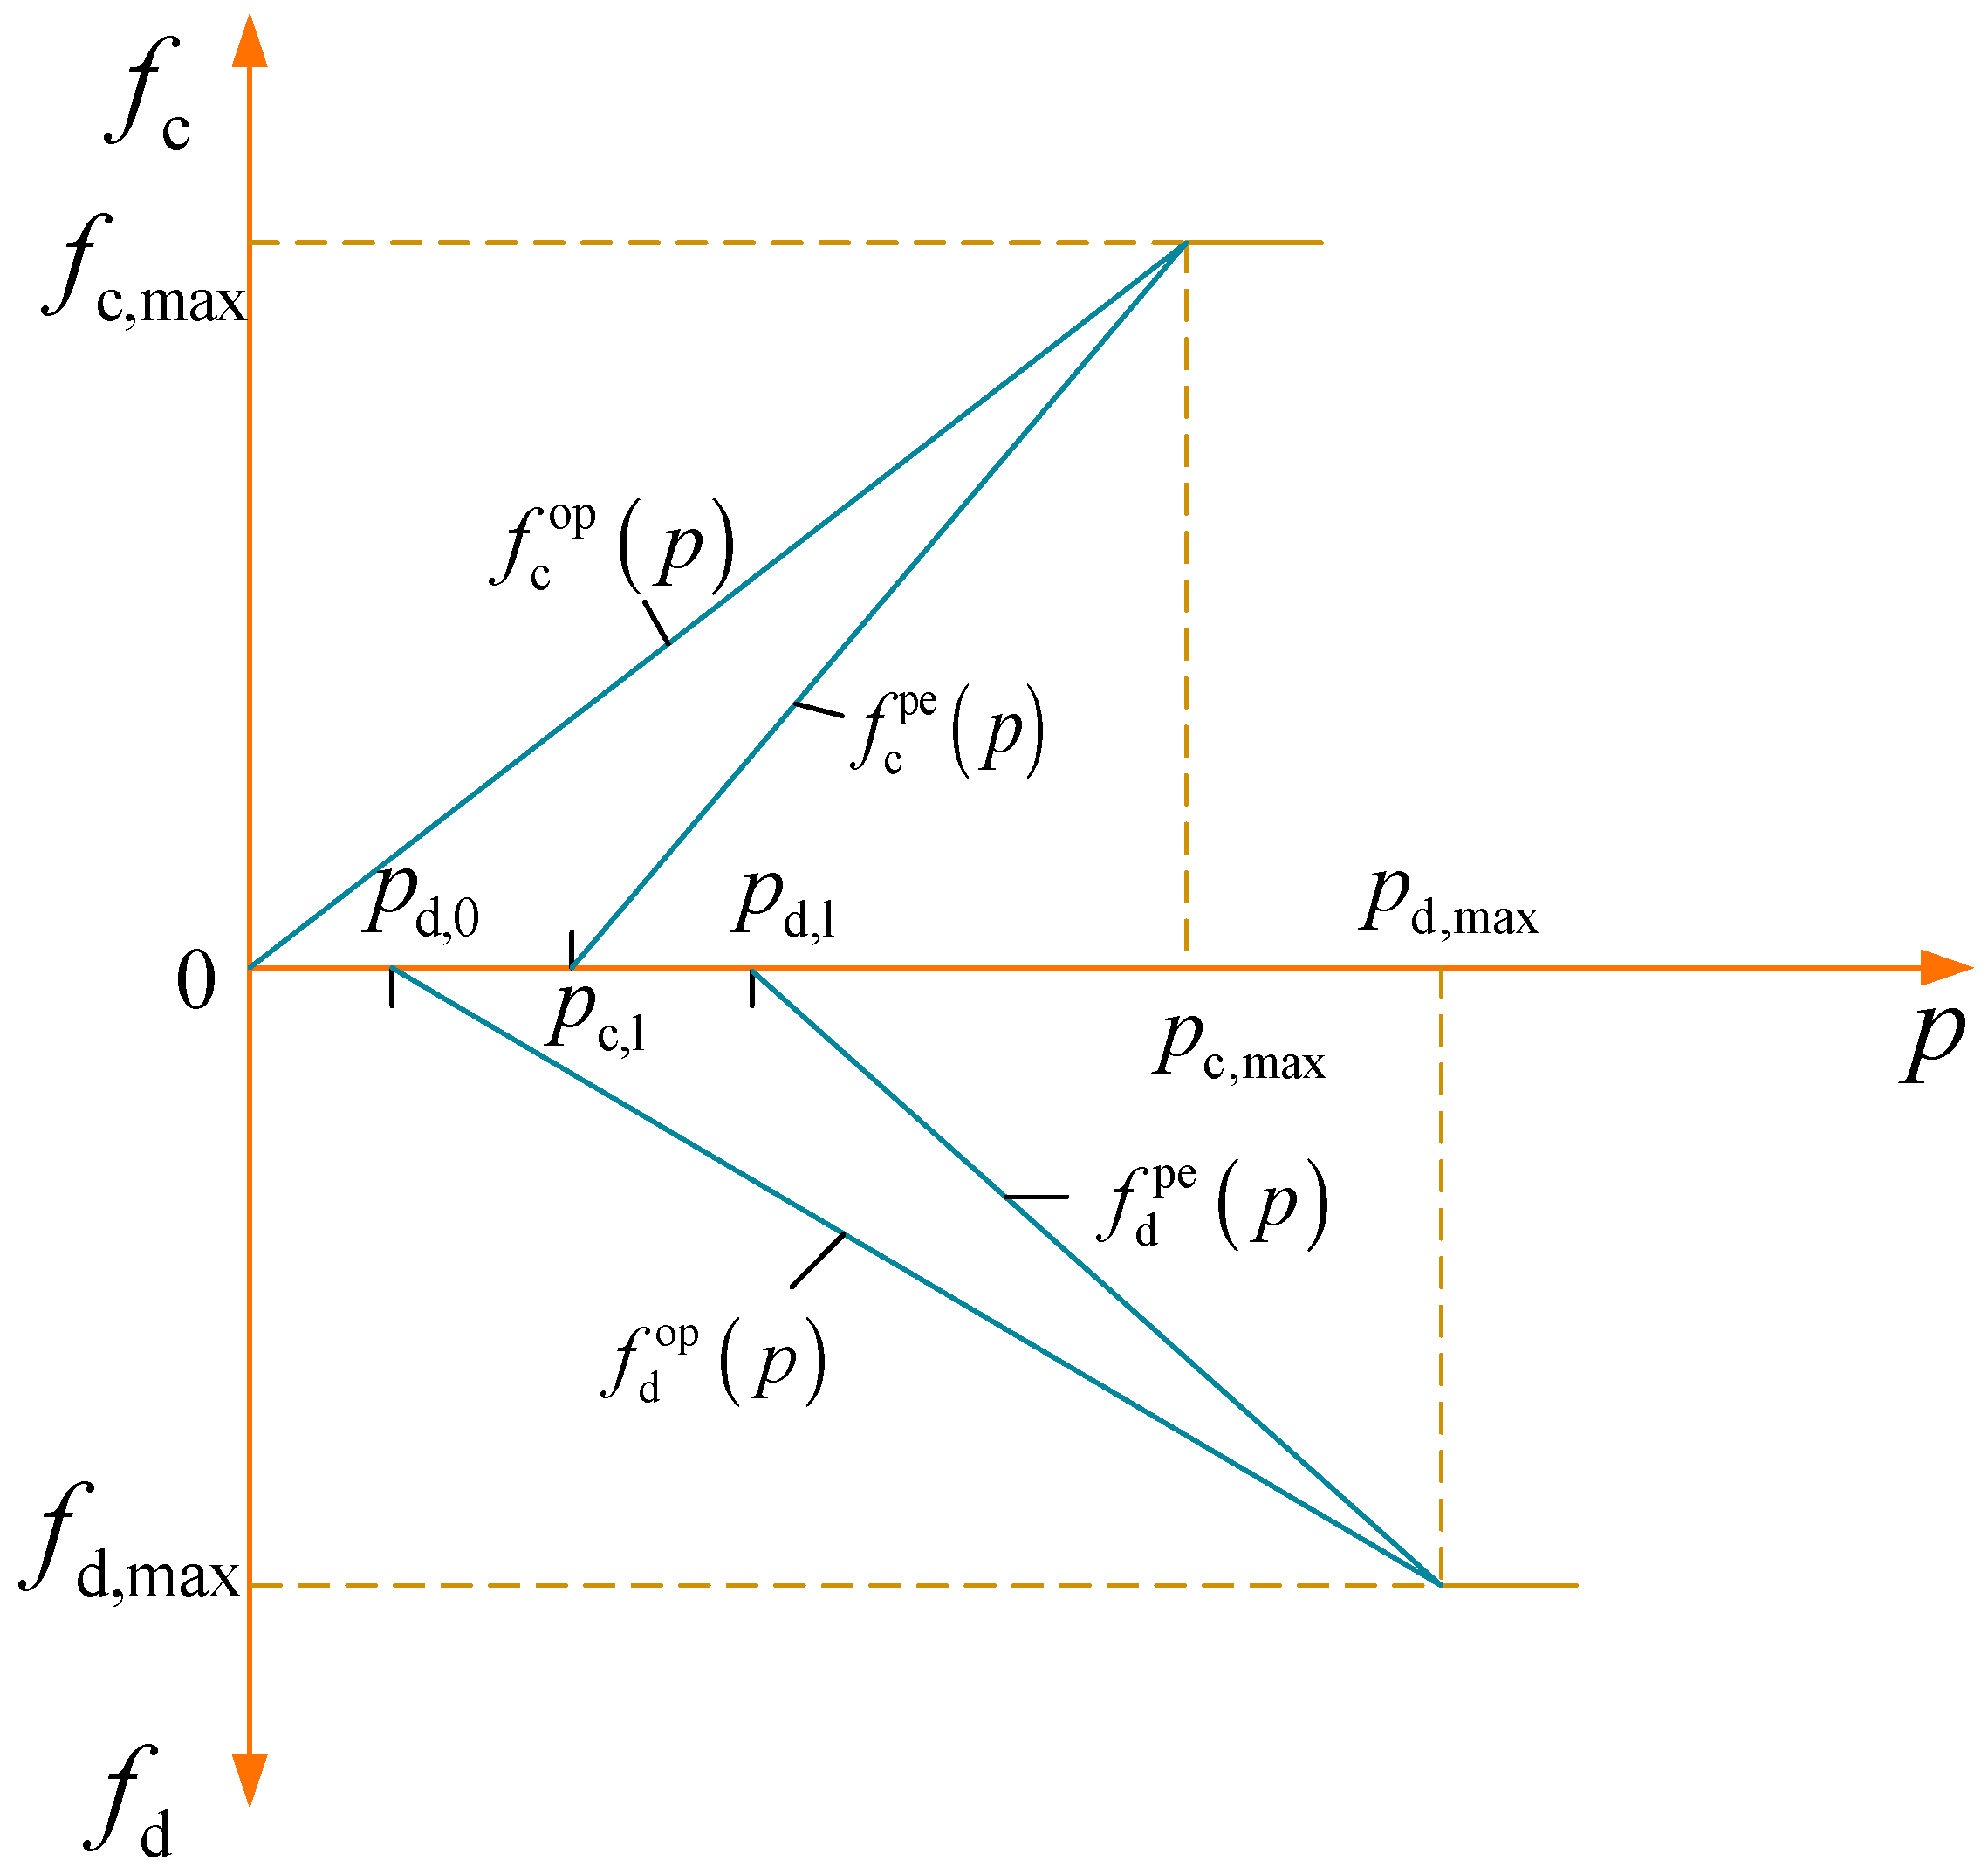
Based on the theoretical framework of consumer psychology [29], this study constructs a demand response model considering the dynamic characteristics of user behaviors. When the incentive price is lower than the electric vehicle user’s psychological threshold, the demand response behavior of this user is inhibited. When the incentive intensity exceeds the critical value, electric vehicle user response intention is activated and shows a positive correlation growth trend, and finally reaches the maximum response degree. In addition, the response behavior of these users has significant unsteady characteristics: under the same incentive level, affected by the external environment and individual differences, the electric vehicle user response rate will fluctuate around the benchmark value in both positive and negative directions. Therefore, this study uses the difference between the positive and negative response rates to quantify the uncertainty intensity of the user response, and constructs a differentiated charge–discharge response rate model based on the asymmetry of charge–discharge behavior [30]. The differentiated response rate model of user charging and discharging is shown in Figure 2. It is worth noting that all electric vehicle users use the same willingness evaluation mechanism, so the willingness of all electric vehicle users to charging and discharging for a certain price is the same, and there is no situation of preferential charging treatment or discharge overpricing only for partial electric vehicle users.
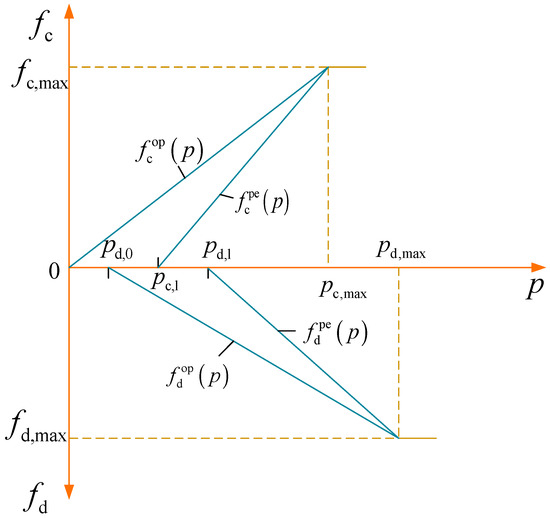
Figure 2.
Differentiated response rate model of electric vehicle user.
As shown in Figure 2, and are the positive and negative response functions of electric vehicle users charging, respectively. and are the positive and negative response curves of discharge, respectively. is the incentive price of an electric vehicle charging station for the unit response energy of electric vehicle users. and are the response rates for electric vehicle users. and are the maximum response rates. is the critical incentive of the charging response. is the critical incentive of the discharging response. and are the charging response saturation incentive and maximum charging response rate, respectively. and are the discharging response saturation incentive and maximum discharging response rate, respectively. is the minimum incentive level for the participation of electric vehicle users in the discharge response.
The expressions of and are as follows:
The expressions of and are as follows:
3.3.2. Positive Response Bias of Users
The positive response bias is defined in the above model to describe the degree to which the user is biased towards a positive response due to other factors, to determine the actual response of an electric vehicle user, as follows:
where is the actual response rate of an electric vehicle user, subscript indicates the response mode of an electric vehicle user; and is the distance between the th electric vehicle and the th charging station.
4. SpatioTemporal Joint Scheduling and Solution Method for Mobile Energy Storage Systems and Electric Vehicles
4.1. Charging and Discharging Model of Mobile Energy Storage System
The charging and discharging model is as follows [31,32]:
where is the capacity of a mobile energy storage system; and are the charging and discharging powers of a mobile energy storage system, respectively; and and are the charging and discharging efficiencies of a mobile energy storage system, respectively.
State of charge measures the remaining power of a mobile energy storage system [33,34], which is as follows:
where is the state of charge of a mobile energy storage system at time , and is the rated capacity of a mobile energy storage system.
4.2. Objective Function
The joint optimal scheduling of an electric vehicle and mobile energy storage system involves multiple interests. Therefore, in order to best balance the interests of the electric vehicle charging station operator, electric vehicle user, and grid, three objective functions are set up, which aims to maximize the interests of charging station operators and minimize the charging cost of electric vehicle users and the total deviation of grid voltage.
4.2.1. Profits of Electric Vehicle Charging Station Operators
The benefits or costs related to electric vehicle charging station operators include charging benefits from electric vehicle users , benefits from users discharging electric vehicles and selling to the grid , and net arbitrage benefits on mobile energy storage systems . Therefore, the sum of the above three benefits related to electric vehicle charging stations constitutes objective function I, that is, the comprehensive benefits of electric vehicle charging station operators. The details are as follows:
where and are the numbers of charging and discharging, respectively; and are the charging and discharging powers, respectively; and represent the charging and discharging price of the th electric vehicle charging station at time , respectively; and are the charging and discharging durations, respectively; and are the purchasing and selling price of distribution networks, respectively; is the aging cost factor of mobile energy storage systems; is the driving time delay in response to charging and discharging regulation; and is the coefficient of time cost.
4.2.2. Comprehensive Cost of Electric Vehicle User
The benefits and costs related to electric vehicle users include electric vehicle users’ charging costs and the discharge revenue from selling electricity to electric vehicle charging station operators . Therefore, the comprehensive cost of electric vehicle users is obtained by subtracting the discharge revenue from the charging cost, that is, objective function II, and the details are as follows:
where and are the time delays caused by electric vehicles participating in charging and discharging regulations, respectively.
4.2.3. Total Voltage Deviation
To consider the impact of the optimal scheduling of electric vehicles and mobile energy storage systems on the grid, the voltage deviation is set as objective function III to quantify the impact on the grid. The goal of voltage-coordinated optimization control in distributed networks is to minimize the total voltage deviation. This objective function is designed to ensure that the voltage level is maintained within a satisfactory range. The total voltage deviation is as follows:
where is the voltage of node at time ; is the reference voltage; and and are the upper and lower limits of voltage, respectively.
4.3. Main Constraints
4.3.1. Constraints of Charging and Discharging Price
To prevent the selfish behavior of electric vehicle charging station operators from leading to overpricing or preferential treatment, the time-of-use tariff of each electric vehicle charging station should be limited within a reasonable range, as follows:
where and are the lower and upper limits of charging price, respectively, and and are the lower and upper limits of the discharging price, respectively.
4.3.2. Constraints of Charging Demands
4.3.3. Grid Operation Constraints
4.4. Solving Method
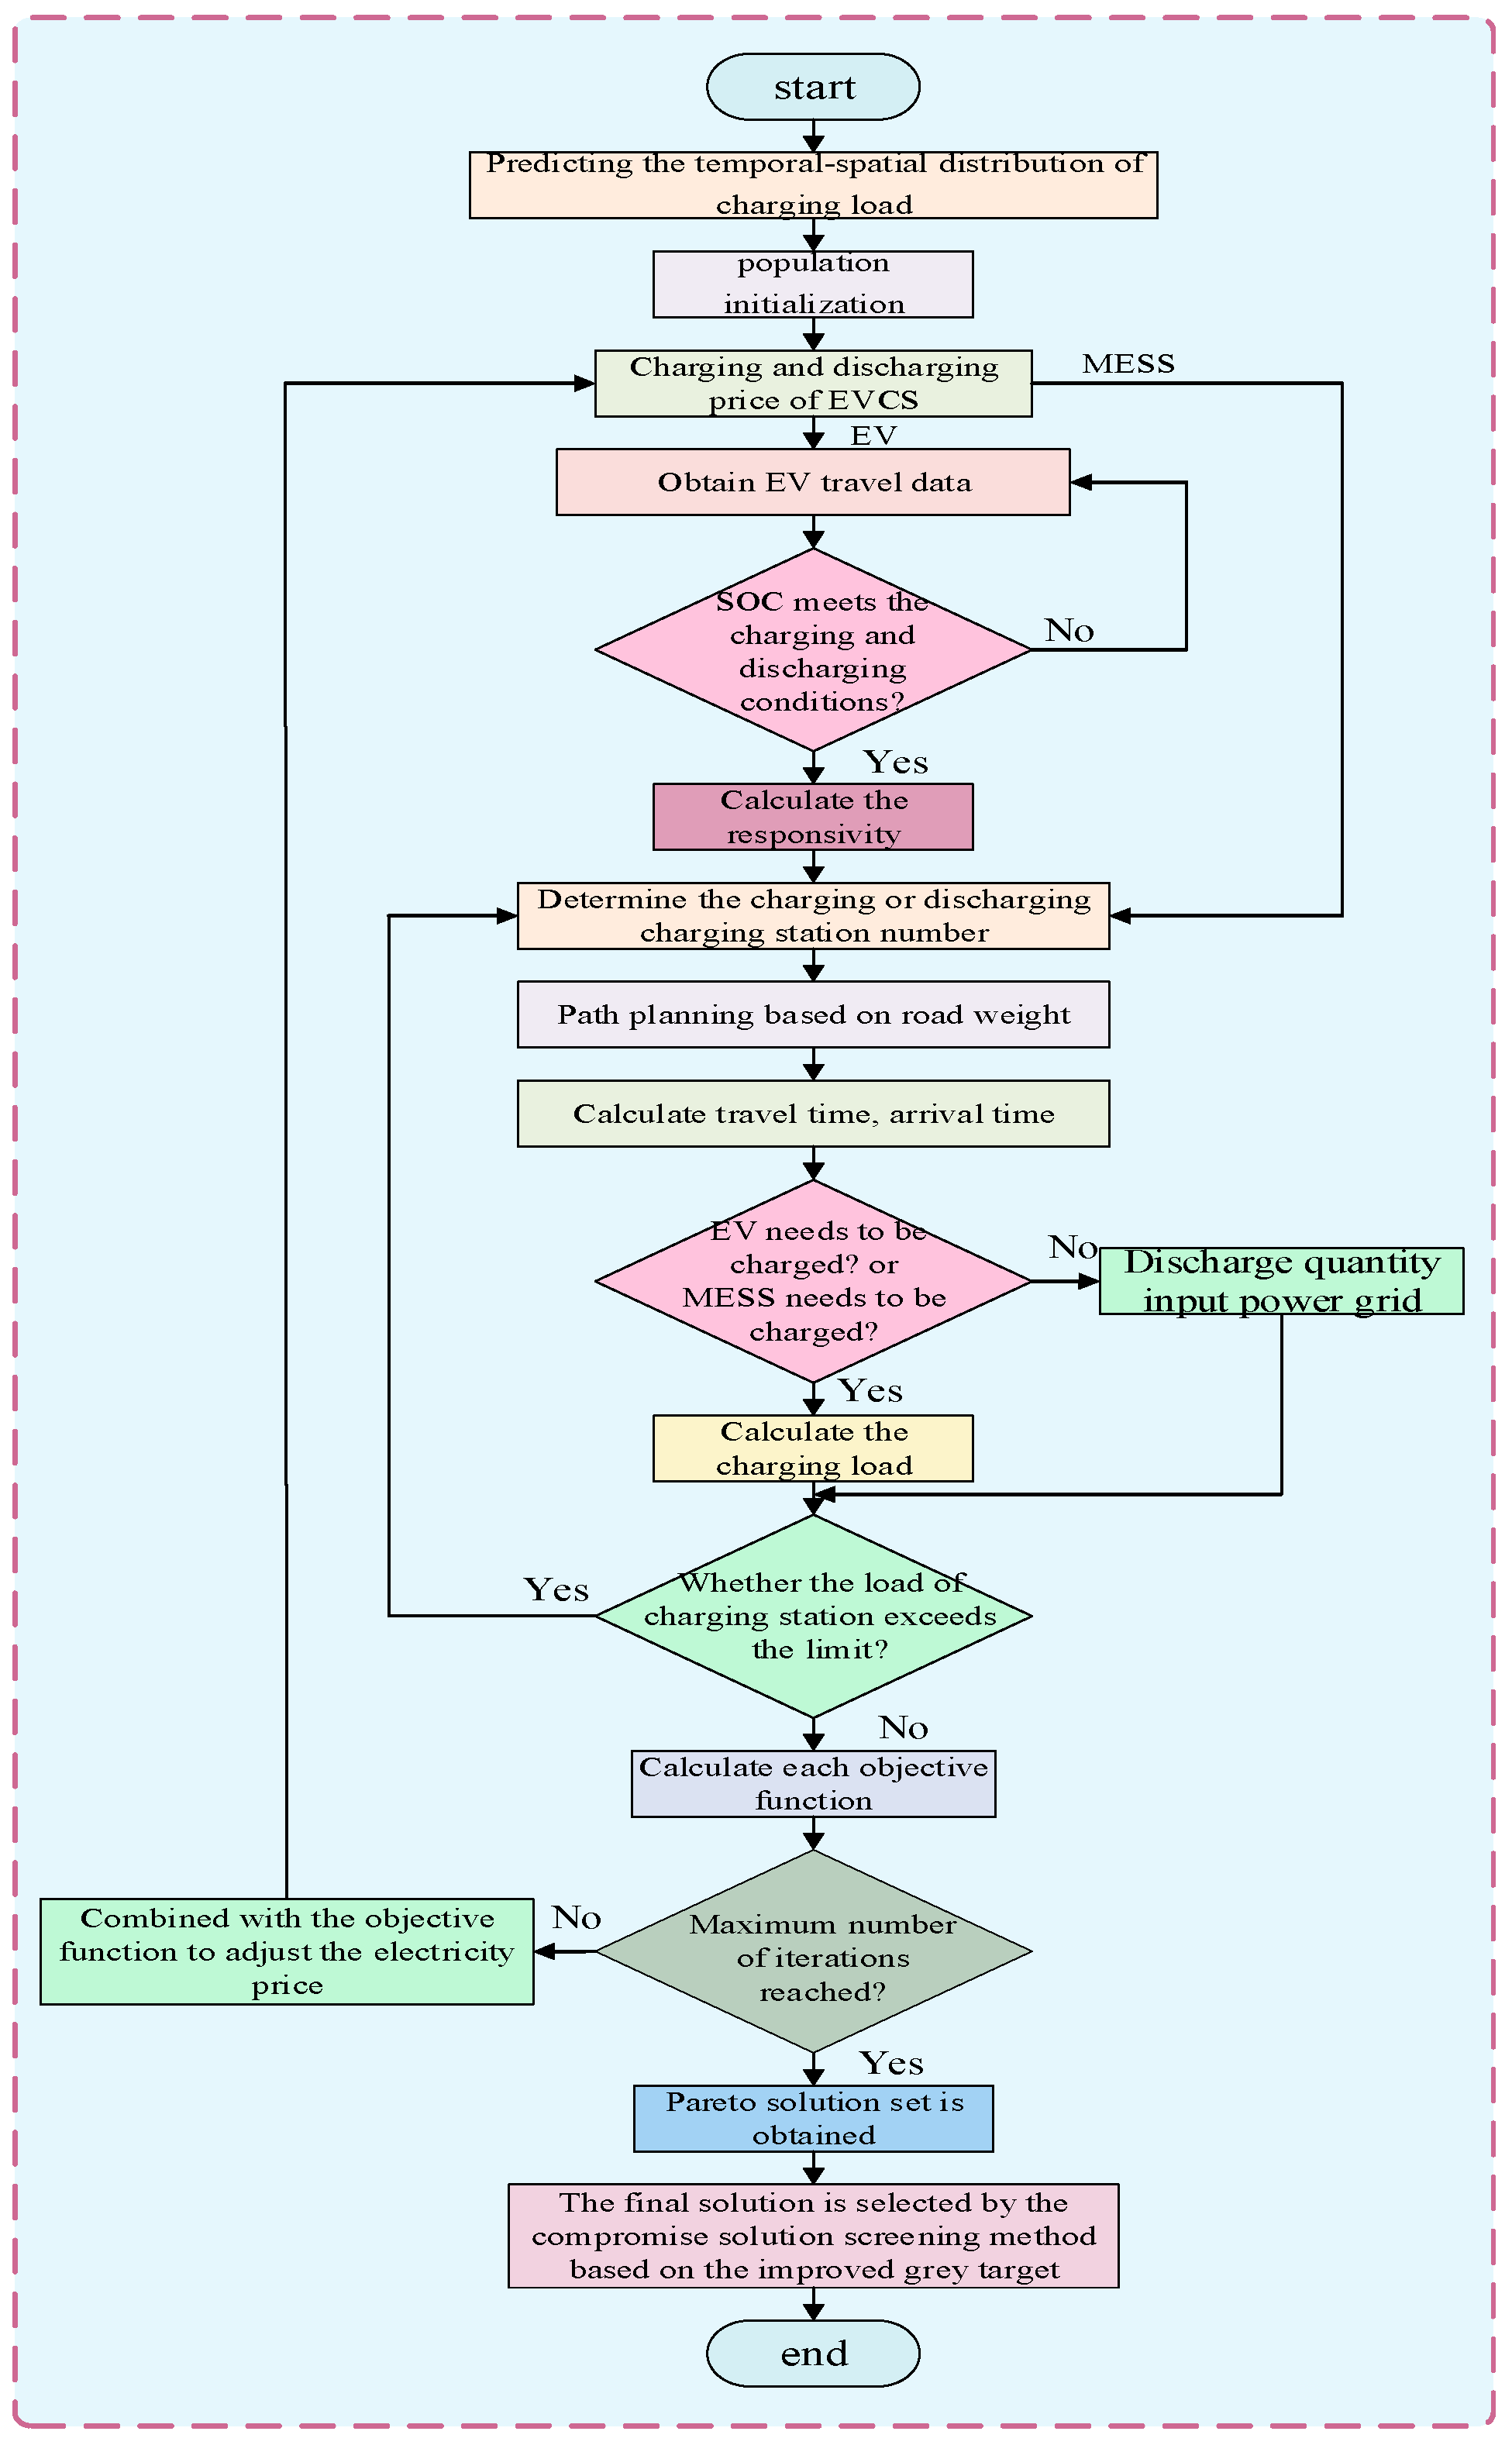
The multi-objective electric vehicle optimal scheduling model proposed in this paper is nonlinear, and the traditional optimization method is difficult to solve effectively. As an excellent multi-objective optimization algorithm, non-dominated sorting genetic algorithm-III has been widely applied to solve complex nonlinear problems [4]. Therefore, this algorithm is applied to solve the model in this paper, which possesses strong convergence performance and excellent global search ability. It should be noted this algorithm used in this study is not from the toolbox, but from the opensource website MathWorks [35]. Furthermore, an objective screening mechanism based on the improved gray target decision theory is introduced to scientifically select the best compromise solution from the Pareto solution set. The specific details can be referred from [36] and the solving process is detailed in Figure 3.

Figure 3.
The solution flow chart based on non-dominated sorting genetic algorithm-III and improved gray target decision theory.
5. Case Studies
5.1. Parameter Settings
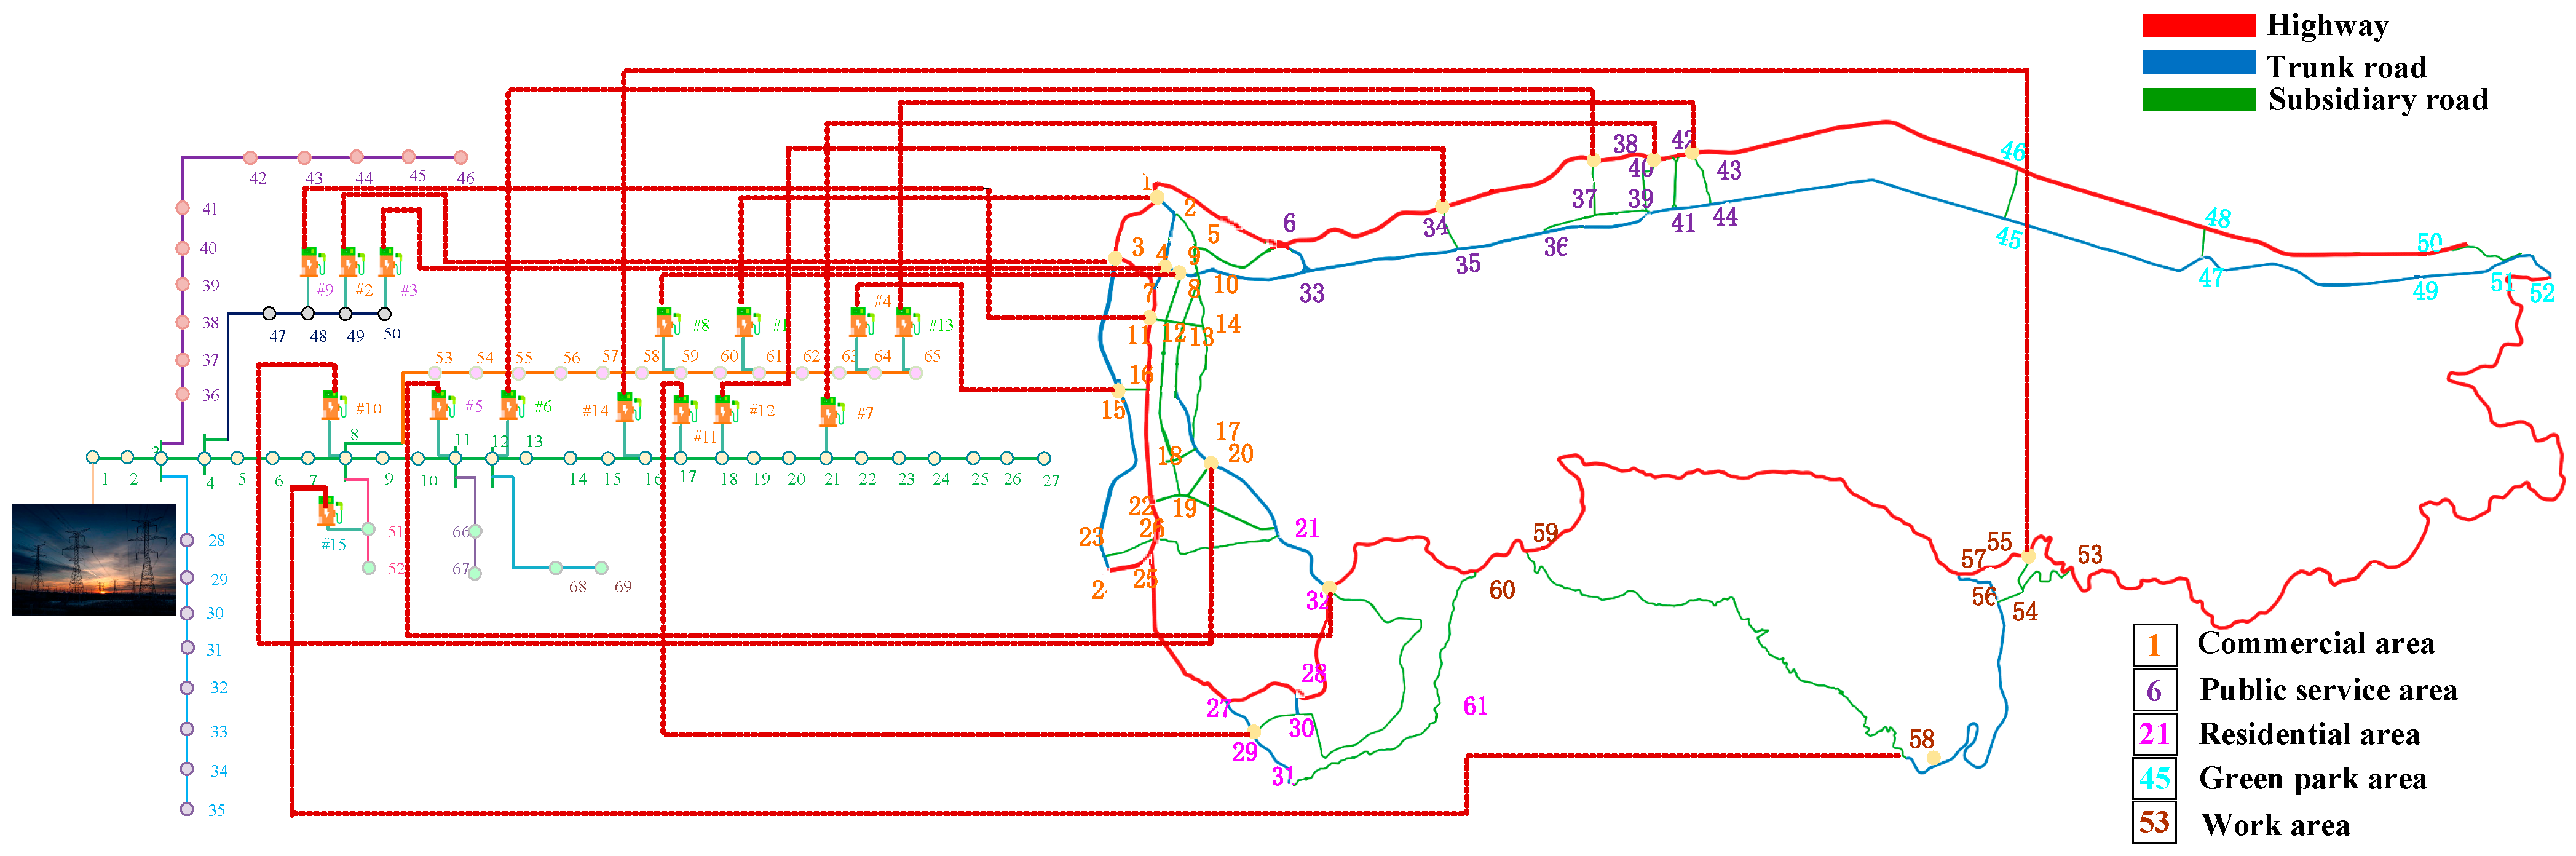
The grid load data in this study adopt the basic load of the IEEE-69 node system, and the schematic diagram of the grid-traffic coupling network is shown in Figure 4. In addition, 8000 electric vehicles are introduced into the traffic network, and the relevant parameters are shown in Table 3 and Table 4. Furthermore, wind power generation is added to grid nodes 34 and 26, and a photovoltaic array is added to grid nodes 62 and 45. The computer is configured with an Intel i5-12500 and 64 GB of RAM, and MATLAB R2023a is employed. In addition, the maximum number of iterations of and the population of non-dominated sorting genetic algorithm-III are 200 and 100, respectively.
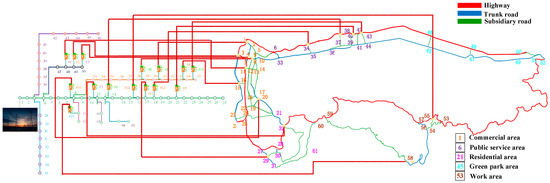
Figure 4.
Schematic diagram of electric-traffic coupling network.
Table 3.
Model parameter setting.
Table 4.
Electric vehicle parameter setting.
5.2. Analysis of Demand Prediction of Electric Vehicle Charging
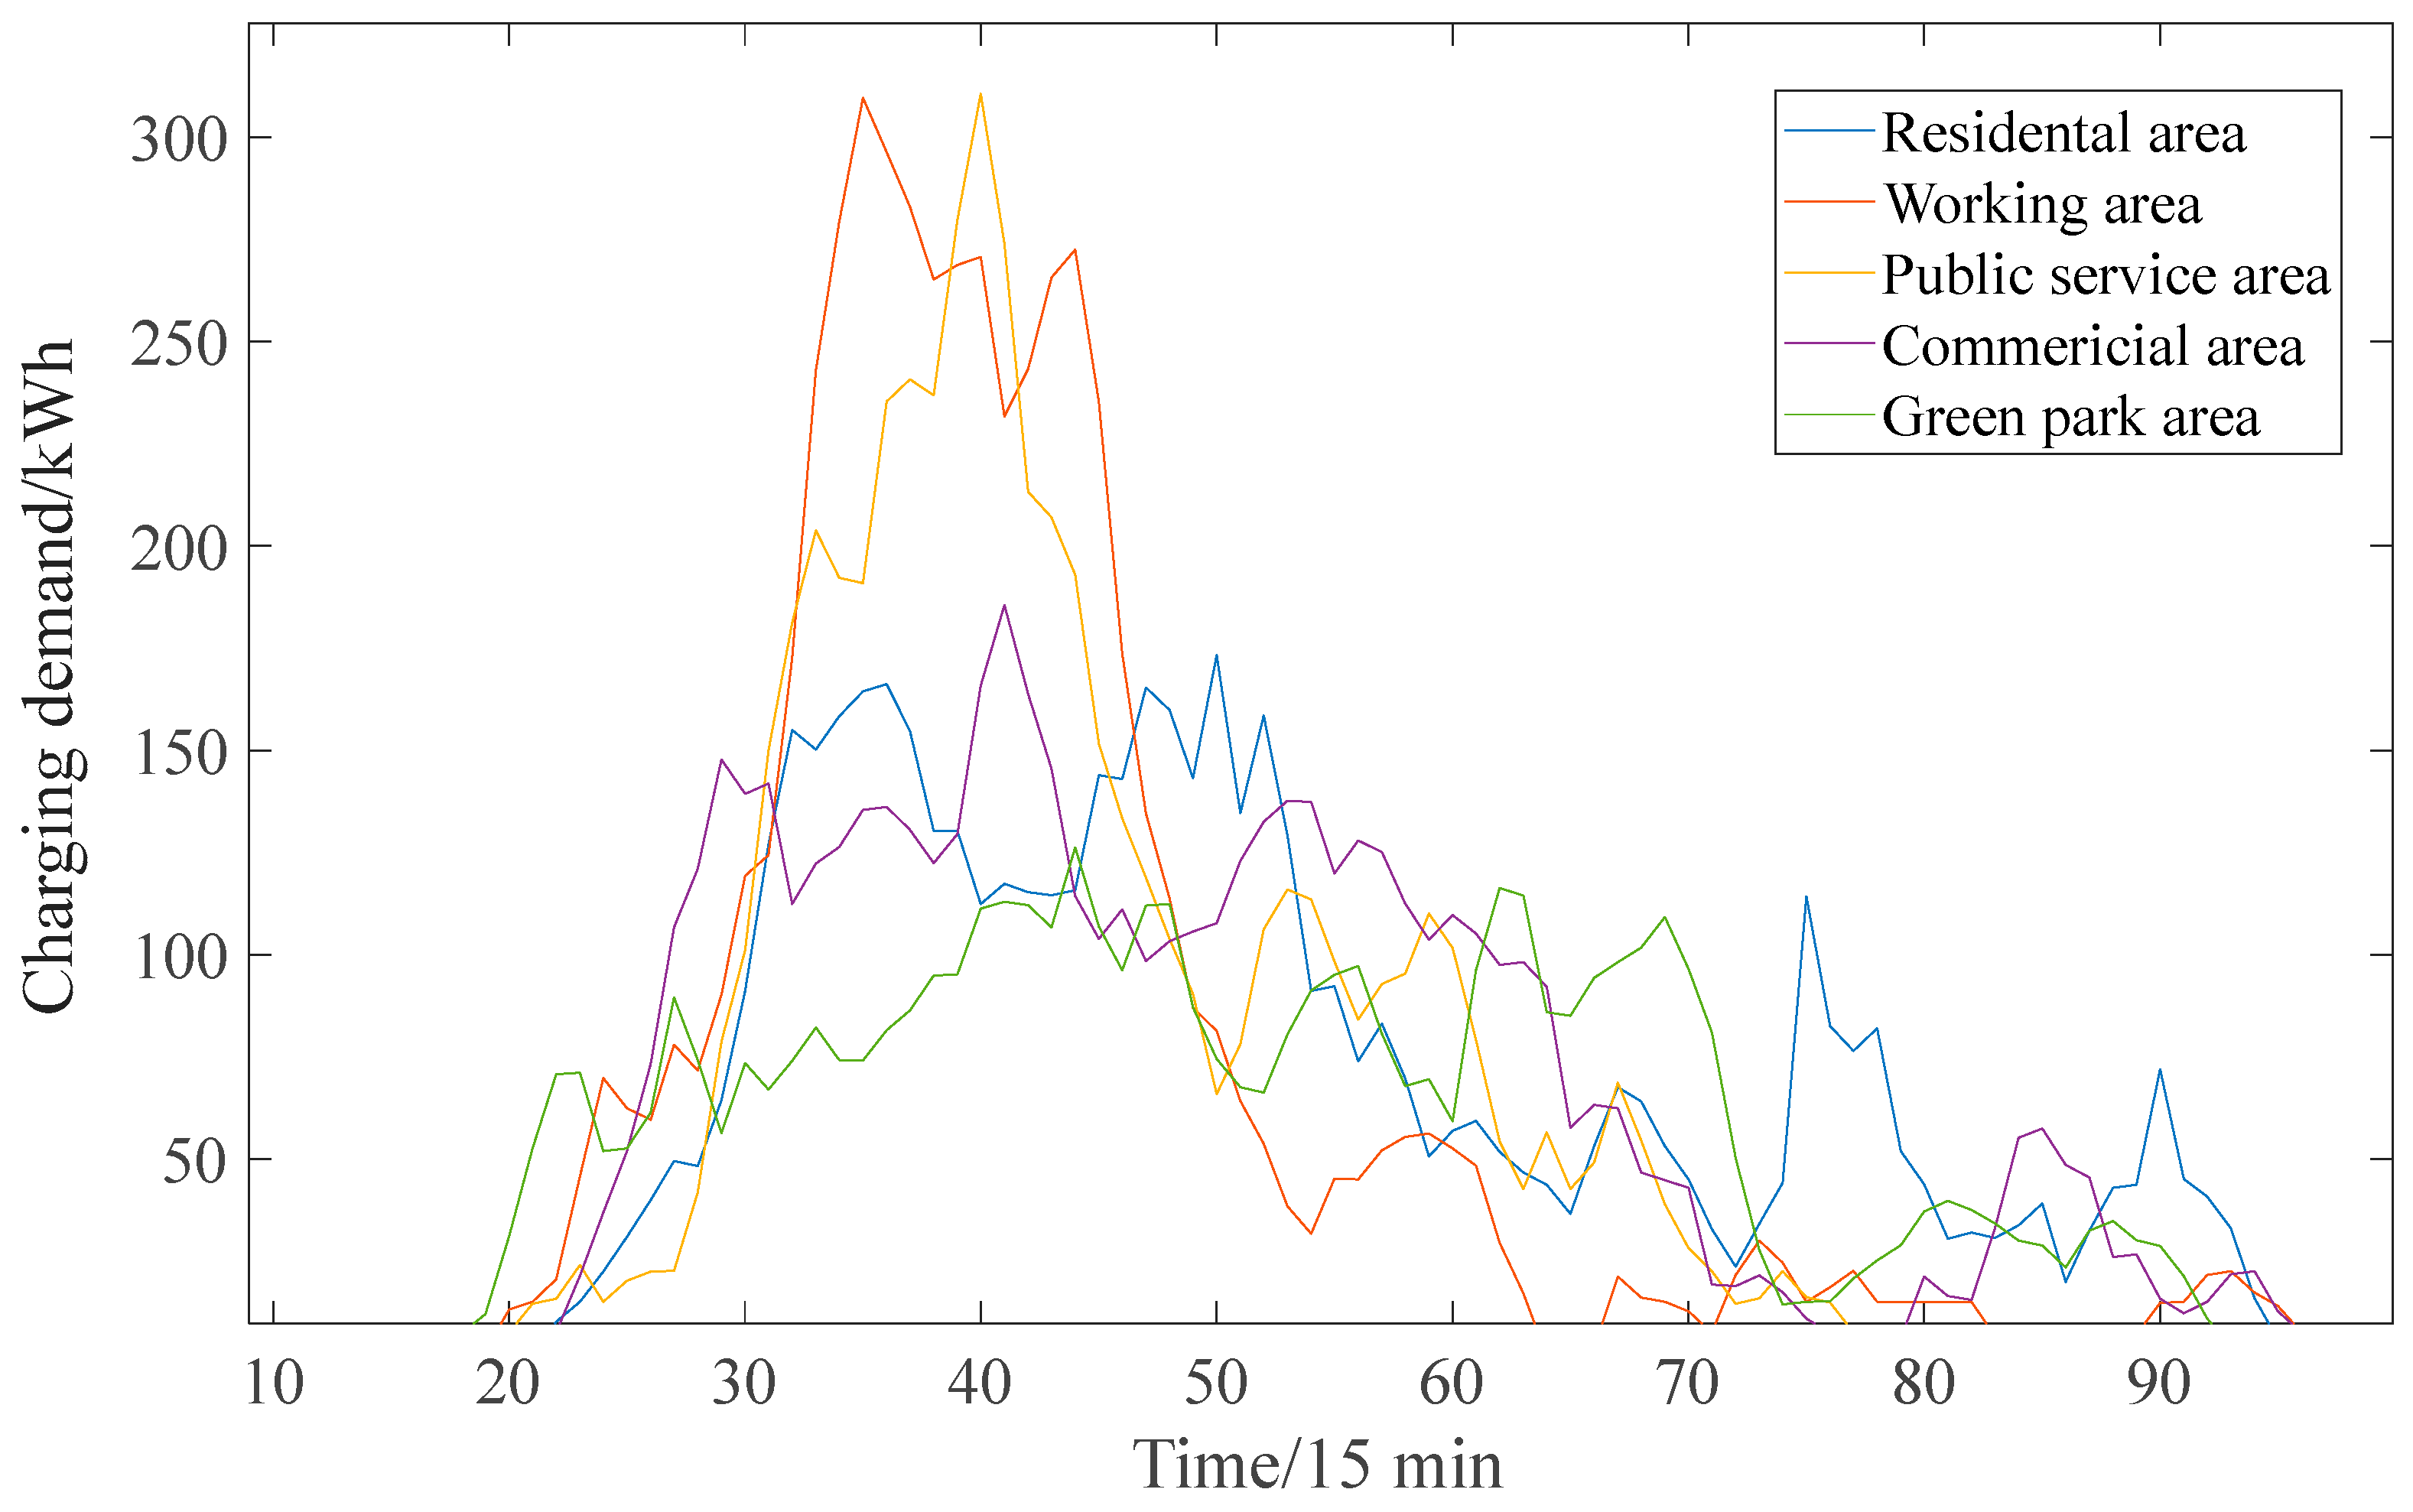
The charging demand forecasting results of each region are summarized in Figure 5. The data in the figure come from the prediction results of the charging demand prediction model. The specific prediction model method and process and references are shown in [4]. In general, the charging characteristic presents a double peak trend. Specifically, at around 8:00, electric vehicle users with charging needs will drive to the area close to the workplace for charging. Therefore, during the first peak period, from 7:30 to 11:15, the charging load demand in all regions reaches the peak, with the largest demand in the work area and public service area. The second peak of charging demand lasts from 18:45 to 22:30, with the highest demand in residential areas.
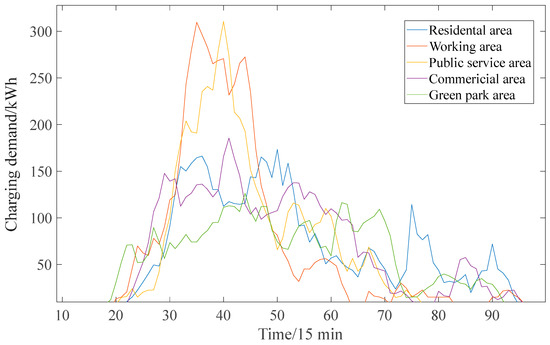
Figure 5.
Forecasting results of charging demand in different areas.
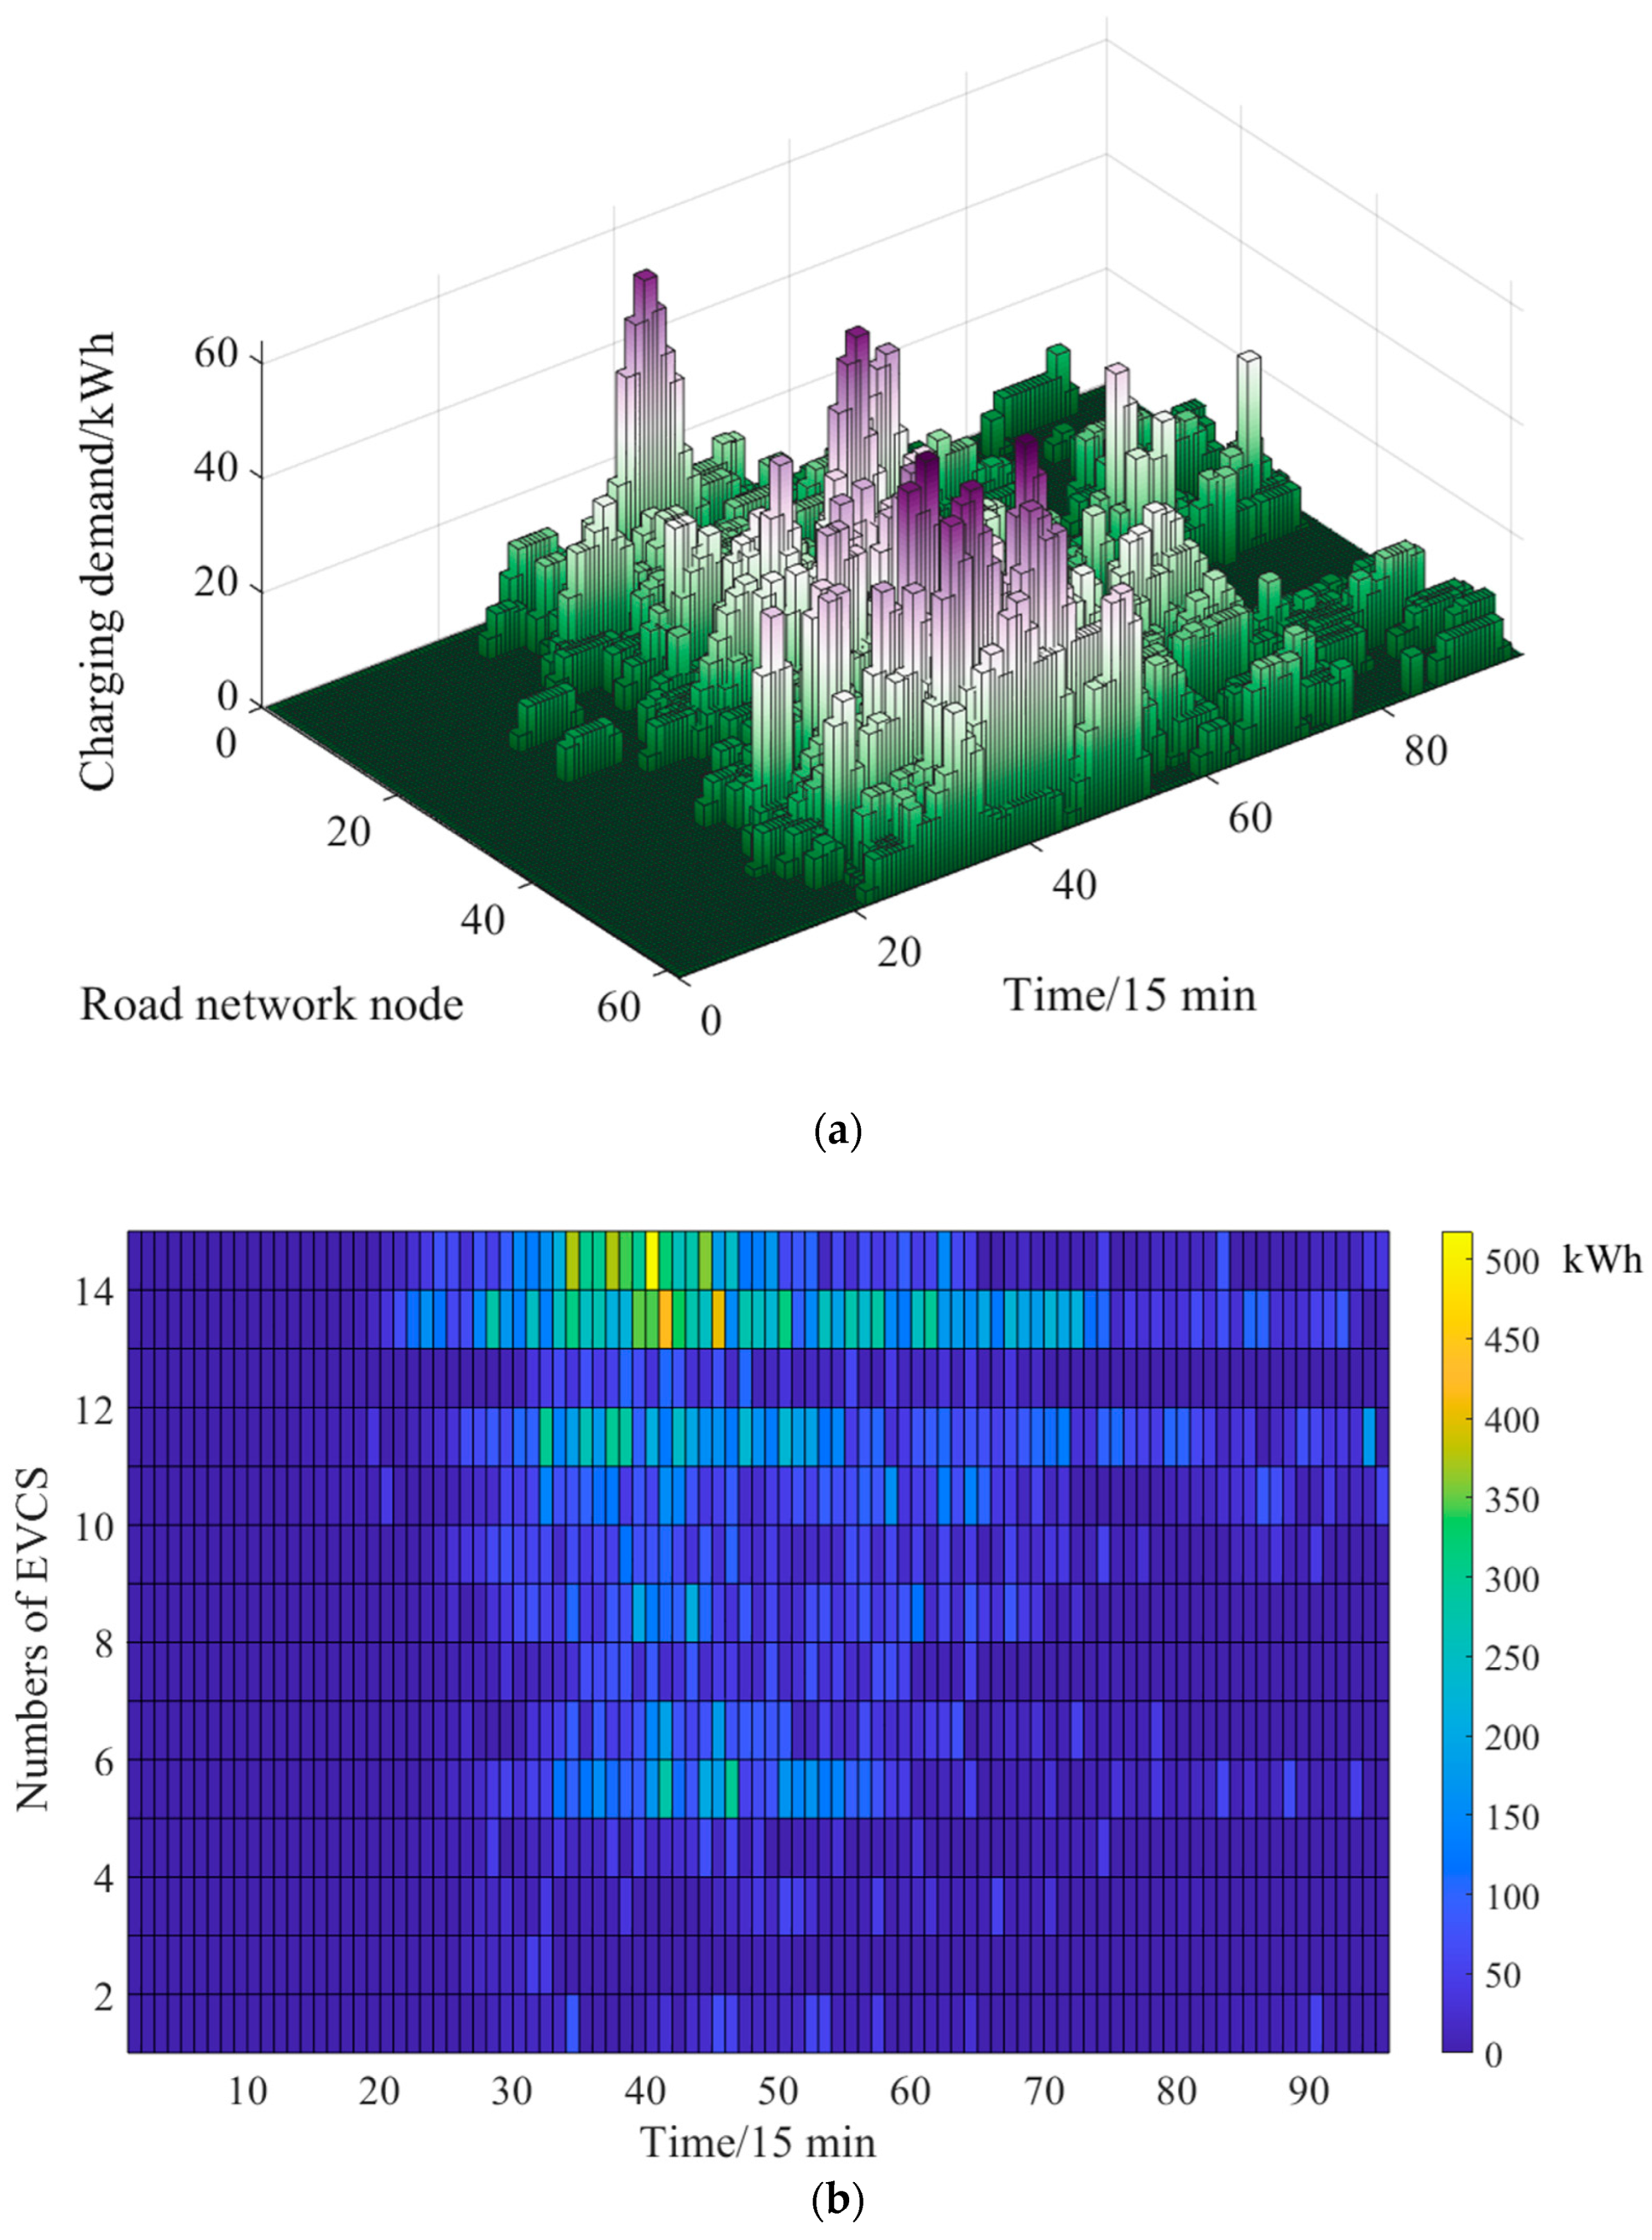
The charging demand of road network nodes is shown in Figure 6a. From the time scale, the total charging demand presents a double peak trend. The first charging peak lasts from 7:30 to 11:15. Within this period, the maximum charging demand of node 56 reaches 63.927 kW·h, which is the highest. In addition, many adjacent nodes around node 56 show a high charging demand, such as nodes 59, 57, 58, 55, 54, and 53. The second peak lasts from 18:45 to 20:30. Within this period, the charging demand of node 29 is the largest, reaching 37.225 kW·h. In addition, the overall demand of the second charging peak is not high, and the impact on the power grid is smaller than that of the first charging peak. The above analysis results are basically consistent with the analysis results in Figure 5. During the first peak period of charging demand, nodes located in public or work areas experience the highest global charging demand. During the second peak charging period, nodes located in residential areas experience a peak charging period.
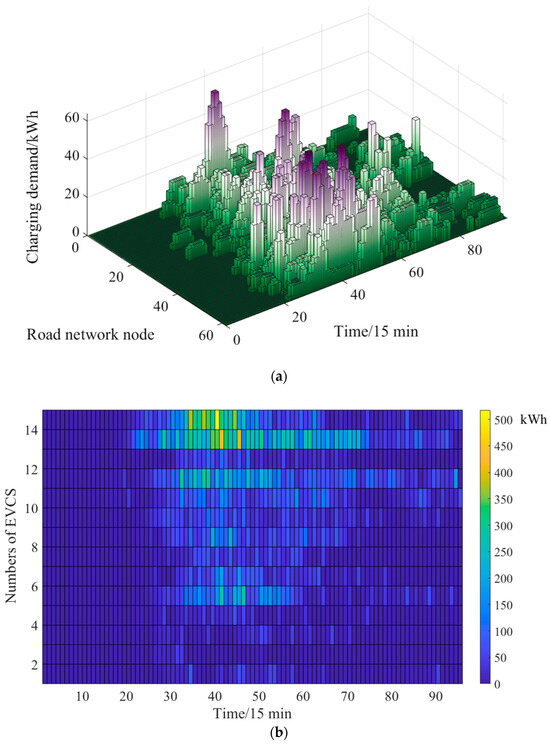
Figure 6.
Charging demand forecasting: charging demand of (a) road network node and (b) electric vehicle charging station.
As illustrated in Figure 6b, the three electric vehicle charging stations of #15, #14, and #13 bear the maximum charging demand. According to Figure 5, the three electric vehicle charging stations mentioned above are located at road nodes 58, 55, and 42, respectively. Road nodes 58 and 55 belong to the working area, while road node 42 belongs to the public service area. Therefore, the three electric vehicle charging stations will undertake higher charging demand tasks.
5.3. Analysis of Optimization Results
5.3.1. Comparison of Optimization Algorithms
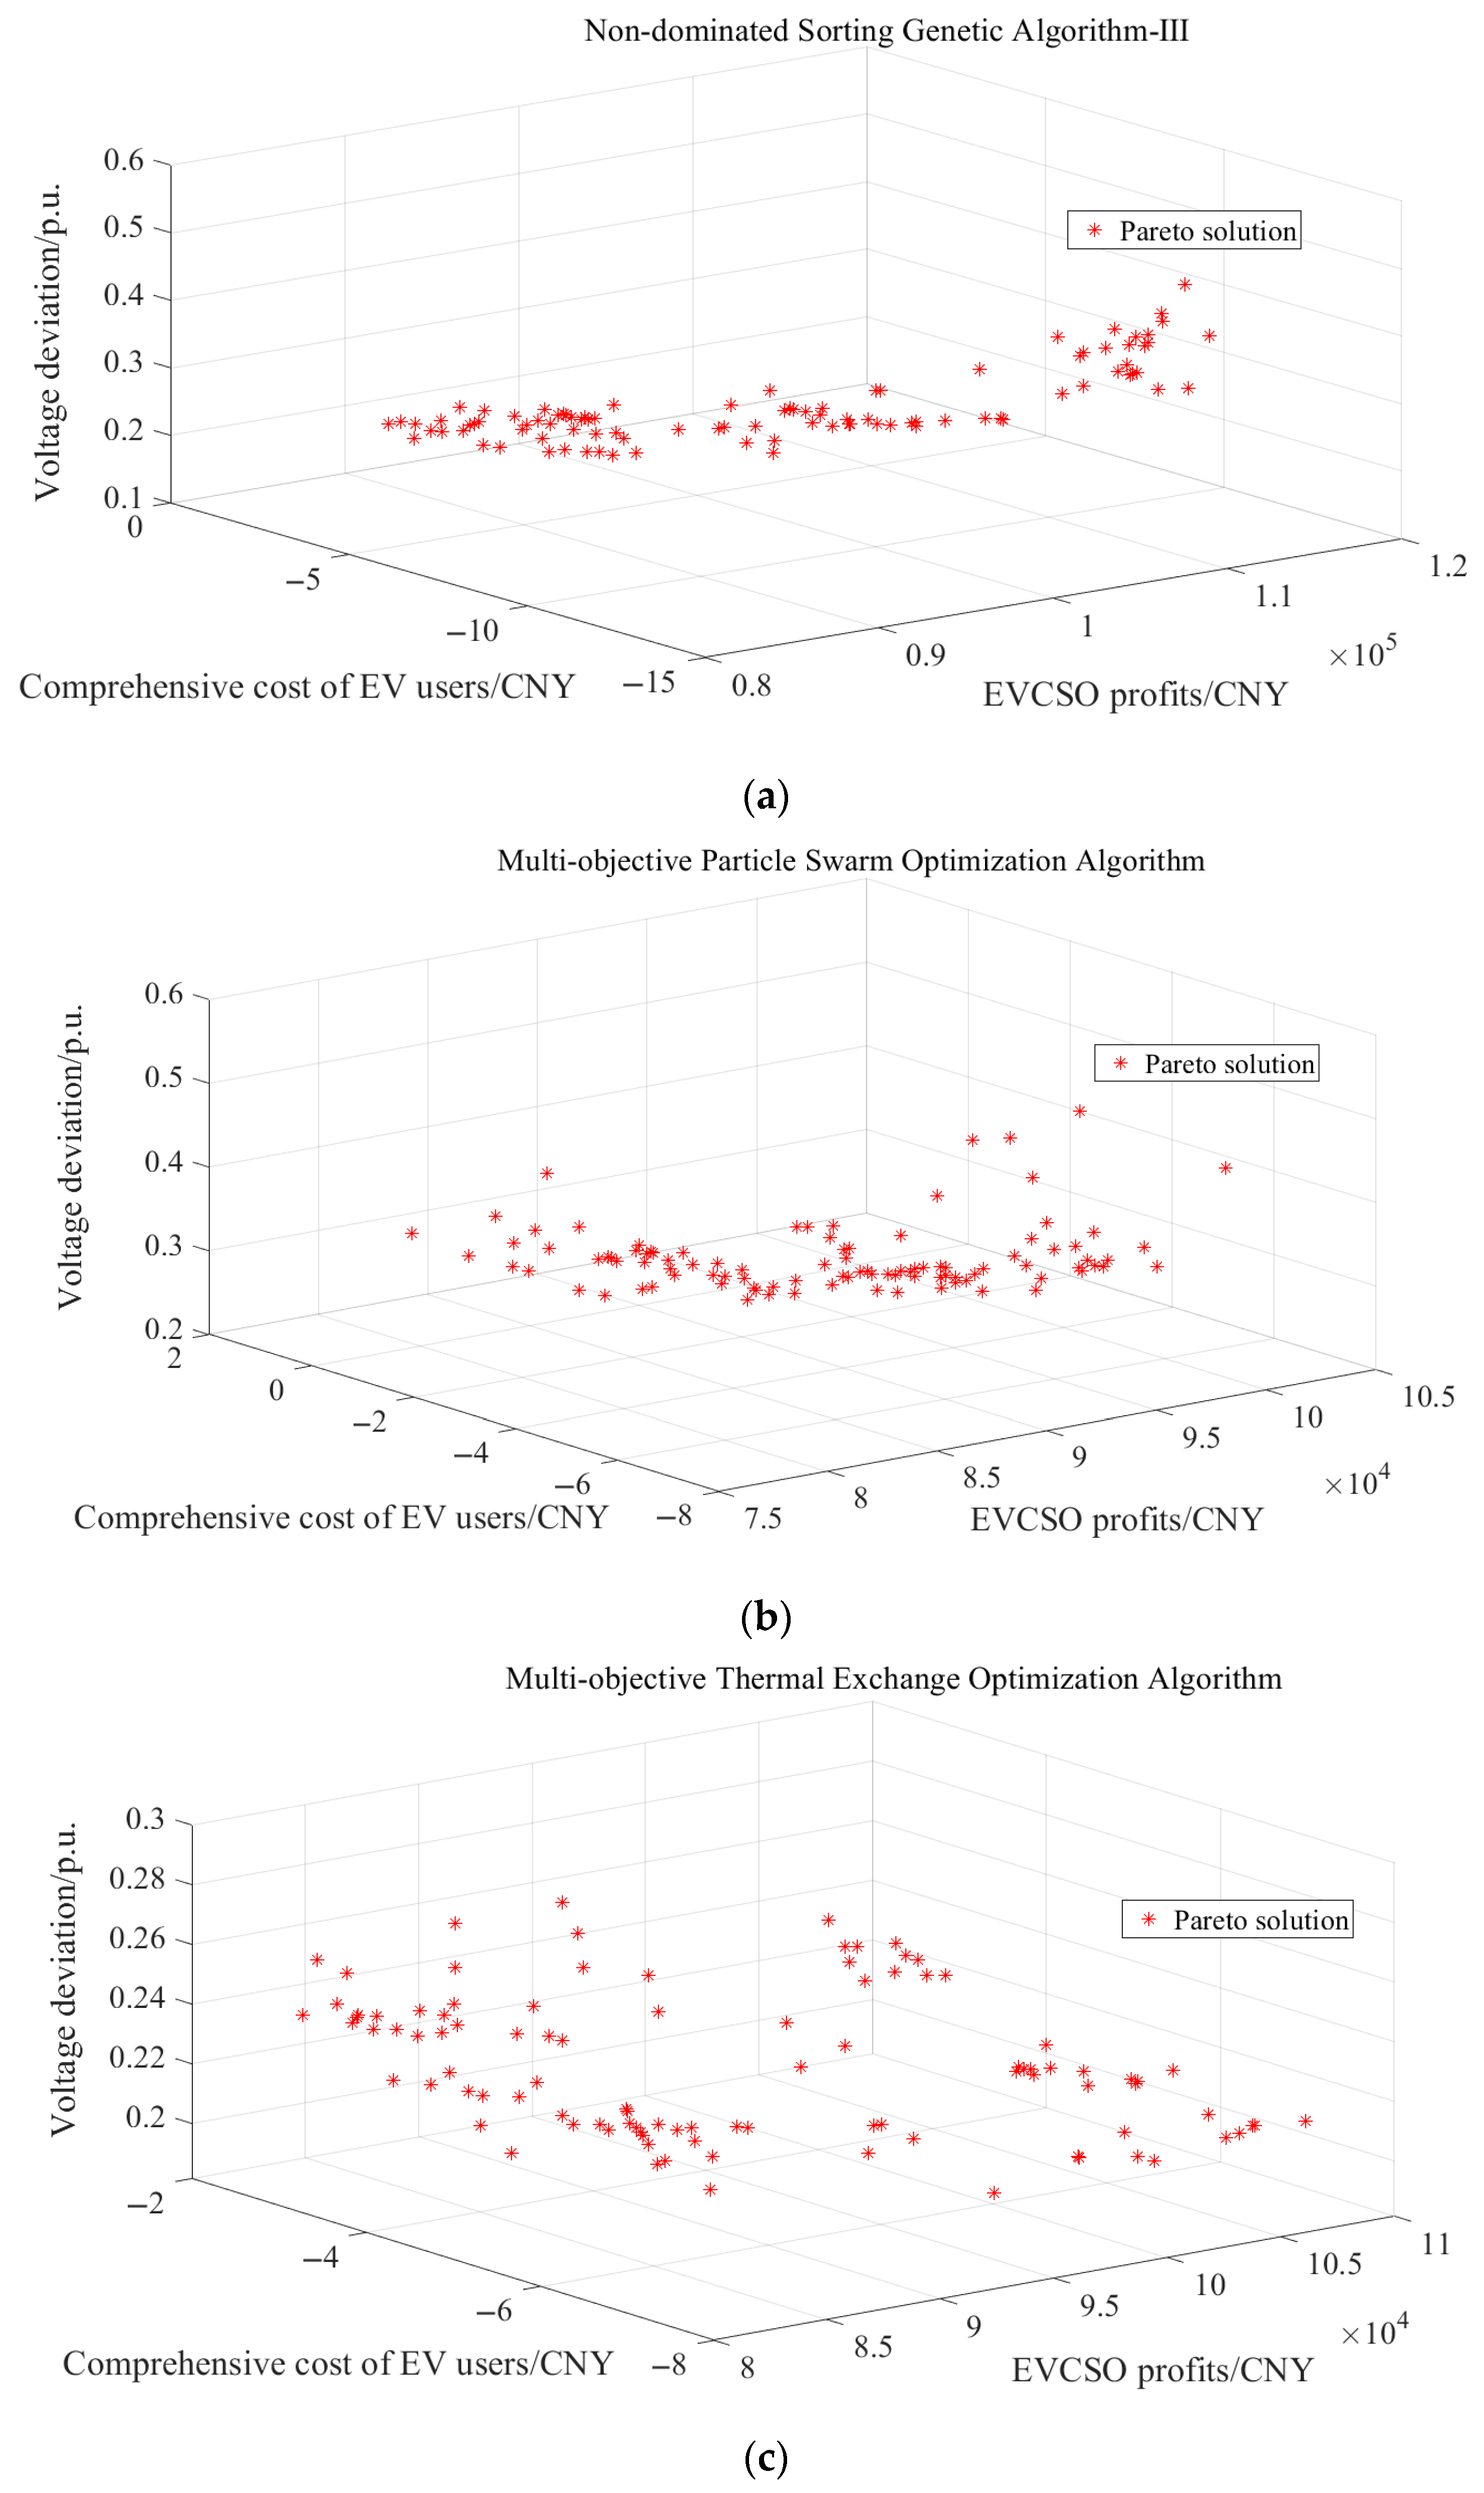
To demonstrate the optimization performance of various algorithms, the Pareto solution frontiers under various algorithms are shown in Figure 7. Compared to the multi-objective thermal exchange optimization and multi-objective particle swarm optimization algorithms, the Pareto solution set distribution of non-dominated sorting genetic algorithm-III approaches the ideal Pareto front simultaneously and is evenly distributed, which indicates that non-dominated sorting genetic algorithm-III has a stronger ability to search for the optimal solution set in complex solution spaces. In addition, under a maximum iteration number of 200, the total time costs are 728, 1244, and 1181 min for non-dominated sorting genetic algorithm-III, the multi-objective thermal exchange optimization algorithm, and the multi-objective particle swarm optimization algorithm, respectively. Although non-dominated sorting genetic algorithm-III achieves minimal time cost, it still remains inadequate for online scheduling or real-time planning applications.
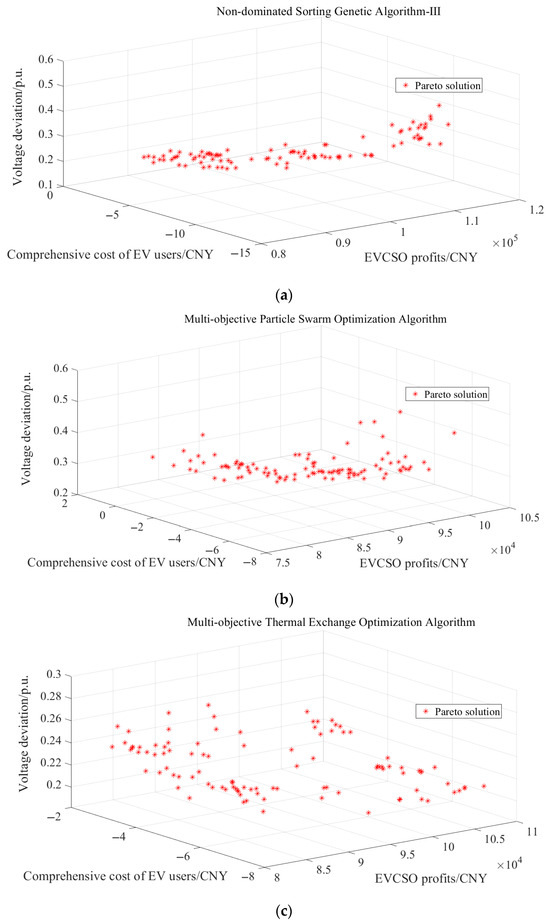
Figure 7.
Pareto solution diagrams under various algorithms: (a) non-dominated sorting genetic algorithm-III; (b) multi-objective particle swarm optimization algorithm; (c) multi-objective thermal exchange optimization algorithm.
The comparative analysis of optimization results documented in Table 5 shows that non-dominated sorting genetic algorithm-III exhibits comprehensive superiority in solving the proposed model. In terms of electric vehicle charging station operator profits, non-dominated sorting genetic algorithm-III achieves 95,408.52 CNY, an increase of 122.6% compared to the initial state (42,880 CNY), significantly ahead of the multi-objective particle swarm optimization algorithm (84,055.72 CNY, 96.0%) and multi-objective thermal exchange optimization algorithm (88,386.97 CNY, 106.2%). In terms of optimizing the cost of electric vehicle users, non-dominated sorting genetic algorithm-III reduces the average user cost to 30.99 CNY (56.01 CNY initial state), a decrease of 44.7%, which is better than those of the multi-objective particle swarm optimization (33.49 CNY, a decrease of 40.2%) and multi-objective thermal exchange optimization algorithms (31.93 CNY, a decrease of 43.0%). The user discharge revenue of non-dominated sorting genetic algorithm-III is higher at 40.37 CNY than those of the multi-objective particle swarm optimization (38.33 CNY) and the multi-objective thermal exchange optimization algorithms (37.52 CNY), leading by 5.3 and 7.6%, respectively. Although the multi-objective thermal exchange optimization algorithm maintains an advantage in voltage deviation control (0.215 p.u.), non-dominated sorting genetic algorithm-III still reduces the voltage deviation to 0.248 p.u. (0.661 p.u. initial state), which is better than the multi-objective particle swarm optimization’s 0.337 p.u. and within a safe range. In summary, non-dominated sorting genetic algorithm-III has advantages in the two indicators of increasing electric vehicle charging station operator profits and reducing electric vehicle user costs, while also considering grid stability, achieving a comprehensive optimization. Therefore, non-dominated sorting genetic algorithm-III performs the best in solving speed, convergence characteristics, and optimization ability.
Table 5.
Comparison of optimization results.
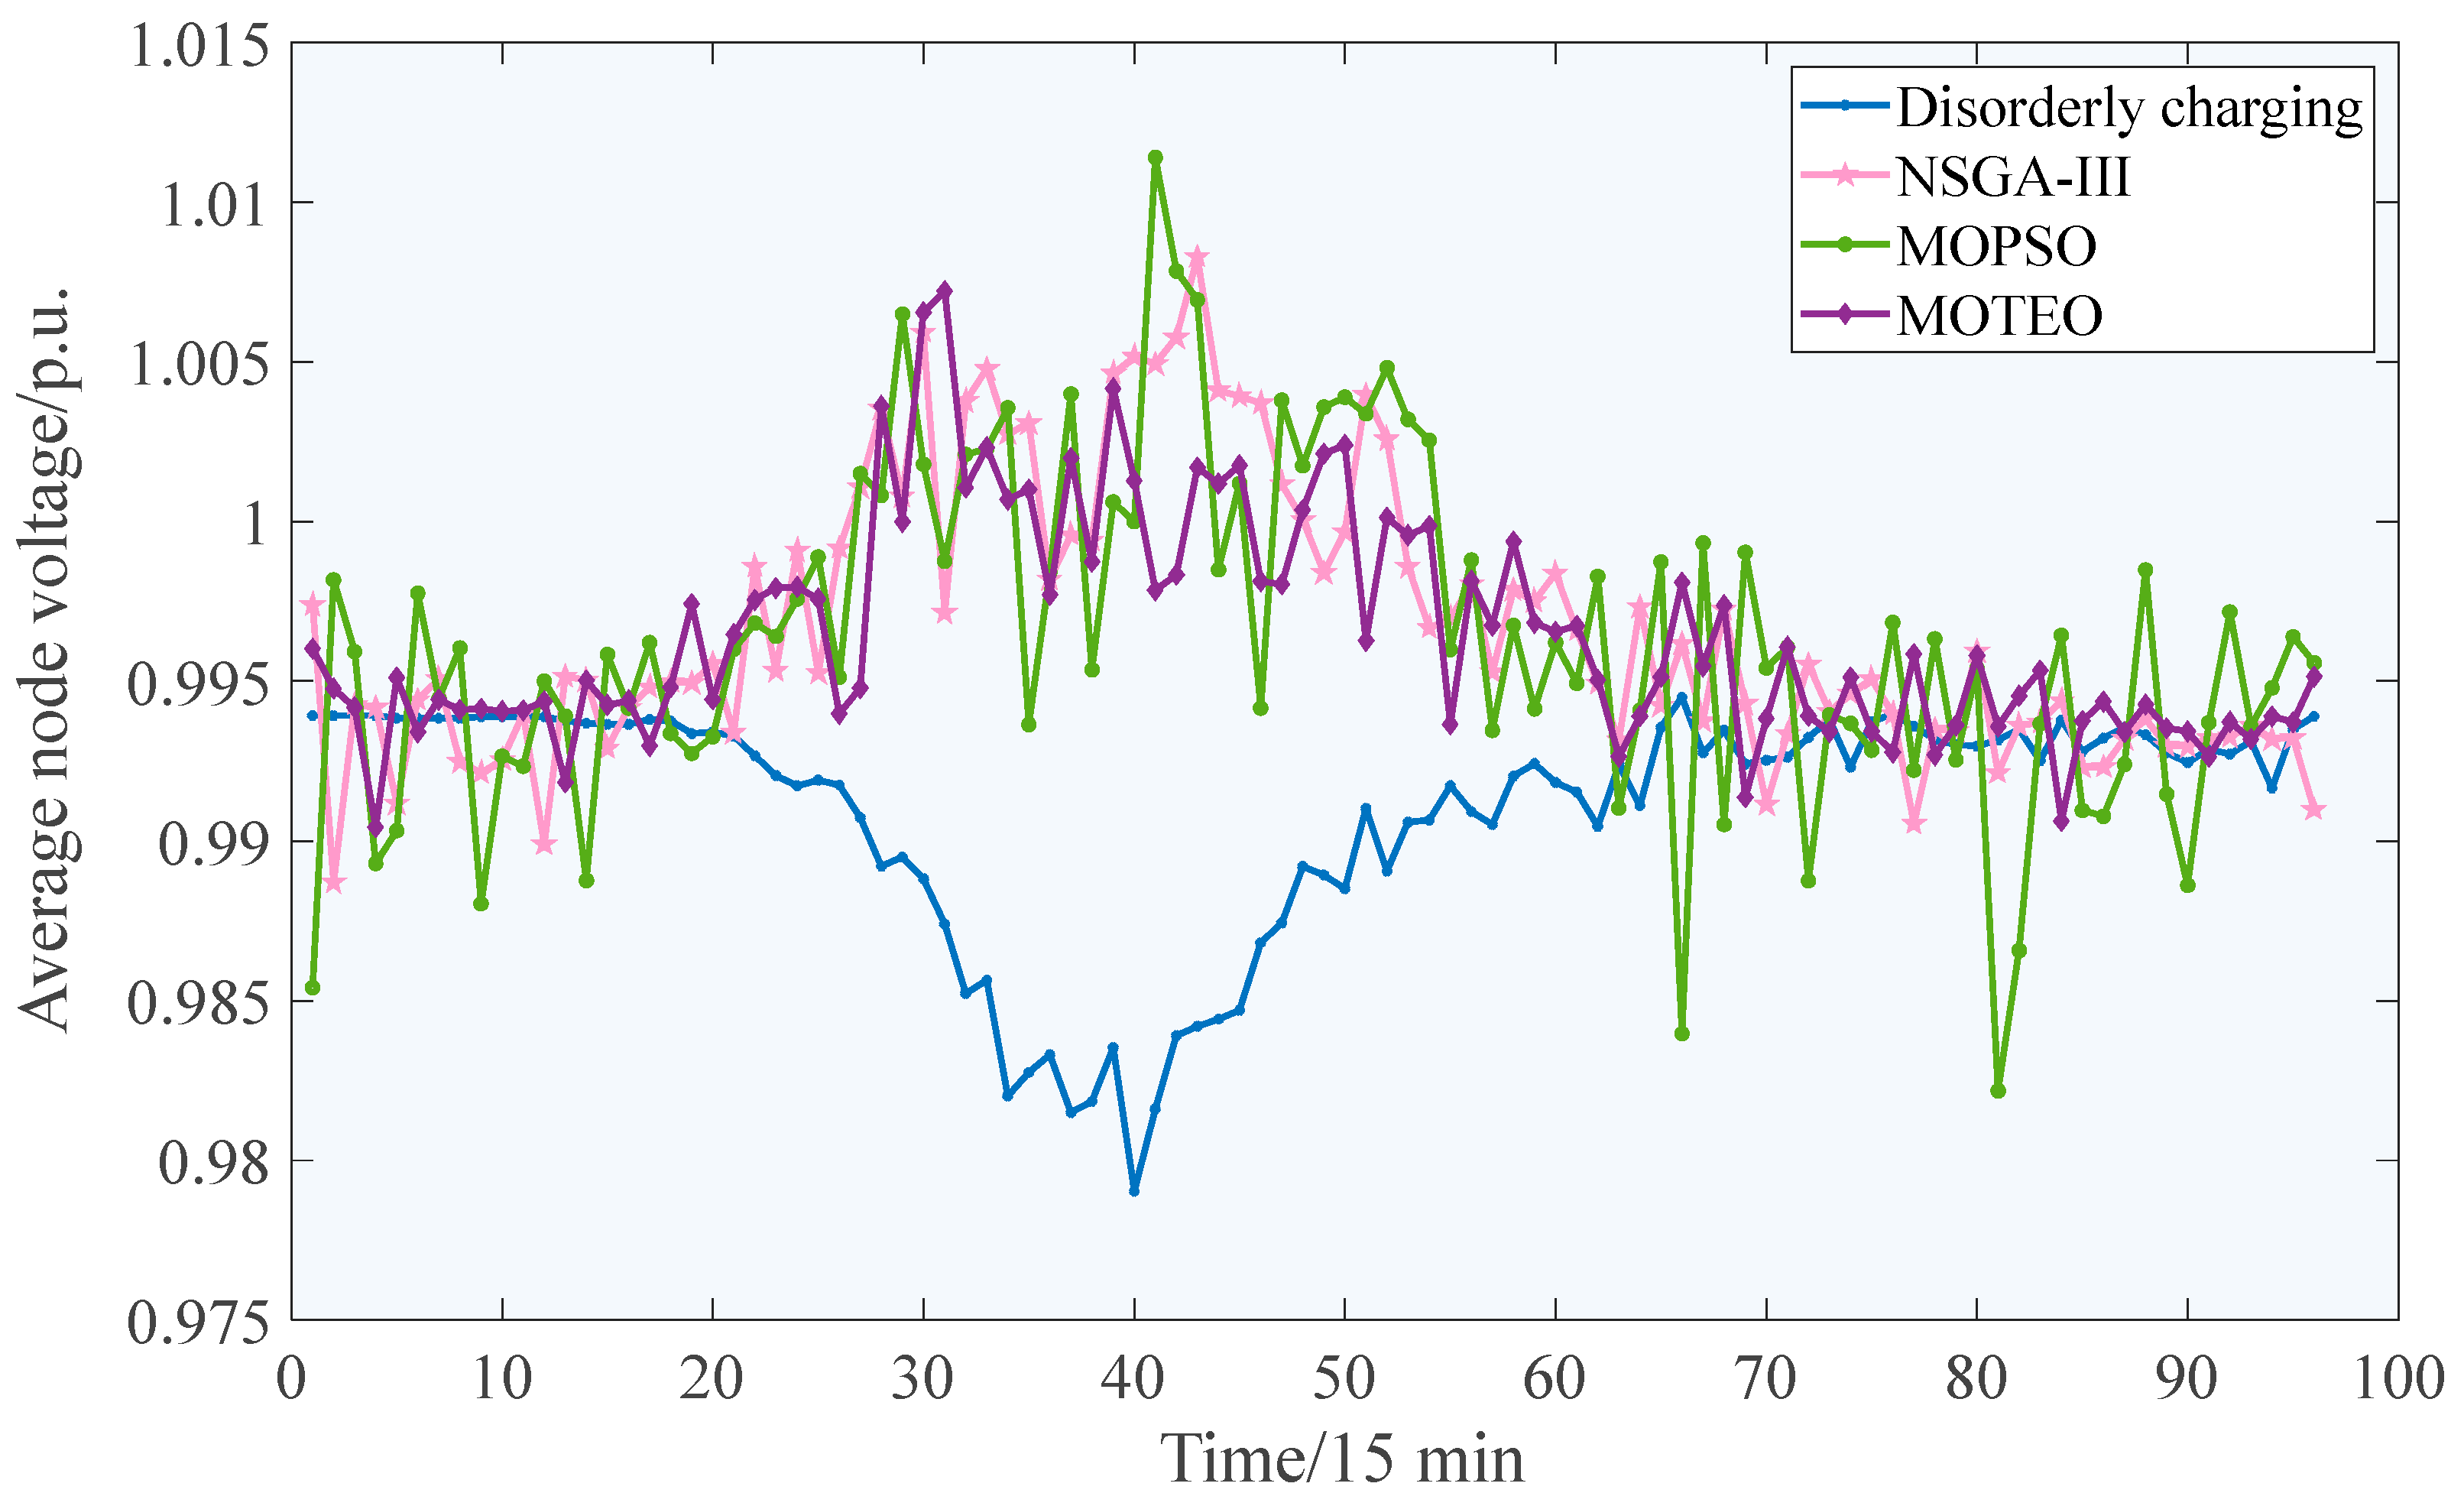
Furthermore, the schematic diagram of the average node voltage under different optimization algorithms is shown in Figure 8, where the data is the best compromise solution selected by the improved gray target decision theory after each algorithm has completed the solution. The variables in the compromise solution (such as the charge and discharge power of the mobile energy storage system, the ground point, and the charge and discharge price of the electric vehicle charging station each time) are used to calculate the load on the relevant grid side, and the power flow calculation is carried out based on the load to obtain the average voltage of each node, that is, the data source in Figure 8. It is clear that compared with the disordered charge and discharge, the optimized node voltage distribution of the system is significantly improved. Among them, the system voltage regulation under the multi-objective thermal exchange optimization algorithm is better, followed by non-dominated sorting genetic algorithm-III. This is consistent with the voltage deviation level optimization results in Table 3.
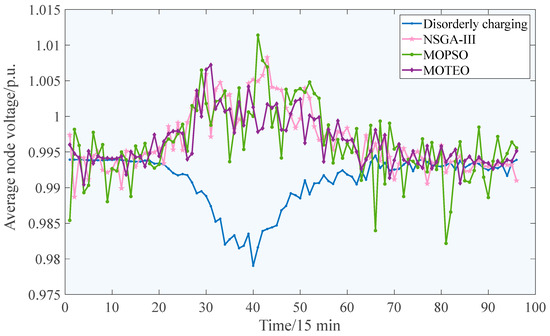
Figure 8.
Average node voltage curves under different optimization algorithms.
5.3.2. Analysis of Pricing Strategy
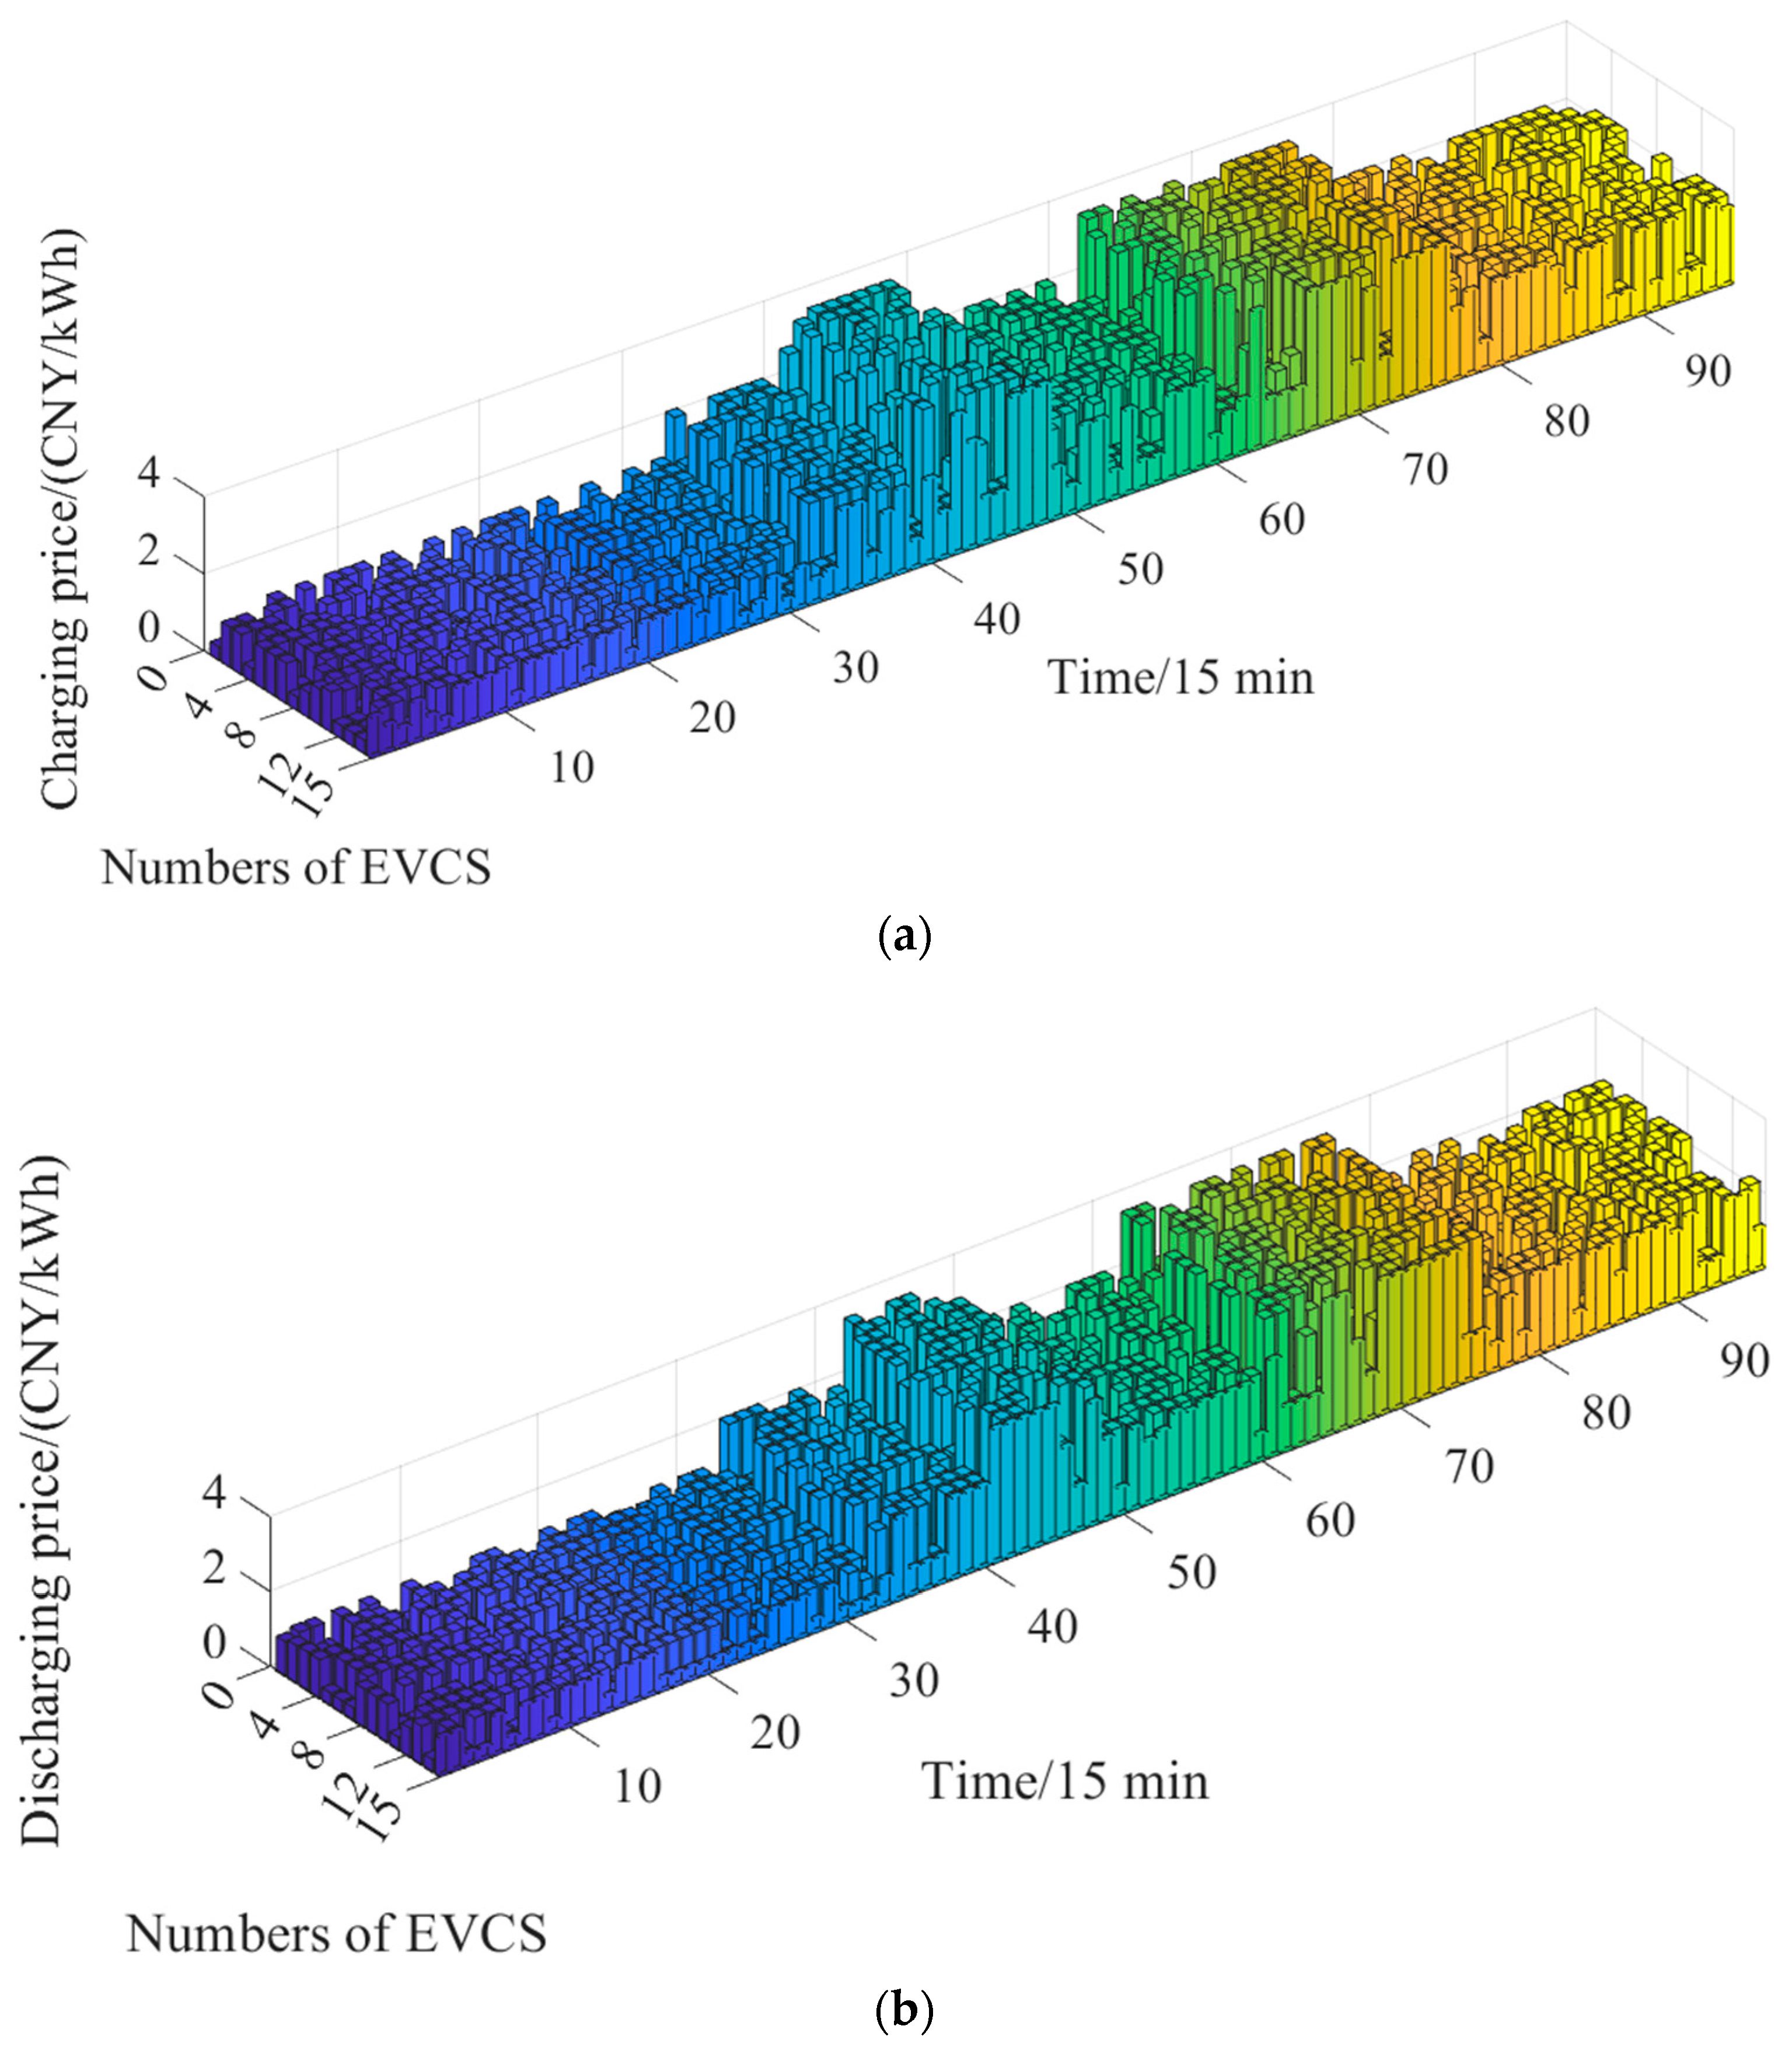
Electric vehicle charging stations formulate the time-of-use tariff to attract electric vehicles according to the forecasting results of the spatiotemporal distribution of electric vehicles, and the optimized TOU price is shown in Figure 9, where the height of each bar in the diagram represents either the charging or discharging price, while its position indicates the corresponding charging station number and time. It is clear that the charging and discharge price of each electric vehicle charging station shows a double peak trend. When the charging demand is in the peak stage, the electric vehicle charging station increases the charging price to increase its own profits, while adjusting the charging behavior of electric vehicle users through high prices to reduce the impact of large-scale charging on the power grid. In addition, the station also sets a higher discharge price at the time of high charging demand, at which time the enthusiasm of electric vehicle users to participate in the vehicle-to-grid technology is high. Through the centralized management of electric vehicle discharging, power supply compensation to the power grid can be realized.

Figure 9.
Time-of-use tariff of electric vehicle charging stations: (a) charging and (b) discharging price of electric vehicle charging stations.
5.3.3. Analysis of Mobile Energy Storage System Scheduling
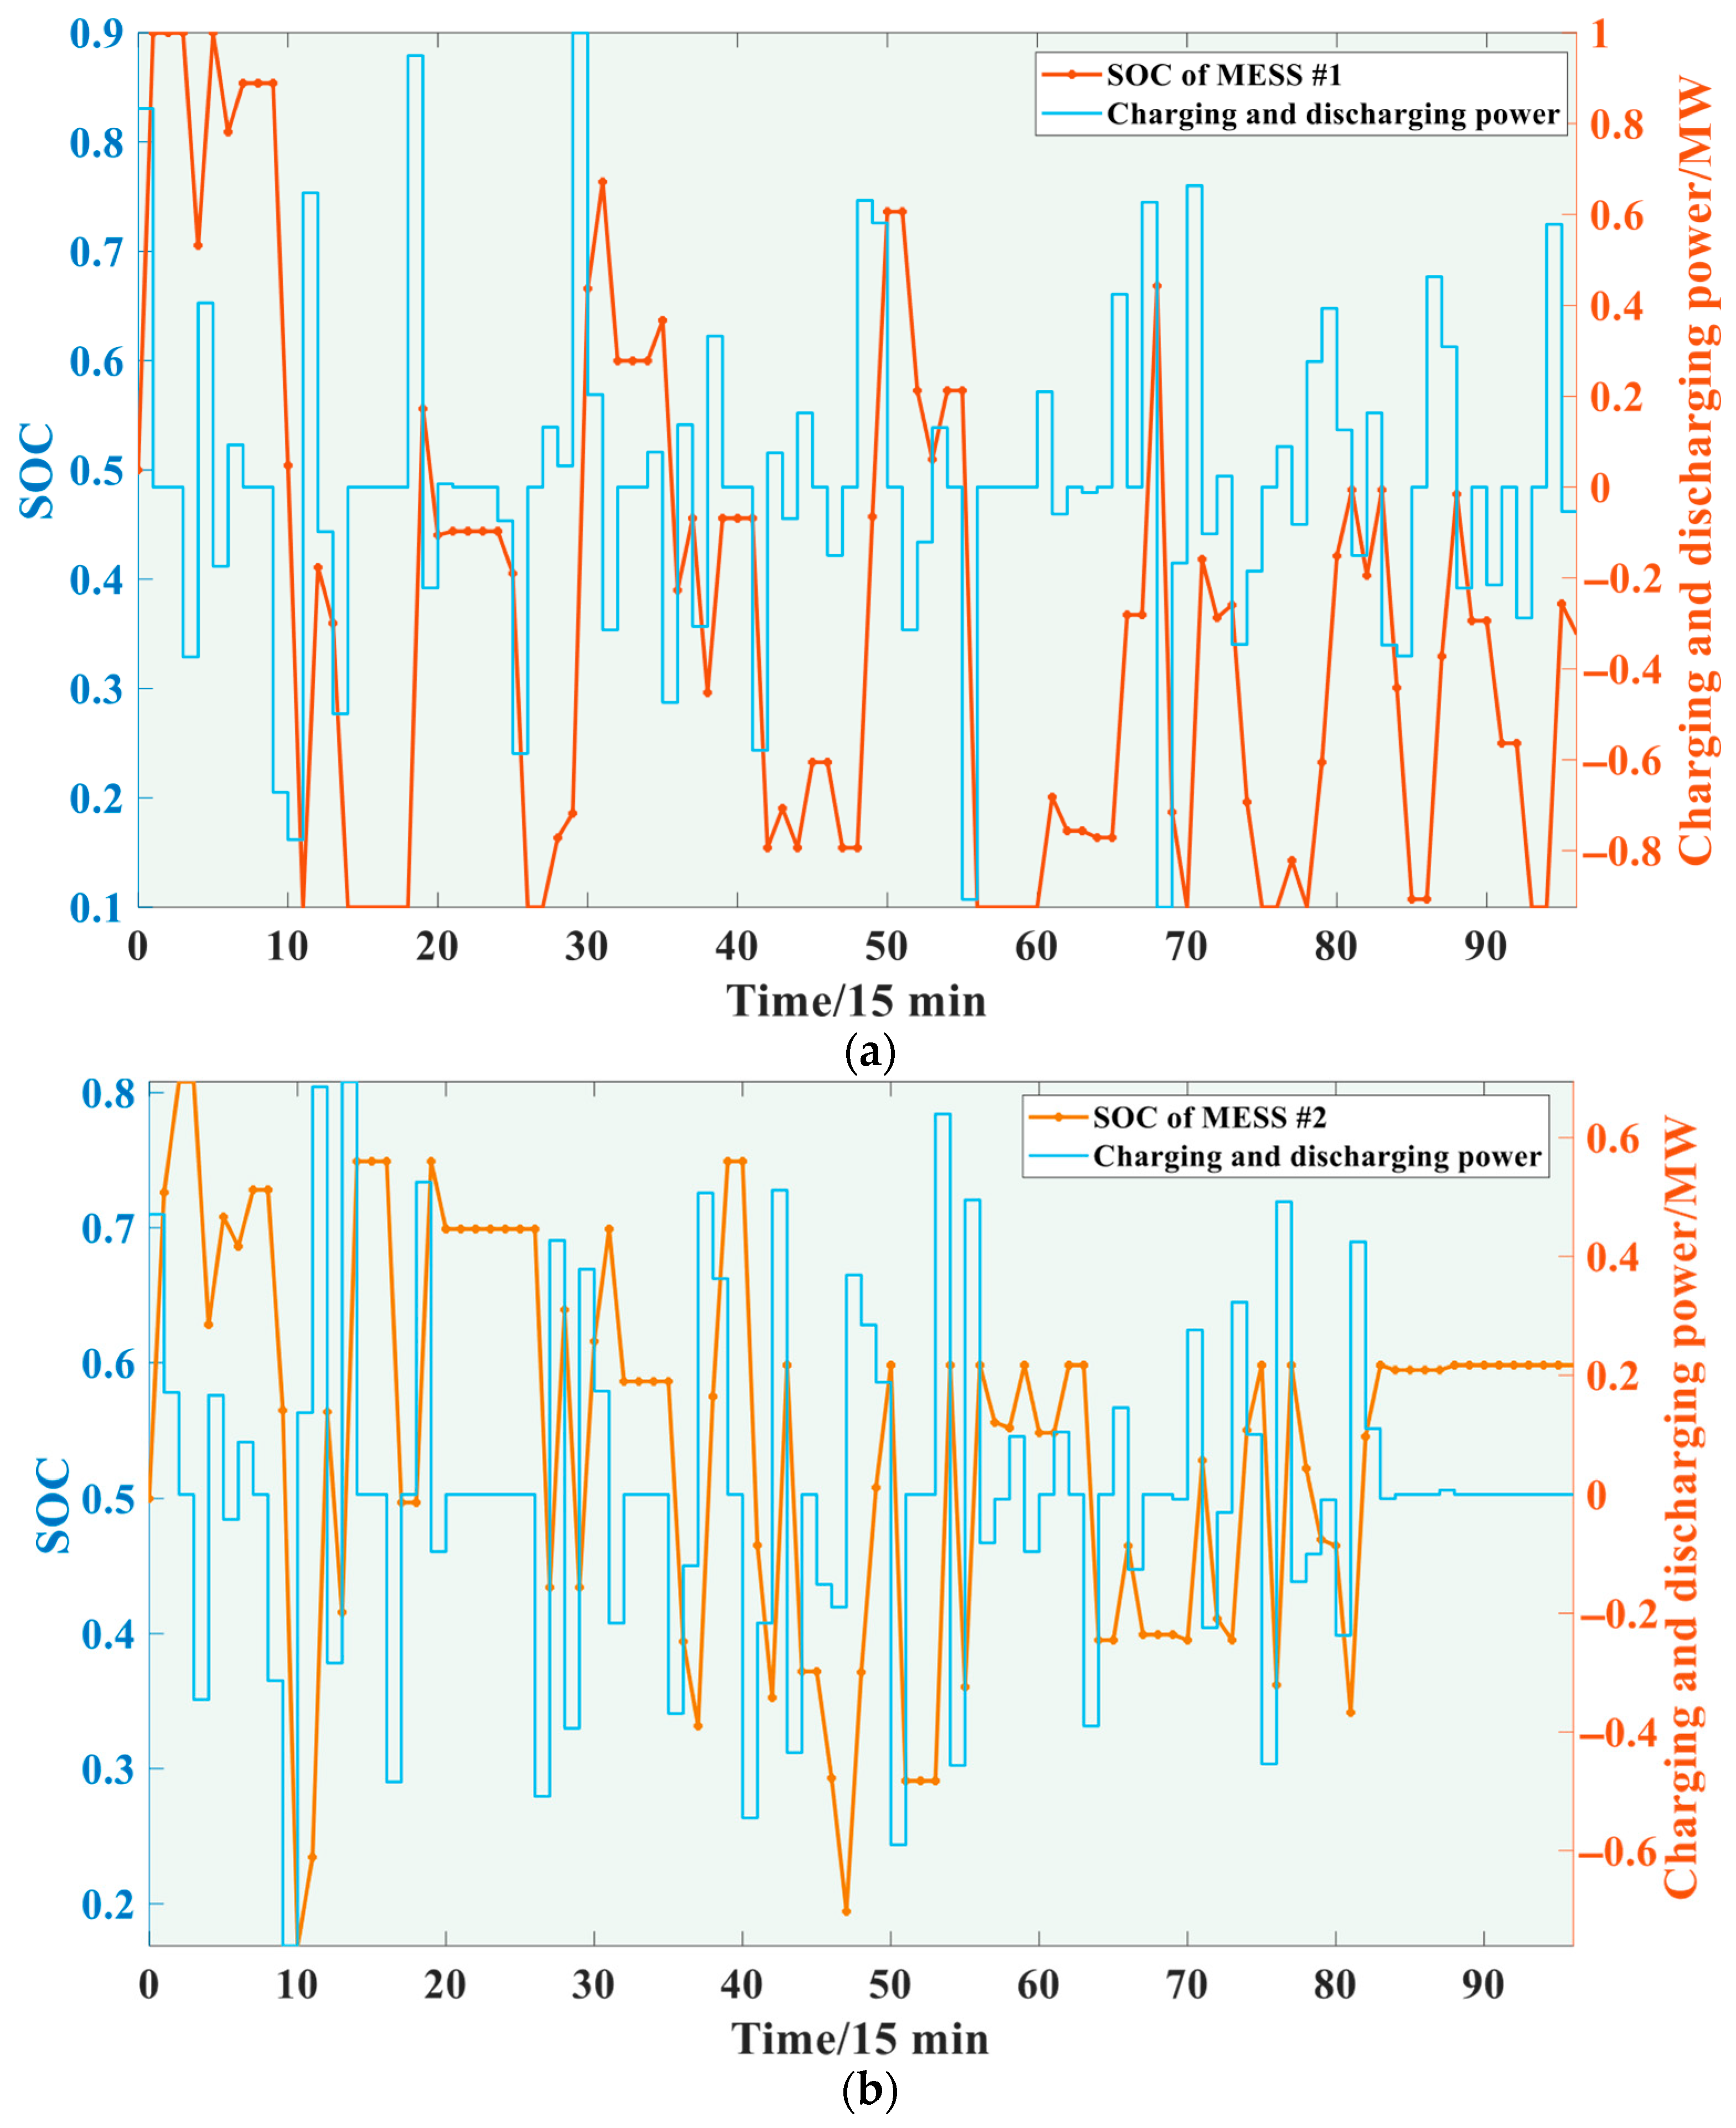
This study constrains the initial positions of the two mobile energy storage systems to nodes 11 and 55. After a scheduling cycle, mobile energy storage systems must return to the starting node. The driving path of the mobile energy storage system in a day is shown in Table 6. It is clear that nodes 58 and 55 located in the working area and 34, 43, and 38 located in the public service area need the cooperation of the mobile energy storage system to provide additional power and maintain the node voltage level. Combined with Table 6 and Figure 10, it can be seen that the space span of mobile energy storage system #1 is long, charging at node 1 with low charging demand and then discharging during the peak demand of node 58. After a long period of turn-back and charge–discharge, the state of charge of mobile energy storage system #1 changes more dramatically. In the process of solving, the charging power of each mobile energy storage system is set as the decision variable. Therefore, after the solution is completed and the improved gray target decision theory is used to select the best compromise solution, the charging power of each mobile energy storage system at each time can be obtained, that is, the data source in Figure 10.
Table 6.
Scheduling path of mobile energy storage system.
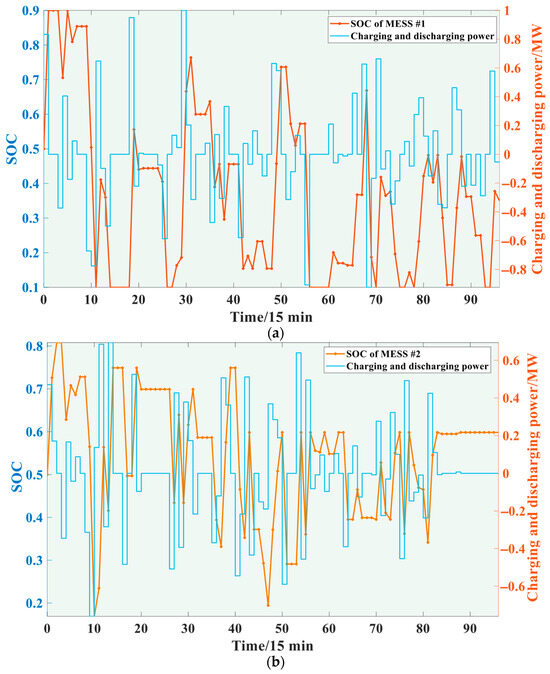
Figure 10.
Charging and discharging power of mobile energy storage systems (a) #1 and (b) #2.
6. Conclusions
This paper proposes a joint scheduling model of mobile energy storage systems and electric vehicles considering the prediction of the spatiotemporal distribution of electric vehicles. Then, non-dominated sorting genetic algorithm-III is employed to solve the model. Finally, to verify the effectiveness of the proposed method, case studies in the IEEE-69 standard test system are carried out, and the final main conclusions are as follows:
(1) The electric vehicle charging demand forecasting results show that the spatiotemporal distribution of charging demand presents a bimodal trend. The first peak occurs between 7:30 and 11:15 and is located in the work area and the public service area. The second peak appears from 18:45 to 20:30, located in residential areas. In addition, there is a large gap between the first and second peaks.
(2) The joint optimal scheduling strategy proposed in this paper effectively balances the interests of the electric vehicle charging station operator, electric vehicle users, and distribution network operator. Compared with the initial state, the profit of the electric vehicle charging station operator is increased by 122.6%, the cost of electric vehicle users is reduced by 44.7%, and the voltage deviation is reduced by 62.5%.
(3) In the joint scheduling framework of mobile energy storage systems and electric vehicles constructed in this study, mobile energy storage systems are charged in the commercial area with more power surplus, and discharges to the working area and public service area during the peak period of power consumption, increasing the flexibility of power supply. In addition, the mobile energy storage system uses time-of-use tariff arbitrage to achieve additional profits for the electric vehicle charging station operator.
The mobile energy storage system can not only realize an increase in energy arbitrage income in daily economic dispatch, but also cope with the uncertainty of renewable generation and provide auxiliary services for the power grid, which is neglected in this study. In future research, we will focus on the key technologies of mobile energy storage system auxiliary support under the strong uncertainty in renewable generation. In addition, the solution method used in this study has a high computational cost and is time-consuming, which cannot be used for real-time scheduling or planning. Therefore, in future research, we will also strive to find better solution methods to reduce computational cost.
Author Contributions
Writing—original draft preparation, L.S.; writing—review and editing, T.Y. All authors have read and agreed to the published version of the manuscript.
Funding
This paper was supported by the National Natural Science Foundation of China-Integrated Project of Joint Fund for Enterprise Innovation and Development (U24B6010).
Data Availability Statement
Datasets are available on request from the authors.
Conflicts of Interest
The authors declare that they have no known competing financial interest or personal relationships that could have appeared to influence the work reported in this article.
Glossary
| Safe driving speed at time | |
| Speed of the preceding electric vehicle at time | |
| Optimal path | |
| Cooling power of the air conditioner | |
| Heating power of the air conditioner | |
| Incentive price | |
| Actual response rate | |
| Capacity of mobile energy storage system at time | |
| Charging power of mobile energy storage system at time | |
| Discharging power of mobile energy storage system at time | |
| State of charge of mobile energy storage system at time | |
| Charging price of the th electric vehicle charging station at time | |
| Discharging price of the th electric vehicle charging station at time | |
| Charging power of electric vehicles | |
| Discharging power of electric vehicles | |
| Purchasing price of distribution network at time | |
| Selling price of distribution network at time | |
| Voltage of node at time | |
| Charging demands of the th charging station at time | |
| Active power loss of node at time | |
| Charging power of node at time | |
| Discharging of node at time |
References
- Yang, B.; Li, J.; Shu, H.; Cai, Z.; Tang, B.; Huang, X.; Zhu, M. Recent advances of optimal sizing and location of charging stations: A critical overview. Int. J. Energy Res. 2022, 46, 17899–17925. [Google Scholar] [CrossRef]
- Zhang, K.; Xu, Y.; Sun, H. Bilevel optimal coordination of active distribution network and charging stations considering EV drivers’ willingness. Appl. Energy 2024, 360, 122790. [Google Scholar] [CrossRef]
- Yang, B.; Yu, L.; Chen, Y.; Ye, H.; Shao, R.; Shu, H.; Yu, T.; Zhang, X.; Sun, L. Modelling, applications, and evaluations of optimal sizing and placement of distributed generations: A critical state-of-the-art survey. Int. J. Energy Res. 2021, 45, 3615–3642. [Google Scholar] [CrossRef]
- He, B.; Yang, B.; Han, Y.; Zhou, Y.; Hu, Y.; Shu, H.; Su, S.; Yang, J.; Huang, Y.; Li, J.; et al. Optimal EVCS planning via spatial-temporal distribution of charging demand forecasting and traffic-grid coupling. Energy 2024, 313, 133885. [Google Scholar] [CrossRef]
- Jin, X.; Wu, Q.; Jia, H.; Hatziargyriou, N.D. Optimal integration of building heating loads in integrated heating/electricity community energy systems: A bi-level MPC approach. IEEE Trans. Sustain. Energy 2021, 12, 1741–1754. [Google Scholar] [CrossRef]
- Makaremi, S. A multi-output deep learning model for energy demand and port availability forecasting in EV charging infrastructure. Energy 2025, 317, 134582. [Google Scholar] [CrossRef]
- Aduama, P.; Zhang, Z.; Al-Sumaiti, A.S. Multi-feature data fusion-based load forecasting of electric vehicle charging stations using a deep learning model. Energies 2023, 16, 1309. [Google Scholar] [CrossRef]
- Arsalan, M.; Jacob, E.; Nie, Z.; Farzaneh, H. Analyzing the impact of battery technical performance and driving conditions on the overall economic feasibility of a Vehicle-to-Grid (V2G) system implemented in the Japan electric power exchange (JEPX) market. Energy Convers. Manag. X 2025, 26, 100980. [Google Scholar] [CrossRef]
- Yu, H.; Tu, J.; Shao, Z.; Jian, L. Accommodating more electric vehicles in old residential communities by enabling distributed vehicle-to-grid dispatching and coordinated system operation. Renew. Sustain. Energy Rev. 2025, 218, 115814. [Google Scholar] [CrossRef]
- Wu, Y.; Aziz, S.M.; Haque, M.H.; Kauschke, T. New staggered time-of-use tariffs to mitigate the impact of electric vehicle charging demand on distribution networks. Sustain. Energy Grids Netw. 2025, 42, 101628. [Google Scholar] [CrossRef]
- Meng, W.; Song, D.; Huang, L.; Chen, X.; Yang, J.; Dong, M.; Talaat, M.; Elkholy, M.H. Distributed energy management of electric vehicle charging stations based on hierarchical pricing mechanism and aggregate feasible regions. Energy 2024, 291, 130332. [Google Scholar] [CrossRef]
- Zhang, J.; Che, L.; Wan, X.; Shahidehpour, M. Distributed hierarchical coordination of networked charging stations based on peer-to-peer trading and EV charging flexibility quantification. IEEE Trans. Power Syst. 2022, 37, 2961–2975. [Google Scholar] [CrossRef]
- Meng, Q.; He, Y.; Gao, Y.; Hussain, S.; Lu, J.; Guerrero, J.M. Bi-level four-stage optimization scheduling for active distribution networks with electric vehicle integration using multi-mode dynamic pricing. Energy 2025, 327, 136316. [Google Scholar] [CrossRef]
- Yin, W.; Wen, T.; Zhang, C. Cooperative optimal scheduling strategy of electric vehicles based on dynamic electricity price mechanism. Energy 2023, 263, 125627. [Google Scholar] [CrossRef]
- Zhang, Z.; Lv, L.; Wang, X. Research on dynamic time-sharing tariff orderly charging strategy based on NSGA2 in PV-storage-charging stations. Electr. Power Syst. Res. 2023, 225, 109784. [Google Scholar]
- Lu, Z.; Ma, Y.; Han, D.; Xu, X.; Xia, S. Spatial–temporal scheduling of regional integrated energy systems with stationary-mobile energy storage systems based on improved Lyapunov optimization. J. Energy Storage 2025, 122, 116665. [Google Scholar] [CrossRef]
- Ghasemi, S.; Moshtagh, J. Distribution system restoration after extreme events considering distributed generators and static energy storage systems with mobile energy storage systems dispatch in transportation systems. Appl. Energy 2022, 310, 118507. [Google Scholar] [CrossRef]
- Farzin, H.; Chehrazi, F.; Saniei, M. Multi-objective planning of mobile energy storage unit in active distribution network considering reliability. J. Energy Storage 2025, 109, 115138. [Google Scholar] [CrossRef]
- Chen, T.; Xu, X.; Wang, H.; Yan, Z. Routing and scheduling of mobile energy storage system for electricity arbitrage based on two-layer deep reinforcement learning. IEEE Trans. Transp. Electrif. 2023, 9, 1087–1102. [Google Scholar] [CrossRef]
- Zhao, H.; Liu, Z.; Mai, X.; Zhao, J.; Qiu, J.; Liu, G.; Dong, Z.Y.; Ghias, A.M.Y.M. Mobile battery energy storage system control with knowledge-assisted deep reinforcement learning. Energy Convers. Econ. 2022, 3, 381–391. [Google Scholar] [CrossRef]
- Chen, L.; He, H.; Jing, R.; Xie, M.; Ye, K. Energy management in integrated energy system with electric vehicles as mobile energy storage: An approach using bi-level deep reinforcement learning. Energy 2024, 307, 132757. [Google Scholar] [CrossRef]
- Wang, D.; Xu, H.; Dai, L.; Zhang, L.; Guo, J. Enhancing the utilization of renewable generation on the highway with mobile energy storage vehicles and electric vehicles. Electr. Power Syst. Res. 2024, 231, 110311. [Google Scholar] [CrossRef]
- Qian, T.; Fang, M.; Shu, W.; Shao, C. Real-Time Simulation Framework of Urban EVs Charging Loads Based on Micro-Level Modeling of Transportation Network. Proceedings of the CSEE. Available online: http://kns.cnki.net/kcms/detail/11.2107.TM.20250220.0916.002.html (accessed on 8 June 2025).
- Shao, Y.; Mu, Y.; Yu, X.; Dong, X.; Jia, H.; Wu, J.; Zeng, Y. A spatial-temporal charging load forecast and impact analysis method for distribution network using EVs-traffic-distribution model. Proc. CSEE 2017, 37, 5207–5219+5519. [Google Scholar]
- Yi, T.; Zhang, C.; Lin, T.; Liu, J. Research on the spatial-temporal distribution of electric vehicle charging load demand: A case study in China. J. Clean. Prod. 2020, 242, 118457. [Google Scholar] [CrossRef]
- Zhang, J.; Yan, J.; Liu, Y.; Zhang, H.; Lv, G. Daily electric vehicle charging load profiles considering demographics of vehicle users. Appl. Energy 2020, 274, 115063. [Google Scholar] [CrossRef]
- Fiori, C.; Ahn, K.; Rakha, H.A. Power-based electric vehicle energy consumption model: Model development and validation. Appl. Energy 2016, 168, 257–268. [Google Scholar] [CrossRef]
- Zhang, M.; Wu, Z.; Yang, X. Electric vehicle charging load prediction based on dynamic energy consumption model and user psychology. Mod. Electr. Power 2022, 39, 710–719. [Google Scholar]
- Chang, F.; Huang, M.; Zhang, W. Research on coordinated charging of electric vehicles based on TOU charging price. Power Syst. Technol. 2016, 40, 2609–2615. [Google Scholar]
- Zhou, X.; Huang, X.; Zhang, Y.; Tang, Y.; Yao, L.; Yang, J. Real-time scheduling and optimization model of electric vehicles based on fuzzy evaluation of demand response potential. Electr. Power Autom. Equip. 2022, 42, 30–37. [Google Scholar]
- Sun, W.; Liu, W.; Zhang, J. Collaborative optimization for dynamic reconfiguration of distribution network and mobile energy storage in background of high proportion of renewable energy. Autom. Electr. Power Syst. 2021, 45, 80–90. [Google Scholar]
- Li, J.; Yang, B.; Huang, J.; Guo, Z.; Wang, J.; Zhang, R.; Hu, Y.; Shu, H.; Chen, Y.; Yan, Y. Optimal planning of electricity-hydrogen hybrid energy storage system considering demand response in active distribution network. Energy 2023, 273, 127142. [Google Scholar] [CrossRef]
- Yang, B.; Wang, J.; Cao, P.; Zhu, T.; Shu, H.; Chen, J.; Zhang, J.; Zhu, J. Classification, summarization and perspectives on state-of-charge estimation of lithium-ion batteries used in electric vehicles: A critical comprehensive survey. J. Energy Storage 2021, 39, 102572. [Google Scholar] [CrossRef]
- Hu, Y.; Yang, B.; Wu, P.; Wang, X.; Li, J.; Huang, Y.; Su, R.; He, G.; Yang, J.; Su, S.; et al. Optimal planning of electric-heating integrated energy system in low-carbon park with energy storage system. J. Energy Storage 2024, 99, 113327. [Google Scholar] [CrossRef]
- Heris, M.K. NSGA-III: Non-dominated Sorting Genetic Algorithm, the Third Version—MATLAB Implementation, Yarpiz, 2016. Available online: https://yarpiz.com/456/ypea126-nsga3 (accessed on 6 July 2025).
- Li, J.; Yang, B.; Hu, Y.; Zhang, R.; Shu, H. Location and capacity planning of electricity hydrogen hybrid energy storage system considering demand response. Power Syst. Technol. 2023, 47, 3698–3714. [Google Scholar]
Disclaimer/Publisher’s Note: The statements, opinions and data contained in all publications are solely those of the individual author(s) and contributor(s) and not of MDPI and/or the editor(s). MDPI and/or the editor(s) disclaim responsibility for any injury to people or property resulting from any ideas, methods, instructions or products referred to in the content. |
© 2025 by the authors. Licensee MDPI, Basel, Switzerland. This article is an open access article distributed under the terms and conditions of the Creative Commons Attribution (CC BY) license (https://creativecommons.org/licenses/by/4.0/).